Carry Trades and Currency Crashes - Princeton Universitymarkus/research/papers/carry_trades... ·...
23
Carry Trades and Currency Crashes Markus K. Brunnermeier, Stefan Nagel, Lasse Pedersen Princeton, Stanford, NYU AEA Meetings, January 2008 BNP (2008) Carry Trades & Currency Crashes AEA, Jan 2008 1 / 23
Transcript of Carry Trades and Currency Crashes - Princeton Universitymarkus/research/papers/carry_trades... ·...

Carry Trades and Currency Crashes
Markus K. Brunnermeier, Stefan Nagel, Lasse Pedersen
Princeton, Stanford, NYU
AEA Meetings, January 2008
BNP (2008) Carry Trades & Currency Crashes AEA, Jan 2008 1 / 23

Introduction
Motivation
We study the drivers of risk (and the return) in FX markets:
“Up by the stairs and down by the elevator”
Forecasting currency crashes: drivers of conditional FX skewness
Pricing of currency crashes: option prices
Co-movements of currencies
Key drivers:
Carry tradesGlobal volatility and/or risk aversionFunding liquidity and unwinding of carry trades
BNP (2008) Carry Trades & Currency Crashes AEA, Jan 2008 2 / 23

Introduction
Carry Trade
1 Violation of UIP - “Forward Premium Puzzle”Example: Yen-Aussie carry trade (Nov. 8, 2007)
Borrow at 0.87% 3m JPY LIBOR (”funding currency”)Invest at 7.09% 3m AUD LIBOR (”investment currency”)Hope that JPY doesn’t appreciate much (UIP violation)
2 Large exchange rate movements without newsExample: October 7th/8th, 1998
BNP (2008) Carry Trades & Currency Crashes AEA, Jan 2008 3 / 23

Introduction
Background: Literature
Macro: near-random walk of FX(Messe & Rogoff 1983, Engel & West )
Funding liquidity constraints of speculators(Brunnermeier and Pedersen 2007; Plantin and Shin 2007)
Unwinding of carry trades when funding liquidity dries upEndogenous negative skewness of carry trade returnsExcess co-movement of funding currencies (investment currencies)
Transaction costs (Burnside et al. 2006)
BNP (2008) Carry Trades & Currency Crashes AEA, Jan 2008 4 / 23

Introduction
Our Main Results
FX crash risk increases with
interest rate differential (i.e. carry)past FX carry returnsspeculator carry futures positionsand decrease with price of insurance (risk reversals)
The price of FX crash insurance increases after crash
An increase in VIX (cf. global risk and risk aversion) leads tounwinding of carry trades
Investment currencies move together, funding currencies ditto
Carry trade exposed to – and may lead to – crash risklimits correcting arbitrage ⇒ “Forward premium puzzle”
BNP (2008) Carry Trades & Currency Crashes AEA, Jan 2008 5 / 23

Data
Data and Definitions
FX rates (1986-2006): st (in logs) [Datastream]
AUD, CAD, JPY, NZD, NOK, CHF, GBP, EUR per USD
Interest rate differentials (1986-2006): i∗ − i (in logs) [Datastream]3m-LIBOR
Foreign currency excess return: zt ≡(i∗t−1 − it−1
)− ∆st
Return from a carry trade where foreign currency is investment currencyUIP: Et [zt+1] = 0
Futures positions of non-commercial traders on the CME(1986-2006): Futurest [CFTC]
Risk Reversals (1998-2006): RiskRevt [JP Morgan]
BNP (2008) Carry Trades & Currency Crashes AEA, Jan 2008 6 / 23

Data
Summary Statistics
Table 1: Summary Statistics
AUD CAD JPY NZD NOK CHF GBP EUR
Panel A: Means
∆st -0.003 -0.002 -0.003 -0.005 -0.002 -0.004 -0.004 -0.004
zt 0.009 0.004 -0.004 0.013 0.007 -0.001 0.009 0.003
i∗t−1−i t−1 0.006 0.002 -0.007 0.009 0.005 -0.004 0.005 -0.001
Futures - 0.059 -0.097 - - -0.067 0.052 0.031
Skewness -0.322 -0.143 0.318 -0.297 -0.019 0.144 -0.094 0.131
Risk reversals -0.426 -0.099 1.059 -0.467 0.350 0.409 0.009 0.329
Summary Statistics
AUD CAD JPY NZD NOK CHF GBP EUR
Panel A: Means
∆st -0.003 -0.002 -0.003 -0.005 -0.002 -0.004 -0.004 -0.004
xt 0.009 0.004 -0.004 0.013 0.007 -0.001 0.009 0.003
rf ,t−1−rd ,t−1 0.006 0.002 -0.007 0.009 0.005 -0.004 0.005 -0.001
Futures - 0.059 -0.097 - - -0.067 0.052 0.031
Skewness -0.322 -0.143 0.318 -0.297 -0.019 0.144 -0.094 0.131
Risk reversals -0.426 -0.099 1.059 -0.467 0.350 0.409 0.009 0.329
−8 −6 −4 −2 0 2 4 6 8 10
x 10−3
−0.4
−0.3
−0.2
−0.1
0
0.1
0.2
0.3
0.4
AUD
CAD
JPY
NZD
NOK
CHF
GBP
EUR
Skewness vs. Interest−Rate Differentials
Brunnermeier, Nagel, Pedersen () November 2007 Preliminary 11 / 27
BNP (2008) Carry Trades & Currency Crashes AEA, Jan 2008 7 / 23

Data
Summary Statistics
Table 1: Summary Statistics (cont.)
AUD CAD JPY NZD NOK CHF GBP EUR
Panel B: Standard deviations
∆st 0.049 0.028 0.062 0.050 0.053 0.063 0.049 0.059
zt 0.050 0.029 0.064 0.053 0.053 0.064 0.049 0.060
i∗t−1−i t−1 0.006 0.004 0.005 0.007 0.008 0.006 0.005 0.006
Futures - 0.248 0.242 - 0.000 0.296 0.272 0.202
Skewness 0.712 0.585 0.627 0.685 0.472 0.438 0.528 0.510
Risk reversals 0.436 0.343 1.204 0.466 0.515 0.550 0.391 0.534
BNP (2008) Carry Trades & Currency Crashes AEA, Jan 2008 8 / 23

Crash Risk
Predicting Crash Risk
Use i∗t − it to predict
FX excess return zt+τ during quarter t + τ
Positive coefficient: carry trade pays off (UIP violation)
Futures positions at end of quarter t + τ
Positive coefficient: consistent with carry trade activity
Skewness of daily zt within quarter t + τ
Negative coefficient: Carry trades are exposed to crash risk
BNP (2008) Carry Trades & Currency Crashes AEA, Jan 2008 9 / 23

Crash Risk
Predicting Crash Risk
Table 2: z , futures positions, and skewness regressed on i∗t − it
FX excess return Futures Skewness
t + 1 2.17 8.30 -23.98
(0.77) (5.06) (3.80)
t + 2 2.24 8.09 -23.22
(0.69) (5.09) (3.65)
t + 3 2.24 6.07 -23.59
(0.69) (4.69) (3.82)
t + 4 1.50 6.47 -23.26
(0.62) (4.47) (4.60)
t + 5 1.11 5.92 -23.40
(0.52) (3.47) (5.04)
Notes: Panel regressions (1986-2006) with country-fixed effects and quarterly data. Standard
errors in parentheses are robust to within-time period correlation of residuals and are adjusted
for serial correlation with a Newey-West covariance matrix with 10 lags.
BNP (2008) Carry Trades & Currency Crashes AEA, Jan 2008 10 / 23

Crash Risk
Predicting Crash Risk
Table 2: z , futures positions, and skewness regressed on i∗t − it
FX excess return Futures Skewness
t + 6 0.76 4.75 -22.10
(0.48) (2.50) (4.97)
t + 7 0.68 4.15 -21.20
(0.48) (1.83) (4.05)
t + 8 0.44 2.74 -16.95
(0.55) (2.04) (4.02)
t + 9 0.27 0.44 -12.88
(0.63) (2.35) (3.44)
t + 10 -0.04 -0.90 -11.08
(0.77) (3.21) (3.72)
Notes: Panel regressions (1986-2006) with country-fixed effects and quarterly data. Standard
errors in parentheses are robust to within-time period correlation of residuals and are adjusted
for serial correlation with a Newey-West covariance matrix with 10 lags.
BNP (2008) Carry Trades & Currency Crashes AEA, Jan 2008 11 / 23

Crash Risk
Predicting Crash Risk
Consider dynamic relationships between FX excess returns, futurespositions, skewness, and interest rate differentials:Vector-Autoregressions
VAR(3) with i∗t − it , zt , Skewt , Futurest
1986-2006, quarterlyImpulse responses for shocks to i∗t − it with Choleski decompositionwith ordering i∗t − it , zt , Skewt , FuturestBootstrap-after-bootstrap bias-adjusted confidence intervals for impulseresponse function (Kilian 1998)
BNP (2008) Carry Trades & Currency Crashes AEA, Jan 2008 12 / 23
Crash Risk
Predictable Return and Crash Risk of Carry Trades
Impulse responses for shocks to i∗t − it
0 5 10 150
0.5
1
1.5
2
2.5
3x 10 3 Interest rate differential
0 5 10 150.02
0
0.02
0.04
0.06
0.08
0.1Cumulated excess return
0 5 10 150.02
0
0.02
0.04
0.06Futures position
0 5 10 150.15
0.1
0.05
0
0.05Skewness
BNP (2008) Carry Trades & Currency Crashes AEA, Jan 2008 13 / 23

Crash Risk
Predicting Crash Risk
0.25 0.2 0.15 0.1 0.05 0 0.05 0.1 0.15 0.2 0.250
2
4
6
8
10Quarterly
0.06 0.04 0.02 0 0.02 0.04 0.060
5
10
15
20
25
30
35Weekly
Figure 1: Kernel density estimates of distribution of foreign exchange
excess returns conditional on interest rate differential. Interest rate differential
groups quarterly: < -0.005 (red), -0.005 to 0.005 (magenta), > 0.005 (blue);
weekly: < -0.01 (red), -0.01 to 0.01 (magenta), > 0.01 (blue).
BNP (2008) Carry Trades & Currency Crashes AEA, Jan 2008 14 / 23

Price of Crash Risk
Price of Crash Risk
Table 3: Forecasting crashes and the price of crash risk
Skewnesst+1 Skewnesst+1 RiskRevt
i∗t −i t -24.74 -29.33 -25.49
(11.47) (11.87) (28.21)
zt -2.98 -1.57 8.47
(0.79) (0.73) (1.62)
Futurest 0.08 0.14 0.32
(0.11) (0.11) (0.16)
Skewnesst 0.20 0.21 0.05
(0.05) (0.05) (0.12)
RiskRevt -0.17
(0.05)
R2 0.21 0.24 0.43
Notes: Panel regressions (1998-2006) with country-fixed effects and quarterly data. Standard
errors in parentheses are robust to within-time period correlation of residuals and are adjusted
for serial correlation with a Newey-West covariance matrix with 10 lags.BNP (2008) Carry Trades & Currency Crashes AEA, Jan 2008 15 / 23

Price of Crash Risk
Price of Crash Risk
Positive interest rate differential predicts negatively skewed physicaland risk-neutral distributions of FX returns
Consistent with carry trades being exposed to crash risk
After FX losses, the crash risk is lower, but the price of crashinsurance is higher.
Price of crash risk insurance is high when future skewness is low.The price of insurance goes up after an “earthquake,” although the riskof another “earthquake” is lowRisk premium may be due to slow moving capital
BNP (2008) Carry Trades & Currency Crashes AEA, Jan 2008 16 / 23

Unwinding
Unwinding of Carry Trades
Proxy for global volatility and funding liquidity: CBOE VIX index
Prior evidence that funding liquidity “dries up” when VIX spikes
Carry trade variables
CRett : zt×sign(i∗t−1 − it−1)
Negative = Losses on carry trade
∆CFutt : ∆Futurest×sign(i∗t−1 − it−1)
Negative = unwinding of carry trades
∆CRiskRevt : ∆RiskRevt × sign(i∗t−1 − it−1),
Negative = Insurance against carry trade losses gets more expensive
BNP (2008) Carry Trades & Currency Crashes AEA, Jan 2008 17 / 23

Unwinding
Unwinding of Carry Trades
Table 4: Sensitivity of weekly carry trade positions, price of skewness
insurance, and carry trade returns to changes in VIX
∆CFutt ∆CFutt+1 ∆CRiskRevt ∆CRiskRevt+1 CRett CRett+1
∆VIXt -1.55 -1.29 -4.66 -3.48 -0.40 -0.01
(0.79) (0.58) (2.80) (3.79) (0.11) (0.11)
CFutt−1 -0.09 -0.11
(0.01) (0.01)
CRiskRevt−1 -0.14 -0.10
(0.02) (0.01)
R2 0.05 0.06 0.07 0.03 0.00 0.00
Notes: Panel regressions with country-fixed effects and weekly data. Standard errors in
parentheses are robust to within-time period correlation of residuals and are adjusted for serial
correlation with a Newey-West covariance matrix with 6 lags. The reported R2 is an adjusted
R2 net of the fixed effects.
BNP (2008) Carry Trades & Currency Crashes AEA, Jan 2008 18 / 23

Unwinding
Unwinding of Carry Trades - VIX
0.25 0.2 0.15 0.1 0.05 0 0.05 0.1 0.15 0.2 0.250
2
4
6
8
10Quarterly
0.05 0.04 0.03 0.02 0.01 0 0.01 0.02 0.03 0.04 0.050
10
20
30
40Weekly
Figure 2: Kernel density estimates of distribution of carry trade returns conditional on
contemporaneous change in VIX. Change in VIX groups quarterly: < -0.25 (red), -0.25 to 0.25
(magenta), > 0.25 (blue);weekly: < -0.1 (red), -0.1 to 0.1 (magenta), > 0.1 (blue).
BNP (2008) Carry Trades & Currency Crashes AEA, Jan 2008 19 / 23

Co-movement
Currency Co-movement
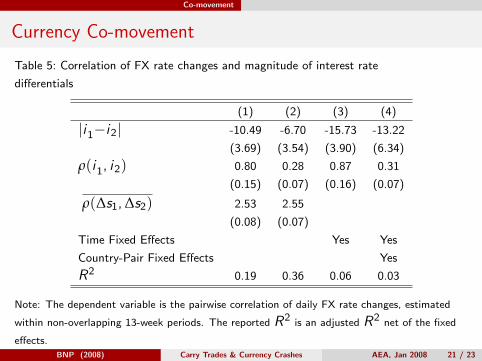
If FX rates are driven by carry trades, funding currencies movetogether, and so do investment currencies
i.e., the lower the interest rate differential between a pair of currencies,the more their FX rates (relative to USD) should co-move
Variables
Dependent variable is the pairwise correlation of daily log FX ratechanges within 13-week (non-overlapping) windows mapped to real lineby re-scaling and logistic transformation|i1 − i2| = absolute pairwise interest rate differential at the start of the13-week period.ρ(i1, i2) = correlation of 5-day interest rate changes, estimated withoverlapping windows, within each 13-week period.Average ρ(∆s1, ∆s2) is the cross-sectional average of all pairwisecorrelations of daily FX rate changes within each non-overlapping13-week periods.
BNP (2008) Carry Trades & Currency Crashes AEA, Jan 2008 20 / 23
Co-movement
Currency Co-movement
Table 5: Correlation of FX rate changes and magnitude of interest rate
differentials
(1) (2) (3) (4)
|i1−i2| -10.49 -6.70 -15.73 -13.22
(3.69) (3.54) (3.90) (6.34)
ρ(i1, i2) 0.80 0.28 0.87 0.31
(0.15) (0.07) (0.16) (0.07)
ρ(∆s1, ∆s2) 2.53 2.55
(0.08) (0.07)
Time Fixed Effects Yes Yes
Country-Pair Fixed Effects Yes
R2 0.19 0.36 0.06 0.03
Note: The dependent variable is the pairwise correlation of daily FX rate changes, estimated
within non-overlapping 13-week periods. The reported R2 is an adjusted R2 net of the fixed
effects.
BNP (2008) Carry Trades & Currency Crashes AEA, Jan 2008 21 / 23

Conclusion
Conclusion
FX crash risk increases with
interest rate differential (i.e. carry)past FX carry gainsspeculator carry futures positionsand decrease with price of insurance, risk reversal
The price of FX crash insurance increases with
interest rate differential (i.e. carry)past FX carry lossesspeculators carry futures positions
An increase in VIX (cf. global risk or risk aversion)contemporaneously leads to
carry unwindcarry lossesprice of insurance increases
Funding currencies move together, funding currencies ditto
BNP (2008) Carry Trades & Currency Crashes AEA, Jan 2008 22 / 23

Conclusion
Conclusion, ctd.
Carry trade
Exposed to crash riskPayoff resembles that of selling put optionsBad payoffs in low liquidity, high volatility states of the worldUnwinding of carry trades after losses and in these “bad” states
Results consistent with idea that speculators
trade carry partly “correcting” UIP, but only partly because theyface crash risk due to their own funding liquidity constraints and other“limits to arbitrage”
BNP (2008) Carry Trades & Currency Crashes AEA, Jan 2008 23 / 23