CARPINTERIA GROUNDWATER BASIN AB3030 GROUNDWATER ...cvwd.net/pdf/water_info/groundwater_reports/2015...
45
CARPINTERIA GROUNDWATER BASIN AB3030 GROUNDWATER MANAGEMENT PLAN ANNUAL REPORT WATER YEARS 2015 AND 2016 Prepared for: CARPINTERIA VALLEY WATER DISTRICT July 2017
Transcript of CARPINTERIA GROUNDWATER BASIN AB3030 GROUNDWATER ...cvwd.net/pdf/water_info/groundwater_reports/2015...
CARPINTERIA GROUNDWATER BASIN AB3030 GROUNDWATER MANAGEMENT PLAN
ANNUAL REPORT
WATER YEARS 2015 AND 2016
Prepared for:
CARPINTERIA VALLEY WATER DISTRICT
July 2017
PUEBLO WATER RESOURCES, INC • 4478 Market Street, Suite 705 • Ventura, CA 93003
July 25, 2017 Project No. 15-0094 Carpinteria Valley Water District 1301 Santa Ynez Avenue Carpinteria, California 93013 Attention: Bob McDonald
General Manager Subject: Carpinteria Groundwater Basin AB3030 Groundwater Management Plan Annual Report;
Water Years 2015 and 2016.
Dear Mr. McDonald:
We are pleased to present to you the subject Annual Report for the Carpinteria Groundwater Basin Groundwater Management Plan. The report presents an overview of hydrogeologic conditions associated with the basin for the 2015 and 2016 water year periods, our conclusions regarding the basin conditions; and our recommendations for the continuance and enhancement of the plan and the data collection program.
Thank you for giving Pueblo the opportunity to assist you with this important project.
Sincerely, Pueblo Water Resources, Inc.
Michael S. Burke Principal Hydrogeologist, C.Hg. 678
July 2017 Project No. 15-0094
15-0094 cvwd ab3030 gwmp annual report july 2017
- i -
TABLE OF CONTENTS
Page
INTRODUCTION ................................................................................................................ 1
FINDINGS ........................................................................................................................... 1
MONITORING WELL NETWORK AND MONITORING PROGRAM ...................... 1 PRECIPITATION DATA .......................................................................................... 4 GROUNDWATER PRODUCTION .......................................................................... 5 WATER LEVEL DATA ............................................................................................ 7 HYDROLOGIC BUDGET ........................................................................................ 9 WATER QUALITY DATA ........................................................................................ 9
CONCLUSIONS AND RECOMMENDATIONS ................................................................... 11
CONCLUSIONS ...................................................................................................... 11 RECOMMENDATIONS ........................................................................................... 12
CLOSURE ........................................................................................................................... 13
TABLES
1 Well Information Summary ...................................................................................... 3 2 Precipitation Data .................................................................................................... 5 3 Summary of Groundwater Pumpage ....................................................................... 6
July 2017 Project No. 15-0094
15-0094 cvwd ab3030 gwmp annual report july 2017
- ii -
TABLE OF CONTENTS (Continued)
FIGURES
Well Location Map ................................................................................................ 1 Carpinteria Groundwater Basin Precipitation ........................................................ 2 Carpinteria Groundwater Basin Pumpage ............................................................ 3 Water Level Hydrographs - West .......................................................................... 4 Water Level Hydrographs - East ........................................................................... 5 Water Level Contours WY 2014 – WY 2015 ......................................................... 6 Water Level Contours WY 2015 – WY 2016 ......................................................... 7 Groundwater Quality Hydrographs - West ............................................................ 8 Groundwater Quality Hydrographs - East ............................................................. 9 Surface Water Quality Hydrographs ..................................................................... 10
APPENDICES
APPENDIX A: HYDROLOGIC DATA
APPENDIX B: HYDROLOGIC BUDGET UPDATE TECHNICAL MEMORANDUM
APPENDIX C: WATER QUALITY DATA
July 2017 Project No. 15-0094
15-0094 cvwd ab3030 gwmp annual report july 2017 (DRAFT)
- 1 -
INTRODUCTION
Assembly Bill 3030 allowed certain defined local agencies to develop groundwater management plans (GWMP) for groundwater basins defined by the California Department of Water Resources (DWR) Bulletin 118. The Carpinteria Valley Water District developed a GWMP for the Carpinteria Groundwater Basin (CGB) and adopted the plan in 1999. Carpinteria’s GWMP includes annual reporting on the hydrogeologic conditions of the CGB. This report presents the findings, conclusions and recommendations developed through the GWMP for Water Years (WY) 2015 and 2016 (Water Year is defined as October 1 of any given year through September 30 of the following year).
Prior to the GWMP reporting for WY 2015 and WY 2016 presented herein, previous annual reports were prepared for calendar year periods. The most recent calendar year report was prepared by Fugro Consultants for 2014 and presented to the District as a letter report dated July 31, 2015 (revised October 9, 2015). The District desired to revise the reporting period for the GWMP to be on a water year basis to be consistent with standard hydrogeologic practice, and to synchronize the reporting period of the GWMP with the reporting period for hydrologic budget updates prepared annually for the CGB by Pueblo Water Resources, Inc. (Pueblo).
The GWMP for the CGB includes collection, compilation, and analysis of precipitation data, water-level data, groundwater production data, and water-quality data. The data are compiled in tabular form and are presented graphically. The purpose of the GWMP is to provide a mechanism for the District to continually monitor groundwater conditions within the CGB and identify trends in groundwater production, water levels, and/or water quality. The District considers the GWMP to be an important tool for the management of the CGB.
FINDINGS
MONITORING WELL NETWORK AND MONITORING PROGRAM
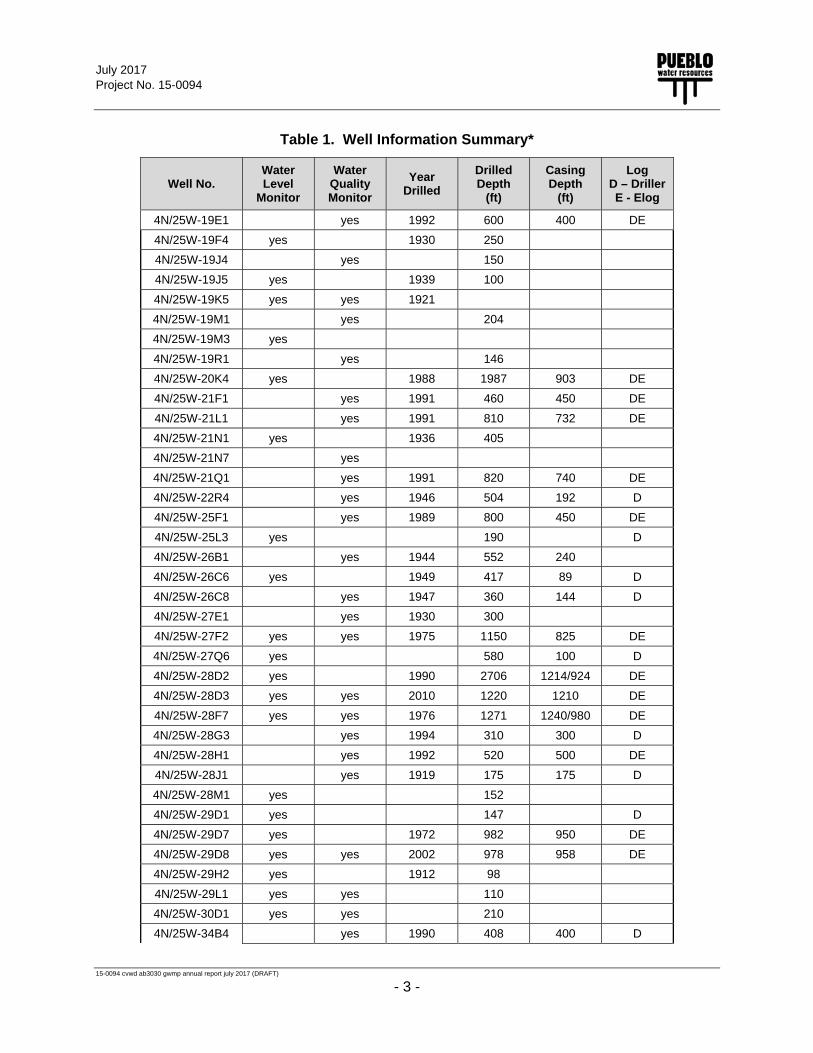
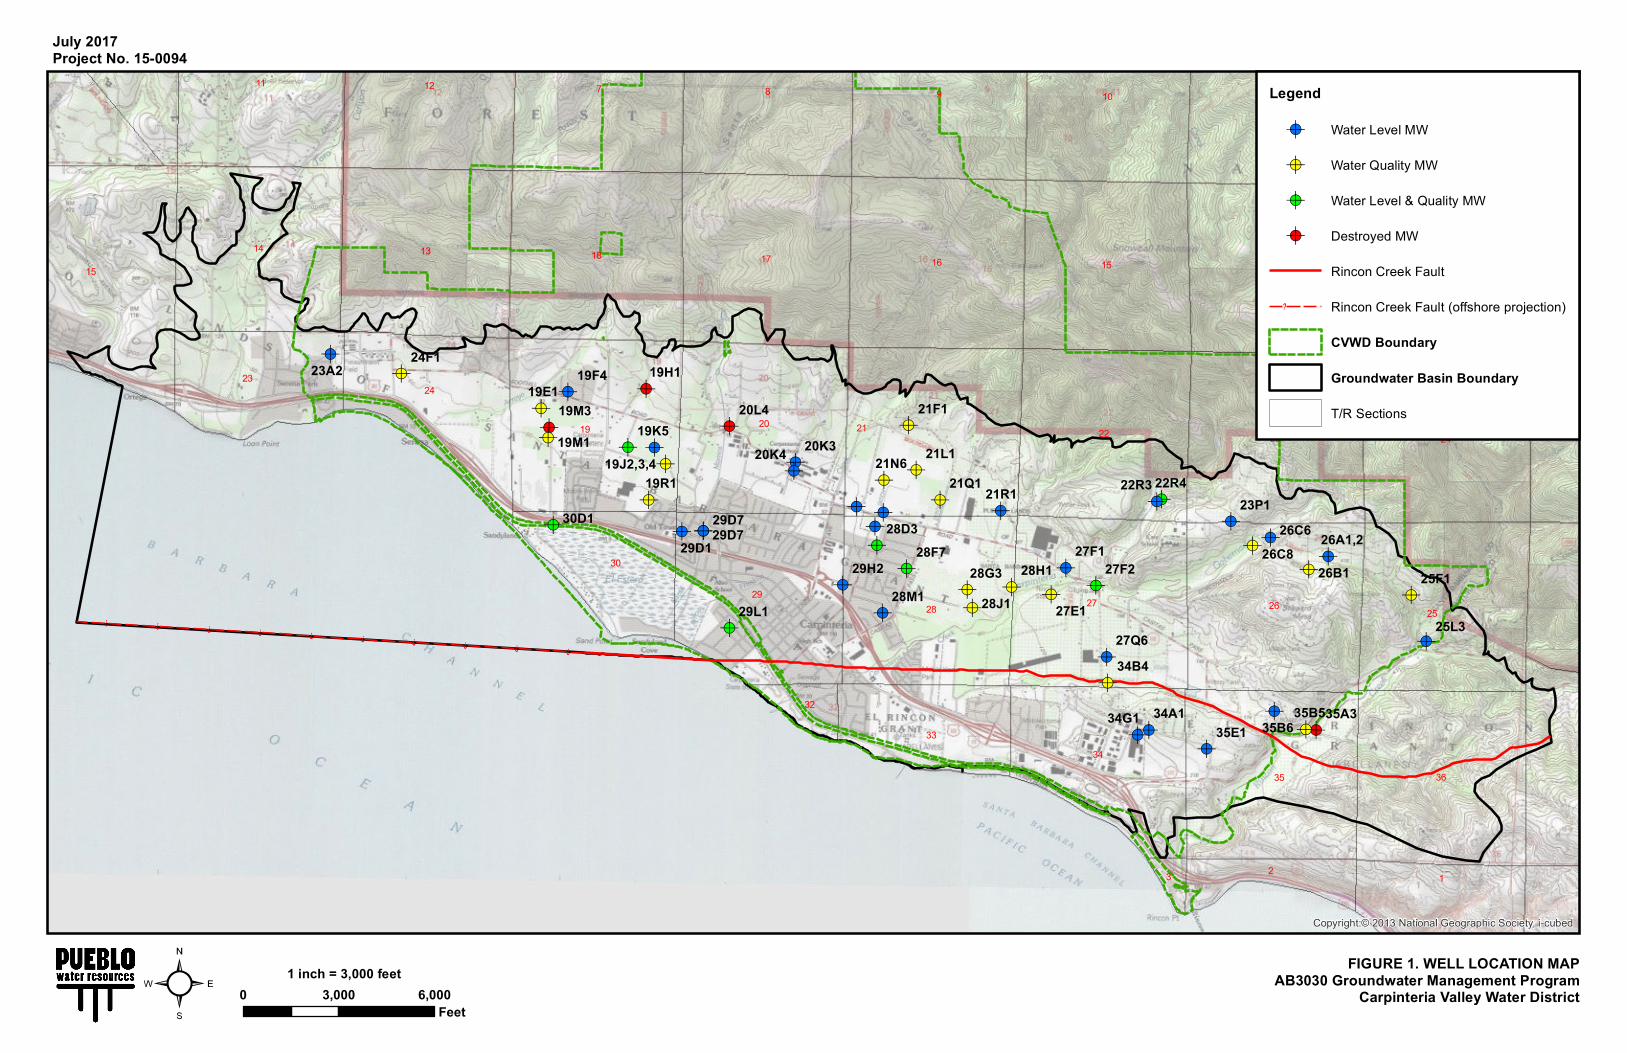
The CGB GWMP includes the collection of data from 42 wells located throughout the basin. The well network includes the District’s groundwater production wells, private wells, and monitoring wells. Water level data are collected on a bi-monthly basis (every other month) from 25 of the wells. Water quality data are collected on a bi-annual basis (fall and spring of each water year) from 25 wells. Water quality data are also collected from 6 surface water sampling locations within the basin. The locations of the CGB GWMP wells are shown on Figure 1, and basic information associated with each of the wells is provided in Table 1.
The GWMP also includes the collection, compilation, and assessment of precipitation data and groundwater production data. Groundwater production from District owned and operated wells is metered. Private pumping in the basin is not metered and has been estimated on an annual basis by the District since 1984 utilizing land use survey and water delivery
July 2017 Project No. 15-0094
15-0094 cvwd ab3030 gwmp annual report july 2017 (DRAFT)
- 2 -
information. Precipitation data is collected by the Santa Barbara County Flood Control District at the Carpinteria Fire Station (SBCFCD Gauging Station No. 208).
Water quality data are derived through the sampling at selected wells throughout the basin. In addition to groundwater samples, surface water samples are collected, when surface water conditions allow. The laboratory analytical program for the samples includes: total dissolved solids; basic inorganic chemical constituents, including chloride; and nitrates.
Water level data compiled through the GWMP are used to prepare hydrographs for each of the wells. In addition, the water level data are used to prepare contours of groundwater surface elevations for the fall and spring period of each water year. The hydrographs and contours allow for representation of basin wide water level conditions and facilitate the identification of trends and patterns with respect to CGB water level conditions.
Chemical hydrographs for selected constituents (TDS, chlorides, and nitrates) are also prepared as part of the GWMP. Again, the graphical representation of water quality data allow for easy identification of important trends in basin water quality.
Groundwater production data and precipitation data are also presented graphically in the annual report. These data are presented comparatively along with the water level and water quality data to help better visualize and understand the relationships between the various hydrogeologic components of the CGB.
While the GWMP was adopted in 1999, the District has been collecting hydrogeologic data from the CGB for many years prior. An update of basin conditions was prepared by Pueblo1 in 2012 for the period WY 1985 through WY 2005. For the purpose of establishing a continuation on that work, graphics for this report date back at least to WY 1985.
Following Pueblo’s 2012 update of CGB hydrologic conditions, subsequent updates were performed in 2014 and 2015 covering the periods of WY 2009 through 2014. Hydrologic updates for WY 2015 - 2016 have been prepared by Pueblo and are discussed as part of this GWMP report. The coordination of the GWMP and the annual updates of CGB hydrologic conditions achieve the District’s goal of synchronizing these two important programs for the purpose of timely and effective basin management.
1 Carpinteria Groundwater Basin, Hydrogeologic Update and Groundwater Model Project Final Report, prepared by Pueblo Water Resources, Inc. for Carpinteria Valley Water District, dated June 30, 2012.
July 2017 Project No. 15-0094
15-0094 cvwd ab3030 gwmp annual report july 2017 (DRAFT)
- 3 -
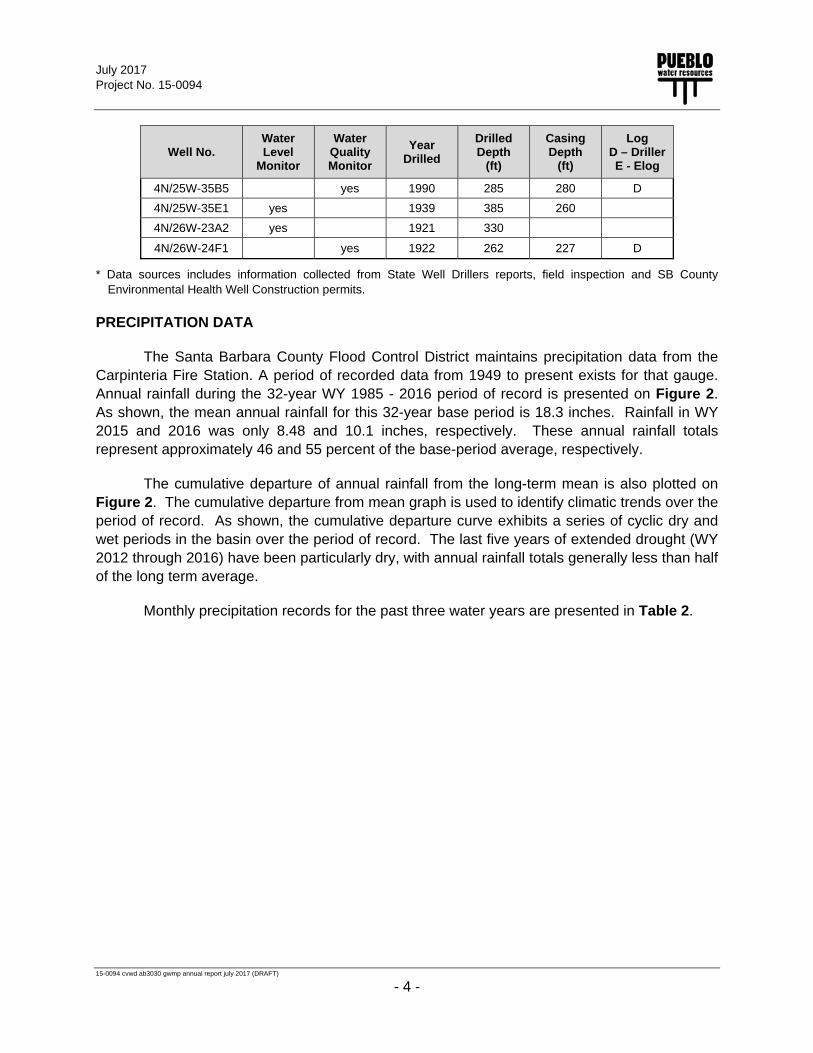
Table 1. Well Information Summary*
Well No. Water Level
Monitor
Water Quality Monitor
Year Drilled
Drilled Depth
(ft)
Casing Depth
(ft)
Log D – DrillerE - Elog
4N/25W-19E1 yes 1992 600 400 DE
4N/25W-19F4 yes 1930 250
4N/25W-19J4 yes 150
4N/25W-19J5 yes 1939 100
4N/25W-19K5 yes yes 1921
4N/25W-19M1 yes 204
4N/25W-19M3 yes
4N/25W-19R1 yes 146
4N/25W-20K4 yes 1988 1987 903 DE
4N/25W-21F1 yes 1991 460 450 DE
4N/25W-21L1 yes 1991 810 732 DE
4N/25W-21N1 yes 1936 405
4N/25W-21N7 yes
4N/25W-21Q1 yes 1991 820 740 DE
4N/25W-22R4 yes 1946 504 192 D
4N/25W-25F1 yes 1989 800 450 DE
4N/25W-25L3 yes 190 D
4N/25W-26B1 yes 1944 552 240
4N/25W-26C6 yes 1949 417 89 D
4N/25W-26C8 yes 1947 360 144 D
4N/25W-27E1 yes 1930 300
4N/25W-27F2 yes yes 1975 1150 825 DE
4N/25W-27Q6 yes 580 100 D
4N/25W-28D2 yes 1990 2706 1214/924 DE
4N/25W-28D3 yes yes 2010 1220 1210 DE
4N/25W-28F7 yes yes 1976 1271 1240/980 DE
4N/25W-28G3 yes 1994 310 300 D
4N/25W-28H1 yes 1992 520 500 DE
4N/25W-28J1 yes 1919 175 175 D
4N/25W-28M1 yes 152
4N/25W-29D1 yes 147 D
4N/25W-29D7 yes 1972 982 950 DE
4N/25W-29D8 yes yes 2002 978 958 DE
4N/25W-29H2 yes 1912 98
4N/25W-29L1 yes yes 110
4N/25W-30D1 yes yes 210
4N/25W-34B4 yes 1990 408 400 D
July 2017 Project No. 15-0094
15-0094 cvwd ab3030 gwmp annual report july 2017 (DRAFT)
- 4 -
Well No. Water Level
Monitor
Water Quality Monitor
Year Drilled
Drilled Depth
(ft)
Casing Depth
(ft)
Log D – DrillerE - Elog
4N/25W-35B5 yes 1990 285 280 D
4N/25W-35E1 yes 1939 385 260
4N/26W-23A2 yes 1921 330
4N/26W-24F1 yes 1922 262 227 D
* Data sources includes information collected from State Well Drillers reports, field inspection and SB County Environmental Health Well Construction permits.
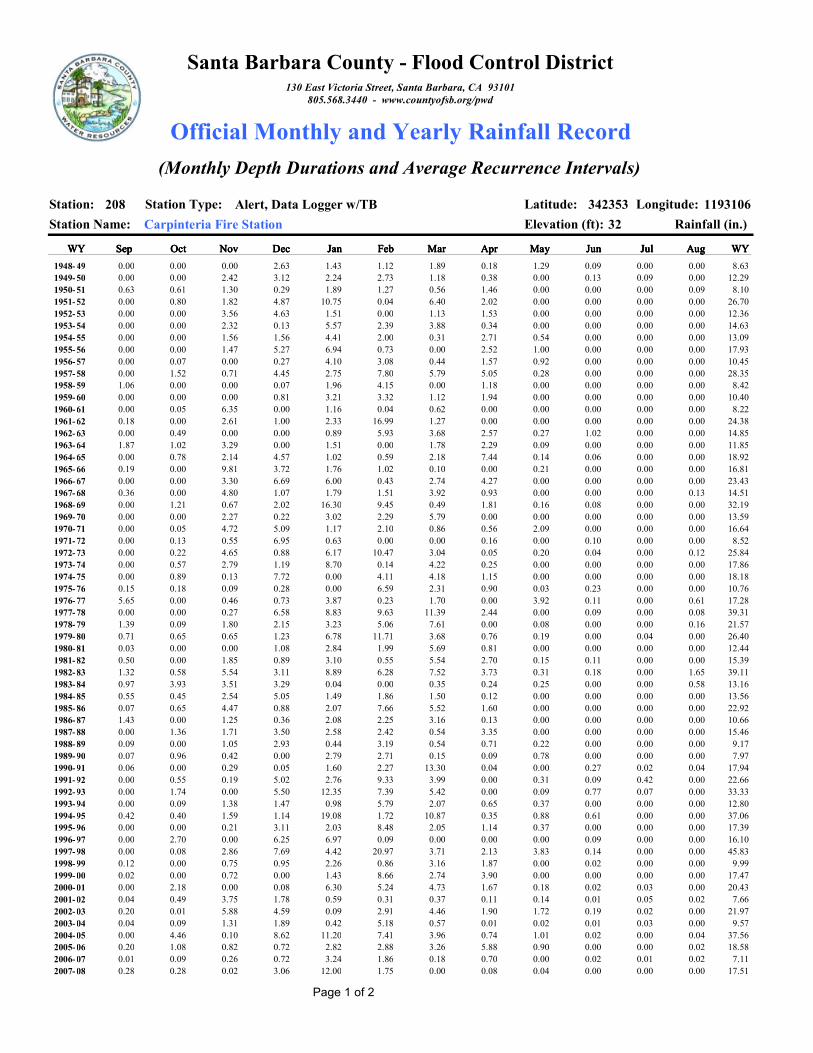
PRECIPITATION DATA
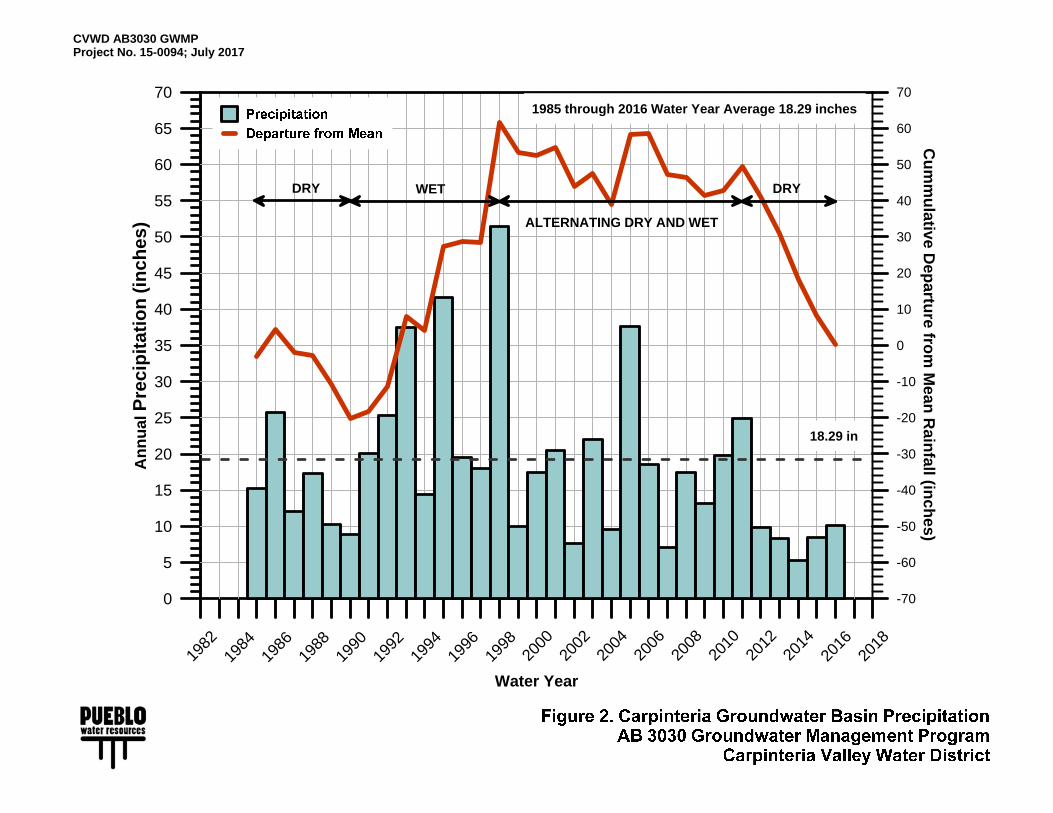
The Santa Barbara County Flood Control District maintains precipitation data from the Carpinteria Fire Station. A period of recorded data from 1949 to present exists for that gauge. Annual rainfall during the 32-year WY 1985 - 2016 period of record is presented on Figure 2. As shown, the mean annual rainfall for this 32-year base period is 18.3 inches. Rainfall in WY 2015 and 2016 was only 8.48 and 10.1 inches, respectively. These annual rainfall totals represent approximately 46 and 55 percent of the base-period average, respectively.
The cumulative departure of annual rainfall from the long-term mean is also plotted on Figure 2. The cumulative departure from mean graph is used to identify climatic trends over the period of record. As shown, the cumulative departure curve exhibits a series of cyclic dry and wet periods in the basin over the period of record. The last five years of extended drought (WY 2012 through 2016) have been particularly dry, with annual rainfall totals generally less than half of the long term average.
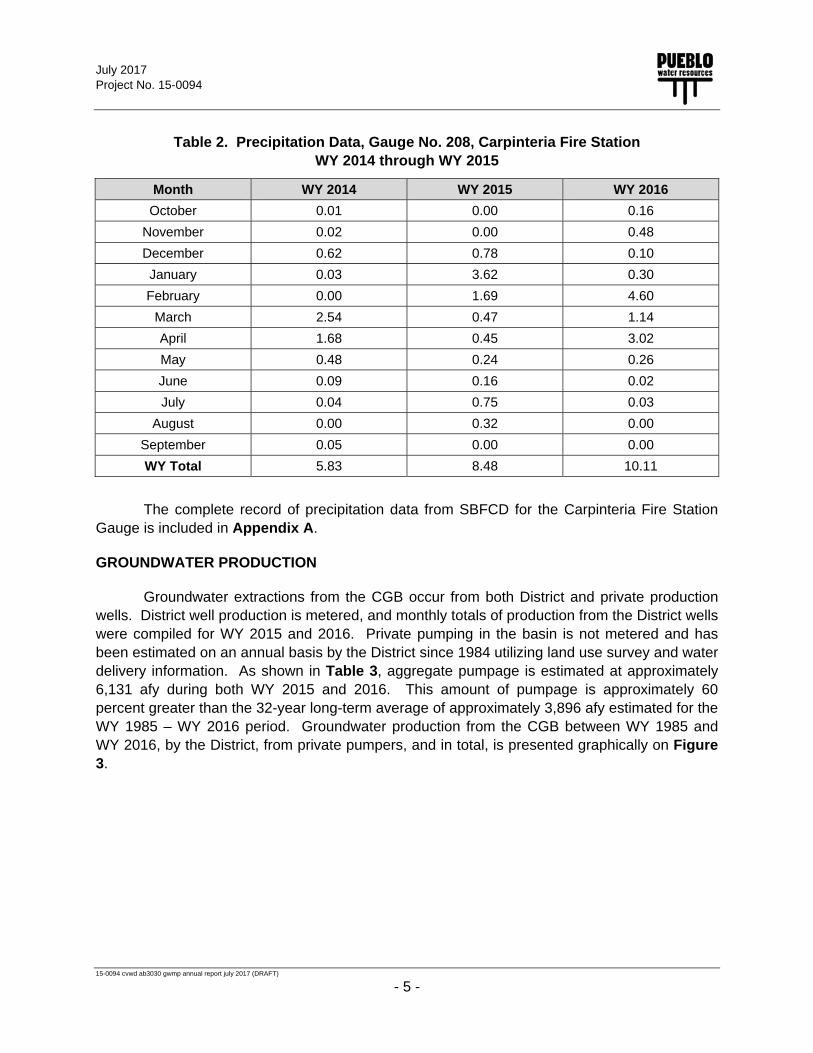
Monthly precipitation records for the past three water years are presented in Table 2.
July 2017 Project No. 15-0094
15-0094 cvwd ab3030 gwmp annual report july 2017 (DRAFT)
- 5 -
Table 2. Precipitation Data, Gauge No. 208, Carpinteria Fire Station WY 2014 through WY 2015
Month WY 2014 WY 2015 WY 2016
October 0.01 0.00 0.16
November 0.02 0.00 0.48
December 0.62 0.78 0.10
January 0.03 3.62 0.30
February 0.00 1.69 4.60
March 2.54 0.47 1.14
April 1.68 0.45 3.02
May 0.48 0.24 0.26
June 0.09 0.16 0.02
July 0.04 0.75 0.03
August 0.00 0.32 0.00
September 0.05 0.00 0.00
WY Total 5.83 8.48 10.11
The complete record of precipitation data from SBFCD for the Carpinteria Fire Station Gauge is included in Appendix A.
GROUNDWATER PRODUCTION
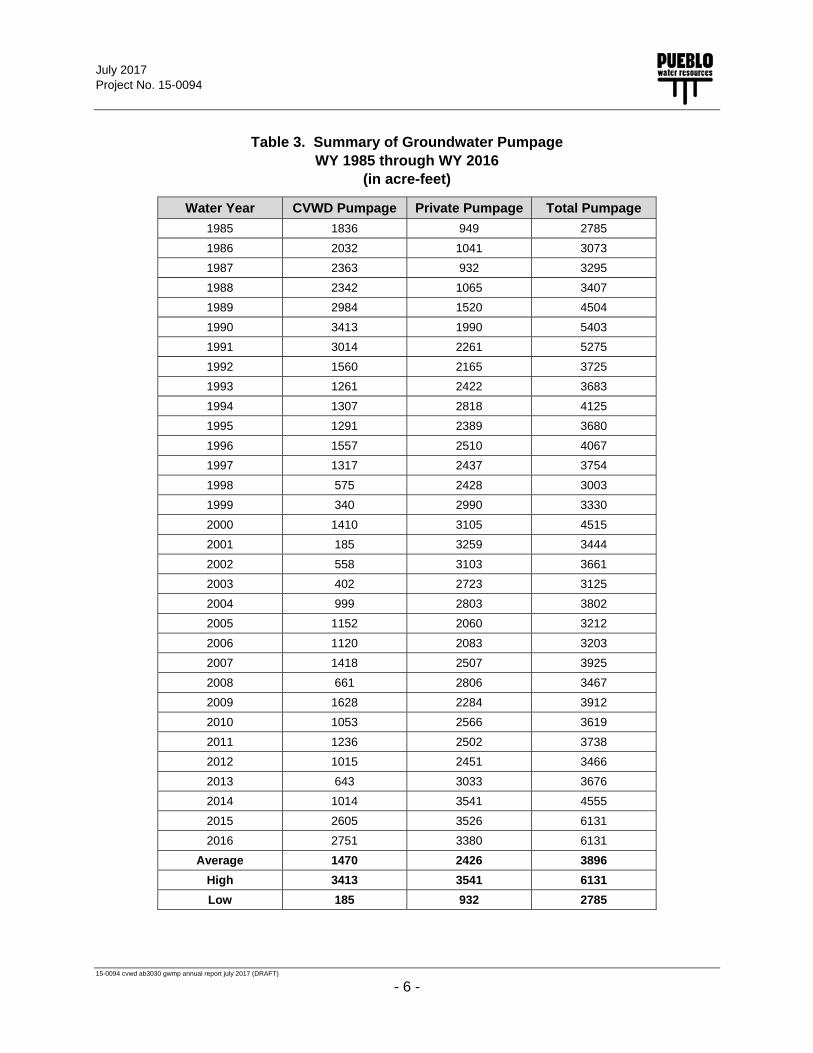
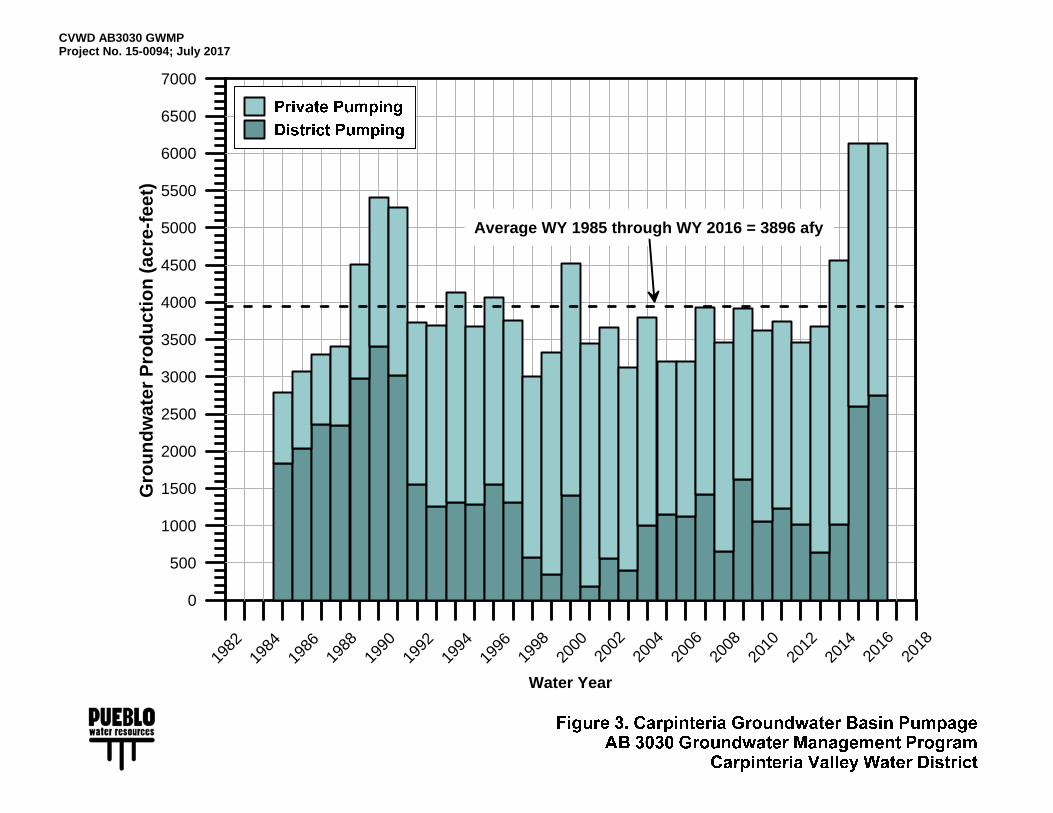
Groundwater extractions from the CGB occur from both District and private production wells. District well production is metered, and monthly totals of production from the District wells were compiled for WY 2015 and 2016. Private pumping in the basin is not metered and has been estimated on an annual basis by the District since 1984 utilizing land use survey and water delivery information. As shown in Table 3, aggregate pumpage is estimated at approximately 6,131 afy during both WY 2015 and 2016. This amount of pumpage is approximately 60 percent greater than the 32-year long-term average of approximately 3,896 afy estimated for the WY 1985 – WY 2016 period. Groundwater production from the CGB between WY 1985 and WY 2016, by the District, from private pumpers, and in total, is presented graphically on Figure 3.
July 2017 Project No. 15-0094
15-0094 cvwd ab3030 gwmp annual report july 2017 (DRAFT)
- 6 -
Table 3. Summary of Groundwater Pumpage WY 1985 through WY 2016
(in acre-feet)
Water Year CVWD Pumpage Private Pumpage Total Pumpage
1985 1836 949 2785
1986 2032 1041 3073
1987 2363 932 3295
1988 2342 1065 3407
1989 2984 1520 4504
1990 3413 1990 5403
1991 3014 2261 5275
1992 1560 2165 3725
1993 1261 2422 3683
1994 1307 2818 4125
1995 1291 2389 3680
1996 1557 2510 4067
1997 1317 2437 3754
1998 575 2428 3003
1999 340 2990 3330
2000 1410 3105 4515
2001 185 3259 3444
2002 558 3103 3661
2003 402 2723 3125
2004 999 2803 3802
2005 1152 2060 3212
2006 1120 2083 3203
2007 1418 2507 3925
2008 661 2806 3467
2009 1628 2284 3912
2010 1053 2566 3619
2011 1236 2502 3738
2012 1015 2451 3466
2013 643 3033 3676
2014 1014 3541 4555
2015 2605 3526 6131
2016 2751 3380 6131
Average 1470 2426 3896
High 3413 3541 6131
Low 185 932 2785
July 2017 Project No. 15-0094
15-0094 cvwd ab3030 gwmp annual report july 2017 (DRAFT)
- 7 -
WATER-LEVEL DATA
Water level data and the hydrographs prepared using the data are essential elements of the GWMP. Hydrographs help to identify water-level trends, assess aquifer response to various hydrogeologic conditions, and assess changes in groundwater storage between various periods in time.
Water-level data in the basin have historically been collected and maintained by the USGS and the District. The USGS database contains water-level records for 75 wells in the CGB, dating back to as early as 1919 (State Well No. 4N/25W-28J1); however, most records begin in either the 1940s or 1970s. The USGS database does not extend beyond 2001. After 2001 the District continued measuring water levels at various wells as part of the GWMP.
Currently, water level data are collected by District staff on a bi-monthly basis from approximately 25 wells located throughout the CGB. As part of the routine collection of water level data, District staff record observations made in the field regarding well activity to assist in determining whether the measurement made at a particular well represents a static or a recovering water level. Pumping water levels are not collected. Hydrographs are created with measurements that represent as close as possible static water level conditions, although it is likely that some of the measurements used are still experiencing some degree of recovery. It is also important to note that many of the wells throughout the basin are screened across multiple aquifer zones. Water bearing deposits within the CGB include interbedded layers of sand, gravel, silt and clay. The coarser grained units comprise the major aquifer zones within the basin, designated Aquifers A (youngest and shallowest), B, C, and D (oldest and deepest). These primary aquifer zones are distinct and generally on the order of 50 to 100 feet thick each, are separated by a series of fine-grained aquitards, and within the central portion of the basin occur under confined conditions. Water level data collected from wells screened across multiple aquifer zones represent composites of the water level conditions of the completed aquifers.
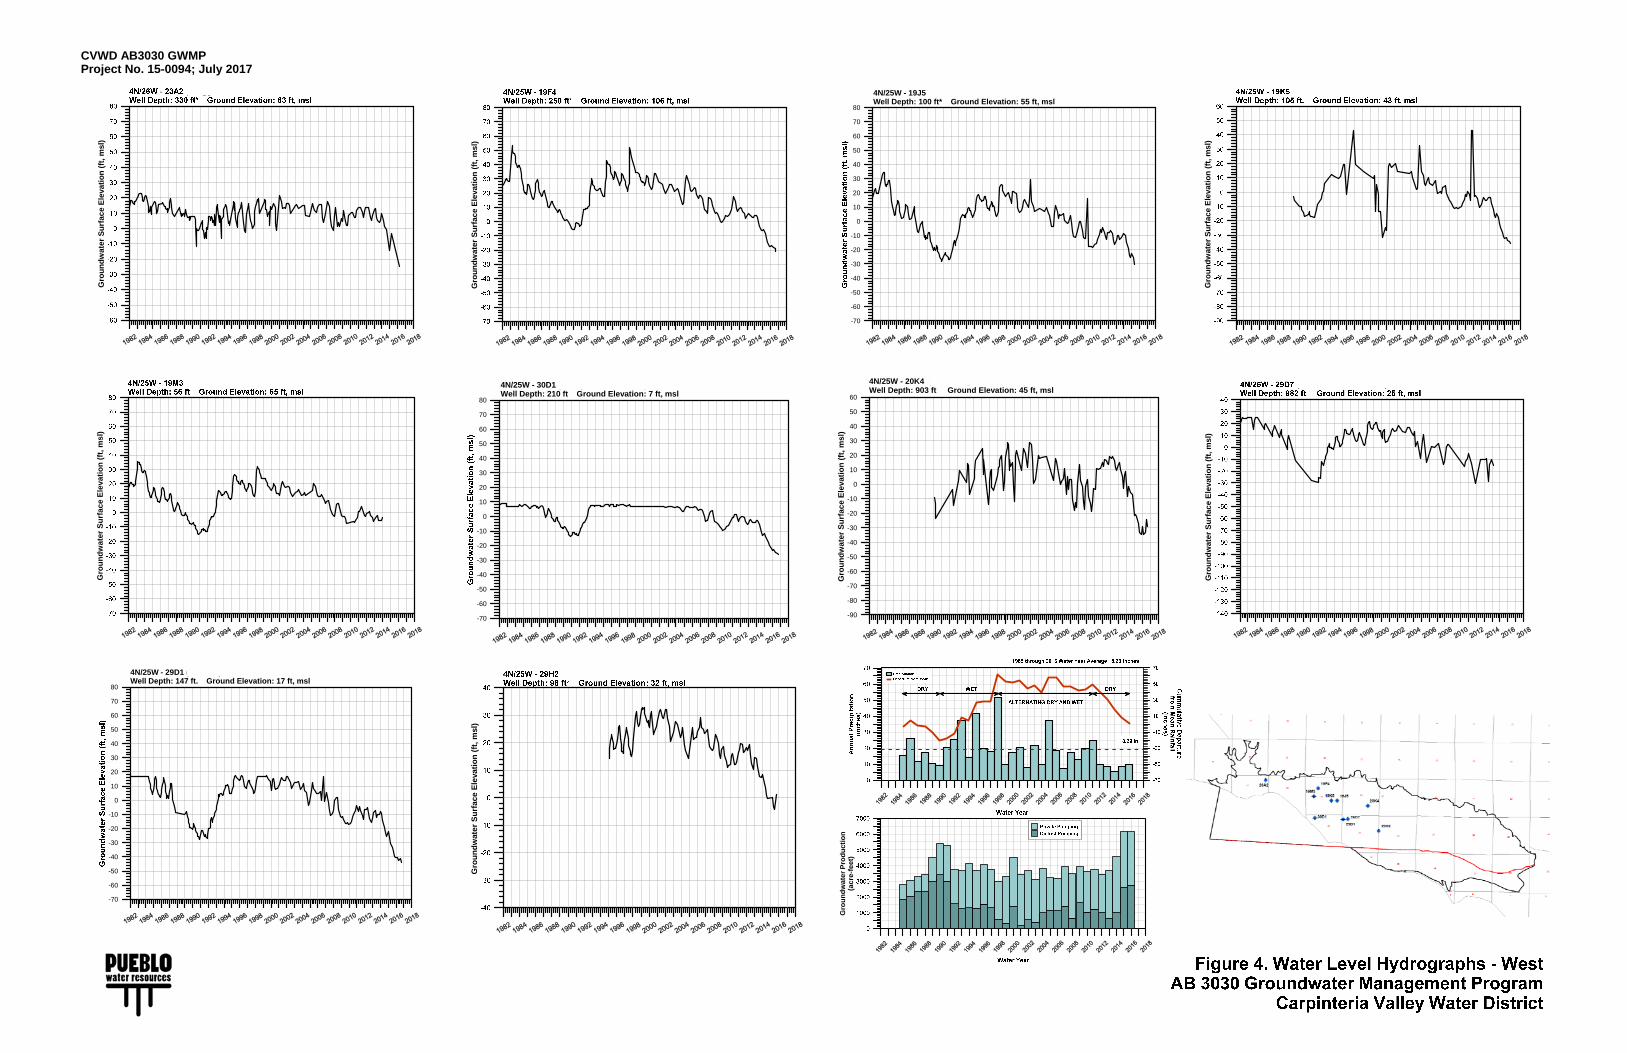
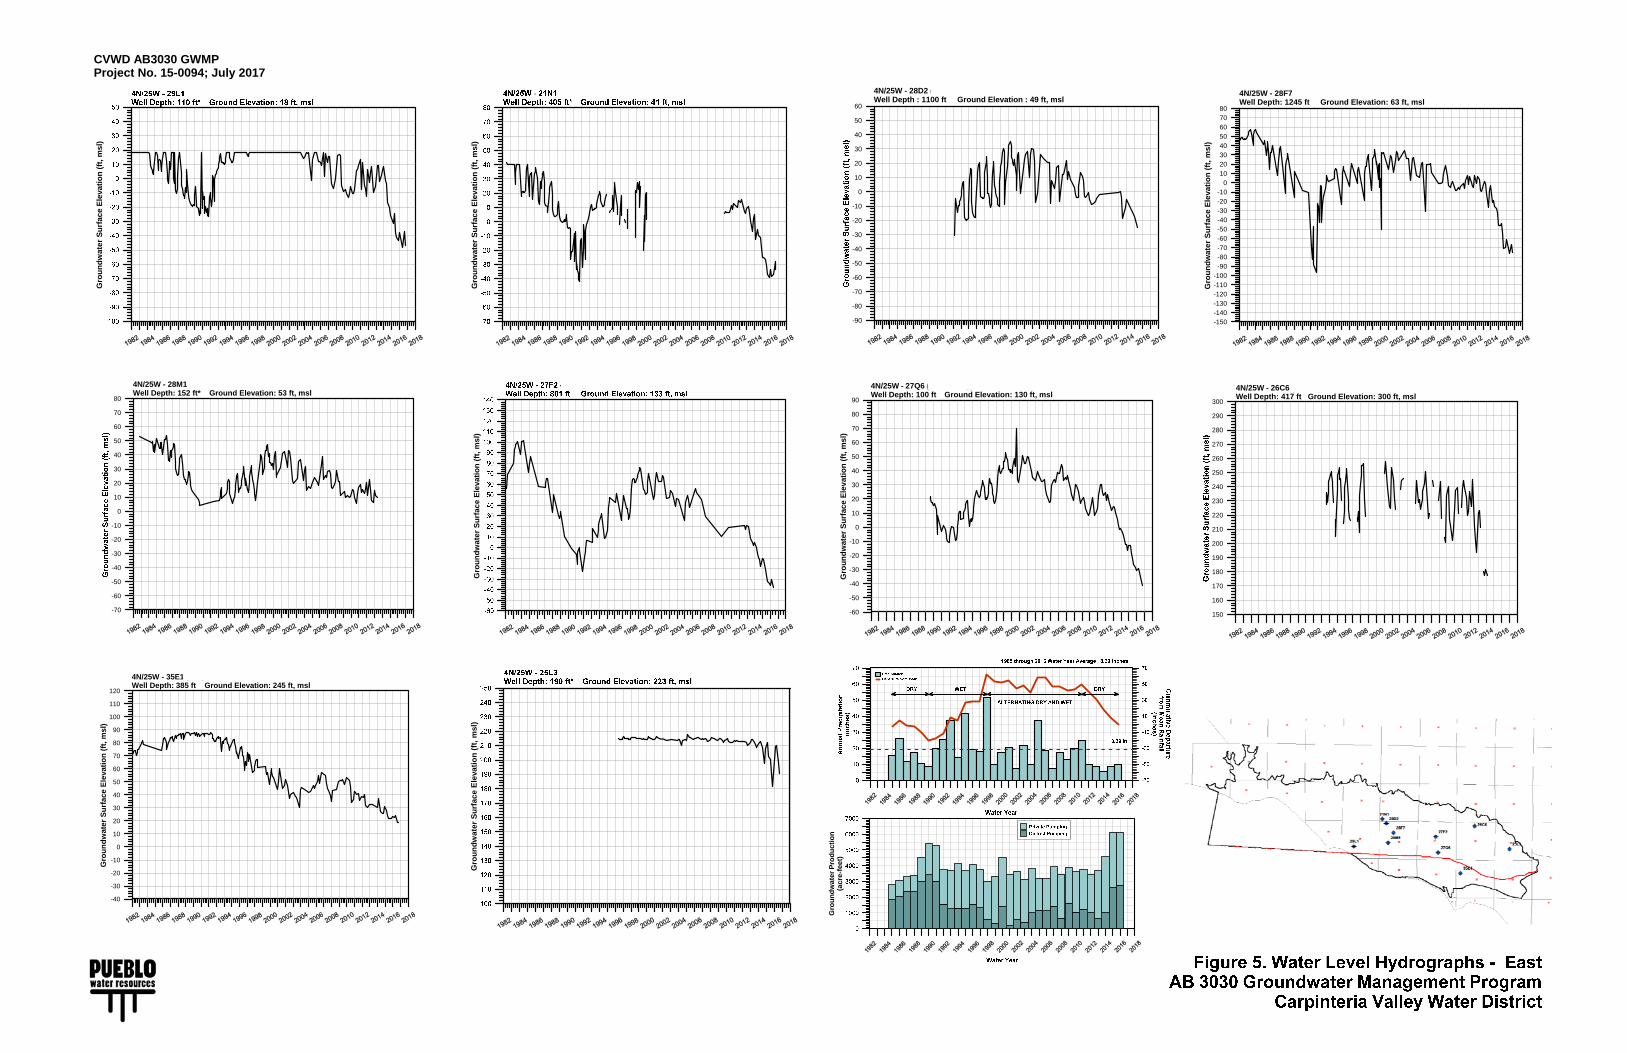
Pueblo has reviewed the water level data collected by the District staff for the WY 2015 and WY 2016 period, and has prepared hydrographs for 20 key wells. These hydrographs are presented on Figures 4 and 5. The records for many of the 20 wells were complete dating back to about 1982 so this date was used as the starting point for the hydrographs. Also presented on the hydrographs along with the water level data are graphical representations of precipitation and groundwater production over the period of record to allow for consideration of these two important hydrogeologic elements when evaluating the water level records.
The hydrographs generally display seasonal and small amplitude annual fluctuations superimposed upon some more enduring, prominent trends. When viewed as a whole, the set of hydrographs presented on Figures 4 and 5 reveal some notable trends that occurred or are occurring within the CGB. Water levels were relatively high in the early- to mid-1980s, then declined relatively sharply in response to an extended 4-year drought that occurred between 1987 and 1990. Evidence of this drought is apparent in the precipitation data and the cumulative departure curve shown on Figure 2. Maximum water level declines in many of the wells occurred during the fall of 1991, after which, water levels trended upward in response to
July 2017 Project No. 15-0094
15-0094 cvwd ab3030 gwmp annual report july 2017 (DRAFT)
- 8 -
increased precipitation and subsequent recharge, and to some extent, a moderate decrease in basin pumpage. The peak of this trend of water level recovery occurred in the late 1990’s –early 2000’s. After that, the hydrographs show a general trend of steady though moderately declining water levels.
The results of the last five years of extended drought (WY 2012 through 2016) are apparent in the hydrographs and sharp declines in water levels have occurred during this period. Review of the hydrographs indicate that at some wells within the basin, the recent levels remain above the low levels attained in 1991, while at other wells, the magnitude of recent decline is equal to or has exceeded that of 1991. Over the past two years (WY2015 and WY2016) water levels throughout the basin, with a couple of exceptions, have been below sea level. In the center of the basin, water levels are generally between 30 feet and 40 feet below sea level.
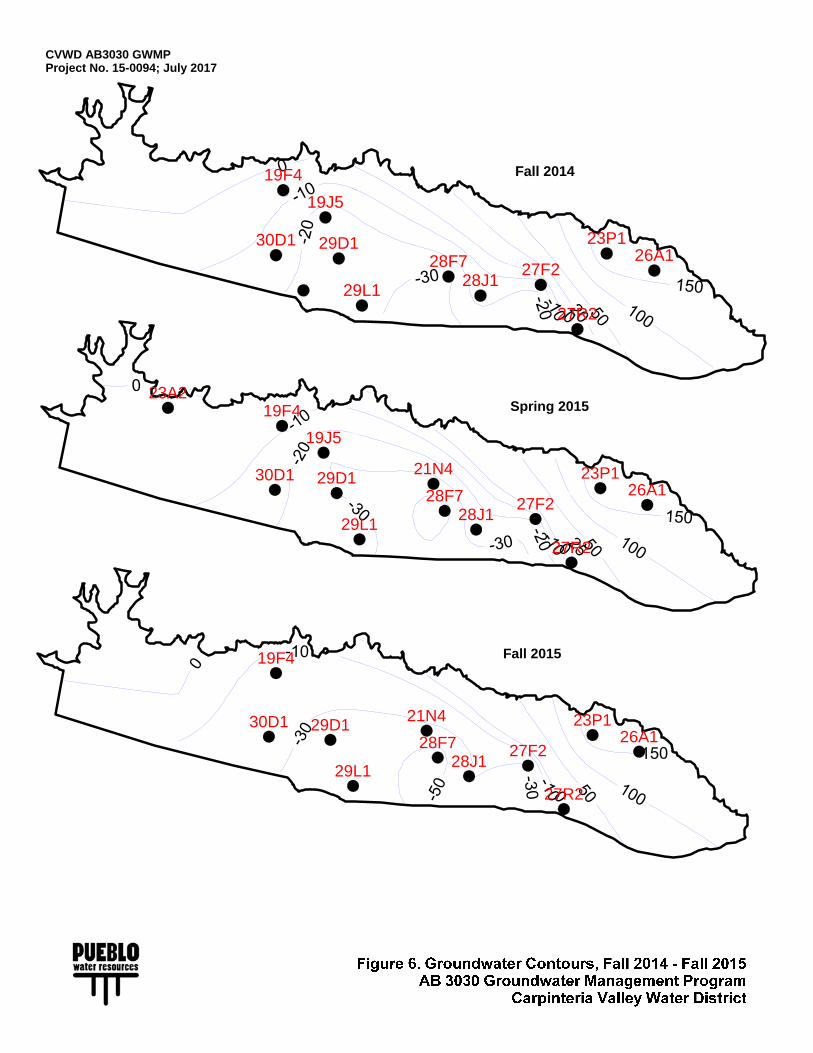
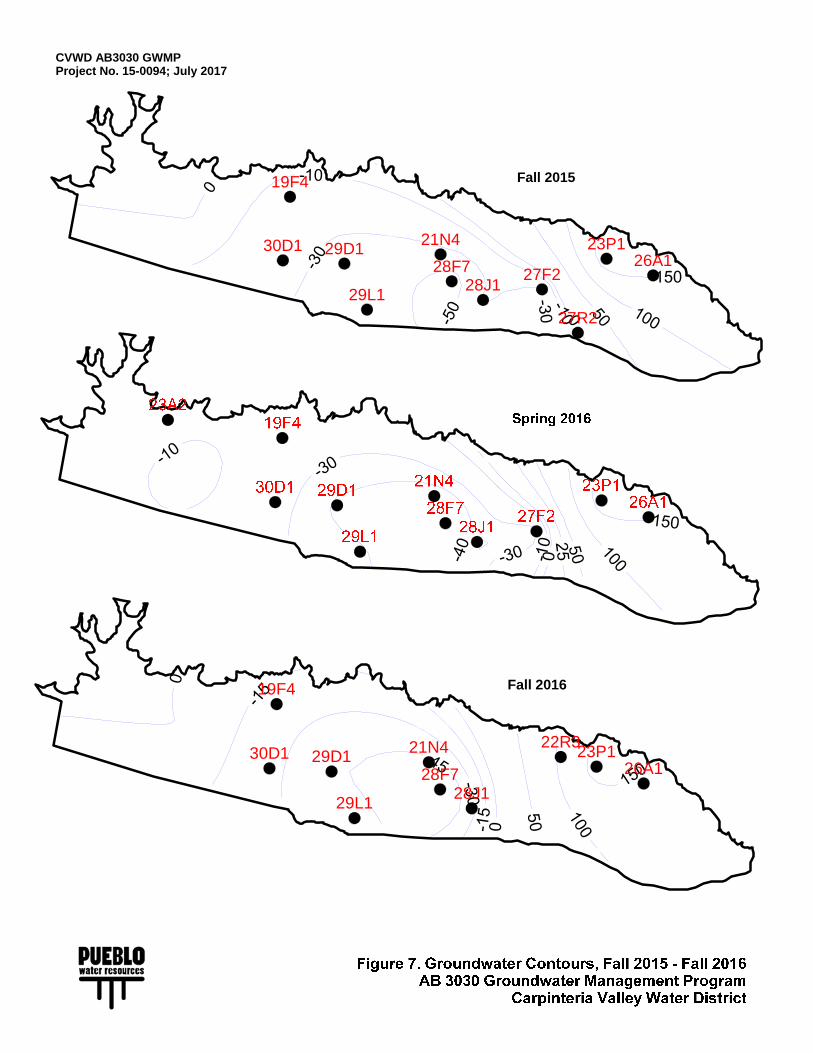
Water level contours have been prepared for the spring and fall periods of WY 2015 and WY 2016. A contour map has also been prepared for the WY 2014 fall period to create a bridge from the reporting from calendar years to water years. The purpose of the water-level contours is to help to identify general patterns in the flow regime within the basin. The contours also are useful in identifying recharge and discharge patterns, and to help understand water level conditions along the margins of the basin, particularly at the coast. The water level contours are presented on Figures 6 and 7.
The water-level contours show that groundwater generally flows in a northeast to southwesterly direction in the eastern half of the basin, and north to south in the western half of the basin. The directions of groundwater flow generally reflect the movement of groundwater from the primary sources of recharge to the primary sources of extraction (groundwater pumping) in the confined area in the center of the basin.
Also apparent on the contour maps is the development of a water-level depression centered in the central portion the basin that has occurred as a result of the last five years of extended drought (WY 2012 through 2016) when limited recharge was available and groundwater extractions were higher than normal. The contour map for the WY 2016 fall period shows the groundwater surface of more than 40 feet below sea level. In the western portion of the basin, even though there are limited data west of well 30D1 and near the coast, the contour maps show water levels along the coast below sea level, although it is difficult to know the actual extent of this condition. Nevertheless, this water level condition may result in a reversal of the natural seaward groundwater gradient, creating the potential for seawater intrusion in this portion of the basin (i.e., in the general area from Sand Point to Serena). It is noted that although seawater intrusion has not historically been detected in existing wells in the basin, there are no existing monitoring wells along the coast that penetrate into the deep Aquifers A – C that can serve as reliable seawater intrusion “sentinel” wells.
July 2017 Project No. 15-0094
15-0094 cvwd ab3030 gwmp annual report july 2017 (DRAFT)
- 9 -
HYDROLOGIC BUDGET
In 2012 Pueblo completed an update of hydrogeologic conditions of the CGB for the period WY1985 through WY2008 as part of a DWR Local Groundwater Assistance Fund grant. The project also included development of a calibrated groundwater model of the basin. Integral to the hydrogeologic update and model development project was an update of the hydrologic budget of the basin over the study period. The hydrologic budget update includes calculation of each of the various components of inflow and outflow in the basin for each water year, and the resulting cumulative changes in basin storage over the period.
Since completion of the 2012 project, Pueblo has provided the District hydrologic updates on an annual basis to allow the District to stay informed of basin conditions, in particular, the state of groundwater recharge and storage within the basin. The most recent hydrologic budget update for the CGB was recently completed by Pueblo for WY 2015 and WY 2016, the results of which were transmitted to the District in a technical memorandum dated March 31, 2017 (presented in Appendix B).
As described in the TM, the change in the amount of groundwater in storage depends on the annual water supply surplus or deficiency, as expressed in the water balance equation. The total inflow during WY 2015 and WY 2016 was estimated at 1,588 and 1,656 afy respectively, and the total amount of outflow was estimated at 6,231 afy in both WY 2015 and WY 2016. The result is a net annual storage depletion amount of approximately 4,643 and 4,575 afy, respectively, for WY 2015 and WY 2016. The storage depletion is a combined result of a limited amount of rainfall and subsequent recharge coupled with increased extractions over the two year period. The current storage conditions are similar to the conditions that existed at the end of the WY 1987 through WY 1990 drought. The hydrographs show that water levels within the basin recovered during the period following that drought, and the hydrologic budget shows an accompanying accumulation in basin storage.
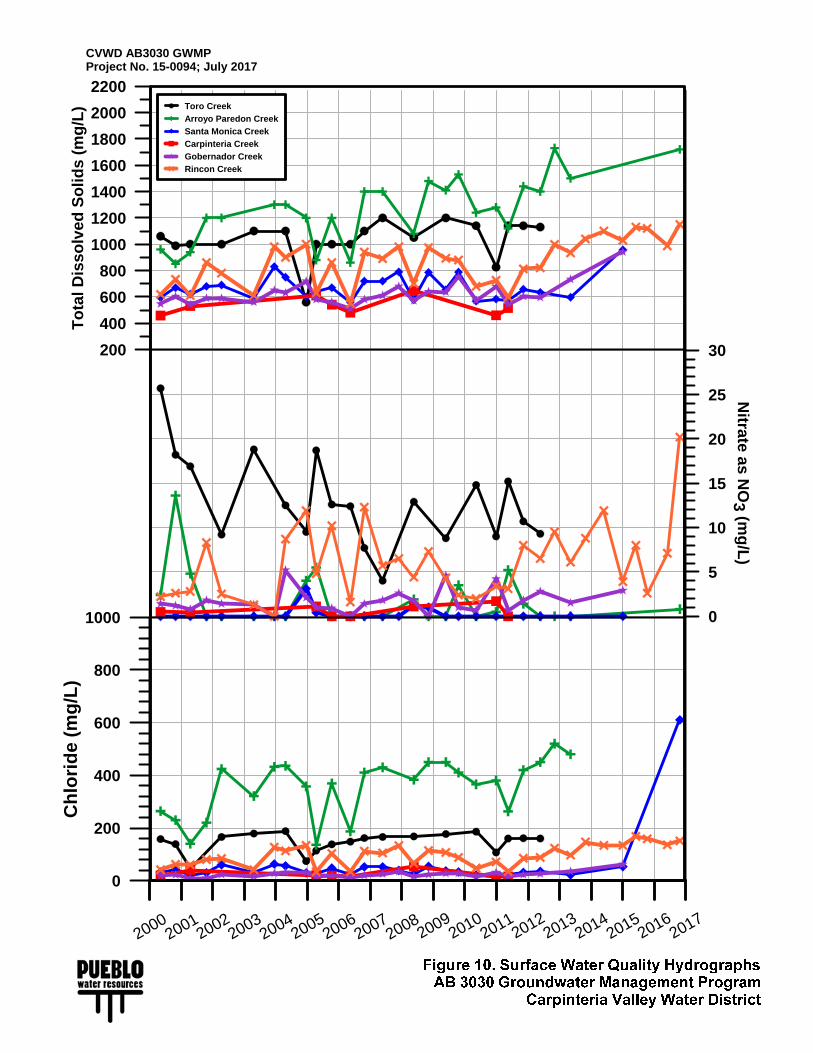
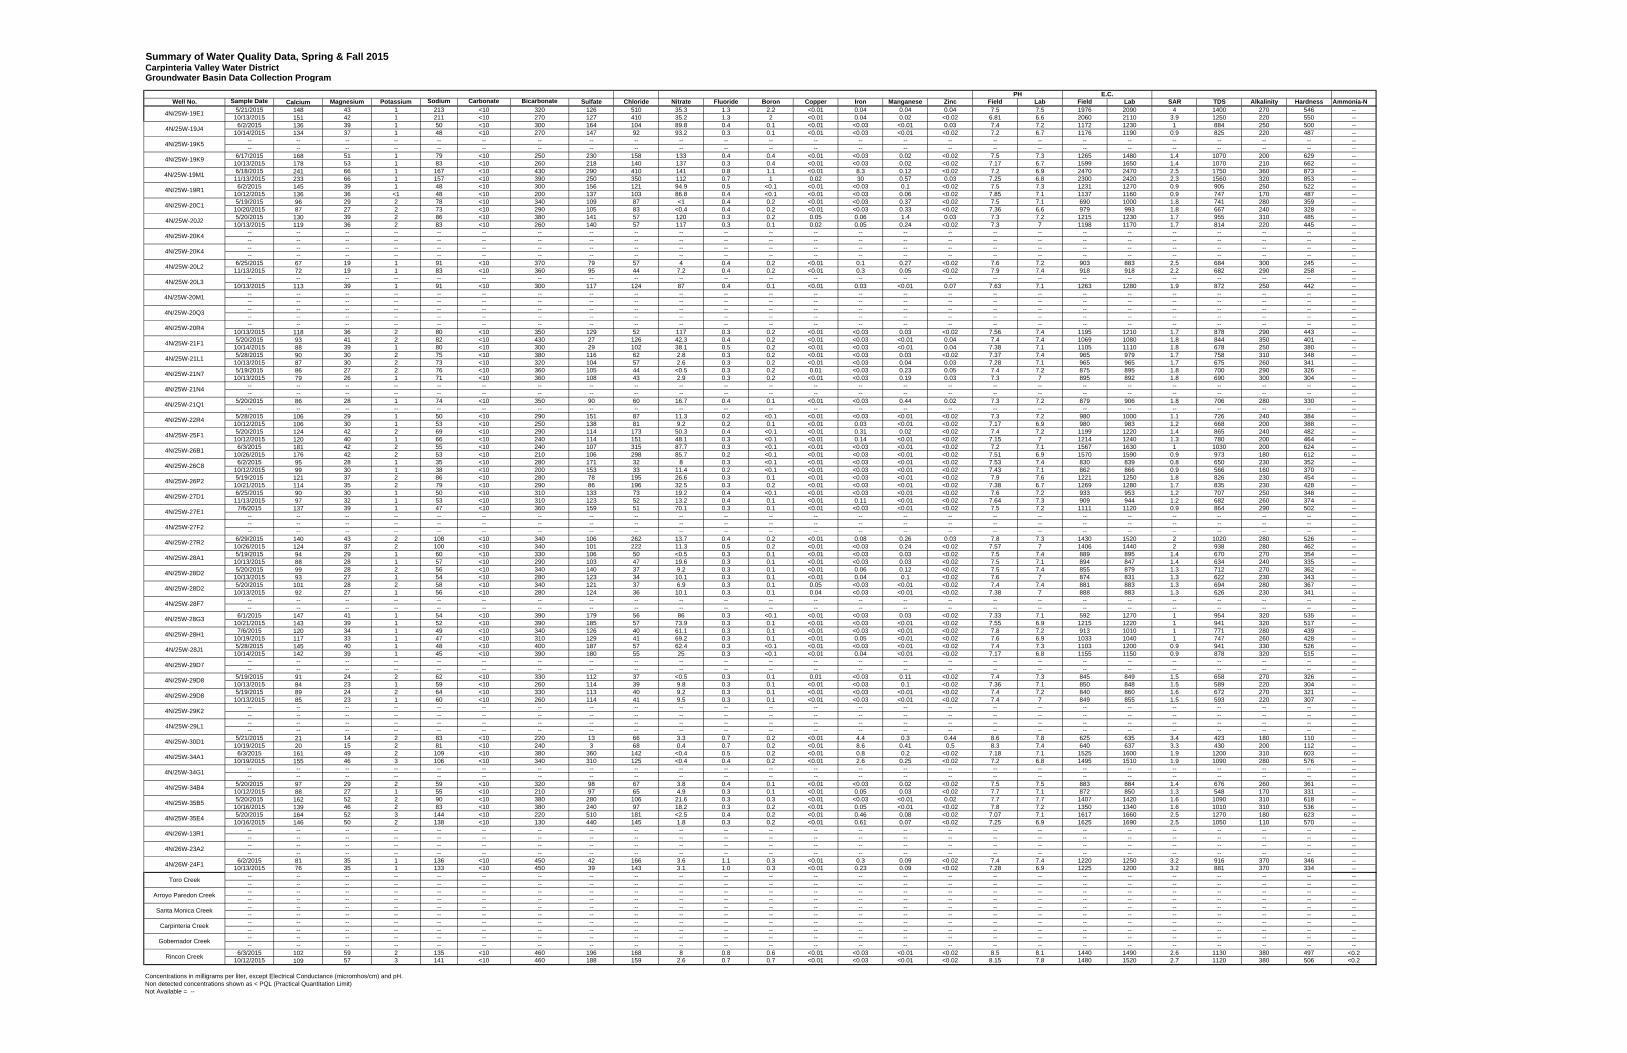
WATER QUALITY DATA
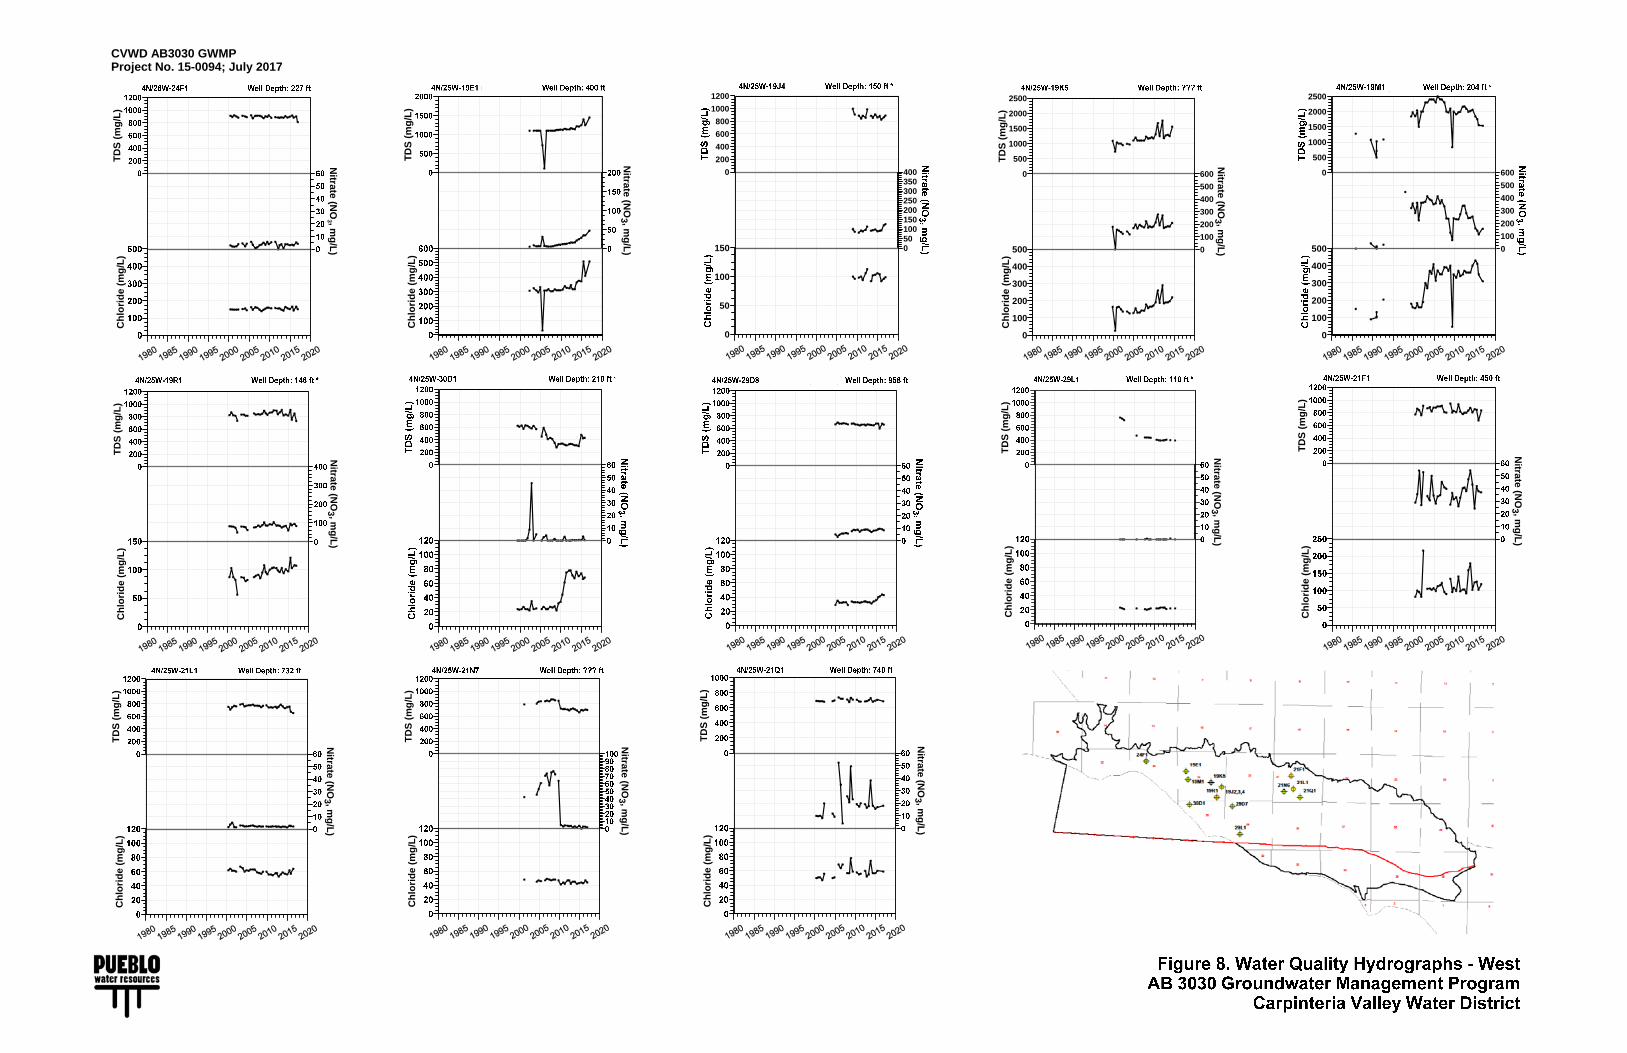
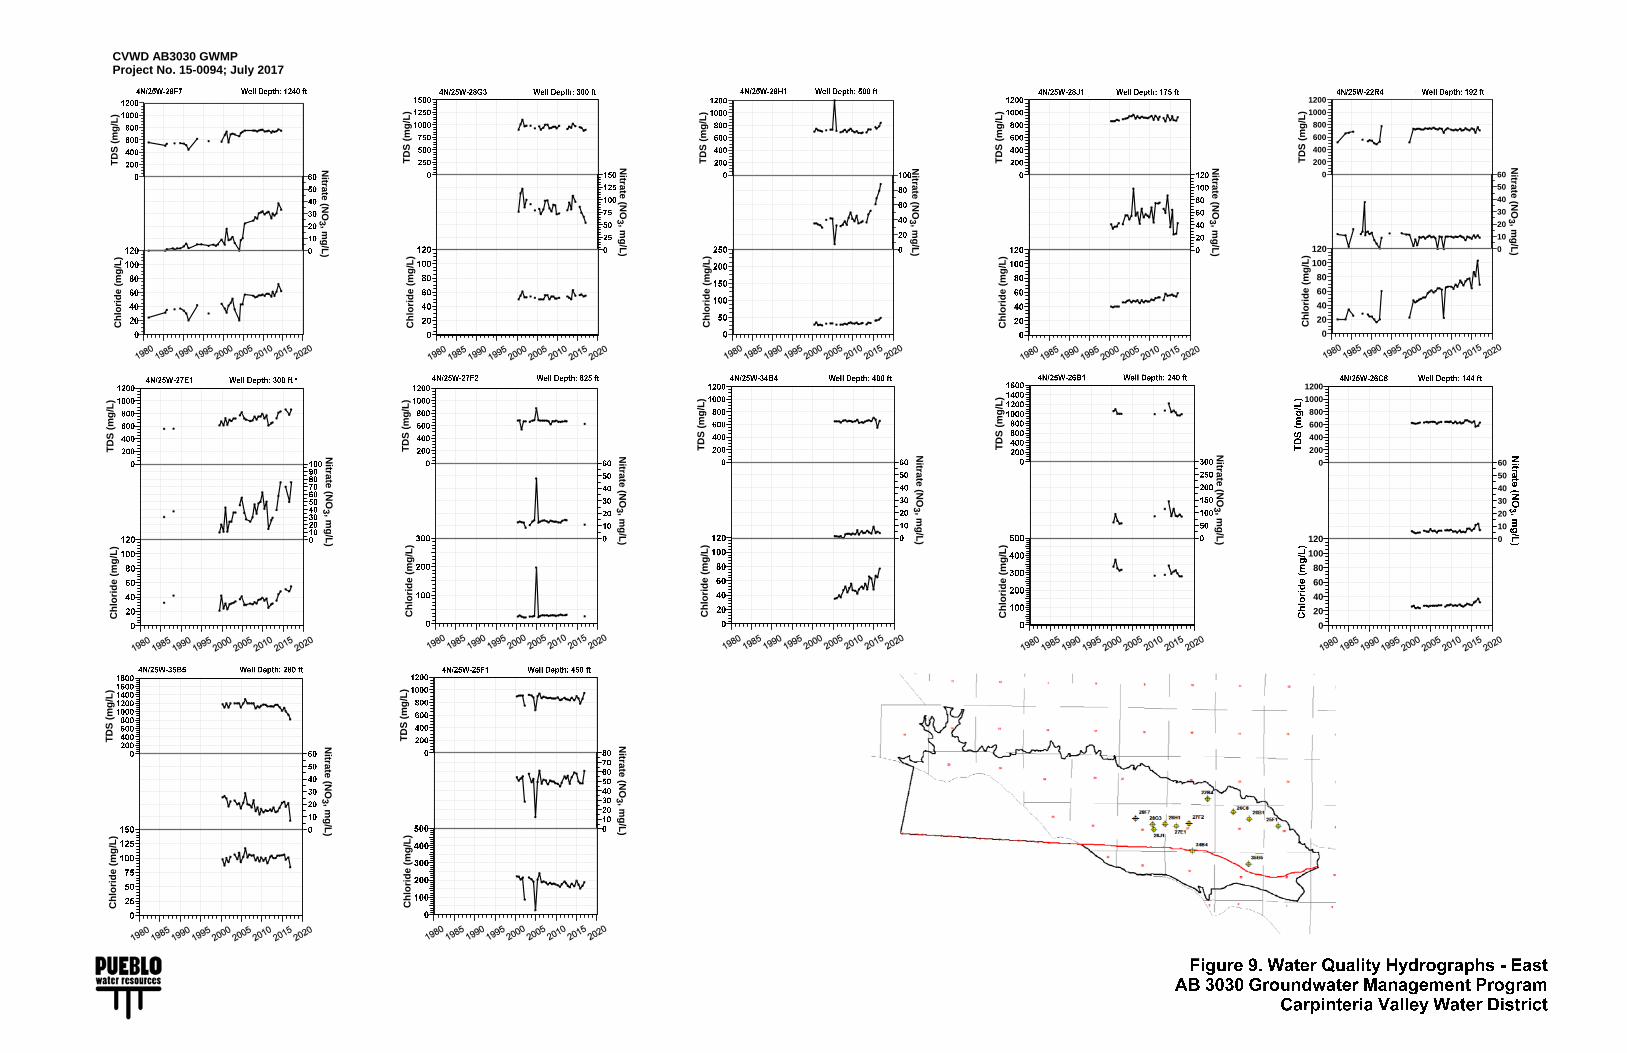
Groundwater quality within the CGB is monitored through the analysis of samples collected from 25 wells located throughout the basin. Water samples are also collected from six surface water stations when surface water is present. The laboratory analytical program for the samples includes: total dissolved solids; basic inorganic chemical constituents, including chloride; and nitrates. Chemical hydrographs have been prepared for the 25 wells monitored and are presented on Figures 8 and 9.
In general, the chemistry of groundwater within the CGB is characterized as calcium-bicarbonate, with concentrations of total dissolved solids within the range of 600 milligrams per liter (mg/L) to 900 mg/L, and chlorides in the range of 40 mg/L to 80 mg/L. Nitrate concentrations are variable throughout the basin, generally lower in wells that are completed in relatively deep aquifer units, and higher in wells in agricultural areas of shallow completions.
There are some notable issues and trends with respect to the water quality within the CGB. In the eastern portion of the basin, TDS concentrations appear to be relatively stable,
July 2017 Project No. 15-0094
15-0094 cvwd ab3030 gwmp annual report july 2017 (DRAFT)
- 10 -
nitrate concentrations are on an increasing trend in several of the wells (28F7 – Lyons, 28H1, and 27E1), and chloride concentrations appear to be relatively stable with a couple of exceptions where slight increases have appeared to occur (27E1, 22R4, and 34B4). The increases in nitrate concentrations in the noted wells appear to be localized and not uncommon for wells located in predominantly agricultural areas.
In the western portion of the basin, well 19M1 showed a notable increase in both TDS and nitrate concentrations between the early 1990’s and the year 2000. The TDS concentration at this well reached a peak of 2500 mg/L in 2006, but has steadily decreased to a current concentration of about 1500 mg/L. Similarly, the chloride concentration in this well peaked in excess of 400 mg/L in 2005, but declined since then to a recently reported concentration of 300 mg/L. Over this same period, the nitrate concentration in this well declined from a peak of approximately 430 mg/L to a recent concentration of about 160 mg/L. The condition of high nitrates at this well is believed to be a localized condition, and the owner of this well has cooperated with the District to investigate the source of the nitrates, but so far the investigation has been inconclusive.
Two wells in the western portion of the basin, 19E1 and 19K5, have exhibited increasing TDS and chloride concentrations in recent past. While there are insufficient data to definitively establish the existence of the increasing trends at 19E1, the TDS concentration appears to have increased from about 1200 mg/L to 1400 mg/L, with a corresponding increase in chlorides from 320 mg/L to possible concentrations of 500 mg/L. Over this same period, the nitrate concentration in the well increased steadily from about 10 mg/L to 50 mg/L.
For Well 19K5, again, the amount of data are insufficient to clearly confirm a firm trend, but TDS concentrations in this well appear to have increased possibly from 1250 mg/L to 1500 mg/L. The trend in chlorides at this well is more clearly established, having increased from about 140 mg/L to 240 mg/L between 2005 and the present.
Another notable water quality issue is associated with well 30D1, where chloride concentrations increased from approximately 25 mg/L to about 70 mg/L between 2009 and 2012. This well is considered to be unsuitable for monitoring and unreliable with respect to water quality conditions within the CGB because the well head has been severely compromised, for the most part open to the atmosphere, and water within the salt marsh has been observed to be high enough to inundate this monitoring well on some occasions.
Surface water quality data are plotted and presented on Figure 10. A trend of slightly increasing TDS concentrations for the surface water quality is apparent over the period of record. Nitrate and chloride concentrations at surface water sampling stations appear to be relatively stable since monitoring began.
Laboratory reports for samples analyzed during the current reporting period (WY 2015 and WY 2016) are included in Appendix C, along with complete summaries of compiled water quality data collected since the inception of the GWMP.
July 2017 Project No. 15-0094
15-0094 cvwd ab3030 gwmp annual report july 2017 (DRAFT)
- 11 -
CONCLUSIONS AND RECOMMENDATIONS
This annual report presents the findings of Carpinteria Valley Water District’s AB 3030 Groundwater Management Plan for the WY 2015 and WY 2016 reporting periods. The conclusions and recommendations developed through assessment of the data collected through the GWMP are as follows:
CONCLUSIONS
Total rainfall during WY 2015 and 2016 was approximately 8.48 and 10.1 inches, respectively, which are approximately 50 percent less than the long-term average of 18.3 inches.
The limited amounts of rainfall and stream runoff during the period resulted in no percolation recharge to the CGB. Total recharge during WY 2015 and 2016 is estimated to be approximately 1,588 and 1,656 afy, respectively, which are approximately 60 percent less than the long-term average of approximately 3,790 afy.
Aggregate Pumpage from the CGB is estimated to have been 6,131 afy for WY 2015 and 6,131 afy for WY 2016. This amount of annual pumpage of 6,131 afy is approximately 57 percent greater than the 32-year long-term average of approximately 3,896 afy estimated for the WY 1985 – WY 2016 period. The average of 3,896 afy is within the recommended long-term operational yield of the basin.
Water levels in the basin have declined over the past two years in response to the recent extended drought and higher than normal groundwater extractions. At some wells, the magnitude of water level decline is about the same as or greater than the decline that occurred in 1991.
Contour maps show that throughout WY 2015 and WY 2016, water levels within the central portion of the basin have been consistently below sea level, most recently on the order of 30 to 40 feet toward the center of the depression.
Although there are no suitable monitoring wells for monitoring water levels within distinct aquifer units at locations adjacent to the coast, there is a possibility that water levels along the coast may have been consistently below sea level during the past two years, a condition that if continued could ultimately result in sea water intrusion within the basin.
Water quality has generally remained stable throughout the basin, although some wells, particularly in the western portion of the basin, have experienced
July 2017 Project No. 15-0094
15-0094 cvwd ab3030 gwmp annual report july 2017 (DRAFT)
- 12 -
slight increases in TDS and chlorides. While the cause of TDS and chloride increases has not been determined, this trend is not believed to be related to seawater intrusion.
Although conditions potentially exist that could lead to seawater intrusion, seawater intrusion into the basin has not occurred to date.
RECOMMENDATIONS
Continue data collection and analysis as prescribed by the GWMP.
Closely monitor water quality conditions at wells 19E1 and 19K5 and consider investigating the cause of the increasing TDS and chlorides at these wells if these trends continue.
Proceed with the installation of a sea water intrusion “sentinel well” along the coast, as planned by the District, as soon as possible. The sentinel well should include a clustered array of separate wells completed in distinct aquifer zones.
Include the sentinel wells in the GWMP for the prescribed collection of water level and water quality data once the wells are installed.
Compliment the sentry well project with a geophysical investigation to further evaluate whether or not seawater intrusion can be detected along the coast. An electrical resistivity tomography (ERT) survey along the beach in the western portion of the CGB where basin aquifers may outcrop offshore could provide useful in determining groundwater quality conditions at this important location.
Destroy well 30D1, as this well does not provide data that is representative of CGB conditions.
As a longer term goal, additional monitoring wells, completed in discrete aquifer zones at key locations within the basin, should be installed. These wells would provide valuable information regarding water level and water quality conditions throughout the basin.
Submit an Application and Notice of Intent for coverage under SWRCB General Waste Discharge Requirements for Aquifer Storage and Recovery Projects and consider conducting and ASR Pilot Project with the intent of implementing a long-term ASR project.
July 2017 Project No. 15-0094
15-0094 cvwd ab3030 gwmp annual report july 2017 (DRAFT)
- 13 -
CLOSURE
This annual report has been prepared for the exclusive use of the Carpinteria Valley Water District, for specific application to the AB 3030 Groundwater Management Plan for the Carpinteria Groundwater Basin, in Santa Barbara County, California. The findings, conclusions, and recommendations presented herein were prepared in accordance with generally accepted hydrogeologic practices. No other warranty, expressed or implied, is made.
FIGURES
@@@@@@@@@@@@@@@@@@@@!A
!A
!A
!A
!A
!A
!A
!A
!A
!A
!A
!A!A
!A
!A
!A
!A
!A
!A!A
!A!A
!A
!A!A
!A
!A!A
!A
!A
!A
!A
!A!A
!A
!A
!A
!A
!A
!A!A
!A
!A!A
!A!A
!A
!A
!A
!A
!A
!A
!A!A
987
1
15
11
16
11
23
13
27 26
21
36
19
1814
35
28
22
12
17
12
20
13
25
15
24
10
14
29
34
2423
30
33
2
32
3
35A3
20L4
19H1
19M3
22R4
28D3
27F2
29D7
19K5
28F7
29L1
30D1
24F1
21F1
21N621Q1
26C826B128G3
35B5
28H1
27E1
19M1
19E1
25F1
34B4
28J1
21L119R1
19J2,3,4
29H2
20K4
23A2
21R1
20K3
26C623P1
22R3
28M1
34A135B6
27F129D7
19F4
35E1
25L327Q6
29D1
34G1
26A1,2
Copyright:© 2013 National Geographic Society, i-cubed
FIGURE 1. WELL LOCATION MAPAB3030 Groundwater Management Program
Carpinteria Valley Water District
July 2017Project No. 15-0094
1 inch = 3,000 feet² 0 3,000 6,000Feet
Legend
!A Water Level MW
!A Water Quality MW
!A Water Level & Quality MW
!A Destroyed MW
Rincon Creek Fault
@@ Rincon Creek Fault (offshore projection)
CVWD Boundary
Groundwater Basin Boundary
T/R Sections
1982
1984
1986
1988
1990
1992
1994
1996
1998
2000
2002
2004
2006
2008
2010
2012
2014
2016
2018
Water Year
0
5
10
15
20
25
30
35
40
45
50
55
60
65
70
An
nu
al P
reci
pit
atio
n (
inch
es)
-70
-60
-50
-40
-30
-20
-10
0
10
20
30
40
50
60
70
Cu
mm
ulative D
epartu
re from
Mean
Rain
fall (inch
es)1985 through 2016 Water Year Average 18.29 inches
CVWD AB3030 GWMPProject No. 15-0094; July 2017
18.29 in
DRY WET
ALTERNATING DRY AND WET
DRY
1982
1984
1986
1988
1990
1992
1994
1996
1998
2000
2002
2004
2006
2008
2010
2012
2014
2016
2018
Water Year
0
500
1000
1500
2000
2500
3000
3500
4000
4500
5000
5500
6000
6500
7000
Gro
un
dw
ate
r P
rod
uc
tio
n (
ac
re-f
ee
t)
Average WY 1985 through WY 2016 = 3896 afy
CVWD AB3030 GWMPProject No. 15-0094; July 2017
Gro
un
dw
ater
Su
rfac
e E
leva
tio
n (
ft, m
sl)
Gro
un
dw
ater
Su
rfac
e E
leva
tio
n (
ft, m
sl)
-70
-60
-50
-40
-30
-20
-10
0
10
20
30
40
50
60
70
80
4N/25W - 19J5 (Lyman-Young)Well Depth: 100 ft* Ground Elevation: 55 ft, msl
Gro
un
dw
ate
r S
urf
ac
e E
leva
tio
n (
ft,
ms
l)
-70
-60
-50
-40
-30
-20
-10
0
10
20
30
40
50
60
70
80
4N/25W - 30D1 (Sandyland/Salt Marsh)Well Depth: 210 ft Ground Elevation: 7 ft, msl
-90
-80
-70
-60
-50
-40
-30
-20
-10
0
10
20
30
40
50
60
Gro
un
dw
ate
r S
urf
ac
e E
leva
tio
n (
ft,
ms
l)
4N/25W - 20K4 (CVWD High School Well)Well Depth: 903 ft Ground Elevation: 45 ft, msl
Gro
un
dw
ater
Su
rfac
e E
leva
tio
n (
ft, m
sl)
Gro
un
dw
ater
Su
rfac
e E
leva
tio
n (
ft, m
sl)
Gro
un
dw
ater
Su
rfac
e E
leva
tio
n (
ft, m
sl)
-70
-60
-50
-40
-30
-20
-10
0
10
20
30
40
50
60
70
80
4N/25W - 29D1 (Sturmer)Well Depth: 147 ft. Ground Elevation: 17 ft, msl
CVWD AB3030 GWMPProject No. 15-0094; July 2017
Gro
un
dw
ater
Pro
du
ctio
n(a
cre-
feet
)
Gro
un
dw
ater
Su
rfac
e E
leva
tio
n (
ft, m
sl)
-90
-80
-70
-60
-50
-40
-30
-20
-10
0
10
20
30
40
50
60
4N/25W - 28D2 (CVWD El Carro)Well Depth : 1100 ft Ground Elevation : 49 ft, msl
-150-140-130-120-110-100
-90-80-70-60-50-40-30-20-10
01020304050607080
Gro
un
dw
ate
r S
urf
ac
e E
leva
tio
n (
ft, m
sl)
4N/25W - 28F7 (CVWD Lyons)Well Depth: 1245 ft Ground Elevation: 63 ft, msl
-70
-60
-50
-40
-30
-20
-10
0
10
20
30
40
50
60
70
80
4N/25W - 28M1 (Baylor)Well Depth: 152 ft* Ground Elevation: 53 ft, msl
Gro
un
dw
ater
Su
rfac
e E
leva
tio
n (
ft, m
sl)
-60
-50
-40
-30
-20
-10
0
10
20
30
40
50
60
70
80
90
Gro
un
dw
ater
Su
rfac
e E
leva
tio
n (
ft, m
sl)
4N/25W - 27Q6 (McCloskey)Well Depth: 100 ft Ground Elevation: 130 ft, msl
150
160
170
180
190
200
210
220
230
240
250
260
270
280
290
300
4N/25W - 26C6 (Moses)Well Depth: 417 ft Ground Elevation: 300 ft, msl
Gro
un
dw
ate
r S
urf
ac
e E
leva
tio
n (
ft, m
sl)
-40
-30
-20
-10
0
10
20
30
40
50
60
70
80
90
100
110
120
Gro
un
dw
ater
Su
rfac
e E
leva
tio
n (
ft, m
sl)
4N/25W - 35E1 (Ota)Well Depth: 385 ft Ground Elevation: 245 ft, msl
Gro
un
dw
ater
Su
rfac
e E
leva
tio
n (
ft, m
sl)
CVWD AB3030 GWMPProject No. 15-0094; July 2017
Gro
un
dw
ater
Pro
du
ctio
n(a
cre-
feet
)
19F4
19J5
23P126A1
27F2
27R2
28F728J1
29D1
29L1
30D1
Fall 2014
19F4
19J5
21N4 23P126A1
27F2
27R2
28F728J1
29D1
29L1
30D1
23A2Spring 2015
19F4
21N4 23P126A1
27F2
27R2
28F728J1
29D1
29L1
30D1
Fall 2015
CVWD AB3030 GWMPProject No. 15-0094; July 2017
19F4
21N4 23P126A1
27F2
27R2
28F728J1
29D1
29L1
30D1
Fall 2015
19F4
21N4 22R323P1
26A128F728J1
29D1
29L1
30D1
Fall 2016
CVWD AB3030 GWMPProject No. 15-0094; July 2017
TD
S (
mg
/L)
Nitrate (N
O3 , m
g/L
)
Ch
lori
de
(mg
/L)
TD
S (
mg
/L)
Nitrate (N
O3 , m
g/L
)
Ch
lori
de
(mg
/L)
0
200
400
600
800
1000
1200
050100150200250300350400
0
50
100
150
0
500
1000
1500
2000
2500
TD
S (
mg
/L)
0
100
200
300
400
500
600
Nitra
te (N
O3 , m
g/L
)
0
100
200
300
400
500
Ch
lori
de
(m
g/L
)
0
500
1000
1500
2000
2500
0
100
200
300
400
500
600
0
100
200
300
400
500
TD
S (
mg
/L)
Nitrate (N
O3 , m
g/L
)
Ch
lori
de
(m
g/L
)
TD
S (
mg
/L)
Nitrate (N
O3 , m
g/L
)
Ch
lori
de
(mg
/L)
TD
S (
mg
/L)
Nitrate (N
O3 , m
g/L
)
Ch
lori
de
(mg
/L)
TD
S (
mg
/L)
Nitrate (N
O3 , m
g/L
)
Ch
lori
de
(mg
/L)
TD
S (
mg
/L)
Nitrate (N
O3 , m
g/L
)
Ch
lori
de
(mg
/L)
TD
S (
mg
/L)
Nitrate (N
O3 , m
g/L
)C
hlo
rid
e (m
g/L
)
CVWD AB3030 GWMPProject No. 15-0094; July 2017
TD
S (
mg
/L)
Nitrate (N
O3 , m
g/L
)
Ch
lori
de
(mg
/L)
TD
S (
mg
/L)
Nitrate (N
O3 , m
g/L
)
Ch
lori
de
(m
g/L
)
TD
S (
mg
/L)
Nitrate (N
O3 , m
g/L
)
Ch
lori
de
(mg
/L)
TD
S (
mg
/L)
Nitrate (N
O3 , m
g/L
)C
hlo
rid
e (m
g/L
)
0
200
400
600
800
1000
1200
TD
S (
mg
/L)
0
10
20
30
40
50
60
Nitrate (N
O3 , m
g/L
)
0
20
40
60
80
100
120
Ch
lori
de
(mg
/L)
TD
S (
mg
/L)
Nitrate (N
O3 , m
g/L
)
Ch
lori
de
(mg
/L)
TD
S (
mg
/L)
Nitrate (N
O3 , m
g/L
)
Ch
lori
de
(mg
/L)
TD
S (
mg
/L)
Nitrate (N
O3 , m
g/L
)C
hlo
rid
e (m
g/L
)
TD
S (
mg
/L)
Nitrate (N
O3 , m
g/L
)
Ch
lori
de
(mg
/L)
0
200
400
600
800
1000
1200
0
10
20
30
40
50
60
0
20
40
60
80
100
120
TD
S (
mg
/L)
Nitrate (N
O3 , m
g/L
)
Ch
lori
de
(mg
/L)
TD
S (
mg
/L)
Nitrate (N
O3 , m
g/L
)
Ch
lori
de
(mg
/L)
CVWD AB3030 GWMPProject No. 15-0094; July 2017
20002001
20022003
20042005
20062007
20082009
20102011
20122013
20142015
20162017
0
200
400
600
800
1000
Ch
lori
de
(mg
/L)
0
5
10
15
20
25
30
Nitrate as N
O3
(mg
/L)
200
400
600
800
1000
1200
1400
1600
1800
2000
2200T
ota
l Dis
solv
ed S
olid
s (m
g/L
) Toro Creek
Arroyo Paredon Creek
Santa Monica Creek
Carpinteria Creek
Gobernador Creek
Rincon Creek
CVWD AB3030 GWMPProject No. 15-0094; July 2017
APPENDIX A HYDROLOGIC DATA
Santa Barbara County - Flood Control District130 East Victoria Street, Santa Barbara, CA 93101
805.568.3440 - www.countyofsb.org/pwd
Official Monthly and Yearly Rainfall Record
(Monthly Depth Durations and Average Recurrence Intervals)
208Station:
SepSepSepSep OctOctOctOct NovNovNovNov DecDecDecDec JanJanJanJan FebFebFebFeb MarMarMarMar AprAprAprApr MayMayMayMay JunJunJunJun JulJulJulJul AugAugAugAug WYWYWYWY
Station Name: Carpinteria Fire Station
Station Type: Alert, Data Logger w/TB Latitude: 342353 Longitude: 1193106
Elevation (ft): 32
WYWYWYWY
Rainfall (in.)
0.00 0.00 0.00 2.63 1.43 1.12 1.89 0.18 1.29 0.09 0.00 0.00 8.631948-1949
0.00 0.00 2.42 3.12 2.24 2.73 1.18 0.38 0.00 0.13 0.09 0.00 12.291949-1950
0.63 0.61 1.30 0.29 1.89 1.27 0.56 1.46 0.00 0.00 0.00 0.09 8.101950-1951
0.00 0.80 1.82 4.87 10.75 0.04 6.40 2.02 0.00 0.00 0.00 0.00 26.701951-1952
0.00 0.00 3.56 4.63 1.51 0.00 1.13 1.53 0.00 0.00 0.00 0.00 12.361952-1953
0.00 0.00 2.32 0.13 5.57 2.39 3.88 0.34 0.00 0.00 0.00 0.00 14.631953-1954
0.00 0.00 1.56 1.56 4.41 2.00 0.31 2.71 0.54 0.00 0.00 0.00 13.091954-1955
0.00 0.00 1.47 5.27 6.94 0.73 0.00 2.52 1.00 0.00 0.00 0.00 17.931955-1956
0.00 0.07 0.00 0.27 4.10 3.08 0.44 1.57 0.92 0.00 0.00 0.00 10.451956-1957
0.00 1.52 0.71 4.45 2.75 7.80 5.79 5.05 0.28 0.00 0.00 0.00 28.351957-1958
1.06 0.00 0.00 0.07 1.96 4.15 0.00 1.18 0.00 0.00 0.00 0.00 8.421958-1959
0.00 0.00 0.00 0.81 3.21 3.32 1.12 1.94 0.00 0.00 0.00 0.00 10.401959-1960
0.00 0.05 6.35 0.00 1.16 0.04 0.62 0.00 0.00 0.00 0.00 0.00 8.221960-1961
0.18 0.00 2.61 1.00 2.33 16.99 1.27 0.00 0.00 0.00 0.00 0.00 24.381961-1962
0.00 0.49 0.00 0.00 0.89 5.93 3.68 2.57 0.27 1.02 0.00 0.00 14.851962-1963
1.87 1.02 3.29 0.00 1.51 0.00 1.78 2.29 0.09 0.00 0.00 0.00 11.851963-1964
0.00 0.78 2.14 4.57 1.02 0.59 2.18 7.44 0.14 0.06 0.00 0.00 18.921964-1965
0.19 0.00 9.81 3.72 1.76 1.02 0.10 0.00 0.21 0.00 0.00 0.00 16.811965-1966
0.00 0.00 3.30 6.69 6.00 0.43 2.74 4.27 0.00 0.00 0.00 0.00 23.431966-1967
0.36 0.00 4.80 1.07 1.79 1.51 3.92 0.93 0.00 0.00 0.00 0.13 14.511967-1968
0.00 1.21 0.67 2.02 16.30 9.45 0.49 1.81 0.16 0.08 0.00 0.00 32.191968-1969
0.00 0.00 2.27 0.22 3.02 2.29 5.79 0.00 0.00 0.00 0.00 0.00 13.591969-1970
0.00 0.05 4.72 5.09 1.17 2.10 0.86 0.56 2.09 0.00 0.00 0.00 16.641970-1971
0.00 0.13 0.55 6.95 0.63 0.00 0.00 0.16 0.00 0.10 0.00 0.00 8.521971-1972
0.00 0.22 4.65 0.88 6.17 10.47 3.04 0.05 0.20 0.04 0.00 0.12 25.841972-1973
0.00 0.57 2.79 1.19 8.70 0.14 4.22 0.25 0.00 0.00 0.00 0.00 17.861973-1974
0.00 0.89 0.13 7.72 0.00 4.11 4.18 1.15 0.00 0.00 0.00 0.00 18.181974-1975
0.15 0.18 0.09 0.28 0.00 6.59 2.31 0.90 0.03 0.23 0.00 0.00 10.761975-1976
5.65 0.00 0.46 0.73 3.87 0.23 1.70 0.00 3.92 0.11 0.00 0.61 17.281976-1977
0.00 0.00 0.27 6.58 8.83 9.63 11.39 2.44 0.00 0.09 0.00 0.08 39.311977-1978
1.39 0.09 1.80 2.15 3.23 5.06 7.61 0.00 0.08 0.00 0.00 0.16 21.571978-1979
0.71 0.65 0.65 1.23 6.78 11.71 3.68 0.76 0.19 0.00 0.04 0.00 26.401979-1980
0.03 0.00 0.00 1.08 2.84 1.99 5.69 0.81 0.00 0.00 0.00 0.00 12.441980-1981
0.50 0.00 1.85 0.89 3.10 0.55 5.54 2.70 0.15 0.11 0.00 0.00 15.391981-1982
1.32 0.58 5.54 3.11 8.89 6.28 7.52 3.73 0.31 0.18 0.00 1.65 39.111982-1983
0.97 3.93 3.51 3.29 0.04 0.00 0.35 0.24 0.25 0.00 0.00 0.58 13.161983-1984
0.55 0.45 2.54 5.05 1.49 1.86 1.50 0.12 0.00 0.00 0.00 0.00 13.561984-1985
0.07 0.65 4.47 0.88 2.07 7.66 5.52 1.60 0.00 0.00 0.00 0.00 22.921985-1986
1.43 0.00 1.25 0.36 2.08 2.25 3.16 0.13 0.00 0.00 0.00 0.00 10.661986-1987
0.00 1.36 1.71 3.50 2.58 2.42 0.54 3.35 0.00 0.00 0.00 0.00 15.461987-1988
0.09 0.00 1.05 2.93 0.44 3.19 0.54 0.71 0.22 0.00 0.00 0.00 9.171988-1989
0.07 0.96 0.42 0.00 2.79 2.71 0.15 0.09 0.78 0.00 0.00 0.00 7.971989-1990
0.06 0.00 0.29 0.05 1.60 2.27 13.30 0.04 0.00 0.27 0.02 0.04 17.941990-1991
0.00 0.55 0.19 5.02 2.76 9.33 3.99 0.00 0.31 0.09 0.42 0.00 22.661991-1992
0.00 1.74 0.00 5.50 12.35 7.39 5.42 0.00 0.09 0.77 0.07 0.00 33.331992-1993
0.00 0.09 1.38 1.47 0.98 5.79 2.07 0.65 0.37 0.00 0.00 0.00 12.801993-1994
0.42 0.40 1.59 1.14 19.08 1.72 10.87 0.35 0.88 0.61 0.00 0.00 37.061994-1995
0.00 0.00 0.21 3.11 2.03 8.48 2.05 1.14 0.37 0.00 0.00 0.00 17.391995-1996
0.00 2.70 0.00 6.25 6.97 0.09 0.00 0.00 0.00 0.09 0.00 0.00 16.101996-1997
0.00 0.08 2.86 7.69 4.42 20.97 3.71 2.13 3.83 0.14 0.00 0.00 45.831997-1998
0.12 0.00 0.75 0.95 2.26 0.86 3.16 1.87 0.00 0.02 0.00 0.00 9.991998-1999
0.02 0.00 0.72 0.00 1.43 8.66 2.74 3.90 0.00 0.00 0.00 0.00 17.471999-2000
0.00 2.18 0.00 0.08 6.30 5.24 4.73 1.67 0.18 0.02 0.03 0.00 20.432000-2001
0.04 0.49 3.75 1.78 0.59 0.31 0.37 0.11 0.14 0.01 0.05 0.02 7.662001-2002
0.20 0.01 5.88 4.59 0.09 2.91 4.46 1.90 1.72 0.19 0.02 0.00 21.972002-2003
0.04 0.09 1.31 1.89 0.42 5.18 0.57 0.01 0.02 0.01 0.03 0.00 9.572003-2004
0.00 4.46 0.10 8.62 11.20 7.41 3.96 0.74 1.01 0.02 0.00 0.04 37.562004-2005
0.20 1.08 0.82 0.72 2.82 2.88 3.26 5.88 0.90 0.00 0.00 0.02 18.582005-2006
0.01 0.09 0.26 0.72 3.24 1.86 0.18 0.70 0.00 0.02 0.01 0.02 7.112006-2007
0.28 0.28 0.02 3.06 12.00 1.75 0.00 0.08 0.04 0.00 0.00 0.00 17.512007-2008
Page 1 of 2
Santa Barbara County - Flood Control District130 East Victoria Street, Santa Barbara, CA 93101
805.568.3440 - www.countyofsb.org/pwd
Official Monthly and Yearly Rainfall Record
(Monthly Depth Durations and Average Recurrence Intervals)
208Station:
SepSepSepSep OctOctOctOct NovNovNovNov DecDecDecDec JanJanJanJan FebFebFebFeb MarMarMarMar AprAprAprApr MayMayMayMay JunJunJunJun JulJulJulJul AugAugAugAug WYWYWYWY
Station Name: Carpinteria Fire Station
Station Type: Alert, Data Logger w/TB Latitude: 342353 Longitude: 1193106
Elevation (ft): 32
WYWYWYWY
Rainfall (in.)
0.03 0.06 2.71 2.55 0.63 6.18 0.78 0.15 0.03 0.07 0.00 0.00 13.192008-2009
0.06 3.61 0.01 2.86 6.14 3.86 0.56 2.45 0.15 0.03 0.02 0.00 19.752009-2010
0.01 2.45 1.00 9.66 0.59 4.06 6.20 0.05 0.48 0.36 0.00 0.03 24.892010-2011
0.09 1.06 1.35 0.32 1.59 0.06 2.32 2.93 0.06 0.02 0.02 0.01 9.832011-2012
0.06 0.04 2.27 3.05 1.32 0.18 0.75 0.26 0.29 0.09 0.02 0.00 8.332012-2013
0.01 0.02 0.62 0.30 0.00 2.54 1.68 0.48 0.09 0.04 0.00 0.05 5.832013-2014
0.00 0.00 0.78 3.62 1.69 0.47 0.45 0.24 0.16 0.75 0.32 0.00 8.482014-2015
0.16 0.48 0.10 0.30 4.60 1.14 3.02 0.26 0.02 0.03 0.00 0.00 10.112015-2016
5.65 4.46 19.08 20.979.669.81 1.027.4413.30 0.423.92Max
N 68 68 68 686868 686868 6868
0.77 0.96 3.88 4.042.441.89 0.191.532.82 0.060.74StdDev
2.68 1.28 0.90 0.990.841.03 2.911.110.87 3.811.83Reg CV
0.28 0.58 3.75 3.792.601.73 0.091.292.87 0.020.36Mean
3.80 1.80 1.60 1.101.001.40 3.601.701.10 4.402.60Reg Skew
Average Recurrence Intervals (in Years)
2
5
0.00
10
25
50
100
200
500
1000
10000
1.65
68
4.10
0.05
4.80
Total 19.03 39.22 255.34 257.42176.58117.82 5.8987.93195.37 1.1624.26 3.65
2.74 1.66 1.03 1.070.941.09 2.221.180.98 3.762.07CV 4.11
0.44
1.10
1.00 1.00 1.00 1.001.001.00 1.001.001.00 1.001.00FIC 1.00 1.00
0.47
1.97
2.72
1.06
3.51
4.34
5.99
6.31
9.26
0.37
1.05
1.55
2.19
2.68
3.16
3.64
4.45
4.74
6.31
1.32
3.00
4.12
5.53
6.55
7.57
8.57
10.14
10.83
13.99
2.25
4.25
5.52
7.05
8.14
9.18
10.21
11.69
12.48
15.60
2.91
6.05
8.25
11.05
13.15
15.21
17.24
20.58
21.90
28.49
3.11
6.60
8.81
11.51
13.49
15.37
17.20
19.90
21.29
26.98
2.42
4.75
6.22
8.02
9.35
10.60
11.82
13.62
14.55
18.35
0.91
2.24
3.19
4.42
5.33
6.23
7.13
8.63
9.20
12.12
0.12
0.67
1.15
1.84
2.37
2.92
3.48
4.44
4.79
6.71
0.00
0.16
0.36
0.66
0.90
1.16
1.42
1.95
2.06
3.00
0.00
0.03
0.08
0.16
0.23
0.31
0.39
0.55
0.58
0.87
0.00
0.07
0.24
0.53
0.78
1.05
1.34
1.95
2.04
3.10
16.03
23.15
27.67
33.18
37.24
41.07
44.83
50.34
53.17
64.82
45.83
68
8.88
17.41
1183.67
0.51
0.22
Page 2 of 2
APPENDIX B HYDROLOGIC BUDGET UPDATE TECHNICAL MEMORANDUM
15-0094_CGB_Hydrologic_Budget_Update_TM_2017-03-31.doc
TECHNICAL MEMORANDUM Pueblo Water Resources, Inc. 4478 Market St., Suite 705 Tel: 805.644.0470 Ventura, CA 93003 Fax: 805.644.0480
To: Carpinteria Valley Water District Date: March 31, 2017
Attention: Bob McDonald, P.E. General Manager
Project No: 15-0094
Copy to: Mike Burke, P.G, C.Hg.
From: Robert Marks, P.G., C.Hg
Subject: Carpinteria Groundwater Basin Hydrologic Budget Update, Water Years 2015 – 2016
Introduction
Presented in this Technical Memorandum (TM) is documentation of our findings developed from an update of the hydrologic budget for the Carpinteria Groundwater Basin (CGB) for Water Years 2015 - 2016. A hydrologic budget for a groundwater basin is an inventory of the various sources of recharge and outflow in the basin, and is expressed by the following equation:
Change in Storage = Inflow - Outflow
where Inflow equals:
• Subsurface Inflow
• Streambed Percolation
• Percolation of Precipitation, and
• Percolation of Irrigation Return Water (pumped and imported);
and Outflow equals:
• Subsurface Outflow
• Gross Groundwater Pumpage, and
• Extraction by Phreatophytes.
The hydrologic budget for the CGB was updated by Pueblo Water Resources, Inc. (PWR) in 2012 for the period of Water Years (WY) 1985 through 2008 as part of the development of a numerical groundwater flow model of the CGB1. PWR performed a
1 Carpinteria Groundwater Basin, Hydrogeologic Update and Groundwater Model Project Final Report, prepared by Pueblo Water Resources, Inc. for Carpinteria Valley Water District, dated June 30, 2012.
Technical Memorandum to Carpinteria Valley Water District March 31, 2017 (Project No. 15-0094) Page 2 of 7
15-0094_CGB_Hydrologic_Budget_Update_TM_2017-03-31.doc
subsequent updates in 2014 and 2015 covering the periods of WY 2009 through 2014 as part of the District’s 2013 and 2014 Annual Reports pursuant to its AB3030 Groundwater Management Plan. The subject update for WY 2015 - 2016 represents a continuation of the District’s ongoing effort to maintain an updated hydrologic budget for the CGB.
FINDINGS
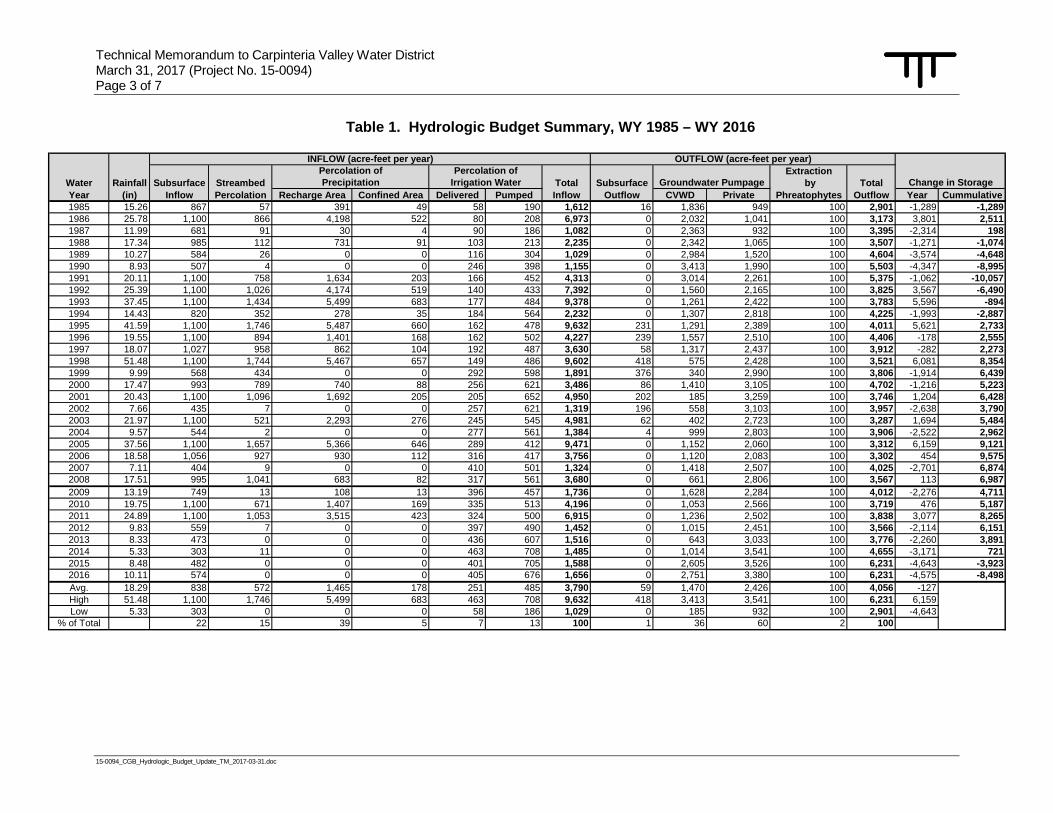
The hydrologic budget inventory for the CGB for WY 2015 - 2016 was updated utilizing the same methods that were developed for the 2012 hydrogeologic update and groundwater model project. Detailed descriptions of the methodologies used for each component of the hydrologic budget are presented in PWR’s 2012 report and will not be repeated here. A summary of the updated hydrologic budget for the WY 1985 – 2016 period (32 years) is presented in Table 1. The values shown in Table 1 are also presented graphically on Figure 1. Summary descriptions for each component of the hydrologic budget are presented below.
Rainfall
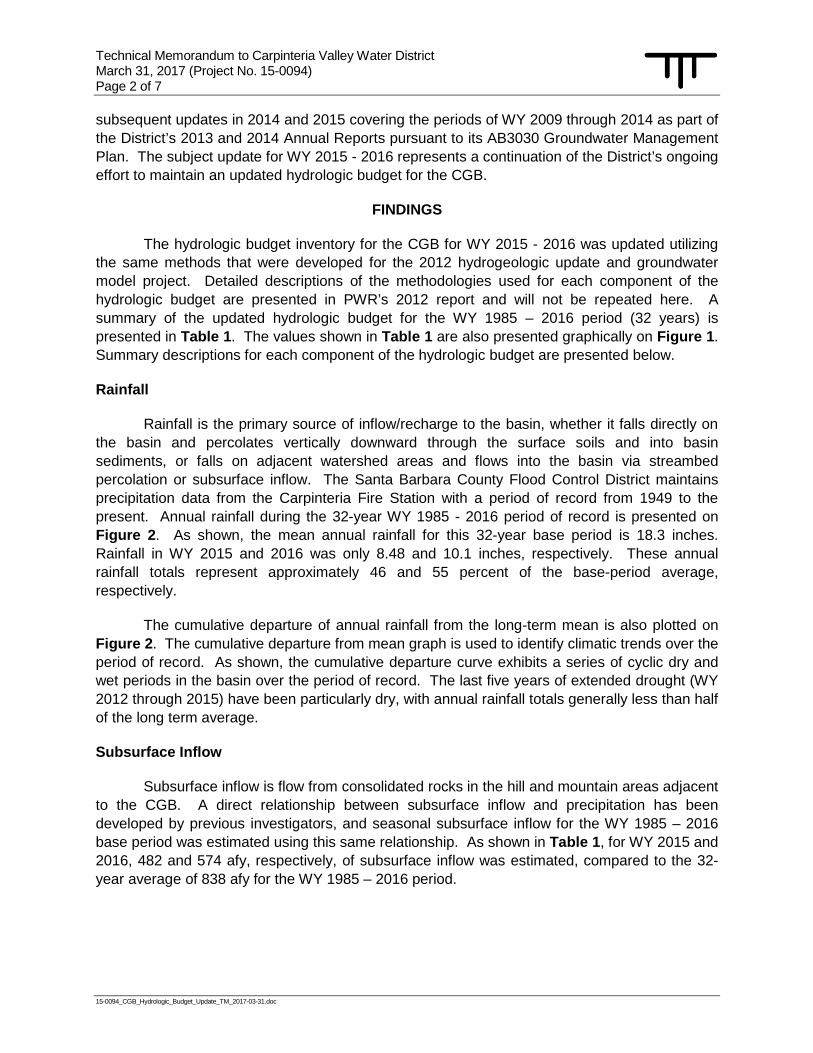
Rainfall is the primary source of inflow/recharge to the basin, whether it falls directly on the basin and percolates vertically downward through the surface soils and into basin sediments, or falls on adjacent watershed areas and flows into the basin via streambed percolation or subsurface inflow. The Santa Barbara County Flood Control District maintains precipitation data from the Carpinteria Fire Station with a period of record from 1949 to the present. Annual rainfall during the 32-year WY 1985 - 2016 period of record is presented on Figure 2. As shown, the mean annual rainfall for this 32-year base period is 18.3 inches. Rainfall in WY 2015 and 2016 was only 8.48 and 10.1 inches, respectively. These annual rainfall totals represent approximately 46 and 55 percent of the base-period average, respectively.
The cumulative departure of annual rainfall from the long-term mean is also plotted on Figure 2. The cumulative departure from mean graph is used to identify climatic trends over the period of record. As shown, the cumulative departure curve exhibits a series of cyclic dry and wet periods in the basin over the period of record. The last five years of extended drought (WY 2012 through 2015) have been particularly dry, with annual rainfall totals generally less than half of the long term average.
Subsurface Inflow
Subsurface inflow is flow from consolidated rocks in the hill and mountain areas adjacent to the CGB. A direct relationship between subsurface inflow and precipitation has been developed by previous investigators, and seasonal subsurface inflow for the WY 1985 – 2016 base period was estimated using this same relationship. As shown in Table 1, for WY 2015 and 2016, 482 and 574 afy, respectively, of subsurface inflow was estimated, compared to the 32-year average of 838 afy for the WY 1985 – 2016 period.
Technical Memorandum to Carpinteria Valley Water District March 31, 2017 (Project No. 15-0094) Page 3 of 7
15-0094_CGB_Hydrologic_Budget_Update_TM_2017-03-31.doc
Table 1. Hydrologic Budget Summary, WY 1985 – WY 2016
ExtractionWater Rainfall Subsurface Streambed Total Subsurface by TotalYear (in) Inflow Percolation Recharge Area Confined Area Delivered Pumped Inflow Outflow CVWD Private Phreatophytes Outflow Year Cummulative1985 15.26 867 57 391 49 58 190 1,612 16 1,836 949 100 2,901 -1,289 -1,2891986 25.78 1,100 866 4,198 522 80 208 6,973 0 2,032 1,041 100 3,173 3,801 2,5111987 11.99 681 91 30 4 90 186 1,082 0 2,363 932 100 3,395 -2,314 1981988 17.34 985 112 731 91 103 213 2,235 0 2,342 1,065 100 3,507 -1,271 -1,0741989 10.27 584 26 0 0 116 304 1,029 0 2,984 1,520 100 4,604 -3,574 -4,6481990 8.93 507 4 0 0 246 398 1,155 0 3,413 1,990 100 5,503 -4,347 -8,9951991 20.11 1,100 758 1,634 203 166 452 4,313 0 3,014 2,261 100 5,375 -1,062 -10,0571992 25.39 1,100 1,026 4,174 519 140 433 7,392 0 1,560 2,165 100 3,825 3,567 -6,4901993 37.45 1,100 1,434 5,499 683 177 484 9,378 0 1,261 2,422 100 3,783 5,596 -8941994 14.43 820 352 278 35 184 564 2,232 0 1,307 2,818 100 4,225 -1,993 -2,8871995 41.59 1,100 1,746 5,487 660 162 478 9,632 231 1,291 2,389 100 4,011 5,621 2,7331996 19.55 1,100 894 1,401 168 162 502 4,227 239 1,557 2,510 100 4,406 -178 2,5551997 18.07 1,027 958 862 104 192 487 3,630 58 1,317 2,437 100 3,912 -282 2,2731998 51.48 1,100 1,744 5,467 657 149 486 9,602 418 575 2,428 100 3,521 6,081 8,3541999 9.99 568 434 0 0 292 598 1,891 376 340 2,990 100 3,806 -1,914 6,4392000 17.47 993 789 740 88 256 621 3,486 86 1,410 3,105 100 4,702 -1,216 5,2232001 20.43 1,100 1,096 1,692 205 205 652 4,950 202 185 3,259 100 3,746 1,204 6,4282002 7.66 435 7 0 0 257 621 1,319 196 558 3,103 100 3,957 -2,638 3,7902003 21.97 1,100 521 2,293 276 245 545 4,981 62 402 2,723 100 3,287 1,694 5,4842004 9.57 544 2 0 0 277 561 1,384 4 999 2,803 100 3,906 -2,522 2,9622005 37.56 1,100 1,657 5,366 646 289 412 9,471 0 1,152 2,060 100 3,312 6,159 9,1212006 18.58 1,056 927 930 112 316 417 3,756 0 1,120 2,083 100 3,302 454 9,5752007 7.11 404 9 0 0 410 501 1,324 0 1,418 2,507 100 4,025 -2,701 6,8742008 17.51 995 1,041 683 82 317 561 3,680 0 661 2,806 100 3,567 113 6,9872009 13.19 749 13 108 13 396 457 1,736 0 1,628 2,284 100 4,012 -2,276 4,7112010 19.75 1,100 671 1,407 169 335 513 4,196 0 1,053 2,566 100 3,719 476 5,1872011 24.89 1,100 1,053 3,515 423 324 500 6,915 0 1,236 2,502 100 3,838 3,077 8,2652012 9.83 559 7 0 0 397 490 1,452 0 1,015 2,451 100 3,566 -2,114 6,1512013 8.33 473 0 0 0 436 607 1,516 0 643 3,033 100 3,776 -2,260 3,8912014 5.33 303 11 0 0 463 708 1,485 0 1,014 3,541 100 4,655 -3,171 7212015 8.48 482 0 0 0 401 705 1,588 0 2,605 3,526 100 6,231 -4,643 -3,9232016 10.11 574 0 0 0 405 676 1,656 0 2,751 3,380 100 6,231 -4,575 -8,498Avg. 18.29 838 572 1,465 178 251 485 3,790 59 1,470 2,426 100 4,056 -127 High 51.48 1,100 1,746 5,499 683 463 708 9,632 418 3,413 3,541 100 6,231 6,159 Low 5.33 303 0 0 0 58 186 1,029 0 185 932 100 2,901 -4,643
% of Total 22 15 39 5 7 13 100 1 36 60 2 100
INFLOW (acre-feet per year) OUTFLOW (acre-feet per year)Percolation of
Irrigation Water Groundwater Pumpage Change in StoragePercolation ofPrecipitation
Technical Memorandum to Carpinteria Valley Water District March 31, 2017 (Project No. 15-0094) Page 4 of 7
15-0094_CGB_Hydrologic_Budget_Update_TM_2017-03-31.doc
Streambed Percolation
There are five principal streams in the CGB; Carpinteria, Gobernador, Santa Monica, Arroyo Parida, and Rincon Creeks. Streambed percolation is assumed to occur only where the stream reaches cross the Recharge Area. Once streamflow reaches the Confined Area, the amount of deep percolation to the main groundwater system is assumed to be insignificant. Previous studies developed runoff vs. streambed percolation relationships for each individual stream. As shown in Table 1 above, zero streambed percolation for both WY 2015 and 2016 was estimated.
Percolation of Precipitation
Percolation of precipitation is the most important source of recharge to the basin, accounting for approximately 45 percent of the total inflow. Precipitation recharges the basin principally through deep percolation to the zone of saturation in the Recharge Area. In addition, one of the important findings from calibrating the numerical groundwater flow model of the CGB in 2012 was that approximately 25 percent of precipitation percolation in the Confined Area does reach the deep aquifers.
The total volume of deep percolation for each year of the base period is shown in Table 1. As shown, significant deep percolation only occurs in the wetter years. In years when the average annual rainfall is less than approximately 12 inches, no deep percolation is estimated to occur. It is notable that no deep percolation of precipitation is estimated to have occurred in the CGB during the 5-year drought period of WY 2012 - 2016.
Percolation of Irrigation Water
Percolation of irrigation return water in the CGB is dependent on a variety of factors, including climatic conditions, crop type, and irrigation practices. Studies by the U.S. Soil Conversation Service for Santa Barbara County indicate irrigation efficiencies range from 65 to 70 percent. For purposes of estimating deep percolation of irrigation return water in the CGB, a conservative estimate is that 20 percent of applied water (both pumped and delivered, which includes imported water) percolates into the basin. As shown in Table 1, the annual recharge to the basin during WY 2015 and 2016 from percolation of irrigation water is estimated to be approximately 1,106 and 1,081 afy, respectively, which is approximately 50 percent greater than the 32-year average of 736 afy. The greater than average amount of irrigation return water reflects the increased amount of applied water required to support crops during WY 2015 and 2016 due to the relative lack of precipitation.
Subsurface Outflow
The quantity of subsurface outflow from the CGB is estimated using Darcy’s Law, in which the rate of discharge through a given cross section of saturated material is proportional to the hydraulic gradient. The hydraulic gradient is driven by water-levels in the basin, and outflow occurs only when there is a seaward gradient (i.e., when water levels are generally above sea level). The results of the subsurface outflow calculations are shown in Table 1. As shown, zero
Technical Memorandum to Carpinteria Valley Water District March 31, 2017 (Project No. 15-0094) Page 5 of 7
15-0094_CGB_Hydrologic_Budget_Update_TM_2017-03-31.doc
subsurface outflow was estimated during WY 2015 and 2016 because the seaward gradient between the coast and inland portions of the basin was reversed (i.e., water levels were lower inland than at the coast). It is noted that the existing reversal of the naturally occurring seaward gradient creates conditions for the potential for seawater intrusion into the basin to occur (i.e., rather than subsurface outflow from the basin to offshore areas, subsurface inflow into the basin from offshore areas is likely occurring).
Groundwater Pumpage
Groundwater extractions from the CGB occur from both District and private production wells. District well production is metered, and monthly totals of production from the District wells were compiled for WY 2015 and 2016. Private pumping in the basin is not metered and has been estimated on an annual basis by the District since 1984 utilizing land use survey and water delivery information. As shown in Table 1, aggregate pumpage is estimated at approximately 6,131 afy during both WY 2015 and 2016. This amount of pumpage is approximately 60 percent greater than the 32-year long-term average of approximately 3,896 afy estimated for the WY 1985 – WY 2016 period.
Extraction by Phreatophytes
Phreatophytes are water loving plants (roots extend into the water table) that live in the vicinity of stream channels and in areas of high groundwater. Groundwater consumed by phreatophytes is dependent on many factors, including plant species, vegetative density, climate, soil types and conditions, and depth to groundwater. Direct measurements of consumptive use by phreatophytes in the CGB do not currently exist. By applying the results of study in San Diego County (Blaney and Criddle, 1963), extractions by phreatophytes have been roughly estimated to be approximately 100 afy. As shown in Table 1, phreatophytes consumption is estimated to be a relatively insignificant portion (2 percent) of the overall outflow from the basin.
Changes in Storage
The change in the amount of groundwater in storage depends on the annual water supply surplus or deficiency, as expressed in the water balance equation. As shown in Table 1, the total inflow during WY 2015 and 2016 was estimated at 1,588 and 1,656 afy respectively. The total amount of outflow was estimated at 6,231 afy in both WY 2015 and 2016, resulting in net annual storage depletion amount of approximately 4,643 and 4,575 afy, respectively.
Figure 3 presents a comparison of the cumulative departure/change curves for both rainfall and basin storage for the WY 1985 – 2016 base period. As shown, the cumulative change in storage curve understandably trends similarly to the cumulative departure of annual rainfall curve. For example, the plots show the period of the WY 1987 through 1990 drought and the corresponding depletion of storage, followed by the cumulatively wet period of WY 1991 through WY 1998 and the corresponding accumulation of basin storage. The relative lack of rainfall during the recent 5-year drought period of WY 2012 - 2016 corresponds to lower amounts of rainfall and recharge in the basin and a resulting cumulative depletion of storage.
Technical Memorandum to Carpinteria Valley Water District March 31, 2017 (Project No. 15-0094) Page 6 of 7
15-0094_CGB_Hydrologic_Budget_Update_TM_2017-03-31.doc
As shown in Table 1 and on Figures 1 and 3, as of WY 2016 the amount of cumulative storage depletion in the CGB is estimated at approximately 8,500 af relative to basin conditions at the start of WY 1985. The current storage conditions are similar to, but not quite as depleted as, those at the end of the WY 1987 through 1990 drought period, when it was depleted by as much as 11,500 af relative to the conditions at the start of WY 1985.
CONCLUSIONS AND RECOMMENDATIONS
Based on the findings developed from the subject update to the CGB hydrologic budget for WY 2015 - 2016, we offer the following conclusions and recommendations:
• Total rainfall during WY 2015 and 2016 was approximately 8.48 and 10.1 inches, respectively, which are approximately 50 percent less than the long-term average of 18.3 inches.
• The limited amounts of rainfall and stream runoff during the period resulted in no percolation recharge to the CGB. Total recharge during WY 2015 and 2016 is estimated to be approximately 1,588 and 1,656 afy, respectively, which are approximately 60 percent less than the long-term average of approximately 3,790 afy.
• Extractions from the basin during WY 2015 and 2016 are estimated at approximately 6,231 afy, which is approximately 50 percent greater than the long-term average of approximately 4,056 afy.
• Due to the relatively limited amounts of natural recharge, combined with increased levels of extractions, approximately 4,600 afy of storage depletion is estimated to have occurred in both WY 2015 and 2016. During the 5-year drought period from WY 2012 - 2016, total cumulative storage depletion of approximately 16,800 af is estimated to have occurred in the basin, corresponding to an average storage loss rate of approximately 3,360 afy. This compares to the estimated 4-year cumulative storage depletion during the WY 1987 – 1990 drought of approximately 11,500 af (approximately 2,900 afy on average).
• There was no subsurface outflow estimated during the period (indeed, no subsurface outflow from the basin has been estimated to have occurred during the last 12 years) due to depressed water levels in the basin. Water levels are currently as much as 40 feet below sea level in the western portion of basin, an area where the Rincon Creek Fault barrier is located offshore. These conditions present a potential risk for seawater intrusion to occur in the CGB.
• Given the current basin conditions, the seawater intrusion “sentinel well” planned by CVWD should be installed as soon as possible.
Technical Memorandum to Carpinteria Valley Water District March 31, 2017 (Project No. 15-0094) Page 7 of 7
15-0094_CGB_Hydrologic_Budget_Update_TM_2017-03-31.doc
CLOSURE
This Technical Memorandum has been prepared exclusively for Carpinteria Valley Water District for the specific application to the Carpinteria Groundwater Basin Hydrologic Budget Update Project. The findings, conclusions, and recommendations presented herein were prepared in accordance with generally accepted hydrogeologic practices. No other warranty, express or implied, is made.
-- o --
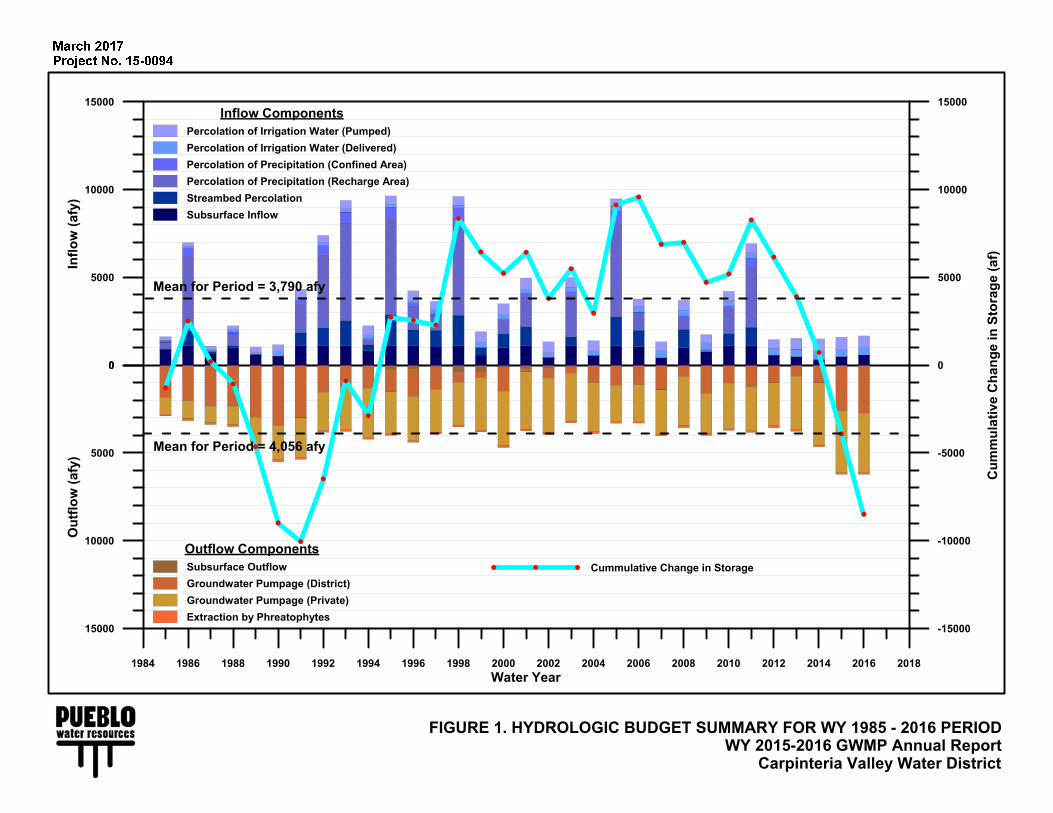
FIGURE 1. HYDROLOGIC BUDGET SUMMARY FOR WY 1985 - 2016 PERIODWY 2015-2016 GWMP Annual Report
Carpinteria Valley Water District
0
5000
10000
15000
Inflo
w (a
fy)
-15000
-10000
-5000
0
5000
10000
15000
Cum
mul
ativ
e C
hang
e in
Sto
rage
(af)
15000
10000
5000
0
Out
flow
(afy
)
1984 1986 1988 1990 1992 1994 1996 1998 2000 2002 2004 2006 2008 2010 2012 2014 2016 2018Water Year
Cummulative Change in Storage
Inflow ComponentsPercolation of Irrigation Water (Pumped)Percolation of Irrigation Water (Delivered)Percolation of Precipitation (Confined Area)Percolation of Precipitation (Recharge Area)Streambed PercolationSubsurface Inflow
Outflow ComponentsSubsurface OutflowGroundwater Pumpage (District)Groundwater Pumpage (Private)Extraction by Phreatophytes
Mean for Period = 3,790 afy
Mean for Period = 4,056 afy
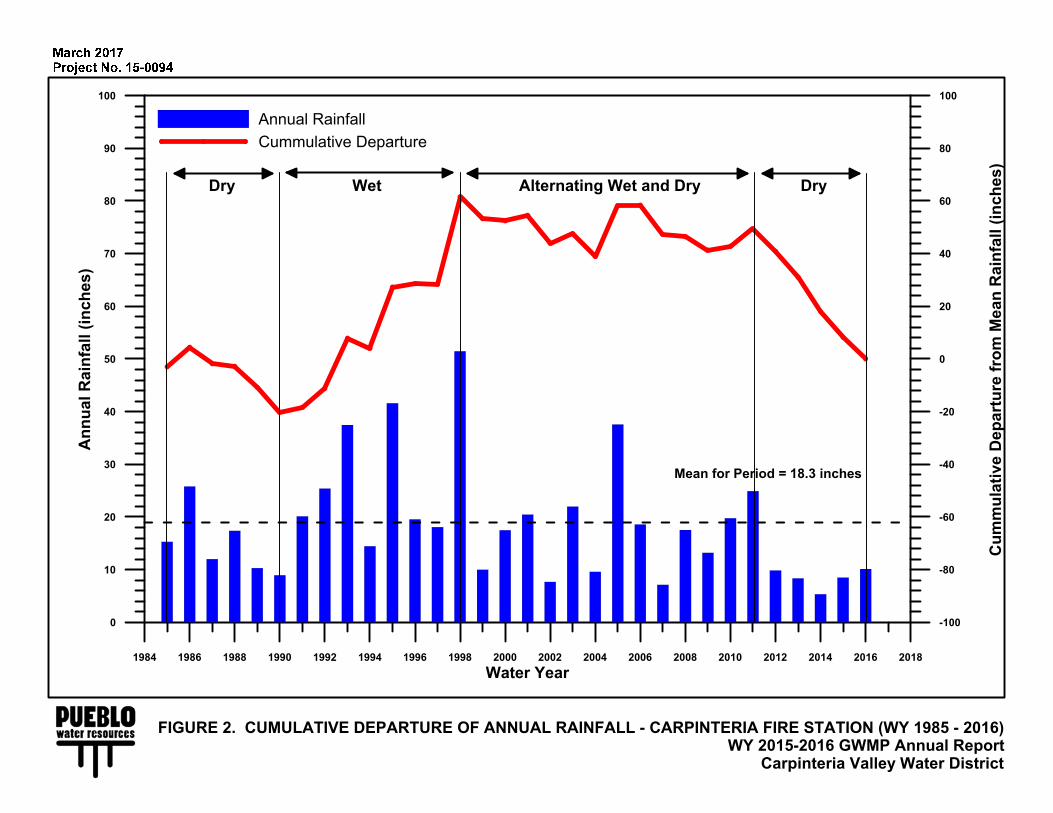
FIGURE 2. CUMULATIVE DEPARTURE OF ANNUAL RAINFALL - CARPINTERIA FIRE STATION (WY 1985 - 2016)WY 2015-2016 GWMP Annual Report
Carpinteria Valley Water District
1984 1986 1988 1990 1992 1994 1996 1998 2000 2002 2004 2006 2008 2010 2012 2014 2016 2018Water Year
0
10
20
30
40
50
60
70
80
90
100A
nnua
l Rai
nfal
l (in
ches
)
-100
-80
-60
-40
-20
0
20
40
60
80
100
Cum
mul
ativ
e D
epar
ture
from
Mea
n R
ainf
all (
inch
es)
Annual RainfallCummulative Departure
Mean for Period = 18.3 inches
Dry Wet Alternating Wet and Dry Dry
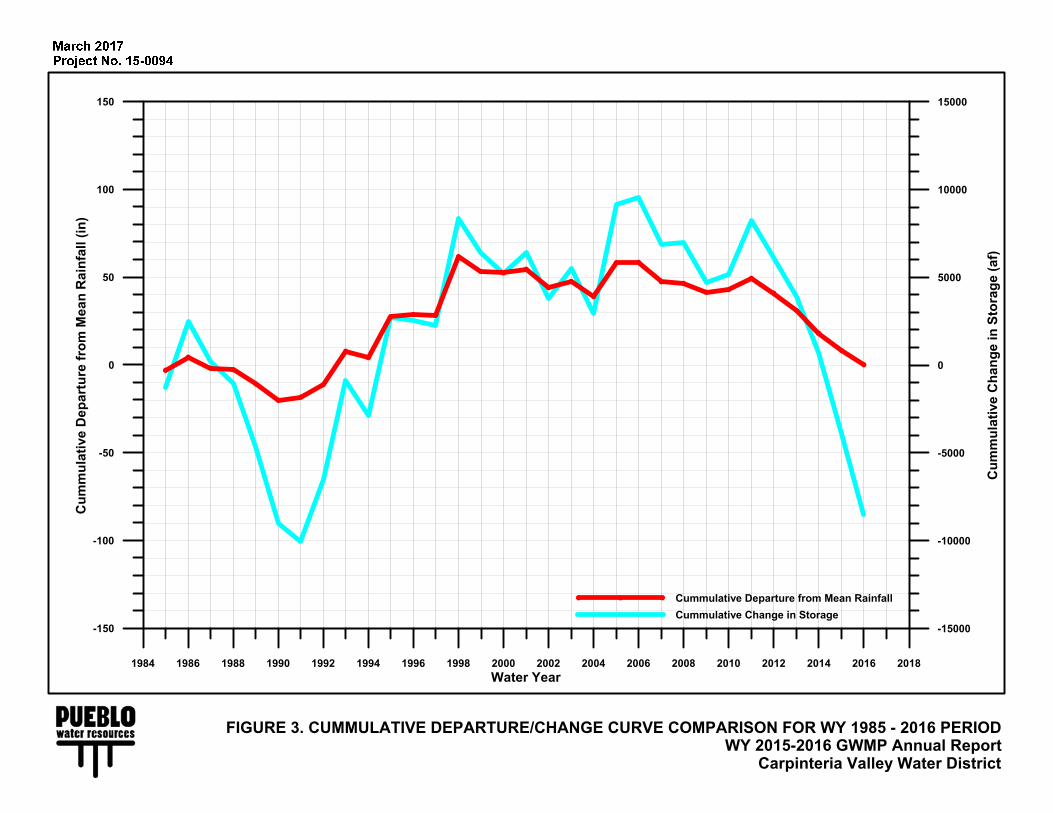
FIGURE 3. CUMMULATIVE DEPARTURE/CHANGE CURVE COMPARISON FOR WY 1985 - 2016 PERIODWY 2015-2016 GWMP Annual Report
Carpinteria Valley Water District
-150
-100
-50
0
50
100
150
Cum
mul
ativ
e D
epar
ture
from
Mea
n R
ainf
all (
in)
-15000
-10000
-5000
0
5000
10000
15000
Cum
mul
ativ
e C
hang
e in
Sto
rage
(af)
1984 1986 1988 1990 1992 1994 1996 1998 2000 2002 2004 2006 2008 2010 2012 2014 2016 2018Water Year
Cummulative Departure from Mean RainfallCummulative Change in Storage

APPENDIX C WATER QUALITY DATA
Summary of Water Quality Data, Spring & Fall 2015Carpinteria Valley Water DistrictGroundwater Basin Data Collection Program
Well No. Sample Date Calcium Magnesium Potassium Sodium Carbonate Bicarbonate Sulfate Chloride Nitrate Fluoride Boron Copper Iron Manganese Zinc Field Lab Field Lab SAR TDS Alkalinity Hardness Ammonia-N5/21/2015 148 43 1 213 <10 320 126 510 35.3 1.3 2.2 <0.01 0.04 0.04 0.04 7.5 7.5 1976 2090 4 1400 270 546 --
10/13/2015 151 42 1 211 <10 270 127 410 35.2 1.3 2 <0.01 0.04 0.02 <0.02 6.81 6.6 2060 2110 3.9 1250 220 550 --6/2/2015 136 39 1 50 <10 300 164 104 89.8 0.4 0.1 <0.01 <0.03 <0.01 0.03 7.4 7.2 1172 1230 1 884 250 500 --
10/14/2015 134 37 1 48 <10 270 147 92 93.2 0.3 0.1 <0.01 <0.03 <0.01 <0.02 7.2 6.7 1176 1190 0.9 825 220 487 ---- -- -- -- -- -- -- -- -- -- -- -- -- -- -- -- -- -- -- -- -- -- -- -- ---- -- -- -- -- -- -- -- -- -- -- -- -- -- -- -- -- -- -- -- -- -- -- -- --
6/17/2015 168 51 1 79 <10 250 230 158 133 0.4 0.4 <0.01 <0.03 0.02 <0.02 7.5 7.3 1265 1480 1.4 1070 200 629 --10/13/2015 178 53 1 83 <10 260 218 140 137 0.3 0.4 <0.01 <0.03 0.02 <0.02 7.17 6.7 1599 1650 1.4 1070 210 662 --6/18/2015 241 66 1 167 <10 430 290 410 141 0.8 1.1 <0.01 8.3 0.12 <0.02 7.2 6.9 2470 2470 2.5 1750 360 873 --
11/13/2015 233 66 1 157 <10 390 250 350 112 0.7 1 0.02 30 0.57 0.03 7.25 6.8 2300 2420 2.3 1560 320 853 --6/2/2015 145 39 1 48 <10 300 156 121 94.9 0.5 <0.1 <0.01 <0.03 0.1 <0.02 7.5 7.3 1231 1270 0.9 905 250 522 --
10/12/2015 136 36 <1 48 <10 200 137 103 86.8 0.4 <0.1 <0.01 <0.03 0.06 <0.02 7.85 7.1 1137 1160 0.9 747 170 487 --5/19/2015 96 29 2 78 <10 340 109 87 <1 0.4 0.2 <0.01 <0.03 0.37 <0.02 7.5 7.1 690 1000 1.8 741 280 359 --
10/20/2015 87 27 2 73 <10 290 105 83 <0.4 0.4 0.2 <0.01 <0.03 0.33 <0.02 7.36 6.6 979 993 1.8 667 240 328 --5/20/2015 130 39 2 86 <10 380 141 57 120 0.3 0.2 0.05 0.06 1.4 0.03 7.3 7.2 1215 1230 1.7 955 310 485 --
10/13/2015 119 36 2 83 <10 260 140 57 117 0.3 0.1 0.02 0.05 0.24 <0.02 7.3 7 1198 1170 1.7 814 220 445 ---- -- -- -- -- -- -- -- -- -- -- -- -- -- -- -- -- -- -- -- -- -- -- -- ---- -- -- -- -- -- -- -- -- -- -- -- -- -- -- -- -- -- -- -- -- -- -- -- ---- -- -- -- -- -- -- -- -- -- -- -- -- -- -- -- -- -- -- -- -- -- -- -- ---- -- -- -- -- -- -- -- -- -- -- -- -- -- -- -- -- -- -- -- -- -- -- -- --
6/25/2015 67 19 1 91 <10 370 79 57 4 0.4 0.2 <0.01 0.1 0.27 <0.02 7.6 7.2 903 883 2.5 684 300 245 --11/13/2015 72 19 1 83 <10 360 95 44 7.2 0.4 0.2 <0.01 0.3 0.05 <0.02 7.9 7.4 918 918 2.2 682 290 258 --
-- -- -- -- -- -- -- -- -- -- -- -- -- -- -- -- -- -- -- -- -- -- -- -- --10/13/2015 113 39 1 91 <10 300 117 124 87 0.4 0.1 <0.01 0.03 <0.01 0.07 7.63 7.1 1263 1280 1.9 872 250 442 --
-- -- -- -- -- -- -- -- -- -- -- -- -- -- -- -- -- -- -- -- -- -- -- -- ---- -- -- -- -- -- -- -- -- -- -- -- -- -- -- -- -- -- -- -- -- -- -- -- ---- -- -- -- -- -- -- -- -- -- -- -- -- -- -- -- -- -- -- -- -- -- -- -- ---- -- -- -- -- -- -- -- -- -- -- -- -- -- -- -- -- -- -- -- -- -- -- -- ---- -- -- -- -- -- -- -- -- -- -- -- -- -- -- -- -- -- -- -- -- -- -- -- --
10/13/2015 118 36 2 80 <10 350 129 52 117 0.3 0.2 <0.01 <0.03 0.03 <0.02 7.56 7.4 1195 1210 1.7 878 290 443 --5/20/2015 93 41 2 82 <10 430 27 126 42.3 0.4 0.2 <0.01 <0.03 <0.01 0.04 7.4 7.4 1069 1080 1.8 844 350 401 --
10/14/2015 88 39 1 80 <10 300 29 102 38.1 0.5 0.2 <0.01 <0.03 <0.01 0.04 7.38 7.1 1105 1110 1.8 678 250 380 --5/28/2015 90 30 2 75 <10 380 116 62 2.8 0.3 0.2 <0.01 <0.03 0.03 <0.02 7.37 7.4 965 979 1.7 758 310 348 --
10/13/2015 87 30 2 73 <10 320 104 57 2.6 0.3 0.2 <0.01 <0.03 0.04 0.03 7.28 7.1 965 965 1.7 675 260 341 --5/19/2015 86 27 2 76 <10 360 105 44 <0.5 0.3 0.2 0.01 <0.03 0.23 0.05 7.4 7.2 875 895 1.8 700 290 326 --
10/13/2015 79 26 1 71 <10 360 108 43 2.9 0.3 0.2 <0.01 <0.03 0.19 0.03 7.3 7 895 892 1.8 690 300 304 ---- -- -- -- -- -- -- -- -- -- -- -- -- -- -- -- -- -- -- -- -- -- -- -- ---- -- -- -- -- -- -- -- -- -- -- -- -- -- -- -- -- -- -- -- -- -- -- -- --
5/20/2015 86 28 1 74 <10 350 90 60 16.7 0.4 0.1 <0.01 <0.03 0.44 0.02 7.3 7.2 879 906 1.8 706 280 330 ---- -- -- -- -- -- -- -- -- -- -- -- -- -- -- -- -- -- -- -- -- -- -- -- --
5/28/2015 106 29 1 50 <10 290 151 87 11.3 0.2 <0.1 <0.01 <0.03 <0.01 <0.02 7.3 7.2 980 1000 1.1 726 240 384 --10/12/2015 106 30 1 53 <10 250 138 81 9.2 0.2 0.1 <0.01 0.03 <0.01 <0.02 7.17 6.9 980 983 1.2 668 200 388 --5/20/2015 124 42 2 69 <10 290 114 173 50.3 0.4 <0.1 <0.01 0.31 0.02 <0.02 7.4 7.2 1199 1220 1.4 865 240 482 --
10/12/2015 120 40 1 66 <10 240 114 151 48.1 0.3 <0.1 <0.01 0.14 <0.01 <0.02 7.15 7 1214 1240 1.3 780 200 464 --6/3/2015 181 42 2 55 <10 240 107 315 87.7 0.3 <0.1 <0.01 <0.03 <0.01 <0.02 7.2 7.1 1567 1630 1 1030 200 624 --
10/26/2015 176 42 2 53 <10 210 106 298 85.7 0.2 <0.1 <0.01 <0.03 <0.01 <0.02 7.51 6.9 1570 1590 0.9 973 180 612 --6/2/2015 95 28 1 35 <10 280 171 32 8 0.3 <0.1 <0.01 <0.03 <0.01 <0.02 7.53 7.4 830 839 0.8 650 230 352 --
10/12/2015 99 30 1 38 <10 200 153 33 11.4 0.2 <0.1 <0.01 <0.03 <0.01 <0.02 7.43 7.1 862 866 0.9 566 160 370 --5/19/2015 121 37 2 86 <10 280 78 195 26.6 0.3 0.1 <0.01 <0.03 <0.01 <0.02 7.9 7.6 1221 1250 1.8 826 230 454 --
10/21/2015 114 35 2 79 <10 290 86 196 32.5 0.3 0.2 <0.01 <0.03 <0.01 <0.02 7.38 6.7 1269 1280 1.7 835 230 428 --6/25/2015 90 30 1 50 <10 310 133 73 19.2 0.4 <0.1 <0.01 <0.03 <0.01 <0.02 7.6 7.2 933 953 1.2 707 250 348 --
11/13/2015 97 32 1 53 <10 310 123 52 13.2 0.4 0.1 <0.01 0.11 <0.01 <0.02 7.64 7.3 909 944 1.2 682 260 374 --7/6/2015 137 39 1 47 <10 360 159 51 70.1 0.3 0.1 <0.01 <0.03 <0.01 <0.02 7.5 7.2 1111 1120 0.9 864 290 502 --
-- -- -- -- -- -- -- -- -- -- -- -- -- -- -- -- -- -- -- -- -- -- -- -- ---- -- -- -- -- -- -- -- -- -- -- -- -- -- -- -- -- -- -- -- -- -- -- -- ---- -- -- -- -- -- -- -- -- -- -- -- -- -- -- -- -- -- -- -- -- -- -- -- --
6/29/2015 140 43 2 108 <10 340 106 262 13.7 0.4 0.2 <0.01 0.08 0.26 0.03 7.8 7.3 1430 1520 2 1020 280 526 --10/26/2015 124 37 2 100 <10 340 101 222 11.3 0.5 0.2 <0.01 <0.03 0.24 <0.02 7.57 7 1406 1440 2 938 280 462 --5/19/2015 94 29 1 60 <10 330 106 50 <0.5 0.3 0.1 <0.01 <0.03 0.03 <0.02 7.5 7.4 889 895 1.4 670 270 354 --
10/13/2015 88 28 1 57 <10 290 103 47 19.6 0.3 0.1 <0.01 <0.03 0.03 <0.02 7.5 7.1 894 847 1.4 634 240 335 --5/20/2015 99 28 2 56 <10 340 140 37 9.2 0.3 0.1 <0.01 0.06 0.12 <0.02 7.5 7.4 855 879 1.3 712 270 362 --
10/13/2015 93 27 1 54 <10 280 123 34 10.1 0.3 0.1 <0.01 0.04 0.1 <0.02 7.6 7 874 831 1.3 622 230 343 --5/20/2015 101 28 2 58 <10 340 121 37 6.9 0.3 0.1 0.05 <0.03 <0.01 <0.02 7.4 7.4 881 883 1.3 694 280 367 --
10/13/2015 92 27 1 56 <10 280 124 36 10.1 0.3 0.1 0.04 <0.03 <0.01 <0.02 7.38 7 888 883 1.3 626 230 341 ---- -- -- -- -- -- -- -- -- -- -- -- -- -- -- -- -- -- -- -- -- -- -- -- ---- -- -- -- -- -- -- -- -- -- -- -- -- -- -- -- -- -- -- -- -- -- -- -- --
6/1/2015 147 41 1 54 <10 390 179 56 86 0.3 <0.1 <0.01 <0.03 0.03 <0.02 7.33 7.1 592 1270 1 954 320 535 --10/21/2015 143 39 1 52 <10 390 185 57 73.9 0.3 0.1 <0.01 <0.03 <0.01 <0.02 7.55 6.9 1215 1220 1 941 320 517 --
7/6/2015 120 34 1 49 <10 340 126 40 61.1 0.3 0.1 <0.01 <0.03 <0.01 <0.02 7.8 7.2 913 1010 1 771 280 439 --10/19/2015 117 33 1 47 <10 310 129 41 69.2 0.3 0.1 <0.01 0.05 <0.01 <0.02 7.6 6.9 1033 1040 1 747 260 428 --5/28/2015 145 40 1 48 <10 400 187 57 62.4 0.3 <0.1 <0.01 <0.03 <0.01 <0.02 7.4 7.3 1103 1200 0.9 941 330 526 --
10/14/2015 142 39 1 45 <10 390 180 55 25 0.3 <0.1 <0.01 0.04 <0.01 <0.02 7.17 6.8 1155 1150 0.9 878 320 515 ---- -- -- -- -- -- -- -- -- -- -- -- -- -- -- -- -- -- -- -- -- -- -- -- ---- -- -- -- -- -- -- -- -- -- -- -- -- -- -- -- -- -- -- -- -- -- -- -- --
5/19/2015 91 24 2 62 <10 330 112 37 <0.5 0.3 0.1 0.01 <0.03 0.11 <0.02 7.4 7.3 845 849 1.5 658 270 326 --10/13/2015 84 23 1 59 <10 260 114 39 9.8 0.3 0.1 <0.01 <0.03 0.1 <0.02 7.36 7.1 850 848 1.5 589 220 304 --5/19/2015 89 24 2 64 <10 330 113 40 9.2 0.3 0.1 <0.01 <0.03 <0.01 <0.02 7.4 7.2 840 860 1.6 672 270 321 --
10/13/2015 85 23 1 60 <10 260 114 41 9.5 0.3 0.1 <0.01 <0.03 <0.01 <0.02 7.4 7 849 855 1.5 593 220 307 ---- -- -- -- -- -- -- -- -- -- -- -- -- -- -- -- -- -- -- -- -- -- -- -- ---- -- -- -- -- -- -- -- -- -- -- -- -- -- -- -- -- -- -- -- -- -- -- -- ---- -- -- -- -- -- -- -- -- -- -- -- -- -- -- -- -- -- -- -- -- -- -- -- ---- -- -- -- -- -- -- -- -- -- -- -- -- -- -- -- -- -- -- -- -- -- -- -- --
5/21/2015 21 14 2 83 <10 220 13 66 3.3 0.7 0.2 <0.01 4.4 0.3 0.44 8.6 7.8 625 635 3.4 423 180 110 --10/19/2015 20 15 2 81 <10 240 3 68 0.4 0.7 0.2 <0.01 8.6 0.41 0.5 8.3 7.4 640 637 3.3 430 200 112 --
6/3/2015 161 49 2 109 <10 380 360 142 <0.4 0.5 0.2 <0.01 0.8 0.2 <0.02 7.18 7.1 1525 1600 1.9 1200 310 603 --10/19/2015 155 46 3 106 <10 340 310 125 <0.4 0.4 0.2 <0.01 2.6 0.25 <0.02 7.2 6.8 1495 1510 1.9 1090 280 576 --
-- -- -- -- -- -- -- -- -- -- -- -- -- -- -- -- -- -- -- -- -- -- -- -- ---- -- -- -- -- -- -- -- -- -- -- -- -- -- -- -- -- -- -- -- -- -- -- -- --
5/20/2015 97 29 2 59 <10 320 98 67 3.8 0.4 0.1 <0.01 <0.03 0.02 <0.02 7.5 7.5 883 884 1.4 676 260 361 --10/12/2015 88 27 1 55 <10 210 97 65 4.9 0.3 0.1 <0.01 0.05 0.03 <0.02 7.7 7.1 872 850 1.3 548 170 331 --5/20/2015 162 52 2 90 <10 380 280 106 21.6 0.3 0.3 <0.01 <0.03 <0.01 0.02 7.7 7.7 1407 1420 1.6 1090 310 618 --
10/16/2015 139 46 2 83 <10 380 240 97 18.2 0.3 0.2 <0.01 0.05 <0.01 <0.02 7.8 7.2 1350 1340 1.6 1010 310 536 --5/20/2015 164 52 3 144 <10 220 510 181 <2.5 0.4 0.2 <0.01 0.46 0.08 <0.02 7.07 7.1 1617 1660 2.5 1270 180 623 --
10/16/2015 146 50 2 138 <10 130 440 145 1.8 0.3 0.2 <0.01 0.61 0.07 <0.02 7.25 6.9 1625 1690 2.5 1050 110 570 ---- -- -- -- -- -- -- -- -- -- -- -- -- -- -- -- -- -- -- -- -- -- -- -- ---- -- -- -- -- -- -- -- -- -- -- -- -- -- -- -- -- -- -- -- -- -- -- -- ---- -- -- -- -- -- -- -- -- -- -- -- -- -- -- -- -- -- -- -- -- -- -- -- ---- -- -- -- -- -- -- -- -- -- -- -- -- -- -- -- -- -- -- -- -- -- -- -- --
6/2/2015 81 35 1 136 <10 450 42 166 3.6 1.1 0.3 <0.01 0.3 0.09 <0.02 7.4 7.4 1220 1250 3.2 916 370 346 --10/13/2015 76 35 1 133 <10 450 39 143 3.1 1.0 0.3 <0.01 0.23 0.09 <0.02 7.28 6.9 1225 1200 3.2 881 370 334 --
-- -- -- -- -- -- -- -- -- -- -- -- -- -- -- -- -- -- -- -- -- -- -- -- ---- -- -- -- -- -- -- -- -- -- -- -- -- -- -- -- -- -- -- -- -- -- -- -- ---- -- -- -- -- -- -- -- -- -- -- -- -- -- -- -- -- -- -- -- -- -- -- -- ---- -- -- -- -- -- -- -- -- -- -- -- -- -- -- -- -- -- -- -- -- -- -- -- ---- -- -- -- -- -- -- -- -- -- -- -- -- -- -- -- -- -- -- -- -- -- -- -- ---- -- -- -- -- -- -- -- -- -- -- -- -- -- -- -- -- -- -- -- -- -- -- -- ---- -- -- -- -- -- -- -- -- -- -- -- -- -- -- -- -- -- -- -- -- -- -- -- ---- -- -- -- -- -- -- -- -- -- -- -- -- -- -- -- -- -- -- -- -- -- -- -- ---- -- -- -- -- -- -- -- -- -- -- -- -- -- -- -- -- -- -- -- -- -- -- -- ---- -- -- -- -- -- -- -- -- -- -- -- -- -- -- -- -- -- -- -- -- -- -- -- --
6/3/2015 102 59 2 135 <10 460 196 168 8 0.8 0.6 <0.01 <0.03 <0.01 <0.02 8.5 8.1 1440 1490 2.6 1130 380 497 <0.210/12/2015 109 57 3 141 <10 460 188 159 2.6 0.7 0.7 <0.01 <0.03 <0.01 <0.02 8.15 7.8 1480 1520 2.7 1120 380 506 <0.2
Concentrations in milligrams per liter, except Electrical Conductance (micromhos/cm) and pH.
PH E.C.
4N/25W-19E1
4N/25W-19J4
4N/25W-19K5
4N/25W-19M1
4N/25W-19R1
4N/25W-19K9
4N/25W-20K4
4N/25W-20K4
4N/25W-20C1
4N/25W-20J2
4N/25W-20L2
4N/25W-20M1
4N/25W-20Q3
4N/25W-20L3
4N/25W-20R4
4N/25W-21F1
4N/25W-21L1
4N/25W-21N7
4N/25W-21N4
4N/25W-21Q1
4N/25W-22R4
4N/25W-25F1
4N/25W-26B1
4N/25W-26C8
4N/25W-27D1
4N/25W-27E1
4N/25W-26P2
4N/25W-27F2
4N/25W-27R2
4N/25W-28A1
4N/25W-28D2
4N/25W-28D2
4N/25W-28F7
4N/25W-28G3
4N/25W-28H1
4N/25W-28J1
4N/25W-29D7
4N/25W-29D8
4N/25W-29D8
4N/25W-29K2
4N/25W-29L1
4N/25W-30D1
4N/25W-34A1
4N/25W-34G1
4N/25W-34B4
4N/25W-35B5
4N/25W-35E4
4N/26W-13R1
4N/26W-23A2
4N/26W-24F1
Toro Creek
Arroyo Paredon Creek
Santa Monica Creek
Carpinteria Creek
Gobernador Creek
Rincon Creek
Non detected concentrations shown as < PQL (Practical Quantitation Limit)Not Available = --
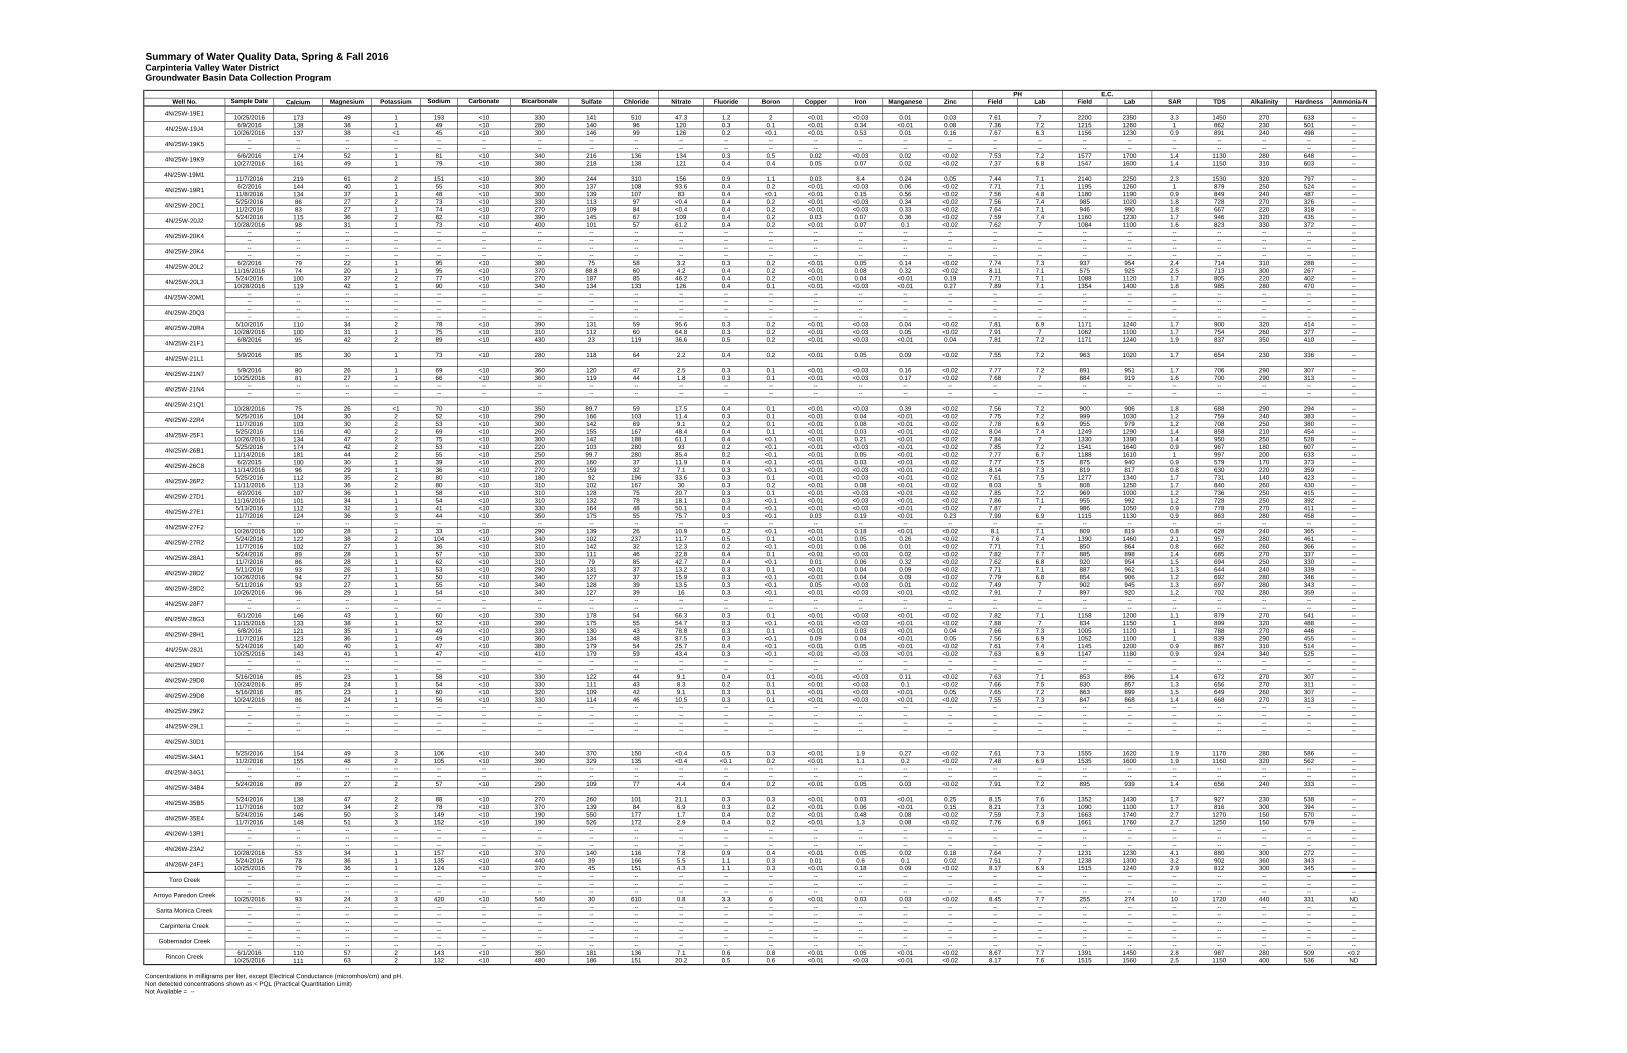
Summary of Water Quality Data, Spring & Fall 2016Carpinteria Valley Water DistrictGroundwater Basin Data Collection Program
Well No. Sample Date Calcium Magnesium Potassium Sodium Carbonate Bicarbonate Sulfate Chloride Nitrate Fluoride Boron Copper Iron Manganese Zinc Field Lab Field Lab SAR TDS Alkalinity Hardness Ammonia-N
10/25/2016 173 49 1 193 <10 330 141 510 47.3 1.2 2 <0.01 <0.03 0.01 0.03 7.61 7 2200 2350 3.3 1450 270 633 --6/9/2016 138 38 1 49 <10 280 140 96 120 0.3 0.1 <0.01 0.34 <0.01 0.08 7.36 7.2 1215 1260 1 862 230 501 --
10/26/2016 137 38 <1 45 <10 300 146 99 126 0.2 <0.1 <0.01 0.53 0.01 0.16 7.67 6.3 1156 1230 0.9 891 240 498 ---- -- -- -- -- -- -- -- -- -- -- -- -- -- -- -- -- -- -- -- -- -- -- -- ---- -- -- -- -- -- -- -- -- -- -- -- -- -- -- -- -- -- -- -- -- -- -- -- --
6/6/2016 174 52 1 81 <10 340 216 136 134 0.3 0.5 0.02 <0.03 0.02 <0.02 7.53 7.2 1577 1700 1.4 1130 280 648 --10/27/2016 161 49 1 79 <10 380 218 138 121 0.4 0.4 0.05 0.07 0.02 <0.02 7.37 6.8 1547 1600 1.4 1150 310 603 --
11/7/2016 219 61 2 151 <10 390 244 310 156 0.9 1.1 0.03 8.4 0.24 0.05 7.44 7.1 2140 2250 2.3 1530 320 797 --6/2/2016 144 40 1 55 <10 300 137 108 93.6 0.4 0.2 <0.01 <0.03 0.06 <0.02 7.71 7.1 1195 1260 1 879 250 524 --
11/8/2016 134 37 1 48 <10 300 139 107 83 0.4 <0.1 <0.01 0.15 0.56 <0.02 7.56 4.8 1180 1190 0.9 849 240 487 --5/25/2016 86 27 2 73 <10 330 113 97 <0.4 0.4 0.2 <0.01 <0.03 0.34 <0.02 7.56 7.4 985 1020 1.8 728 270 326 --11/2/2016 83 27 1 74 <10 270 109 84 <0.4 0.4 0.2 <0.01 <0.03 0.33 <0.02 7.64 7.1 946 990 1.8 667 220 318 --5/24/2016 115 36 2 82 <10 390 145 67 109 0.4 0.2 0.03 0.07 0.36 <0.02 7.59 7.4 1160 1230 1.7 946 320 435 --
10/28/2016 98 31 1 73 <10 400 101 57 61.2 0.4 0.2 <0.01 0.07 0.1 <0.02 7.62 7 1084 1100 1.6 823 330 372 ---- -- -- -- -- -- -- -- -- -- -- -- -- -- -- -- -- -- -- -- -- -- -- -- ---- -- -- -- -- -- -- -- -- -- -- -- -- -- -- -- -- -- -- -- -- -- -- -- ---- -- -- -- -- -- -- -- -- -- -- -- -- -- -- -- -- -- -- -- -- -- -- -- ---- -- -- -- -- -- -- -- -- -- -- -- -- -- -- -- -- -- -- -- -- -- -- -- --
6/2/2016 79 22 1 95 <10 380 75 58 3.2 0.3 0.2 <0.01 0.05 0.14 <0.02 7.74 7.3 937 954 2.4 714 310 288 --11/16/2016 74 20 1 95 <10 370 88.8 60 4.2 0.4 0.2 <0.01 0.08 0.32 <0.02 8.11 7.1 575 925 2.5 713 300 267 --5/24/2016 100 37 2 77 <10 270 187 85 46.2 0.4 0.2 <0.01 0.04 <0.01 0.19 7.71 7.1 1088 1120 1.7 805 220 402 --
10/28/2016 119 42 1 90 <10 340 134 133 126 0.4 0.1 <0.01 <0.03 <0.01 0.27 7.89 7.1 1354 1400 1.8 985 280 470 ---- -- -- -- -- -- -- -- -- -- -- -- -- -- -- -- -- -- -- -- -- -- -- -- ---- -- -- -- -- -- -- -- -- -- -- -- -- -- -- -- -- -- -- -- -- -- -- -- ---- -- -- -- -- -- -- -- -- -- -- -- -- -- -- -- -- -- -- -- -- -- -- -- ---- -- -- -- -- -- -- -- -- -- -- -- -- -- -- -- -- -- -- -- -- -- -- -- --
5/10/2016 110 34 2 78 <10 390 131 59 95.6 0.3 0.2 <0.01 <0.03 0.04 <0.02 7.81 6.9 1171 1240 1.7 900 320 414 --10/28/2016 100 31 1 75 <10 310 112 60 64.8 0.3 0.2 <0.01 <0.03 0.05 <0.02 7.91 7 1062 1100 1.7 754 260 377 --
6/8/2016 95 42 2 89 <10 430 23 119 36.6 0.5 0.2 <0.01 <0.03 <0.01 0.04 7.81 7.2 1171 1240 1.9 837 350 410 --
5/9/2016 85 30 1 73 <10 280 118 64 2.2 0.4 0.2 <0.01 0.05 0.09 <0.02 7.55 7.2 963 1020 1.7 654 230 336 --
5/9/2016 80 26 1 69 <10 360 120 47 2.5 0.3 0.1 <0.01 <0.03 0.16 <0.02 7.77 7.2 891 951 1.7 706 290 307 --10/25/2016 81 27 1 66 <10 360 119 44 1.8 0.3 0.1 <0.01 <0.03 0.17 <0.02 7.68 7 884 919 1.6 700 290 313 --
-- -- -- -- -- -- -- -- -- -- -- -- -- -- -- -- -- -- -- -- -- -- -- -- ---- -- -- -- -- -- -- -- -- -- -- -- -- -- -- -- -- -- -- -- -- -- -- -- --
10/28/2016 75 26 <1 70 <10 350 89.7 59 17.5 0.4 0.1 <0.01 <0.03 0.39 <0.02 7.56 7.2 900 906 1.8 688 290 294 --5/25/2016 104 30 2 52 <10 290 166 103 11.4 0.3 0.1 <0.01 0.04 <0.01 <0.02 7.75 7.2 999 1030 1.2 759 240 383 --11/7/2016 103 30 2 53 <10 300 142 69 9.1 0.2 0.1 <0.01 0.08 <0.01 <0.02 7.78 6.9 955 979 1.2 708 250 380 --5/25/2016 116 40 2 69 <10 260 155 167 48.4 0.4 0.1 <0.01 0.03 <0.01 <0.02 8.04 7.4 1249 1290 1.4 858 210 454 --
10/26/2016 134 47 2 75 <10 300 142 188 61.1 0.4 <0.1 <0.01 0.21 <0.01 <0.02 7.84 7 1330 1390 1.4 950 250 528 --5/25/2016 174 42 2 53 <10 220 103 280 93 0.2 <0.1 <0.01 <0.03 <0.01 <0.02 7.85 7.2 1541 1640 0.9 967 180 607 --
11/14/2016 181 44 2 55 <10 250 99.7 280 85.4 0.2 <0.1 <0.01 0.05 <0.01 <0.02 7.77 6.7 1188 1610 1 997 200 633 --6/2/2015 100 30 1 39 <10 200 160 37 11.9 0.4 <0.1 <0.01 0.03 <0.01 <0.02 7.77 7.5 875 940 0.9 579 170 373 --
11/14/2016 96 29 1 36 <10 270 159 32 7.1 0.3 <0.1 <0.01 <0.03 <0.01 <0.02 8.14 7.3 819 817 0.8 630 220 359 --5/25/2016 112 35 2 80 <10 180 92 196 33.6 0.3 0.1 <0.01 <0.03 <0.01 <0.02 7.61 7.5 1277 1340 1.7 731 140 423 --
11/11/2016 113 36 2 80 <10 310 102 167 30 0.3 0.2 <0.01 0.08 <0.01 <0.02 8.03 5 808 1250 1.7 840 260 430 --6/2/2016 107 36 1 58 <10 310 128 75 20.7 0.3 0.1 <0.01 <0.03 <0.01 <0.02 7.85 7.2 969 1000 1.2 736 250 415 --
11/16/2016 101 34 1 54 <10 310 132 78 18.1 0.3 <0.1 <0.01 <0.03 <0.01 <0.02 7.86 7.1 955 992 1.2 728 250 392 --5/13/2016 112 32 1 41 <10 330 164 48 50.1 0.4 <0.1 <0.01 <0.03 <0.01 <0.02 7.87 7 986 1050 0.9 778 270 411 --11/7/2016 124 36 3 44 <10 350 175 55 75.7 0.3 <0.1 0.03 0.19 <0.01 0.23 7.99 6.9 1115 1130 0.9 863 280 458 --
-- -- -- -- -- -- -- -- -- -- -- -- -- -- -- -- -- -- -- -- -- -- -- -- --10/26/2016 100 28 1 33 <10 290 139 26 10.9 0.2 <0.1 <0.01 0.18 <0.01 <0.02 8.1 7.1 809 819 0.8 628 240 365 --5/24/2016 122 38 2 104 <10 340 102 237 11.7 0.5 0.1 <0.01 0.05 0.26 <0.02 7.6 7.4 1390 1460 2.1 957 280 461 --11/7/2016 102 27 1 36 <10 310 142 32 12.3 0.2 <0.1 <0.01 0.06 0.01 <0.02 7.71 7.1 850 864 0.8 662 260 366 --5/24/2016 89 28 1 57 <10 330 111 46 22.8 0.4 0.1 <0.01 <0.03 0.02 <0.02 7.82 7.7 885 898 1.4 685 270 337 --11/7/2016 86 28 1 62 <10 310 79 85 42.7 0.4 <0.1 0.01 0.06 0.32 <0.02 7.62 6.8 920 954 1.5 694 250 330 --5/11/2016 93 26 1 53 <10 290 131 37 13.2 0.3 0.1 <0.01 0.04 0.09 <0.02 7.71 7.1 887 962 1.3 644 240 339 --
10/26/2016 94 27 1 50 <10 340 127 37 15.9 0.3 <0.1 <0.01 0.04 0.09 <0.02 7.79 6.8 854 906 1.2 692 280 346 --5/11/2016 93 27 1 55 <10 340 128 39 13.5 0.3 <0.1 0.05 <0.03 0.01 <0.02 7.49 7 902 945 1.3 697 280 343 --
10/26/2016 96 29 1 54 <10 340 127 39 16 0.3 <0.1 <0.01 <0.03 <0.01 <0.02 7.91 7 897 920 1.2 702 280 359 ---- -- -- -- -- -- -- -- -- -- -- -- -- -- -- -- -- -- -- -- -- -- -- -- ---- -- -- -- -- -- -- -- -- -- -- -- -- -- -- -- -- -- -- -- -- -- -- -- --
6/1/2016 146 43 1 60 <10 330 178 54 66.3 0.3 0.1 <0.01 <0.03 <0.01 <0.02 7.82 7.1 1158 1200 1.1 879 270 541 --11/15/2016 133 38 1 52 <10 390 175 55 54.7 0.3 <0.1 <0.01 <0.03 <0.01 <0.02 7.88 7 834 1150 1 899 320 488 --
6/8/2016 121 35 1 49 <10 330 130 43 78.8 0.3 0.1 <0.01 0.03 <0.01 0.04 7.66 7.3 1005 1120 1 788 270 446 --11/7/2016 123 36 1 49 <10 360 134 48 87.5 0.3 <0.1 0.09 0.04 <0.01 0.05 7.56 6.9 1052 1100 1 839 290 455 --5/24/2016 140 40 1 47 <10 380 179 54 25.7 0.4 <0.1 <0.01 0.05 <0.01 <0.02 7.61 7.4 1145 1200 0.9 867 310 514 --
10/25/2016 143 41 1 47 <10 410 179 59 43.4 0.3 <0.1 <0.01 <0.03 <0.01 <0.02 7.63 6.9 1147 1180 0.9 924 340 525 ---- -- -- -- -- -- -- -- -- -- -- -- -- -- -- -- -- -- -- -- -- -- -- -- ---- -- -- -- -- -- -- -- -- -- -- -- -- -- -- -- -- -- -- -- -- -- -- -- --
5/16/2016 85 23 1 58 <10 330 122 44 9.1 0.4 0.1 <0.01 <0.03 0.11 <0.02 7.63 7.1 853 896 1.4 672 270 307 --10/24/2016 85 24 1 54 <10 330 111 43 8.3 0.2 0.1 <0.01 <0.03 0.1 <0.02 7.66 7.5 830 857 1.3 656 270 311 --5/16/2016 85 23 1 60 <10 320 109 42 9.1 0.3 0.1 <0.01 <0.03 <0.01 0.05 7.65 7.2 863 899 1.5 649 260 307 --
10/24/2016 86 24 1 56 <10 330 114 46 10.5 0.3 0.1 <0.01 <0.03 <0.01 <0.02 7.55 7.3 847 868 1.4 668 270 313 ---- -- -- -- -- -- -- -- -- -- -- -- -- -- -- -- -- -- -- -- -- -- -- -- ---- -- -- -- -- -- -- -- -- -- -- -- -- -- -- -- -- -- -- -- -- -- -- -- ---- -- -- -- -- -- -- -- -- -- -- -- -- -- -- -- -- -- -- -- -- -- -- -- ---- -- -- -- -- -- -- -- -- -- -- -- -- -- -- -- -- -- -- -- -- -- -- -- --
5/25/2016 154 49 3 106 <10 340 370 150 <0.4 0.5 0.3 <0.01 1.9 0.27 <0.02 7.61 7.3 1555 1620 1.9 1170 280 586 --11/2/2016 155 48 2 105 <10 390 329 135 <0.4 <0.1 0.2 <0.01 1.1 0.2 <0.02 7.48 6.9 1535 1600 1.9 1160 320 562 --
-- -- -- -- -- -- -- -- -- -- -- -- -- -- -- -- -- -- -- -- -- -- -- -- ---- -- -- -- -- -- -- -- -- -- -- -- -- -- -- -- -- -- -- -- -- -- -- -- --
5/24/2016 89 27 2 57 <10 290 109 77 4.4 0.4 0.2 <0.01 0.05 0.03 <0.02 7.91 7.2 895 939 1.4 656 240 333 --
5/24/2016 138 47 2 88 <10 270 260 101 21.1 0.3 0.3 <0.01 0.03 <0.01 0.25 8.15 7.6 1352 1430 1.7 927 230 538 --11/7/2016 102 34 2 78 <10 370 139 84 6.9 0.3 0.2 <0.01 0.06 <0.01 0.15 8.21 7.3 1090 1100 1.7 816 300 394 --5/24/2016 146 50 3 149 <10 190 550 177 1.7 0.4 0.2 <0.01 0.48 0.08 <0.02 7.59 7.3 1663 1740 2.7 1270 150 570 --11/7/2016 148 51 3 152 <10 190 526 172 2.9 0.4 0.2 <0.01 1.3 0.08 <0.02 7.76 6.9 1661 1760 2.7 1250 150 579 --
-- -- -- -- -- -- -- -- -- -- -- -- -- -- -- -- -- -- -- -- -- -- -- -- ---- -- -- -- -- -- -- -- -- -- -- -- -- -- -- -- -- -- -- -- -- -- -- -- ---- -- -- -- -- -- -- -- -- -- -- -- -- -- -- -- -- -- -- -- -- -- -- -- --
10/28/2016 53 34 1 157 <10 370 140 116 7.8 0.9 0.4 <0.01 0.05 0.02 0.18 7.64 7 1231 1230 4.1 880 300 272 --5/24/2016 78 36 1 135 <10 440 39 166 5.5 1.1 0.3 0.01 0.6 0.1 0.02 7.51 7 1238 1300 3.2 902 360 343 --
10/25/2016 79 36 1 124 <10 370 45 151 4.3 1.1 0.3 <0.01 0.18 0.09 <0.02 8.17 6.9 1515 1240 2.9 812 300 345 ---- -- -- -- -- -- -- -- -- -- -- -- -- -- -- -- -- -- -- -- -- -- -- -- ---- -- -- -- -- -- -- -- -- -- -- -- -- -- -- -- -- -- -- -- -- -- -- -- ---- -- -- -- -- -- -- -- -- -- -- -- -- -- -- -- -- -- -- -- -- -- -- -- --
10/25/2016 93 24 3 420 <10 540 30 610 0.8 3.3 6 <0.01 0.03 0.03 <0.02 8.45 7.7 255 274 10 1720 440 331 ND-- -- -- -- -- -- -- -- -- -- -- -- -- -- -- -- -- -- -- -- -- -- -- -- ---- -- -- -- -- -- -- -- -- -- -- -- -- -- -- -- -- -- -- -- -- -- -- -- ---- -- -- -- -- -- -- -- -- -- -- -- -- -- -- -- -- -- -- -- -- -- -- -- ---- -- -- -- -- -- -- -- -- -- -- -- -- -- -- -- -- -- -- -- -- -- -- -- ---- -- -- -- -- -- -- -- -- -- -- -- -- -- -- -- -- -- -- -- -- -- -- -- ---- -- -- -- -- -- -- -- -- -- -- -- -- -- -- -- -- -- -- -- -- -- -- -- --
6/1/2016 110 57 2 143 <10 350 181 136 7.1 0.6 0.8 <0.01 0.05 <0.01 <0.02 8.67 7.7 1391 1450 2.8 987 280 509 <0.210/25/2016 111 63 2 132 <10 480 186 151 20.2 0.5 0.6 <0.01 <0.03 <0.01 <0.02 8.17 7.6 1515 1560 2.5 1150 400 536 ND
Concentrations in milligrams per liter, except Electrical Conductance (micromhos/cm) and pH.Non detected concentrations shown as < PQL (Practical Quantitation Limit)Not Available = --
Toro Creek
Arroyo Paredon Creek
Santa Monica Creek
Carpinteria Creek
Gobernador Creek
Rincon Creek
4N/26W-13R1
4N/26W-23A2
4N/26W-24F1
4N/25W-34B4
4N/25W-35B5
4N/25W-35E4
4N/25W-30D1
4N/25W-34A1
4N/25W-34G1
4N/25W-29D8
4N/25W-29K2
4N/25W-29L1
4N/25W-28J1
4N/25W-29D7
4N/25W-29D8
4N/25W-28F7
4N/25W-28G3
4N/25W-28H1
4N/25W-28A1
4N/25W-28D2
4N/25W-28D2
4N/25W-27E1
4N/25W-27F2
4N/25W-27R2
4N/25W-26C8
4N/25W-26P2
4N/25W-27D1
4N/25W-22R4
4N/25W-25F1
4N/25W-26B1
4N/25W-21N7
4N/25W-21N4
4N/25W-21Q1
4N/25W-20R4
4N/25W-21F1
4N/25W-21L1
4N/25W-20L3
4N/25W-20M1
4N/25W-20Q3
4N/25W-20K4
4N/25W-20K4
4N/25W-20L2
4N/25W-19R1
4N/25W-20C1
4N/25W-20J2
4N/25W-19K5
4N/25W-19K9
4N/25W-19M1
PH E.C.
4N/25W-19E1
4N/25W-19J4