Carpark Asset Management Plan 2017 - latrobe.vic.gov.au · The CAMP is a presentation of...
83
Pg. 1 Carpark Asset Management Plan 2017 Draft Plan October 2017 V1.0
Transcript of Carpark Asset Management Plan 2017 - latrobe.vic.gov.au · The CAMP is a presentation of...

Pg. 1
Carpark Asset Management Plan
2017
Draft Plan October 2017
V1.0

Pg. 2
Document Control
Document ID: 59 299 140531 nams plus3 amp template v3.1
Rev No Date Revision Details Author Reviewer Approver
1.0 10 October 2017 Review of draft from SFC SFC K Delaney
© Copyright 2016 – All rights reserved.
The Institute of Public Works Engineering Australasia.
www.ipwea.org/namsplus

Pg. 3
TABLE OF CONTENTS 1 EXECUTIVE SUMMARY ......................................................................................................................... 5
1.1 Context ........................................................................................................................................ 5 1.2 Purpose of the Plan ...................................................................................................................... 5 1.3 Asset Description ......................................................................................................................... 5 1.4 The Carpark Service ..................................................................................................................... 7 1.5 Service Provision .......................................................................................................................... 7 1.6 Future Demand ............................................................................................................................ 9 1.7 Demand Management .............................................................................................................. 10 1.8 What does it Cost? ..................................................................................................................... 11 1.9 What we will do ......................................................................................................................... 11 1.10 What we cannot do ................................................................................................................... 11 1.11 Managing the Risks ................................................................................................................... 11 1.12 Confidence Levels ...................................................................................................................... 12 1.13 The Next Steps ........................................................................................................................... 12 1.14 Key Issues: ................................................................................................................................. 12
2 INTRODUCTION .................................................................................................................................. 13 2.1 Background ................................................................................................................................ 13 2.2 The purpose of the Road Asset Management Plan ................................................................... 13 2.3 CAMP Stakeholders ................................................................................................................... 14 2.4 Goals and Objectives of Asset Management ............................................................................. 18 2.5 Plan Framework......................................................................................................................... 18 2.6 Core and Advanced Asset Management ................................................................................... 18 2.7 Community Consultation ........................................................................................................... 19
3 LEVELS OF SERVICE ............................................................................................................................ 20 3.1 Customer Research and Expectations ....................................................................................... 20 3.2 Strategic and Corporate Goals .................................................................................................. 20 3.3 Legislative Requirements ........................................................................................................... 21 3.4 Community Levels of Service ..................................................................................................... 21 3.5 Technical Levels of Service ......................................................................................................... 23
4 FUTURE DEMAND .............................................................................................................................. 30 4.1 Demand Drivers ......................................................................................................................... 30 4.2 Changes that Impact Service Provisioning (i.e. the amount of carpark required) ..................... 30 4.3 Demand Forecast ....................................................................................................................... 32 4.4 Demand Management Plan ...................................................................................................... 33 4.5 Asset Programs to Meet Demand.............................................................................................. 34
5 LIFECYCLE MANAGEMENT PLAN ........................................................................................................ 36 5.1 Background Data ....................................................................................................................... 36 5.2 Infrastructure Risk Management Plan ....................................................................................... 41 5.3 Routine Operations and Maintenance Plan............................................................................... 42 5.4 Asset Hierarchy .......................................................................................................................... 43 5.5 Disposal Plan ............................................................................................................................. 50
6 FINANCIAL SUMMARY ....................................................................................................................... 51 6.1 Financial Statements and Projections ....................................................................................... 51 6.2 Funding Strategy ....................................................................................................................... 57 6.3 Valuation Forecasts ................................................................................................................... 57 6.4 Key Assumptions made in Financial Forecasts .......................................................................... 58 6.5 Forecast Reliability and Confidence ........................................................................................... 60
7 PLAN IMPROVEMENT AND MONITORING ......................................................................................... 62 7.1 Status of Asset Management Practices ..................................................................................... 62 7.2 Monitoring and Review Procedures........................................................................................... 63 7.3 Performance Measures ............................................................................................................. 63

Pg. 4
8 REFERENCES ....................................................................................................................................... 64 APPENDICES .................................................................................................................................................. 65
Appendix A - Proposed Maintenance Response Service Level Agreement .................................... 66 8.1 Appendix B - Projected 10 year Capital Renewal and Replacement Works Program ................ 67 Appendix C - Projected Upgrade/New Expenditure 10 year Capital Works Program................... 72 Appendix D - Budgeted Expenditures ............................................................................................ 73 Appendix E - Abbreviations .......................................................................................................... 74 Appendix F - Glossary ................................................................................................................... 75 Appendix G CAMP Improvement Plan .......................................................................................... 83

Pg. 5
1 EXECUTIVE SUMMARY
1.1 Context
Latrobe City is located approximately 150 km east of Melbourne and is one of Victoria's four major
regional cities with a population of over 75,000 residents. Latrobe City is made up of four central
townships: Churchill, Moe-Newborough, Morwell and Traralgon. The smaller rural townships of Boolarra,
Glengarry, Toongabbie, Tyers, Traralgon-South, Yallourn North and Yinnar are situated within the
surrounding rural areas within the municipality.
Council owns, operates and maintains numerous at grade off street carparks and currently one multi-storey
carpark to assist council operations, commercial activity, and the general community. This plan does not
include the multi-storey carpark as asset planning for multi-carpark structure is best treated from a building
management aspect.
Planning for new carparks requires considerable insight into the demand profile created by the social
infrastructure is supported by and generated the demand carparks. That is to say, the provision of a
carpark is a result of the social planning and the provision is derived from changes to the social
infrastructure asset base. Future demand prediction is therefore beyond the scope of this document and
instead relies at this time on the Activity Centre Plans developed by Strategic Planning and other related
studies. The Complementary Parking Measures Assessment study prompted by planning reviews into car
parking needs, has recently led to a broader analysis on short term car parking needs that will be
incorporated into this document at a future review. The findings of that study will be incorporated into
future revisions of this Carpark Asset Management Plan.
It is acknowledged that the planned developments at Gippsland Regional Aquatic Centre and/or the
Latrobe Creative Precinct will likely add multi-storey car park capacity and that these will be added to the
databases and the building asset portfolio at that time. Should these (or any other future development)
create new at-grade car parks this plan will be updated to include the new assets.
1.2 Purpose of the Plan
The Carpark Asset Management Plan (CAMP) will assist with decision-making about Council’s existing at-
grade off street carpark infrastructure, to present asset information, and to predict the financial
requirements of long-term renewal of this category of transport assets.
The CAMP is a presentation of Council’s strategic approach based on balancing the community’s desired
service levels with Council’s ability to provide the service. It should be noted that Council’s owned and/or
managed carpark assets are only a proportion of the total available carparks and private businesses and
other authorities provide part of the car parking service to the community.
1.3 Asset Description
In addition to major infrastructure assets such as roads, footpaths, drainage and open space, Council is also
responsible for a range of smaller asset sets such as carparks. The carpark asset class includes Council
owned and managed carparks associated with retail precincts, sports facilities, childcare centres, community
and civic facilities. Council owns one multi-storey carpark between Seymour Street and Hotham Street in
Traralgon, and it is likely that another will arise from the Gippsland Regional Aquatic Centre and or the
Latrobe Creative Precinct projects.
The assets considered in this CAMP, include pavements, running surfaces (the sealed and unsealed) and
kerbs, for all the constructed sealed and unsealed carparks for which Council is the Responsible Road
Authority. It does not include drainage infrastructure, lighting and landscaping within the carpark as they

Pg. 6
are either covered under other plans or are minor assets provided to augment the amenity (not
performance) of the carpark.
Carpark asset components considered in the preparation of this CAMP include:
Pavements;
Surfaces; and
Kerbs.
For clarity in considering this plan, assets not considered in this CAMP are:
On-road carparks where the pavement is shared with the road – these are included in the
Road Asset Management Plan;
Multi-storey carparks - these are included in the Building Asset Management Plan;
Vehicular Crossings – these are the responsibility of the property owner; and
Private car parks – these are the responsibility of the private owners.
Council’s Carpark infrastructure is provided to enable the community to go about their business as
conveniently as practical when accessing both private and Council owned properties and services.
The road network underpins a service of access to property. Carparks provide amenity for motorists that
need to store their vehicles to undertake activities at locations to which they need to drive. Table 1.3.1
below presents the breakdown of the Council carpark network by surface type and the principle adjacent
land use.
The Latrobe City Council carpark network is primarily comprised of following assets being:
223 Carparks; including
o 174,428 sq.m of pavements and surfaces; and
o 17,632 lin.m of Kerb and Channel.
Table 1.3.1: Council’s Carpark Assets broken down to surface type and principle adjacent land use
Network Component &
Adjacent land-Use
Co
mm
ercial
Co
mm
un
ity
Edu
cation
Ind
ustrial
Op
en
Space
Re
creatio
n
Re
siden
tial
Ru
ral Living
Tou
rism
Total (sq.m)
(#)
Sealed 65,371 19,420 8,952 3,601 4,825 26,751 10,144 0 324 139,387
Estimated Carpark Yield (#)
2,179 647 298 120 161 892 338 0 11 4,646
Unsealed 6,519 10,447 3,006 2,652 3,617 4,432 18,55 863 1650 35,041
Estimated Carpark Yield (#)
217 348 100 88 121 148 62 29 55 1,168
Total (sq.m) 71,890 29,867 11,958 6,253 8,442 31,183 11,999 863 1,974 174,428
Estimated Carpark Yield (#)
2,396 996 399 208 281 1,039 400 29 66 5,814
Council’s Carpark Assets have been built-up over many years and presents a significant commitment to
fund its up keep and eventual renewal as the assets reach the end of their useful lives. The assets excluding
the Seymour/Hotham multi-storey car park that make up the carpark network have a ‘Greenfields’
replacement value of $11,737,087, which consists of the following breakdown:

Pg. 7
Table 1.3.2: Council’s Carpark Asset Components and Greenfields Replacement Value
Carpark Component Kerb Length (km) Pavement Area
(m2) Greenfield CRC
Asphalt 10,156 98,015 $7,454,213
Bitumen 5,050 36,594 $2,453,136
Concrete 1,221 4,779 $652,882
Gravel 1,205 35,041 $1,176,855
Total Carpark 17,632 174,428 $11,737,087
Sealed Carparks 16,426 139,387 $10,560,232
Unsealed carparks 1,205 35,041 $1,176,855
Total Carpark 17,632 174,428 $11,737,087
1.4 The Carpark Service
The CAMP levels of service give due regard to the strategic goals and objectives in the Council Plan and
current understanding of the community’s desired service levels. Future iterations of this plan may be
tested and amended in line with actual community service levels.
It is always a challenge to strike a balance between the needs and desires of the community and what can
realistically be achieved. Council however, has been providing a carpark network for many years and
officers have developed current service provision levels over time to best match the perceived community
desires constrained by resources.
There are two key service provision areas, the number and type of carpark assets provided, being ‘Service
Provision’, or the level of service to which the assets will be maintained, which is defined in the community’s
terms and technical terms.
The Road Management Act 2004 obliges Councils in Victoria to document the basic technical service levels
that Council will apply and includes what is called “road related infrastructure”. These are very risk based
and are in Council’s Road Management Plan. Due to the direct relationship between carparks and roads,
its technical service levels forms part of the levels of service of this CAMP.
1.5 Service Provision
The service provision is the quantity of an asset of any particular type that will be provided. In the case of
carparks this is does not include the determination of the number of spaces that need to be provided. That
is specific to broader planning and study to determine the overall requirement for car parking. To
elaborate on this, it is not practical for this Asset Management Plan (AMP) to predict what the parking
requirement to service the community. This asset management plan is based on the prevailing supply of car
parking.
The levels of service for carparks generally relates to location, the number and standard of construction of
the provided carparks.
Council has adopted two hierarchy classification for Council Carparks as follows:
(CAR1) - Sealed Carparks:
(CAR2) - Unsealed Carparks:

Pg. 8
Service provision levels also apply to:
New Asset – If Council provides new road structures / assets, then what design and
maintainability standards shall apply to make them meet Service Provision Levels?
Upgraded or Reconstructed Asset to original standard - If Council upgrades or
reconstructs a road asset, then what design and maintainability standards shall apply to
make them meet Service Provision Levels?
Existing Assets to define the planned maintenance regime/technical levels of service to be
applied.
The community desire is generally for increased and improved standard of services. Generally, community
requests for increased levels of service for carparks relates to the sealing of unsealed carparks.
Unfortunately, the funding available to meet these demands is constrained and therefore the upgrades are
prioritised and implemented only as funds are available. There is not an accepted policy with respect to
justifying and/or prioritising the upgrading of existing carpark assets. This will be developed and has been
included as an item on the improvement plan.

Pg. 9
1.6 Future Demand
The Australian Bureau of Statistics indicates that by 2030 Latrobe City’s population will be more than
84,000.
The majority of this growth is currently within the Traralgon area and projected for the Lake Narracan
area north of Moe. Most new assets will be developer provided though some concurrent upgrade will be
required as part of Council’s obligation under Development Contribution Plans. Within the known plans
for urban development there are no significant new council managed carparks planned.
Areas of specific interest in the foreseeable future are:
Development at Marshalls Road, Traralgon will involve the creation of privately managed
carpark associated with the planned supermarket development.
Though these growth related carpark asset upgrades have been envisaged, only those relating to known
development contributions are at this time considered affordable.
Figure 1.6.1: Projected & Planned Expenditure
Latrobe City – CARPARKS - Projected and Planned Expenditure $000's
10 year total cost [10 yr Ops, Maint, Renewal & Upgrade Proj Exp] $4,626
10 year average cost $463
10 year total budget [10 yr Ops, Maint, Renewal & Upgrade Budget] $1,724
10 year average budget $172
10 year AM financial indicator 37%
10 year average funding shortfall (-ve shortfall, +ve Surplus) -$290
The average cost of the carpark assets service is $463,000 per annum for the next 10 years.
Figure 1.6.2 outlines the history of investment in carpark assets. The creation of assets began in the early
1950’s. Most assets were generated as part of commercial development and consequently gifted to
Council. The figure shows the steady increase in asset age and the renewal task being steady until 2020
before it starts to increase.
Figure 1.6.2: Carpark Investment History and Asset Age

Pg. 10
Latrobe City does not have a backlog in carpark infrastructure projects. The overall condition of the
pavements and the running surfaces of the carpark network is GOOD with an average Condition score of
2.3 out of 5.0. Analysis of the data on carparks suggests that there is a potential issue with kerb condition
which has elements which are POOR. This will need to be analysed to determine a work plan for the
renewal of carpark kerbs; the initial spike in the renewal funding in figures 1.6.2 and 1.6.3 is in the most
kerb renewal. There is an approaching challenge in renewal funding caused by ageing assets (those reaching
the end of their useful lives) which this plan attempts to identify and address. This is evident when
observing the elements above the red line in Figure 1.6.3
Maintenance and Operations funding appears to have been low and will need to be increased to account for
to projects renewal requirements for this asset class.
1.6.3 Projected Operating and Capital Expenditure
1.7 Demand Management
The future growth areas and the areas of specific interest are a result of population increase driving traffic
volume increases in Township centres, and the resulting increase in patronage at facilities that Council
provides and general parking for business activity in the townships.
The demand for increased car parking assets, like for road assets, is related to car usage. Most
metropolitan areas are looking to support working from home or alternative transport modes such as using
bicycles, walking, or using public transport as an alternative to building more and more car parking assets.
Council does not have a formal Demand Management Plan, as more data on demographics needs to be
collected to review the impacts and pressures of population growth on its transport network. Like most
rural towns, the low population outside the towns and the distances to employment and shopping, does
not lend itself to easily implementing/supporting these mode shift options.
This CAMP is not designed to articulate Council’s transport strategy in this manner, however it includes
consideration where appropriate such as:
Incorporating and accommodating bicycle and public transport as priority in all renewal
designs and upgrades as resources allow.
Consideration of the pricing of parking to modify demand.

Pg. 11
1.8 What does it Cost?
The projected outlays necessary to provide the carpark assets covered by this CAMP which includes
operations, maintenance, renewal and the upgrade of existing assets over the next 10 year planning period
is on average $463,000 per year.
The funding allocated for this period is on average $172,000 per year which includes capital expenditure
for new and upgrade projects, maintenance, operations and an allowance for renewal based on the financial
depreciation of the road assets. This is a funding under-allocation on average of $290,000 per year,
generated primarily from the practice of allocation for annual renewal expenditure based on the annual
depreciation and/or historical allocation of funds rate rather than calculated renewal requirement. Planned
improvement to maintenance management will aid data collection that will more clearly delineate the
expenditure between that spent of roads and that spent on carparks. This will allow finer understanding of
the modelled shortfall.
1.9 What we will do
Council will provide support the Carpark network through the following:
Maintain current funding levels for operations, maintenance, and renewal of pavements, surfaces
and kerb to meet the current level of service;
Seek funding to undertake upgrade of carpark assets where capacity shortfalls have been identified
in the existing system; and
Maintain critical carpark assets as a high priority.
1.10 What we cannot do
Council is not responsible for increasing the level of service of the existing network where the community
has increasing expectations and where the pre-existing asset conditions are at an acceptable standard for
the time of construction, safe and are within design capacity.
This plan currently does not include assets associated with Latrobe Regional Airport, caravan parks at
Hazelwood, Moe, and Lake Narracan as well as the Hyland Highway Landfill. The information on these
assets will be collected as resources permit until which time the assets will remain under the care and
control of the management of these business units.
1.11 Managing the Risks
There are risks associated with providing the service and not being able to complete all identified activities
and projects with the resource available to Council.
We have identified the major risks as:
Non representative asset degradation curves which potentially may lead to poor decision-making
and ‘looseness’ in the funding calculation for maintenance and renewals;
We will endeavour to manage these risks, within funding constraints, by:
Conducting regular condition audits and site inspections to determine the remaining useful life of
assets and maintenance requirements. This includes adherence to Australian Standards and best
practice notes as produced by IPWEA;
Continued effort to rationalise collected data and improved processes to ensure data completeness
and accuracy; and
Request funding for renewals as required and to monitor trends of maintenance requirements and
techniques.

Pg. 12
1.12 Confidence Levels
This CAMP is based on a HIGH level of confidence in the data. Primarily as the database has been
developed incrementally over some 25 years, and the current data set has been created from a variety of
sources generally with a HIGH degree of accuracy. The data has been tested and has been provide a
proven to HIGH level of completeness and accuracy.
There is confidence in the calculation of the financial information is also HIGH; the results are based on
asset quantities with HIGH confidence and asset age with HIGH to MODERATE confidence. This plan
has incorporated asset condition as assessed by independent third party provider who is an expert in this
field. The condition has been used to determine remaining useful life, providing a high level of confidence in
the financial predictions.
1.13 The Next Steps
The actions resulting from this asset management plan are to:
Continue to improve asset data;
Increase staff awareness surrounding the importance of maintaining an up to date and accurate
carpark asset information for inclusion into future revisions of this CAMP; and
Implement the CAMP improvement plan as time and resources allow.
1.14 Key Issues:
Excluding supply or capacity, the most common issues raised by the community are requests to upgrade
existing unsealed carparks to sealed construction. Table 1.14.1 highlights the sections of the carpark
network generating community requests for sealing.
Table 1.14.1 highlights the sections of the road network generating community requests for sealing.
Table 1.14.1: Components of the Carpark Network at risk of Requests for Increased Service Level
Network Component & Adjacent
land-Use
Co
mm
ercial
Co
mm
un
ity
Edu
cation
Ind
ustrial
Op
en
Space
Re
creatio
n
Re
siden
tial
Ru
ral Living
Tou
rism
Total (sq.m)
Sealed 65,371 19,420 8,952 3,601 4,825 26,751 10,144 0 324 139,387
Unsealed 6,519 10,447 3,006 2,652 3,617 4,432 1,855 863 1,650 35,041
Sealing Cost $000’s
186 298 86 76 103 126 53 25 47 1,000
Total (sq.m) 71,890 29,867 11,958 6,253 8,442 31,183 11,999 863 1,974 174,428
Sections of the carpark network that are likely to generate requests for upgrading through sealing of
currently gravel surfaced carparks amounts to 35,041 sq.m of carparks (shown highlighted orange). Sealing
these carparks would cost of the order of $1.0M dollars.

Pg. 13
2 INTRODUCTION
2.1 Background
This Carpark Asset Management Plan (CAMP) aids responsive management of assets (and services the
provided from assets), compliance with regulatory requirements and communicates renewal, operating and
maintenance funding needs to provide the required levels of service over the forward planning period.
2.2 The purpose of the Road Asset Management Plan
2.2.1 The purpose of the CAMP
The fundamental purpose of an asset management plan is to demonstrate good long-term strategic
management in the context of:
Council’s available financial and human resources;
The community’s desired levels of service is in accordance with Council’s key strategic documents,
meets legislative.
The CAMP achieves this by setting standards, service levels and programs which Council will develop and
deliver. The standards and service levels have been set in accordance with user needs, regulations, industry
practice and legislative codes of practice.
2.2.2 The relationship of the CAMP with the Road Management Plan
The Road Management Act provides a legal framework for the management of the public road network.
The Road Management Act imposes specific statutory duties on road authorities to inspect, repair and
maintain to a reasonable standard those roads that form part of the public road network. It further obliges
Council to document and make public its approach to managing its responsibilities under the Act in a Road
Management Plan (RMP).
There is at times a confusion of purpose between the transport asset management plans and the RMP. The
RMP however, speaks only to the maintenance and risk management aspects of being a Road Authority
under the Road Management Act 2004. The CAMP, among other things is focused on good overall
strategic management in terms of providing a carpark network, such as future demand, planning, community
levels of service and so on.
This CAMP includes, where Council is the responsible road authority:
Carpark Road pavements;
Carpark Road surfaces; and
Carpark Kerbs and Channel.
For clarity in considering this plan, assets not considered in this CAMP are:
On-road carparks where the pavement is shared with the road – these are included in the
Road Asset Management Plan;
Multi-storey carparks - these are included in the Building Asset Management Plan;
Vehicular Crossings – these are the responsibility of the property owner; and
Private car parks – these are the responsibility of the private owners.

Pg. 14
2.3 CAMP Stakeholders
Council recognises varying needs of external and internal stakeholders depending on whether these
stakeholders are the business community, residents, or visitors and they include:
Table 2.3.1: External Key Stakeholders
External Key Stakeholder
Community and general users
Local Businesses
Transport Businesses
Tourists and visitors – as occasional users
Management Committees of the built and open space environment
Tourists and visitors – as occasional users
VicRoads
Developers
Council’s Insurer
State and Federal Government
Council’s organisational structure for service delivery from infrastructure assets is detailed below. The
functions that have been identified in the Asset Management Strategy 2014-2018 are not fully reflected in
the organisational structure.
The following table represents the Latrobe City Council positions implementing asset management
throughout the asset life cycle.
Within Latrobe City there are internal stakeholders that either have responsibility for the delivery of
transport assets or deliver services to our community that depend upon transport assets. The core
organisation structure of those stakeholders is presented in Figure 2.4.2 with detail of their role outlined in
Table 2.4.3. More detailed outline of responsibilities throughout an assets life-cycle is presented in Figure
2.5.4.

Pg. 15
Figure 2.3.2: Organisational Structure Chart
Key internal stakeholders and their role in asset management are outlined in Table 2.4.3.
Table 2.4.3: Key Internal Stakeholders
Internal Key Stakeholder Role in Asset Management Plan
Councillors Represent the needs of community/stakeholders, allocate resources to
meet the organisation’s objectives in providing services while managing
risks, ensure organisation is financially sustainable.
CEO/General Manager Overall stewardship and responsibility to provide the support
structure and resources to allow adequate management of the road
assets.
Manager Infrastructure
Development
Manage strategic planning, construction of new, and renewal of existing
assets.
Coordinator Infrastructure
Planning
Provide support and undertake strategic asset planning.
Team Leader Asset Strategy Coordinate strategic planning activities and maintain road data.
Asset Assessment Officers Data collection, condition reporting and spatial location of assets.
Manager Operations and Waste Manage reactive and planned asset maintenance.
Co-ordinator Infrastructure
Maintenance
Provide support and guidance to reactive and programmed routine
maintenance.
Team Leader Sealed Roads and
Team Leader Unsealed Roads
Inspect and respond to reactive maintenance requests and undertake
routine maintenance.
Road Crews Respond to reactive maintenance requests and undertake routine
maintenance.
Council Business Units
Responsible for operational delivery, local laws enforcement and land
use / development planning.
Council
Chief Executive
General Manager, Infrastructure and Recreation
Manager, Operations and Waste
Coordinator Infrastructure Maintenance
Team leader Seald Roads
Team Leader Unsealed Roads
Manager Infrastructure Development
Coordinator Infrastructure Planning
Team Leader Asset Strategy and 2 Asset Assessment Officers
Coordinator Civil Works

Pg. 16
Figure 2.3.4: Organisational Asset Management Structure/Roles
Service & Asset Function Division Department Position Formalised in
Organisational Structure
Service Owner IR IR GM IR No
Service Provider IR Infra Dev Mgr Infra Development No
Service Planner Off-street Renewal
IR Infra Dev Mgr Infra Development No
Service Planner Off-street New/Upgrade
Dependent upon service owner using
carpark
Dependent upon service owner using
carpark
Dependent upon service owner using carpark (ie childcare, recreation etc)
No
Service Planner – On-street IR Infra Dev Mgr Infra Development No
Asset Owner IR Infra Dev Mgr Infra Development No
Asset Provider IR Infra Dev Mgr Infra Development Yes
Asset Designer IR Infra Dev Co-ord Infra Design Yes
Construction Supervisor IR Infra Dev
Co-ord Civil Works Projects Yes
Civil Engineers Yes
Team Leader Development Yes
Co-ord Major Projects Yes
Data Collector IR Infra Dev Asset Assessment Officer Yes
Data Manager IR Infra Dev Team Leader Asset Strategy Yes
GIS IR Infra Dev Asset Assessment Officer Yes
Risk Inspector IR Infra Ops Manager Operations and Waste No
Asset Condition Inspector IR Infra Dev Asset Assessment Officer Yes
Emergency Maintenance IR Infra Dev Team Leader Sealed Roads Yes
Team Leader Unsealed Roads Yes
Reactive Maintenance IR Infra Dev Not Allocated to position No
Co-ord Infrastructure Planning Yes
Programmed Maintenance Provider
IR Infra Ops Not Allocated to position No
Asset Planner IR Infra Dev Co-ord Infrastructure Planning Yes
Financial Planner Corp Services Finance Mgr Finance No
Asset Accountant Corp Services Finance Mgr Finance No
Asset Renewal Designer IR Infra Dev Co-ord Infra Design Yes
Asset Renewal Supervisor IR Infra Dev
Co-ord Civil Works Projects Yes
Civil Engineers Yes
Team Leader Development Yes
Co-ord Major Projects Yes

Pg. 17

Pg. 18
2.4 Goals and Objectives of Asset Management
The organisation exists to provide services to its community. Some of these services are provided through
infrastructure assets. Council has acquired infrastructure assets by ‘purchase’, through construction by our
staff or through contract, and by gifting of assets constructed by developers and others to meet increased
service provision.
Our goal in managing infrastructure assets is to meet the defined level of service (as amended from time to
time) in the most cost effective manner for present and future users.
The key elements of infrastructure asset management are:
Providing a defined level of service and monitoring performance;
Managing the impact of growth through demand management and infrastructure investment;
Taking a lifecycle approach to developing cost-effective management strategies for the long-term
that meet the defined level of service;
Managing risks associated with asset failures;
Having a long-term financial plan which identifies required, affordable expenditure and how it will
be financed; and
Continuing improvement in asset management practices.
2.5 Plan Framework
Key elements of this plan are:
Future demand and how this will impact on future service delivery, and how this is to be met;
Specifying the level of service for carparks, to what standard carparks will be built, when carparks
will be maintained and renewed;
Lifecycle management that outlines how Council will manage its existing and future assets to
provide the defined levels of service;
Financial summary of what funds are required to provide the defined services;
Monitoring of the plan to ensure it is meeting organisation’s objectives; and
The implementation of an Asset Management Improvement Plan (Appendix H).
2.6 Core and Advanced Asset Management
This CAMP is prepared as a ‘core’ asset management plan in accordance with the International
Infrastructure Management Manual. It is prepared to meet minimum legislative and organisational
requirements for sustainable service delivery and long term financial planning and reporting. Core asset
management is essentially where the level of service is not analysed against community expectations or
Council’s ability to fund different service delivery strategies.
Future revisions of the CAMP will move towards ‘advanced’ asset management using a ‘bottom up’
approach, gathering asset information for individual assets inclusive of asset condition to support the
optimisation of activities and programs to meet agreed service levels in a financially sustainable manner.

Pg. 19
2.7 Community Consultation
Future revisions of the AMP will incorporate community consultation on service levels and costs of
providing the service. This will assist the Council and the community in matching the level of service
needed by the community, service risks and consequences with the community’s ability and willingness to
pay for the service.
To elaborate the ‘core’ AMP does not attempt to:
Optimise decision making; and
Balance community expectation of levels of service to Council’s ability to fund.

Pg. 20
3 LEVELS OF SERVICE
3.1 Customer Research and Expectations
The organisation has not carried out any research on customer expectations. This will be investigated for
future updates of the CAMP or as part of Service Provision planning. An example of this is the provider of
the service or services operating at that location will need to identify if there is a sufficiency of parking.
With respect to the condition of the carpark the general service levels applied to the hierarchy of the
adjacent road will be adopted until a clear hierarchy of carparks is established.
The levels of service developed for this plan are based on current adopted technical levels of service that
have been the experience of Council in delivering the service and responding to community requests and
complaints.
3.2 Strategic and Corporate Goals
This CAMP is prepared under the direction of the organisation’s vision, mission, goals and objectives.
Our Objectives are to:
Improve the liveability and connectedness of Latrobe City;
Ensure that Council operates openly, transparently and responsibly.
Our Strategies are to:
Develop council’s long term financial plan and asset management plan to ensure that Council remains
financially sustainable; and
Provide services, infrastructure and advocacy to support health, well-being and safety of our community.
Relevant organisational goals and objectives and how these are addressed in the CAMP are included in
Table 3.2.
Table 3.2: Organisational Objectives and strategies to be addressed in this Plan
Strategies
Objectives
Improve liveability and
connectedness of Latrobe City
Ensure Council Operates openly,
transparently and responsibility
Develop Council’s long term
financial plan and asset
management plan to ensure
that Council remains
financially sustainable.
YES
Provide services,
infrastructure and advocacy to
support health, well-being and
safety of our community.
YES

Pg. 21
The organisation will exercise its duty of care to ensure public safety is accordance with Council’s risk
management policies. Management of infrastructure risks is covered in Section 5.2.
3.3 Legislative Requirements
The organisation will meet legislative requirements including Australian and State legislation and regulations.
These are included in Table 3.3.1.
Table 3.3.1: Legislative Requirements
Legislation Requirement
Local Government Act 1989 Sets out role, purpose, responsibilities and powers of local
governments.
Road Management Act 2004 Relates to management of roads
Subdivision Act 1988 and
Subdivision Regulations
(Procedures) 1989
Sets out the requirements for the provision of infrastructure
resulting from development.
ResCode Specifies infrastructure requirements and standards for urban
development.
Environment Protection Act
1970
Relates discharge, emission or deposit of any substance that
may pollute any segment or element of the environment
Emergency Management Act
1986
Requires a council to have a Municipal Emergency Management
Plan to address local emergency risks.
Occupational Health and Safety
Act 2004
Applicable to working on infrastructure assets.
3.4 Community Levels of Service
Service levels are defined in two terms, community levels of service and technical levels of service.
Community Levels of Service measure how the community perceives the service and whether the
organisation is providing community value.
The organisation’s current and expected community service levels are detailed in Tables 3.4.1 and 3.4.2.
Both tables show the agreed expected community levels of service based on resource levels in the current
long-term financial plan and non-structured community consultation/engagement.
The community level of service has been developed over many years as a result of community feedback,
consultation. With respect to the surface, pavement and kerb condition, the levels of service defined in this
section will:
Clarify the level of service that our community should expect;
Identify works required to meet these levels of service;
Identify the costs and benefits of the services offered;
Enable Council and our community to discuss and assess the suitability, affordability and equity
of the existing service level and to determine the impact of increasing or decreasing the level
of service in future.
With respect to the provision of parking for a facility or for general parking within a township being the
combination of on-street car parking and off-street car parking opportunities provided by Council for the
general use of the community when visiting a township.

Pg. 22
This Asset Management Plan does not have the sophistication to predict the adequacy of service provision.
Specific parking studies have been undertaken to inform the adequacy of service provision.
The primary purpose of the carpark network is to provide safe, convenient and mostly all-weather
accessible car parking so the community can visit adjacent properties. The community also desires that the
access be clean, comfortable, and aesthetically pleasing. These same principles apply to the associated
provision of the car parking.
The following tables define existing community expectations of transport service levels given due regard to
the medium term strategic goals and objectives in the current Council Plan.
Council currently receives feedback from the community from the following various sources:
Benchmarking with like Councils;
Pathways Request – customer requests and reactive asset complaints; and
Annual Local Government Community Satisfaction Surveys.
Table 3.4.1 is to be read in conjunction with Table 3.5.
Table 3.4.1: Community Level of Service
COMMUNITY OUTCOMES
The provision of a road network that:
AMENITY - allows trouble free access of properties and links communities;
SAFE - allows safe travel including vehicle parking;
DRIVABILITY – trouble free smooth travel;
ECONOMIC - enhances the movement of freight/promotes economic development.
COMMUNITY LEVELS OF SERVICE
Asset
Component Asset Type Community Level of Service Community Service Measure
Carpark All types All weather access no dust/mud Amenity/economic
Access road
ancillary to the
carpark
All types All weather access, no dust/mud Amenity/economic
Carpark:
Township
General parking in
townships
To be generally available within 200 m of
desired destination.
Amenity
Carpark:
Facility
Off-street parking
associated with
community
facilities
To be generally available within 150 m of
desired destination.
Amenity
Council’s performance against the community levels of service will be monitored to the extent that is
practical through the performance measures as outlined in Table 3.4.2 and 3.5.
A general rule of thumb is that motorists searching for car parking will consider that the area is full if there
is less than 15% of the spaces empty. Generally there will always be a car parking space available, but it
may not be at a location that the motorist considers to be an acceptable walking distance from their
planned destination. Acceptable distance is a difficult measure to quantify some people get disgruntled if

Pg. 23
they cannot park within 30m of their destination while other people are content to walk 200m to 500m
depending on the requirement to carry goods.
Council must decide what that distance is and how often a motorist will be obliged to walk that distance.
It would be imprudent to distil the various views and opinions before including such conclusions into this
Asset Management Plan
The Complementary Parking Measures Assessment indicates that generally, except for peak times that
adequate parking exists within the key central business districts of the three major towns. Provision of
more car parking cannot be identified within this plan as it requires considerable research including
understanding the service level that the community desires and what they are prepared to pay to receive
that level of service..
Table 3.4.2: Community Level of Service Measures
Community Service
Measure Performance metric
Current
Performance Target performance
Safety
Crash statistics
Number of safety related Pathways requests resulting in safety improvements.
To be determined (Improvement Plan action)
To be determined (Improvement Plan action)
Driveability “Know Your Council”
community satisfaction survey
50 55
Amenity “Know Your Council”
community satisfaction survey
50 55
Economic Number of Pathways
relating to economic efficiency.
To be determined (Improvement Plan action)
To be determined (Improvement Plan action)
3.5 Technical Levels of Service
Supporting the community service levels are operational or technical guidelines to the level of service.
These technical measures relate to the allocation of resources to service activities that the organisation
undertakes to best achieve the desired community outcomes and demonstrate effective organisational
performance.
Technical service measures are linked to annual budgets covering:
Operations – the regular activities to provide a functioning carpark network, which involves
services such as street sweeping, rubbish removal and the provision of street lighting.
Maintenance – the activities necessary to retain an asset as near as practicable to an appropriate
service condition (e.g. cleaning of refuse/rubble, removing tree roots, replacing cracked pit lids,
repairing potholes). Maintenance is generally divided into reactive maintenance and routine
maintenance.
o Reactive maintenance is generally as a response to community requests and scheduled
road/carpark inspections undertaken in compliance with the Road Management Plan (RMP).
The need for maintenance action is generally assessed against the intervention levels as
outlined in the RMP.

Pg. 24
o Routine maintenance comprises of planned activities to maintain the serviceability of the
transport network and includes such actions as grading, culvert cleaning and table drain
cleaning.
Renewal – comprises capital works that return the service capability of an asset to its original status
at the time of it reaching the end of its useful life.
Upgrade – comprises capital works undertaken to provide a higher level of service than that which
the asset was originally build to deliver, a road sense this may include the provision of kerbing that
was not originally provided or sealing a previously unsealed road. This plan does not consider
funding for upgrading the existing carparks.
New – capital works undertaken to provide a new asset which in turn provides a new service of
the grouped with expansion which is capital works that expanded level of service able to be
provided. This plan does not consider funding for new carparks.
Table 3.5 shows the technical level of service expected to be provided under this CAMP. The agreed
sustainable position in the table documents the assumed current position of Council based on existing and
past practice. Further development of this Plan will include/consider community consultation and trade-off
of service levels performance, costs and risk within resources available in the long-term financial plan.
Some of the maintenance activities are delivered through the implementation of the RMP. These are
reactive actions such as repairing potholes that deliver a smooth running-surface as opposed to planned
activities such as carpark surface reseals which is a renewal of the running surface at the end of the sealed
surface expected useful life and delivers a smooth running-surface over the longer term.
3.5.1 The provision of Reconstructed (Asset Renewal), Upgraded and New Assets.
The CAMP is based on asset modelling which uses asset condition projected forward through time to the
forecast point at which the asset reaches the end of its useful life. These activities are funded wholly by
Council under specific renewal programs such as:
o Kerb Replacement Program;
o Gravel Road Re-sheet Program;
o The Road Reseal and Asphalt Overlay Programs; and the
o Road Rehabilitation Program.
The projected funding requirements for the component of these programs as related to carparks are
included in this CAMP. Most new assets and upgraded assets are provided through development activity,
after which the assets are gifted to Council.
Other upgrading of assets such as the sealing of unsealed carparks will be funded through Council allocation
and contribution from adjacent property owners that are the primary beneficiaries of the upgrade, typically
the property owners adjacent to a carpark being upgraded. Prioritising these projects and the contribution
required by property owners is undertaken under the guidelines of the Special Charge Scheme Policy.
Generally Council will fund the community portion of such an upgrade and the property owners the
remainder. The current policy is not explicit about contribution mechanism for carparks but for certain
carparks there are clear special benefits to nearby properties and businesses.
Unsealed carparks which have been constructed by others on public road reserves and not identified in
Council’s Register of Public Carparks 1will not be considered for maintenance and/or upgrading by Council.
1 Council’s Register of Public Carparks is currently in development

Pg. 25
However, Council may accept responsibility for these carparks should they be constructed to Council’s
current standards by developers, committees of management or adjoining property owners.

Pg. 26
Carpark Asset Management Plan 2017
Table 3.5: Technical Levels of Service
TECHNICAL LEVELS OF SERVICE – Non- Road Management Plan
Service Attribute Focus Tactical Performance
Measure Strategic Performance Measure Current Performance Future Actions
All Weather Access Amenity N/A Re-sheet Program delivery Program delivered Set performance targets
Smooth Running Surface Amenity N/A Reseal & Re-sheet Program delivery Program delivered Set performance targets
Potholes Safety RMP delivery N/A To be determined Set performance targets
Slipperiness Safety RMP delivery Reseal Program delivery Program delivered Set performance targets
Corrugations Safety RMP delivery N/A To be determined Set performance targets
Clear Line Marking Safety RMP delivery Line Marking Program delivery To be determined Set performance targets
Clear Regulatory Signage Safety RMP delivery N/A To be determined Set performance targets
Clear Directional Signage Amenity RMP delivery N/A To be determined Set performance targets
Urban Street Lighting Amenity N/A Requests of substance To be determined Set performance targets

Pg. 27
Carpark Asset Management Plan 2017
Table 3.5a - Road Management Plan response codes and relevant response times
TECHNICAL LEVELS OF SERVICE – Road Management Plan Response Codes
Response Code Control Mechanism Response Time
ER Inspect and rectify if possible, or provide appropriate warning Within 2 hours of inspection notification
A Inspect and rectify if possible, or provide appropriate warning Within 1 day of inspection notification
B Inspect and rectify if possible, or provide appropriate warning Within 2 days of inspection notification
C Inspect and rectify if possible, or provide appropriate warning Within 5 days of inspection notification
D Inspect and rectify if possible, or provide appropriate warning Within 2 weeks of inspection notification
E Inspect and rectify if possible, or provide appropriate warning Within 4 weeks of inspection notification
F Inspect and rectify if possible, or provide appropriate warning Within 8 weeks of inspection notification
G Inspect and rectify if possible, or provide appropriate warning Within 12 weeks of inspection notification
H Inspect and rectify if possible, or provide appropriate warning During routine annual maintenance

Pg. 28
Carpark Asset Management Plan 2017
Table 3.5b – Road Management Plan Technical Level of Service (Adopted August 2017)
TECHNICAL LEVELS OF SERVICE – Road Management Plan Intervention Levels – table 1 of 3
Defect Code Description of Defect and Intervention Level Response Times (Refer Appendix E)
RMC1 RMC1 RMC3 RMC4 RMC5
Table 3. 9.0 Off Street Carparks
COA Defective pedestrian areas with a step greater than 30mm N/A N/A D D N/A
COV Vegetation over pedestrian areas of carparks, intruding into a minimum of 2.1m height clearance over pedestrian areas.
N/A N/A D E N/A
CPS Sealed Pavement defects (i.e Potholes >300mm in diameter and greater than 75mm deep. ) N/A N/A
D D N/A
CPU Unsealed Pavement defects (i.e Potholes >500mm diameter and 100mm deep ) N/A N/A
E E N/A

Pg. 29
Carpark Asset Management Plan 2017
3.5.2 Construction Standards for Reconstructed (Asset Renewal), Upgraded and New Assets.
New carparks that will be provided are in accordance with:
o The Infrastructure Design Manual (IDM);
o Council’s design standards; and
o Relevant Australian Standards.
Council has endorsed adopting the IDM to communicate its road and carpark construction standards.
These standards take into account user requirements relating to operational comfort, convenience, safety
and the funding resources available to Council.
It is not intended that all existing roads and carparks will be upgraded to comply with these adopted
Standards, however any new work will be constructed to the desirable Standard, where practicable. In
instances where adopted standards cannot be achieved, professional judgement and industry best practice
will be adopted. Renewal works will endeavour to increase the standard to meet the IDM standards but is
subject to funding and what is practical within the existing road/carpark environment.

Pg. 30
Carpark Asset Management Plan 2017
4 FUTURE DEMAND
4.1 Demand Drivers
Demand drivers affecting demand include population change, changes in demographics, seasonal factors, consumer
preferences and expectations, technological changes, economic factors, agricultural practices, environmental
awareness, to ensure Council’s road and carpark network meets future service provision levels Council must
consider primarily:
Population changes – e.g. developments, general densification or otherwise;
Changes in traffic patterns arising from changing demographics, businesses, changes in the VicRoads
network such as the Traralgon Bypass; and
Changes to vehicle specifications (increasing vehicle size among the SUV sector).
4.2 Changes that Impact Service Provisioning (i.e. the amount of carpark required)
4.2.1 Industry Changes
The recent closure of the Hazelwood Power generation facility will have an isolated short term impact on the
economy however this is not considered to have a general impact on carpark demand. Changes to the
transportation network (including carparks) associated with the industry changes are predicted to be minor or
limited to isolated locations.
4.2.2 Population Changes
Projections by the Australian Bureau of Statistics indicate that should Latrobe City continue to experience
current growth trends that the population be approximately 84,000 by 2030.
The majority of this growth is forecast to be concentrated within the Traralgon area and hence it is expected that
population pressures and the flow on impacts for the demand for car parking will be most felt in Traralgon.
4.2.3 New Developments and increased business demand
Growth is typically governed by new development, by general increase in population (and the resulting increase in
motorists), and less so by social change (more walking and bicycling), though the potential of changing social
norms with respect to the provision and cost of providing car parking should be considered.
Generally, developers are obliged to provide car parking required to meet the needs of their business. Council
has endorsed a reduced obligation on businesses and this will manifest itself in an increased demand on Council to
provide carparks, either on-street or to build new carparks. There can be at times, impacts on the adjacent
transport network not directly attributable to a developer, or logic dictates that a carpark needs to be developed
to support a development. Provision of car parking for the Latrobe Performing Arts Centre for example may
result in the development of additional parking
4.2.4 Current Carpark Asset Utilisation
4.2.4.1 On-street
There are some commercial blocks with the central business districts of the major towns where the on-street car
parking is congested at peak times. The Complementary Parking Measures Assessment (CPMA) distilled and
repeated earlier studies to determine that in the townships of Moe, Morwell, and Traralgon, on-street car parking
demand was approximately as shown in Table 4.2.1.
It is important to consider that the on-street car parking within a CBD will never meet peak demand all the time.
The concentration of businesses, if successful will attract more customers than there is road space in front of the
Pg. 31
Carpark Asset Management Plan 2017
shops. During peak times motorists will need to park “down the block”. For the most part as long as there is a
more than 85% chance to find parking within 200 m (approximately 2 minutes’ walk) of the desired destination,
most motorists would consider this acceptable.
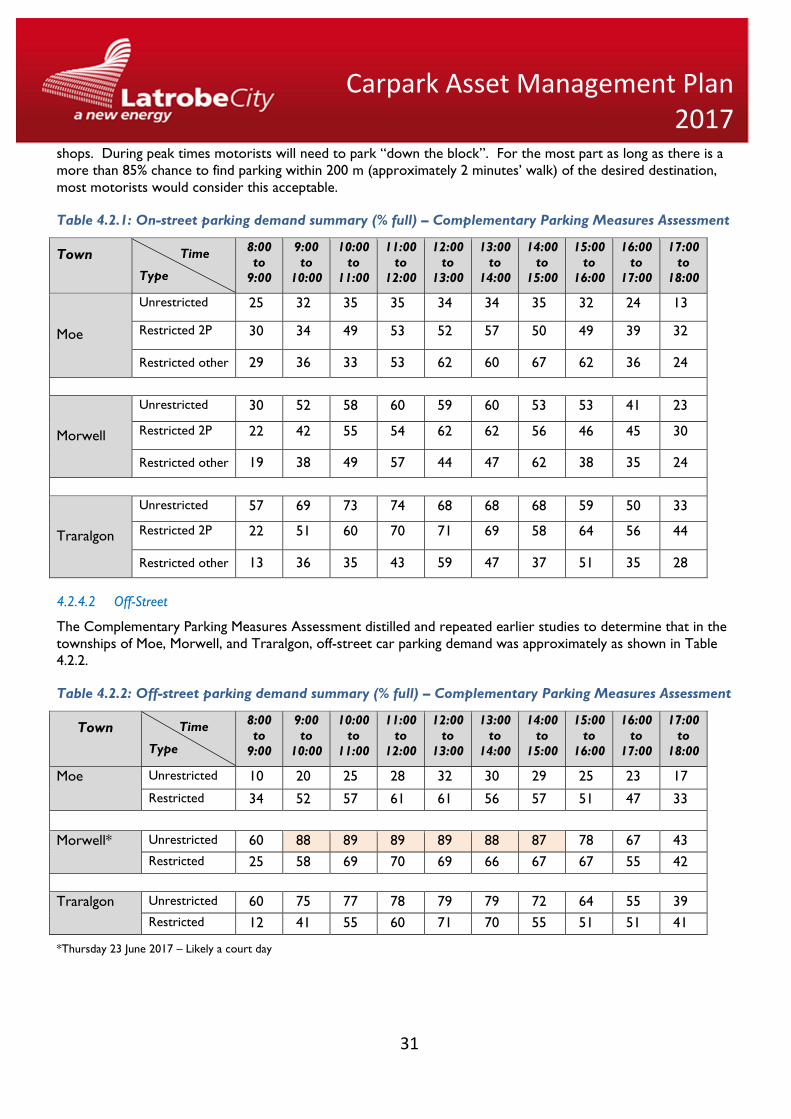
Table 4.2.1: On-street parking demand summary (% full) – Complementary Parking Measures Assessment
Town Time
Type
8:00
to
9:00
9:00
to
10:00
10:00
to
11:00
11:00
to
12:00
12:00
to
13:00
13:00
to
14:00
14:00
to
15:00
15:00
to
16:00
16:00
to
17:00
17:00
to
18:00
Moe
Unrestricted 25 32 35 35 34 34 35 32 24 13
Restricted 2P 30 34 49 53 52 57 50 49 39 32
Restricted other 29 36 33 53 62 60 67 62 36 24
Morwell
Unrestricted 30 52 58 60 59 60 53 53 41 23
Restricted 2P 22 42 55 54 62 62 56 46 45 30
Restricted other 19 38 49 57 44 47 62 38 35 24
Traralgon
Unrestricted 57 69 73 74 68 68 68 59 50 33
Restricted 2P 22 51 60 70 71 69 58 64 56 44
Restricted other 13 36 35 43 59 47 37 51 35 28
4.2.4.2 Off-Street
The Complementary Parking Measures Assessment distilled and repeated earlier studies to determine that in the
townships of Moe, Morwell, and Traralgon, off-street car parking demand was approximately as shown in Table
4.2.2.
Table 4.2.2: Off-street parking demand summary (% full) – Complementary Parking Measures Assessment
Town Time
Type
8:00
to
9:00
9:00
to
10:00
10:00
to
11:00
11:00
to
12:00
12:00
to
13:00
13:00
to
14:00
14:00
to
15:00
15:00
to
16:00
16:00
to
17:00
17:00
to
18:00
Moe
Unrestricted 10 20 25 28 32 30 29 25 23 17
Restricted 34 52 57 61 61 56 57 51 47 33
Morwell* Unrestricted 60 88 89 89 89 88 87 78 67 43
Restricted 25 58 69 70 69 66 67 67 55 42
Traralgon Unrestricted 60 75 77 78 79 79 72 64 55 39
Restricted 12 41 55 60 71 70 55 51 51 41
*Thursday 23 June 2017 – Likely a court day

Pg. 32
Carpark Asset Management Plan 2017
The level of stress except for Morwell – Off Street Unrestricted is still below impacts experienced within
business precincts of a large city and below the generally accepted norm of 85% occupied being the trigger to
consider action.
It is noted that the survey date for Morwell was a Thursday and likely impacted by court being in session it
warrants analysis. It should be noted though; that the Unrestricted on-street demand is in the order of 60%,
indicating that a motorist can still find an unrestricted parking space should they be willing to walk from the
fringes.
While roads/carparks are to be assessed as a separate project to identify alternative connectivity and road usage
options, including upgrades and expansions, it should also be noted that aspects of community expectations and
strategies to manage demand should also form part of such investigations.
4.3 Demand Forecast
The present position and projections for demand drivers that may impact future service delivery and utilisation of
assets are documented in Table 4.3.1.
Table 4.3.1: Demand Drivers, Projections and Impact on Services
Demand Drivers Present position Projection Impact on services
Population Changes Leading to ongoing
commercial/residential
development
To remain steady for
the next 10 years
Negligible
Traralgon Growth Area
including northeast and
southwest developments
Leading to ongoing
commercial/residential
development
To remain steady for
the next 10 years
Flow on impacts and
cost to address
network stress issue in
the Traralgon CBD.
Moe North and Morwell
North West
Leading to ongoing
commercial/residential
development
Not to significantly
contribute to gifted
assets in the short-
term.
Negligible
The combined factor for growth used in modelling the financial needs of this plan is 0.1 of one percent. This
includes the estimate for annual gifted assets, commitments under Development Contribution Plans and
contingency for future network upgrades for capacity issues. This forecast will be refined in future revisions of
this CAMP.
The CPMA undertook a comprehensive analysis of the actual parking demand for each of the townships and
predicted the demand into the future. A simplified version of the Table 28 from the CPMA is reproduced in
Table 4.4.3.
Table 4.3.2: Off-street parking demand summary (% full) – Complementary Parking Measures
Assessment
Town Location Type 2016 2021 2026 2031
Moe
On Street Restricted 53 53 54 57
Unrestricted 34 34 35 37
Off Street Restricted 61 61 62 65
Unrestricted 32 32 32 34

Pg. 33
Carpark Asset Management Plan 2017
Town Location Type 2016 2021 2026 2031
Morwell*
On Street Restricted 60 61 62 63
Unrestricted 59 60 61 63
Off Street Restricted 69 70 71 73
Unrestricted 89 90 92 94
Town Location Type 2016 2021 2026 2031
Traralgon
On Street Restricted 76 78 82 87
Unrestricted 55 58 62 65
Off Street Restricted 73 78 82 87
Unrestricted 77 82 87 92
Table 4.3.2 indicates that on the day in question for each township, there is a potential off-street issue in Morwell,
although as noted and can be seen in Table 4.3.2, unrestricted on-street has capacity.
4.4 Demand Management Plan
Demand for new services will be managed through a combination of managing existing assets, upgrading of
existing assets and providing new assets to meet demand and demand management. Demand management
practices include non-asset solutions, insuring against risks and managing asset failures and capacity issues.
Non-asset solutions focus on providing the required service without the need for the organisation to create or
even own the assets and management actions including:
Improve use of existing supply:
Review and configure time restrictions to create parking opportunities;
Review parking restrictions to ensure a good balance between user groups;
Ensure motorists are able to find underutilised parking (wayfinding);
Create parking opportunities through enforcement – compel long term car parkers to park further
from the centre of the CBD or in long term off-street parking areas; and
Encourage compliance through charging for parking – meters ensure that longer term motorists park
away from businesses that have many customers;
Encourage and support non-car use (especially Single Occupant Vehicle (SOV use);
Make non-SOV transport modes pleasant and comfortable, e.g. locating facilities near bus stops or
providing high quality stops and shelters;
Promote/support car sharing (High Occupant vehicles and car sharing); and
Promote bicycle and perhaps motorcycle use due to the smaller impact per motorist.
Simply increasing supply will put a strain on Council’s ability to deliver other services. Therefore the above non-
asset or non-carpark asset related initiatives are the first choice to meet/manage demand. Once these are
expended or at least implemented then exploring providing new infrastructure is applicable.
Future demand increase is inevitable. Population increases (development) and changes to industry operations or
locations will impact the transportation network.

Pg. 34
Carpark Asset Management Plan 2017
Other methods that can be used to manage the future impact on Council’s resources including:
4.4.1 Planning Controls
Society as a whole has recognised that urban sprawl is a negative and is unsustainable. Urban sprawl occurs when
cheaper land on the fringe of an urban area is developed in a way that residents rely on using a motor vehicle for
everyday activities, including in developments shopping centres, schools, or other services in these suburbs can
reduce the demand on the existing road network. Alternatively, population can be accommodated within the
existing developed areas with infill (two lot sub-divisions), higher density renewal (townhouses and apartments in
the CBD). Such changes in the pattern of development can reduce the reliance on private vehicles and
subsequently the demand for car parking.
With respect to car parking, creation of satellite shopping centres near these higher density areas that have basic
services for the local community would increase non-car trips and reduce the impact on the CBD.
A Planning control that can reduce the rate at which the remaining supply is taken up by increased population is
to reconsider the reduced parking rate applied within the Planning Scheme. The parking rate of 100% of the
Column B’ rate is recommended for office use and 75% for all other uses in Morwell and Traralgon. These two
locations are the higher stressed in terms of parking and with the profile of the motorists within the average
country town being very car dependent, Council may wish to reconsider this relaxation.
4.4.2 Managing Motorist Expectations
Most motorists are anxious to park adjacent their destination for free. Historically this expectation has been met
by converting wide boulevards of the main townships into angled parking lots – that is to say, increasing supply to
meet demand. In each of the “Heat Maps” of the Complementary Parking Study there are underutilised areas on
the fringe of the townships. These are usually a 4 or 5 minute walk from the centre of the CBD.
The determination of when to spend large amounts of public money to reduce the inconvenience must eventually
be weighed against the perceived inconvenience. The overuse of motor vehicles is leading to increased
frustration for motorists and other users of our public spaces. Simple strategies such as getting children back to
walking and cycling to school, using the extensive public transport system and simply undertaking a simple trip of
less than 1.5 kilometre either on foot or by bicycle can ease these frustrations and have positive health and social
benefits.
4.5 Asset Programs to Meet Demand
The new assets required to meet growth if rural developments will be acquired free of cost (gifted) from land
developments to 100% for office developments and 75% for all other uses. The remaining 25% of parking for all
other developments will need to be either met through the demand management methods discussed earlier or
constructed/acquired by Council. New assets constructed/acquired by Council are shown below in Figure 4.5.
The cumulative value of new contributed and constructed assets will be further refined in future editions of this
plan.

Pg. 35
Carpark Asset Management Plan 2017
Figure 4.5: Upgrade and New Assets to meet demand not met by others (Cumulative)
Acquiring these new assets will commit the Council to fund ongoing operations, maintenance and renewal costs
for the period that the provision of service from the assets is required. These future costs are identified and
considered in developing forecasts of future operations, maintenance and renewal costs in Section 5.

Pg. 36
Carpark Asset Management Plan 2017
5 LIFECYCLE MANAGEMENT PLAN
The lifecycle management plan details how the organisation plans to manage and operate the assets at the agreed
levels of service (defined in Section 3) while optimising life cycle costs.
5.1 Background Data
In order to estimate operational expenditure and focus planned maintenance activities, a quantitative desktop
analysis has been conducted of available data including the current layers of data featured in the Geographical
Information System (GIS) and Asset Management System (AMS) datasets.
5.1.1 Physical parameters
The assets covered by the CAMP and the associated data accuracy are shown in Table 5.1:
Table 5.1a: Assets covered by this Plan (as at 30 June 2016)
Category Total Category Breakdown % of
Category
Level of
confidence in
Data
Sealed
Carparks 139,387 (m2)
Asphalt Surface 70 HIGH
Bitumen Surface (Spray Seal) 48 HIGH
Concrete & Concrete Paver 2 HIGH
Unsealed
Carparks 35,041(m2)
Gravel Surface 100 HIGH
Natural Surface 0 HIGH
Kerbs 17,632 (m) Kerb on Sealed Carparks 93 HIGH
Kerb on Unsealed Carparks 7 HIGH
Due to a lack of information of suitable accuracy, this plan currently does not include assets listed in the table
below. Future iterations of this plan will be expanded to include these assets.
Table 5.1b: Assets not covered by this Plan (as at 30 June 2015)
Asset Type Status
Latrobe Valley Airport Data collection underway
Moe Caravan Park Business Unit planning
Hazelwood Caravan Park Business Unit planning
Lake Narracan Caravan Park Business Unit planning
Hyland Highway Landfill Business Unit planning
Private Carparks, DELWP and
Parks Vic Roads
Carparks not under the control
of Latrobe City Council
The age profile of the assets included in the CAMP is shown in Figure 5.1.1. Age profile information has been
recorded over many years and was migrated from the original pavement management system into the current
asset management system and reviewed by long serving Council Officers to ensure accuracy. This is considered
to be a quality data set and well suited for the purposes of the plan.

Pg. 37
Carpark Asset Management Plan 2017
The graph in Figure 5.1.1 also shows the total value of the assets for the year acquired or last renewed in each
year values presented are in current day values.
Figure 5.1.1: Asset Age Profile
Due to the size and the spread nature of carpark assets they are only practically viewable on Council’s GIS
system.
5.1.2 Asset capacity
As discussed in Section 4 (Future Demand) and tabulated in Table 4.2.1 and Table 4.2.2, there are a small number
of carparks and areas within townships where the community has expressed concerns about supply. There are
two emerging capacity issues identified in the Complementary Parking Measures Assessment study undertaken in
2016, being the Morwell unrestricted car parking supply and the Traralgon unrestricted and longer term parking
supply.
The performance of the car parks in terms other than number or capacity is acceptable.
Future traffic studies will explore these locations for issues but at this time these locations are listed as suspected
locations as deficient locations, Table 5.1.2 merely defines the perceived situation at this time.
5.1.3 Asset Condition Performance
Condition is known for the majority of carpark assets via asset assessment officer assessment conducted in 2016.
In addition to the condition assessment officers have compiled any known condition based issues and these are
presented in Table 5.1.3a.
Council has a documented “Road Rating Manual” which is available for viewing at Council’s Offices. Full road and
carpark condition inspections of the entire road and carpark network are undertaken on a three to four year
cycle. This also includes assessing the condition of the kerbs.

Pg. 38
Carpark Asset Management Plan 2017
The condition of road assets is measured as follows:
a) Pavements and Road Wearing Surface:
o Measuring the severity and extent of pavement defects
Crocodile cracking;
Linear cracking;
Rutting; and
Deformation.
o Measuring the severity and extent of surface defects
Potholes and other surface repairs
Flushing and or bleeding
Stripping; and
Oxidisation
b) Kerbs:
o Measuring the severities and extents of alignment:
Distortion,
Cracking,
Shape loss
Structural failures
Roll backs; and
Channel deficiencies.
Table 5.1.3a: Known asset condition and other issues
Location Service Deficiency
N/A Nil
Condition has been assessed using a 1 – 5 grading using the IIMM 1 (very good) – 5 (very poor) condition system2
as detailed in Table 5.1.3b.
Table 5.1.3b: Simple Condition Grading Model
Condition
Grading Description of Condition
1 Very Good: only planned maintenance required
2 Good: minor maintenance required plus planned maintenance
3 Fair: significant maintenance required
4 Poor: significant renewal/rehabilitation required
5 Very Poor: physically unsound and/or beyond rehabilitation
Figure 5.1.3c shows the condition profile for carpark assets. The graph shows the total value of assets for each
condition grading where zero value represents asset that are new.
2 IPWEA, 2015, IIMM

Pg. 39
Carpark Asset Management Plan 2017
Figure 5.1.3c: Condition Profile (Average Condition is 2.3)
5.1.4 Asset valuations
Asset valuations are of two types, depending on their application. ‘Greenfields’ based valuation is based on the
cost to construct an asset in an undeveloped area and is required for Asset Valuation Reporting purposes.
‘Brownfields’ based valuation is based on the costs for construction in a developed situation and better reflects
the actual cost to replace established assets and is used to determine the replacement costs for asset planning
purposes. Care has been taken to note which figure is used in this plan.
Assets were last revalued at 30 June 2015. Assets are valued at Fair Value in accordance with AASB13 Fair Value
Measurement. The values listed below are ‘Greenfields’ values with the associated “Brownfield” values presented
for comparison.

Pg. 40
Carpark Asset Management Plan 2017
Table 5.1.4a: Greenfield Financial Asset Reporting values
Latrobe City - CARPARKS Greenfields
Value $000's
Current Replacement Cost $11,736
Depreciable Amount (Residual Value = $0) $11,736
Depreciated Replacement Cost $208
Annual Depreciation Expense $209
Rate of Annual Asset Consumption (Depreciation/Depreciable Amount) 1.78 %
Rate of Annual Asset Renewal (Capital Renewal exp/Depreciable Amount) 0.43 %
Rate of Annual Asset Upgrade 0.00 %
Rate of Asset Upgrade (Including Contributed Assets) 0.01 %
Asset renewals as percentage of consumption 24.0 %
Percentage Increase in asset stock 0.01 %
Figure 5.1.4b: Asset Financial reporting value explanation
Residual
Value
Depreciable
Amount
Useful Life
Current
Replacement
Cost
End of
reporting
period 1
Annual
Depreciation
Expense
End of
reporting
period 2
Accumulated
Depreciation Depreciated
Replacement
Cost
Source: IPWEA
Useful lives were independently reviewed in June 2015 by Assetic Pty Ltd as part of the independent advice for
the asset valuation. Various ratios of asset consumption and expenditure have been prepared to help guide and
gauge asset management performance and trends over time.
On a long-life asset, the rate of Annual Asset Consumption and rate of Annual Asset Renewal can misrepresent
the immediate financial position by reflecting constant renewal when renewal demand does not occur until asset
reach their useful life.
Council plans to renew assets at 24 % of the rate they are being consumed and will be increasing its asset stock
by 0.01% each year.

Pg. 41
Carpark Asset Management Plan 2017
5.2 Infrastructure Risk Management Plan
An assessment of risks associated with service delivery from infrastructure assets has identified some of the
critical risks. The typical risk assessment process identifies credible risks, the likelihood of the risk event
occurring, the consequences should the event occur, develops a risk rating, evaluates the risk and develops a risk
treatment plan for non-acceptable risks.
Road carpark assets play an important role in the transport system that conveys the community throughout the
municipality. Therefore, a failure of the assets will cause potential property and injury risks. Such risks are
heightened when key access is denied to key services and where there is no alternative access.
In order to assess these risks, each road segment asset is assigned a Risk Rating derived from Table 5.2.
Table 5.2: Risk Rating likelihood and consequence criteria and weighting
Likelihood of Failure
Improbable Remote Occasional Probable Frequent
Consequence
of Failure
Negligible Acceptable Acceptable Acceptable Moderate Moderate
Low Acceptable Moderate Moderate High High
Moderate Acceptable Moderate High High Very High
Significant Moderate High High Extreme Extreme
Catastrophic Moderate High Very High Extreme Extreme
Critical risks, being those assessed as ‘Extreme’ - requiring immediate corrective action and ‘ Very High’ –
requiring prioritised corrective action identified in the Infrastructure Risk Management Plan, together with the
estimated residual risk after the selected treatment plan is operational are summarised in Table 5.2.
5.2.1 Risk of road and carpark failure
An assessment of risks3 associated with service delivery from infrastructure assets has identified critical risks that
will result in loss or reduction in service from infrastructure assets or a ‘financial shock’ to the organisation. The
risk assessment process identifies credible risks, the likelihood of the risk event occurring, the consequences
should the event occur, develops a risk rating, evaluates the risk and develops a risk treatment plan for non-
acceptable risks.
Critical risks, being those assessed as ‘Very High’ - requiring immediate corrective action and ‘High’ – requiring
prioritised corrective action identified in the Infrastructure Risk Management Plan, together with the estimated
residual risk after the selected treatment plan is operational are summarised in Table 5.2. These risks are
reported to management and Council.
3 Reference to the Organisation’s Infrastructure Risk Management Plan

Pg. 42
Carpark Asset Management Plan 2017
Table 5.2: Critical Risks and Treatment Plans
Service or Asset at Risk
What can Happen
Risk Rating
Risk Treatment Plan Residual Risk *
Treatment Costs
Traralgon
CBD parking
Restricted
commercial
activity
Med
Continue to monitor the
utilisation rates for
Traralgon CBD car parking.
Low To be
determined
Regional
Airport
Unable to access
parking at the
Regional Airport
in an emergency
High
Review mix of parking an
reserve parking for
emergency services.
Low To be
determined
Impact to carparks is unlikely to create a loss of access to these to critical emergency services facilities but should
be monitored as part of the standard regular inspections.
5.2.2 Insurance
Council has a process to report any incidents and claims that result from roads and carpark incidents when they
occur.
5.3 Routine Operations and Maintenance Plan
Operations include regular activities to provide services such as public health, safety and amenity, e.g. street
sweeping, grass mowing and street lighting electricity and operations costs. For roads and carparks there are few
operational activities. Street sweeping and litter cleaning are the main operation activities undertaken by Latrobe
City.
Maintenance is the regular on-going work that is necessary to keep assets operating, including instances where
portions of the asset fail and need immediate repair to make the asset operational again. Maintenance excludes
rehabilitation or renewal.
Maintenance Management activities include inspection, assessing the condition against failure/breakdown
experience, prioritising, scheduling, actioning the work and reporting what was done to develop a maintenance
history and improve maintenance and service delivery performance.
Maintenance may be classified into Reactive, Planned and Specific maintenance work activities.
Reactive maintenance is unplanned repair work carried out in response to service requests and
management/supervisory directions.
Planned maintenance is repair work that is identified and managed through a maintenance management system
(MMS). This is an area for improvement at Latrobe City.
Specific maintenance is replacement of higher value components/sub-components of assets that is undertaken on
a regular cycle including for roads this would include replacing guideposts, line marking and replacement of minor
culverts.
This work falls below the capital/maintenance threshold but may require a specific budget allocation.
Actual past operational and maintenance expenditure of the following road/transport services is shown in Table
5.3.1.

Pg. 43
Carpark Asset Management Plan 2017
Table 5.3.1: Maintenance Expenditure Trends
Year
Maintenance Expenditure
($000’s)
Sealed Carparks Unsealed
Carparks All Carparks
2013-14 $65,562 $34,418 $99,980
2014-15 $70,796 $38,081 $108,876
2015-16 $71,657 $39,200 $110,856
2016-17 $81,086 $37,185 $118,271
Assessment and prioritisation of reactive maintenance is undertaken by Council officers using experience and
judgement.
Council is advised to allocate annual operations funding to the following projects in Table 5.3.2.
These estimates have been reflected in projected maintenance figures of this plan.
5.4 Asset Hierarchy
An asset hierarchy provides a framework for structuring data in an information system to assist in collection of
data, reporting information and making decisions. The hierarchy includes the asset class and component used for
asset planning and financial reporting and service level hierarchy used for service planning and delivery.
With this in mind, the primary criteria for assigning a hierarchical category is carpark classification, based on
parking demand. While the adjacent roads may be indicative of the importance of an adjacent carpark the
surrounding property usage is likely to weight as a more important factor in categorising carparks. To assist in
the modelling for this CAMP the carparks have been classified as either sealed or not sealed.
To assist in monitoring service delivery and calculating risk, the organisation’s service hierarchy is shown in Table
5.4.
Table 5.4 Road Hierarchy (Definitions and guidance for the road hierarchy is included in the RMP)
Service Hierarchy Service Level Objective
RMP Hierarchy Equivalent Road
Maintenance Class Primary Function
CAR1 RMC3 Sealed Carparks
CAR2 RMC4 Unsealed Carparks:
In future iterations of this CAMP the intention is to review the hierarchy to better reflect the criticality of given
carpark assets. Having a well thought out hierarchy allows effective modelling of the allocation of renewal and
maintenance funding to the more critical assets. For example Council may opt to renew CBD carpark assets at a

Pg. 44
Carpark Asset Management Plan 2017
condition score of 4.5 instead of 5.0 because of the high use and critical nature of these precincts. This body of
work has been identified within the improvement plan attached as Appendix H.
5.4.1 Operations and Maintenance Strategies
The organisation will operate and maintain assets to provide the defined level of service to approved budgets in
the most cost-efficient manner. This is being developed as part of a maintenance management system and the
following proposed/identified activities will be modified as that plan/system develops.
The operation and maintenance activities include:
Scheduling operations activities to deliver the defined level of service in the most efficient manner;
Undertaking maintenance activities through a planned maintenance system to reduce maintenance costs
and improve maintenance outcomes. Undertake cost-benefit analysis to determine the most cost-
effective split between planned and unplanned maintenance activities (50 – 70% planned maintenance
being desirable as measured by cost);
Maintain a current hierarchy of critical assets and required operations and maintenance activities;
Develop and regularly review appropriate emergency response capability; and
Review management of operations and maintenance activities to ensure Council is obtaining best value for
resources used.
Responsive Maintenance (Reactive):
Council repairs and maintains roads and carparks on the basis of defined intervention levels and response times.
The intervention level defines the condition, state or risk level associated with an asset component; it is at that
point in time when the asset is considered to be below an acceptable level of service as assessed by the level of
specific defects. Maintenance is scheduled for when the asset reaches this point. The response time defines a
reasonable time frame within which the community can expect Council to remedy the defect. The intervention
levels and response times are presented in Council’s RMP.
Routine Maintenance (Planned):
Council undertakes planned maintenance activities to proactively correct carpark defects and to ensure that the
carparks do not deteriorate. These funding for the reactive and planned maintenance is budgeted annually.
5.4.2 Summary of future operations and maintenance expenditures
Future operations and maintenance expenditure is forecast to trend in line with the value of the assets as shown
in Figure 5.4.2. Note that all costs are shown in 2017 dollar values (i.e. current values).

Pg. 45
Carpark Asset Management Plan 2017
Figure 5.4.2: Projected Operations and Maintenance Expenditures
Deferred maintenance are works that are identified for maintenance and unable to be funded and are to be
included in future risk assessment and analysis. There are no deferred maintenance works that have been
identified. The maintenance budgets have been held flat for a number of years. Figure 5.4.2 highlights the growth
that is required in maintenance expenditure due to the growth in the road asset base resulting mainly from assets
that are gifted from residential development each year.
Renewal and replacement expenditure is major capital work which does not increase the asset’s design capacity
but restores, rehabilitates, replaces or renews an existing asset to its original or lesser required service potential.
Work over and above restoring an asset to original service potential is upgrade/expansion or new works
expenditure.
5.4.3 Renewal Plan
The data from the asset register has been used to project the renewal costs using current age, condition score
and remaining and degradation relationships to determine remaining useful life and hence the renewal year.
The expected useful lives of assets were last reviewed in 2015 and have been used to develop projected asset
renewal expenditures are shown in Table 5.5.1a and 5.5.1b.
Table 5.5.1a: Useful Lives of Assets (Unsealed Roads)
Asset Class Asset Category Useful life
Unsealed Roads Surface – Gravel
Pavement under Gravel
15 years
45 years
Unsealed Roads Surface – Natural
Pavement – Natural
25 years
25 years
It should be noted that the useful lives used for the CAMP differ from those used in the Valuation. The useful lives
in the CAMP reflect a relationship between surface and pavement to assist in the programming of renewal. For
example, a bitumen carpark will be built then undergo 4 reseals at 15 year intervals before reaching the end of its
useful life 15 years after the last reseal.

Pg. 46
Carpark Asset Management Plan 2017
Table 5.5.1b: Useful Lives of Assets (Sealed Roads)
Asset Class Asset Category Useful life
Sealed Road Surface – Concrete
Pavement Under - Concrete
85 years
85 years
Sealed Road Surface – Concrete Pavers
Pavement under – Pavers
50 years
50 years
Sealed Roads Surface – Asphalt Surface
Pavement under Asphalt
18 years
72 years
Sealed Roads Surface – Bitumen – (Spray Seal)
Pavement under Bitumen
15 years
75 years
Sealed Roads Kerbs 77 years
5.4.4 Renewal and Replacement Strategies
As an asset ages the nature of the maintenance and eventual renewal interventions become greater and hence
more expensive. Figure 5.5.2 portrays condition of an asset throughout is useful life and the nature of
maintenance and renewal interventions.
Figure 5.5.2: Condition and its relationship to intervention
5.4.4.1 Pavement Reconstruction Treatment
The full reconstruction of a road/carpark consists of the replacement of pavement, surface and the kerb and
channel. Often the footpath is also replaced because of level changes (particularly full width footpaths), however,
it is a distinct asset group that has less impact on the integrity of the road than the kerb and channel, and given
the function each serves.

Pg. 47
Carpark Asset Management Plan 2017
Full reconstruction is usually applied where the road/carpark suffers from pavement deformation/shape loss which
usually equates to a Pavement Condition Index (PCI) score of 4 or 5 out of 5 and/or the sub-base has insufficient
pavement depth and/or the carpark has poor kerb and channel.
Reconstruction resets the life of the carpark equivalent to that of a brand new carpark.
5.4.4.2 Pavement Rehabilitation Treatment
In some situations, the reconstruction of a road/carpark may not involve the replacement of the entire carpark
pavement or carpark surface. This is particularly the case where the distress does not involve a pavement that
has extensively failed or one that displays signs of nearing the end of its life. Typically, this might occur in lower
use carparks that carry low volumes of heavy vehicles and the deterioration of the pavement and surface is very
slow.
Pavement rehabilitation is usually applied where the road/carpark suffers from pavement deformation/shape loss
and crocodile cracking is predominately present.
It is important, where roads/carparks are considered for rehabilitation, that all of the options are compared in
terms of their costs and benefits over time. Increasingly, this includes specific testing to better predict the
remaining life of the asset. Ideally, the solution with the best ‘cost benefit’ is selected, although the opportunity to
do this is always subject to the available funding.
5.4.4.3 Road and Carpark Resurfacing Treatments
The selection of a resurfacing treatment for a road or carpark where the surface is no longer functioning as a
waterproofing layer and the pavement is in otherwise good condition is not always straightforward. The
following summaries of broad groupings of treatments are the key ones used in Latrobe.
Strengthening of weak or failed areas should be undertaken before resealing. Strengthening may be excavation of
the surface and pavement to a desired depth (typically 300 mm but dependent on the circumstances, and
backfilled with gravel, usually 2 to 3% cement stabilised, or profiled to between 60 and 80 mm and reinstated with
14 mm type N hot-mix or similar stiff mixture (P&R 60 or P&R 80).
Spray Seals:
Only used where the pavement is sound and the new seal is laid over the existing seal. Usually this treatment is
undertaken because of stripping/stone loss defects, bitumen binder becoming fatty and/or also if surface has
totally oxidised. This treatment is not suitable where major shape loss defects are present or extensive cracking.
A 10 mm seal is the default in urban areas due to the desire to reduce road noise. A 14 mm seal is typical in rural
areas due to the longer life and wearing properties.
Hot-mix Asphalt Overlay to spray sealed road/carpark:
This treatment involves overlaying a 20 mm to 30 mm asphalt surface over an existing sprayed seal surface. This
would be applied when the surface is reaching the end of its life and the underlying pavement is exhibiting
moderate deterioration and/or loss of shape but is otherwise sound.
Hot-mix Asphalt Overlay (renewal):
This treatment involves profiling at least the edge of the existing road and overlaying hot-mix asphalt surface of 25
mm to 30 mm.
Gravel Rehabilitation and Re-sheeting Treatments:
The Road Re-sheeting Program is an annual program that renews gravel road surfaces that have reached the end
of their serviceable lives or suffer from a surface or pavement deficiency.
The types of re-sheeting treatments commonly applied by Council are:

Pg. 48
Carpark Asset Management Plan 2017
100 mm loose (75 mm compacted) depth of B Grade crushed rock, or a 125 mm loose (100 mm compacted)
depth of natural gravel. Sometimes clayey sands are mixed with existing gravel if it is deficient in fines.
Occasionally a 50 mm re-sheet is applied as an intermediate holding treatment, or to treat a localized problem.
Kerb & Channel Reconstruction:
This type of treatment is rehabilitation or repair if applied to minor lengths of the block, or renewal where the
entire length of kerb & channel in the street segment is replaced.
A program is being developed to renew full carpark lengths to satisfactory alignment, or larger lengths of
rehabilitation.
Council will plan capital renewal projects to meet level of service objectives and minimise infrastructure service
risks by:
Planning and scheduling renewal projects to deliver the defined level of service in the most cost efficient
manner;
Undertaking project scoping for all capital renewal and replacement projects to identify;
o the service delivery ‘deficiency’, present risk and optimum time for renewal/replacement;
o the project objectives to rectify the deficiency;
o the range of options, estimated capital and lifecycle costs for each option that could address the
service deficiency;
o evaluate the options against evaluation criteria adopted by the organisation, and
o select the best option to be included in capital renewal programs,
o Using ‘low cost’ renewal methods (cost of renewal is less than replacement),
These principles are applied to develop a 10 year capital works program which is grouped into like treatments.
These renewal programs include:
Road/Carpark Surface Renewal Programs:
o Asphalt (Overlay) Renewal Program;
o Bitumen (Reseal) Renewal Program; and
o Gravel Surface (Light Resheet) Program.
Road/Carpark Pavement Renewal Programs:
o Sealed Road (Road Rehabilitation) Program; and
o Gravel Road (Heavy Resheet) Program)
Kerb renewal program.
A summary of these programs for 2017-18 is included in Appendix B.
5.4.5 Summary of future renewal and replacement expenditure
Projected future renewal and replacement expenditures are forecast to increase over time as the asset stock ages
and to a lesser extent due to growth of the area of carparks, this projection is presented in Figure 5.5.3.
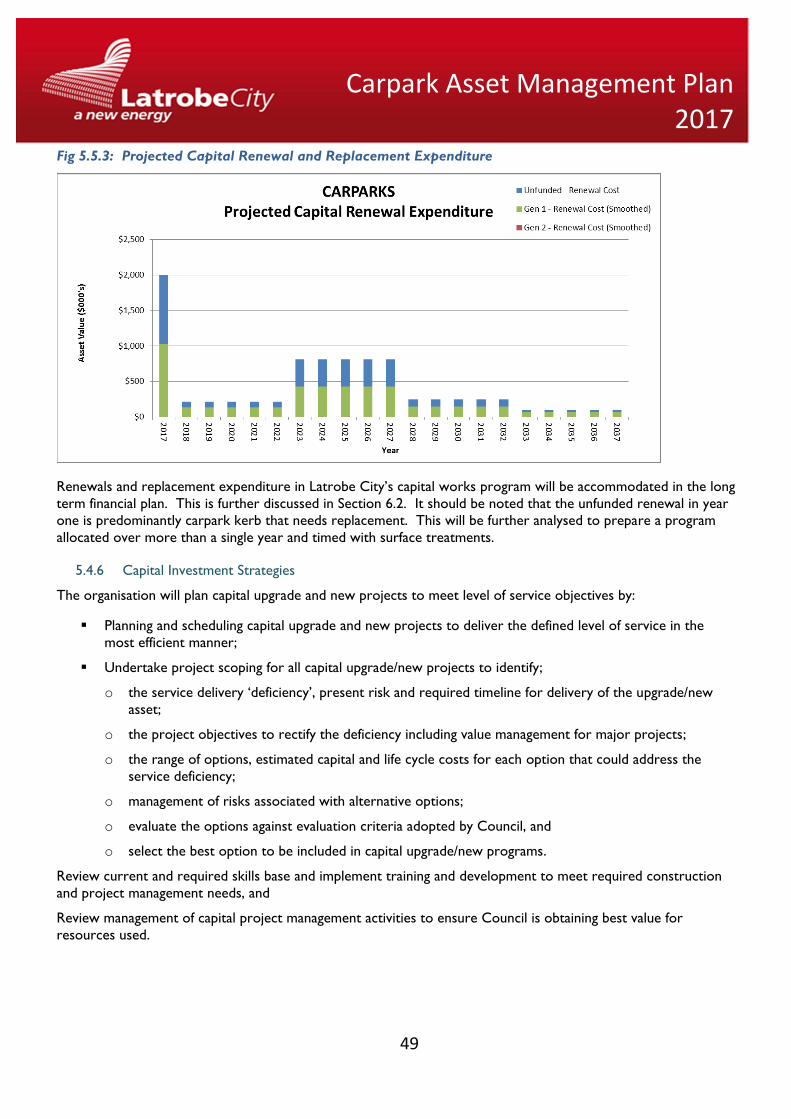
Pg. 49
Carpark Asset Management Plan 2017
Fig 5.5.3: Projected Capital Renewal and Replacement Expenditure
Renewals and replacement expenditure in Latrobe City’s capital works program will be accommodated in the long
term financial plan. This is further discussed in Section 6.2. It should be noted that the unfunded renewal in year
one is predominantly carpark kerb that needs replacement. This will be further analysed to prepare a program
allocated over more than a single year and timed with surface treatments.
5.4.6 Capital Investment Strategies
The organisation will plan capital upgrade and new projects to meet level of service objectives by:
Planning and scheduling capital upgrade and new projects to deliver the defined level of service in the
most efficient manner;
Undertake project scoping for all capital upgrade/new projects to identify;
o the service delivery ‘deficiency’, present risk and required timeline for delivery of the upgrade/new
asset;
o the project objectives to rectify the deficiency including value management for major projects;
o the range of options, estimated capital and life cycle costs for each option that could address the
service deficiency;
o management of risks associated with alternative options;
o evaluate the options against evaluation criteria adopted by Council, and
o select the best option to be included in capital upgrade/new programs.
Review current and required skills base and implement training and development to meet required construction
and project management needs, and
Review management of capital project management activities to ensure Council is obtaining best value for
resources used.

Pg. 50
Carpark Asset Management Plan 2017
5.4.7 Summary of future upgrade/new assets expenditure
Council is not funding an expansion of the network to attract new development at this time. There are
projections for development contribution plan construction that should eventually be cost neutral to the existing
community.
Figure 5.5.5: Projected Capital Upgrade/New Asset Expenditure
The projected upgrade/new capital works program is shown in Appendix C. There are no new and/or upgrade
works projected for carparks in this AMP.
Where upgrade/new projects have been identified, they will be funded as part of the current capital budget
process. Projected upgrade/new asset expenditures are summarised in Fig 6. All amounts are shown in net real
values (No inflation).
Expenditure on new assets and services in Council’s capital works program will be accommodated in the long
term financial plan. This is further discussed in Section 6.2.
5.5 Disposal Plan
Disposal includes any activity associated with disposal of a decommissioned asset including sale, demolition or
relocation. These assets will be further reinvestigated to determine the required levels of service and see what
options are available for alternate service delivery, if any.
The revenue projected is not sufficient to be included in Council’s long term financial plan. Currently there are no
disposals identified.
This graph is intentionally blank. There are no planned upgrades or new carparks.

Pg. 51
Carpark Asset Management Plan 2017
6 FINANCIAL SUMMARY
This section contains the financial requirements resulting from all the information presented in the previous
sections of the CAMP. The financial projections will be improved as further information becomes available on
desired levels of service and current and projected future asset performance.
Table 6.1 : Financial Classification “Road Works”
Financial
Sub-Class
Valuation
Input
Valuation
Technique
June 2015
Replacement
Valuation
($000’s)
Sealed Carparks Level 3 Cost Approach $10,560
Unsealed Carparks Level 3 Cost Approach $1,176
Total Greenfields Valuation $11,737
6.1 Financial Statements and Projections
The financial projections are shown in Fig 7 for projected operating (operations and maintenance) and capital
expenditure (renewal and upgrade/expansion/new assets). All amounts are shown in net real values (No
inflation).
Fig 6.1: Projected Operating and Capital Expenditure
The spike in the first year is that for the renewal of poor condition carpark kerbs that will be smoothed over the
medium term and timed with surface treatments to minimise disruption to carpark users. The financial analysis
presents a position that is on average reasonably provided for the over the first five years. The period from 2023
to 2032 is under provided for and will present a challenge. Experience to date is that the current reseal program
is extending the life of our sealed carparks assets. This will require further analysis to fully understand to what
extent. The increasing age of the carpark network will limit that which can be achieved and an increase in carpark
renewal funding will needed to maintain the current level of service.

Pg. 52
Carpark Asset Management Plan 2017
6.1.1 Sustainability of service delivery
There are four key indicators for service delivery sustainability that have been considered in the analysis of the
services provided by this asset category, these being the asset renewal funding ratio, long term life cycle
costs/expenditures and medium term projected/budgeted expenditures over five and 10 years of the planning
period.
Latrobe City - CARPARKS
Asset Renewal Funding Ratio
Asset Renewal Funding Ratio: (LTFP Renewal/Forecast Renewal for next 20 Years) (Preferred) 21 %
Asset Renewal Funding Ratio: (LTFP Renewal/Depreciation entire for next 20 Years) 24 %
Short Term – 5 year financial planning period (Dollars in $000's per yr)
5 yr Ops, Maint & Renewal Projected Expenditure $432 p.a.
5 yr Ops, Maint & Renewal LTFP Budget Exp $172 p.a.
5 year financing shortfall [5 yr proj exp - 5 LTFP Budget exp] -$260 p.a.
5 year financing indicator [5 yr LTFP Budget exp / 5 yr proj exp] 40 %
Medium Term - 10 year financial planning period (Dollars in $000's per Yr)
10 yr Ops, Maint & Renewal Projected Expenditure $463 p.a.
10 yr Ops, Maint & Renewal LTFP Budget Exp $172 p.a.
10 year financing shortfall [10 yr proj exp - 10 LTFP Budget exp] -$290 p.a.
10 year financing indicator [10 LTFP Budget exp / 10 yr proj exp] 37 %
Long Term - Life Cycle Costs (Dollars in $000's per yr)
Life Cycle Cost [average 20 years projected ops, maint exp and deprn.] $331 p.a.
Life Cycle Exp [average 20 years LTFP budget ops, maint & capital renewal exp] $172 p.a.
Life Cycle Gap [ave life cycle expenditure – ave life cycle cost (-ve = gap)] -$159
Life Cycle Indicator [life cycle expenditure / life cycle cost] 52 %
6.1.1.1 Asset Renewal Funding Ratio
Asset Renewal Funding Ratio4 21 %
The Asset Renewal Funding Ratio is the most important indicator and reveals that over the next 20 years,
Council is forecasting that it will have 21 % of the funds required for the optimal renewal and replacement of its
carpark assets. Further analysis will be undertaken to ensure that there is clear allocation of expenditure
between works within programs so that there are accurate figures for carpark expenditure. Currently programs
like the reseal program may not always clearly differentiate between road and carpark expenditure.
4 AIFMG, 2012, Version 1.3, Financial Sustainability Indicator 4, Sec 2.6, p 2.16

Pg. 53
Carpark Asset Management Plan 2017
Long term - Lifecycle Cost
Lifecycle costs (or whole of life costs) are the average costs that are required to sustain the service levels over
the asset life cycle. Lifecycle costs include operations and maintenance expenditure and asset consumption
(depreciation expense). The lifecycle cost for the services covered in this asset management plan is $331,000
per year (average operations and maintenance expenditure plus depreciation expense projected over 20 years).
Lifecycle costs can be compared to life cycle expenditure to give an initial indicator of affordability of projected
service levels when considered with age profiles. Life cycle expenditure includes operations, maintenance and
capital renewal expenditure. Lifecycle expenditure will vary depending on the timing of asset renewals. The life
cycle expenditure over the 20 year planning period is $172,000 per year (average operations and maintenance
plus capital renewal budgeted expenditure in LTFP over 20 years).
A gap between life cycle cost and life cycle expenditure is the life cycle gap. The life cycle gap for services
covered by this asset management plan is -ve $159,000 per year (-ve = gap, +ve = surplus).
Further analysis is required to determine whether this gap is overstated /masked by unclear identification/separation of
expenditure between carparks and roads. Planned maintenance management improvements should assist in identifying
against which asset expenditure is expended.
Life cycle expenditure is 37 % of life cycle costs.
The life cycle costs and life cycle expenditure comparison highlights any difference between present outlays and
the average cost of providing the service over the long term. If the life cycle expenditure is less than that life
cycle cost, it is most likely that outlays will need to be increased or cuts in services made in the future.
Knowing the extent and timing of any required increase in outlays and the service consequences if funding is not
available will assist organisations in providing services to their communities in a financially sustainable manner.
This is the purpose of the asset management plans and long term financial plan.
6.1.1.2 Medium term – 10 year financial planning period
This asset management plan identifies the projected operations, maintenance and capital renewal expenditures
required to provide an agreed level of service to the community over a 10 year period. This provides input into
10 year financial and funding plans aimed at providing the required services in a sustainable manner.
These projected expenditures may be compared to budgeted expenditures in the 10 year period to identify any
funding shortfall. In a core asset management plan, a gap is generally due to increasing asset renewals for ageing
assets.
The projected operations, maintenance and capital renewal expenditure required over the 10 year planning
period is $463,000 on average per year.
Estimated (budget) operations, maintenance and capital renewal funding is $172,000 on average per year giving a
10 year funding under allocation of $290,000 per year. This indicates that Council expects to have 92 % of the
projected expenditures needed to provide the services documented in the CAMP.
6.1.1.3 Short Term – five year financial planning period
The projected operations, maintenance and capital renewal expenditure required over the first five years of the
planning period is $432,000 on average per year.
Estimated (budget) operations, maintenance and capital renewal funding is $172,000 on average per year giving a
5 year funding under allocation of $260,000. This indicates that Council expects to have 40% of projected
expenditures required to provide the services shown in the CAMP.

Pg. 54
Carpark Asset Management Plan 2017
6.1.1.4 Asset management financial indicators
Figure 6.1a shows the asset management financial indicators over the 10 year planning period and for the long
term life cycle.
Figure 6.1a: Asset Management Financial Indicators
Providing services from infrastructure in a sustainable manner requires the matching and managing of service
levels, risks, projected expenditures and financing to achieve a financial indicator of approximately 100 % for the
first years of the CAMP and ideally over the 10 year life of the Long Term Financial Plan.
Figure 6.1c shows the projected asset renewal and replacement expenditure over the 20 years of the CAMP. The
projected asset renewal and replacement expenditure is compared to renewal and replacement expenditure in
the capital works program, which is accommodated in the long-term financial plan.
Figure 6.1b Projected and Future Funding Provision
Table 6.1c shows the over-allocation between projected renewal and replacement expenditures and expenditure
accommodated in long term financial plan. Budget expenditures accommodated in the long-term financial plan or
extrapolated.

Pg. 55
Carpark Asset Management Plan 2017
Table 6.1c: Projected and LTFP Budgeted Renewals and Financing Variances
Latrobe City - CARPARKS
Year End Jun-30
Projected Renewals ($’000)
LTFP Renewal Budget ($'000)
Renewal Financing Variance
Cumulative Variance
(- gap, + surplus) ($'000)
(- gap, + surplus) ($'000)
2017 $1,022 $50 $972 $972
2018 $132 $50 $82 $1,054
2019 $132 $50 $82 $1,137
2020 $132 $50 $82 $1,219
2021 $132 $50 $82 $1,301
2022 $132 $50 $82 $1,383
2023 $430 $50 $380 $1,763
2024 $430 $50 $380 $2,142
2025 $430 $50 $380 $2,522
2026 $430 $50 $380 $2,902
2027 $430 $50 $380 $3,282
2028 $148 $50 $98 $3,379
2029 $148 $50 $98 $3,477
2030 $148 $50 $98 $3,575
2031 $148 $50 $98 $3,672
2032 $148 $50 $98 $3,770
2033 $74 $50 $24 $3,794
2034 $74 $50 $24 $3,817
2035 $74 $50 $24 $3,841
2036 $74 $50 $24 $3,864
2037 $74 $50 $24 $3,888
Providing services in a sustainable manner will require matching of projected asset renewal and replacement
expenditure to meet agreed service levels with the corresponding capital works program accommodated in the
long term financial plan.

Pg. 56
Carpark Asset Management Plan 2017
6.1.2 Projected expenditures for long term financial plan
Table 6.1.2 shows the projected expenditures for the 10 year long term financial plan. Expenditure projections
are in 2016 real values.
Table 6.1.2 Projected Expenditures for Long Term Financial Plan ($000)
Latrobe City - CARPARKS
Year Operations Maintenance Projected Capital
Disposals Capital Renewal Upgrade/New
2017 $87 $35 $1,022 $0 $0
2018 $87 $35 $132 $0 $0
2019 $87 $35 $132 $0 $0
2020 $87 $35 $132 $0 $0
2021 $87 $35 $132 $0 $0
2022 $87 $35 $132 $0 $0
2023 $87 $35 $430 $0 $0
2024 $87 $35 $430 $0 $0
2025 $87 $35 $430 $0 $0
2026 $87 $35 $430 $0 $0
2027 $87 $35 $430 $0 $0
2028 $87 $35 $148 $0 $0
2029 $87 $35 $148 $0 $0
2030 $87 $35 $148 $0 $0
2031 $87 $35 $148 $0 $0
2032 $87 $35 $148 $0 $0
2033 $87 $35 $74 $0 $0
2034 $87 $35 $74 $0 $0
2035 $87 $35 $74 $0 $0
2036 $88 $35 $74 $0 $0
2037 $88 $35 $74 $0 $0
All dollar values are in ($'000)'s

Pg. 57
Carpark Asset Management Plan 2017
6.2 Funding Strategy
After reviewing service levels, as appropriate to ensure ongoing financial sustainability projected expenditures
identified in Section 6.1.2 will be accommodated in the Council’s 10 year long-term financial plan.
Figure 6.2: LTFP Expenditure Projections
Latrobe City – CARPARKS Projected Expenditure ($000,s)
2017 2018 2019 2020 2021 2022 2023 2024 2025 2026
Capital Renewal of existing assets
$1,022 $132 $132 $132 $132 $132 $430 $430 $430 $430
Capital Upgrade/New assets
$0 $0 $0 $0 $0 $0 $0 $0 $0 $0
Operational cost of
existing assets $87 $87 $87 $87 $87 $87 $87 $87 $87 $87
Maintenance cost of
existing assets $35 $35 $35 $35 $35 $35 $35 $35 $35 $35
Operational cost of
New assets $0 $0 $0 $0 $0 $0 $0 $0 $0 $0
Maintenance cost of New assets
$0 $0 $0 $0 $0 $0 $0 $0 $0 $0
Disposal of Surplus assets
$0 $0 $0 $0 $0 $0 $0 $0 $0 $0
Annual Funding Requirement
$1,144 $254 $254 $254 $254 $254 $552 $552 $552 $552
5 Yr Average Annual Funding Requirement
$432 $492
Maintenance and Operations figures for new assets are included, these costs increase in line with the growth in
assets due to developer contributions and new and upgrade projects.
6.3 Valuation Forecasts
Asset values are forecast to decrease as additional assets are added to the asset stock from construction and
acquisition by Council and from assets constructed by land developers and others and donated (gifted) to Council
are less than the depreciation of existing assets. Figure 6.3a shows the projected asset value (Written Down
Value) over the planning period in real values.
Figure 6.3a: Projected Asset Values

Pg. 58
Carpark Asset Management Plan 2017
Depreciation expense values are forecast in line with asset values as shown in Figure 6.3.b.
Figure 6.3b: Projected Depreciation Expense
The depreciated replacement cost will vary over the forecast period depending on the rates of addition of new
assets, disposal of old assets and consumption and renewal of existing assets. Forecast of the assets’ depreciated
replacement cost is shown in Figure 6.3c. The depreciated replacement cost of contributed and new assets is
shown in the darker colour and in the lighter colour for existing assets.
Figure 6.3c: Projected Depreciated Replacement Cost
6.4 Key Assumptions made in Financial Forecasts
This section details the key assumptions made in presenting the information contained in this asset management
plan and in preparing forecasts of required operating and capital expenditure and asset values, depreciation
expense and carrying amount estimates. It is presented to enable readers to gain an understanding of the levels
of confidence in the data behind the financial forecasts.
Key assumptions made in the CAMP and risks that these may change are shown in Table 6.4.

Pg. 59
Carpark Asset Management Plan 2017
Table 6.4: Key Assumptions made in the CAMP
Key Assumptions
Additional maintenance funds will be made available to continue current services as Council’s asset
base grows from assets handed over from developers and asset upgrades.
Maintenance and renewal allocation are fully funded.
Forecasted financial plans are in today’s dollars.
Current maintenance levels of service will remain the status quo.
The funds raised via a Development Contribution Plan for the provision of new carparks or upgrade
(particularly in established areas) have been approximated in the growth factor and the timing of
these expenditures has not been taken into consideration for this iteration of the CAMP as further
investigation is required.
Renewal is based on replacement like for like for financial purposes.
Upgrade or increased capacity projects beyond those identified in this plan are subject to separate
capital bids.
6.4.1.1 Inferred and reported condition
Current industry knowledge has been used to model adopted the life expectancy for road asset components as
outlined in Table 5.4.
Condition and remaining life will be inferred by a degradation curve for long life concrete assets using the asset’s
construction date.
It is noted, however, that in Australia, work relating to age deterioration models is still in its infancy, and lifecycles
can vary widely due to construction practices and external conditions. As condition information is added, and the
network is calibrated to local conditions, a revised figure for asset consumption will be evaluated.
Table 6.4.1: Reconciled Useful Lives of Assets (Sealed Roads and Carparks)
Asset Class Asset Category Expected Useful
life
Reconciled Useful Life from
current Condition
Assessment *preliminary
sample data
Sealed Road Surface – Concrete
Pavement Under - Concrete
85 years
85 years
88 years
75 years
Sealed Road Surface – Concrete Pavers
Pavement under - Pavers
50 years
50 years
50 years
37 years
Sealed Roads Surface - Asphalt Surface
Pavement under Asphalt
18 years
72 years
18 years
64 years
Sealed Roads Surface – Bitumen – (Spray Seal)
Pavement under Bitumen
15 years
75 years
16 years
75 years
Kerbs Kerbs 77 years 71 years

Pg. 60
Carpark Asset Management Plan 2017
Table 6.4.2: Reconciled Useful Lives of Assets (Unsealed Roads and Carparks)
Asset Class Asset Category Expected Useful
life
Reconciled Useful Life from
current Condition
Assessment
Unsealed Roads Surface -Gravel
Pavement under Gravel
15 years
45 years
15 years
50 years
Unsealed Roads Surface – Natural
Pavement - Natural
25 years
25 years
28 years
31 years
It should be noted that the forecast useful lives are calculated based on the current assessed condition converted
to a remaining useful life through the relevant degradation curve, then referenced to the year of last renewal for
each asset to predict when the asset will reach the end of its useful life, hence the forecast age at the end of its
useful life can be reset. These reported results are based on the performance of road assets and even though
the carpark assets are likely to reflective of that of the roads these results are indicative and require further
scrutiny which will be undertaken in time for the next revision of this CAMP.
6.4.1.2 Current Conditions
It can be seen by examining available construction age data, there were three periods of intense construction
activity – the mid-1950s and 1960s driven by residential support for the State Electricity Commission, in the mid-
1970s and a steady decline in late-1980s until a recent increase in residential development. With this in mind, it is
anticipated that significant renewals will occur between 2065 and 2090, and therefore a funding strategy needs to
be developed with a 50 year vision from present.
It is known that roads constructed under good conditions may last longer than the current accounting lifespan.
Therefore, improving road knowledge via the improvement plan, and moving to an evidence based condition
system has the potential to save residents significant long term expenditure.
6.5 Forecast Reliability and Confidence
The expenditure and valuations projections in the CAMP are based on best available data. Currency and accuracy
of data is critical to effective asset and financial management. Data confidence is classified on a five level scale in
accordance with Table 6.5.
Table 6.5: Data Confidence Grading System
Confidence
Grade
Description
A Highly reliable Data based on sound records, procedures, investigations and analysis, documented properly and
recognised as the best method of assessment. Dataset is complete and estimated to be accurate ±
2 %
B Reliable Data based on sound records, procedures, investigations and analysis, documented properly but has
minor shortcomings, for example some of the data is old, some documentation is missing and/or
reliance is placed on unconfirmed reports or some extrapolation. Dataset is complete and
estimated to be accurate ± 10 %
C Uncertain Data based on sound records, procedures, investigations and analysis which is incomplete or
unsupported, or extrapolated from a limited sample for which grade A or B data are available.
Dataset is substantially complete but up to 50 % is extrapolated data and accuracy estimated ± 25 %
D Very Uncertain Data based on unconfirmed verbal reports and/or cursory inspections and analysis. Dataset may
not be fully complete and most data is estimated or extrapolated. Accuracy ± 40 %
E Unknown None or very little data held.

Pg. 61
Carpark Asset Management Plan 2017
The estimated confidence level for and reliability of data used in the CAMP is shown in Table 6.5.1.
Table 6.5.1: Data Confidence Assessment for Data used in the CAMP
Data Confidence
Assessment Comment
Demand drivers Uncertain Require further testing and inclusion of DCP
commitments to be included rather than estimated.
Growth projections Reliable Reliable source documents
Operations expenditures Reliable Obtained from Finance Department
Maintenance expenditures Reliable Obtained from Finance Department
Projected Renewal exps.
- Asset values Reliable
Modelled based on condition assessment with
reconciled useful lives being reasonable.
- Asset residual values Reliable No used consistent with valuation
- Asset useful lives Reliable Benchmarked against like Councils and reviewed in
2015 and preliminary reconciliation
- Condition modelling Reliable Relationship to useful life reasonable
- Defect repairs Very Uncertain No MMS to record outcomes
Upgrade/New expenditures Reliable Obtained from Finance Department
Over all data sources the data confidence is assessed as Reliable confidence level for data used in the
preparation of the CAMP.

Pg. 62
Carpark Asset Management Plan 2017
7 PLAN IMPROVEMENT AND MONITORING
7.1 Status of Asset Management Practices
7.1.1 Accounting and financial systems
Council uses FinanceOne from TechnologyOne as the finance system.
7.1.1.1 Accounting standards and regulations
The applicable accounting standards are AASB116 “Property, Plant, and Equipment” , AASB13 “Fair Value
Measurement” and AASB138 “Intangible Assets”
7.1.1.2 Capital/maintenance threshold
Council has set a value of $10,000 in expenditure before it is considered to be capitalised. This is the cost
captured as renewal or upgrade as opposed to maintenance.
7.1.1.3 Required changes to accounting financial systems arising from the CAMP
No specific changes have been identified however with advances in Maintenance Management processes, the
Finance system may be modified to better capture maintenance effort against the assets (as opposed to generally).
This increased detail will assist in identifying maintenance and renewal needs.
7.1.2 Asset Management System
Council uses MyData Asset Management System from Assetic Pty Ltd. It is a sophisticated database system that
allows detailed management of the data. A partner to this is MyPredictor Asset Modelling System also from
Assetic that will, once implemented with the data and necessary algorithms, allow Council to model the
deterioration of assets and improve the science of lifecycle costing.
7.1.2.1 Asset registers
The asset register relevant to the CAMP held in MyData include:
Sealed Carparks
Unsealed Carparks
Kerbs
7.1.2.2 Linkage from asset management to financial system
This is currently a manual process through Microsoft Excel spreadsheets. There is no integration between
financial and asset management systems.
7.1.2.3 Accountabilities for asset management system and data maintenance
Team Leader Asset Strategy and Co-ordinator Infrastructure Planning.
7.1.2.4 Required changes to asset management system arising from the CAMP
The AMS used is sophisticated and very capable. No changes are required to the system. Changes proposed are
related to the data and information that reside in the system. This is discussed in Appendix G – CAMP
Improvement Plan.

Pg. 63
Carpark Asset Management Plan 2017
7.1.3 Geographic Information System (GIS)
Council’s road spatial data is contained and updated within separate GIS layers and can be viewed via the internal
GIS viewer, IntraMaps.
7.2 Monitoring and Review Procedures
This asset management plan will be reviewed periodically and amended to recognise any material changes in
service levels and/or resources available to provide those services as a result of budget decisions.
The CAMP will be updated to ensure it represents the current service level, asset values, projected operations,
maintenance, capital renewal and replacement, capital upgrade/new and asset disposal expenditures and projected
expenditure values incorporated into the organisation’s long term financial plan.
The financial model of this CAMP should be reviewed annually to adjust for changes to the network, and CAMP
should be reviewed every 4 years at a minimum to ensure it represents the current service level, asset values,
projected operations, maintenance, capital renewal and replacement, capital upgrade/new and asset disposal
expenditures and projected expenditure values consistent with the organisation’s long term financial plan.
7.3 Performance Measures
The effectiveness of the CAMP can be measured in the following ways:
The degree to which the required projected expenditures identified in the CAMP are incorporated into
Council’s long term financial plan;
The degree to which one to five year detailed works programs, budgets, business plans and organisational
structures take into account the ‘global’ works program trends provided by the CAMP.
The degree to which the existing and projected service levels and service consequences (what we cannot do),
risks and residual risks are incorporated into the Council’s Strategic Plan and associated plans, and;
The Asset Renewal Funding Ratio exceeding the actual 21.

Pg. 64
Carpark Asset Management Plan 2017
8 REFERENCES
Documents referenced by the CAMP include:
IPWEA, 2015, ‘International Infrastructure Management Manual’, Institute of Public Works Engineering
Australasia, Sydney, www.ipwea.org/IIMM
IPWEA, 2015, ‘NAMS.PLUS Asset Management’, Institute of Public Works Engineering Australasia, Sydney,
www.ipwea.org/namsplus.
IPWEA, 2015, ‘Australian Infrastructure Financial Management Manual’, Institute of Public Works Engineering
Australasia, Sydney, www.ipwea.org/AIFMG.
Latrobe City Council Plan 2013-2017.

Pg. 65
Carpark Asset Management Plan 2017
APPENDICES
Appendices attached to the CAMP include:
Appendix A Proposed Maintenance Response Service Level Agreement
Appendix B Projected Upgrade/New Expenditure 10 year Capital Works Program
Appendix C Projected Upgrade/New Expenditure 10 year Capital Works Program
Appendix D Budgeted Expenditures Accommodated
Appendix E Abbreviations
Appendix F Glossary
Appendix G CAMP Improvement Plan

Pg. 66
Carpark Asset Management Plan 2017
Appendix A - Proposed Maintenance Response Service Level Agreement
Until a new Service Level Agreement is developed in conjunction with the Operations and Waste Department
the current operational approach and standards will be maintained.
Part of the development of the new Service Level Agreement will be refining inspection and resulting maintenance
using the criticality of roads as per the risk categorisation model of Appendix I that determines each roads
criticality.

Pg. 67
Carpark Asset Management Plan 2017
8.1 Appendix B - Projected 10 year Capital Renewal and Replacement Works Program
ROAD/CARPARK SURFACE RENEWAL PROGRAMS:
B1-ASPHALT (OVERLAY) RENEWAL PROGRAM 2017-27 (sq m):
LOCALITY/YEAR 2017 2018 2019 2020 2021 2022 2023 2024 2025 2026 2027 TOTAL
BOOLARRA - - - - - - - - - - -
CALLIGNEE - - - - - - - - - - 20,000 20,000
CHURCHILL - - - - - - - - - 6,000 227,000 33,000
GLENGARRY - - - - - - - - - 12,000 - 2,000
MOE 3,000 - - - - 109,000 - - 73,000 108,000 154,000 447,000
MORWELL 121,000 - - - 16,000 154,000 - - 20,000 94,000 277,000 682,000
NEWBOROUGH - - - - - - - - - 17,000 19,000 36,000
TRARALGON - - - - - 37,000 - - 191,000 82,000 163,000 473,000
TYERS - - - - - - - - - - 12,000 12,000
YALLOURN
NORTH - - - - - - - - 50,000 - 21,000 71,000
TOTAL 124,000 - - - 16,000 300,000 - - 334,000 319,000 893,000 986,000

Pg. 68
Carpark Asset Management Plan 2017
B2- BITUMEN (RESEAL) RENEWAL PROGRAM 2017-27 (sq m):
LOCALITY/YEAR 2017 2018 2019 2020 2021 2022 2023 2024 2025 2026 2027 Total
CHURCHILL 5000 5,000
HAZELWOOD 40,000 40,000
MOE 39,000 18,000 5,000 29,000 91,000
MOE &
NEWBOROUGH 10,000 18,000 9,000 38,000 75,000
MOE SOUTH 1,000 1,000
MORWELL 2,000 6,000 20,000 86,000 114,000
NEWBOROUGH 13,000 10,000 3,000 20,000 46,000
NEWBOROUGH
& YALLOURN 5,000 5,000
TRARALGON 9,000 11,000 5,000 42,000 20,000 87,000
TRARALGON
SOUTH 4,000 14,000
YALLOURN
NORTH 21,000 17,000 38,000
TOTAL 90,000 9,000 62,000 9,000 9,000 5,000 67,000 147,000 63,000 55,000 516,000

Pg. 69
Carpark Asset Management Plan 2017
B3- GRAVEL SURFACE (LIGHT RESHEET) - No Pavement Renewal) 2017-27 (sq m)
LOCALITY/YEAR 2017 2018 2019 2020 2021 2022 2023 2024 2025 2026 2027 Total
BALOOK 2,000 4,000 3,000 9,000
BOOLARRA 7,000 2,000 9,000
BOOLARRA
STH-BALOOK 2,000 2,000
CHURCHILL 4,000 2,000 21,000 4,000 31,000
DRIFFIELD 11,000 11,000
GLENGARRY 2,000 2,000
JEERALANG 2,000 3,000 3,000 8,000
KOORNALLA 2,000 1,000 3,000
MOE 1,000 1,000
MOE &
NEWBOROUGH -
MOE SOUTH 6,000 6,000
MORWELL 40,000 9,000 13,000 8,000 33,000 12,000 1,000 1,000 2,000 119,000
NEWBOROUGH -
TOONGABBIE 2,000 2,000 2,000 2,000 2,000 2,000 2,000 2,000 2,000 2,000 2,000 22,000
TRARALGON 2,000 4,000 3,000 9,000
TYERS 7,000 2,000 9,000
YALLOURN
NORTH 2,000 2,000
YINNAR 4,000 2,000 21,000 4,000 31,000
YINNAR SOUTH 11,000 11,000
TOTAL 97,000 11,000 2,000 23,000 15,000 91,000 4,000 3,000 3,000 4,000 2,000 285,000

Pg. 70
Carpark Asset Management Plan 2017
B4- GRAVEL SURFACE (LIGHT RESHEET) - No Pavement Renewal) 2017-27 (sq m)
Locality/Year 2017 2018 2019 2020 2021 2022 2023 2024 2025 2026 2027 Total
BALOOK 2,000 4,000 3,000 9,000
BOOLARRA 7,000 2,000 9,000
BOOLARRA
STH-BALOOK 2,000 2,000
CHURCHILL 4,000 2,000 21,000 4,000 31,000
DRIFFIELD 11,000 11,000
GLENGARRY 2,000 2,000
JEERALANG 2,000 3,000 3,000 8,000
KOORNALLA 2,000 1,000 3,000
MOE 1,000 1,000
MOE &
NEWBOROUGH -
MOE SOUTH 6,000 6,000
MORWELL 40,000 9,000 13,000 8,000 33,000 12,000 1,000 1,000 2,000 119,000
NEWBOROUGH -
TOONGABBIE 2,000 2,000 2,000 2,000 2,000 2,000 2,000 2,000 2,000 2,000 2,000 22,000
TRARALGON 2,000 4,000 3,000 9,000
TYERS 7,000 2,000 9,000
YALLOURN
NORTH 2,000 2,000
YINNAR 4,000 2,000 21,000 4,000 31,000
YINNAR
SOUTH 11,000 11,000
TOTAL 97,000 11,000 2,000 23,000 15,000 91,000 34,000 3,000 3,000 4,000 2,000 285,000

Pg. 71
Carpark Asset Management Plan 2017
B5- KERB RENEWAL PROGRAM 2017-27 (l m)
Locality/Year 2017 2018 2019 2020 2021 2022 2023 2024 2025 2026 2027 Total
BALOOK
BOOLARRA 21,000 21,000
BOOLARRA STH-
BALOOK
CALLIGNEE
CHURCHILL 24,000 3,000 3,000 1,000 14,000 45,000
DRIFFIELD
GLENGARRY
HAZELWOOD
JEERALANG
KOORNALLA
MOE 93,000 11,000 24,000 29,000 157,000
MOE &
NEWBOROUGH 28,000 28,000
MOE SOUTH
MORWELL 4,000 53,000 75,000 - 621,000
NEWBOROUGH 18,000 1,000 19,000
NEWBOROUGH &
YALLOURN
TOONGABBIE
TRARALGON 116,000 27,000 37,000 15,000 27,000 222,000
TRARALGON
SOUTH
TYERS 4,000 4,000
YALLOURN
NORTH 96,000 96,000
YINNAR
YINNAR SOUTH
TOTAL 769,000 49,000 139,000 4,000 2,000 119,000 104,000 27,000
1,213,000

Pg. 72
Carpark Asset Management Plan 2017
Appendix C - Projected Upgrade/New Expenditure 10 year Capital Works Program
Upgrade and new projects incorporated in the CAMP plan include:
Marshalls Road supermarket development – carpark to be paid by development not Council.

Pg. 73
Carpark Asset Management Plan 2017
Appendix D - Budgeted Expenditures
Expenditure currently incorporated into annual budgets include:
BUDGET: 2017 2018 2019 2020 2021 2022
Management Overhead $4,516 $4,516 $4,516 $4,516 $4,516 $4,516
Asset Management $42,594 $42,594 $42,594 $42,594 $42,594 $42,594
Operations $40,216 $40,216 $40,216 $40,216 $40,216 $40,216
OPERATIONS BUDGET
$87,326 $87,326 $87,326 $87,326 $87,326 $87,326
Reactive Maintenance $35,000 $35,000 $35,000 $35,000 $35,000 $35,000
Routine Maintenance $0 $0 $0 $0 $0 $0
Specific Maintenance $0 $0 $0 $0 $0 $0
MAINTENANCE BUDGET
$35,000 $35,000 $35,000 $35,000 $35,000 $35,000
Renewal $50,000 $50,000 $50,000 $50,000 $50,000 $50,000
Upgrade/Expansion $0 $0 $0 $0 $0 $0
New Capex $0 $0 $0 $0 $0 $0
Disposal Expenses $0 $0 $0 $0 $0 $0
CAPITAL EXPENDITURE
$50,000 $50,000 $50,000 $50,000 $50,000 $50,000
BUDGETED ANNUAL RENEWAL
$50,000 $50,000 $50,000 $50,000 $50,000 $50,000
Renewal Gap -$972,286 -$82,123 -$82,123 -$82,123 -$82,123 -$82,123
FORECAST ANNUAL RENEWAL
$1,022,286 $132,123 $132,123 $132,123 $132,123 $132,123
BUDGET: 2023 2024 2025 2026 2027
Management Overhead $4,516 $4,516 $4,516 $4,516 $4,516
Asset Management $42,594 $42,594 $42,594 $42,594 $42,594
Operations $40,216 $40,216 $40,216 $40,216 $40,216
OPERATIONS BUDGET
$87,326 $87,326 $87,326 $87,326 $87,326
Reactive Maintenance $35,000 $35,000 $35,000 $35,000 $35,000
Routine Maintenance $0 $0 $0 $0 $0
Specific Maintenance $0 $0 $0 $0 $0
MAINTENANCE BUDGET
$35,000 $35,000 $35,000 $35,000 $35,000
Renewal $50,000 $50,000 $50,000 $50,000 $50,000
Upgrade/Expansion $0 $0 $0 $0 $0
New Capex $0 $0 $0 $0 $0
Disposal Expenses $0 $0 $0 $0 $0
CAPITAL EXPENDITURE
$50,000 $50,000 $50,000 $50,000 $50,000
BUDGETED ANNUAL RENEWAL
$50,000 $50,000 $50,000 $50,000 $50,000
Renewal Gap -$379,794 -$379,794 -$379,794 -$379,794 -$379,794
FORECAST ANNUAL RENEWAL
$429,794 $429,794 $429,794 $429,794 $429,794

Pg. 74
Carpark Asset Management Plan 2017
Appendix E - Abbreviations
Abbreviations used in the CAMP include:
AAAC Average annual asset consumption
AM Asset Management
AEP Annual Exceedance Probability
ASC Annual service cost
BOD Biochemical (biological) oxygen demand
CAMP
CRC
Carpark Asset Management Plan
Current replacement cost
CWMS Community wastewater management systems
DA
RAMP
Depreciable amount
Road Asset Management Plan
DRC Depreciated replacement cost
EF
GPT
Earthworks/formation
Gross Pollutant Trap
IRMP Infrastructure risk management plan
LCC Life Cycle cost
LCE Life cycle expenditure
LTFP Long term financial plan
MMS Maintenance Management System
PCI Pavement condition index
RV Residual value
SoA State of the Assets
vph Vehicles per hour
WDCRC Written down current replacement cost

Pg. 75
Carpark Asset Management Plan 2017
Appendix F - Glossary
Annual service cost (ASC)
a) Reporting actual cost
The annual (accrual) cost of providing a service including operations, maintenance, depreciation,
finance/opportunity and disposal costs less revenue.
b) For investment analysis and budgeting
An estimate of the cost that would be tendered, per annum, if tenders were called for the supply of a
service to a performance specification for a fixed term. The Annual Service Cost includes operations,
maintenance, depreciation, finance/opportunity and disposal costs, less revenue.
Asset
A resource controlled by an entity as a result of past events and from which future economic benefits are
expected to flow to the entity. Infrastructure assets are a sub-class of property, plant and equipment which
are non-current assets with a life greater than 12 months and enable services to be provided.
Asset category
Sub-group of assets within a class hierarchy for financial reporting and management purposes.
Asset class
A group of assets having a similar nature or function in the operations of an entity, and which, for purposes
of disclosure, is shown as a single item without supplementary disclosure.
Asset condition assessment
The process of continuous or periodic inspection, assessment, measurement and interpretation of the
resultant data to indicate the condition of a specific asset so as to determine the need for some
preventative or remedial action.
Asset hierarchy
A framework for segmenting an asset base into appropriate classifications. The asset hierarchy can be based
on asset function or asset type or a combination of the two.
Asset management (AM)
The combination of management, financial, economic, engineering and other practices applied to physical
assets with the objective of providing the required level of service in the most cost effective manner.
Asset renewal funding ratio
The ratio of the net present value of asset renewal funding accommodated over a 10 year period in a long
term financial plan relative to the net present value of projected capital renewal expenditures identified in
an asset management plan for the same period [AIFMG Financial Sustainability Indicator No 8].
Average annual asset consumption (AAAC)*
The amount of an organisation’s asset base consumed during a reporting period (generally a year). This
may be calculated by dividing the depreciable amount by the useful life (or total future economic
benefits/service potential) and totalled for each and every asset OR by dividing the carrying amount
(depreciated replacement cost) by the remaining useful life (or remaining future economic benefits/service
potential) and totalled for each and every asset in an asset category or class.
Borrowings
A borrowing or loan is a contractual obligation of the borrowing entity to deliver cash or another financial
asset to the lending entity over a specified period of time or at a specified point in time, to cover both the
initial capital provided and the cost of the interest incurred for providing this capital. A borrowing or loan

Pg. 76
Carpark Asset Management Plan 2017
provides the means for the borrowing entity to finance outlays (typically physical assets) when it has
insufficient funds of its own to do so, and for the lending entity to make a financial return, normally in the
form of interest revenue, on the funding provided.
Brownfields Valuation
Valuation method where the initial recognition and subsequent recognition of assets involves expensing
those costs that are considered to be ‘sunk’ one-off costs for components that are expected to have an
unlimited life such as earthworks and formation for roadworks and capitalising only those costs associated
with ongoing renewal of the asset.
Capital expenditure
Relatively large (material) expenditure, which has benefits, expected to last for more than 12 months.
Capital expenditure includes renewal, expansion and upgrade. Where capital projects involve a combination
of renewal, expansion and/or upgrade expenditures, the total project cost needs to be allocated
accordingly.
Capital expenditure - expansion
Expenditure that extends the capacity of an existing asset to provide benefits, at the same standard as is
currently enjoyed by existing beneficiaries, to a new group of users. It is discretionary expenditure, which
increases future operations and maintenance costs, because it increases the organisation’s asset base, but
may be associated with additional revenue from the new user group, e.g. extending a drainage or road
network, the provision of an oval or park in a new suburb for new residents.
Capital expenditure - new
Expenditure which creates a new asset providing a new service/output that did not exist beforehand. As it
increases service potential it may impact revenue and will increase future operations and maintenance
expenditure.
Capital expenditure - renewal
Expenditure on an existing asset or on replacing an existing asset, which returns the service capability of
the asset up to that which it had originally. It is periodically required expenditure, relatively large (material)
in value compared with the value of the components or sub-components of the asset being renewed. As it
reinstates existing service potential, it generally has no impact on revenue, but may reduce future
operations and maintenance expenditure if completed at the optimum time, eg. resurfacing or resheeting a
material part of a road network, replacing a material section of a drainage network with pipes of the same
capacity, resurfacing an oval.
Capital expenditure - upgrade
Expenditure, which enhances an existing asset to provide a higher level of service or expenditure that will
increase the life of the asset beyond that which it had originally. Upgrade expenditure is discretionary and
often does not result in additional revenue unless direct user charges apply. It will increase operations and
maintenance expenditure in the future because of the increase in the organisation’s asset base, eg. widening
the sealed area of an existing road, replacing drainage pipes with pipes of a greater capacity, enlarging a
grandstand at a sporting facility.
Capital funding
Funding to pay for capital expenditure.
Capital grants
Monies received generally tied to the specific projects for which they are granted, which are often upgrade
and/or expansion or new investment proposals.
Capital investment expenditure
See capital expenditure definition

Pg. 77
Carpark Asset Management Plan 2017
Capitalisation threshold
The value of expenditure on non-current assets above which the expenditure is recognised as capital
expenditure and below which the expenditure is charged as an expense in the year of acquisition.
Carrying amount
The amount at which an asset is recognised after deducting any accumulated depreciation / amortisation
and accumulated impairment losses thereon.
Class of assets
See asset class definition.
Component
Specific parts of an asset having independent physical or functional identity and having specific attributes
such as different life expectancy, maintenance regimes, risk or criticality.
Core asset management
Asset management which relies primarily on the use of an asset register, maintenance management systems,
job resource management, inventory control, condition assessment, simple risk assessment and defined
levels of service, in order to establish alternative treatment options and long-term cashflow predictions.
Priorities are usually established on the basis of financial return gained by carrying out the work (rather
than detailed risk analysis and optimised decision- making).
Cost of an asset
The amount of cash or cash equivalents paid or the fair value of the consideration given to acquire an asset
at the time of its acquisition or construction, including any costs necessary to place the asset into service.
This includes one-off design and project management costs.
Critical assets
Assets for which the financial, business or service level consequences of failure are sufficiently severe to
justify proactive inspection and rehabilitation. Critical assets have a lower threshold for action than non-
critical assets.
Current replacement cost (CRC)
The cost the entity would incur to acquire the asset on the reporting date. The cost is measured by
reference to the lowest cost at which the gross future economic benefits could be obtained in the normal
course of business or the minimum it would cost, to replace the existing asset with a technologically
modern equivalent new asset (not a second-hand one) with the same economic benefits (gross service
potential) allowing for any differences in the quantity and quality of output and in operating costs.
Deferred maintenance
The shortfall in rehabilitation work undertaken relative to that required to maintain the service potential of
an asset.
Depreciable amount
The cost of an asset, or other amount substituted for its cost, less its residual value.
Depreciated replacement cost (DRC)
The current replacement cost (CRC) of an asset less, where applicable, accumulated depreciation
calculated on the basis of such cost to reflect the already consumed or expired future economic benefits of
the asset.
Depreciation / amortisation
The systematic allocation of the depreciable amount (service potential) of an asset over its useful life.

Pg. 78
Carpark Asset Management Plan 2017
Economic life
See useful life definition.
Expenditure
The spending of money on goods and services. Expenditure includes recurrent and capital outlays.
Expenses
Decreases in economic benefits during the accounting period in the form of outflows or depletions of
assets or increases in liabilities that result in decreases in equity, other than those relating to distributions
to equity participants.
Fair value
The amount for which an asset could be exchanged, or a liability settled, between knowledgeable, willing
parties, in an arms-length transaction.
Financing gap
A financing gap exists whenever an entity has insufficient capacity to finance asset renewal and other
expenditure necessary to be able to appropriately maintain the range and level of services its existing asset
stock was originally designed and intended to deliver. The service capability of the existing asset stock
should be determined assuming no additional operating revenue, productivity improvements, or net
financial liabilities above levels currently planned or projected. A current financing gap means service levels
have already or are currently falling. A projected financing gap, if not addressed, will result in a future
diminution of existing service levels.
Generation 1
First renewal of an asset after construction.
Generation 2
Subsequent renewal of asset after initial renewal.
Greenfields valuation
Valuation method where the initial recognition and subsequent revaluation of assets involves the
capitalisation of all costs including those for components that are expected to have an unlimited life (such
as earthworks and formation for roadwork).
Heritage asset
An asset with historic, artistic, scientific, technological, geographical or environmental qualities that is held
and maintained principally for its contribution to knowledge and culture and this purpose is central to the
objectives of the entity holding it.
Impairment loss
The amount by which the carrying amount of an asset exceeds its recoverable amount.
Infrastructure assets
Physical assets that contribute to meeting the needs of organisations or the need for access to major
economic and social facilities and services, eg. roads, drainage, footpaths and cycleways. These are typically
large, interconnected networks or portfolios of composite assets. The components of these assets may be
separately maintained, renewed or replaced individually so that the required level and standard of service
from the network of assets is continuously sustained. Generally the components and hence the assets have
long lives. They are fixed in place and are often have no separate market value.
Investment property
Property held to earn rentals or for capital appreciation or both, rather than for:

Pg. 79
Carpark Asset Management Plan 2017
a) use in the production or supply of goods or services or for administrative purposes; or
b) sale in the ordinary course of business.
Key performance indicator
A qualitative or quantitative measure of a service or activity used to compare actual performance against a
standard or other target. Performance indicators commonly relate to statutory limits, safety,
responsiveness, cost, comfort, asset performance, reliability, efficiency, environmental protection and
customer satisfaction.
Level of service
The defined service quality for a particular service/activity against which service performance may be
measured. Service levels usually relate to quality, quantity, reliability, responsiveness, environmental impact,
acceptability and cost.
Life Cycle Cost * (LCC)
a) Total LCC The total cost of an asset throughout its life including planning, design, construction,
acquisition, operation, maintenance, rehabilitation and disposal costs.
b) Average LCC The life cycle cost (LCC) is average cost to provide the service over the longest asset
life cycle. It comprises average operations, maintenance expenditure plus asset consumption expense,
represented by depreciation expense projected over 10 years. The Life Cycle Cost does not indicate
the funds required to provide the service in a particular year.
Life Cycle Expenditure
The Life Cycle Expenditure (LCE) is the average operations, maintenance and capital renewal expenditure
accommodated in the long term financial plan over 10 years. Life Cycle Expenditure may be compared to
average Life Cycle Cost to give an initial indicator of affordability of projected service levels when
considered with asset age profiles.
Loans / borrowings
See borrowings.
Maintenance
All actions necessary for retaining an asset as near as practicable to an appropriate service condition,
including regular ongoing day-to-day work necessary to keep assets operating, eg road patching but
excluding rehabilitation or renewal. It is operating expenditure required to ensure that the asset reaches its
expected useful life.
• Planned maintenance
Repair work that is identified and managed through a maintenance management system (MMS). MMS
activities include inspection, assessing the condition against failure/breakdown criteria/experience,
prioritising scheduling, actioning the work and reporting what was done to develop a maintenance history
and improve maintenance and service delivery performance.
• Reactive maintenance
Unplanned repair work that is carried out in response to service requests and management/ supervisory
directions.
• Specific maintenance
Maintenance work to repair components or replace sub-components that needs to be identified as a
specific maintenance item in the maintenance budget.
• Unplanned maintenance
Corrective work required in the short-term to restore an asset to working condition so it can continue to
deliver the required service or to maintain its level of security and integrity.

Pg. 80
Carpark Asset Management Plan 2017
Maintenance expenditure *
Recurrent expenditure which is periodically or regularly required as part of the anticipated schedule of
works to ensure that the asset achieves its useful life, and provides the required level of service. It is
expenditure, which was anticipated in determining the asset’s useful life.
Materiality
The notion of materiality guides the margin of error acceptable, the degree of precision required and the
extent of the disclosure required when preparing general purpose financial reports. Information is material
if its omission, mis-statement or non-disclosure has the potential, individually or collectively, to influence
the economic decisions of users taken on the basis of the financial report or affect the discharge of
accountability by the management or governing body of the entity.
Modern equivalent asset
Assets that replicate what is in existence with the most cost-effective asset performing the same level of
service. It is the most cost efficient, currently available asset which will provide the same stream of services
as the existing asset is capable of producing. It allows for technology changes and, improvements and
efficiencies in production and installation techniques
Net present value (NPV)
The value to the organisation of the cash flows associated with an asset, liability, activity or event calculated
using a discount rate to reflect the time value of money. It is the net amount of discounted total cash
inflows after deducting the value of the discounted total cash outflows arising from eg the continued use
and subsequent disposal of the asset after deducting the value of the discounted total cash outflows.
Non-revenue generating investments
Investments for the provision of goods and services to sustain or improve services to the community that
are not expected to generate any savings or revenue to the Council, eg. parks and playgrounds, footpaths,
roads and bridges, libraries etc.
Operations
Regular activities to provide services such as public health, safety and amenity, eg street sweeping, grass
mowing and street lighting.
Operating expenditure
Recurrent expenditure, which is continuously required to provide a service. In common use the term
typically includes, eg power, fuel, staff, plant equipment, on-costs and overheads but excludes maintenance
and depreciation. Maintenance and depreciation is on the other hand included in operating expenses.
Operating expense
The gross outflow of economic benefits, being cash and non-cash items, during the period arising in the
course of ordinary activities of an entity when those outflows result in decreases in equity, other than
decreases relating to distributions to equity participants.
Operating expenses
Recurrent expenses continuously required to provide a service, including power, fuel, staff, plant
equipment, maintenance, depreciation, on-costs and overheads.
Operations, maintenance and renewal financing ratio
Ratio of estimated budget to projected expenditure for operations, maintenance and renewal of assets over
a defined time (eg five, 10 and 15 years).

Pg. 81
Carpark Asset Management Plan 2017
Operations, maintenance and renewal gap
Difference between budgeted expenditures in a long-term financial plan (or estimated future budgets in
absence of a long term financial plan) and projected expenditures for operations, maintenance and renewal
of assets to achieve/maintain specified service levels, totalled over a defined time (e.g. five, 10 and 15 years).
Pavement management system (PMS)
A systematic process for measuring and predicting the condition of road pavements and wearing surfaces
over time and recommending corrective actions.
PMS Score
A measure of condition of a road segment determined from a Pavement Management System.
Rate of annual asset consumption *
The ratio of annual asset consumption relative to the depreciable amount of the assets. It measures the
amount of the consumable parts of assets that are consumed in a period (depreciation) expressed as a
percentage of the depreciable amount.
Rate of annual asset renewal *
The ratio of asset renewal and replacement expenditure relative to depreciable amount for a period. It
measures whether assets are being replaced at the rate they are wearing out with capital renewal
expenditure expressed as a percentage of depreciable amount (capital renewal expenditure/DA).
Rate of annual asset upgrade/new *
A measure of the rate at which assets are being upgraded and expanded per annum with capital
upgrade/new expenditure expressed as a percentage of depreciable amount (capital upgrade/expansion
expenditure/DA).
Recoverable amount
The higher of an asset's fair value, less costs to sell and its value in use.
Recurrent expenditure
Relatively small (immaterial) expenditure or that which has benefits expected to last less than 12 months.
Recurrent expenditure includes operations and maintenance expenditure.
Recurrent funding
Funding to pay for recurrent expenditure.
Rehabilitation
See capital renewal expenditure definition above.
Remaining useful life
The time remaining until an asset ceases to provide the required service level or economic usefulness. Age
plus remaining useful life is useful life.
Renewal
See capital renewal expenditure definition above.
Residual value
The estimated amount that an entity would currently obtain from disposal of the asset, after deducting the
estimated costs of disposal, if the asset were already of the age and in the condition expected at the end of
its useful life.

Pg. 82
Carpark Asset Management Plan 2017
Revenue generating investments
Investments for the provision of goods and services to sustain or improve services to the community that
are expected to generate some savings or revenue to offset operating costs, eg public halls and theatres,
childcare centres, sporting and recreation facilities, tourist information centres, etc.
Risk management
The application of a formal process to the range of possible values relating to key factors associated with a
risk in order to determine the resultant ranges of outcomes and their probability of occurrence.
Section or segment
A self-contained part or piece of an infrastructure asset.
Service potential
The total future service capacity of an asset. It is normally determined by reference to the operating
capacity and economic life of an asset. A measure of service potential is used in the not-for-profit
sector/public sector to value assets, particularly those not producing a cash flow.
Service potential remaining
A measure of the future economic benefits remaining in assets. It may be expressed in dollar values (Fair
Value) or as a percentage of total anticipated future economic benefits. It is also a measure of the
percentage of the asset’s potential to provide services that is still available for use in providing services
(Depreciated Replacement Cost/Depreciable Amount).
Specific Maintenance
Replacement of higher value components/sub-components of assets that is undertaken on a regular cycle
including repainting, replacement of air conditioning equipment, etc. This work generally falls below the
capital/ maintenance threshold and needs to be identified in a specific maintenance budget allocation.
Strategic Longer-Term Plan
A plan covering the term of office of councillors (four years minimum) reflecting the needs of the
community for the foreseeable future. It brings together the detailed requirements in the Council’s longer-
term plans such as the asset management plan and the long-term financial plan. The plan is prepared in
consultation with the community and details where the Council is at that point in time, where it wants to
go, how it is going to get there, mechanisms for monitoring the achievement of the outcomes and how the
plan will be resourced.
Sub-component
Smaller individual parts that make up a component part.
Useful life
Either: (a) the period over which an asset is expected to be available for use by an entity, or (b) the
number of production or similar units expected to be obtained from the asset by the entity.
It is estimated or expected time between placing the asset into service and removing it from service, or the
estimated period of time over which the future economic benefits embodied in a depreciable asset, are
expected to be consumed by the Council.
Value in use
The present value of future cash flows expected to be derived from an asset or cash generating unit. It is
deemed to be depreciated replacement cost (DRC) for those assets whose future economic benefits are
not primarily dependent on the asset's ability to generate net cash inflows, where the entity would, if
deprived of the asset, replace its remaining future economic benefits.
Source: IPWEA, 2009, Glossary., Additional and modified glossary items shown *

Pg. 83
Carpark Asset Management Plan 2017
Appendix G CAMP Improvement Plan
The asset management improvement plan is shown below
Item Priority Resources
Update Register of Public Carparks including Carpark
Condition Assessment High 20,000
Assign Carpark Hierarchy and Criticality Medium 5,000
Consult with the community and develop service level
measures Medium 25,000
MyPredictor Asset Modelling High 5,000
Review of Useful Lives and Unit Rates Medium 5,000
TOTAL EXTERNAL RESOURCES/FUNDING REQUIRED $60,000