Nearby Dwarf Galaxies - Department of Astronomy - University of

The Astrophysical Journal Letters, 777:L4 (6pp), 2013 November 1 doi:10.1088/2041-8205/777/1/L4C© 2013. The American Astronomical Society. All rights reserved. Printed in the U.S.A.
CARMA SURVEY TOWARD INFRARED-BRIGHT NEARBY GALAXIES (STING). III. THE DEPENDENCEOF ATOMIC AND MOLECULAR GAS SURFACE DENSITIES ON GALAXY PROPERTIES
Tony Wong1, Rui Xue1, Alberto D. Bolatto2, Adam K. Leroy3, Leo Blitz4, Erik Rosolowsky5, Frank Bigiel6,David B. Fisher2, Jurgen Ott7, Nurur Rahman8,10, Stuart N. Vogel2, and Fabian Walter9
1 Department of Astronomy, University of Illinois, Urbana, IL 61801, USA2 Department of Astronomy, University of Maryland, College Park, MD 20742, USA
3 National Radio Astronomy Observatory, Charlottesville, VA 22903, USA4 Department of Astronomy, University of California, Berkeley, CA 94720, USA
5 Department of Physics, University of Alberta, Edmonton, AB T6G 2E1, Canada6 Institut fur theoretische Astrophysik, Zentrum fur Astronomie der Universitat Heidelberg, Albert-Ueberle Str. 2, D-69120 Heidelberg, Germany
7 National Radio Astronomy Observatory, Socorro, NM 87801, USA8 Department of Physics, C1 Lab 140, University of Johannesburg, P.O. Box 524, Auckland Park, Johannesburg 2006, South Africa
9 Max-Planck-Institut fur Astronomie, Konigstuhl 17, D-69117 Heidelberg, GermanyReceived 2013 August 21; accepted 2013 September 20; published 2013 October 9
ABSTRACT
We investigate the correlation between CO and H i emission in 18 nearby galaxies from the CARMA SurveyToward IR-Bright Nearby Galaxies (STING) at sub-kpc and kpc scales. Our sample, spanning a wide range instellar mass and metallicity, reveals evidence for a metallicity dependence of the H i column density measured inregions exhibiting CO emission. Such a dependence is predicted by the equilibrium model of McKee and Krumholz,which balances H2 formation and dissociation. The observed H i column density is often smaller than predictedby the model, an effect we attribute to unresolved clumping, although values close to the model prediction arealso seen. We do not observe H i column densities much larger than predicted, as might be expected were there adiffuse H i component that did not contribute to H2 shielding. We also find that the H2 column density inferred fromCO correlates strongly with the stellar surface density, suggesting that the local supply of molecular gas is tightlyregulated by the stellar disk.
Key words: galaxies: ISM – ISM: atoms – ISM: molecules
Online-only material: color figures
1. INTRODUCTION
Molecular gas in galaxies provides the raw material forstar formation (e.g., McKee & Ostriker 2007), yet in mostgalaxies the interstellar medium (ISM) is predominantly atomic.Understanding how the conversion of atomic-to-molecular gasis related to galaxy global properties, e.g., mass, morphology,and metallicity, is therefore critical to predicting the dense gasfraction and hence the star formation rate (e.g., Lada et al. 2012).Resolved studies of the spatial distribution of molecular andatomic gas over a wide variety of nearby galaxies can be usedto test proposed theories of ISM phase balance (e.g., Krumholzet al. 2009; Ostriker et al. 2010) and constrain the evolution ofthe ISM through cosmic time (e.g., Obreschkow et al. 2009;Bauermeister et al. 2010).
Over the past few decades, the 21 cm H i line and the 3 mmCO J = 1–0 line have been the primary methods to study theatomic and molecular gas components of nearby galaxies. Themajor reasons for using CO as a molecular gas tracer areits intrinsic brightness, modest excitation requirements, highabundance relative to H2, and accessibility to ground-basedradio telescopes. Thus, despite the uncertainty in convertingCO intensity to H2 column density, typically performed using aconstant scaling factor (“X-factor”; see Bolatto et al. 2013 fora recent review), CO remains the preferred method to surveythe molecular gas content in galaxies. In contrast to CO, theinference of atomic gas mass from 21 cm emission is fairlydirect, except in cases where the optical depth is thought to be
10 South Africa SKA Postdoctoral Fellow.
significant. The primary challenge for systematically mappingH i in nearby galaxies is achieving both high angular resolutionand sensitivity.
While early observations (e.g., Tacconi & Young 1986) hadalready indicated that H i and CO are distributed very differentlyin galaxies, with CO largely confined to the stellar disk, thecomparison of radial H i and CO profiles across significantsamples by Wong & Blitz (2002), Blitz & Rosolowsky (2006,hereafter BR06), and Leroy et al. (2008) revealed strong radialtrends in the ratio of molecular to atomic hydrogen mass surfacedensity,
Rmol ≡ ΣH2/ΣH i ,
which exhibit a tight correlation with a simple estimate ofthe midplane gas pressure based on hydrostatic equilibrium,Pmp ∝ Σgas
√ρ∗. This supported an earlier model by Elmegreen
(1993) that interstellar pressure (and, secondarily, radiationfield) govern the H i to H2 transition. Note that Rmol is related tothe quantity fmol ≡ ΣH2/Σgas = Rmol/(1 + Rmol), which is moreproperly referred to as the molecular gas fraction but exhibitsmuch less dynamic range.
In recent years there has been a resurgence of interest intheoretical modeling of the H i to H2 transition, includingattempts to model the physical and chemical processes onsmall scales in a time-dependent manner (Pelupessy et al. 2006;Glover et al. 2010), as well as construct analytic equilibriummodels suitable for cloud scales and larger. The latter approachhas been outlined in a series of papers by Krumholz et al.(2008), Krumholz et al. (2009, hereafter KMT09), and McKee& Krumholz (2010, hereafter MK10). Roughly speaking, an
1

The Astrophysical Journal Letters, 777:L4 (6pp), 2013 November 1 Wong et al.
equilibrium H2 abundance arises from a competition betweenH2 formation on grains and photodissociation by UV radiation.Thus, for a given cloud the molecular gas fraction dependson the dust optical depth of the cloud (since dust excludesdissociating radiation and encourages molecule formation) andthe strength of the external radiation field. A dependence offmol on metallicity enters via the correlation of metallicity withthe dust abundance. Already there have been attempts to applythe empirical Rmol–Pmp relation of BR06 and the theoreticalpredictions for fmol of KMT09 and MK10 to cosmologicalcontexts (e.g., Obreschkow et al. 2009; Fu et al. 2010; Lagoset al. 2011; Kuhlen et al. 2012), underscoring the importance oftesting their applicability across a broader range of galaxies.
The CARMA11 Survey Toward IR-Bright Nearby Galaxies(STING) is a major effort to measure the molecular gas proper-ties and their relation to star formation in a sample of ∼20 nearbystar-forming galaxies. Unlike the precursor BIMA Survey ofNearby Galaxies (SONG; Helfer et al. 2003), the STING sam-ple is specifically chosen to cover a wide range in stellar mass,and thus covers a wide range in associated galaxy properties(star formation rate, color, luminosity, metallicity, etc.). Sup-plementing STING CO data with ancillary multi-wavelengthdata from the ultraviolet (UV) to infrared (IR), Rahman et al.(2011) studied the spatially resolved star formation law and itssensitivity to different analysis methods in NGC 4254, and haverecently extended this study to the full STING sample (Rahmanet al. 2012). The molecular gas data from the STING survey alsopermit a study of atomic-to-molecular gas transition, which isthe subject of this Letter. We compare the STING CO J = 1–0dataset with archival H i data from the NRAO Very Large Array(VLA) to examine the atomic and molecular gas relation in 18galaxies of the STING sample on sub-kpc to kpc scales. Ourprincipal observational result is a clear dependence of H i col-umn density on metallicity, and an equally striking dependenceof H2 column density on stellar surface density. A more detailedpresentation of these data and comparison with theoretical mod-els will be presented in a future work (Xue et al., in preparation,hereafter X14).
2. OBSERVATIONS AND DATA REDUCTION
The STING sample is composed of northern (δ > −20◦),moderately inclined (i < 75◦) galaxies within 45 Mpc selectedfrom the IRAS Revised Bright Galaxy Survey (Sanders et al.2003) to sample a wide range of stellar masses (and conse-quently, ISM metallicity). CO observations were conducted inthe C and D configurations of CARMA to yield a robustlyweighted synthesized beam of 3′′–4′′ across a field of viewextending to roughly half the optical radius. Calibration wasperformed using the MIRIAD package, but imaging and decon-volution were performed using CASA12 (McMullin et al. 2007),taking advantage of the multi-scale clean feature of CASAto better recover extended structures by searching for modelcomponents on multiple scales (in our case, point sources aswell as Gaussians twice and five times the width of the syn-thesized beam). For four galaxies (NGC 3198, 4254, 4536, and5713) with CO J = 2–1 single-dish maps from the HERACLESproject (Leroy et al. 2009, 2013b), a detailed comparison in X14
11 The Combined Array for Research in Millimeter-wave Astronomy(CARMA) is operated by the Universities of California (Berkeley), Chicago,Illinois, and Maryland, and the California Institute of Technology, under acooperative agreement with the University Radio Observatory program of theNational Science Foundation.12 Common Astronomy Software Applications, http://casa.nrao.edu
suggests that the CARMA maps recover �75% of the flux withinthe field of view.
We searched the NRAO Data Archive13 for public H i 21 cmdata of STING galaxies obtained in B, C, or D configurationsof the VLA with adequate velocity resolution (�20 km s−1)to separate line from continuum. Archival data were found for19 out of the 23 galaxies, so the present study is restrictedto this sub-sample. In addition, NGC 3593 shows unusuallylow deprojected H i column densities, which we attribute toits high inclination and significant optical depth in the 21 cmline, so we do not include it in the present analysis. To ensurethe most uniform possible data processing, we reprocessed thevisibility data using CASA. We employed multi-scale cleanfor well-resolved galaxies (with map resolution <1 kpc), andflagged regions with strong continuum emission (Tb > 50 K) aspotentially susceptible to optical depth effects. Further detailson the pipeline as well as data sources can be found in X14. TheFWHM beam parameters of the resulting H i maps (major andminor axis and position angle (P.A.)) are given in Table 1, andset the limiting resolution for our analysis.
A smoothing and masking process was used to generateintegrated line intensity images from the CO and H i data cubes.The cube was first smoothed along the spatial and velocity axesto increase the signal-to-noise ratio. A mask was then generatedfrom the smoothed cube by starting at emission peaks definedby at least two consecutive >4σ channels (where σ is the rmsnoise in the smoothed cube) and expanding outward to a 2σedge. This mask was then applied to the original cube, blankingregions outside the mask, before summing the velocity channels.Finally, the integrated intensity images were deprojected to face-on using the orientation parameters given in Table 1 after beingregridded to a common pixel scale and smoothed to a commonresolution (the latter chosen to achieve a circular beam whendeprojected). For reference, Table 1 also gives, as a measure ofthe physical resolution, the length scale rphy corresponding tothe deprojected H i beam using the median redshift-independentdistance (e.g., from the Tully–Fisher method) reported byNED.14
Face-on mass surface densities were calculated by using theoptically thin assumption for H i and a CO-to-H2 conversionfactor of αCO = 4.4 M pc−2 (K km s−1)−1 for CO (e.g.,Leroy et al. 2008). Reported surface densities include a factorof 1.36 to account for helium. The typical 1σ uncertainty inthe deprojected surface density, based on a typical integrationwindow of 20 km s−1 for CO and 40 km s−1 for H i, is givenin Table 1 and is appropriate for maps smoothed to the H iresolution. The deprojected intensity maps were sampled ontoa hexagonal grid with a spacing between grid centers equal tothe (deprojected) FWHM resolution of the image, following themethodology of Leroy et al. (2013b).
3. RESULTS
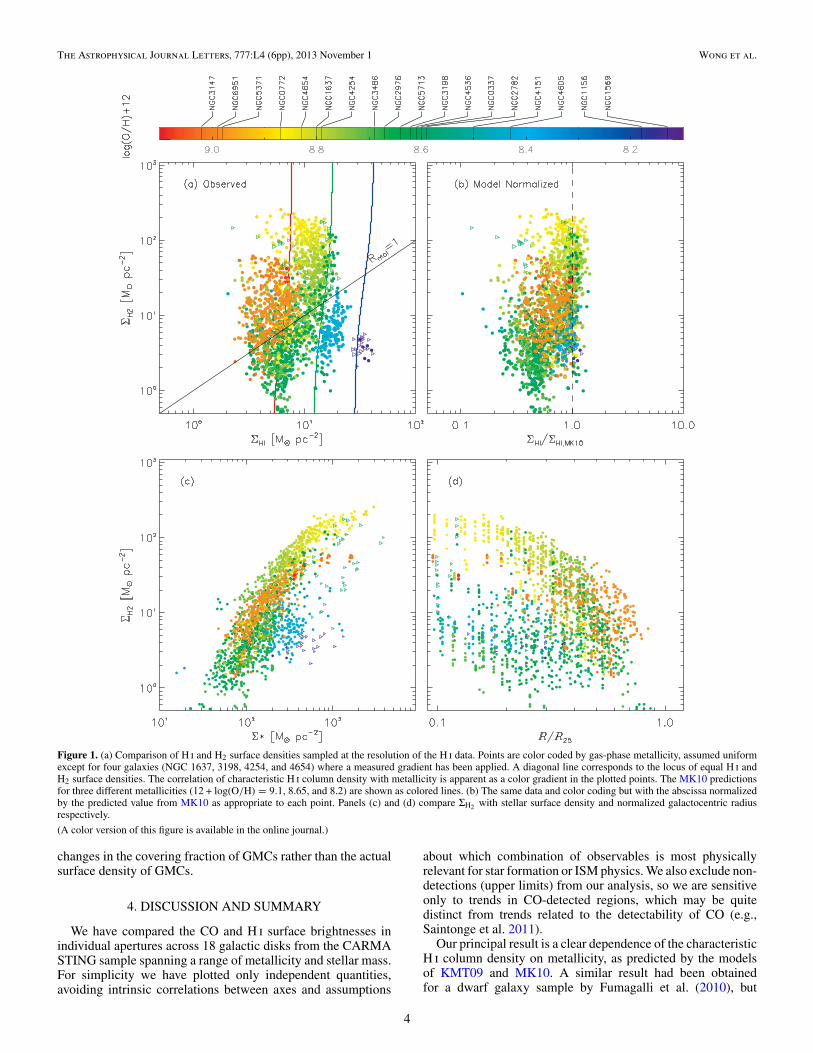
Figure 1(a) displays a point-by-point comparison of ΣH i andΣH2 at the limiting resolution of the H i data. Only regionswhere both H i and CO are detected at the >3σ level areshown. Open triangle symbols indicate H i measurements whichare potentially contaminated by absorption in front of brightcontinuum emission, and a diagonal line labeled Rmol = 1
13 http://archive.nrao.edu14 The NASA/IPAC Extragalactic Database (NED) is operated by the JetPropulsion Laboratory, California Institute of Technology, under contract withthe National Aeronautics and Space Administration.
2

The Astrophysical Journal Letters, 777:L4 (6pp), 2013 November 1 Wong et al.
Table 1Sample Properties
Name Dist. i P.A. MB 12+log(O/H) Metal Ref. bmaj × bmin (P.A.) rphy σΣH i σΣH2
(Mpc) (◦) (◦) (mag) (dex) (′′ × ′′) (◦) (kpc) (M pc−2) (M pc−2)
NGC 337 21.3 52 121 −19.99 ± 0.24 8.60 ± 0.34 1 28.5 × 20.5 (195) 4.74 0.09 0.61NGC 772 30.2 37 315 −21.57 ± 0.49 8.87 ± 0.13 6 48.1 × 43.0 (88) 8.50 0.04 0.67NGC 1156 7.0 52 272 −17.73 ± 0.34 8.18 ± 0.10 3 7.0 × 6.2 (336) 0.38 0.40 2.97NGC 1569 2.5 63 112 −17.65 ± 0.96 8.13 ± 0.12 3 6.6 × 5.6 (17) 0.18 0.25 1.01NGC 1637 9.8 39 213 −18.63 ± 0.56 8.80 ± 0.34 4 23.3 × 19.2 (169) 1.34 0.08 0.94NGC 2782 16.1 30 75 −18.79 ± 0.97 8.59 ± 0.10 3 7.5 × 6.2 (87) 0.61 0.57 4.48NGC 2976 3.6 65 335 −17.20 ± 0.50 8.67 ± 0.31 1 8.9 × 7.7 (46) 0.37 0.12 0.98NGC 3147 40.9 32 147 −21.72 ± 0.37 9.02 ± 0.36 2 21.3 × 18.0 (136) 4.40 0.10 1.12NGC 3198 14.0 72 215 −19.90 ± 0.28 8.62 ± 0.28 1 7.7 × 6.5 (66) 1.53 0.10 0.77NGC 3486 15.6 36 263 −19.99 ± 0.59 8.75 ± 0.32 2 59.2 × 49.8 (79) 4.69 0.07 0.37NGC 3593 5.5 67 90 −16.92 ± 0.08 8.29 ± 0.26 2 15.4 × 14.6 (346) 1.06 0.03 0.37NGC 4151 6.6 21 22 −17.71 ± 1.40 8.41 ± 0.28 2 9.6 × 8.8 (66) 0.33 0.59 3.22NGC 4254 15.6 31 69 −20.67 ± 0.23 8.79 ± 0.34 1 10.6 × 9.6 (95) 0.89 0.40 1.54NGC 4536 14.7 68 301 −19.74 ± 0.37 8.61 ± 0.40 1 10.1 × 9.4 (81) 1.86 0.14 0.72NGC 4605 5.5 67 300 −17.85 ± 0.41 8.43 ± 0.28 2 5.5 × 4.9 (72) 0.36 0.30 1.24NGC 4654 16.1 62 125 −20.02 ± 0.28 8.83 ± 0.27 5 16.9 × 16.4 (55) 2.82 0.06 0.45NGC 5371 27.7 48 11 −20.93 ± 0.55 8.90 ± 0.34 2 85.1 × 45.6 (81) 16.68 0.04 0.11NGC 5713 21.4 33 203 −19.95 ± 0.53 8.64 ± 0.40 1 16.9 × 16.2 (328) 2.08 0.14 0.77NGC 6951 23.3 46 138 −21.55 ± 0.27 8.99 ± 0.36 2 11.1 × 6.5 (48) 1.83 0.37 2.53
Notes. Metallicity references: (1) Moustakas et al. (2010); (2) Moustakas et al. (2010; L–Z); (3) Engelbracht et al. (2008); (4) van Zee et al. (1998); (5) Pilyugin et al.(2004) and Dors & Copetti (2006); (6) Anderson et al. (2010).
divides H i and H2-dominated regimes. Points are color codedby metallicity, determined as follows. For six objects lackingspectroscopic gas-phase metallicities (NGC 3147, 3486, 4151,4605, 5371, and 6951), we derive a fiducial metallicity forthe galaxy by applying the luminosity–metallicity relation ofMoustakas et al. (2010). For four galaxies (NGC 1637, 3198,4254, and 4654) for which a metallicity gradient has beendetermined from multiple spectroscopic measurements, wedetermine a local metallicity appropriate to each grid sample.For the remaining galaxies, we assign a single metallicity value(given in Table 1) across the galaxy, based on published H iiregion spectroscopy. (Since the gradients, when measured, aretypically around −0.5 dex per R25, and our observations areconfined to R � 0.5 R25, inclusion or omission of a gradient haslittle effect on our results.) We find that points for a given galaxytend to be distributed vertically, consistent with a nearly constantvalue of ΣH i when CO is detectable. However, horizontal offsetsbetween galaxies are clearly apparent, with lower metallicitygalaxies shifted to the right.
In Figure 1(b), ΣH i has been normalized by the H i surfacedensity predicted by MK10 (their Equations (13), (86), (91), and(93)) for the observed ΣH2 and metallicity; this is rather insen-sitive to the actual value of ΣH2 (and thus the adopted CO-to-H2conversion factor), as indicated by the nearly vertical shape ofthe model curves drawn in Figure 1(a). For the sample as a wholewe find a reduced dispersion in ΣH i (from 0.23 to 0.17 dex) afterapplying the MK10 prediction, as well as a shift of some of thelower metallicity outliers into the main concentration of points.We therefore see evidence for the metallicity dependence pre-dicted by the model. Nevertheless, the distribution is stronglyskewed to the left of the dashed line, where observed and pre-dicted column densities are equal. Thus, the model frequentlyoverpredicts ΣH i by factors of up to five, especially for lowervalues of ΣH2 . The trends and scatter we observe remain un-changed when we repeat the analysis for nine galaxies at a fixeddeprojected resolution of 2 kpc, suggesting they are not stronglyinfluenced by varying rphy across our sample.
The tendency for the MK10 model to overpredict ΣH i maybe linked to a reduction in measured peak gas column densities(relative to what would be measured on giant molecular cloud(GMC)-like scales) as a result of spatial averaging over kpc-scale beams. Because fmol is a steeply increasing function of Σgasin the model, the suppression of peaks in Σgas by beam averagingcauses the model to underestimate the molecular fraction andthus overestimate ΣH i. Higher values of ΣH2 may be subject toless beam dilution and may better reflect the conditions underwhich the MK10 model is directly applicable (i.e., a resolvedGMC complex and its atomic envelope). This may account forthe tendency for ΣH i/ΣH i,MK10 to approach unity for larger ΣH2 .Further discussion of this effect can be found in KMT09.
To investigate trends in ΣH2 independent of ΣH i, Figures 1(c)and (d) plot values of ΣH2 against stellar mass surface density(Σ∗) and scaled galactocentric radius, with points still colorcoded by metallicity. The stellar mass surface density is inferredfrom Spitzer 3.6 μm imaging (S4G project; Sheth et al. 2010)using Σ∗ = 317.7 × I3.6 (Eskew et al. 2012), where I3.6 is thebackground-subtracted 3.6 μm intensity in units of MJy sr−1. Astrong correlation between ΣH2 and Σ∗ is apparent, whereas norelationship with R/R25 is discernible in the sample as a whole.
Figure 2 provides another view of the ΣH2 –Σ∗ correlation byshowing the same data as Figure 1(a), but with points colorcoded by Σ∗. At the full H i resolution (left panel), it is clear thatΣH2 correlates well with Σ∗, except for a few low-metallicity,H i-dominated galaxies where ΣH2 is low despite high Σ∗. (Suchexceptions may reveal inaccuracies in our assumption a uniformX-factor and uniform mass-to-light ratio in the IR.) Averagevalues of ΣH i and ΣH2 (filled triangles), calculated in uniformlyspaced logarithmic bins of Σ∗, underscore the much greatersensitivity of ΣH2 to Σ∗. The same trend is seen at a fixedresolution of 2 kpc (right panel), for the nine galaxies observedat sufficiently high resolution, except that several of the low-metallicity systems drop out of the sample. We stress that theCO measurements are taken over areas much larger than anindividual GMC, so the observed trend probably originates from
3
The Astrophysical Journal Letters, 777:L4 (6pp), 2013 November 1 Wong et al.
Figure 1. (a) Comparison of H i and H2 surface densities sampled at the resolution of the H i data. Points are color coded by gas-phase metallicity, assumed uniformexcept for four galaxies (NGC 1637, 3198, 4254, and 4654) where a measured gradient has been applied. A diagonal line corresponds to the locus of equal H i andH2 surface densities. The correlation of characteristic H i column density with metallicity is apparent as a color gradient in the plotted points. The MK10 predictionsfor three different metallicities (12 + log(O/H) = 9.1, 8.65, and 8.2) are shown as colored lines. (b) The same data and color coding but with the abscissa normalizedby the predicted value from MK10 as appropriate to each point. Panels (c) and (d) compare ΣH2 with stellar surface density and normalized galactocentric radiusrespectively.
(A color version of this figure is available in the online journal.)
changes in the covering fraction of GMCs rather than the actualsurface density of GMCs.
4. DISCUSSION AND SUMMARY
We have compared the CO and H i surface brightnesses inindividual apertures across 18 galactic disks from the CARMASTING sample spanning a range of metallicity and stellar mass.For simplicity we have plotted only independent quantities,avoiding intrinsic correlations between axes and assumptions
about which combination of observables is most physicallyrelevant for star formation or ISM physics. We also exclude non-detections (upper limits) from our analysis, so we are sensitiveonly to trends in CO-detected regions, which may be quitedistinct from trends related to the detectability of CO (e.g.,Saintonge et al. 2011).
Our principal result is a clear dependence of the characteristicH i column density on metallicity, as predicted by the modelsof KMT09 and MK10. A similar result had been obtainedfor a dwarf galaxy sample by Fumagalli et al. (2010), but
4

The Astrophysical Journal Letters, 777:L4 (6pp), 2013 November 1 Wong et al.
Figure 2. (a) Same data points are shown as in Figure 1(a), but the points are color coded by stellar surface density as inferred from Spitzer 3.6 μm surface brightness.Solid triangles denote average values of ΣH i and ΣH2 , calculated in deciles of Σ∗. There is a strong gradient in stellar surface density along the ΣH2 axis. (b) ΣH2 vs.ΣH i, again color coded by Σ∗, determined at a fixed resolution of 2 kpc for galaxies with rphy < 2 kpc.
(A color version of this figure is available in the online journal.)
with less of a clear metallicity dependence. We find that amajor success of the MK10 model is its ability to predict theupper envelope of the observed ΣH i values, although the fulldistribution of points appears skewed below the predicted valuesby unresolved clumping within the beam. In particular, we do notsee evidence for a diffuse H i component that does not contributeto H2 shielding and would therefore cause the observed ΣH i toexceed the model prediction. On the other hand, the fact thatthe predicted value of ΣH i is sometimes reached in low ΣH2
regions suggests that H i and CO need not suffer equally frombeam dilution. This would imply a difference in how H i and COare spatially distributed, as found by recent studies of the SmallMagellanic Cloud (SMC; Bolatto et al. 2011) and other galaxies(Leroy et al. 2013a), and be inconsistent with the bulk of the H ibeing confined to the GMC envelopes modeled by MK10.
The correlation we observe between ΣH2 and Σ∗ (setting asidelow-metallicity systems for which the CO-to-H2 conversionfactor or 3.6 μm mass-to-light ratio may change) is hardlyunexpected: a correspondence between CO and stellar radialprofiles has been noted in many previous studies (e.g., Reganet al. 2001; Leroy et al. 2008, 2009; Schruba et al. 2011; Bigiel &Blitz 2012). Still, a comparison of Figures 1(a) and 2(a) vividlyillustrates that the H i and H2 column densities of galactic disksappear to be governed by distinct processes. It is possible thatthe two trends we observe, lower ΣH i with higher metallicity(which often associates with higher Σ∗) and higher ΣH2 withhigher Σ∗, reinforce each other to produce a tight correlationof Rmol with Σ∗ and estimates of hydrostatic pressure. However,since Σ∗ is dominated by the old stellar population, the processesthat maintain its tight correlation with ΣH2 remain unclear.
Studies probing GMC size scales find that the mass surfacedensities of GMCs are confined to a fairly narrow range(Bolatto et al. 2008; Roman-Duval et al. 2010), implyingthat kiloparsec-scale variations in ΣH2 are largely reflecting
the CO areal covering factor. We therefore hypothesize thatGMCs are more abundant in regions of galaxies with higherΣ∗. A simple explanation is that star formation in GMCsis responsible for building up the stellar disk, resulting in astellar disk that naturally mimics the H2 distribution. However,observational evidence for GMC lifetimes of only a few tens ofMyr (Kawamura et al. 2009; Murray 2011) raises the questionof why the GMCs should be regenerated at the same locationsin the disk. In present-day, highly evolved galaxies with gasfractions ∼0.1, it seems more plausible to argue that the H2distribution is governed by the stellar distribution. For instance,in the thermal equilibrium model of Ostriker et al. (2010), higherstellar density leads to higher pressure in the diffuse gas (asrequired by hydrostatic equilibrium), increasing the cooling rateand leading to the formation of bound clouds. Alternatively, H2consumption could be regulated by Σ∗-dependent gravitationalinstabilities (an idea explored further by Zheng et al. 2013), ora significant fraction of the total H2 supply may be recycledfrom the old stellar disk (an idea explored further by Leitner &Kravtsov 2011).
We thank the referee for suggestions which have improvedthe presentation of results. T.W. and R.X. acknowledge supportfrom NSF University Radio Facilities Program and the NASAAstrophysics Data Analysis Program. Support for CARMA con-struction was derived from the Gordon and Betty Moore Foun-dation, the Eileen and Kenneth Norris Foundation, the CaltechAssociates, the states of California, Illinois, and Maryland, andthe NSF. Funding for ongoing CARMA development and oper-ations are supported by NSF and CARMA partner universities.The National Radio Astronomy Observatory is a facility of theNational Science Foundation operated under cooperative agree-ment by Associated Universities, Inc.
Facilities: VLA, CARMA, Spitzer
5
The Astrophysical Journal Letters, 777:L4 (6pp), 2013 November 1 Wong et al.
REFERENCES
Anderson, J. P., Covarrubias, R. A., James, P. A., Hamuy, M., & Habergham,S. M. 2010, MNRAS, 407, 2660
Bauermeister, A., Blitz, L., & Ma, C.-P. 2010, ApJ, 717, 323Bigiel, F., & Blitz, L. 2012, ApJ, 756, 183Blitz, L., & Rosolowsky, E. 2006, ApJ, 650, 933Bolatto, A. D., Leroy, A. K., Jameson, K., et al. 2011, ApJ, 741, 12Bolatto, A. D., Leroy, A. K., Rosolowsky, E., Walter, F., & Blitz, L. 2008, ApJ,
686, 948Bolatto, A. D., Wolfire, M., & Leroy, A. K. 2013, ARA&A, 51, 207Dors, O. L., Jr., & Copetti, M. V. F. 2006, A&A, 452, 473Elmegreen, B. G. 1993, ApJ, 411, 170Engelbracht, C. W., Rieke, G. H., Gordon, K. D., et al. 2008, ApJ, 678, 804Eskew, M., Zaritsky, D., & Meidt, S. 2012, AJ, 143, 139Fu, J., Guo, Q., Kauffmann, G., & Krumholz, M. R. 2010, MNRAS, 409, 515Fumagalli, M., Krumholz, M. R., & Hunt, L. K. 2010, ApJ, 722, 919Glover, S. C. O., Federrath, C., Mac Low, M.-M., & Klessen, R. S.
2010, MNRAS, 404, 2Helfer, T. T., Thornley, M. D., Regan, M. W., et al. 2003, ApJS, 145, 259Kawamura, A., Mizuno, Y., Minamidani, T., et al. 2009, ApJS, 184, 1Krumholz, M. R., McKee, C. F., & Tumlinson, J. 2008, ApJ, 689, 865Krumholz, M. R., McKee, C. F., & Tumlinson, J. 2009, ApJ, 693, 216Kuhlen, M., Krumholz, M. R., Madau, P., Smith, B. D., & Wise, J. 2012, ApJ,
749, 36Lada, C. J., Forbrich, J., Lombardi, M., & Alves, J. F. 2012, ApJ, 745, 190Lagos, C. D. P., Baugh, C. M., Lacey, C. G., et al. 2011, MNRAS, 418, 1649Leitner, S. N., & Kravtsov, A. V. 2011, ApJ, 734, 48Leroy, A. K., Bolatto, A., Bot, C., et al. 2009, ApJ, 702, 352Leroy, A. K., Lee, C., Schruba, A., et al. 2013a, ApJL, 769, L12
Leroy, A. K., Walter, F., Brinks, E., et al. 2008, AJ, 136, 2782Leroy, A. K., Walter, F., Sandstrom, K., et al. 2013b, AJ, 146, 19McKee, C. F., & Krumholz, M. R. 2010, ApJ, 709, 308McKee, C. F., & Ostriker, E. C. 2007, ARA&A, 45, 565McMullin, J. P., Waters, B., Schiebel, D., Young, W., & Golap, K. 2007, in ASP
Conf. Ser. 376, Astronomical Data Analysis Software and Systems XVI, ed.R. A. Shaw, F. Hill, & D. J. Bell (San Francisco, CA: ASP), 127
Moustakas, J., Kennicutt, R. C., Jr., Tremonti, C. A., et al. 2010, ApJS, 190, 233Murray, N. 2011, ApJ, 729, 133Obreschkow, D., Croton, D., De Lucia, G., Khochfar, S., & Rawlings, S.
2009, ApJ, 698, 1467Ostriker, E. C., McKee, C. F., & Leroy, A. K. 2010, ApJ, 721, 975Pelupessy, F. I., Papadopoulos, P. P., & van der Werf, P. 2006, ApJ, 645, 1024Pilyugin, L. S., Vılchez, J. M., & Contini, T. 2004, A&A, 425, 849Rahman, N., Bolatto, A. D., Wong, T., et al. 2011, ApJ, 730, 72Rahman, N., Bolatto, A. D., Xue, R., et al. 2012, ApJ, 745, 183Regan, M. W., Thornley, M. D., Helfer, T. T., et al. 2001, ApJ, 561, 218Roman-Duval, J., Jackson, J. M., Heyer, M., Rathborne, J., & Simon, R.
2010, ApJ, 723, 492Saintonge, A., Kauffmann, G., Kramer, C., et al. 2011, MNRAS, 415, 32Sanders, D. B., Mazzarella, J. M., Kim, D.-C., Surace, J. A., & Soifer, B. T.
2003, AJ, 126, 1607Schruba, A., Leroy, A. K., Walter, F., et al. 2011, AJ, 142, 37Sheth, K., Regan, M., Hinz, J. L., et al. 2010, PASP, 122, 1397Tacconi, L. J., & Young, J. S. 1986, ApJ, 308, 600van Zee, L., Salzer, J. J., Haynes, M. P., O’Donoghue, A. A., & Balonek, T. J.
1998, AJ, 116, 2805Wong, T., & Blitz, L. 2002, ApJ, 569, 157Zheng, Z., Meurer, G. R., Heckman, T. M., Thilker, D. A., & Zwaan, M. A.
2013, MNRAS, 434, 3389
6


![Comparing [C II], HI, and CO Dynamics of Nearby Galaxies](https://static.fdocuments.us/doc/165x107/587df0761a28ab941a8b8242/comparing-c-ii-hi-and-co-dynamics-of-nearby-galaxies.jpg)