Carlos J. Costa BUSINESS INTELLIGENCE
42
2018/19 1 Carlos J. Costa (ISEG) BUSINESS INTELLIGENCE Carlos J. Costa
Transcript of Carlos J. Costa BUSINESS INTELLIGENCE

2018/19 1Carlos J. Costa (ISEG)
BUSINESS INTELLIGENCECarlos J. Costa

2019/20 2Carlos J. Costa (ISEG)
Business Intelligence
• What is Business Intelligence?• Business Analytics• BI Products and vendors• Datawarehouse• Predictive analytics• Big Data Analytics• Internet of Things (IoT)• Location Analytics and Geographic Information Systems• Decision Support for Senior Management• Decisions Support Techniques• Multidimensional Structure
2019/20 3Carlos J. Costa (ISEG)
What Is Business Intelligence?
2019/20 4Carlos J. Costa (ISEG)
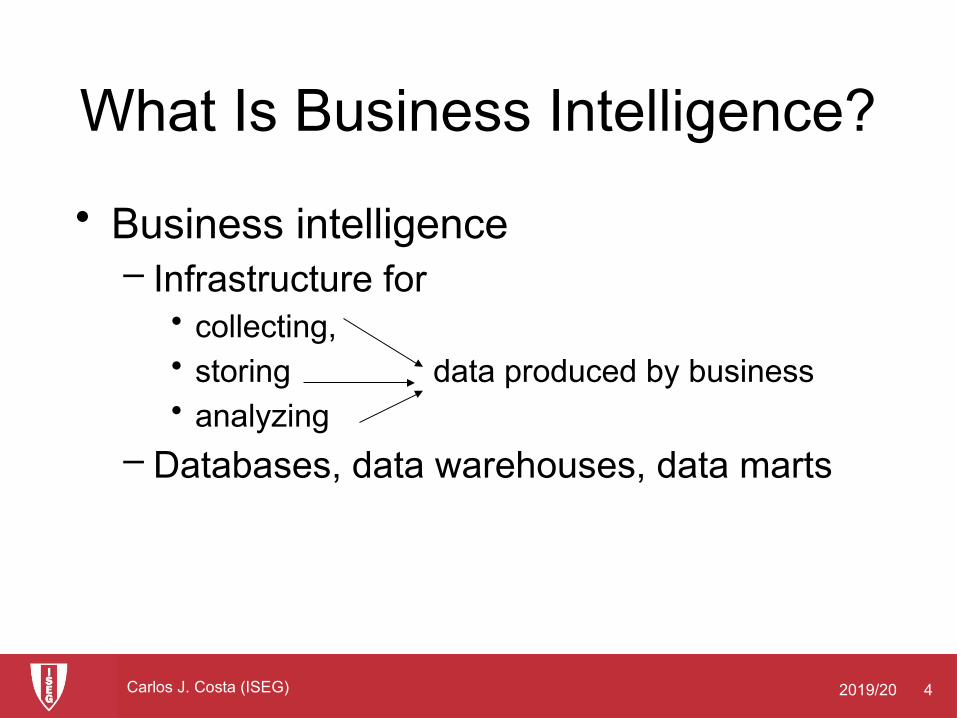
What Is Business Intelligence?
• Business intelligence– Infrastructure for
• collecting, • storing data produced by business• analyzing
– Databases, data warehouses, data marts
2019/20 5Carlos J. Costa (ISEG)
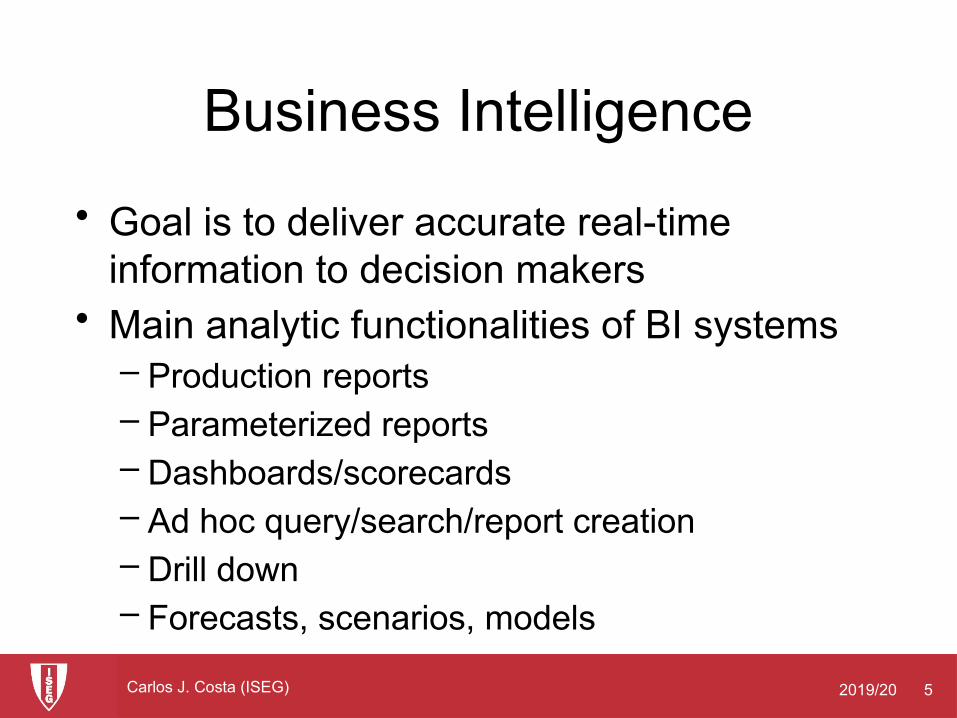
Business Intelligence
• Goal is to deliver accurate real-time information to decision makers
• Main analytic functionalities of BI systems– Production reports– Parameterized reports– Dashboards/scorecards– Ad hoc query/search/report creation– Drill down– Forecasts, scenarios, models
2019/20 6Carlos J. Costa (ISEG)
Business analytics
• Tools and techniques for analysing data• OLAP, statistics, models, data mining
2019/20 7Carlos J. Costa (ISEG)
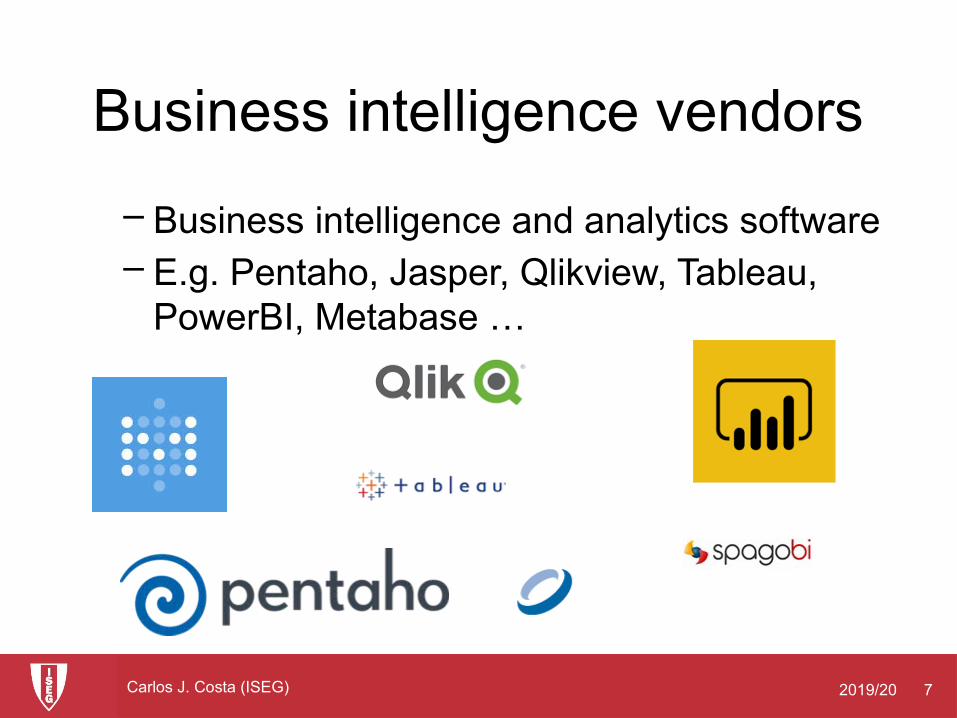
Business intelligence vendors
– Business intelligence and analytics software– E.g. Pentaho, Jasper, Qlikview, Tableau,
PowerBI, Metabase …
2019/20 8Carlos J. Costa (ISEG)
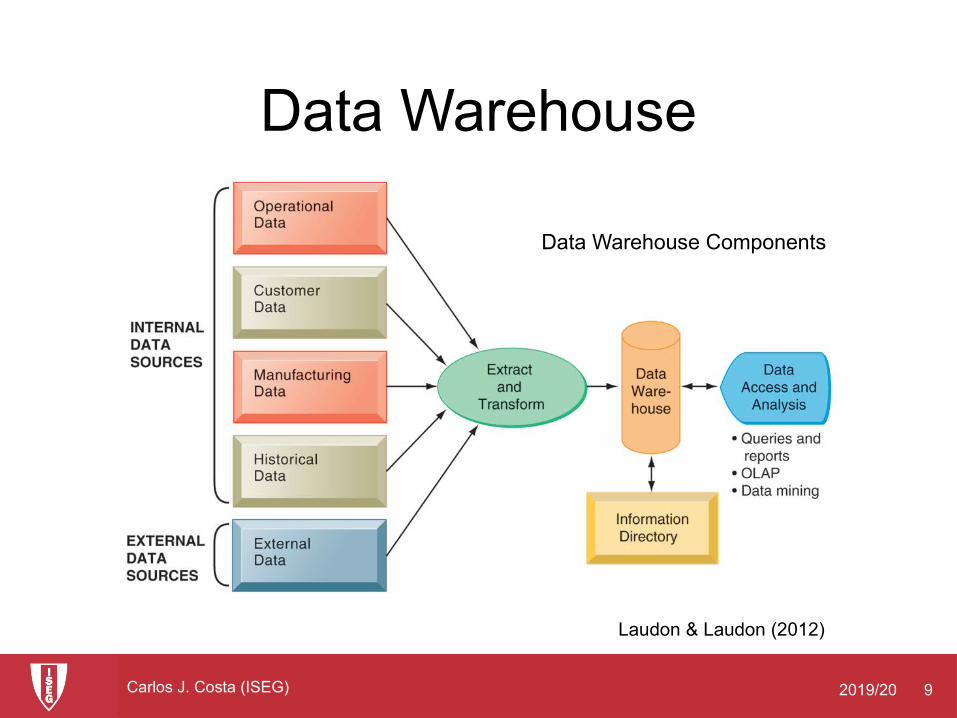
Data Warehouse
• Central repositories • Integrate data from one or more
disparate sources.• Store current and historical data in one
single place • Are used for creating analytical reports
for workers throughout the enterprise.
2019/20 9Carlos J. Costa (ISEG)
Data Warehouse
Laudon & Laudon (2012)
Data Warehouse Components
2019/20 10Carlos J. Costa (ISEG)
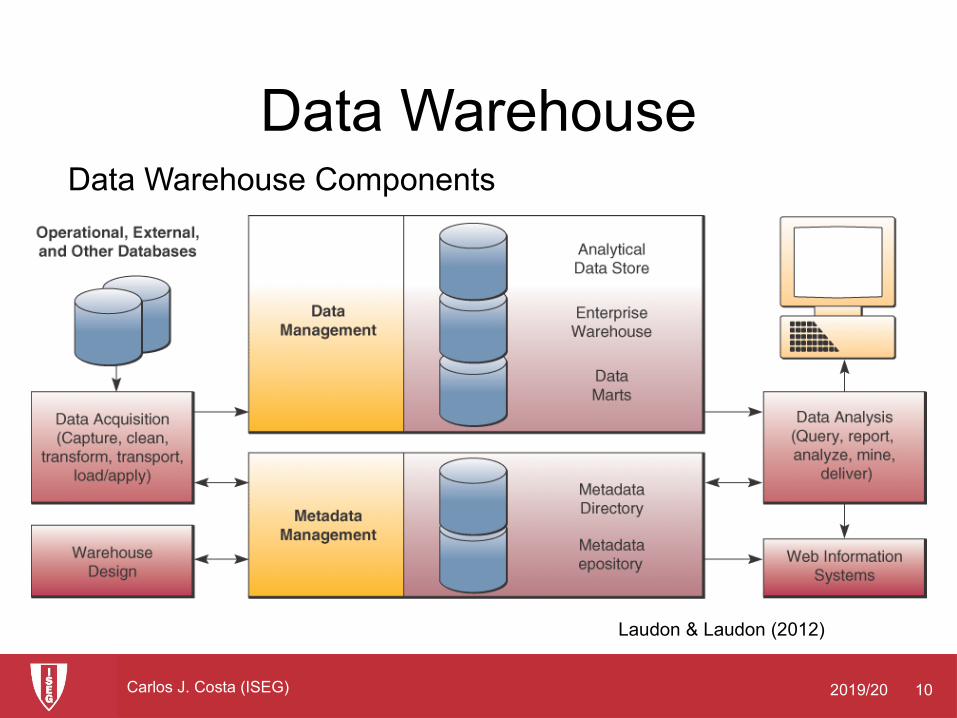
Data Warehouse
Laudon & Laudon (2012)
Data Warehouse Components
2019/20 11Carlos J. Costa (ISEG)
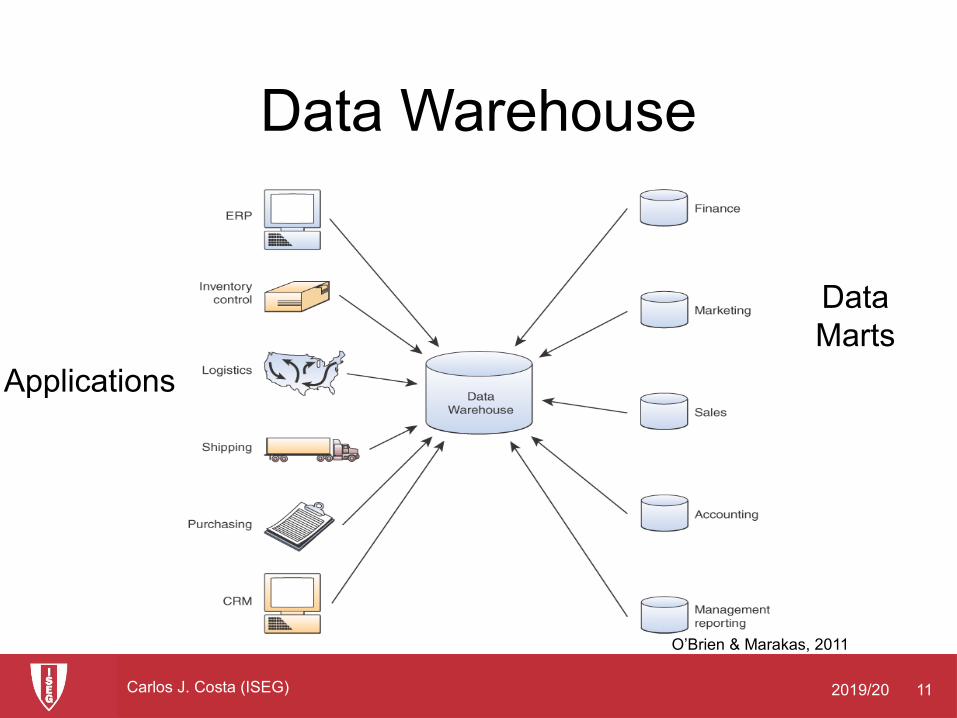
Data Warehouse
O’Brien & Marakas, 2011
Data Marts
Applications
2019/20 12Carlos J. Costa (ISEG)
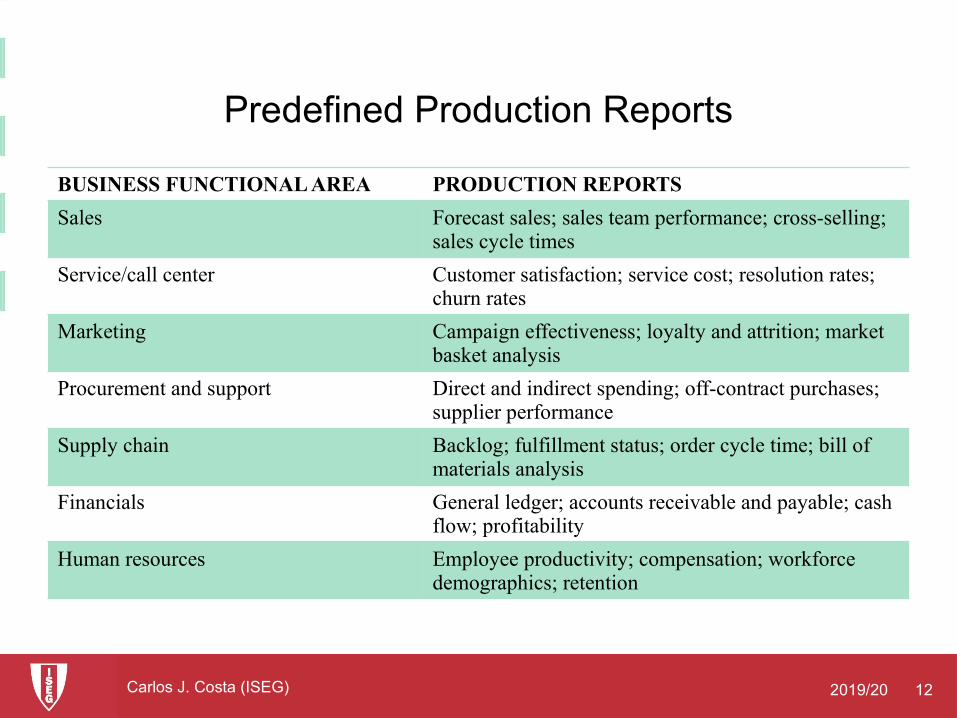
Predefined Production Reports
BUSINESS FUNCTIONAL AREAPRODUCTION REPORTS
SalesForecast sales; sales team performance; cross-selling; sales cycle times
Service/call centerCustomer satisfaction; service cost; resolution rates; churn rates
MarketingCampaign effectiveness; loyalty and attrition; market basket analysis
Procurement and supportDirect and indirect spending; off-contract purchases; supplier performance
Supply chainBacklog; fulfillment status; order cycle time; bill of materials analysis
FinancialsGeneral ledger; accounts receivable and payable; cash flow; profitability
Human resourcesEmployee productivity; compensation; workforce demographics; retention
BUSINESS FUNCTIONAL AREA PRODUCTION REPORTS
Sales Forecast sales; sales team performance; cross-selling; sales cycle times
Service/call center Customer satisfaction; service cost; resolution rates; churn rates
Marketing Campaign effectiveness; loyalty and attrition; market basket analysis
Procurement and support Direct and indirect spending; off-contract purchases; supplier performance
Supply chain Backlog; fulfillment status; order cycle time; bill of materials analysis
Financials General ledger; accounts receivable and payable; cash flow; profitability
Human resources Employee productivity; compensation; workforce demographics; retention

2019/20 13Carlos J. Costa (ISEG)
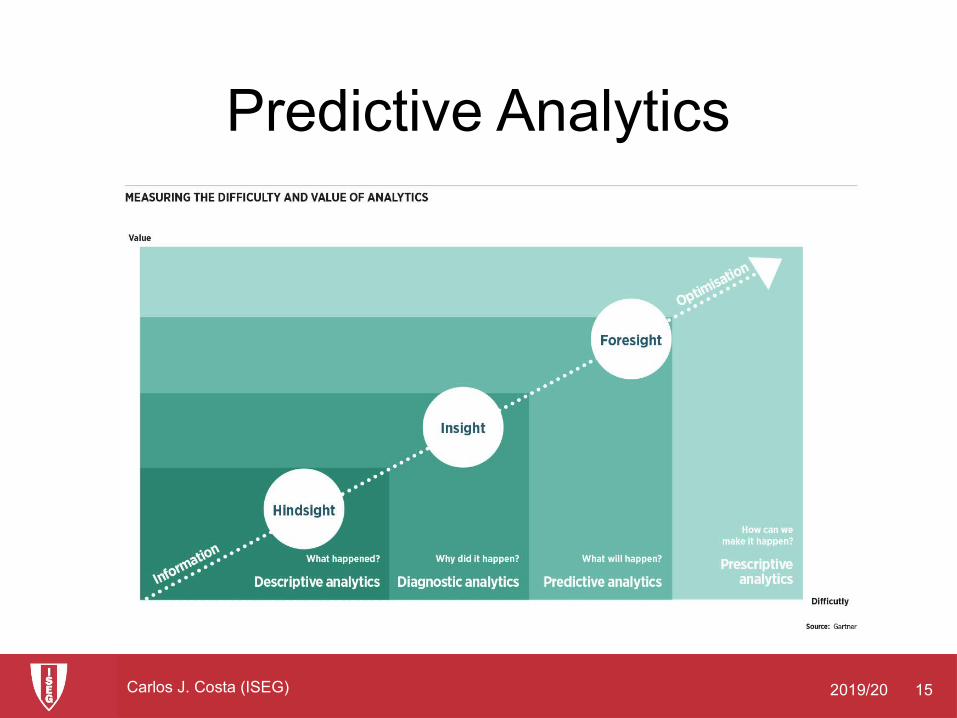
Predictive Analytics
• Uses variety of data, techniques to predict future trends and behavior patterns– Statistical analysis– Data mining– Historical data– Assumptions
• Incorporated into numerous BI applications for sales, marketing, finance, fraud detection, health care– Credit scoring– Predicting responses to direct marketing campaigns
2019/20 14Carlos J. Costa (ISEG)
Predictive Analytics
• https://trends.google.com/
• https://trends.google.pt/trends/explore?date=all&q=%2Fg%2F11_p4w4lm,%2Fg%2F125n18f5v,%2Fm%2F03c6__1,%2Fg%2F1z3t20rmg
2019/20 15Carlos J. Costa (ISEG)
Predictive Analytics
2019/20 16Carlos J. Costa (ISEG)
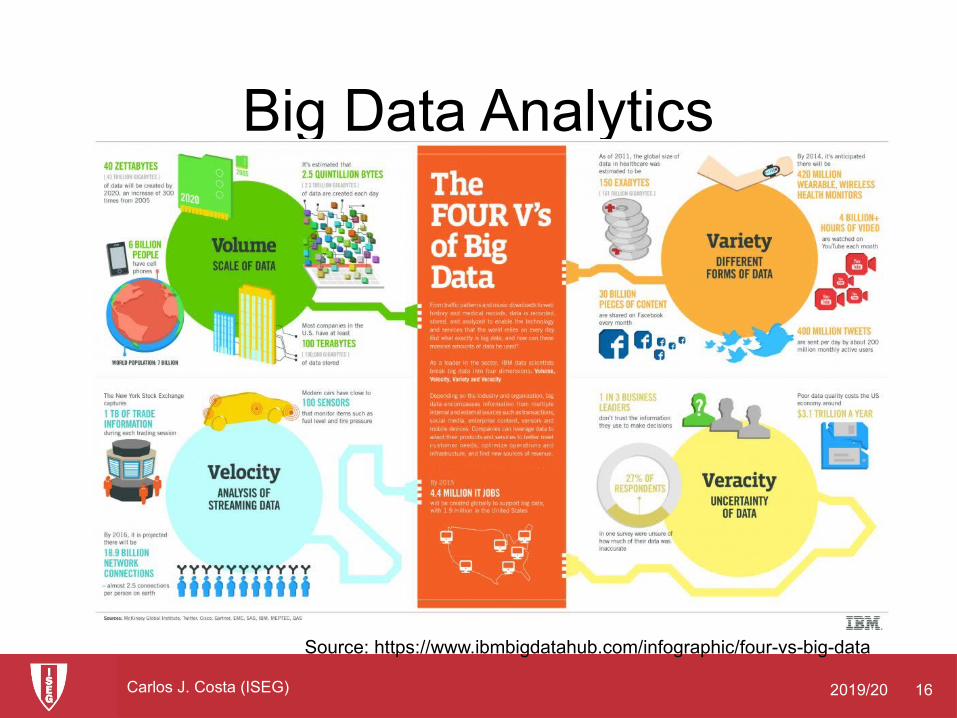
Big Data Analytics
Source: https://www.ibmbigdatahub.com/infographic/four-vs-big-data

2019/20 17Carlos J. Costa (ISEG)
Big Data Analytics
• https://www.youtube.com/watch?v=6seM6mYUEzo
2019/20 18Carlos J. Costa (ISEG)
Big Data Analytics
• Big data: Massive datasets collected from social media, online and in-store customer data, and so on
• Help create real-time, personalized shopping experiences for major online retailers
• Smart cities– Public records– Sensors, location data from smartphones– Ability to evaluate effect of one service change on
system
2019/20 19Carlos J. Costa (ISEG)
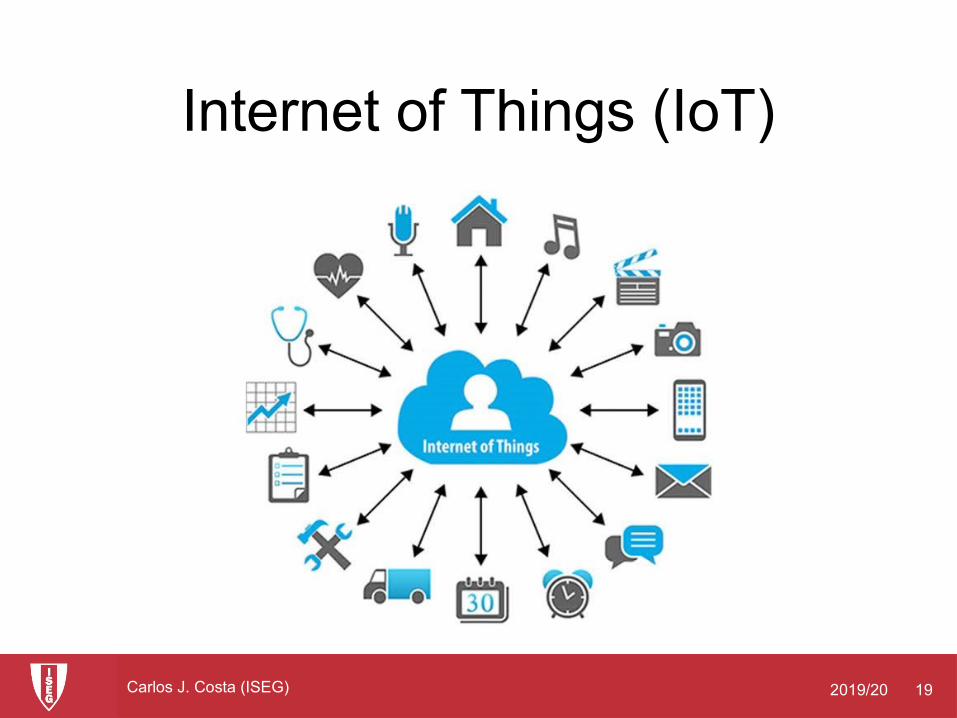
Internet of Things (IoT)
2019/20 20Carlos J. Costa (ISEG)
Internet of Things (IoT)
• Collection and use of data generated by sensors
• Creating huge streams of data from web activities, sensors, and other monitoring devices
2019/20 21Carlos J. Costa (ISEG)
Location Analytics and Geographic Information Systems
• Location analytics– Ability to gain business insight from the location
(geographic) component of data• Mobile phones• Sensors, scanning devices• Map data
• Geographic information systems (GIS)– Ties location-related data to maps– Example: For helping local governments
calculate response times to disasters
2019/20 22Carlos J. Costa (ISEG)
Location Analytics and Geographic Information Systems
• Google Maps

2019/20 23CCarlos J. Costa (ISEG)
Decision Support for Senior Management
Laudon & Laudon (2012)
2019/20 24Carlos J. Costa (ISEG)
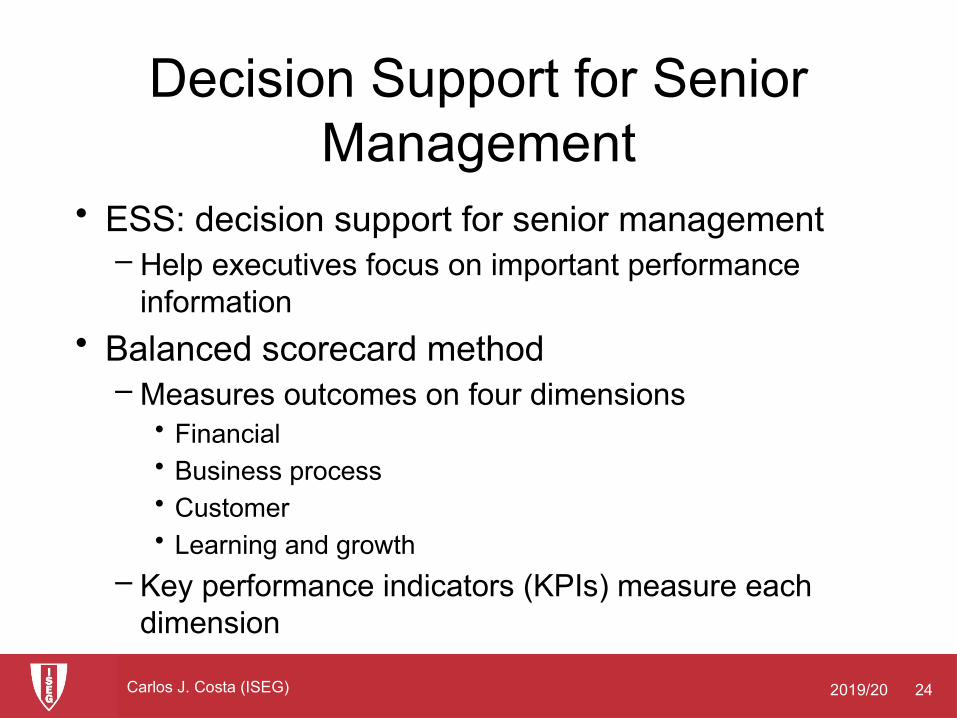
Decision Support for Senior Management
• ESS: decision support for senior management– Help executives focus on important performance
information• Balanced scorecard method
– Measures outcomes on four dimensions • Financial• Business process• Customer• Learning and growth
– Key performance indicators (KPIs) measure each dimension
2019/20 25CCarlos J. Costa (ISEG)
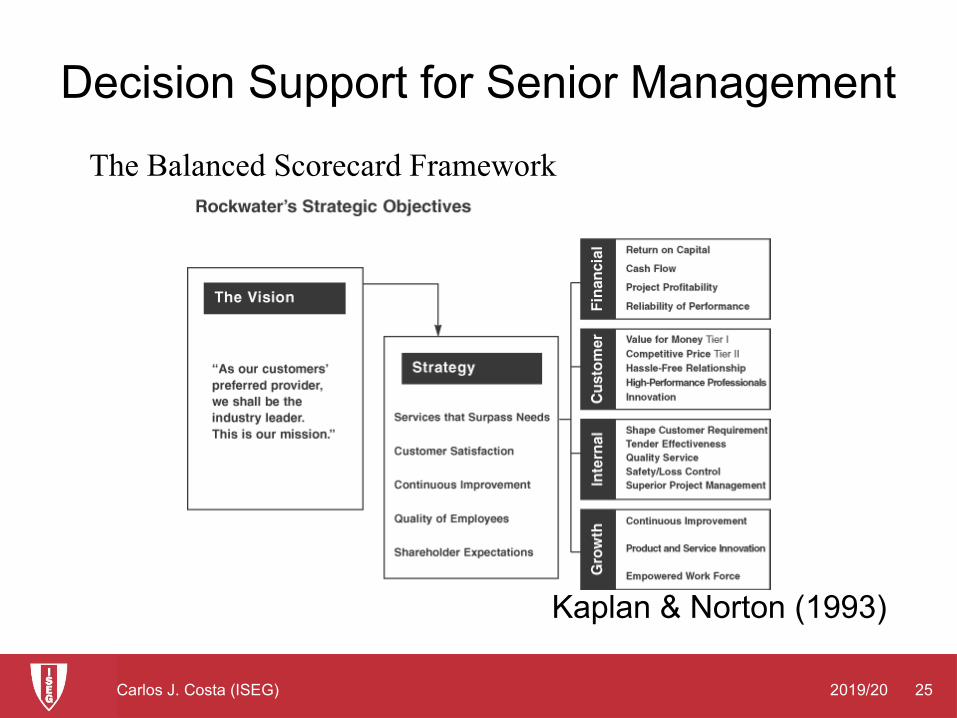
Decision Support for Senior Management
Kaplan & Norton (1993)
The Balanced Scorecard Framework
2019/20 26Carlos J. Costa (ISEG)
Decision Support for Senior Management
• Key Performance Indicator (KPI)– is a type of performance measurement. – the physical values which are used to
measure, compare and manage the overall organizational performance
– evaluate the success of an organization or of a specific activity (e.g. programs, projects, products and other initiatives).
2019/20 27Carlos J. Costa (ISEG)
Decision Support for Senior Management
• Key Performance Indicator (KPI)
• Strategy -> Objectives
• KPY= Objectives +Measurements
• Must be SMART• Specific• Measurable• Achievable• Relevant (aligned with strategy).• Time-bound (reached in specific time range)
2019/20 28Carlos J. Costa (ISEG)
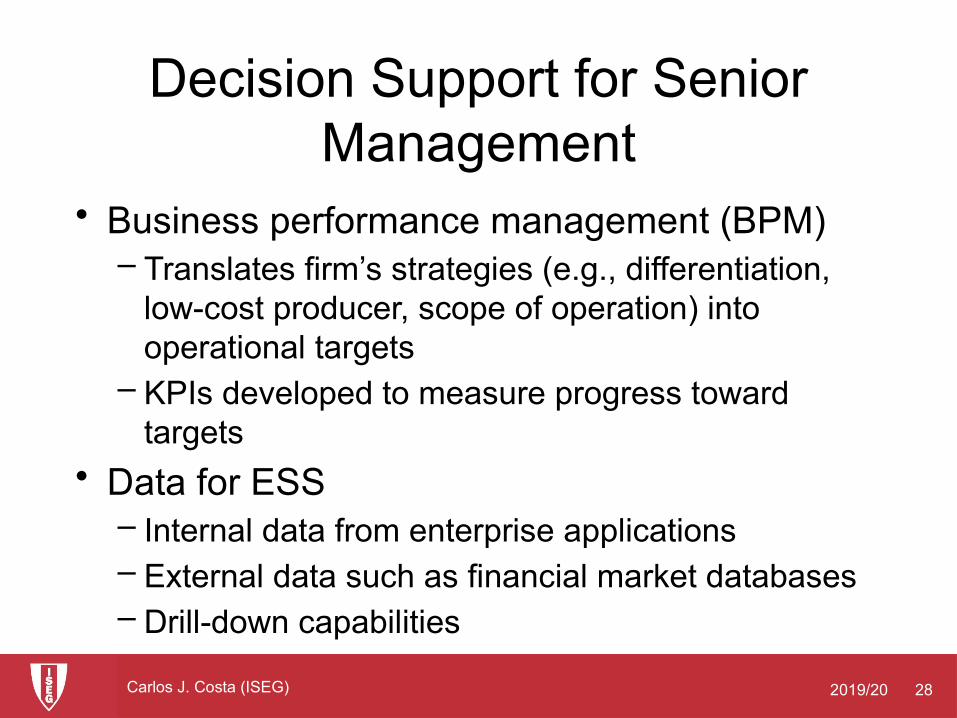
Decision Support for Senior Management
• Business performance management (BPM)– Translates firm’s strategies (e.g., differentiation,
low-cost producer, scope of operation) into operational targets
– KPIs developed to measure progress toward targets
• Data for ESS – Internal data from enterprise applications– External data such as financial market databases– Drill-down capabilities
2019/20 29Carlos J. Costa (ISEG)
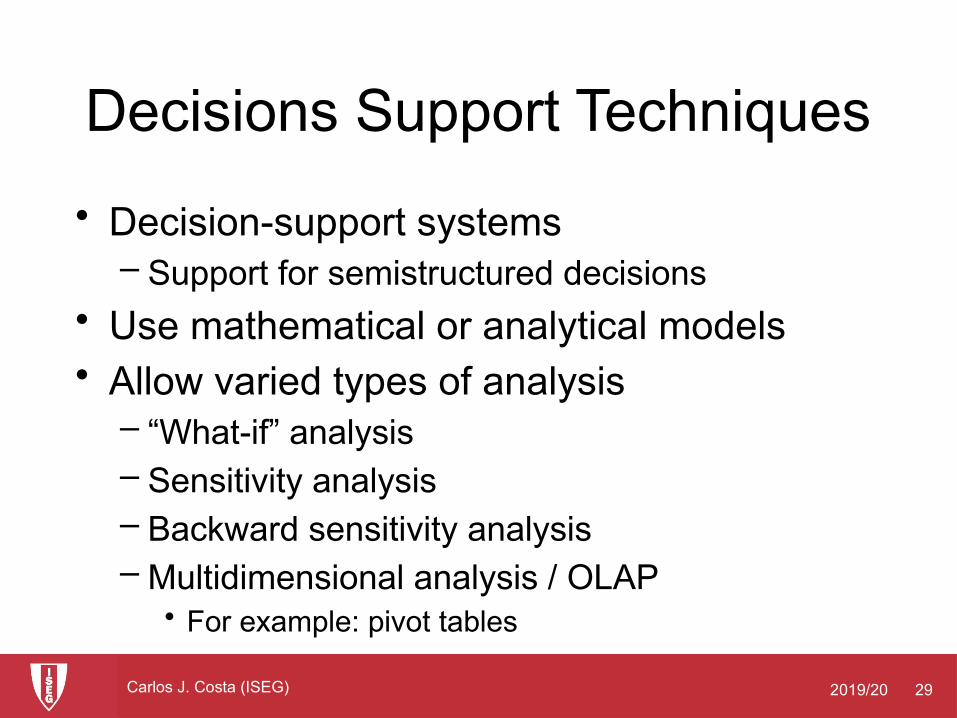
Decisions Support Techniques
• Decision-support systems– Support for semistructured decisions
• Use mathematical or analytical models• Allow varied types of analysis
– “What-if” analysis– Sensitivity analysis– Backward sensitivity analysis– Multidimensional analysis / OLAP
• For example: pivot tables
2019/20 30CCarlos J. Costa (ISEG)
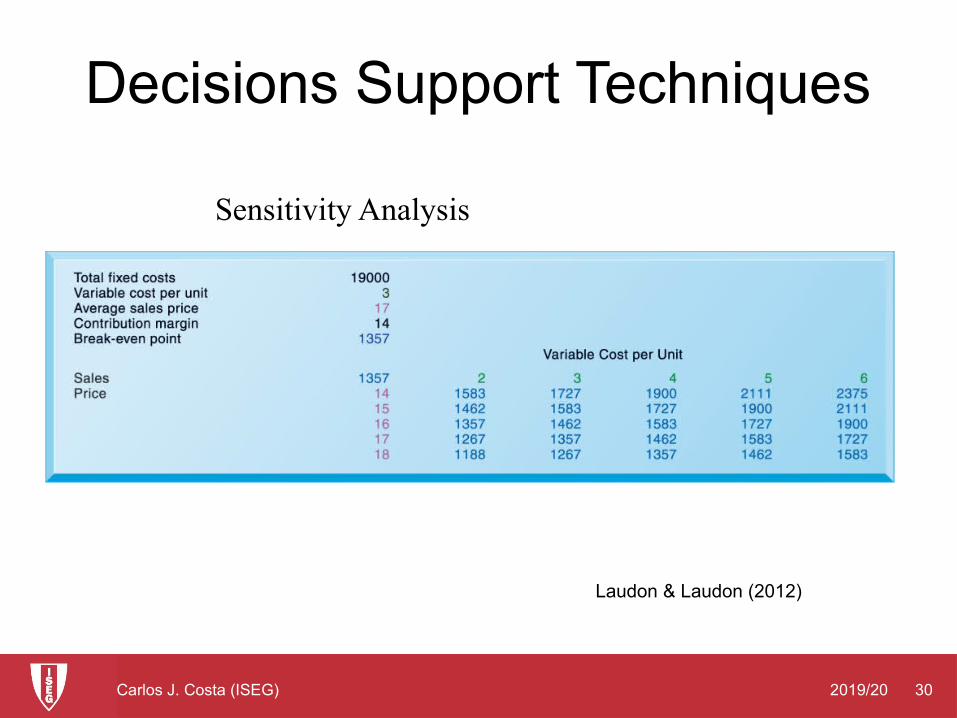
Decisions Support Techniques
Laudon & Laudon (2012)
Sensitivity Analysis
2019/20 31CCarlos J. Costa (ISEG)
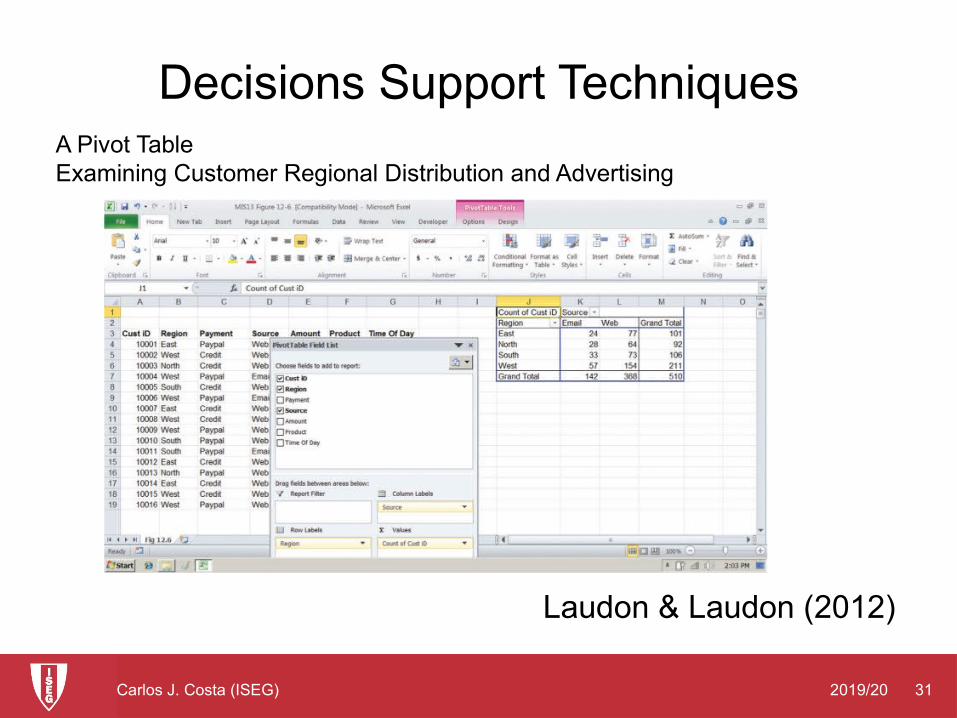
Decisions Support Techniques
Laudon & Laudon (2012)
A Pivot Table Examining Customer Regional Distribution and Advertising

2019/20 32Carlos J. Costa (ISEG)
Decisions Support Techniques
• Group Decision-Support Systems (GDSS)– Interactive system to facilitate solution of
unstructured problems by group– Specialized tools
• Virtual collaboration rooms• Software to collect, rank, edit participant ideas and
responses
– Promotes collaborative atmosphere, anonymity– Cisco’s Collaboration Meeting Rooms Hybrid (CMR)– Skype for Business
2019/20 33Carlos J. Costa (ISEG)
Multidimensional structure
• a variation of the relational model that uses multidimensional structures to organize data and express the relationships between data
O'Brien & Marakas (2009).

2019/20 34Carlos J. Costa (ISEG)
Dimensional Schema
• Primary keys• Foreign keys• Fact tables• Dimension Tables• Star schemas• Snowflake schemas
2019/20 35Carlos J. Costa (ISEG)
Primary key
• A primary key is a column or a set of columns in a table whose values uniquely identify a row in the table.
• A relational database is designed to enforce the uniqueness of primary keys by allowing only one row with a given primary key value in a table.
2019/20 36Carlos J. Costa (ISEG)
foreign key
• is a column or a set of columns in a table whose values correspond to the values of the primary key in another table.
• In order to add a row with a given foreign key value, there must exist a row in the related table with the same primary key value.
• The primary key/foreign key relationships between tables in a star or snowflake schema, sometimes called many-to-one relationships, represent the paths along which related tables are joined together in the database.
2019/20 37Carlos J. Costa (ISEG)
Dimension tables
• A dimension table is a table in a star or snowflake schema that stores attributes that describe aspects of a dimension.
• For example, a time table stores the various aspects of time such as year, quarter, month, and day.
• A foreign key of a fact table references the primary key in a dimension table in a many-to-one relationship.
2019/20 38Carlos J. Costa (ISEG)
Fact table
• A fact table is a table in a star or snowflake schema that stores facts that measure the business, such as sales, cost of goods, or profit.
• Fact tables also contain foreign keys to the dimension tables.
• These foreign keys relate each row of data in the fact table to its corresponding dimensions and levels.
2019/20 39Carlos J. Costa (ISEG)
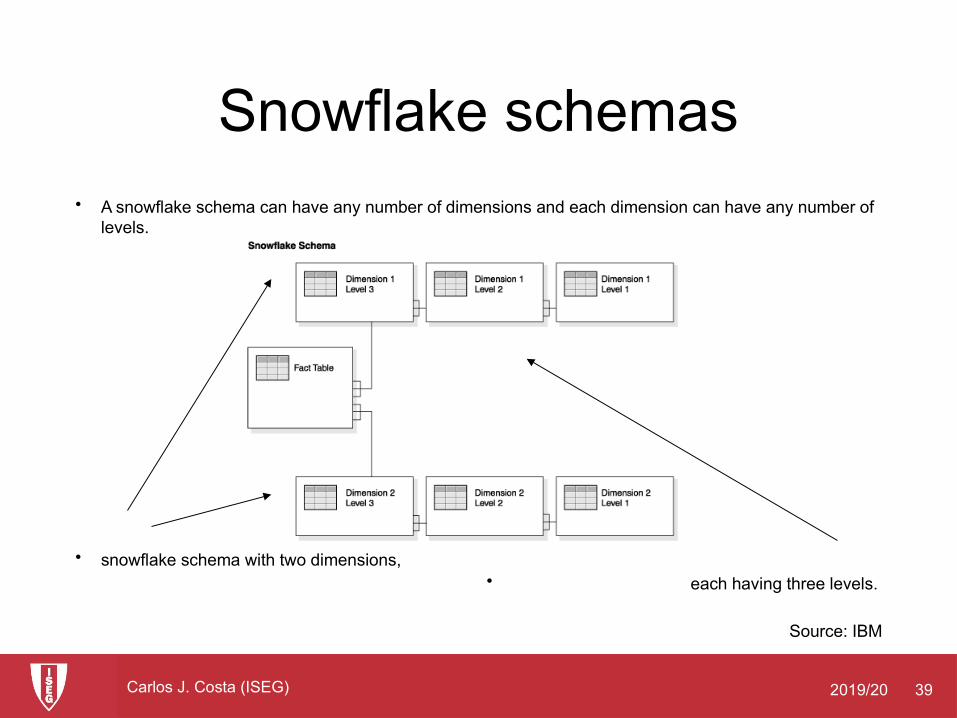
Snowflake schemas• A snowflake schema can have any number of dimensions and each dimension can have any number of
levels.
• snowflake schema with two dimensions, • each having three levels.
Source: IBM
2019/20 40Carlos J. Costa (ISEG)
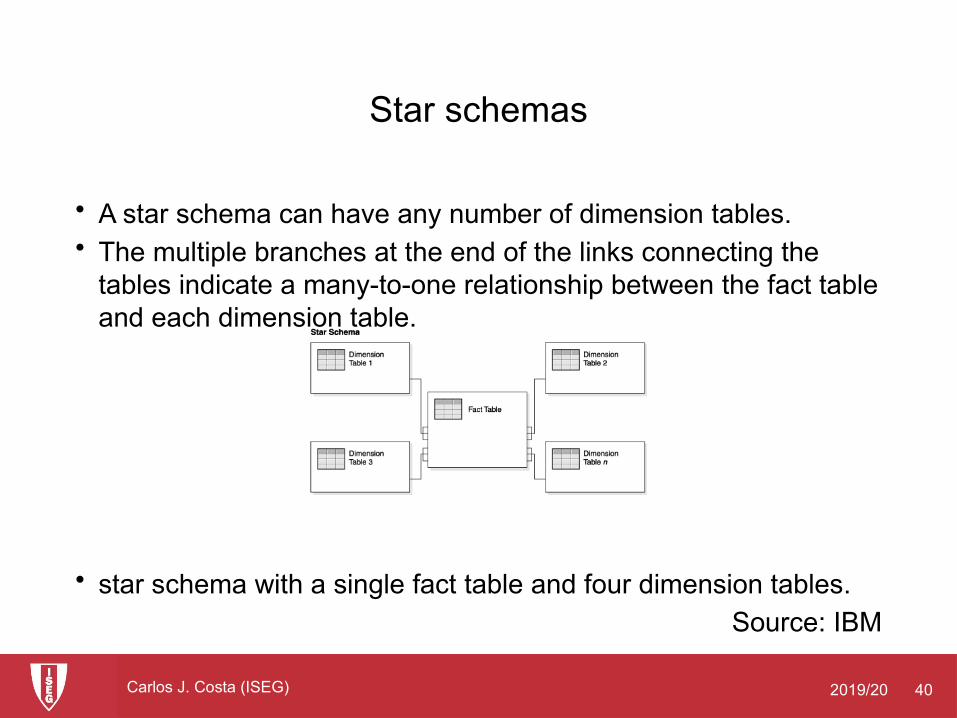
Star schemas
• A star schema can have any number of dimension tables. • The multiple branches at the end of the links connecting the
tables indicate a many-to-one relationship between the fact table and each dimension table.
• star schema with a single fact table and four dimension tables.
Source: IBM
2019/20 41Carlos J. Costa (ISEG)
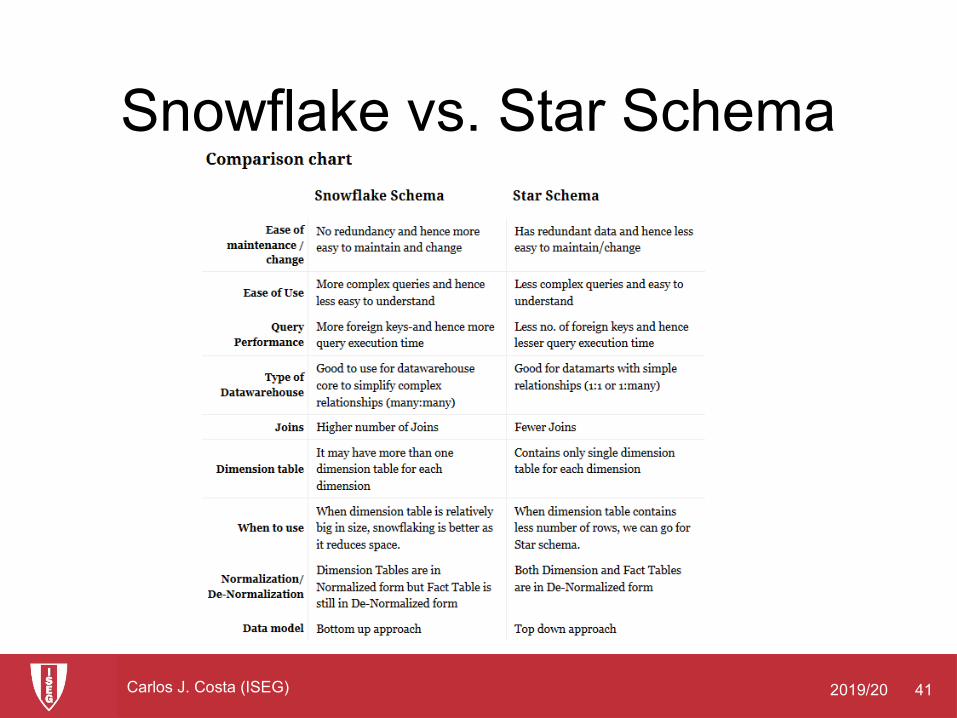
Snowflake vs. Star Schema

2019/20 42Carlos J. Costa (ISEG)
References
Few, Stephen (2006) Information Dashboard Design O’Reilly
Kaplan, Robert S; Norton, D. P. (1993). "Putting the Balanced Scorecard to Work". Harvard Business Review, sept-oct.
Microsoft, Power BI Advanced Visualization and Storytelling Slides
Mintzberg, H. (1989). Mintzberg on Management: Inside Our Strange World of Organizations. Simon and Schuster.
Laudon, Kenneth & Laudon, Jane (2012). Management Information Systems – Managing the Digital Firm, 12ª ed., Pearson, Harlow.
O'Brien, J. A., & Marakas, G. M. (2009). Management information systems (9th ed.). Boston, MA: McGraw-Hill/Irwin.
Parmenter, David (2010) Key Performance Indicators, Developing, Implementing,and Using Winning KPIs Second Edition, John Wiley & Sons, Inc. New Jersey