Carl E. Pray , Latha Nagarajan , Jikun Huang , Ruifa Hu ...bharat/Research/prayetal.pdfImpact of Bt...
38
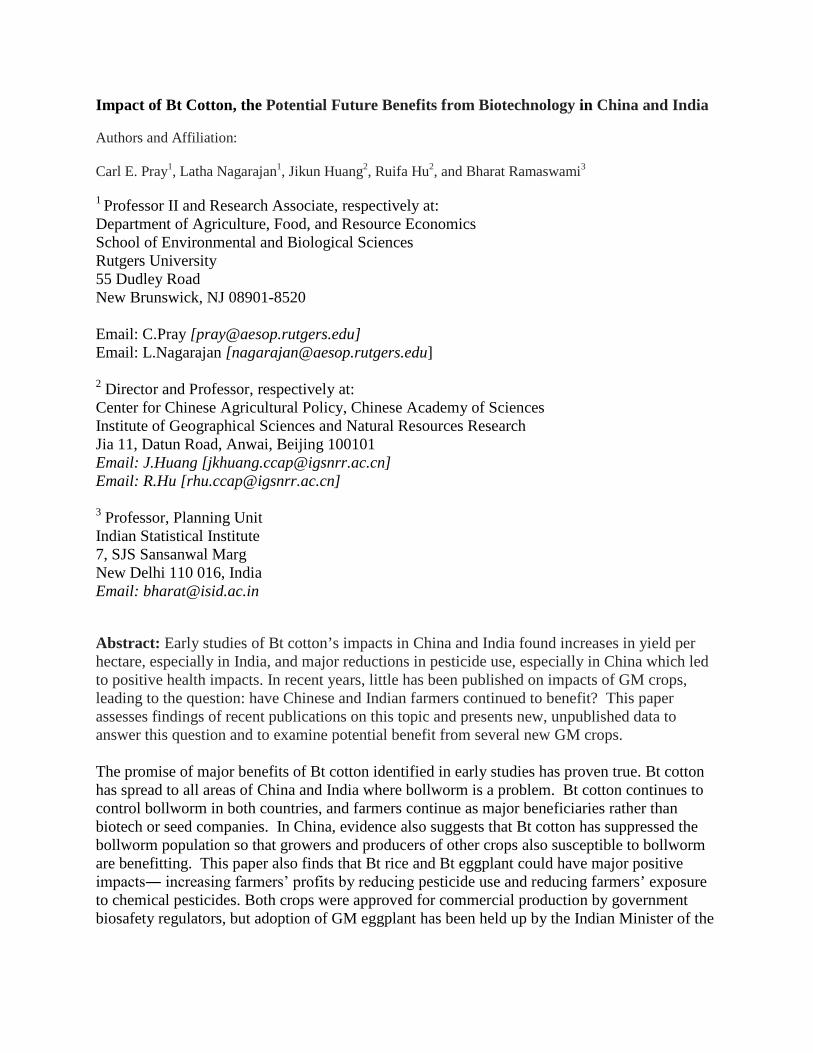
Impact of Bt Cotton, the Potential Future Benefits from Biotechnology in China and India Authors and Affiliation: Carl E. Pray 1 , Latha Nagarajan 1 , Jikun Huang 2 , Ruifa Hu 2 , and Bharat Ramaswami 3 1 Email: C.Pray [ Professor II and Research Associate, respectively at: Department of Agriculture, Food, and Resource Economics School of Environmental and Biological Sciences Rutgers University 55 Dudley Road New Brunswick, NJ 08901-8520 [email protected]] Email: L.Nagarajan [[email protected]] 2 Director and Professor, respectively at: Center for Chinese Agricultural Policy, Chinese Academy of Sciences Institute of Geographical Sciences and Natural Resources Research Jia 11, Datun Road, Anwai, Beijing 100101 Email: J.Huang [[email protected]] Email: R.Hu [[email protected]] 3 The promise of major benefits of Bt cotton identified in early studies has proven true. Bt cotton has spread to all areas of China and India where bollworm is a problem. Bt cotton continues to control bollworm in both countries, and farmers continue as major beneficiaries rather than biotech or seed companies. In China, evidence also suggests that Bt cotton has suppressed the bollworm population so that growers and producers of other crops also susceptible to bollworm are benefitting. This paper also finds that Bt rice and Bt eggplant could have major positive impacts― increasing farmers’ profits by reducing pesticide use and reducing farmers’ exposure to chemical pesticides. Both crops were approved for commercial production by government biosafety regulators, but adoption of GM eggplant has been held up by the Indian Minister of the Professor, Planning Unit Indian Statistical Institute 7, SJS Sansanwal Marg New Delhi 110 016, India Email: [email protected] Abstract: Early studies of Bt cotton’s impacts in China and India found increases in yield per hectare, especially in India, and major reductions in pesticide use, especially in China which led to positive health impacts. In recent years, little has been published on impacts of GM crops, leading to the question: have Chinese and Indian farmers continued to benefit? This paper assesses findings of recent publications on this topic and presents new, unpublished data to answer this question and to examine potential benefit from several new GM crops.
Transcript of Carl E. Pray , Latha Nagarajan , Jikun Huang , Ruifa Hu ...bharat/Research/prayetal.pdfImpact of Bt...
Impact of Bt Cotton, the Potential Future Benefits from Biotechnology in China and India Authors and Affiliation: Carl E. Pray1, Latha Nagarajan1, Jikun Huang2, Ruifa Hu2, and Bharat Ramaswami3
1
Email: C.Pray [
Professor II and Research Associate, respectively at: Department of Agriculture, Food, and Resource Economics School of Environmental and Biological Sciences Rutgers University 55 Dudley Road New Brunswick, NJ 08901-8520
[email protected]] Email: L.Nagarajan [[email protected]] 2 Director and Professor, respectively at: Center for Chinese Agricultural Policy, Chinese Academy of Sciences Institute of Geographical Sciences and Natural Resources Research Jia 11, Datun Road, Anwai, Beijing 100101 Email: J.Huang [[email protected]] Email: R.Hu [[email protected]] 3
The promise of major benefits of Bt cotton identified in early studies has proven true. Bt cotton has spread to all areas of China and India where bollworm is a problem. Bt cotton continues to control bollworm in both countries, and farmers continue as major beneficiaries rather than biotech or seed companies. In China, evidence also suggests that Bt cotton has suppressed the bollworm population so that growers and producers of other crops also susceptible to bollworm are benefitting. This paper also finds that Bt rice and Bt eggplant could have major positive impacts― increasing farmers’ profits by reducing pesticide use and reducing farmers’ exposure to chemical pesticides. Both crops were approved for commercial production by government biosafety regulators, but adoption of GM eggplant has been held up by the Indian Minister of the
Professor, Planning Unit Indian Statistical Institute 7, SJS Sansanwal Marg New Delhi 110 016, India Email: [email protected] Abstract: Early studies of Bt cotton’s impacts in China and India found increases in yield per hectare, especially in India, and major reductions in pesticide use, especially in China which led to positive health impacts. In recent years, little has been published on impacts of GM crops, leading to the question: have Chinese and Indian farmers continued to benefit? This paper assesses findings of recent publications on this topic and presents new, unpublished data to answer this question and to examine potential benefit from several new GM crops.

Environment while specific Bt rice hybrids are still being evaluated by the Chinese Ministry of Agriculture. Introduction China and India are two of the world’s largest producers and consumers of food and other agricultural products. Since the 1980s, both the Chinese and Indian governments have heavily invested in agricultural biotechnology research, with the Chinese government making more public-sector investment than the Indian government and the private sector in India exceeding China’s private sector. Chinese farmers began adopting genetically modified (GM) crops in the mid-1990s with Indian farmers following in 2000. In spite of R&D investments in various crops in both countries, one crop, Bt cotton, covers almost all areas in China and all areas in India in cultivation by a GM crop. Recently, China approved GM traits in two major food crops, rice and maize, and India nearly approved its first GM food crop, Bt eggplant. None of these crops are being grown by Chinese or Indian farmers. The experiences of India and China with GM crops are not only particularly important for Asia where few other countries grow GM crops (Philippines is the only exception) but also for other parts of the world where small farmers produce most crops. Comparing the experiences of China and India allows us to see how the same technology – Bt cotton – can have different impacts because of differences in technology policies, regulatory institutions, agricultural conditions and levels of development. Early studies of Bt cotton’s impacts in China (Pray, Huang, Ma and Qaio, 2001) and India (Qaim and Zilberman, 2003) found increases in yield per hectare, especially in India, reductions in pesticide use, especially in China and positive health impacts, in both countries, due to reduced pesticide exposure. In recent years, little has been published on impacts of GM crops, leading to the question: have Chinese and Indian farmers continued to benefit? Our paper addresses this question. It also provides empirical evidence for potential impacts of Bt rice and Bt eggplant, the next GM traits in the commercialization pipeline. This paper finds that the promise of major benefits of Bt cotton identified in early studies has proven true. Bt cotton has spread to all areas of China and India where bollworm is a problem pest. Bt cotton continues to control bollworm in both countries, and farmers continue as major beneficiaries rather than biotech or seed companies. In China, evidence also suggests that Bt cotton has suppressed bollworm population to the extent that growers and producers of other crops also susceptible to bollworm are benefitting. This paper also finds that GM rice and GM eggplant could have major positive impacts― increasing farmers’ profits by reducing pesticide use and reducing their exposure to chemical pesticides. Both crops were approved for commercial production by government biosafety regulators, but adoption of GM eggplant has been held up by the Indian Minister of the Environment and specific Bt rice hybrids are still being evaluated by the Chinese Ministry of Agriculture. The paper is organized as follows. It first reviews recent investments in biotechnology in China and India and spread of GM crops in the two countries. It then reviews impact studies, examines

evidence available on potential impact of GM food crops in the two countries and finally summarizes results. Investments in Agricultural Biotechnology Public Investments in Chinese Agricultural Biotech The Chinese government began investing in agricultural biotechnology research in the mid-1980s, with funding rapidly increasing since 1996 (Figure 1). Basic biotechnology research got a major boost from the “863” program funded by the Ministry of Science and Technology in March 1986, and, ten years later, the 1997 “973” program further increased basic and applied biology research (Huang and Wang, 2002). Of total agro-biotechnology research investment, nearly 60 % was in plant biotechnology, with the remainder allocated to animal and micro-organism research. Since 2000, expenditure has increased even more rapidly, reaching about US $200 million in 2003. Unpublished survey data collected by the Center for Chinese Agricultural Policy in 2010estimates expenditures of at least US$ 1.2 billion for agricultural biotech research in 2009 (based on a survey of government agencies). Private-sector agricultural biotechnology research is small relative to the public sector. Some large Chinese seed companies, such as Origin Seed and Denghai Seeds, have established biotechnology laboratories in recent years. A few multinational seed and biotechnology companies have conducted applied biotechnology research in China. For example, Monsanto, in collaboration with Delta & Pineland and Chinese government research institutes, bred and tested Bt cotton varieties in the 1990s. This research was abandoned after 2000 as a result of low profits from Bt cotton due to lack of enforceable patents and trademarks. As a result, events such as Bollgard II, the most popular Bt cotton in India, and RR Flex cotton (stacked Bts plus herbicide tolerant genes) have not entered into the Chinese biosafety regulatory process.1
Foreign companies, with Chinese partners, have begun working on Bollgard II, other Bt genes and herbicide-tolerant products for cotton, maize and other crops. In recent years, Monsanto, DuPont and Syngenta have invested in basic biological research in Beijing and Shanghai.
Recently, foreign firms and local private firms have begun re-investing in biotechnology innovation and research (Table1), believing it possible to appropriate some gains from R&D as IPRs appear to be strengthening. The Plant Variety Protection Law passed in 1997 was gradually broadened to include all major crops including cotton in 2005. Government enforcement of patents, trademarks and PVP also appears to be improving. In interviews with the authors ( Beijing, August 2009), seed company executives have stated they can charge high enough prices for hybrid maize to make investments in breeding profitable. Further, the growing sophistication of Chinese seed companies in their use of IPRs and contracts makes it easier for foreign companies to do business in China. Finally, the recent approval of GM rice and maize opens up food crops for GMOs for the first time. Factors in place for some time―the numbers of research institutes, the skills of Chinese scientists and the huge potential market―have also attracted international R&D investments.
1 An ‘event’ is defined as a specific set of genes that have been placed in specific plant background material. So there are many Bt cotton events which consist of different types of Bts in one background or the same Bts in different backgrounds.
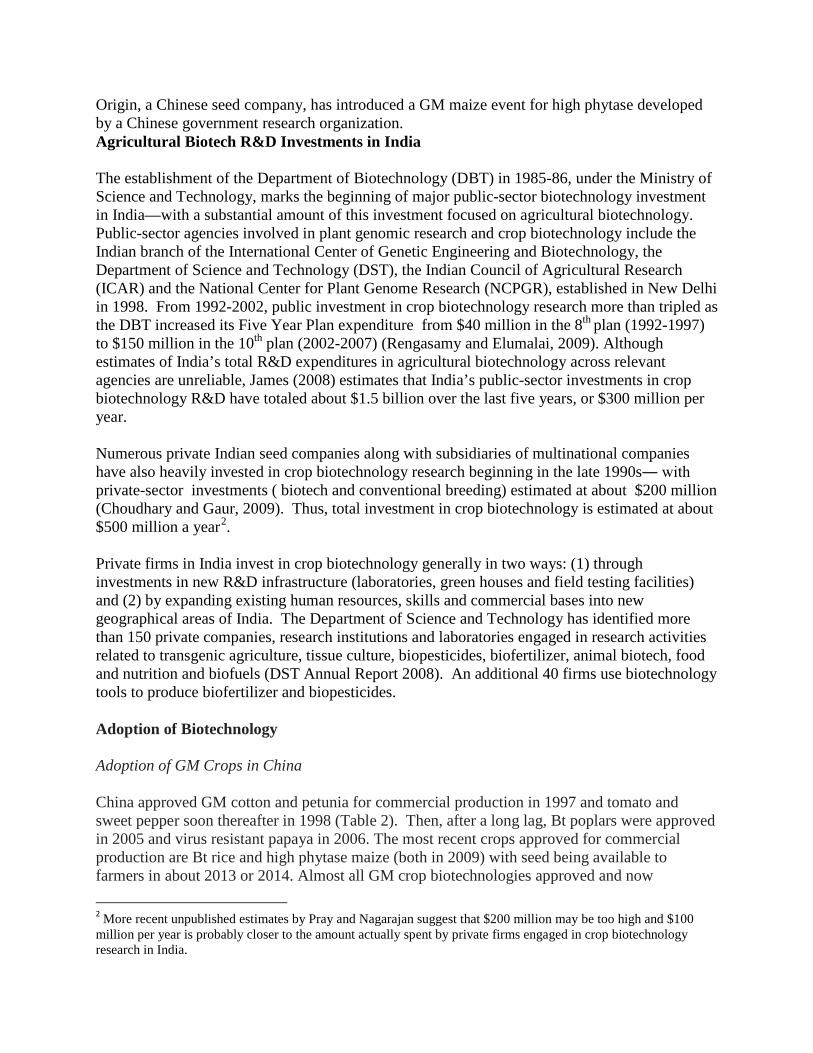
Origin, a Chinese seed company, has introduced a GM maize event for high phytase developed by a Chinese government research organization. Agricultural Biotech R&D Investments in India The establishment of the Department of Biotechnology (DBT) in 1985-86, under the Ministry of Science and Technology, marks the beginning of major public-sector biotechnology investment in India—with a substantial amount of this investment focused on agricultural biotechnology. Public-sector agencies involved in plant genomic research and crop biotechnology include the Indian branch of the International Center of Genetic Engineering and Biotechnology, the Department of Science and Technology (DST), the Indian Council of Agricultural Research (ICAR) and the National Center for Plant Genome Research (NCPGR), established in New Delhi in 1998. From 1992-2002, public investment in crop biotechnology research more than tripled as the DBT increased its Five Year Plan expenditure from $40 million in the 8th plan (1992-1997) to $150 million in the 10th
Numerous private Indian seed companies along with subsidiaries of multinational companies have also heavily invested in crop biotechnology research beginning in the late 1990s― with private-sector investments ( biotech and conventional breeding) estimated at about $200 million (Choudhary and Gaur, 2009). Thus, total investment in crop biotechnology is estimated at about $500 million a year
plan (2002-2007) (Rengasamy and Elumalai, 2009). Although estimates of India’s total R&D expenditures in agricultural biotechnology across relevant agencies are unreliable, James (2008) estimates that India’s public-sector investments in crop biotechnology R&D have totaled about $1.5 billion over the last five years, or $300 million per year.
2
China approved GM cotton and petunia for commercial production in 1997 and tomato and sweet pepper soon thereafter in 1998 (Table 2). Then, after a long lag, Bt poplars were approved in 2005 and virus resistant papaya in 2006. The most recent crops approved for commercial production are Bt rice and high phytase maize (both in 2009) with seed being available to farmers in about 2013 or 2014. Almost all GM crop biotechnologies approved and now
. Private firms in India invest in crop biotechnology generally in two ways: (1) through investments in new R&D infrastructure (laboratories, green houses and field testing facilities) and (2) by expanding existing human resources, skills and commercial bases into new geographical areas of India. The Department of Science and Technology has identified more than 150 private companies, research institutions and laboratories engaged in research activities related to transgenic agriculture, tissue culture, biopesticides, biofertilizer, animal biotech, food and nutrition and biofuels (DST Annual Report 2008). An additional 40 firms use biotechnology tools to produce biofertilizer and biopesticides. Adoption of Biotechnology
Adoption of GM Crops in China
2 More recent unpublished estimates by Pray and Nagarajan suggest that $200 million may be too high and $100 million per year is probably closer to the amount actually spent by private firms engaged in crop biotechnology research in India.

commercially used in China were developed by the Chinese public sector—the only exceptions being Monsanto’s Bt gene and Bt cotton hybrids commercialized in China through joint ventures with Chinese and foreign biotech companies.
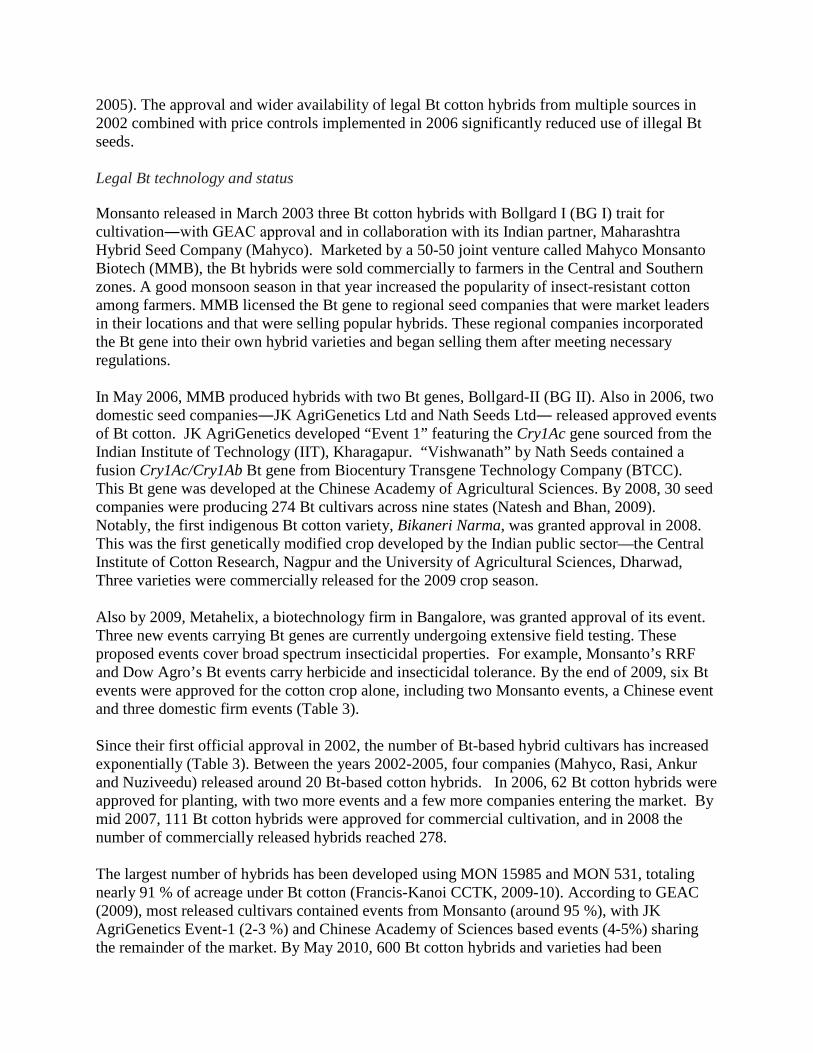
Although GM papaya is grown extensively in Southern China and GM sweet pepper and tomato are grown in small areas throughout several regions, Bt cotton is China’s only major GM field crop. First introduced in the north eastern cotton zone along the Yellow River (1997) and then spreading south into the Yangtze River region, Bt cotton now almost completely covers both regions. However, it has not made headway in the other main cotton growing region, irrigated regions of the desert in Xinjiang province where bollworm is not a major pest. Figure 2 shows the rapid spread of Bt cotton since its introduction in 1997 to its peak in 2004 where it covered nearly 70 % of China’s total cotton production area. Adoption has slowed since 2004 because farmers in all areas where bollworm is a major pest now use Bt cotton. No GM cotton varieties have been developed for Xinjiang. Hundreds of Bt varieties and hybrids are approved for use in China, with most areas covered with Bt varieties rather than hybrids.
Adoption of GM Cotton in India
In contrast to China, only one GM crop—Bt cotton—has been approved and introduced for commercial production in India. The Government of India approved Bt cotton for commercial release in 2002, although it was first introduced illegally in Gujarat around 2000. In 2002, Indian farmers grew only about 50,000 hectares of Bt cotton, but adoption increased rapidly over the next few years (See Figure 3 and Table 4) so that by 2008 7.6 million acres were planted in Bt cotton, representing 82 % of all cotton planted in that year (Figure 3). By the 2009-2010 cropping season, the area under Bt cotton cultivation is expected to reach nearly 90 % of total areas planted. The States of Gujarat, Maharashtra, Andhra Pradesh, Madhya Pradesh, Punjab and Haryana account for more than 71 % of total cotton production in India and farmers in these areas are major users of Bt cotton seed. Illegal Bt introduction and spread Farmers used Bt cotton seeds in India before the first official Bt hybrids were approved in 2002. During 2001, the Bt cotton hybrid NB-151 of the NavBharat company was cultivated on more than 4000 hectares in Gujarat State. This hybrid had not undergone testing and trials mandated by bio-safety regulations and had not been approved by the Genetic Engineering Approval Committee (GEAC) ―hence the term “illegal seeds”. Though GEAC recommended that the NB-151 cotton crop be destroyed, farmer opposition prevented this. As a result, illegal Bt cotton seeds were multiplied and sold under various names on a growing black market in different Indian states (Sadasivappa and Qaim, 2009). Illegal Bt seeds were priced between 800 and 1200 Indian rupees (US$ 18-27) per packet of 450 grams compared to Rs. 1600 (US $36.45) for official Bt cotton seeds (Murugkar, Ramaswami, and Shelar, 2007)3
3 1 Packet of seed is equivalent to 450 grams of seed, suffice to plant 1 acre of cotton.
. In 2004-05, illegal Bt seeds reached an estimated 800,000 hectares (Pray, Bengali, and Ramaswami, 2005). On average, illegal Bt hybrids generated higher profits than conventional cotton hybrids but lower profits than legal Bt hybrids (Bennett, Ismael, and Morse,
2005). The approval and wider availability of legal Bt cotton hybrids from multiple sources in 2002 combined with price controls implemented in 2006 significantly reduced use of illegal Bt seeds. Legal Bt technology and status Monsanto released in March 2003 three Bt cotton hybrids with Bollgard I (BG I) trait for cultivation―with GEAC approval and in collaboration with its Indian partner, Maharashtra Hybrid Seed Company (Mahyco). Marketed by a 50-50 joint venture called Mahyco Monsanto Biotech (MMB), the Bt hybrids were sold commercially to farmers in the Central and Southern zones. A good monsoon season in that year increased the popularity of insect-resistant cotton among farmers. MMB licensed the Bt gene to regional seed companies that were market leaders in their locations and that were selling popular hybrids. These regional companies incorporated the Bt gene into their own hybrid varieties and began selling them after meeting necessary regulations. In May 2006, MMB produced hybrids with two Bt genes, Bollgard-II (BG II). Also in 2006, two domestic seed companies―JK AgriGenetics Ltd and Nath Seeds Ltd― released approved events of Bt cotton. JK AgriGenetics developed “Event 1” featuring the Cry1Ac gene sourced from the Indian Institute of Technology (IIT), Kharagapur. “Vishwanath” by Nath Seeds contained a fusion Cry1Ac/Cry1Ab Bt gene from Biocentury Transgene Technology Company (BTCC). This Bt gene was developed at the Chinese Academy of Agricultural Sciences. By 2008, 30 seed companies were producing 274 Bt cultivars across nine states (Natesh and Bhan, 2009). Notably, the first indigenous Bt cotton variety, Bikaneri Narma, was granted approval in 2008. This was the first genetically modified crop developed by the Indian public sector—the Central Institute of Cotton Research, Nagpur and the University of Agricultural Sciences, Dharwad, Three varieties were commercially released for the 2009 crop season. Also by 2009, Metahelix, a biotechnology firm in Bangalore, was granted approval of its event. Three new events carrying Bt genes are currently undergoing extensive field testing. These proposed events cover broad spectrum insecticidal properties. For example, Monsanto’s RRF and Dow Agro’s Bt events carry herbicide and insecticidal tolerance. By the end of 2009, six Bt events were approved for the cotton crop alone, including two Monsanto events, a Chinese event and three domestic firm events (Table 3). Since their first official approval in 2002, the number of Bt-based hybrid cultivars has increased exponentially (Table 3). Between the years 2002-2005, four companies (Mahyco, Rasi, Ankur and Nuziveedu) released around 20 Bt-based cotton hybrids. In 2006, 62 Bt cotton hybrids were approved for planting, with two more events and a few more companies entering the market. By mid 2007, 111 Bt cotton hybrids were approved for commercial cultivation, and in 2008 the number of commercially released hybrids reached 278. The largest number of hybrids has been developed using MON 15985 and MON 531, totaling nearly 91 % of acreage under Bt cotton (Francis-Kanoi CCTK, 2009-10). According to GEAC (2009), most released cultivars contained events from Monsanto (around 95 %), with JK AgriGenetics Event-1 (2-3 %) and Chinese Academy of Sciences based events (4-5%) sharing the remainder of the market. By May 2010, 600 Bt cotton hybrids and varieties had been

approved, and currently 33 companies are developing Bt cotton hybrids and varieties (IGMORIS, 2010). Empirical studies on the impact of adoption Bt cotton Impact of Bt cotton adoption in China Empirical studies of GM traits in developing countries started with the Pray, Huang, Ma and Qiao (2001) study of Bt cotton using 1999 and 2000 production surveys. This study was the first in a series conducted on Bt cotton with the CCAP. Other studies have been conducted by Pemsel, Waibel and Gutierrez (2005); Pemsl (2006) and Wang et al (2008). CCAP surveys, conducted in 1999, 2000, 2001, 2004, 2006 and 2007, are the only surveys available after 2004. They encompass a random sample of up to 500 farmers in the northeast (Yellow River) and central (Yangtze River) cotton zones.4
Early studies of three Provinces in our sample in northern China found that Bt cotton reduced pesticide use by 35.7 kg per hectare, or a reduction of 55% of pesticide use in the entire sample between 1999 and 2001 (Huang et al. 2002). Henan is the only province in the survey where farmers cultivated some non-Bt fields as late as 2006 and 2007. Figure 6 shows that insecticide use against bollworm in Bt cotton fields in Henan has been less than 10 kg/ha for the entire
Agronomic and Economic Impacts Figures 4, 6 and 7 summarize agronomic and economic impacts of Bt cotton adoption in CCAP field samples. Figure 4 shows that mean yields of Bt cotton were higher than conventional varieties in all years except 2004 when there was no statistically significant difference. Differences between Bt and non-Bt are reported after 2004, but they are somewhat less reliable because the number of plots where non-Bt was grown is scarce. In 2006, there were only 14 plots and in 2007 only 4. Figure 4 also shows that Bt cotton yields have remained high in recent years, with annual yield variations and variations in differences between Bt and non-Bt largely due to variations in weather and severity of pest attack (Huang et al. 2010; Hu et al. 2009). Because surveys in China were conducted over six years (from 1999-2007), it is possible to investigate two other potential impacts: (1) decline in Bt efficacy as a result of being backcrossed into more varieties by numerous public- and private-sector plant breeders or as a result of the development of bollworm resistance to Bt and (2) growth of secondary pests into major pest problems. Chinese data do not support the hypothesis of declining Bt efficacy. Aggregate cotton yields continue to rise in China suggesting that Bt cotton also continues to do well. Using historical data beginning in the 1950s, Figure 6 shows a gradual increase in cotton yields until the late 1970s. A yield jump in the late 1970s coincides with the 1978 introduction of the household responsibility system and continues to 2002 when a period of declining yields began as bollworms developed resistance to chemical pesticides. Yield growth and decline in yield volatility after 1995 correspond with the introduction and spread of Bt cotton.
4 Xinjiang Province, China’s third major cotton-growing region, was not surveyed as cotton bollworm is not a significant pest and little Bt cotton is used.

period except 2000, and that spraying for bollworms on non-Bt cotton fields has also declined dramatically since 1999. This supports the hypothesis that bollworm populations in the entire area have declined. Econometric modeling of pesticide use in all fields surveyed between 2001 and 2007 also supports this hypothesis of declining bollworm infestation over time (Huang et al, 2010). Although Bt cotton seed prices were higher than conventional cultivars during the survey years, differences in seed costs were offset by reductions in expenditures on pesticides and labor, due in large part to reductions in number of required sprays. This resulted in overall decreases in production costs for Bt cotton, as compared to non-Bt cotton, and increased net revenue (Huang et al. 2002). As shown in Figure 7, net revenue from Bt crops exceeded net revenue from conventional cotton in all surveyed farm households. In some villages studied, farmers reported increased levels of mirids, which had been only a minor pest when high levels of broad spectrum pesticides were used before the adoption of Bt cotton. A recent study (Wang et al. 2008), measuring farm-level pattern of insecticide use from 1999 to 2006 shows increased insecticide use to control mirids between 2001 and 2004. This increase does not continue in most sampled villages after 2004. Increased insecticide use to control secondary pests is lower than reduction in total insecticide use due to Bt cotton adoption. Further econometric analyses show that fluctuation in mirid infestation is largely related to local temperature and rainfall (Huang et al 2010). A new study by biologists in Science (Lu et al 2010) confirms farmers’ observations that decreased pesticide use due to Bt cotton has led to an increase in mirids. Lu et al (2010) argue that improved pest management strategies, such as carefully integrating Bt with other pesticides and combined with improved cultural practices, are needed to control secondary pests. This coincides with the findings of Pemsl and Waibel (2007) that to better realize potential benefits of Bt technology farmers must be trained in the use of other control measures (especially cultural practices and chemical pesticides).This is supported by results of on-farm trials conducted in Hubei Province (2002) which showed that use of non-Bt cotton combined with farmer training in integrated pest management using the Farmer Field School (FFS) approach equaled the economic performance of Bt cotton with additional pesticide use (Yang, Illes, Yan and Jolife, 2005). Health effects Many authors have speculated about positive and negative health impacts of GM crops on farmers, but only one study (Hossain et al, 2004) provides statistical evidence linking GM adoption and use to farmer health. The impact of pesticide on health of exposed people includes both immediate sickness and long term effects on the nervous system, which lead to sickness many years after initial exposure. Ideally, evidence of acute toxicity and potential long term impacts is identified through physician and hospital medical records but resources for this study was limited. This study surveyed farmers who were asked if they felt sick during the season they were growing cotton. If so, how sick did they get and what were their symptoms (dizziness, nausea, headaches) and did they visit a doctor or hospital as a result? Data from the same surveys northeastern China 1999, 2000 and 2001 are depicted in Figures 4, 6 and 7. These data were pooled, and used to estimate a two-stage econometric model.

The study shows that the amount of pesticide farmers sprayed on cotton was a major factor influencing whether farmers reported feeling sick or not. The more pesticide sprayed the higher probability that farmers would report feeling sick. To ensure that results were not biased by other factors that could lead to sickness, we included in the survey a number of farmer characteristics that could affect susceptibility to poisoning such as age and pre-existing health problems. As expected farmers who were already unhealthy had a higher probability of being poisoned and farmers with higher education had a lower probability of being poisoned. Other characteristics of farmers that we could measure such as age did not have a significant impact. Poisoning was linked to Bt cotton through impact of Bt on pesticide use. The study (and many others) found that Bt cotton adoption reduced pesticide use dramatically even after controlling for weather, incidence of serious pest attacks and pesticide prices. Taken together, the impact of Bt on reducing pesticide use and the impact of the reduced pesticide use on poisonings indicates that adoption of Bt cotton can substantially reduce risk and incidence of pesticide poisoning. Impact of adoption of Bt cotton in India A range of field studies assessing economic performance of Bt cotton in India revealed that farmers have benefited from adopting Bt cotton technology through increased yields and reduced pesticide costs. Although Bt technology does not target increased yield, substantial yield increases are attributed to decreased pest damages. In spite of higher costs of Bt cotton seed, reduced pesticide use, and reduced costs associated with pesticide use, offsets increased expenditures on seed. Additional spill-over benefits include improved quality of life due to increased income and better health due to less pesticide exposure (ASSOCHAM Survey, 2007). Reduction in insecticide use, increase in aggregate yields
The Qaim and Zilberman (2003) study comparing Mahyco Bt hybrids with the same hybrid without Bt in three major cotton-growing states of India (Tamil Nadu, Maharashtra and Madya Pradesh) is the most carefully designed study of Bt trait impacts. Comparing Bt hybrids with genetically identical hybrids except for the Bt gene, the study found that Bt hybrids were sprayed three times less (70%) against bollworms than non-Bt hybrids and local varieties, and that yield increased by 80 to 87%.
A study funded by Mahyco (Barwale, Gadwal, Zehr and Zehr, 2004) documented results of a 1,069 farmer survey in six states during the 2002 season. According to this report, Bt cotton increased yields by 42% and reduced pesticide use by 57%. In their assessment of Bt cotton performance among farmers in Maharashtra during the 2002 and 2003 cropping seasons, Bennett, Ismael, Kambhapati and Morse (2004) found a significant reduction in pesticide expenditure, 72% in 2002 and 83 % in 2003. Seed costs were higher; however, increased yields of Bt cotton of 45% in 2002 and 63 % in 2003 over non-Bt cotton compensated for higher seed costs. Similar results were reported by Bennett et al (2006) from a survey conducted in Maharashtra, Gujarat, Madya Pradesh and Karnataka. In Maharashtra, Bambawale et al (2004) conducted a participatory field trial with MECH-162 variety Bt cotton and a conventional variety/hybrid using integrated pest management (IPM) techniques with both crops. Their results showed that IPM in Bt cotton was most effective with only 11% damage. Non-Bt hybrids using

IPM had as much as 33 % damage. Seed cotton yield was also higher in Bt cotton hybrids by 300 kg compared to non-Bt varieties and hybrids.
A Front Line Demonstrations (FLD) study on cotton conducted by the Indian Council of Agricultural Research (ICAR) collected details from 1,200 Bt demonstration and farmer plots across 11 States in the 2005-2006 growing season. Results confirmed that Bt cotton hybrids registered a net yield increase of 33.7 % over non-Bt hybrids and a 73.8% increase over open-pollinated cotton varieties (OPV). In their study of 694 growers from four major cotton-growing states of Gujarat, Maharashtra, Andhra Pradesh and Tamil Nadu, Gandhi and Namboodiri (2006) found significantly higher yields of Bt cotton with reduced pesticide costs under both irrigated and rain-fed conditions.
One of the few analyses examining Bt technology performance as late as 2006-2007 is the study conducted by Sadasivappa and Qaim (2009). Covering the first five years of Bt adoption in India and using three rounds of survey data between 2002-2003 and 2006-2007, they document reductions in pesticide use at around 30 % and increased yields of 40 % among Bt growers. Subramaniam and Qaim (2009) also analyzed village-level welfare and distribution effects of Bt cotton adoption, documenting that, in addition to yield gains and decreased pesticide costs, the region as a whole showed improved aggregate employment, especially for hired female agricultural laborers, and increased household income among cotton growers. Each additional hectare of Bt cotton was shown to produce 82% higher aggregate incomes than obtained from conventional cotton. Farm-level studies are substantiated by aggregate cotton production data in India. After the release of the first commercial hybrids in 1970s, cotton yields showed marginal improvement, due to both public- and private-sector research. Yet, overall or aggregate yields only increased significantly with increased adoption of Bt cotton since 2002. Prior to Bt cotton, India had one of the lowest cotton yields in the world—308 kg per hectare in 2001-2002. The global average for cotton production is 788 kgs per hectare (USDA-FAS, 2007). As shown on Table 4, the average yield of Bt cotton has increased to 560 kg/ha in 2007-2008 as compared to 300 kg/ha in 2001-2002. Currently, India accounts for 25% of the global area under cotton cultivation, around 33.4 million hectares. However, in terms of production, India accounts for only 20% of world production, due to lower productivity per hectare. Increased farm income and spillovers Reduced insecticide use combined with significant yield increases due to lower crop losses has resulted in considerable gains in farm-level profit. Profit differences between Bt and non Bt cotton have increased over time―from US $ 49.23 per acre in 2002-2003 to US$ 66.97 in 2006-2007 (Sadasivappa and Qaim, 2009). Bennett et al (2006), using 2002 and 2003 surveys, also conclude that Bt growers received higher gross margin―US $ 1157/hectare for Bt growers compared to US$665.4/hectare for non Bt growers, even after account for seed cost and varying cotton prices. Another study involving 150 Bt cotton growers during the 2003 season in Maharashtra also reported a 79.2% higher profit from Bt cotton cultivation, compared to non Bt cultivation under irrigated conditions (Vaidya, 2005).

Gandhi and Namboodri (2006), in their survey across four major cotton growing states cited above, found that profits per hectare of Bt cotton cultivation ranged from US$ 347 to US$729 while non Bt cotton profits ranged from US$123 to US$ 414 per hectare. The consulting firm, ASSOCHAM conducted a study (2007) across 23 districts in six states and reported increases in net revenue of US$ 175 per acre associated with Bt adoption. This means Bt growers earned on average a 64 % higher income per acre than conventional growers. Other measurable farm-level benefits from Bt cotton production are important. At the farm level, in addition to improved yields and higher incomes per acre, 87 % of Bt cotton farmers reported better lifestyles, 84 % reported improved peace of mind due to risk reduction, 72 % invested more in their children's education and 67 % repaid debts (ASSOCHAM Survey, 2007). A survey conducted by Indicus Analyticus (2007) across 9000 farmers in eight states also found positive health impacts and increased investments in education among farm households growing Bt cotton. Additionally, the cotton industry has captured benefits. Qaim (2003) projected surplus gains from Bt cotton at $315 million for 2005. Of this, farmers captured two thirds while biotech and seed firms garnered the remainder. Bt cotton in India is commercialized in hybrids, so use of farm-saved seeds is low. Thus, the private sector profits from selling the GM cotton hybrids are higher than in China. A 2004 study conducted in Gujarat by Kambhapathy, Morse, Bennett and Ismael (2005) reveals that the textile industry, ginners and textile manufacturers, also benefitted from improved fiber quality due to less insect damage. When analyzing aggregate effects of increased production and trade of Bt cotton, the world market must also be considered. Bring following paragraph up here—I can’t move it for some reason…The Frisvold and Reeves (2007) paper is the first to consider concurrent impacts of Bt adoption in India and globally. Examining effects of Bt cotton production on world and Indian cotton prices at 2005 adoption levels, they estimated a global increase in total factor productivity (TFP) at around 3.3 %, with 0.9 % and 0.7 % increases in textile and apparel production, respectively. They concluded that while Bt adoption in India led to a more than US$ 200 billion gain in India, increased worldwide production led to a 3 % decline in world cotton prices. Anderson, Valenzuela and Jackson (2008) estimate that widespread adoption of Bt cotton in India and other South Asian countries will result in additional regional welfare gains on the order of $1 billion per year. In India, cotton exports increased from 0.05 million bales in 2002-2003 to 8.5 million bales in 2007-2008, with earnings increasing from US$ 10.4 million in 2002-2003 to US$ 2.2 billion by 2007-2008. During the same period, cotton imports decreased from 2.5 million to 0.7 million bales. Cotton textile exports also increased in value from US$3.4 billion in 2002-2003 to US$ 4.7 billion in 2007-2008 (CCI, 2009). Although partly a result of increased yields, export increases are generally attributed to changes in domestic and international agricultural trade regulations. Some groups lost profits because of Bt cotton and maize adoption. For example, insecticide producing companies and distributors competing with Bt varieties had reduced profits because of declines in demand for chemical pesticides. In India aggregate pesticide use on cotton has

declined. Traditionally, cotton production has required significant insecticide use. Thus, with reductions in use in the Bt cotton crop, total pesticide use in India has declined from 47,020 MT in 2001-2002 to 37,959 in 2006-07 (James, 2008). The real value of insecticide use for bollworm management was down from $147 million in 1998 to $65 million in 2006 (ISAAA 2009). If profit margin is estimated at 20% of sales, this represents $16 million in lost profits. Impact of seed and royalty price controls and farmers’ benefits5
Price controls, introduced mid-2006, are partially responsible for increased sales of Bt cotton seeds (See Figure 3 and Table 4). Adoption of Bt cotton cultivars soared from 28% of cultivated area in 2005to 63% in 2006. During the 2007-2008 season, demand for Bt cotton seed packets almost quadrupled (16 million packets were sold), covering more than 90 % of cultivated area under hybrid cotton. Part of this increase in Bt seed sales is also a result of increased availability of locally adapted Bt hybrids which had gone through the regulatory process by 2006. Introduction of BG II and new Bt events from JK AgriGenetics and Nath seeds also increased farmer choice. State governments also now regulate the cotton seed trade by penalizing illegal seed suppliers through heavy fines and punishments to ensure tested and approved varieties reach farmers
India presents a unique case study as the first time a government body imposed pricing regulations on Bt cotton hybrid seeds. When Bt cotton hybrids were first approved for release in 2002, Mahyco Monsanto Biotech (MMB) held the only Bt genes approved for commercialization in India and firms were required to license technology from MMB. However, in 2006 the government of Andhra Pradesh (AP) petitioned the Monopolies and Restrictive Trade Practices Commission (MRTPC) to reduce seed prices. The Commission agreed and MMB appealed to the Supreme Court. Meanwhile, the AP government negotiated with seed companies to set the price of hybrid Bt cotton seed at US$18 for a 450 gram packet, including technology fee. This price was less than half of MMB’s price of US $29 per 450 gram packet. Soon, other state governments adopted the same pricing policy, with price caps spreading to important cotton-growing states throughout the country including Maharashtra, Gujarat, Tamil Nadu, Karnataka, Madhya Pradesh and West Bengal. Even domestic firms with their own Bt events such as Nath Seeds and JK AgriGenetics sell hybrid seeds at the mandated price of US$18 per 450 gram packet. MMB currently sells BG-II seeds at US$23 per 450 gram packet.
6
Qaim (2003) projected US$315 million in Bt cotton surplus gains for India in 2005. Of this, farmers captured two thirds while the rest accrued to biotech and seed firms. Table 6 presents
. Prices controls increased farmer share of benefits from Bt cotton adoption and reduced share accruing to seed companies and biotech trait providers (see Table 5). The price of Bt seed before price control was three times that of conventional seeds. By 2006-07, the average Bt seed price declined by 68 % (Sadashivappa and Qaim, 2009), resulting in increased seed demand, increased seed sales and expansion of area under Bt cotton cultivation. Although seed demand and sales increased with price control, companies made less profit per unit sold and less total profit.
5 An in depth study of how these price controls affect biotech and seed company profits and their incentive to conduct research and innovate is forthcoming in Pray and Nagarajan 2011. 6 Personal Communication: Nath Seeds, 2008-09, Rasi seeds, 2010.

total revenue (net) realized by all stakeholders in the Bt seed value chain (excluding consumers) since Bt’s introduction in 2002. We estimate that farm-level profit share has increased substantially by farmer adoption of Bt cotton. Farm profits make up nearly 85 to 90 % of the total revenue earned by the Bt cotton industry, including technology-provider and seed-firm profits.7
The Chinese Academy of Agricultural Sciences (CAAS) has perhaps the highest global investment in biotech wheat. It is developing a wide range of traits such as resistance to yellow
Table 5 also shows the dramatic impact of price control on providers of Bt genes and seed companies licensing the gene. Profit share was as high as 28 % and 16 % for seed firms and MMB prior to 2006-2007. This declined immediately after imposition of price control. Revenue earned by seed firms was especially affected (falling from 27 % to 2 %), perhaps due to two reasons―a reduction in seed prices by nearly 50 to 60 % combined with increased cost of seed production by 35 to 40 %. Royalties paid before price controls were as high as US$ 40 per packet of Bt cotton seeds in 2002-2003. This was reduced to US$ 9 per packet with the onset of price control and in 2009-2010 royalties went down to as low as US$1 per packet for some Bt cotton seeds. Rao (2008) suggests that short-term benefits from current policies may outweigh potential losses from forgoing technology in the long term, but results are sensitive to assumptions about future technology foregone and the discount rate. Herbicide Tolerant (HT) and Drought Tolerant (DT) varieties are examples of cost-saving technologies which may benefit farmers. If a few or all of these varieties are delayed from entering the market, welfare losses to farmers could result. Limiting technology fees by imposing price controls transfers benefit from technology owners to technology consumer (in this case farmers) in the short-term (Rao, 2008), but long-term consequences remain unclear. Potential Impact of Biotechnology in Other Crops GM Crops in Pipeline in China As mentioned above, Bt rice and high phytase maize have been approved for cultivation. Hybrids in which these events are used will be approved by the cultivar registration system (a requirement for all new cultivars whether transgenic or not) within the next two years. With the approval of these crops, a number of new transgenic events are likely to be released. Table 6 lists GMO crops currently in the regulatory pipeline. High phytase corn will primarily impact the livestock industry by increasing phosphorus and micronutrient availability to the maize plant, decreasing phosphorous pollution of ground water and decrease cost of feedstuffs. No studies have yet been published quantifying impact.
7 The fact farmers were the major beneficiaries of Bt cotton suggests that biotechnology has not forced farmers deep into debt for the benefit of the biotech and seed companies and that there is little support for the anti-GM groups have tried to link Bt cotton, with increased debt and ultimately to farmers suicides. This conclusion is further supported by a recent study that shows that debt and suicides are not related to Bt cotton but are caused by a series of other factors (Gruère Mehta-Bhatt, and Sengupta. 2008).

mosaic virus, head scab, powdery mildew and insect. A wheat line with resistance to yellow mosaic virus is expected to be commercially available by 2015. Henan Agricultural University is also developing sprouting-tolerant wheat to overcome the 20% loss in production due to early sprouting. This will be commercially available by 2012 or 2013(ISAAA, 2010). Impact of GM Rice In China, GM rice (or any other GM crop) must be grown under farmer conditions in extensive pre-production trials before approved for commercial cultivation. As a result, Huang et al (2005 and 2008) were able to measure impact of Bt rice varieties on yields, pesticide use and health in two provinces in southern China. Results from these studies provide evidence of the positive impacts of insect-resistant GM rice: increased yields, reductions in pesticide use and improvements in farmer health. Insect-resistant GM rice produced yields 6 to 9 % higher than conventional varieties, with an 80 % reduction in pesticide use and a concomitant reduction in adverse health impacts of pesticides (Huang et al. 2005). Huang et al (2008) expanded on the 2005 analysis to include another year and more sophisticated econometric techniques. To measure economic impact of GM rice on yield and pesticide use in pre-production trials, they conducted from 2002-2004 extensive farm-level surveys across 320 households growing two GM hybrids: GM II-Youming 86 and GM Xianyou 63. Sampled respondents consisted of farm households growing non-GM hybrids, either alone or with GM rice for comparison. Data from all sampled households demonstrated that GM rice farmers applied pesticide less than one time per season (0.6 times) as compared to 3.7 times per season by non-GM growers. Reduction in pesticide use also decreased labor among GM growers, with GM growers using only 1.4 labor days per hectare for spraying versus the conventional 10.1 labor days per hectare. The study further estimated that among GM rice growers, the point estimates of yields were higher than those for non-GM rice growers (although not significant at 5 %). Adoption of GM rice in preproduction villages showed increased yields of rice by 9 to 12 % compared to control villages. At the individual household level, pesticide reductions were as high as 85 to 90 % among GM rice growers. Though yield effects were not large with GM rice, yield variance was significantly reduced. It is important to note that GM rice adoption led to large reductions in pesticide use without diminishing yields. If it is assumed that GM rice would be equally effective across a larger part of China (especially in stem borer infested areas), potential gains to China’s economy could be as large as US$ 4.2 billion (Huang, 2004).
GM crops research in India In India, public sector institutes are currently conducting biotech research on more than 20 crops, focusing their research on four traits: (1) insect and disease resistance; (2) tolerance to abiotic stresses (drought and cold); (3) saline resistance and (4) fortification. For example, scientists at the Indian Agricultural Research Institute in New Delhi are pursuing several transgenic wheat and rice projects, seeking drought- and disease-resistant cultivars. In the private sector, more than 35 companies are actively engaged in GM crop research. Mahyco leads the research with

more than 10 transgenic lines (Table 7) and the Mahyco Research Center is also engaged in GM wheat cultivar research in collaboration with its multinational company partner, Monsanto. Bt eggplant Bt eggplant is the first GM food crop in India, the crop closest to being approved for cultivation and commercialization and the crop with the most research on its economic impacts. Traditionally, cotton required more insecticide sprays of any field crop. Eggplant (and Indian chili) is its equivalent among vegetables. Fruit and shoot borer (FSB) alone damages by 48 to 86% of the eggplant fruit and reduces yield by 50-60%.8
Mishra (
. Given the success of Bt technology in cotton, the same technology has been adapted for Bt eggplant. Maharashtra Hybrid Seed Company Ltd. (Mahyco), a leading Indian seed company, developed Bt Eggplant by inserting the same Cry1Ac used in Bt cotton. The Bt eggplant event EE1 was developed through a public-private partnership under the aegis of Cornell University’s USAID- sponsored Agriculture Biotechnology Support Project. The Bt technology available with Mahyco has been transferred (free of cost) to Tamil Nadu Agriculture University (Coimbatore), the University of Agricultural Sciences (Dharwad) and the Indian Institute of Vegetable Research (Varanasi).
2003) estimated potential welfare benefits from Bt eggplant adoption in India at US$ 422 million, with consumers gaining 57% of these benefits. Mahyco conducted multi-local field trials during the 2004-2005 cropping season to compare Bt eggplant hybrids with non-Bt in different agro-climatic regions. Their results suggest a 45% reduction in insecticide usage on the Bt plots (2.82 Kg/acre).The major impact of Bt technology was in yield, with the mean yield of Bt eggplant at 2.2 t/acre compared to non-Bt hybrids at 1.02 t/acre (Krishna and Qaim, 2007). Using contingent valuation techniques, Krishna and Qaim (2007 and 2008) report net benefits of US$ 370 to US$440 per acre from Bt eggplant hybrid adoption. Cornell University’s Agricultural Biotechnology Support Project II (ABSP II) estimates that Bt eggplant offers resource poor farmers in India significant benefit, including:
• 45% reduction in insecticide sprays, with implications for human health, and the environment production costs
• 117% increase in yield with implications for more affordable vegetables for consumers • US$411 million per annum increase in net benefits to Indian eggplant farmers and
consumers at the national level (ABSP II, 2007; James, 2007). Further, Krishna and Qaim (2008) project that Bt eggplant in India may produce farmer health benefits worth approximately $4 billion per year. An ex ante assessment conducted by Ramasamy et al (2007) also estimated net benefits from Bt eggplant cultivation by Indian farmers and consumers in the range of US$25 to 142 million per annum assuming only 10% adoption of Bt eggplant in the first year of commercialization. 8 Some studies estimate that FSB is responsible for losses of up to 60-70%. See Jeyanthi and Kombairaju, 2005; Lesser and Kolady, 2006; Mahyco 2008.

In spite of encouraging results from various farm-level trials conducted by both public and private firms and in spite of approval in October 2009 after lengthy review by GEAC, which includes experts from the Ministry of Environment, , the Ministry of Environment put approval for Bt eggplant on hold pending further consultations. Losers from this decision include small vegetable farmers who could reduce production costs and their exposure to pesticides, consumers who also would also reduce exposure to pesticide residue in the eggplants they consume, farmers and seed and biotech companies hoping this would open the door for GM food crops. Winners are pesticide companies, anti-GM groups and consumers who fear biotechnology more than they fear pesticides. This decision also reflects the political clout of various players. Vegetable farmers have little political clout. Some may worry that adoption of GM eggplant would reduce consumer demand. Commercial farmers and seed companies do have political clout, explaining why the Ministry of Agriculture publicly argued in favor of allowing commercialization of Bt eggplant. The pesticide industry and anti-GM groups are very well organized. Urban consumers, who may be more aware of potential problems from pesticide use, are inundated with Indian newspaper reports about potential problems of GM food crops. However, little is reported about pesticide residues in vegetables. The pesticide industry influences events quietly while anti-GM groups work noisily. The Ministry of the Environment and Forests is the final biosafety regulatory authority and seems to have decided it is more politically expedient to side with anti-GM groups and urban consumers than with small farmers. However, the debate continues. Conclusions
The earliest studies of Bt cotton impacts were conducted in China using data collected from a random sampling of farmers in northern China beginning in 1999. Using means comparisons and econometric analysis, these studies found small increases in yields, major reductions in pesticide use and increased profits for farmers adopting Bt cotton. In addition, Bt cotton adoption led to reduced pesticide use, which resulted in farmers reporting fewer pesticide-related- illnesses. In the early years, farmers captured almost the entire economic surplus from Bt cotton adoption. Suppliers of genetic traits and seeds made limited amounts of money because seeds were not hybrids and were quickly copied by farmers and other seed companies. Also in these years, limited benefits were transferred to consumers through lower cotton prices because the Government of China procured most of the cotton crop at a government-established price. In India, results of Bt adoption were different. Introduction of insect resistance had a significant impact on yields, with increases of 40 to 80 % as farmers in India did not have good pest control available to them. Reduction in pesticide use for bollworm control was also substantial but less than in China. Like Chinese farmers, Indian farmers increased their net incomes despite higher seed prices. Indian seed and biotech firms had more ways to appropriate benefit from the technology embodied in the seed than did Chinese companies. Indian farmers typically use hybrid seed and, until 2006, the Indian government only permitted one company to supply a Bt gene. However, farmers in India captured two-thirds of the social surplus generated by Bt cotton adoption even in the early years before price controls were mandated.

Perhaps this paper’s most important contribution is new evidence presented on recent changes in benefits from Bt cotton adoption. In China, CCAP economists have found that pesticide use for bollworm in Bt cotton has continued to decline up to 2007 when their last study was conducted. This is consistent with findings by entomologists (Wu et al 2008) that the bollworm population in all crops has declined because of Bt cotton. This suggests positive externalities for other crops such as maize and vegetables which had been sprayed extensively for bollworm but now have less damage and require fewer sprays. As yet, no outbreaks of Bt resistant bollworms have been reported in China. CCAP economists have also found that in some villages a minor pest, mirids, has become an increasing problem since Bt cotton was introduced, seemingly due to the decline in broad spectrum pesticides previously used to control bollworms (Lu et al 2010). The benefits from reducing pesticide sprays for bollworm outweigh costs of increased spraying for mirids.9
9 In India there have been reports that pink bollworms resistant to Bollgard – I were found in a small area of Gujarat. It is not clear the economic importance of this report. Pink bollworm is not the major bollworm pest in Gujarat or elsewhere in India, and Monsanto reports that Bollgard II controls pink bollworm.
Chinese farmers rather than biotech or seed companies continue to be Bt cotton’s main beneficiary as seed prices remain low because IPR enforcement is still weak and most seed used is varietal, not hybrid. Indian farmers now obtain a greater share of benefits from Bt cotton. State government policies increased farmer benefit at the expense of the seed and biotechnology industry. In both India and China, Bt cotton has spread to all areas where bollworm is a major pest, in India about 90% of the cotton area and in China about 70 to 80%. The area under Bt cotton is likely to remain the same until new superior traits are introduced. Thus, the development and commercialization of new GM crops is the most likely avenue for increased benefit from crop biotechnology in the near future. The approval of Bt rice in China and evidence of its efficacy in controlling borers and reducing pesticide suggests it will contribute significantly to China’s growth. Bt eggplant also has potential to transform vegetable production in India and elsewhere. However, it is now in regulatory limbo and may not be soon cultivated. Economists and plant scientists must continue to measure impact of Bt cotton to potentially identify ways to use Bt more effectively and to reduce further the use of chemical pesticides. For example, Arizona is using Bt and other forms of pest control in a coordinated program to eradicate pink bollworm (NCC, 2001). Continued research can also identify new problems farmers face from changes in pests and weather. In addition, comparative studies of the impacts on health and the environment of GM and chemical pesticides could be useful for decision makers. Finally, studies of the new GM traits and crops in regulatory trials or have recently adopted by farmers could help farmers and governments determine which traits best fit farmer needs. Acknowledgements: We would like to thank the two anonymous reviewers for their helpful comments. We would like to thank Ms. Judith Killen, for helping us to edit and revise the manuscript. Funding support from the Bill and Melinda Gates Foundation (BMGF) and Economic Research Service at USDA is gratefully acknowledged.

References
ABSP-II (Agricultural Biotechnology Support Project –II). (2007). Bt Eggplant Insect Resistance
Management Strategy for the Eggplant Fruit and Shoot Borer. Cornell University: Ithaca, NY.
www.sathguru.com/absp2/irmstrategy.pdf.
Adityendra, K. (2007). Indian Agri-Biotech Sector: Emerging scenarios, issues and challenges.
Rabo Bank F&A Research and Advisory Report, Mumbai, India.
Anderson, K., Valenzuela, E., Jackson, L.A. (2008). Recent and Prospective Adoption of
Genetically Modified Cotton: A Global Computable General Equilibrium Analysis of Economic
Impacts. Economic Development and Cultural Change, 56, 265-296.
ASSOCHAM - Association of Chambers of Commerce and Industry of India. (2007). Economic
benefits of Bt cotton cultivation in India. In Bt cotton farming in India. New Delhi, India.
Retrieved from Monsanto website athttp://monsanto.mediaroom.com/index.php?s=43&item=508
Bambawale, O. M., Singh, A., Sharma, O. P., Bhosle, B. B., Lavekar, R. C., Dhandapani, A.,
Kanwar, V., Tanwar, R. K., Rathod, K. S., Patange, N. R., Pawar, V. M. (2004). Performance of
Bt cotton (MECH-162) under Integrated Pest Management in farmers’ participatory field trial in
Nanded district, Central India. Current Science, 86 (12), 1628-1633.
Barwale, R. B., Gadwal, V. R., Zehr, U., Zehr, B. (2004). Prospects for Bt cotton technology in
India. AgBioForum, 7, 23-26.
Bennett, R. M., Ismael, Y., Kambhampati, U., Morse, S. (2004). Economic impact of genetically
modified cotton in India. AgBioForum, 7, 96-100.
Bennett, R., Kambhampati, U., Morse, S., Ismail, Y. (2006). Farm-level economic performance
of genetically modified cotton in Maharashtra, India. Review of Agricultural Economics, 28, 50-
71.
Bennett, R.M., Ismael, Y., Morse, S. (2005). Explaining contradictory evidence regarding
impacts of genetically modified crops in developing countries: Varietal performance of
transgenic cotton in India. Journal of Agricultural Science, 143, 35-41.
Biospectrum-ABLE industry overview. (2009). Biospectrum, Cyber media Publication, 4(11),
Bangalore, India.
Brookes G and P Barfoot. 2010. GM Crops: Global Socio-economic and Environmental Impacts
1996-2008. P.G. Economics Ltd, Dorchester, UK. http://www.pgeconomics.co.uk/pdf/2010-
global-gm-crop-impact-study-final-April-2010.pdf

Brookes, G., Barfoot, P. (2008). Global impact of biotech crops: socioeconomic and
environmental effects, 1996-2006. AgBioForum, 11, 21-38.
CCI (Cotton Corporation of India). 2009. National Cotton Scenario, Ministry of Textile.
http://www.cotcorp.gov.in/national_cotton.asp
Choudhary, B.,Gaur., K. (2009). Agri-Biotech in India: A new surge. Biotech News, 4(2), 30-33.
Department of Biotechnology, Ministry of Science and Technology, Government of India.
CICR- Central Institute of Cotton Research. (2009). Cotton Database. Nagpur, India. Retrieved
from
GEAC- Genetic Engineering Approval Committee. (2009).
Accessed at
http:/ /www.cicr.org.in.
DST- Department of Science and Technology Annual Report. (2008). Ministry of Science and
Technology, Technology Bhavan, New Delhi.
DST- Department of Science and Technology. (2006). Report of the working group for the
eleventh five year plan (2007–2012). Ministry of Science and Technology, Technology Bhavan,
New Delhi.
Francis Kanoi Agri-Inputs Marketing Research Data Bank. (2010). Cotton Crop Track: A
Syndicated Report on Seeds. Francis-Kanoi Marketing Research, Chennai, India.
Frisvold, G. B., Reeves, J. M. (2007). Economy-wide impacts of Bt Cotton. Proceedings of the
Beltwide Cotton Conference, January 2007.
Gandhi, V., Namboodiri, N.V. (2006). The adoption and economics of Btcotton in India:
Preliminary results from a study. Indian Institute of Management (IIM), Ahmadabad, India.
Working paper No. 2006-09-04.
http://www.envfor.nic.in/divisions/csurv/geac/decision-jan-91.htm.
Hossain,F., Pray,C.E., Lu, Y., Huang,J., Fan,C., Hu, R. (2004). GM Cotton and Farmer’s Health
in China: An Econometric Analysis of the Relationship between Pesticide Poisoning and GM
Cotton Use in China. International Journal of Occupational and Environmental Health, 10(3),
307-314.
http://ipts.jrc.ec.europa.eu/publications/pub.cfm?id=2199
Hu, R.,Pray,C.E., Huang, J., Rozelle,S.,Fan,C., Zhang,C. (2009). Reforming Intellectual Property
Rights and the Bt Cotton Seed Industry in China: Who Benefits from Policy Reform? Research
Policy, 38, 793–801.

Huang, J. (2010). Biotech and approval of GM rice and maize in China and its implications.
Presented at the 14th ICABR conference on Bioeconomy Governance: Policy, environmental and
health regulations, and public investments in Research (June 16-18), Ravello, Italy.
Huang, J., Hu, R., Rozelle, S., Pray, C.E. (2005). Insect-Resistant GM Rice in Farmers’ Fields:
Assessing Productivity and Health Effects in China. Science, 308, 688–690.
Huang, J., Hu, R., Rozelle, S., Pray, C.E. (2008). Genetically modified rice, yields, and
pesticides: Assessing farm-level productivity effects in China. Economic Development and
Cultural Change, 56, 241-263.
Huang, J., Hu, R., Rozelle, S., Qiao, F., Pray, C.E. (2002). Transgenic varieties and productivity
of smallholder cotton farmers in China. Australian Journal of Agricultural and Resource
Economics,
IGMORIS -Indian GMO Research Information Service. (2010). Retrieved from website at
46(3), 367-387.
Huang, J., Hu, R., van Meijl, H., van Tongeren, F. (2004). Biotechnology Boosts to Crop
Productivity in China: Trade and Welfare Implications. Journal of Development Economics,
75(1), 27-54.
Huang, J., Mi, J.W., Lin, H., Wang, Z., Chen, R., Hu, R., Rozelle, S., Pray,C.E. (2010). A decade
of Bt cotton in Chinese fields: Assessing the direct effects and indirect externalities of Bt cotton
adoption in China. Science China Life Sciences, 53, 981–991. doe: 10.1007/s11427-010-4036-y
Huang, J., Wang, Q. (2002). Agricultural biotechnology development and policy in China.
AgBioForum, 5(4), 122-135.
Gruère, G. P., Mehta-Bhatt,P., and Sengupta.D. 2008. Bt Cotton and Farmer Suicides in India.
IFPRI Discussion Paper 00808. Environment and Production Technology Division, International
Food Policy Research Institute, Washington, D.C.
http://igmoris.nic.in/commercial_approved.asp
Indicus Analytics, 2007. Socio-economic appraisal of Bt cotton cultivation in India. Indicus
Analytics Study.
ISAAA- International Service for the Acquisition of Agri-Biotech Applications (2010). Biotech
Wheat. Brief No.38, August, 2010. SEAsiaCenter c/o IRRI, DAPO Box 7777, Metro Manila,
Philippines.
James, C. (2007). Global Status of Commercialized Biotech/GM Crops. ISAAA Briefs No. 37.
International Service for the Acquisition of Agri-Biotech Applications. Ithaca, NY.

James, C. (2008). Global Status of Commercialized Biotech/GM Crops. ISAAA Briefs No. 39.
International Service for the Acquisition of Agri-Biotech Applications. Ithaca, NY.
Jeyanthi, H., Kombairaju. S. (2005). Pesticide Use in Vegetable Crops: Frequency, Intensity and
Determinant Factors. Agricultural Economics Research Review, 18, 209-221.
Kambhampati, U., Morse, S., Bennett, R., Ismael, Y. (2005). Perceptions of the impacts of
genetically modified cotton varieties: A case study of the cotton industry in Gujarat, India.
AgBioForum, 8(2&3), 161-171.
Karihaloo,J.L., Kumar, P.A.(2009). Bt cotton in India – A status report (Second Edition). Asia-
Pacific Consortium on Agricultural Biotechnology (APCoAB), New Delhi, India.
Kolady, D.E., Lesser, W. (2006). Who adopts what kind of technologies? The case of Bt
eggplant in India. AgBioForum, 9(2), 94-103.
Krishna, V.V., Qaim, M. (2007). Estimating the adoption of Bt eggplant in India: Who Benefits
from public-private partnership? Food Policy, 32(5&6), 523-543.
Krishna, V.V., Qaim, M.(2008). Potential impacts of Bt eggplant on economic surplus and
farmers' health in India. Agricultural Economics, 38(2), 167-180.
Linton, K., M. Torsekar, M. (2010). Innovation in Biotechnology Seeds: Public and Private
Initiatives in India and China. Journal of International Commerce and Economics, Published by
the United States International Trade Commission(USITC), Washington D.C.
Lu, Y., Wu, K., Jiang,Y., Xia,B., Li, P., Feng, H., Wyckhuys, K.A.G., Guo, Y. (2010). Mirid
Bug Outbreaks in Multiple Crops Correlated with Wide-Scale Adoption of Bt Cotton in China.
Science, 328, 1151-1153.
Mishra, S. (2003). An ex-ante economic impact assessment of Bt eggplant in Bangladesh, the
Philippines and India. Unpublished Master's Thesis, Virginia Tech University, USA.
Murugkar, M., Ramaswami, B., Shelar, M. (2007). Competition and monopoly in the Indian
cotton seed market. Economic and Political Weekly, 62 (37), 3781–3789.
Natesh, S., Bhan, M.K.(2009). Biotechnology sector in India: strengths, limitations, remedies
and outlook. Current Science, 97(2),157-169.
NCC-National Cotton Council. (2001). Pink bollworm eradication: a window of opportunity.
http://www.cotton.org/tech/pest/bollworm/loader.cfm?csModule=security/getfile&pageid=10771
Accessed in January, 201.

Pemsl, D. (2006). Economics of Agricultural Biotechnology in Crop Protection in Developing
Countries – The Case of Bt-Cotton in Shandong Province, China. Pesticide Policy Project
Publication Series, Special Issue No. 11. University of Hannover, Germany.
Pemsl, D., Waibel, H. (2007). Assessing the profitability of different crop protection strategies in
cotton: Case study results from Shandong Province, China. Agricultural Systems, 95, (1-3), 28-
36.
Pemsl, D., Waibel, H., Gutierrez, A. P. (2005). Why do some Bt-cotton farmers in China
continue to use high levels of pesticides? International Journal of Agricultural Sustainability,
3(1), 44-56.
Pray C. E., Bengali, P., Ramaswami, B. (2005). The Cost of Regulation: the India Experience.
Quarterly Journal of International Agriculture, 44 (3), 267-289.
Pray, C.E. and L. Nagarajan (2011). Price Controls and Biotechnology Innovation: Are State
Government Policies Reducing Research and Innovation by the Ag Biotech Industry in India?
Forthcoming in Agbioforum
Pray, C.E., Huang, J., Ma, D., Qiao, F. (2001). Impact of Bt cotton in China. World
Development, 29, 813-825.
Qaim, M. (2003). Bt Cotton in India: Field Trial Results and Economic Projections. World
Development. 31 (12), 2115–2127.
Qaim, M., Subramanian, A., Naik G., Zilberman, D. (2006). Adoption of Bt Cotton and Impact
Variability: Insights from India. Review of Agricultural Economics, 28(1),48–58.
Qaim, M., Zilberman, D. (2003). Yield Effects of Genetically Modified Crops in Developing
Countries. Science, 299, 900–902.
Qaim.M. (2009). The Economics of Genetically Modified Crops. The Annual Review of
Resource Economics, 1, 665-693.
Ramasamy C, Selvaraju K.N, Norton G.W, Vijayaraghavan, K. (2007). Economic and
environmental benefits and costs of transgenic crops : ex-ante assessment. Working Paper –
CARDS, Department of Agricultural Economics, Tamil Nadu Agricultural University.
Coimbatore.
Rao,S.S. (2008). Economic impact of price controls and regulations: Case of GM Cotton in
India. Unpublished MS Thesis, Department of Agricultural, Food and Resource Economics,
Rutgers, The State University of New Jersey, New Brunswick, NJ 08902.

Rengasamy,N., Elumalai, K. (2009). Market Opportunities and Challenges for Agri-Biotech
Products in India. Agricultural Economics Research Review, 22, 471 481.
Sadashivappa, P., Qaim, M. (2009). Bt cotton in India: Development of benefits and the role of
government seed price interventions. AgBioForum, 12(2), 172-183.
Singh, S.K. (2007). India: Cotton and Products Annual. Foreign Agricultural Services (FAS),
United States Department of Agriculture (USDA).
Stein, A.J. and E. Rodríguez-Cerezo (2009). The global pipeline of new GM crops: introduction
Subramanian, A., Qaim, M. (2009). Village-wide effects of agricultural biotechnology: The case
of Bt cotton in India. World Development, 37, 256-267.
to the database. JRC Technical Note EUR 23810 EN. Luxembourg: European Communities.
Vaidya, A. (2005). Monsanto’s cotton has deficiencies: study. Retrieved from The Times of India
at: http://timesofindia.indiatimes.com/city/pune/Monsantos-cotton-has-deficiencies-
study/articleshow/1132562.cms
Wang G., Wu Y., Gao W., Fok M., Liang W. (2008). Impact of Bt Cotton on the Farmer's
Livelihood System in China In: International Cotton Conference, Rationales and evolutions of
cotton policies in main producing countries. ISSCRI International Conference (May, 13-17),
Montpellier, France.
Yang, P., Iles, M., Yan, S., Joliffe, F. (2005). Farmers' knowledge, perceptions and practices in
transgenic Bt cotton in small producer systems in Northern China. Crop Protection, 24(3), 229-
239.

Figures
Fig. 1 Agricultural biotech research investment in China (1986 to 2003)
Source: Huang, Hu, Rozelle and Pray (2005) Note: Investments are calculated at 2003 year base prices equivalent terms. The conversion factor is therefore, 1.65 billion Yuan = US$ 200 million using the 2003 market exchange rate..
0
200
400
600
800
1000
1200
1400
1600
180019
8619
8719
8819
8919
9019
9119
9219
9319
9419
9519
9619
9719
9819
9920
0020
0120
0220
03
Mill
ion
Yua
n (2
003
Pric
es)
Plants
Agriculture
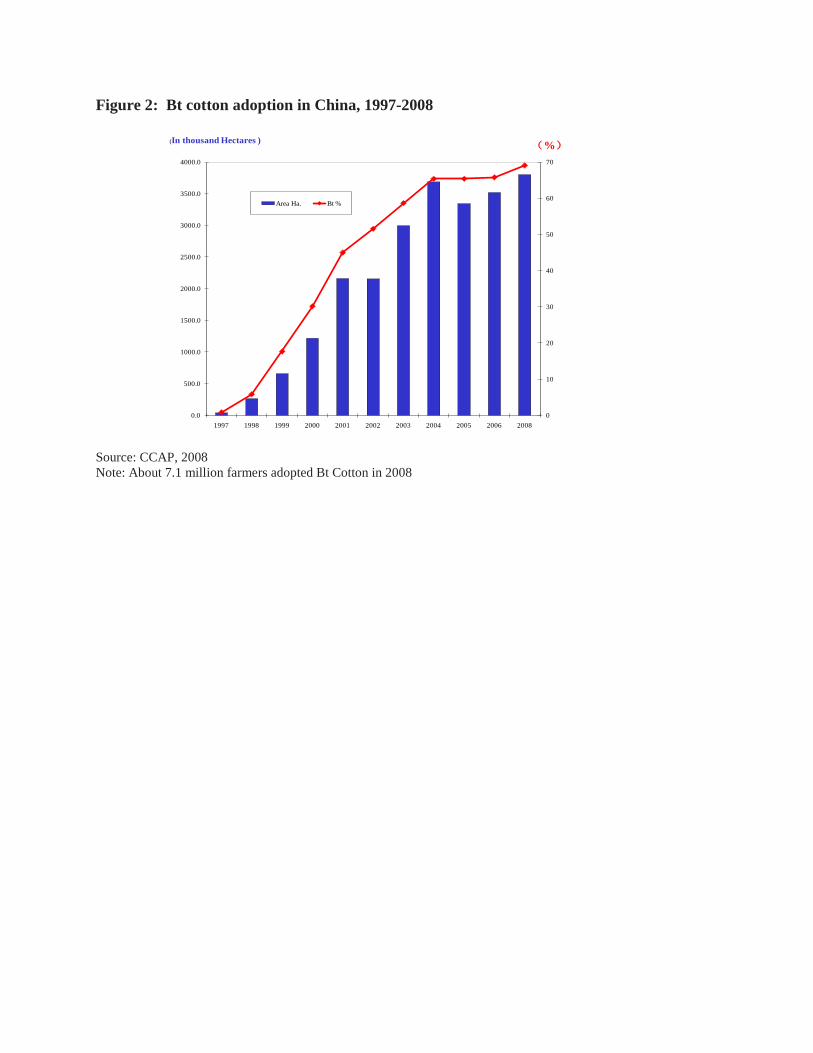
Figure 2: Bt cotton adoption in China, 1997-2008
0
10
20
30
40
50
60
70
0.0
500.0
1000.0
1500.0
2000.0
2500.0
3000.0
3500.0
4000.0
1997 1998 1999 2000 2001 2002 2003 2004 2005 2006 2008
Area Ha. Bt %
(In thousand Hectares )(%)
Source: CCAP, 2008 Note: About 7.1 million farmers adopted Bt Cotton in 2008

Fig.3 Trends under Bt cotton adoption in India (2002-03 to 2009-2010)
Source: 2002 to 2006, Singh, S.K (2007); 2007 to 2010 Illegal Bt area is estimated by Indian seed industry sources in personal communication with the authors.
0.0
2.0
4.0
6.0
8.0
10.0
12.0
Total cotton area (Mill Ha)
Bt cotton area (Mill Ha)
Illegal Bt Area
Total Bt area
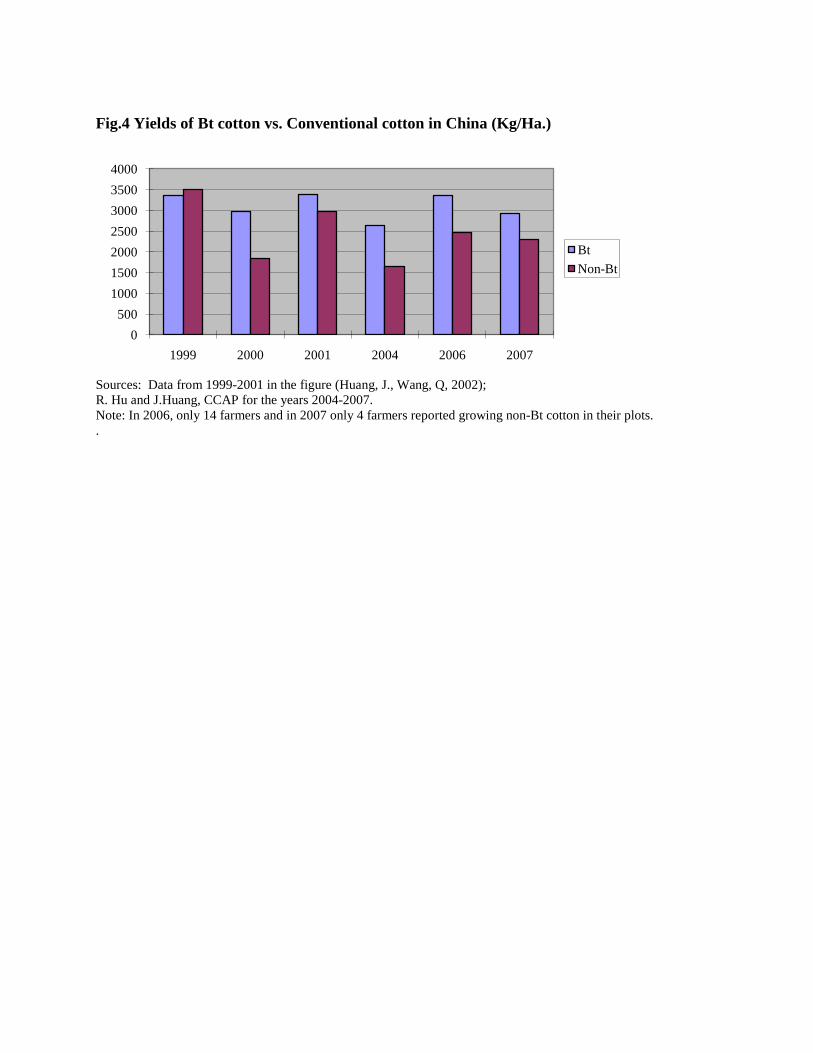
Fig.4 Yields of Bt cotton vs. Conventional cotton in China (Kg/Ha.)
Sources: Data from 1999-2001 in the figure (Huang, J., Wang, Q, 2002); R. Hu and J.Huang, CCAP for the years 2004-2007. Note: In 2006, only 14 farmers and in 2007 only 4 farmers reported growing non-Bt cotton in their plots. .
0500
1000150020002500300035004000
1999 2000 2001 2004 2006 2007
BtNon-Bt

Fig.5 Cotton yields in China (MT/Ha) 1950-2008
Source: Compiled by R. Hu and J.Huang, CCAP, 2010.
0.000
0.200
0.400
0.600
0.800
1.000
1.200
1.400
1950 1955 1960 1965 1970 1975 1980 1985 1990 1995 2000 2005

Fig. 6 Cotton pesticide use (Kg/Ha) by sample households in Henan province, China (1999-2007)
Source: Data from Huang et al 2010. Note: In 2006, only 14 farmers and in 2007 only 4 farmers reported growing non-Bt cotton in their plots.
0
10
20
30
40
50
60
70
80
90
1999 2000 2001 2004 2006 2007
Kg/
ha
Bt variety pesticides for all insectsNon-Bt variety pesticides for all insectsBt variety pesticides only for bollwormNon-Bt variety pesticides only for bollworm

Fig. 7 Net Revenues (RMB Yuan current prices) from BT vs. non BT cotton among surveyed villages in China
Source: Data from 1999-2001 in the figure (Huang et al. 2002); Unpublished data collected by authors for the years 2004, 2006 and 2007 Note: In 2006, only 14 farmers and in 2007 only 4 farmers reported growing non-Bt cotton in their plots.
0
2000
4000
6000
8000
10000
12000
14000
16000
1999 2000 2001 2004 2006 2007
Bt
Non-Bt

Fig.8 Cotton yields in India (kg/ha) 1950-51 to2008-09
Source: Department of Agriculture, Ministry of Agriculture, New Delhi (2009).
First Commercial Hybrid (H-4)
Bt Cotton
0
100
200
300
400
500
600
70019
50-5
119
52-5
319
54-5
519
56-5
719
58-5
919
60-6
119
62-6
319
64-6
519
66-6
719
68-6
919
70-7
119
72-7
319
74-7
519
76-7
719
78-7
919
80-8
119
82-8
319
84-8
519
86-8
719
88-8
919
90-9
119
92-9
319
94-9
519
96-9
719
98-9
920
00-0
120
02-0
320
04-0
520
06-0
720
08-0
9
Tables
Table 1 Emerging public-private partnerships in agbiotechnology research in China (2009) International company Chinese biotech institute Commodity focus Research
description Pioneer/DuPont Peking University
Rice Stress, efficient
nutrition utilization Dow China National Rice
Research Institute Rice
BASF National Institute of Biological Sciences
Corn, soybean, rice Yield genes
Monsanto Peking-Yale Joint Center for Plant Molecular
Genetics and Ag-biotechnology
Gift for scholarships Plant biotech
Syngenta Institute of Genetics and Developmental Biology
Anhui Rice Research Institute
China Agricultural University
Corn, soybean, wheat, sugar beet
and sugar cane Rice
Corn & soybean
Novel genes for agronomic traits
Bayer Crop Sciences China National Rice Research Institute
Rice Hybrids
Monsanto a Biotech research lab, Beijing
Company crops Genomics and bioinformatics.
Syngenta a Biotech lab, Beijing $65 million in 5 years, 200 scientists
and technicians by 2010
Yield, pest and drought resistance,
biomass conversion for biofuels
Novozyme a Own lab in Beijing
Bioenzymes
Mendel Genetics a Research facility, Southern China
Selection for yield, disease resistance
Miscanthus for biofuels
Source: Author interviews with companies in 2009 Beijing or company websites. Note: a In-house research facility headquartered in China by the respective firms
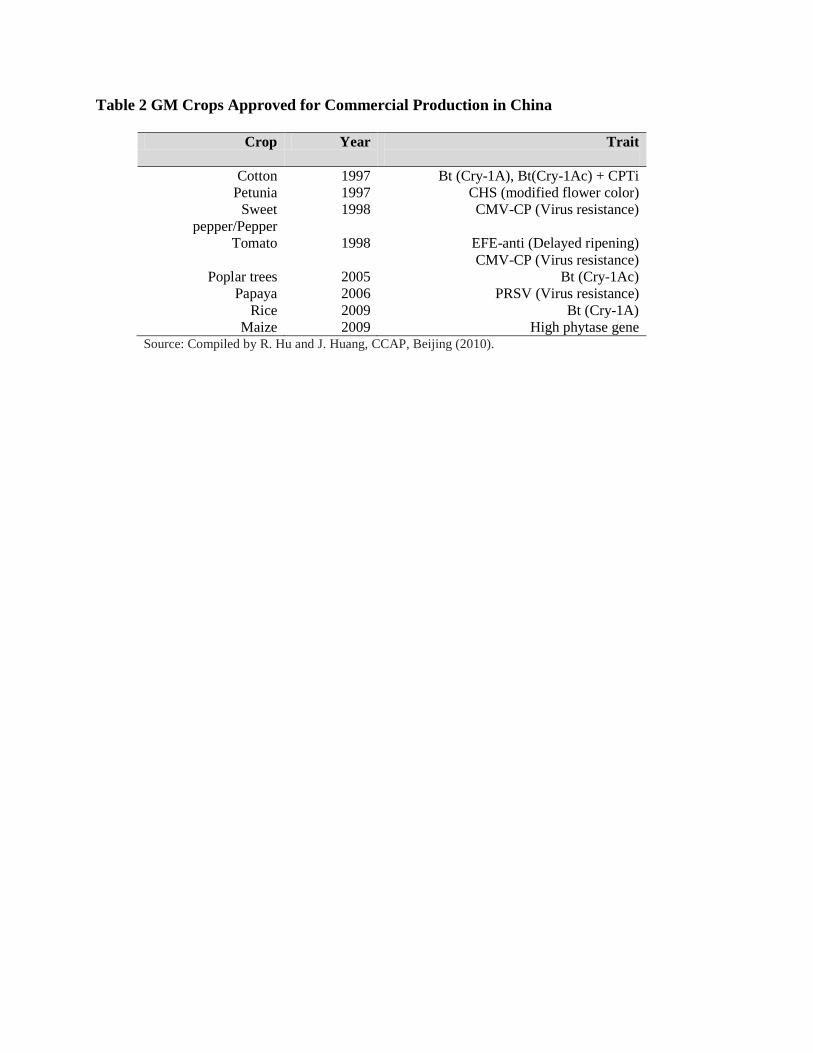
Table 2 GM Crops Approved for Commercial Production in China
Source: Compiled by R. Hu and J. Huang, CCAP, Beijing (2010).
Crop Year Trait
Cotton 1997 Bt (Cry-1A), Bt(Cry-1Ac) + CPTi Petunia 1997 CHS (modified flower color)
Sweet pepper/Pepper
1998 CMV-CP (Virus resistance)
Tomato 1998 EFE-anti (Delayed ripening) CMV-CP (Virus resistance)
Poplar trees 2005 Bt (Cry-1Ac) Papaya 2006 PRSV (Virus resistance)
Rice 2009 Bt (Cry-1A) Maize 2009 High phytase gene
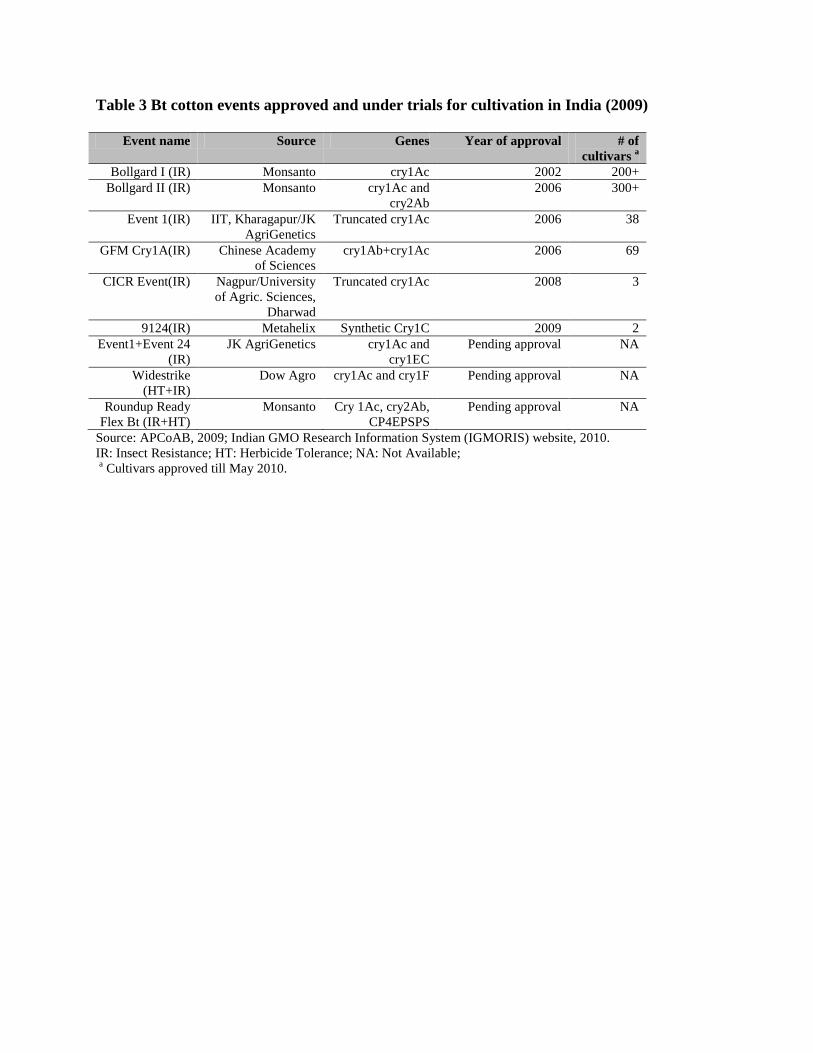
Table 3 Bt cotton events approved and under trials for cultivation in India (2009)
Event name Source Genes Year of approval # of cultivars a
Bollgard I (IR) Monsanto cry1Ac 2002 200+ Bollgard II (IR) Monsanto cry1Ac and
cry2Ab 2006 300+
Event 1(IR) IIT, Kharagapur/JK AgriGenetics
Truncated cry1Ac 2006 38
GFM Cry1A(IR) Chinese Academy of Sciences
cry1Ab+cry1Ac 2006 69
CICR Event(IR) Nagpur/University of Agric. Sciences,
Dharwad
Truncated cry1Ac 2008 3
9124(IR) Metahelix Synthetic Cry1C 2009 2 Event1+Event 24
(IR) JK AgriGenetics cry1Ac and
cry1EC Pending approval NA
Widestrike (HT+IR)
Dow Agro cry1Ac and cry1F Pending approval NA
Roundup Ready Flex Bt (IR+HT)
Monsanto Cry 1Ac, cry2Ab, CP4EPSPS
Pending approval NA
Source: APCoAB, 2009; Indian GMO Research Information System (IGMORIS) website, 2010. IR: Insect Resistance; HT: Herbicide Tolerance; NA: Not Available; a Cultivars approved till May 2010.

Table 4 Area, Yield and Seed Sales of Bt cotton in India
Year Total cotton area
Million Ha
Bt Cotton Area Yield
Bt Seed Packets
Sold a Illegal Bt
Area Million
Ha % to total Kg/Ha
Million
Million Ha
2002-03 7.7 0.05 0.7 302 0.1 0.03 2003-04 7.6 0.1 1.3 404 0.2 0.1 2004-05 8.8 0.5 5.7 470 1.3 0.6 2005-06 8.8 1.3 14.7 478 3.1 1.2 2006-07 9.1 3.8 41.6 521 4.0 2.0 2007-08 9.6 6.3 65.7 560 16.0 1.8 2008-09 9.4 7.6 81.1 526 27.0 1.6
2009-10 9.5 b 8.4 88.8 575 30.0 1.3a
Source: James (2008); Ministry of Agriculture, GOI (2009). a Each packet sold is equivalent to 450 grams of Bt Cotton Seed. b Estimates based on personal communication with seed firms (2009-10 only)

Table 5 Bt cotton adoption and net revenue realized by farmers, seed firms and technology providers Year Bt
Packets sold
Bt Cotton Area
Net Revenue Bt Cotton (Farmersa+Firmsb+MMBc
Share of stakeholders in Net Revenue (%)
) Million Million
Hectares Million Indian Rupees
Farmers Seed Firms Technology Provider (MMB)
2002-03 0.07 0.05 474.10 71.20 18.20 10.60 2003-04 0.23 0.10 1,110.90 60.80 24.80 14.40 2004-05 1.30 0.50 5,975.00 56.50 27.70 15.80 2005-06 3.13 1.30 15,113.30 58.10 26.90 15.00 2006-07* 4.00 3.80 26,762.00 95.80 1.90 2.30 2007-08 16.00 6.30 45,550.90 93.40 3.10 3.60 2008-09 27.00 7.60 56,761.60 90.40 4.20 5.40 2009-10 30.00 8.40 63,434.40 89.40 4.40 6.30 Source: Authors’ calculations based on information provided by Industry sources on total number of seed packets sold. * Price controls were imposed in three states from the 2006-2007season. a Net revenues for farm households were calculated based on field-based studies conducted by Qaim et al in various years. The net revenue assumptions for the years 2002-2003 to 2006-2007 were based on Qaim et al farm level survey results; for 2009-2010, based on Francis-Kanoi CCTK 2009-2010. b Net revenue of seed firms = Bt seed sales price – Technology Provider trait fee (MMB fee) - Cost of seed production (that includes revenue shared with actors in distribution channels) times the number of packets (450gms) sold. The cost of seed production incurred by seed firms assumed indifferent for BG 1 and BG 2. c Technology providers’(MMB) revenue is calculated from their share in total trait value. Of the total revenue, Monsanto shares 50 % of revenue with their domestic partner, Mahyco.

Table 6 GMO crops in Pipeline in China Crop Trait/Institution Rice Bt -Chinese Academy of Science (Bt/sck rice)
Disease resistant rice – Chinese Academy of Agricultural Sciences (Xa21) Bt rice - Zhejiang University (cry1Ab)
Maize Bt – Chinese Agricultural University Wheat Herbicide tolerance – Henan Agricultural
University Soybean Herbicide tolerance Chinese Academy of
Agricultural Sciences Tomato, Rapeseed, Chili and Cabbage
Chinese Academy of Agricultural Sciences - Disease and pest resistance
Source: Huang, J. (2010).

Table 7 GMO research in India (2006-2009) Crop Number of firms
with own events # of firms
testing GM cultivars
Trait focus
Public Private Eggplant 3 3 14 Insect resistance Cabbage 0 2 7 Insect resistance Castor 1 0 - Insect resistance Cauliflower 0 2 7 Insect resistance Corn 0 3 4 Insect resistance/Herbicide
tolerance Cotton 2 5 37 Insect resistance/Herbicide
tolerance Peanut/Pigeon pea 1 0 3 Virus resistance / drought tolerance Okra 0 4 9 Insect resistance Potato 3 0 - Disease resistance Rice 7 9 13 Pest /disease/drought resistance
fortified food; Sorghum 1 0 4 Insect resistance Wheat 1 1 - Biotic and abiotic resistance Tomato 4 2 10 Pest /disease/drought resistance Source: IGMORIS data base; Biospectrum (2008). Private firms include the research on transgenic rice by two non-governmental organizations.