
Caribbean/South American Regional Traffic Forecasts, 2011 - ICAO
45
. Caribbean/South American Regional Traffic Forecasts 2011-2031 Report of the Ninth Meeting Of the CAR/SAM Traffic Forecasting Group (CAR/SAM TFG) Tegucigalpa. Honduras, 30 April-4 May 2012 International Civil Aviation Organization
Transcript of Caribbean/South American Regional Traffic Forecasts, 2011 - ICAO
.
Caribbean/South American Regional Traffic Forecasts 2011-2031
Report of the Ninth Meeting Of the CAR/SAM Traffic Forecasting Group (CAR/SAM TFG) Tegucigalpa. Honduras, 30 April-4 May 2012 International Civil Aviation Organization

.
NINTH MEETING OF THE CAR/SAM TRAFFIC FORECASTING GROUP
CAR/SAM TFG
(Tegucigalpa, Honduras, 30 April – 4 May 2012)
TABLE OF CONTENTS Page 1. Introduction ...................................................................................................................... 1 2. Methodology .................................................................................................................... 2 2.1 Definitions of Route Groups ............................................................................................ 2 2.2 Air Passenger Forecast Methodology ............................................................................... 2 2.3 Aircraft Movements Forecast Methodology..................................................................... 3 3. Historical Trends and Forecast assumptions .................................................................... 4 3.1 Global Trends ............................................................................................................. 4 3.1.1 Global Economic Trends .................................................................................. 4 3.1.2 Global Traffic Trends ....................................................................................... 4 3.2 Trends and Prospects for the Latin America and Caribbean Region ................................ 5 3.2.1 Data Sources ............................................................................................................ 5 3.2.2 Historical Traffic Trends of the Latin American and Caribbean Airlines ............... 5 3.2.3 Economic Trends and Prospects .............................................................................. 6 3.3 Yield Trends and Assumptions ........................................................................................ 7 3.4 Analysis of Load Factors and Capacity ............................................................................ 9 4. Forecasts of Passenger Traffic and Aircraft Movements for Major Route Groups To, From and Within the Latin American and Caribbean Region ...................... 11 4.1 South Atlantic ............................................................................................................. 11 4.2 Mid-Atlantic ............................................................................................................... 13 4.3 Intra-South America ................................................................................................... 15 4.4 Between South America and Central America/Caribbean ......................................... 17 4.5 Intra-Central America/Caribbean ............................................................................... 19 4.6 Between North America and South America and Central America/Caribbean .......... 21 4.7 Summary of Major Route Group Forecasts ...................................................................... 23 4.7.1 Passenger Forecast................................................................................................... 23 4.7.2 Aircraft Movements Forecast .................................................................................. 24 Appendix A: Peak-Period Analysis for Central American FIR ………………………... 25 Appendix B: Definition of the Route Groups and Geographical Areas Used in the Development of Forecasts By the CAR/SAM TFG …………………… ..... 39 Appendix C: List of Participants ............................................................................................. 41
(i)

1. INTRODUCTION 1.1 The main purpose of the Caribbean/South American (CAR/SAM) Region Traffic Forecasting Group (TFG) which was established in 1996, is to prepare forecasts for air passenger traffic and aircraft movements as well as peak period analysis, used to support the planning of air navigation services in the Region. Traffic forecasts and the analysis of peak-period planning parameters are important in anticipating where and when airspace and airport congestions may occur. It is then possible to plan for the required expansion of capacity. These forecasts also have an important role in planning the implementation of CNS/ATM systems. The primary users of the forecasts developed by the CAR/SAM TFG are expected to be Member States of ICAO, air navigation service providers in the region, and the ICAO planning and implementation regional group for CAR/SAM (GREPECAS). 1.2 The CAR/SAM TFG to date has held 9 meetings. During the last meeting, held in Tegucigalpa, Honduras from 30 April to 4 may 2012, the Group developed a new set of forecasts for the six major route groups to, from and within the Region, taking into account the recent developments. The forecasts cover passenger and aircraft movements traffic. Passenger traffic forecasts are based on assumptions made for economic growth and passenger yields. Aircraft movements traffic forecasts are based on assumptions for future trends in average load factors and average aircraft seating capacity. Projections of aircraft movements traffic for the top 25 city pairs in each of the major route groups were also developed. In addition, the analysis of FIR aircraft movements traffic data including peak-period planning parameters for the airspace controlled by COCESNA (CENAMER FIR) was carried out. In preparing the forecasts, the base year was 2011, and the forecasts were developed for the periods 2011-2016, 2016-2031and 2011-2031.

- 2 -
2. METHODOLOGY 2.1 Definition of Route Groups 2.1.1 Traffic to, from and within the CAR/SAM Region is classified, into the following six major route groups as defined in Appendix C: 1) South Atlantic 2) Mid-Atlantic 3) Intra-South America 4) Between South America and Central America/Caribbean 5) Intra-Central America/Caribbean 6) Between North America and South America and Central America/Caribbean 2.2 Air Passenger Forecast Methodology 2.2.1 In preparing passenger forecasts for the CAR/SAM region, the Group estimated a passenger model that uses Gross Domestic Product and yields to explain air passenger demand for scheduled service. Non-scheduled, or charter services are not included. No specific assumptions were made about various possible geo-political and economic events in the future beyond those implicit in the GDP assumptions (GDP assumptions are discussed in Section 2.3.2 and Yields Assumptions in Section 3.3.3). 2.2.3 The Group’s model uses both time series and cross-sectional sets of data from 1993 to 2011 covering all of the above six routes. Scheduled air passenger statistics and yields were obtained from ICAO whereas GDP data was obtained from IHS Global Insight. With respect to the form of the model, a log linear regression model was estimated using Excel, and this was similar to the model developed at the previous 2010 meeting. In order to account for the disparities among the six routes, the model was calibrated with the following three dummy variables:
South Atlantic and Mid Atlantic Intra-South America and Intra Central America/Caribbean Between South America and Central America/Caribbean AND between North America and
South America/Central America/Caribbean 2.2.4 The model calibration resulted in the equation shown below, which was deemed to be the best fit of the historical data, hence it was used to forecast air passenger traffic. Total Regional air passenger forecasts for each route were then produced using the model results and forecasts of GDP and yields. To finalize the forecast, adjustments were applied accordingly based on differential growth rates of the routes.
LN (Passengers) = Constant + A*LN(GDP) + B*LN(Yield) + Dummy Variables
In this functional form, A and B are constant coefficients which represent elasticities.
The calibration produced the following results:
Ln (Passengers) = -13.22 + 1.93 ln(GDP) - 0.74 ln(Yield) - 2.33 (D1) + 1.90 (D2) - 0.36 (D3) (Adj. R2 = 0.95, tGDP = 26.12, tYield = -3.81, tD1 = -22.24, tD2 = 22.14, tD3 = -4.78)

- 3 -
2.3 Aircraft Movement Forecast Methodology 2.3.1 Forecasts of aircraft movements for each route group were derived from forecasts of air passengers and assumptions about future trends in load factors and average aircraft seating capacity. The link between these variables is expressed below:
Number of Air Passengers Number of Aircraft Movements _______________________________________________________
(Passengers/Seats) * (Seats per Aircraft)
Number of Air Passengers __________________________________________________________________
(Load factors) * (Average Aircraft Seating Capacity) 2.3.2 The relationship between changes in the same variables can therefore be deduced to: Y = X1 – X2 – X3 Where: Y = Change in number of aircraft movements (%) X1 = Change in number of air passengers (%) X2 = Change in load factors (%) X3 = Change in average aircraft seats (%) 2.3.3 Judgement was applied to assess expected trends in load factors. In addition an analysis of future trends in average aircraft seating capacity was discussed. It was assumed that historical trends of using aircraft with larger seating capacity and matching of aircraft size to demand levels will be continued by airlines over the forecast horizon. 2.3.4 Aircraft movement forecasts were then allocated to each of the respective city-pairs taking into account traffic service patterns, types of aircraft, demographics and other pertinent factors. 2.3.5 The historical trends in total seats available, average aircraft size, average load factor as well as aircraft movements were established for each of the route groups concerned based on data from Traffic by Flight Stage (TFS) compiled by ICAO. 2.3.6 For each of the major route groups concerned, a detailed city-pair traffic flow was developed using the 2011 Official Airline Guide (OAG) data as the basis. A relationship between the TFS data and the aircraft movement data from the OAG was established.

- 4 -
3. HISTORICAL TRENDS AND FORECAST ASSUMPTIONS 3.1 Global Trends 3.1.1 Global Economic trends 3.1.1.1 Between 2001 and 2011, the aggregate world economy measured in terms of Gross Domestic Product (GDP) grew at an average annual rate of 3.6 per cent in real terms. Growth rates varied across regions, from a low of 1.6 per cent for North America to as high as 6.2 per cent for Asia/Pacific. During the same period the world population increased at an average annual rate of 1.2 per cent. The resulting world GDP per capita was a healthy increase of 2.4 percent per year over the 10 year period. 3.1.1.2 After a decline of about 1 per cent in 2009, the world economy began to recover. The real GDP grew 5.1 and 3.7 per cent in 2010 and 2011 respectively. In the short term the world economy is expected to grow 3.4 and 4.1 percent during the years 2012 and 2013. Over the long-term (2011 to 2031) the world economy is projected to grow at an average annual rate of 4.0 per cent in real terms, while world GDP per capita is projected to grow by 3.1 per cent. 3.1.2 Global Traffic trends 3.1.2.1 Between 2001 and 2011 total scheduled airline traffic, measured in terms of passenger-kilometres performed (PKPs), grew at an average annual rate of 5 per cent reaching some 4980 billion PKPs by 2011. As expected, the growth pattern of passenger traffic reflects that of economic growth and this linkage is illustrated in Figure 1 below. The early to mid 1990s were generally a period of robust growth for both GDP and air passenger traffic. Following that period, traffic growth slowed down considerably amid weak global economic conditions which were set-off by the Asian financial crisis in 1997 followed by the oil price increases of 1999 and further exacerbated by the events of September 11, 2001. It was only in 2004 that world traffic growth fully recovered registering a whopping 14.1 per cent growth, reflecting strong recovery by the airlines in Asia/Pacific (the region worst affected by the SARS outbreak), improved performance of some regional economies and the sustained expansion of the Middle East economy. Global traffic continued to grow remarkably between 2005 and 2007, supported by a strong performance of the world economy, registering growth rates of 8.0, 6.1 and 7.7 per cent respectively. In 2008 the global financial crisis and the ensued economic recession led to a significant slowdown in traffic growth resulting in a modest increase of about 3 percent. In 2009 the worst decline of 1.1 percent in air passenger traffic was experienced. In 2010 the world traffic bounces back and registered a growth of 8 per cent due mainly to the economic recovery. During 2011 the world traffic grew at 6.4 per cent as the economic recovery slowed down.

- 5 -
FIGURE 1
WORLD ANNUAL GROWTH IN GDP AND AIRLINE TRAFFIC 2000-2011
3.2 Trends and Prospects for The Latin American And Caribbean Region 3.2.1 Data sources 3.2.1.1 In order to study the relationship between traffic and socio-economic trends in the Latin American and Caribbean Region, data from several sources were collected on the economies of the countries in the area. GDP historical and forecast data originate from IHS Global Insight. Airline yield information was obtained from ICAO and adjusted by the CAR/SAM TFG based on the most recent information available from other sources. 3.2.2 Historical Traffic Trends of the Latin America and Caribbean Airlines 3.2.2.1 During the past decade (2001-2011), scheduled traffic of the Latin American and Caribbean region airlines, measured in terms of passenger–kilometers performed, grew at an average annual rate of about 5.4 per cent, compared to 5 per cent for global traffic, reaching some 226 billion passenger kilometres by 2011. Traffic growth was volatile over this period. After experiencing declining growth rates in 2001 (1 percent) and 2002 (3 percent), the region’s traffic recovered in 2004 (9.6 percent) and continued to expand until 2007 supported by an improved economic environment. In 2008 the region’s traffic maintained its momentum and grew by 8.1 percent, contrary to the world traffic which slowed down. In 2009 as the economic crisis took its toll on global traffic and as a consequence, the region’s traffic also suffered a decline of 0.7 per cent. As the economic environment in the Region has been getting better progressively, the airline traffic has also continued to improve. In 2010 the Airlines of the region registered an impressive11 per cent growth while during 2011 the growth was about 7.5 per cent.
Tonne-Kms performed
Real GDP

- 6 -
3.2.3 Economic trends and prospects 3.2.3.1 Over the 2001-2011 period, the aggregate Latin American and Caribbean economies grew at an average annual rate of 3.7 per cent in real terms, whereas GDP per capita grew 2.4 per cent, at the same rate compared to world GDP per capita growth for the same period. 3.2.3.2 In the late nineties, the economy of the region experienced a slowdown and grew only by 0.4 per cent in 1999. This was partly due to the financial market setback, which led Brazil to introduce severe austerity measures. Other countries in the region, such as Peru, Ecuador, El Salvador, Honduras and Nicaragua, suffered from the adverse effects of repeated natural disasters which resulted in constricted output, especially due to devastation in the agricultural and industrial sectors, and consequently declining overall economic performance. While the Latin American and Caribbean Region enjoyed above average growth in the 1990s, due mainly to large capital inflows, the years 2000 and 2001 posted weak growth, affected by the 2001 slowdown and the 2002 recession. In 2003, recovery began to take its root causing GDP growth to strengthen. During 2004, with the world’s economy enjoying an impressive growth of 4.9 per cent, the Latin American and Caribbean Region also registered robust growth of 5.9 per cent and that upswing was held up well until 2007. In 2008, economic growth in the region eased somewhat, showing an increase of 4.2 per cent as a result of moderating exports, softer commodity prices and severe financial conditions. In 2009 the economic conditions continued to deteriorate pushing the region into a recession with a decrease of 1.8 per cent. The year 2010 saw a robust economic recovery in the Region and accordingly the GDP grew at an impressive 5.9 per cent. The momentum has so far continued and during the year 2011 the economic growth has somewhat slowed down with a growth of 4.4 per cent, higher than the world average of 3.7 per cent in the same year. 3.2.3.3 Table 1 below shows GDP growth rates for the major economies in the CAR/SAM region and those of other regions.

- 7 -
TABLE 1
GDP GROWTH RATES FOR THE REGION’S MAJOR ECONOMIES
GDP Growth Rate (per cent)
Country/Region Estimate Forecast
2011 2012 2013 2014 2016 Average annual growth rate
2011 to 2016
2016 to 2021
2011 to 2031
Countries Argentina 9.3 4.0 4.9 5.1 4.6 4.7 4.4 4.1 Brazil 2.9 3.5 5.2 5.8 5.0 4.8 4.5 4.5 Chile 6.3 3.8 3.8 3.3 3.4 3.6 3.6 3.7 Colombia 5.9 4.9 4.1 4.3 4.7 4.5 4.7 4.2 Mexico 1.5 1.9 3.1 2.4 1.9 2.3 1.8 1.7 Peru 4.0 3.0 4.2 4.7 4.0 4.0 3.7 3.5 Venezuela 4.0 3.6 4.3 4.0 3.2 3.6 3.0 2.9 Regions Latin America and Caribbean 4.4 3.7 4.1 4.7 4.3 4.2 4.1 3.9 North America 1.8 2.2 2.4 3.3 2.9 2.7 2.5 2.5 Europe 2.0 0.2 1.4 2.1 2.5 1.7 2.3 2.0 Asia-Pacific 5.8 6.0 6.4 6.7 6.3 6.4 5.8 5.0 Middle East 4.5 3.3 3.8 4.4 3.9 4.0 3.5 3.6 Africa 2.3 4.7 5.6 5.4 5.0 5.2 4.6 4.2 Total World 3.7 3.3 4.1 4.7 4.6 4.4 3.3 3.3
Note: Regional growth rates based on all the countries in the region. Source: ICAO/ IHS Global Insight. 3.3 Yields trends and assumptions 3.3.1 The prospects for airline yields are closely related to cost developments and market conditions in the airline industry. Changes in fuel prices have significant effects on costs, hence on financial returns and airline yields. After soaring in 1999 and 2000, fuel prices declined moderately in 2001 and have risen continuously since then until July 2008 when they reached record breaking levels inflicting financial strain on the world airline industry. After August-2008, oil prices declined dramatically to reach levels below 50$/barrel by the end of 2008 and increased somewhat to average about 60 $/barrel in 2009. During 2010 the prices continued to escalate and reached about 80$/barrel on the average. The year 2011 saw the fuel prices still rising beyond the level of 2010 and achieving a level of about a 100 $/barrel. In the long run, oil prices are expected to remain somewhat on a higher level. During the next 30 year period it is expected that the prices could reach about 130 $/barrel. These various cost pressures will provide a benchmark for airline yields, with revenues needing to be sufficient to cover costs over the long term.
- 8 -
0.00
2.00
4.00
6.00
8.00
10.00
12.00
14.00
1995 1997 1999 2001 2003 2005 2007 2009 2011
U.S Cents
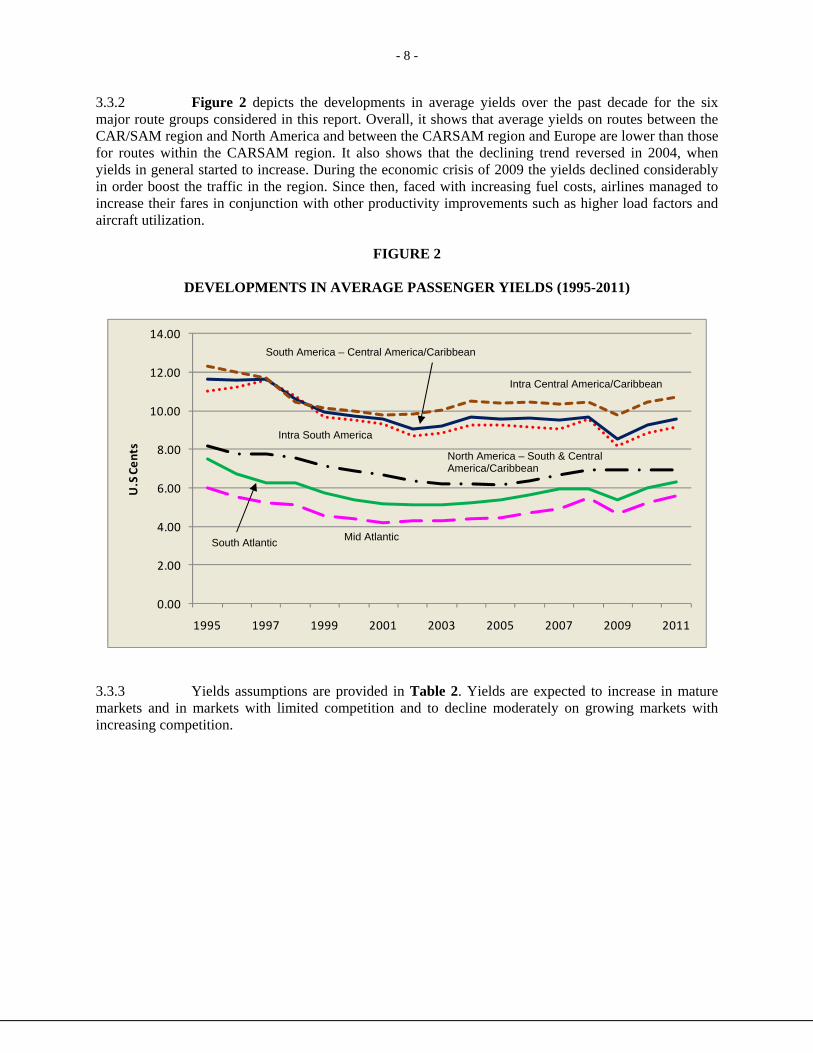
3.3.2 Figure 2 depicts the developments in average yields over the past decade for the six major route groups considered in this report. Overall, it shows that average yields on routes between the CAR/SAM region and North America and between the CARSAM region and Europe are lower than those for routes within the CARSAM region. It also shows that the declining trend reversed in 2004, when yields in general started to increase. During the economic crisis of 2009 the yields declined considerably in order boost the traffic in the region. Since then, faced with increasing fuel costs, airlines managed to increase their fares in conjunction with other productivity improvements such as higher load factors and aircraft utilization.
FIGURE 2
DEVELOPMENTS IN AVERAGE PASSENGER YIELDS (1995-2011)
3.3.3 Yields assumptions are provided in Table 2. Yields are expected to increase in mature markets and in markets with limited competition and to decline moderately on growing markets with increasing competition.
Intra Central America/Caribbean
Intra South America
South America – Central America/Caribbean
North America – South & Central America/Caribbean
South Atlantic Mid Atlantic

- 9 -
TABLE 2
YIELDS CHANGE ASSUMPTIONS (PER CENT)
Route Groups 2011-2016 2016-2021 2021-2031 (%) (%) (%) South Atlantic 0.2 1.0 0.0 Mid-Atlantic 1.8 1.5 0.0 Intra-South America -0.7 -1.0 -0.5 Between South America and Central America/Caribbean -0.5 -0.1 0.0 Intra-Central America/Caribbean 1.0 0.5 0.5 Between North America and South America and Central America/Caribbean 1.1 1.2 0.5
3.4 Analysis of Load Factors and Capacity 3.4.1 The projections for load factors and average aircraft seating capacity for the period up to 2031 have been developed using the approach described in the Methodology section. 3.4.2 Figure 3 below depicts the historical load factors for the six CARSAM routes and shows that since the year 2000, airlines have been increasing load factors as part of their efficiency improvement strategies.
FIGURE 3
HISTORICAL LOAD FACTORS (2001-2011)
50
55
60
65
70
75
80
85
90
2001 2002 2003 2004 2005 2006 2007 2008 2009 2010 2011
Per
Cen
t
3.4.3 Table 3 below shows the load factors and indicates that compared to 2001 levels, load factors are projected to be significantly higher in 2031 on all route groups with the exception of the South Atlantic and Mid-Atlantic where they are anticipated to increase only marginally.
Mid Atlantic
South Atlantic
Intra South America
North America – South & Central America/Caribbean
South America – Central America/Caribbean
Intra Central America/Caribbean

- 10 -
TABLE 3
ANALYSIS OF LOAD FACTORS (PER CENT)
Route Groups Historical Forecast 2001 2006 2011 2016 2021 2031 South Atlantic 71.0 84.3 83.1 83.1 83.6 84.0 Mid-Atlantic 79.0 80.3 83.2 83.2 83.7 84.1 Intra-South America 56.0 70.9 76.0 76.0 76.5 76.9 Between South America and Central America/Caribbean 63.0 70.0 71.0 71.0 71.6 72.2 Intra-Central America/Caribbean 60.0 63.4 71.9 71.9 72.4 72.9 Between North America and South America and Central America/Caribbean 68.0 74.4 80.0- 80.0 81.8 85.0 3.4.4 Average aircraft seats for each of the route groups for the period 2001-2011 and the projected average aircraft seats for the target years 2016, 2021 and 2031 are provided in Table 4. The average aircraft seats in 2031 are expected to vary from a low of 103 seats for the Intra Central America/Caribbean route group to a high of 289 seats for the Mid-Atlantic route group.
TABLE 4
ANALYSIS OF CAPACITY (AVERAGE AIRCRAFT SEATS) Route Groups Historical Forecast
2001 2006 2011 2016 2021 2031 South Atlantic 278 277 272 277 277 277 Mid-Atlantic 301 300 299 289 289 289 Intra-South America 160 159 160 158 159 160 Between South America and Central America/Caribbean 163 159 161 143 144 145 Intra-Central America/Caribbean 91 93 94 102 102 103 Between North America and South America and Central America/Caribbean 175 174 170 159 160 160

- 11 -
4 FORECASTS OF PASSENGER TRAFFIC AND AIRCRAFT MOVEMENTS FOR MAJOR ROUTE GROUPS TO, FROM AND WITHIN THE LATIN AMERICAN AND CARIBBEAN REGION
4.1 South Atlantic
4.1.1 Table 5a) depicts the number of passengers for the South Atlantic route for selected periods from 2001 to 2011 and projections for traffic from 2011 to 2031. Passenger traffic grew at an average annual rate of 7.4 per cent, from some 4.3 million passengers in 2001 to about 8.9 million passengers in 2011. 4.1.2 For the period 2011-2031, passenger traffic is expected to grow at an average annual growth rate of 4.9 per cent, reaching approximately 23.4 million passengers in the year 2031.
TABLE 5a)
Year
Passengers (Million)
Load Factor
Average Seats
Historical 2001 4.34 75.0 278 2006 6.79 84.3 284 2011 8.89 83.1 277 Forecast 2012 9.39 83.1 277 2013 9.92 83.1 277 2014 10.49 83.1 277 2015 11.13 83.1 277 2016 11.76 83.1 277 2021 14.83 85.0 278 2031 23.35 85.0 280 Average Annual Growth (Per cent) 2011-2016 5.7 0.0 0.0 2016-2021 4.7 0.5 0.1 2021-2031 4.6 0.0 0.1 2011-2031 4.9 0.1 0.1
4.1.3 The aircraft movements for the period 2011-2031 are projected to grow at an average annual growth rate of 4.8 per cent, reaching over 97 000 movements in the year 2031, as illustrated in Table 5b).
TABLE 5b)
Year Aircraft Movements Historic 2011* 38493*
Forecast 2012 40622
2013 42940 2014 45390 2015 48155 2016 50898 2021 62573 2031 97851
Average Annual Growth (Per cent) 2011-2016 5.7
2016-2021 4.2 2021-2031 4.6 2011-2031 4.8
- 12 -
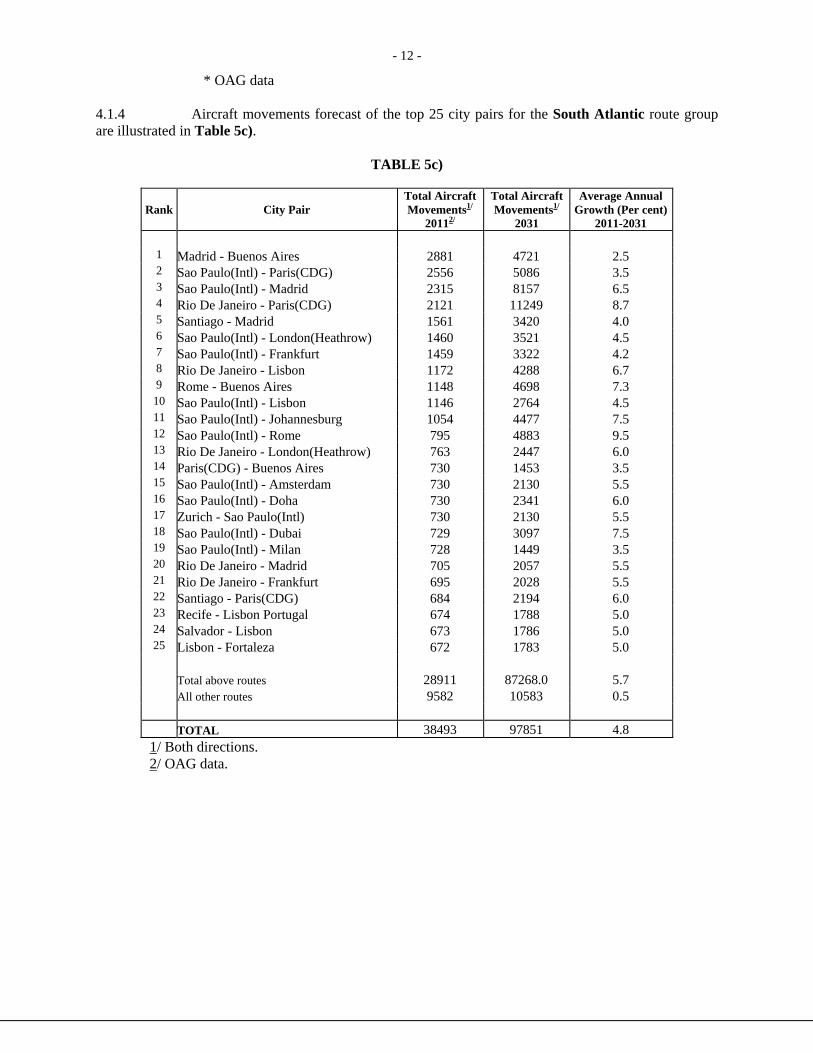
* OAG data 4.1.4 Aircraft movements forecast of the top 25 city pairs for the South Atlantic route group are illustrated in Table 5c).
TABLE 5c)
Rank
City Pair
Total Aircraft Movements1/
20112/
Total Aircraft Movements1/
2031
Average Annual Growth (Per cent)
2011-2031
1 Madrid - Buenos Aires 2881 4721 2.5 2 Sao Paulo(Intl) - Paris(CDG) 2556 5086 3.5 3 Sao Paulo(Intl) - Madrid 2315 8157 6.5 4 Rio De Janeiro - Paris(CDG) 2121 11249 8.7 5 Santiago - Madrid 1561 3420 4.0 6 Sao Paulo(Intl) - London(Heathrow) 1460 3521 4.5 7 Sao Paulo(Intl) - Frankfurt 1459 3322 4.2 8 Rio De Janeiro - Lisbon 1172 4288 6.7 9 Rome - Buenos Aires 1148 4698 7.3 10 Sao Paulo(Intl) - Lisbon 1146 2764 4.5 11 Sao Paulo(Intl) - Johannesburg 1054 4477 7.5 12 Sao Paulo(Intl) - Rome 795 4883 9.5 13 Rio De Janeiro - London(Heathrow) 763 2447 6.0 14 Paris(CDG) - Buenos Aires 730 1453 3.5 15 Sao Paulo(Intl) - Amsterdam 730 2130 5.5 16 Sao Paulo(Intl) - Doha 730 2341 6.0 17 Zurich - Sao Paulo(Intl) 730 2130 5.5 18 Sao Paulo(Intl) - Dubai 729 3097 7.5 19 Sao Paulo(Intl) - Milan 728 1449 3.5 20 Rio De Janeiro - Madrid 705 2057 5.5 21 Rio De Janeiro - Frankfurt 695 2028 5.5 22 Santiago - Paris(CDG) 684 2194 6.0 23 Recife - Lisbon Portugal 674 1788 5.0 24 Salvador - Lisbon 673 1786 5.0 25 Lisbon - Fortaleza 672 1783 5.0 Total above routes 28911 87268.0 5.7
All other routes 9582 10583 0.5 TOTAL 38493 97851 4.8
1/ Both directions. 2/ OAG data.

- 13 -
4.2 Mid-Atlantic 4.2.1 Table 6a) depicts the number of passengers for the Mid Atlantic route for selected periods from 2001 to 2011 and projections for traffic up to 2031. Mid-Atlantic traffic grew from 6.2 million passengers in 2001 to slightly over 9 million passengers in 2011, which is an average annual growth rate of 3.9 per cent. 4.2.2 For the period 2011-2031, passenger traffic is forecast to grow at an average annual growth rate of 5.5 per cent, reaching approximately 26.8 million passengers in the year 2031.
TABLE 6a)
Year Passengers (Million)
Load Factor
Average Seats
Historical 2001 6.19 79.0 301 2006 7.72 80.3 296 2011 9.10 83.2 289 Forecast 2012 9.67 83.2 289 2013 10.28 83.2 289 2014 10.93 83.2 289 2015 11.61 83.2 289 2016 12.29 83.2 289 2021 15.71 85.0 289 2031 26.79 85.0 290 Average Annual Growth (Per cent) 2011-2016 6.2 0.0 0.0 2016-2021 5.0 0.4 0.0 2021-2031 5.5 0.0 0.0 2011-2031 5.5 0.1 0.0
4.2.3 The number of aircraft movements for the period 2011-2031 are projected to increase at an average annual growth rate of 5.4 per cent, reaching about 174 000 movements in the year 2031, as illustrated in Table 6b).
TABLE 6b)
Year Aircraft Movements Historic 2011* 60491*
Forecast
2012 64286 2013 68319 2014 72606 2015 77161 2016 81699 2021 102162 2031 173802
Average Annual Growth (Per cent) 2011-2016 6.2
2016-2021 4.6 2021-2031 5.5 2011-2031 5.4
* OAG data.
- 14 -
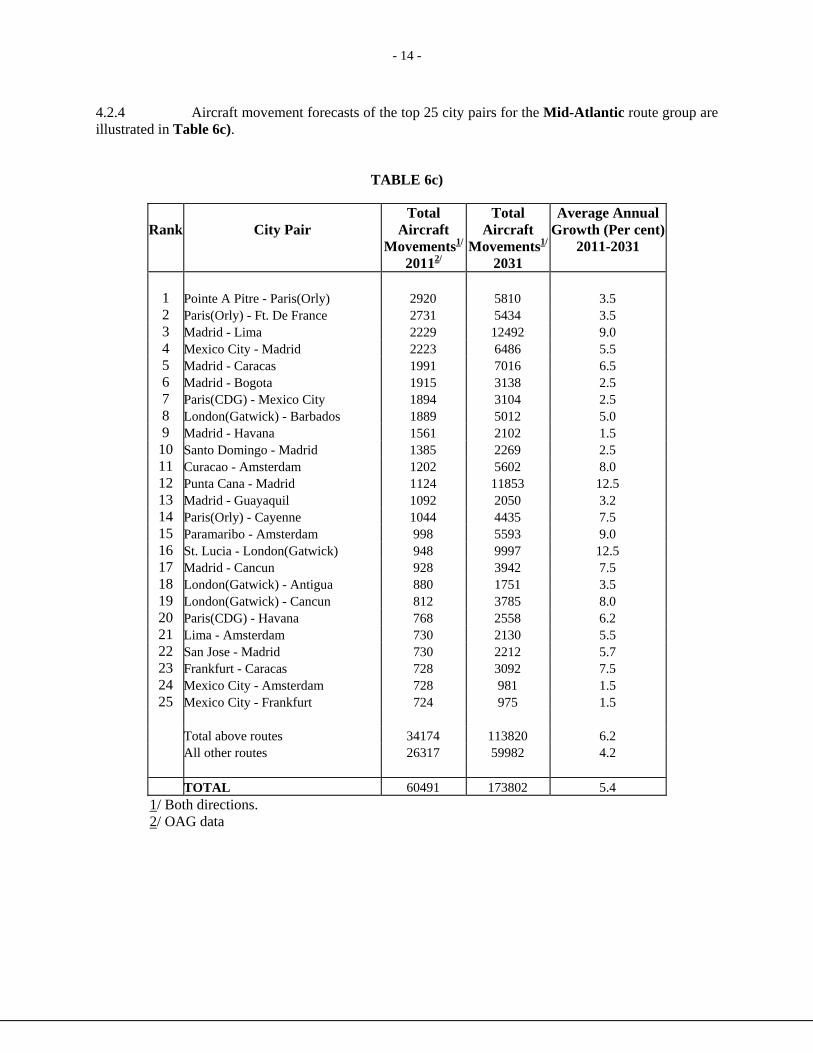
4.2.4 Aircraft movement forecasts of the top 25 city pairs for the Mid-Atlantic route group are illustrated in Table 6c).
TABLE 6c)
Rank
City Pair
Total Aircraft
Movements1/
20112/
Total Aircraft
Movements1/
2031
Average Annual Growth (Per cent)
2011-2031
1 Pointe A Pitre - Paris(Orly) 2920 5810 3.5 2 Paris(Orly) - Ft. De France 2731 5434 3.5 3 Madrid - Lima 2229 12492 9.0 4 Mexico City - Madrid 2223 6486 5.5 5 Madrid - Caracas 1991 7016 6.5 6 Madrid - Bogota 1915 3138 2.5 7 Paris(CDG) - Mexico City 1894 3104 2.5 8 London(Gatwick) - Barbados 1889 5012 5.0 9 Madrid - Havana 1561 2102 1.5
10 Santo Domingo - Madrid 1385 2269 2.5 11 Curacao - Amsterdam 1202 5602 8.0 12 Punta Cana - Madrid 1124 11853 12.5 13 Madrid - Guayaquil 1092 2050 3.2 14 Paris(Orly) - Cayenne 1044 4435 7.5 15 Paramaribo - Amsterdam 998 5593 9.0 16 St. Lucia - London(Gatwick) 948 9997 12.5 17 Madrid - Cancun 928 3942 7.5 18 London(Gatwick) - Antigua 880 1751 3.5 19 London(Gatwick) - Cancun 812 3785 8.0 20 Paris(CDG) - Havana 768 2558 6.2 21 Lima - Amsterdam 730 2130 5.5 22 San Jose - Madrid 730 2212 5.7 23 Frankfurt - Caracas 728 3092 7.5 24 Mexico City - Amsterdam 728 981 1.5 25 Mexico City - Frankfurt 724 975 1.5
Total above routes 34174 113820 6.2 All other routes 26317 59982 4.2 TOTAL 60491 173802 5.4
1/ Both directions. 2/ OAG data

- 15 -
4.3 Intra-South America 4.3.1 Table 7a) depicts the total number of international passengers between countries in South America for selected periods between 2001 and 2011 and projections for traffic up to 2031. The passenger traffic within South America increased from some 6 million in 2001 to approximately 20 million passengers in 2011, which reflects an average annual growth rate of 13.6 per cent. 4.3.2 For the period 2011-2031, passenger traffic is forecast to grow at an average annual rate of 8 percent, reaching over 93 million passengers by the year 2031.
TABLE 7a)
Year Passengers
(Million) Load
Factor Average
Seats Historical 2001 5.59 55.9 160 2006 10.81 70.9 166 2011 19.99 76.0 158 Forecast 2012 21.93 76.0 158 2013 24.06 76.0 158 2014 26.39 76.0 158 2015 28.74 76.0 158 2016 31.17 76.0 158 2021 45.11 78.2 162 2031 93.31 80.0 170 Average Annual Growth (Per cent) 2011-2016 9.3 0.0 0.0 2016-2021 7.7 0.6 0.5 2021-2031 7.5 0.2 0.5 2011-2031 8.0 0.3 0.4
4.3.3 The aircraft movement forecasts for the same period are projected to increase at an average annual growth rate of 7.4 per cent, reaching around 615 000 in the year 2031, as illustrated in Table 7b).
TABLE 7b)
Year Aircraft Movements Historic 2011* 147989*
Forecast
2012 162330 2013 178060 2014 195314 2015 212701 2016 230740 2021 317827 2031 614952
Average Annual Growth 2011-2016 9.3
(Per cent) 2016-2021 6.6 2021-2031 6.8 2011-2031 7.4
* OAG data.

- 16 -
4.3.4 Aircraft movement forecasts of the top 25 city pairs for the Intra-South America route group are illustrated in Table 7c).
TABLE 7c)
Rank
City Pair
Total Aircraft
Movements1/
20112/
Total Aircraft
Movements1/ 2031
Average Annual Growth(Per
cent) 2011-2031
1 Sao Paulo(Intl) -Buenos Aires(Pistarini) 7929 12993 2.5 2 Montevideo - Buenos Aires(Newbery) 7906 22209 5.3 3 Santiago - Buenos Aires(Pistarini) 7787 12760 2.5 4 Sao Paulo(Intl) - Buenos Aires(Newbery) 7312 23451 6.0 5 Quito -Bogota 6430 21414 6.2 6 Santiago-Lima 6426 27297 7.5 7 Punta Del Este-Buenos Aires(Newbery) 4670 21767 8.0 8 Lima -Buenos Aires(Pistarini) 4646 23751 8.5 9 Sao Paulo(Intl) - Santiago 4556 10988 4.5
10 Santiago-Buenos Aires(Newbery) 4327 15247 6.5 11 Sao Paulo(Intl) - Montevideo 4274 21849 8.5 12 Caracas -Bogota 4115 6743 2.5 13 Lima -Bogota 4112 23045 9.0 14 Santiago-Montevideo 3339 20507 9.5 15 Rio De Janeiro-Buenos Aires(Pistarini) 3318 8804 5.0 16 Sao Paulo(Intl) -Bogota 3041 15546 8.5 17 Quito -Lima 2993 11582 7.0 18 Rio De Janeiro(Intl) -Buenos Aires(Newbery) 2902 10226 6.5 19 Sao Paulo(Intl) -Lima 2857 18199 9.7 20 Santiago-Mendoza 2596 11027 7.5 21 Porto Alegre -Montevideo 2076 8819 7.5 22 Guayaquil -Bogota 1870 9213 8.3 23 Lima -Guayaquil 1823 7054 7.0 24 Lima -Caracas 1731 2836 2.5 25 Montevideo -Buenos Aires(Pistarini) 1642 2440 2.0
Total above routes 104678 369764 6.5 All other routes 43311 245188 9.1 TOTAL 147989 614952 7.4
1/ Both directions. 2/ OAG data.
- 17 -
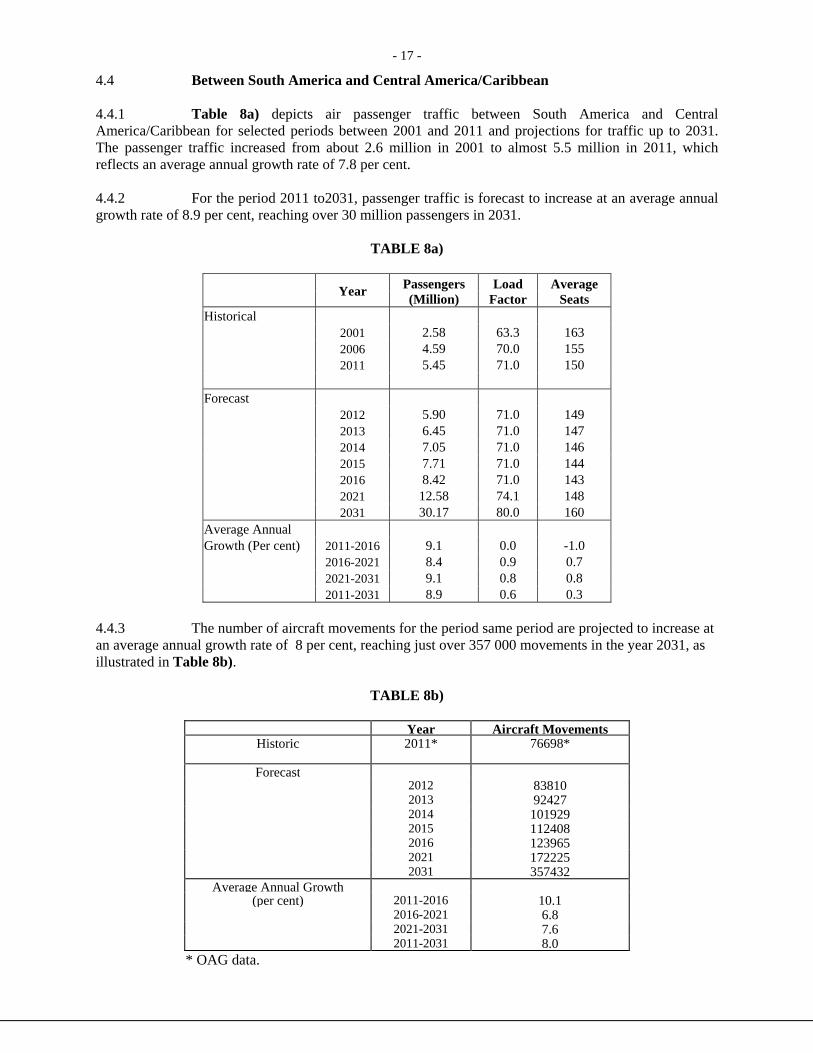
4.4 Between South America and Central America/Caribbean 4.4.1 Table 8a) depicts air passenger traffic between South America and Central America/Caribbean for selected periods between 2001 and 2011 and projections for traffic up to 2031. The passenger traffic increased from about 2.6 million in 2001 to almost 5.5 million in 2011, which reflects an average annual growth rate of 7.8 per cent.
4.4.2 For the period 2011 to2031, passenger traffic is forecast to increase at an average annual growth rate of 8.9 per cent, reaching over 30 million passengers in 2031.
TABLE 8a)
Year Passengers
(Million) Load
Factor Average
Seats Historical 2001 2.58 63.3 163 2006 4.59 70.0 155 2011 5.45 71.0 150 Forecast 2012 5.90 71.0 149 2013 6.45 71.0 147 2014 7.05 71.0 146 2015 7.71 71.0 144 2016 8.42 71.0 143 2021 12.58 74.1 148 2031 30.17 80.0 160 Average Annual Growth (Per cent) 2011-2016 9.1 0.0 -1.0 2016-2021 8.4 0.9 0.7 2021-2031 9.1 0.8 0.8 2011-2031 8.9 0.6 0.3
4.4.3 The number of aircraft movements for the period same period are projected to increase at an average annual growth rate of 8 per cent, reaching just over 357 000 movements in the year 2031, as illustrated in Table 8b).
TABLE 8b)
Year Aircraft Movements Historic 2011* 76698*
Forecast
2012 83810 2013 92427 2014 101929 2015 112408 2016 123965 2021 172225 2031 357432
Average Annual Growth(per cent) 2011-2016 10.1
2016-2021 6.8 2021-2031 7.6 2011-2031 8.0
* OAG data.

- 18 -
4.4.4 Aircraft movement forecasts of the top 25 city pairs for the route group between South America and Central America/Caribbean are provided in Table 8c).
TABLE 8c)
Rank
City Pair
Total Aircraft
Movements1/
20112/
Total AircraftMovements1/
2031
Average Annual Growth (Per cent)
2011-2031
1 Panama City - Bogota 5918 36346 9.5 2 Mexico City - Bogota 3727 25073 10.0 3 Pt. of Spain - Georgetown 3285 8075 4.6 4 Panama City - Medellin 3156 21232 10.0 5 Panama City - Lima 2954 18142 9.5 6 Panama City - Caracas 2916 15753 8.8 7 Panama City - Cali 2198 13499 9.5 8 Las Piedras - Aruba 2190 6152 5.3 9 Sao Paulo(Intl) - Panama City 2188 12262 9.0
10 Mexico City - Lima 2186 13426 9.5 11 Santiago - Panama City 1979 8099 7.3 12 Curacao - Caracas 1826 5328 5.5 13 Panama City - Buenos Aires(Pistarini) 1770 3804 3.9 14 Georgetown - Barbados 1663 2725 2.5 15 Quito - Panama City 1460 3454 4.4 16 Panama City - Guayaquil 1458 2958 3.6 17 Valencia - Curacao 1424 3778 5.0 18 Ft. De France - Cayenne 1398 2291 2.5 19 San Jose - Bogota 1386 5363 7.0 20 San Jose - Lima 1320 3183 4.5 21 Mexico City - Buenos Aires(Pistarini) 1263 4887 7.0 22 Panama City - Barranquilla 1216 5668 8.0 23 Panama City - Cartagena 1188 3466 5.5 24 Santiago - Mexico City 1170 2113 3.0 25 Pt. of Spain - Caracas 1136 2901 4.8
Total above routes 52375 229982 7.7 All other routes 24323 127450 8.6 TOTAL 76698 357432 8.0
1/ Both directions. 2/ OAG data.

- 19 -
4.5 Intra-Central America/Caribbean 4.5.1 Table 9a) depicts the number of air passengers within the Central America/Caribbean for selected periods between 2001 and 2011 and projections for traffic up to 2031. The passenger traffic increased from about 3.4 million in 2001 to 4.7 million in 2011, which reflects an average annual growth rate of 3.3 per cent. 4.5.2 For the period 2011-2031, passenger traffic is forecast to grow at an average annual rate of 7.8 per cent, reaching 21 million by 2031.
TABLE 9a)
Year Passengers (Million)
Load Factor
Average Seats
Historical 2001 3.37 60.4 91 2006 3.51 63.4 95 2011 4.65 71.9 101 Forecast 2012 5.10 71.9 101 2013 5.59 71.9 101 2014 6.13 71.9 101 2015 6.67 71.9 101 2016 7.17 71.9 102 2021 10.24 74.3 103 2031 21.00 79.0 105 Average Annual Growth (Per cent) 2011-2016 9.0 0.0 0.2 2016-2021 7.4 0.7 0.3 2021-2031 7.4 0.6 0.2 2011-2031 7.8 0.5 0.2
4.5.3 The aircraft movements for the period 2011-2031 are projected to increase at an average annual growth rate of 7.2 per cent, bringing total movements to 1.1 million by 2031, as illustrated in Table 9b).
Table 9b)
Year Aircraft Movements
Historic 2011 266438*
Forecast 2012 292257 2013 320577 2014 351642 2015 382159 2016 410716 2021 561586 2031 1072075
Average Annual Growth (Per cent) 2011-2016 8.8
2016-2021 6.5 2021-2031 6.7 2011-2031 7.2
* OAG data.

- 20 -
4.5.4 Aircraft movement forecasts of the top 25 city-pairs for the Intra Central America/Caribbean route group are illustrated in Table 9c).
TABLE 9c)
Rank
City Pair
Total Aircraft
Movements1/
20112/
Total Aircraft
Movements1/ 2031
Average Annual Growth (Per cent)
2011-2031
1 St. Maarten - St. Barthelemy 23097 81386 6.5 2 St. Thomas - San Juan 12261 30723 4.7 3 Pointe A Pitre - Ft. De France 11564 30683 5.0 4 Tortola - San Juan 11024 26587 4.5 5 Curacao - Aruba 10231 57339 9.0 6 St. Croix - San Juan 7935 19137 4.5 7 Curacao - Bonaire 7447 34710 8.0 8 San Jose - Panama City 5716 19398 6.3 9 Santo Domingo - San Juan 4846 10618 4.0
10 Santo Domingo - Panama City 3693 27204 10.5 11 Montserrat - Antigua 3664 7291 3.5 12 San Jose - Guatemala City 3582 21999 9.5 13 Pt. of Spain - Barbados 3548 6408 3.0 14 Panama City - Havana 3516 21594 9.5 15 Pt. of Spain - Grenada 3493 6309 3.0 16 St. Maarten - St. Eustatius 3400 6765 3.5 17 Virgin Gorda - San Juan 3285 11575 6.5 18 St. Lucia - Barbados 3240 5309 2.5 19 Panama City - Guatemala City 2939 19065 9.8 20 St. Maarten - Saba Bonaire 2865 5175 3.0 21 Tortola - St. Maarten 2849 4668 2.5 22 Mexico City - Guatemala City 2713 4900 3.0 23 St. Vincent - Barbados 2685 4849 3.0 24 San Salvador - Guatemala City 2679 7817 5.5 25 Grenada - Barbados 2560 4624 3.0
Total above routes 144832 476132 6.1 All other routes 121606 595944 8.3 TOTAL 266438 1072075 7.2
1/ Both directions. 2/ OAG data.
- 21 -
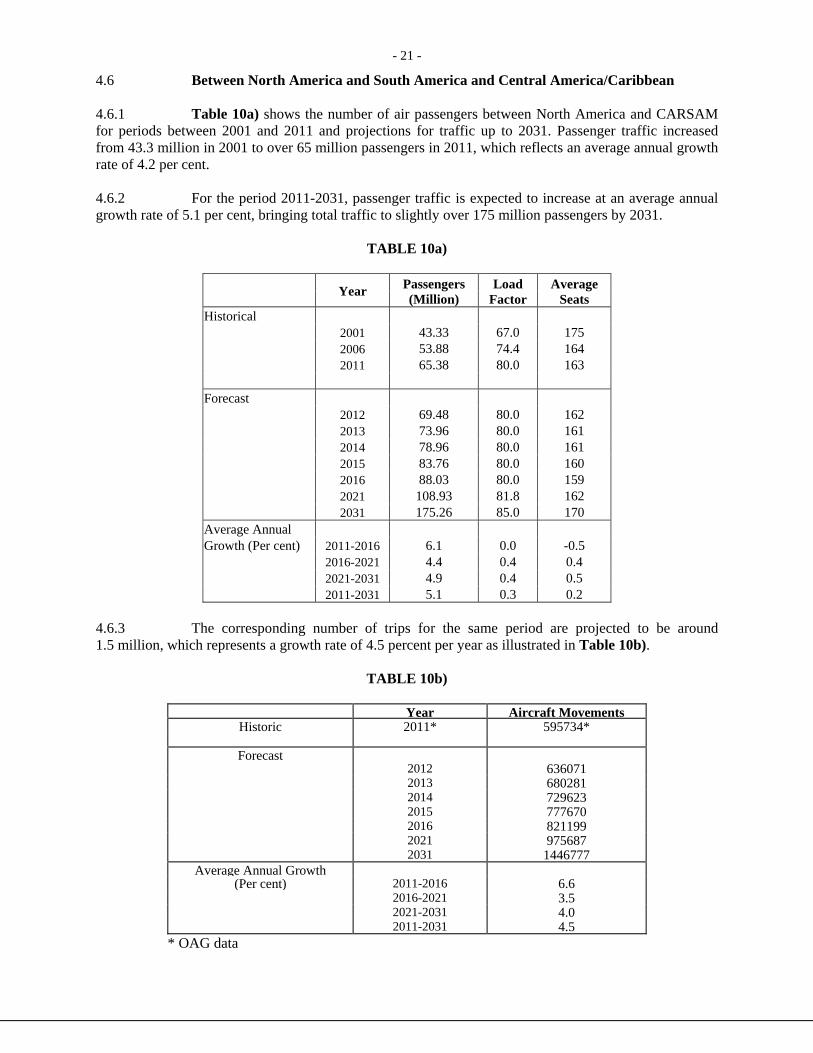
4.6 Between North America and South America and Central America/Caribbean 4.6.1 Table 10a) shows the number of air passengers between North America and CARSAM for periods between 2001 and 2011 and projections for traffic up to 2031. Passenger traffic increased from 43.3 million in 2001 to over 65 million passengers in 2011, which reflects an average annual growth rate of 4.2 per cent. 4.6.2 For the period 2011-2031, passenger traffic is expected to increase at an average annual growth rate of 5.1 per cent, bringing total traffic to slightly over 175 million passengers by 2031.
TABLE 10a)
Year Passengers
(Million) Load
Factor Average
Seats Historical 2001 43.33 67.0 175 2006 53.88 74.4 164 2011 65.38 80.0 163 Forecast 2012 69.48 80.0 162 2013 73.96 80.0 161 2014 78.96 80.0 161 2015 83.76 80.0 160 2016 88.03 80.0 159 2021 108.93 81.8 162 2031 175.26 85.0 170 Average Annual Growth (Per cent) 2011-2016 6.1 0.0 -0.5 2016-2021 4.4 0.4 0.4 2021-2031 4.9 0.4 0.5 2011-2031 5.1 0.3 0.2
4.6.3 The corresponding number of trips for the same period are projected to be around 1.5 million, which represents a growth rate of 4.5 percent per year as illustrated in Table 10b).
TABLE 10b)
Year Aircraft Movements
Historic 2011* 595734*
Forecast 2012 636071 2013 680281 2014 729623 2015 777670 2016 821199 2021 975687 2031 1446777
Average Annual Growth (Per cent) 2011-2016 6.6
2016-2021 3.5 2021-2031 4.0 2011-2031 4.5
* OAG data

- 22 -
4.6.4 Aircraft movement forecasts of the top 25 city pairs for the route group Between North America and CARSAM are illustrated in Table 10c).
TABLE 10c)
Rank
City Pair
Total Aircraft
Movements1/
20112/
Total Aircraft
Movements1/
2031
Average Annual Growth (Per cent)
2011-2031
1 Mexico City - Houston 8070 19463 4.5 2 San Juan - New York(JFK) 7755 15431 3.5 3 Nassau - Miami 7589 13707 3.0 4 Mexico City - Los Angeles 6886 11732 2.7 5 San Juan - Orlando 6829 19925 5.5 6 Monterrey - Houston 6148 12233 3.5 7 Miami - Mexico City 6064 10952 3.0 8 Los Angeles - Guadalajara 5935 9725 2.5 9 San Juan - Miami 5539 9076 2.5
10 Nassau - Ft. Lauderdale 5264 7822 2.0 11 Santiago - New York(JFK) 5264 17204 6.1 12 Santo Domingo - New York(JFK) 5083 49032 12.0 13 Miami - Caracas 5080 10108 3.5 14 San Juan - Atlanta 5040 17759 6.5 15 San Juan - Ft. Lauderdale 4737 16692 6.5 16 Panama City - Miami 4663 11246 4.5 17 Cancun - Atlanta 4580 20192 7.7 18 Miami - Cancun 4238 6944 2.5 19 Houston - Cancun 4159 9113 4.0 20 Ft. Lauderdale - Freeport 4100 6718 2.5 21 Houston - Guadalajara 4036 11776 5.5 22 Mexico City - Chicago 3826 6269 2.5 23 Sao Paulo - Miami 3777 6822 3.0 24 Pt. Au Prince - Miami 3712 8952 4.5 25 Mexico City - Dallas/Ft. Worth 3706 6073 2.5
Total above routes 132080 334967 4.8 All other routes 463654 1111810 4.5 TOTAL 595734 1446777 4.5
1/ Both directions. 2/ OAG data.

- 23 -
Average Annual Growth (%)
Majour Route Groups 2011 2012 2013 2014 2016 2021 2031 2011- 2016- 2021- 2011-
2016 2021 2031 2031
South Atlantic 8.89 9.39 9.92 10.49 11.76 14.83 23.35 5.7 4.7 4.6 4.9
Mid Atlantic 9.10 9.67 10.28 10.93 12.29 15.71 26.79 6.2 5.0 5.5 5.5
Intra-South America 19.99 21.93 24.06 26.39 31.17 45.11 93.31 9.3 7.7 7.5 8.0
Between South America and
Central America/ Caribbean 5.45 5.90 6.45 7.05 8.42 12.58 30.17 9.1 8.4 9.1 8.9
Intra-Central America/Caribbean 4.65 5.10 5.59 6.13 7.17 10.24 21.00 9.0 7.4 7.4 7.8
Between North America and South America
/Central America/Caribbean 65.38 69.48 73.96 78.96 88.03 108.93 175.26 6.1 4.4 4.9 5.1
TOTAL 113.47 121.48 130.27 139.94 158.85 207.39 369.88 7.0 5.5 6.0 6.1
4.7 Summary of Major Route Group Forecasts 4.7.1 Passenger Forecasts 4.7.1.1 Table 11 is a summary of the passenger traffic forecasts for the six route groups to, from and within the CAR/SAM Region for the period 2011 to 2016 and target years 2021 and 2031.
TABLE 11
PASSENGER TRAFFIC FORECASTS, IN MILLIONS, 2011-2031
4.7.1.2 The economy has recovered from the declines registered in 2009, nevertheless, the growth is projected to be somewhat slower, therefore the air passenger traffic forecasts, on the routes associated with North America and Europe are somewhat lower. The rest of the route groups in the Region are projected to grow faster due mainly to better economic performance expected in the future. 4.7.1.3 Overall passenger traffic to, from and within the region is projected to grow at an average annual rate of 6.1 per cent. It is anticipated that the average annual growth rates for the route groups will fall between 4.9 percent (South Atlantic) and 8.9 per cent (Between South America and Central America / Caribbean).

- 24 -
Average Annual Growth (%)
Majour Route Groups 2011 2012 2013 2014 2016 2021 2031 2011- 2016- 2021- 2011-
2016 2021 2031 2031
South Atlantic 38.49 40.62 42.94 45.39 50.90 62.57 97.85 5.7 4.2 4.6 4.8
Mid Atlantic 60.49 64.29 68.32 72.61 81.70 102.16 173.80 6.2 4.6 5.5 5.4
Intra-South America 147.99 162.33 178.06 195.31 230.74 317.83 614.95 9.3 6.6 6.8 7.4
Between South America and
Central America/ Caribbean 76.70 83.81 92.43 101.93 123.96 172.22 357.43 10.1 6.8 7.6 8.0
Intra-Central America/Caribbean 266.44 292.26 320.58 351.64 410.72 561.59 1072.08 9.0 6.5 6.7 7.2
Between North America and
South America/Central America/Caribbean 595.73 636.07 680.28 729.62 821.20 975.69 1446.78 6.6 3.5 4.0 4.5
TOTAL 1185.84 1279.38 1382.60 1496.50 1719.22 2192.06 3762.89 7.7 5.0 5.6 5.9
4.7.2 Aircraft movements forecast 4.7.2.1 Table 12 depicts the aircraft movements for the major route groups to, from and within the CAR/SAM Region for the period 2010 to 2014, and the target years 2019 and 2030.
TABLE 12
AIRCRAFT MOVEMENTS FORECAST,IN THOUSANDS, 2011-2031
* OAG data 4.7.2.2 The overall number of movements is forecast to increase from about 1.2 million in 2011 to slightly over 3.7 million in 2031, which reflects an average annual growth rate of 5.9 per cent. The average growth rates for the route groups will range from 4.5 per cent (between North America and CARSAM route) to 8 per cent (Between South America and Central America/Caribbean).
— — — — — —

- 25 -
APPENDIX A
PEAK-PERIOD ANALYSIS FOR CENTRAL AMERICAN FIR
The Group also carried out a detailed analysis of the FIR traffic data for the year 2011, provided by COCESNA. In order to define the peak-period parameters, due to a considerably large dataset pertaining to the FIR, certain amount of queries were performed using Microsoft Access to in order to generate the various output results highlighting different peaks. The results of the analyses are presented below in this appendix in the forms of graphs and tables. The FIR traffic data provided by COCESNA includes the following fields : Name Type Size (field) Date_Flight Date/Time 8 Time_entry Date/Time 8 Flight_Number Text 10 Registration Text 15 Type Text 10 Distance Integer long 4 Time_Exit Date/Time 8 Point_entry Text 5 Point_exit Text 5 Origin Text 5 Destination Text 5 Flight_level Integer long 4

- 26 -
The following output results were extracted, categorized by COCESNA control centre: 1. Monthly traffic 2. Daily traffic analysis
2.1. Daily profile of traffic 2.2. Maximum, minimum and average daily traffic 2.3. Daily traffic ranking 2.4. Daily traffic probability distribution
3. Hourly traffic analysis 3.1. Hourly Traffic (whole year) 3.2. Traffic profile by specified hour
3.3. Maximum, minimum and average hourly traffic 3.4. Traffic peaking by specified hour
4. Annual traffic analysis 4.1. Aircraft movements by aircraft type 4.2. Aircraft movements by flight level 4.3. Aircraft movements by entry point 4.4. Aircraft movements by exit point 4.5. Aircraft movements by pair of entry point - exit point
4.6. Aircraft movements by origin and destination 4.7 Detailed analysis of aircraft movement traffic (through data field combinations)
5. Traffic density analysis 5.1. Time interval density 5.2. Point in time density

- 27 -
0
100
200
300
400
500
600
Daily profile ‐ Aircraft movements
1. Monthly traffic The following table illustrates the monthly traffic for the Central American FIR for the year 2011: Central American FIR
2011
Month MovementsJanuary 12,904
February 11,387
March 12,822
April 12,264
May 12,073
June 11,990
July 13,187
August 12,771
September 11,031
October 11,370
November 11,850
December 13,786
2. Daily traffic analysis 2.1. Daily profile of traffic
An illustration of the daily profile of traffic by control centre for a one-year period is shown in order to help identify any seasonality pattern in the annual traffic. The figure below shows the daily profile for Central American FIR:
0
2,000
4,000
6,000
8,000
10,000
12,000
14,000
16,000
Monthly Traffic
- 28 -
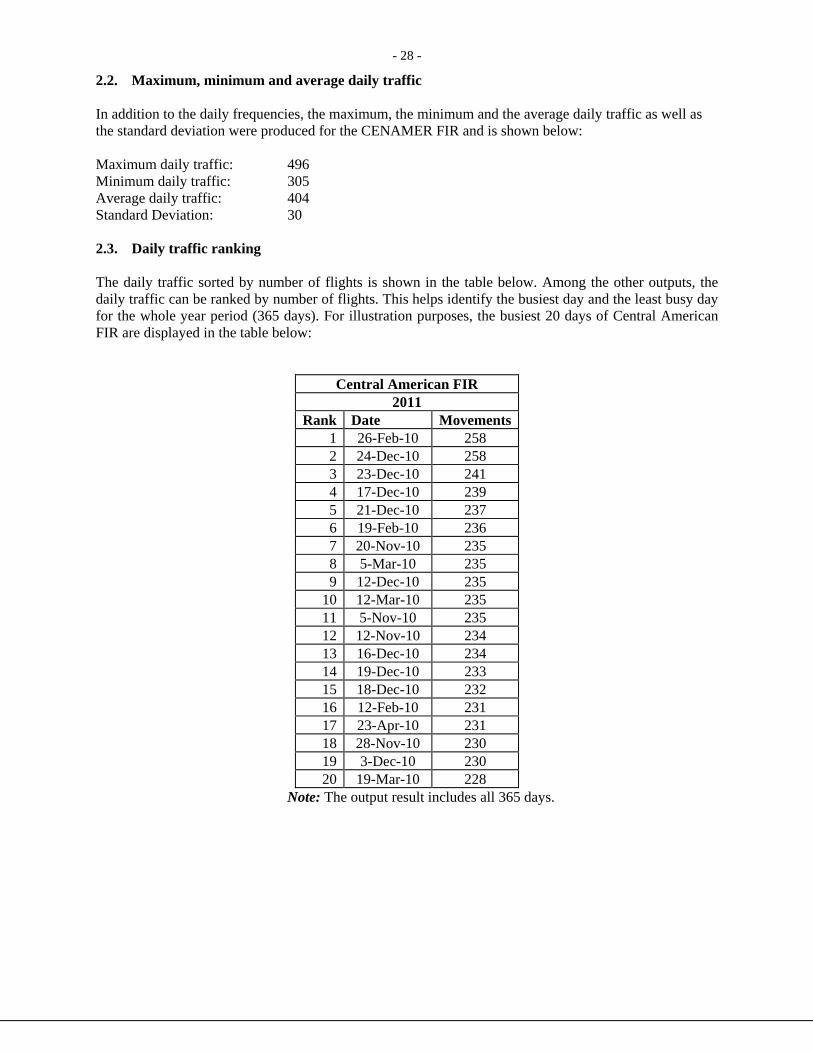
2.2. Maximum, minimum and average daily traffic In addition to the daily frequencies, the maximum, the minimum and the average daily traffic as well as the standard deviation were produced for the CENAMER FIR and is shown below: Maximum daily traffic: 496 Minimum daily traffic: 305 Average daily traffic: 404 Standard Deviation: 30 2.3. Daily traffic ranking The daily traffic sorted by number of flights is shown in the table below. Among the other outputs, the daily traffic can be ranked by number of flights. This helps identify the busiest day and the least busy day for the whole year period (365 days). For illustration purposes, the busiest 20 days of Central American FIR are displayed in the table below:
Central American FIR 2011
Rank Date Movements1 26-Feb-10 258 2 24-Dec-10 258 3 23-Dec-10 241 4 17-Dec-10 239 5 21-Dec-10 237 6 19-Feb-10 236 7 20-Nov-10 235 8 5-Mar-10 235 9 12-Dec-10 235
10 12-Mar-10 235 11 5-Nov-10 235 12 12-Nov-10 234 13 16-Dec-10 234 14 19-Dec-10 233 15 18-Dec-10 232 16 12-Feb-10 231 17 23-Apr-10 231 18 28-Nov-10 230 19 3-Dec-10 230 20 19-Mar-10 228
Note: The output result includes all 365 days.
- 29 -
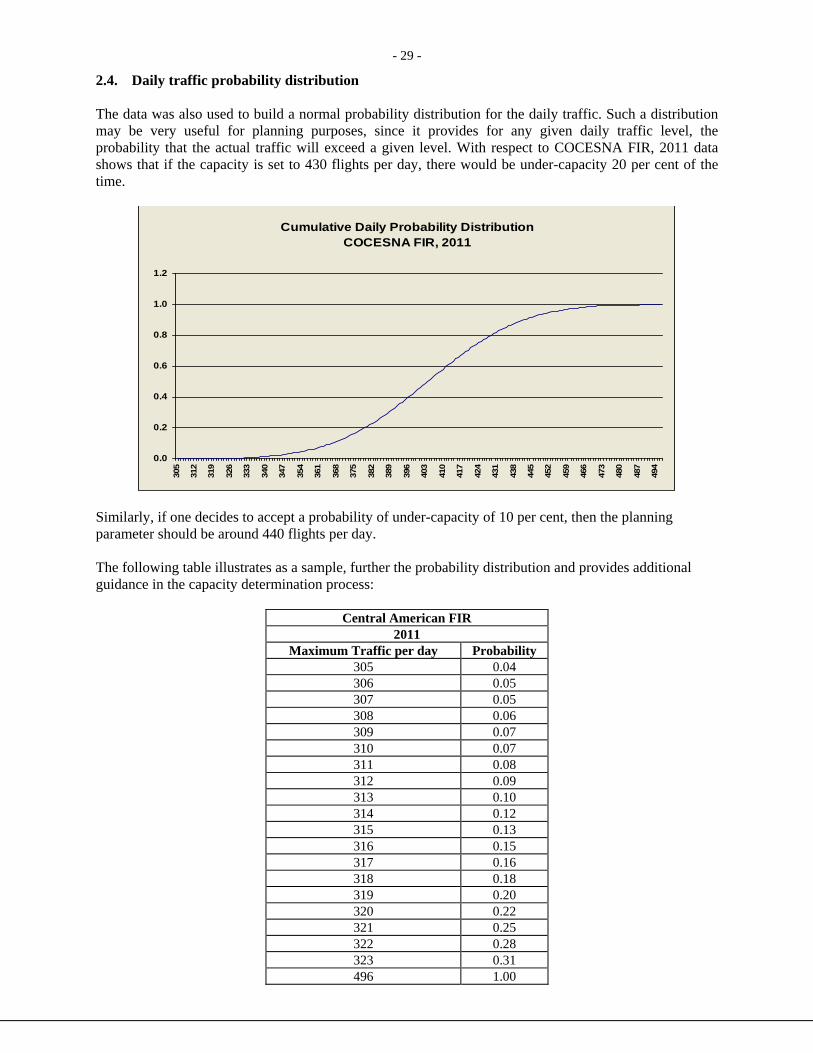
2.4. Daily traffic probability distribution The data was also used to build a normal probability distribution for the daily traffic. Such a distribution may be very useful for planning purposes, since it provides for any given daily traffic level, the probability that the actual traffic will exceed a given level. With respect to COCESNA FIR, 2011 data shows that if the capacity is set to 430 flights per day, there would be under-capacity 20 per cent of the time.
Cumulative Daily Probability DistributionCOCESNA FIR, 2011
0.0
0.2
0.4
0.6
0.8
1.0
1.2
305
312
319
326
333
340
347
354
361
368
375
382
389
396
403
410
417
424
431
438
445
452
459
466
473
480
487
494
Similarly, if one decides to accept a probability of under-capacity of 10 per cent, then the planning parameter should be around 440 flights per day. The following table illustrates as a sample, further the probability distribution and provides additional guidance in the capacity determination process:
Central American FIR 2011
Maximum Traffic per day Probability 305 0.04 306 0.05 307 0.05 308 0.06 309 0.07 310 0.07 311 0.08 312 0.09 313 0.10 314 0.12 315 0.13 316 0.15 317 0.16 318 0.18 319 0.20 320 0.22 321 0.25 322 0.28 323 0.31 496 1.00

- 30 -
3. Hourly traffic analysis 3.1. Hourly Traffic (whole year) Traffic per hour over the whole year is calculated and sorted by amount of traffic which occurs on hourly basis. This helps to determine the hourly peaks and also is useful for planning the flight schedules. (the maximum size of the sorted list is 24*365= 8760 rows). The following table shows the top 20 hours in terms of traffic for the whole year:
Central American FIR 2011
Rank Date Hour Movements 1 30-Dec-11 17 49 2 23-Dec-11 21 48 3 19-Dec-11 21 48 4 17-Dec-11 17 48 5 11-Mar-11 17 46 6 6-Jul-11 18 45 7 27-Nov-11 17 45 8 29-Dec-11 17 44 9 28-Dec-11 21 44
10 26-Nov-11 17 44 11 26-Dec-11 21 43 12 28-Dec-11 17 43 13 7-Aug-11 18 43 14 5-Feb-11 21 43 15 8-Dec-11 17 42 16 18-Dec-11 17 42 17 2-Jan-11 17 42 18 17-Mar-11 16 42 19 20-Dec-11 17 42 20 31-Dec-11 21 42
3.2. Traffic profile by specified hour The hourly traffic profiles focuses on the period of time when the traffic flow is maximum on yearly basis. The graph below shows the number of flights by hour for 2011. It should be noted that most of the traffic occurs between 1600 and 1900 hours and between 2100 and 2200 hours. In terms of flight handling, more than 10,000 flights were managed for every hour specified in the hourly profile. The hour where there were most flights was between 1600 and 1700h with 10 953 flights: Hourly profiles are very useful for the staffing and management of the controlled airspace.

- 31 -
0
5
10
15
20
25
30
35
40
45
Traffic between 16h and 17h
0
2000
4000
6000
8000
10000
12000
00h0
0‐00h59
01h0
0‐01h59
02h0
0‐02h59
03h0
0‐03h59
04h0
0‐04h59
05h0
0‐05h59
06h0
0‐06h59
07h0
0‐07h59
08h0
0‐08h59
09h0
0‐09h59
10h0
0‐10h59
11h0
0‐11h59
12h0
0‐12h59
13h0
0‐13h59
14h0
0‐14h59
15h0
0‐15h59
16h0
0‐16h59
17h0
0‐17h59
18h0
0‐18h59
19h0
0‐19h59
20h0
0‐20h59
21h0
0‐21h59
22h0
0‐22h59
23h0
0‐23h59
Traffic per hour
The same chart can be plotted for any hour of the day and by aircraft type. 3.3. Maximum, minimum and average for a specified hour Beyond, the graphical display, the minimum , maximum and the average traffic between 16h00 and17h00 for the Central American FIR, as well as the standard deviation, are shown below: Maximum daily traffic: 42 Minimum daily traffic: 16 Average daily traffic: 30 Standard Deviation: 5 3.4. Traffic peaking by specified hour The graph below indicates that the traffic pattern between 1600 and 1700 hours on yearly basis. It shows that the traffic is more dense between these hours. The following table below the graph provides more insight into traffic peaking during this slot throughout the year at 16h00 (by providing the list of the top 20 traffic days at 16h00):

- 32 -
Ranking of daily movements between 1600 and 1700h
Central American FIR 16h00 traffic 2011
Rank Date Movements1 17-Mar-11 42 2 5-May-11 41 3 9-Apr-11 41 4 14-Apr-11 41 5 25-Jul-11 40 6 16-Mar-11 40 7 19-Mar-11 40 8 5-Aug-11 40 9 13-Aug-11 40
10 3-Apr-11 40 11 28-Apr-11 40 12 17-Apr-11 40 13 3-Aug-11 39 14 7-May-11 39 15 8-Oct-11 39 16 16-Aug-11 39 17 13-Apr-11 39 18 20-Mar-11 38 19 11-Jul-11 38 20 21-Jul-11 38
Note: The full list has all 365 days. 4. Annual traffic analysis 4.1. Aircraft movements by aircraft type Using the COCESNA FIR traffic data, the following chart illustrates the aircraft movements traffic by aircraft type for the year 2011.The aircraft using the airspace with the highest number of flights was B737-800 with 28.895flights, followed by E190 with 24.345, and thereafter, B-757and A319 in between 12000 to 15.000 flights.
0
5 000
10 000
15 000
20 000
25 000
30 000
B738
E190
A320
B752
A319
B737
B763
B762
A321
B772
B764
MD83
A343
B739
H25B
CL30
E145
GLF4
B734
B753
CVLT
CRJ9
Movements By AcType

- 33 -
0
2000
4000
6000
8000
10000
12000
14000
16000
370
350
360
340
380
390
330
164
400
210
320
214
157
156
163
231
310
410
246
150
282
161
174
245
Movements by Flight Level
COCESNA FIR
4.2. Aircraft movements by flight level Using the same set of data, aircraft movements by flight level are illustrated in the figure below:
4.3. Aircraft movements by entry point FIR traffic can be aggregated by entry point and sorted by traffic volume (aircraft movements). The table below shows the top 20 entry points for Central American FIR in 2011.
Central American FIR 2011
Rank Entry Point Movements 1 SELEK 8,038 2 ISEBA 6,696 3 PENSO 6,670 4 RADON 5,826 5 CACHI 4,770 6 PABEL 4,602 7 BUFEO 4,323 8 SIGMA 4,070 9 ERBOR 3,858
10 PINOS 3,582 11 RAB 3,529 12 CTM 3,429 13 CANAS 3,279 14 TAP 3,190 15 ARENA 3,145 16 GABOS 3,014 17 NALDA 2,235 18 AVRIS 2,215 19 NAGEL 2,186 20 ASOKU 2,164
- 34 -
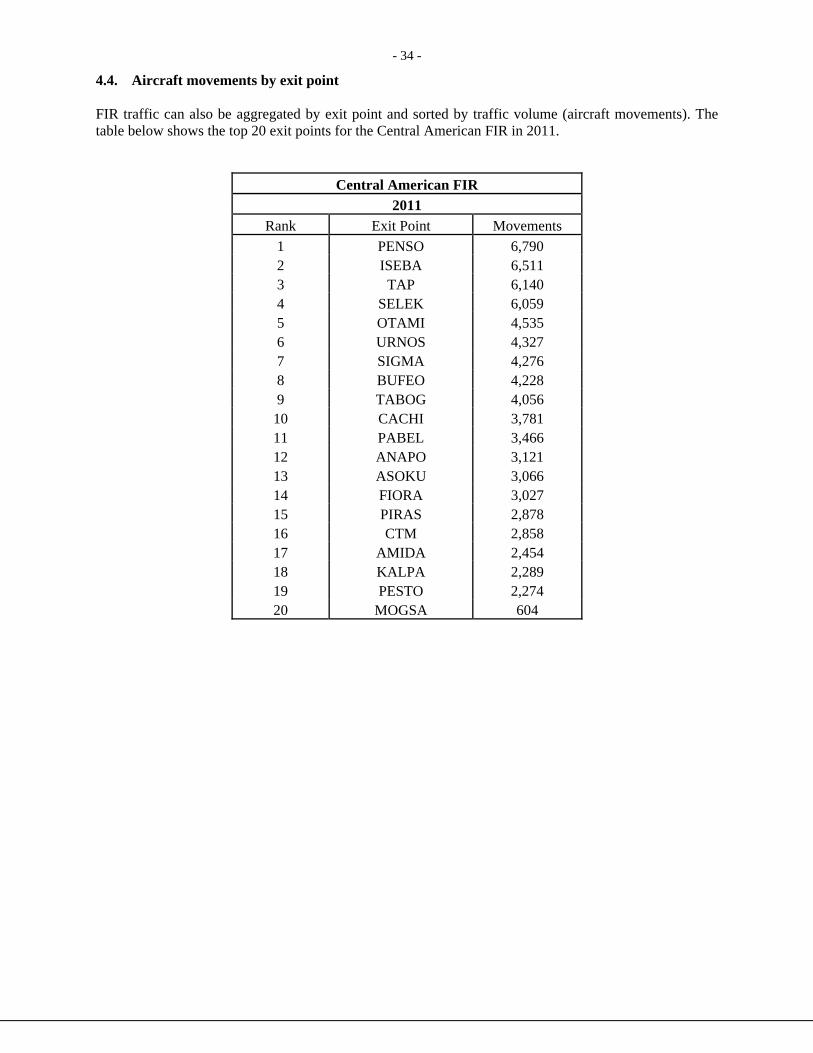
4.4. Aircraft movements by exit point FIR traffic can also be aggregated by exit point and sorted by traffic volume (aircraft movements). The table below shows the top 20 exit points for the Central American FIR in 2011.
Central American FIR
2011
Rank Exit Point Movements
1 PENSO 6,790 2 ISEBA 6,511 3 TAP 6,140 4 SELEK 6,059 5 OTAMI 4,535 6 URNOS 4,327 7 SIGMA 4,276 8 BUFEO 4,228 9 TABOG 4,056
10 CACHI 3,781 11 PABEL 3,466 12 ANAPO 3,121 13 ASOKU 3,066 14 FIORA 3,027 15 PIRAS 2,878 16 CTM 2,858 17 AMIDA 2,454 18 KALPA 2,289 19 PESTO 2,274 20 MOGSA 604

- 35 -
4.5. Aircraft movements by pair of entry point - exit point The COCESNA FIR traffic has been aggregated by pair of entry and exit points and sorted by traffic volume (aircraft movements). It determines the spent by a flight in the controlled air space and is useful in terms of route planning and congestion management.Traffic carried on the 20 routes below represents more than quarter of the total traffic (29 per cent). In these routes, it is noted that the flights spent more than an hour on the average between the following entry and exit points:
- RADON and SELEK
- SELEK and PIRAS, FIORA, RAKEL
- ISEBA and TAP
- PABEL and URNOS
- PINOS and BUFEO
The table below shows the top 20 pair of entry and exit points, for the Central American FIR in 2011.
Central American FIR
2011
Rank Entry-Exit Movements Flight time in
airspace
1 CACHI-ISEBA 4,565 0:08:03 2 ISEBA-CACHI 3,575 0:08:49 3 RADON-SELEK 3,084 1:14:27 4 SELEK-PIRAS 2,293 1:13:37 5 RADON-PESTO 2,067 0:55:58 6 SELEK-FIORA 2,067 1:19:07 7 CTM-TILOT 1,959 0:28:45 8 SELEK-RAKEL 1,898 1:01:43 9 ABFAL-SIGMA 1,819 0:54:57
10 ISEBA-TAP 1,787 1:23:43 11 RAKEL-SELEK 1,746 1:00:26 12 NALDA-COBAN 1,742 0:17:10 13 PABEL-URNOS 1,725 1:00:58 14 ERBOR-KALPA 1,668 0:08:20 15 RAB-CTM 1,649 0:32:44 16 RAB-NALDA 1,589 0:22:12 17 CANAS-OTAMI 1,491 0:52:14 18 SIGMA-ABFAL 1,479 0:54:42 19 RELTA-AVRIS 1,453 0:28:41 20 PINOS-BUFEO 1,448 1:11:47

- 36 -
4.6. Aircraft movements by origin and destination The FIR traffic can also be aggregated by pair of origin and destination airports and sorted by traffic volume (aircraft movements). The table below shows the top 10 pairs of origin-destinations, for the Central American FIR in 2011.
Central American FIR 2011
Rank Origin-Destination Movements1 MROC-MPTO 3235 2 MPTO-MROC 3192 3 MROC-KMIA 2736 4 KMIA-MROC 2464 5 KMIA-MGGT 2266 6 MGGT-KMIA 2102 7 SKBO-MMMX 2084 8 MMMXSKBO 1928 9 MHLM-KMIA 1887
10 MPTO-MGGT 1824 4.7. Detailed analysis of aircraft movement traffic (through data field combinations) An extended analysis of FIR data was performed in order to produce tables and charts combining relevant data fields such as aircraft type, flight level, pair of entry and exit points, pair of origin and destination and type of traffic (inbound, outbound, over flights, within the FIR). This type of analyses is helpful in determining the number of aircraft movements by aircraft type and by flight level to give an indication about the proportion of aircraft not flying at their optimum flight levels. It also provides knowledge of the different aircraft types using different flight levels in a given FIR for better control and management of flight levels. The figure below illustrates the traffic by aircraft type and by flight level for the COCESNA FIR
Centre: COCESNA by flight level and by type of traffic
0
1000
2000
3000
4000
5000
6000
A300
A310
A319
A320
A321
B722
B732
B733
B737
B752
B762
B763
B764
CRJ70
CV58E19
0
MD11
<> 220 240 300 310 320 330 340 350 360 370 380 390 400 410
All combinations of the data fields above can be used to produce similar charts and/or tables.

- 37 -
5. Traffic density analysis It is possible to perform a traffic density analysis either for a time interval or for a specific point in time. 5.1. Time interval density The following table lists all the flights for the annual peak hour which occurs on the 30st of January 2011 between 16h00 and 17h00 . This list includes all flights that have either entered or exited the Central American FIR during that hour or remained in the FIR for the whole hour. For this reason, the number of flights (76) is higher than the peak-hour traffic (49), which includes only the flights that have entered the FIR during the same hour.
Date
Type of
Aircraft
Entry Point
Time of Exit Point
Time of
Exit
Origin
Destination
Entry
30/12/11 E190 IMOLA 16:11 TABOG 16:19 MNMG MROC 30/12/11 A319 ALERA 16:04 TAP 16:29 MSLP MMMX 30/12/11 E190 ARENA 16:10 BERTA 16:38 MROC MHTG 30/12/11 GLF5 DANUL 16:19 MAMBI 16:44 KDAL MWCR 30/12/11 B738 RELTA 16:02 AVRIS 16:31 MSLP KDFW 30/12/11 B762 SATOS 16:08 URNOS 16:40 KMIA MSLP 30/12/11 B738 SATOS 16:45 BZE 16:51 KMIA MZBZ 30/12/11 CRJ2 ROA 16:02 ULISA 16:43 MHLC MWCR 30/12/11 E190 CACHI 16:32 ISEBA 16:40 MROC MPTO 30/12/11 E190 TALAG 16:07 PABEL 17:13 MHTG KMIA 30/12/11 B733 ROA 16:28 ULISA 17:09 MHLC MWCR 30/12/11 A319 PARRI 16:35 PAPIN 17:02 MROC SEQU 30/12/11 A319 RAB 16:29 CTM 17:01 MGGT KMIA 30/12/11 E190 CACHI 17:00 ISEBA 17:08 MROC SVMI 30/12/11 B738 PISIS 16:28 ROA 17:09 CYUL MHLC 30/12/11 A319 CACHI 16:51 ISEBA 16:59 MROC SKBO 30/12/11 B752 GABOS 17:15 TABOG 17:47 MSLP MROC 30/12/11 B738 NALDA 16:58 COBAN 17:14 KIAH MGGT 30/12/11 E190 ISEBA 17:10 CACHI 17:18 MPTO MROC 30/12/11 B737 PENSO 17:17 BZE 17:24 KIAH MZBZ 30/12/11 GLF4 MAMBI 17:05 DANUL 17:30 MWCR KADS 30/12/11 B752 PATIK 17:15 TAP 17:26 MGGT MMMX 30/12/11 B738 SELEK 16:58 RAKEL 17:58 KMIA MNMG 30/12/11 B737 TELAX 16:02 PILKO 17:11 SVMI MMMX 30/12/11 B738 CTM 17:05 TILOT 17:32 KMIA MGGT 30/12/11 E190 ANSON 16:50 LIBIS 17:36 MPTO MHTG 30/12/11 A319 RUBRA 16:55 PABEL 17:43 MHLM KMIA 30/12/11 CVLT CTM 17:17 NANDO 17:42 KMIA MGGT 30/12/11 B738 PENSO 17:23 BERTA 18:09 KIAH MNMG 30/12/11 A320 PARRI 16:39 LIXAS 17:43 MROC SPIM 30/12/11 B737 ISEBA 16:07 TAP 17:29 SKBO MMMX 30/12/11 A320 ISEBA 16:13 TAP 17:35 SKBO MMMX 30/12/11 B752 MAMBI 17:16 DANUL 17:40 MKJS CYYC 30/12/11 B738 AMIDA 17:28 KORTI 17:48 KATL MHLM 30/12/11 LJ55 SATOS 17:16 AUR 17:55 KFXE MGGT 30/12/11 E190 BUFEO 17:46 EMARI 18:11 MPTO MNMG 30/12/11 A320 CANAS 16:55 OTAMI 17:46 MROC MGGT 30/12/11 B752 MAMBI 17:21 DANUL 17:45 SBBV MMUN 30/12/11 B737 PENSO 17:15 TALAG 17:50 KIAH MHTG 30/12/11 B738 SELEK 16:34 IMOLA 17:51 KMIA MRLB 30/12/11 B738 SELEK 17:20 RAKEL 18:21 KATL MNMG 30/12/11 B738 RADON 16:51 SELEK 18:10 MROC KJFK 30/12/11 C750 DANUL 17:37 MAMBI 18:01 KSAT MWCR 30/12/11 E190 CACHI 17:47 ISEBA 17:55 MROC MPTO 30/12/11 E190 BUFEO 17:04 ANAPO 17:55 MPTO MSLP 30/12/11 B738 SIGMA 17:08 ABFAL 18:03 KIAH MPTO

- 38 -
Type of
Aircraft
Entry Point
Time of
Entry
Exit Point
Time of
Exit
Origin
Destination
30/12/11 B739 PENSO 17:00 IMOLA 18:02 KIAH MRLB 30/12/11 B738 ABFAL 17:15 SIGMA 18:10 MPTO MMUN 30/12/11 GLF4 MAMBI 17:40 DANUL 18:05 TNCM MMSD 30/12/11 E190 EMARI 17:44 BUFEO 18:12 MNMG MPTO 30/12/11 B733 TAP 17:54 DUNEL 18:14 KHOU MSLP 30/12/11 A320 SATOS 17:42 URNOS 18:14 MMUN MSLP 30/12/11 B738 SIGMA 17:23 FALLA 18:21 MMUN MPTO 30/12/11 B752 ARENA 17:34 ROMBO 18:14 MROC MHLM 30/12/11 B738 AVRIS 17:45 URNOS 18:11 KIAH MSLP 30/12/11 A320 RADON 17:07 SELEK 18:23 MROC MUHA 30/12/11 B738 PENSO 17:58 OMOSO 18:17 KIAH MHLM 30/12/11 A320 SELEK 16:58 PIRAS 18:11 KMCO MROC 30/12/11 E190 PINOS 17:13 BUFEO 18:25 MGGT MPTO 30/12/11 LJ35 ROA 17:36 PISIS 18:22 MHRO KFXE 30/12/11 A320 SELEK 17:03 FIORA 18:22 KFLL MROC 30/12/11 B752 ARENA 17:10 PENSO 18:24 MROC KDFW 30/12/11 E190 BUFEO 17:20 OTAMI 18:30 MPTO MGGT 30/12/11 B738 PENSO 17:17 ULAPO 18:22 KIAH MROC 30/12/11 B737 SELEK 17:14 IMOLA 18:33 KEWR MRLB 30/12/11 B752 SELEK 17:16 IMOLA 18:34 KATL MRLB 30/12/11 B738 ISEBA 17:13 TAP 18:38 MPTO MMMX 30/12/11 A321 PABEL 17:40 URNOS 18:40 KJFK MSLP 30/12/11 B752 PESTO 17:39 PIRAS 18:36 KATL MROC 30/12/11 C750 IMOLA 17:43 PENSO 18:46 MRLB KHOU 30/12/11 H25B PILKO 17:28 FALLA 18:48 MMPB SKCG 30/12/11 A320 PABEL 17:56 URNOS 18:57 KIAD MSLP 30/12/11 B752 SELEK 17:47 PIRAS 18:58 KMIA MROC 30/12/11 A321 CANAS 17:57 ANAPO 18:28 MROC MSLP 30/12/11 A320 LIXAS 17:40 ANAPO 19:16 SEGU MSLP 30/12/11 A332 EGODI 17:53 ASOKU 19:16 SBGR MMMX
5.2. Point in time density It is also possible to determine the FIR traffic at a any point in time. For example, the following table lists the flights present in the Central American FIR on 17 March 2011 at 16:00.
Type of Time of Time of
Date Aircraft Entry Point Entry Exit Point Exit Origin Destination
17/03/11 B752 GABOS 16:08 URPOS 16:19 MSLP MNMG
17/03/11 B737 OTAMI 16:22 OTAMI 16:22 MPTO MGGT
17/03/11 LJ35 MAMBI 16:02 DANUL 16:29 TJSJ MMCZ
17/03/11 B738 ALSAL 16:42 ALSAL 16:42 MPTO MMMX
17/03/11 B752 BUFEO 16:30 CLARA 16:39 MPTO MROC
17/03/11 MD83 ERBOR 16:19 DUNEL 16:40 KHRL MSLP
17/03/11 B738 PENSO 16:26 OMOSO 16:46 KIAH MHLM
17/03/11 B752 NALDA 16:31 COBAN 16:50 KATL MGGT
17/03/11 E190 CACHI 16:30 ISEBA 16:38 MROC MPTO
17/03/11 B753 ABPZA 16:07 SIGMA 16:57 MPTO KIAH
17/03/11 B738 PENSO 16:11 BERTA 16:59 KIAH MNMG
17/03/11 B738 AVRIS 16:31 URNOS 16:58 KIAH MSLP
17/03/11 A320 TILOT 16:31 CTM 16:57 MGGT KMIA
17/03/11 E190 CACHI 16:45 ISEBA 16:53 MROC SKRG
— — — — — —

- 39 -
APPENDIX B
. Definition of the route groups and geographical areas used in the
development of the forecasts by the CAR/SAM TFG
Route Groups 1. South Atlantic
Includes routes between, on the one hand, gateway points in the following South American States: Argentina, Brazil, Chile, Falkland Islands (Malvinas), Paraguay and Uruguay and, on the other hand, the geographical areas of Europe, Middle East and Africa. 2. Mid Atlantic
Includes routes between, on the one hand, gateway points in the geographical areas of Central America and the Caribbean and/or in the following South American States: Bolivia, Colombia (including the San Andres Islands), Ecuador, French Guiana, Guyana, Peru, Suriname and Venezuela and, on the other hand, the geographical areas of Europe, Middle East and Africa. 3. Intra-South America
4. Between South America and Central America/Caribbean
5. Intra-Central America/Caribbean 6. Between North America and South America and Central America/Caribbean
Geographical Areas North America
Bermuda, Canada, St. Pierre et Miquelon, United States including Alaska and Hawaii, but excluding Puerto Rico and the Virgin Islands.
Central America / Caribbean Anguilla, Antigua and Barbuda, Aruba, Bahamas, Barbados, Belize, British Virgin Islands, Cayman Islands, Costa Rica, Cuba, Dominica, Dominican Republic, El Salvador, Grenada, Guadeloupe, Guatemala, Haiti, Honduras, Jamaica, Martinique, Mexico, Montserrat, Netherlands Antilles, Nicaragua, Panama, Puerto Rico, Saint Kitts and Nevis1, Saint Lucia, Saint Vincent and the Grenadines, Trinidad and Tobago, Turks and Caicos Islands and Virgin Islands of the United States. South America Argentina, Bolivia, Brazil, Chile, Colombia (including San Andres Islands), Ecuador, Falkland Islands (Malvinas), French Guiana, Guyana, Paraguay, Peru, Suriname, Uruguay and Venezuela. Middle East Bahrain, Iran (Islamic Republic of), Iraq, Israel, Jordan, Kuwait, Lebanon, Oman, Qatar, Saudi Arabia, Syrian Arab Republic, United Arab Emirates and Yemen.

- 40 -
Europe Geographical Europe and Azores, Canary Islands, Cyprus, Greenland, Iceland, Madeira, Malta, Russian Federation and Turkey. Africa The continent of Africa (including Algeria, Egypt, Libya, Morocco, Sudan and Tunisia) and offshore islands, but excluding Azores, Canary Islands, Madeira and Malta.
— — — — — —

- 41 -
APPENDIX C
LIST OF PARTICIPANTS
BRAZIL Perola Kottler Berman INFRAERO Rio De Janeiro Cristian Viera Dos Reis Manager, Statistical Analysis and Market Monitoring Division Economic Regulation and Market Monitoring Department ANAC Brasilia Miguel Antunes da Costa Junior DECEA Rio De Janeiro
Tel.: E-mail Tel: E-mail: Tel: E-mail:
55 (21) 3398-4172 [email protected] 55 (61) 3314-4397 [email protected] 55 (21) 2101-6537 [email protected]
JAMAICA Althea Roper Manager, Aviation Statistics Airfares and Rates Jamaica Civil Aviation Authority 4 Winchester Road Kingston 10 DOMINICAN REPUBLIC Héctor J. Christopher Junta de Aviación Civil Santo Domingo
Telephone: (876) 936-6524 (Direct), (876)960-4033, 3948 (Office) (876)836-1805 (Mobile) Email: [email protected] Tel: (809) 689416 E-mail: [email protected]

- 42 -
HONDURAS (COCESNA) Carlos Antonio Carbajal Perdomo ATM Analyst 150 mtrs. Al Sur del Aeropuerto Internacional Toncontín, Tegucigalpa, Honduras, Centro América Iris Janeth Juares P. COCESNA Jesus Rodriguez COCESNA Fernando Soto COCESNA Luis Castellanos COCESNA Jacqueline Oqueli COCESNA Alfredo Santos Mondragon COCESNA AIM Pablo Alexander Luna COCESNA
Tel.: Fax: E-mail: Tel : E-mail; Tel : E-mail: Tel : E-mail: Tel : E-mail: Tel: E-mail: Tel: E-mail: Tel: E-mail:
(504) 234-3360 (504) 234-3360 Ext. 1322 [email protected] (504) 2234-2479 [email protected] (504) 2234-3360 [email protected] (504) 2234-3360 [email protected] (504) 2234-3360 [email protected] (504) 2234-3360 [email protected] (504) 2234-3360 [email protected] (505) 2234-3360 [email protected]
INTERNATIONAL ORGANIZATIONS (ICAO) Zubair Anwar Secretary, CAR/SAM TFG Associate Economist, Economics Analyses and Policy Section Air Transport Bureau ICAO 999 University Street Montreal, Quebec, Canada H3C 5H7
Tel.: Fax: E-mail:
(514) 954-8219 Ext. 6294 (514) 954-6744 [email protected]
— END —