Career Pathways
34
Career Pathways Career Pathways Prepared for: Prepared for: Wor-Wic Community Wor-Wic Community College College September 2013 September 2013
-
Upload
levi-mendez -
Category
Documents
-
view
29 -
download
0
description
Career Pathways. Prepared for: Wor-Wic Community College September 2013. By 2023, Hospitality and Leisure is projected to increase from 13,282 jobs in 2013 to 14,587 in 2023 increasing the job market by 1,305 jobs across the Lower Shore. - PowerPoint PPT Presentation
Transcript of Career Pathways

Career PathwaysCareer Pathways
Prepared for: Prepared for:
Wor-Wic Community CollegeWor-Wic Community CollegeSeptember 2013September 2013

By 2023, Hospitality and Leisure is projected to increase from 13,282 jobs in 2013 to 14,587 in 2023 increasing the job market by 1,305 jobs across the Lower Shore.
Health Care is expected to gain the most job openings by 2023. This year the total job openings for Health Care is 11,460. The projections show an increase of 3,869 jobs by 2023 across the Lower Shore. Manufacturing is projected to be a
decreasing industry over the next 10 years.
Professional and Technical services are projected to increase by just over 300 jobs by 2023.
Transportation and Warehousing is also increasing and is projected to increase by almost 250 jobs by 2023.
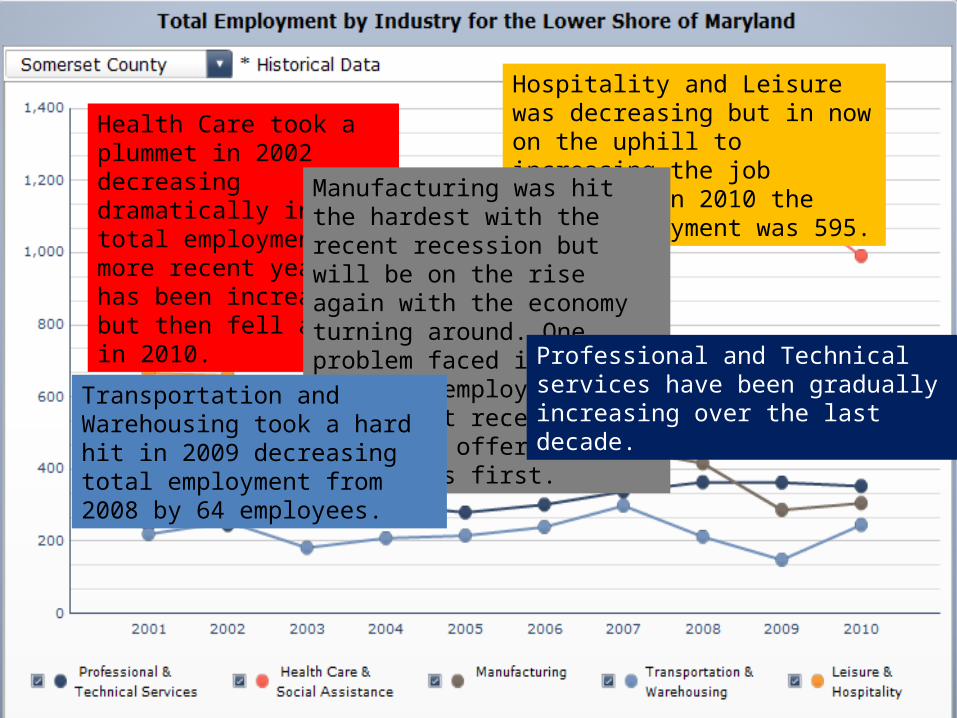
Health Care took a plummet in 2002 decreasing dramatically in total employment. In more recent years is has been increasing but then fell again in 2010.
Hospitality and Leisure was decreasing but in now on the uphill to increasing the job openings. In 2010 the total employment was 595.
Manufacturing was hit the hardest with the recent recession but will be on the rise again with the economy turning around. One problem faced is the laid off employees from the recent recession are receiving offers for their jobs first.
Professional and Technical services have been gradually increasing over the last decade.
Transportation and Warehousing took a hard hit in 2009 decreasing total employment from 2008 by 64 employees.
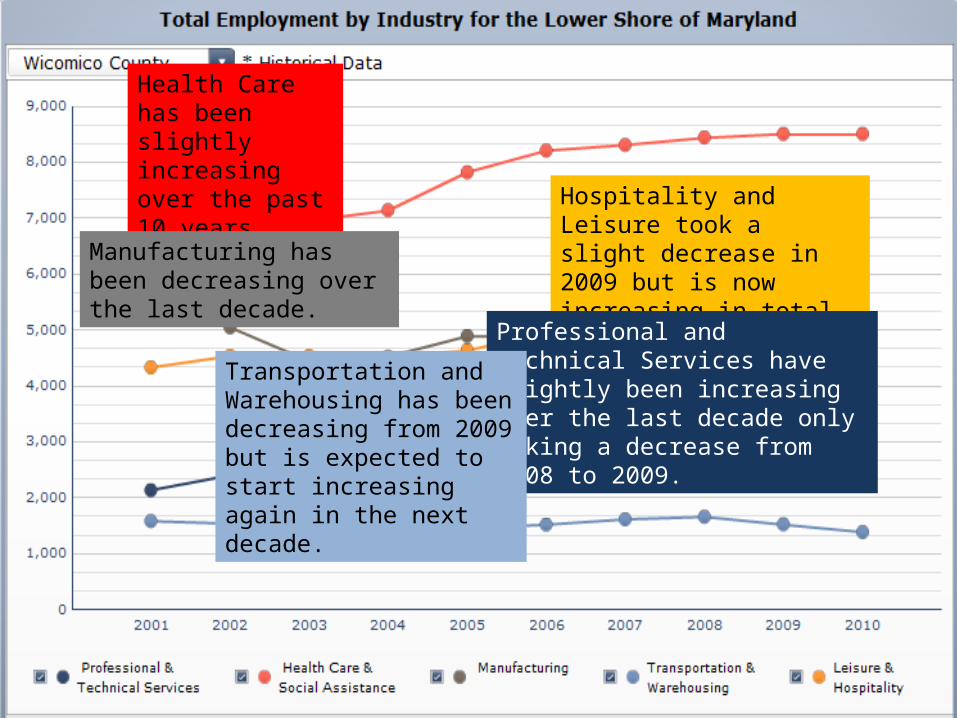
Health Care has been slightly increasing over the past 10 years.
Hospitality and Leisure took a slight decrease in 2009 but is now increasing in total employment.
Manufacturing has been decreasing over the last decade.
Professional and Technical Services have slightly been increasing over the last decade only taking a decrease from 2008 to 2009.
Transportation and Warehousing has been decreasing from 2009 but is expected to start increasing again in the next decade.

Hospitality and Leisure has been showing slight decreases in total employment but is expected to increase in the next decade
Health Care is slightly rising in the previous years and is expected to increase in the upcoming years.
Manufacturing has decreased dramatically in total employment
Professional and Technical Services have been pretty consistent over the last few years.
Transportation and Warehousing has also been pretty consistent over the last few years.

Hospitality & LeisureHospitality & Leisure
Professional, Scientific & Professional, Scientific & Technical ServicesTechnical Services
ManufacturingManufacturing
Health CareHealth Care
Transportation, Transportation, Warehousing & UtilitiesWarehousing & Utilities
Please click anywhere on a circle to view more information about the industry represented by that circle. When you have reviewed all Please click anywhere on a circle to view more information about the industry represented by that circle. When you have reviewed all the slides for that industry, you will automatically return to this page to be able to select another industry. When you are done, simply the slides for that industry, you will automatically return to this page to be able to select another industry. When you are done, simply proceed to the next slide for additional data sets.proceed to the next slide for additional data sets.

25

86

Table 2.1: Lower Eastern Shore Staffing Patterns for Health Care and Social Assistance
SOC Occupation Employed in Industry
(2010)
Change (2010 -
2023)
% of the Total
Jobs in Industry
(2013)
Education Level
29-1141 Registered Nurses 1,396 587 13.0% Associate's degree
31-1014 Nursing Assistants 929 478 9.5% Postsecondary non-degree award
29-2061 Licensed Practical and Licensed Vocational Nurses
475 240 4.9% Postsecondary non-degree award
39-9021 Personal Care Aides 321 379 3.8% Short-term on-the-job training
31-9092 Medical Assistants 304 141 2.9% Moderate-term on-the-job training
31-1011 Home Health Aides 258 306 2.9% Short-term on-the-job training
43-6013 Medical Secretaries 277 149 2.7% Moderate-term on-the-job training
43-4171 Receptionists and Information Clerks
259 123 2.4% Short-term on-the-job training
43-9061 Office Clerks, General 243 92 2.3% Short-term on-the-job training
43-6014 Secretaries and Administrative Assistants, Except Legal, Medical, and Executive
203 47 1.8% Short-term on-the-job training
29-2041 Emergency Medical Technicians and Paramedics
147 120 1.6% Postsecondary non-degree award

Table 2.2: Health Care Job Outlook
NAICS Code Description 2013 Jobs 2018 Jobs 2023 Jobs621111 Offices of Physicians (except Mental Health Specialists) 2,013 2,367 2,636
621112 Offices of Physicians, Mental Health Specialists 25 29 31621210 Offices of Dentists 417 469 493621310 Offices of Chiropractors 51 50 51621320 Offices of Optometrists 67 98 116621330 Offices of Mental Health Practitioners (except Physicians) 135 185 222
621340 Offices of Physical, Occupational and Speech Therapists, and Audiologists
147 187 205
621391 Offices of Podiatrists 33 34 34621420 Outpatient Mental Health and Substance Abuse Centers 44 43 44
621492 Kidney Dialysis Centers 82 108 130621493 Freestanding Ambulatory Surgical and Emergency Centers 111 149 168
621498 All Other Outpatient Care Centers 42 55 62621511 Medical Laboratories 33 38 43621512 Diagnostic Imaging Centers 62 97 118621610 Home Health Care Services 391 501 590621910 Ambulance Services 194 249 291622110 General Medical and Surgical Hospitals (Private) 3,749 4,275 4,616623110 Nursing Care Facilities 1,277 1,586 1,836623210 Residential Mental Retardation Facilities 529 667 827623220 Residential Mental Health and Substance Abuse Facilities 114 103 120
623311 Continuing Care Retirement Communities 55 36 <10623312 Homes for the Elderly 250 282 324624110 Child and Youth Services 13 14 14624120 Services for the Elderly and Persons with Disabilities 482 577 674624190 Other Individual and Family Services 558 816 984624221 Temporary Shelters 26 27 27624310 Vocational Rehabilitation Services 278 320 359624410 Child Day Care Services 251 267 290


123
313

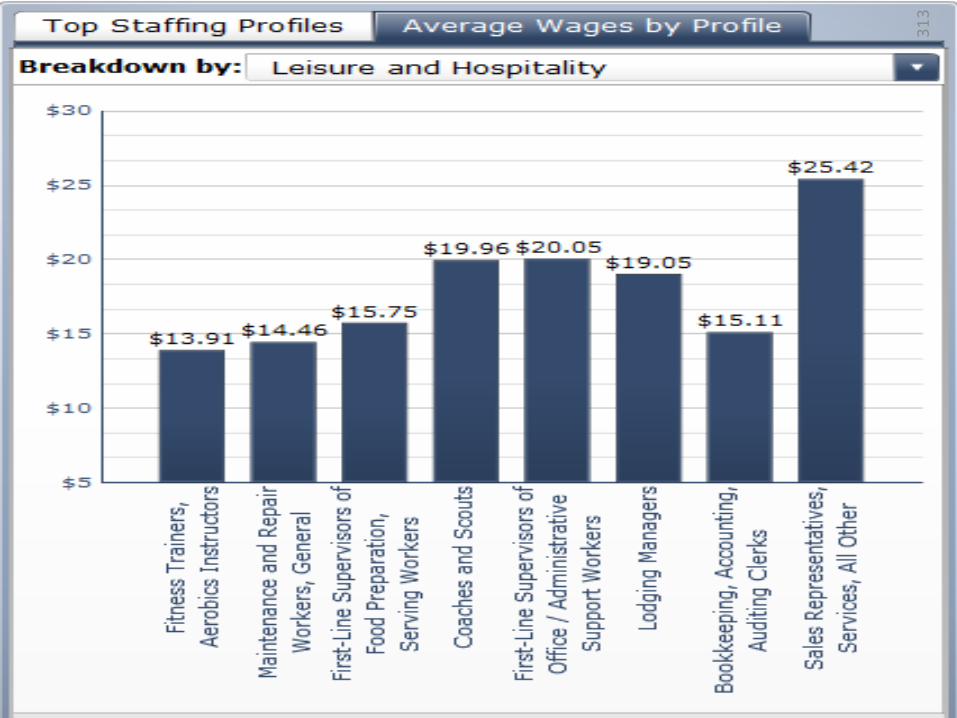
Table 3.1: Staffing Pattern for Hospitality and Leisure
SOC Occupation Employed in Industry
(2010)
Change (2010 -
2023)
% of the Total Jobs in Industry
(2013)
Education Level
39-9031 Fitness Trainers and Aerobics Instructors
83 100 6.1% Postsecondary non-degree award
43-4081 Hotel, Motel, and Resort Desk Clerks 328 82 3.0% Short-term on-the-job training
49-9071 Maintenance and Repair Workers, General
195 74 1.9% Moderate-term on-the-job training
35-1012 First-Line Supervisors of Food Preparation and Serving Workers
634 24 5.4% Work experience in a related occupation
27-2022 Coaches and Scouts 27 16 1.8% Long-term on-the-job training
43-1011 First-Line Supervisors of Office and Administrative Support Workers
53 15 0.5% Work experience in a related occupation
11-9081 Lodging Managers 54 14 0.5% Work experience in a related occupation
43-3031 Bookkeeping, Accounting, and Auditing Clerks
60 13 0.6% Moderate-term on-the-job training


38
39

Table 4.1: Manufacturing Staffing Patterns SOC Occupation Employed
in Industry (2010)
Employed in Industry
(2023)
Change (2010 -
2023)
% of the Total
Jobs in Industry
(2013)
Education Level
51-4011 Computer-Controlled Machine Tool Operators, Metal and Plastic
48 88 40 1.3% Moderate-term on-the-job training
51-4041 Machinists 47 111 64 1.1% Long-term on-the-job training
17-2112 Industrial Engineers 42 53 11 0.9% Bachelor's degree
51-3011 Bakers 24 58 34 0.8% Long-term on-the-job training
51-4121 Welders, Cutters, Solderers, and Brazers
37 45 8 0.7% Postsecondary non-degree award
49-3011 Aircraft Mechanics and Service Technicians
26 39 13 0.6% Postsecondary non-degree award
13-1081 Logisticians 18 30 12 0.4% Bachelor's degree
51-7041 Sawing Machine Setters, Operators, and Tenders, Wood
10 20 10 0.2% Short-term on-the-job training

Table 4.2: Manufacturing Job Outlook
NAICS Code Description 2013 Jobs
2018 Jobs 2023 Jobs
311111 Dog and Cat Food Manufacturing 90 94 99311119 Other Animal Food Manufacturing 106 48 33311211 Flour Milling 98 111 128311615 Poultry Processing 582 400 325311712 Fresh and Frozen Seafood Processing 123 54 22311812 Commercial Bakeries 175 246 292312111 Soft Drink Manufacturing 266 193 168312120 Breweries 12 21 27321113 Sawmills 96 99 135321114 Wood Preservation 19 23 27323113 Commercial Screen Printing 23 50 76323116 Manifold Business Forms Printing 123 64 42324110 Petroleum Refineries <10 11 15325188 All Other Basic Inorganic Chemical Manufacturing <10 13 15325211 Plastics Material and Resin Manufacturing 120 104 110325212 Synthetic Rubber Manufacturing 17 21 20325412 Pharmaceutical Preparation Manufacturing 336 411 456325414 Biological Product (except Diagnostic) Manufacturing 87 111 126327320 Ready-Mix Concrete Manufacturing 39 29 21327390 Other Concrete Product Manufacturing 19 27 33332322 Sheet Metal Work Manufacturing 25 44 60332710 Machine Shops 170 243 305333411 Air Purification Equipment Manufacturing 47 46 48333512 Machine Tool (Metal Cutting Types) Manufacturing 18 33 43333514 Special Die and Tool, Die Set, Jig, and Fixture Manufacturing 18 28 33334419 Other Electronic Component Manufacturing 484 186 63334511 Search, Detection, Navigation, Guidance, Aeronautical, and Nautical System
and Instrument Manufacturing33 44 51
335311 Power, Distribution, and Specialty Transformer Manufacturing 85 108 122336413 Other Aircraft Parts and Auxiliary Equipment Manufacturing 868 1,058 1,116336611 Ship Building and Repairing 59 81 97339920 Sporting and Athletic Goods Manufacturing 69 78 84339999 All Other Miscellaneous Manufacturing 91 99 101


44

45

Table 5.1: Professional, Scientific, and Technical Services Staffing Pattern
SOC Occupation Employed in Industry
(2010)
Change (2010 -
2023)
% of the Total Jobs in Industry
(2013)
Education Level
41-3099 Sales Representatives, Services, All Other
34 17 1.9% Short-term on-the-job training
13-1111 Management Analysts 29 36 1.8% Bachelor's or higher degree, plus work experience
43-4051 Customer Service Representatives 32 18 1.8% Short-term on-the-job training
15-1151 Computer User Support Specialists 19 20 1.4% Associate's degree
15-1132 Software Developers, Applications 13 28 1.1% Bachelor's degree
13-1161 Market Research Analysts and Marketing Specialists
16 16 1.0% Bachelor's degree
15-1131 Computer Programmers 11 16 0.9% Bachelor's degree
15-1121 Computer Systems Analysts 12 18 0.9% Bachelor's degree
15-1133 Software Developers, Systems Software
11 21 0.8% Bachelor's degree

Table 5.2: Professional, Scientific, & Technical Services Job Outlook
NAICS Code Description 2013 Jobs 2018 Jobs 2023 Jobs
541110 Offices of Lawyers 286 261 242
541211 Offices of Certified Public Accountants 207 212 212
541213 Tax Preparation Services 60 60 56
541214 Payroll Services 95 115 131
541219 Other Accounting Services 101 61 41
541310 Architectural Services 79 88 91
541320 Landscape Architectural Services 13 13 11
541330 Engineering Services 157 128 95
541350 Building Inspection Services 13 14 14
541370 Surveying and Mapping (except Geophysical) Services 26 14 <10
541430 Graphic Design Services 15 17 19
541511 Custom Computer Programming Services 29 27 27
541512 Computer Systems Design Services 125 162 207
541519 Other Computer Related Services 39 64 80
541611 Administrative Management and General Management Consulting Services
37 34 31
541613 Marketing Consulting Services 34 33 36
541614 Process, Physical Distribution, and Logistics Consulting Services 63 91 107
541618 Other Management Consulting Services 80 109 132
541620 Environmental Consulting Services 16 21 24
541690 Other Scientific and Technical Consulting Services 140 210 269
541712 Research and Development in the Physical, Engineering, and Life Sciences (except Biotechnology)
53 78 93
541720 Research and Development in the Social Sciences and Humanities 16 13 11
541810 Advertising Agencies 22 23 21
541850 Display Advertising 28 17 <10
541860 Direct Mail Advertising 22 15 <10
541921 Photography Studios, Portrait 100 147 172
541940 Veterinary Services 159 184 199


50

51

Table 6.1: Transportation, Warehousing, and Utilities Staffing Pattern
SOC Occupation Employed in Industry (2010)
Change (2010 -
2023)
% of the Total
Jobs in Industry
(2013)
Education Level
49-9051 Electrical Power-Line Installers and Repairers
41 31 11.5% Long-term on-the-job training
53-3032 Heavy and Tractor-Trailer Truck Drivers 215 31 15.5% Short-term on-the-job training
49-2095 Electrical and Electronics Repairers, Powerhouse, Substation, and Relay
13 13 3.9% Postsecondary non-degree award
51-8013 Power Plant Operators 12 12 3.2% Long-term on-the-job training
49-3031 Bus and Truck Mechanics and Diesel Engine Specialists
31 9 2.3% Postsecondary non-degree award
17-2071 Electrical Engineers 11 7 3.0% Bachelor's degree
17-3023 Electrical and Electronics Engineering Technicians
12 6 3.3% Associate's degree
49-1011 First-Line Supervisors of Mechanics, Installers, and Repairers
15 6 3.9% Work experience in a related occupation

Table 6.2: Transportation Job Outlook
NAICS Code Description 2013 Jobs 2018 Jobs 2023 Jobs
481111 Scheduled Passenger Air Transportation 336 337 338
481211 Nonscheduled Chartered Passenger Air Transportation 14 18 19
484110 General Freight Trucking, Local 38 30 28 484121 General Freight Trucking, Long-Distance, Truckload 89 64 49
484122 General Freight Trucking, Long-Distance, Less Than Truckload 54 66 69
484210 Used Household and Office Goods Moving 29 31 31 484220 Specialized Freight (except Used Goods) Trucking, Local 164 190 222
484230 Specialized Freight (except Used Goods) Trucking, Long-
Distance10 26 37
485210 Interurban and Rural Bus Transportation 151 199 233 485310 Taxi Service 52 39 24 485410 School and Employee Bus Transportation 101 128 146 485999 All Other Transit and Ground Passenger Transportation <10 12 15
487210 Scenic and Sightseeing Transportation, Water 20 23 23
488410 Motor Vehicle Towing 13 17 19 488510 Freight Transportation Arrangement 12 16 18

Table 6.4: Transportation Occupations by Age
NAICS Code
Description Age 19-21
Age 22-24
Age 25-34
Age 35-44
Age 45-54
Age 55-64
481111 Scheduled Passenger Air Transportation <10 21 86 59 92 59
484121 General Freight Trucking, Long-Distance, Truckload
0 0 <10 16 36 23
484122 General Freight Trucking, Long-Distance, Less Than Truckload
<10 <10 <10 20 13 <10
484220 Specialized Freight (except Used Goods) Trucking, Local
<10 <10 20 42 46 29
485210 Interurban and Rural Bus Transportation 0 <10 14 27 36 54
485410 School and Employee Bus Transportation <10 <10 <10 12 29 31

Table 6.6: Warehousing Job Outlook
NAICS Code
Description 2013 Jobs
2018 Jobs
2023 Jobs
491110 Postal Service (Private Sector) <10 <10 <10
492110 Couriers and Express Delivery Services 202 211 220
492210 Local Messengers and Local Delivery 27 37 45
493110 General Warehousing and Storage <10 <10 <10
493120 Refrigerated Warehousing and Storage <10 <10 <10
493130 Farm Product Warehousing and Storage 28 37 46
493190 Other Warehousing and Storage <10 <10 <10

Table 6.10: Utilities Job Outlook
NAICS Code
Description 2013 Jobs
2018 Jobs
2023 Jobs
221119 Other Electric Power Generation 14 <10 0
221122 Electric Power Distribution 366 442 510
221210 Natural Gas Distribution 77 56 38
221310 Water Supply and Irrigation Systems <10 <10 <10

Table 6.12: Utilities Occupations by Age
NAICS Code
Description Age 19-21
Age 22-24
Age 25-34
Age 35-44
Age 45-54
Age 55-64
221119 Other Electric Power Generation 0 0 <10 <10 <10 <10
221122 Electric Power Distribution <10 <10 58 79 135 77
221210 Natural Gas Distribution <10 <10 14 19 23 18
221310 Water Supply and Irrigation Systems 0 0 0 <10 <10 0

Thank you!Thank you!
BEACON BEACON
1101 Camden Ave1101 Camden AvePerdue Hall, Suite 100Perdue Hall, Suite 100Salisbury, MD 21801Salisbury, MD 21801Phone:(410) 546-6001Phone:(410) 546-6001Fax: (410) 546-6002Fax: (410) 546-6002Email: [email protected]: [email protected]
http://BEACON.salisbury.eduhttp://BEACON.salisbury.edu