
Care Home Benchmarking - RCPA · Care Home Benchmarking Get in touch Report 2016/17 Whether...
11
Care Home Benchmarking Report 2016/17
Transcript of Care Home Benchmarking - RCPA · Care Home Benchmarking Get in touch Report 2016/17 Whether...

Care Home Benchmarking Report 2016/17Get in touch
Whether you’re considering reducing your energy costs, increasing your fee rates, occupancy levels or bed numbers, our healthcare specialists are based throughout the UK and are available to visit you on site to discuss your ambitions for your care home.
business.natwest.com/healthcare-expertise
0800 073 0261
Text talk 18001 0800 073 0261
Monday to Friday, 9am-5.30pm (excl. public holidays). Calls may be recorded.
Important Information
This document has been prepared by National Westminster Bank Plc and its affi liates (together “NatWest”) for the intended (the “Recipient”).This document has been delivered to the Recipient for information purposes only. It does not constitute an offer or invitation for the sale, purchase, exchange or transfer of any investment, loan or asset and is not intended to form the basis of any decision or evaluation by the Recipient and should not be regarded as a recommendation by NatWest that the Recipient should participate in any transaction. The Recipient should seek its own fi nancial and tax advice and perform its own independent investigation research and analysis, and shall rely solely on its own judgment, review and analysis to determine its interest in participating in any transaction. Nothing in this document should be construed as legal, tax, regulatory, valuation or accounting advice by NatWest for the Recipient; all of which the Recipient acknowledges that it should seek from its own advisors.
The content of this document refl ects prevailing conditions and NatWest’s views as at this date. NatWest reserves the right, but shall not be obliged, to revise, update or replace such content. NatWest has prepared this document based on information obtained from a number of different sources and assumed, without independent verifi cation, the accuracy and completeness of all such information. No representation, warranty, undertaking or assurance of any kind, express or implied, is or will or has been authorised to be made as to the accuracy or completeness of the document. Without prejudice to the generality of the foregoing, nothing contained in this document is, or shall be, relied upon as a promise or representation as to the achievability or reasonableness of any future projections, estimates, prospects or returns contained herein (or in such other written or oral information provided to the Recipient). The issue of this document shall not be deemed to be any form of commitment on the part of NatWest to proceed with any transaction.
NatWest shall not be liable for any direct, indirect or consequential loss or damage suffered by any person as a result of relying on any statement in or omission from this document or in any other information or communications made in connection with the matters set out herein. NatWest accepts no liability for the actions of any third party referred to in this document. By accepting this document, the Recipient agrees to be bound by the foregoing limitations.
The publication and distribution of this document may, in certain jurisdictions, be restricted by law. Recipients of this document should be aware of, and comply with, applicable legal requirements and restrictions. NatWest accepts no responsibility for any violation of any such restrictions.
National Westminster Bank Plc. Registered in England No. 929027. Registered Offi ce: 135 Bishopsgate, London EC2M 3UR.
Authorised by the Prudential Regulation Authority and regulated by the Financial Conduct Authority and the Prudential Regulation Authority.

Introduction
Welcome to our second edition of the NatWest benchmarking report for SME care homes covering regions across England, Scotland, Wales and Northern Ireland.
Following feedback from last year’s report, we are covering some of the major costs faced by a care home in greater detail. The data is drawn from our healthcare Relationship Managers visiting 484 care home customers across the UK, representing a large sample of our small to medium-sized operators. We’ve also included for the first time a section on children’s homes. We’ve analysed data from 156 homes, including both SME and corporate providers. It’s worth noting that the data was collected prior to the introduction of the National Living Wage and the recent increase in the standard NHS-funded nursing care rate from £112 to £156.25 per week.
Throughout this report we have identified a number of market norms. For example, a typical residential home will have staff costs equal to 52% of turnover. In some cases this is significantly higher or lower, which leads us to question why. Another area which is surprising is the increased use of agency staff. This may be expected in nursing homes due to a shortage of nurses, however the trend is also seen amongst residential homes.
We have also noticed a correlation between lower maintenance spend and inspection findings. The typical maintenance cost is around £1,000 per bedroom, so when this spend drops to £250 we may be dealing with either a new home or one possibly not receiving the attention it deserves or needs.
We’ve provided the figures and analysis to help you benchmark your care home against others in your region and nationally – and to help you set reasonable strategic targets for the short and long term. On page 19 you’ll also find a useful table that you can complete with your own information so you can easily make your comparison.
I hope you’ll find this report useful. If you have any comments or questions, please email me at [email protected] or contact your Relationship Manager.
Yours sincerely
Jeremy Huband
Contents
03 Introduction
04 North of England
06 Midlands
08 London and the South East
10 South West
12 Scotland
13 Wales
14 Northern Ireland
15 UK
16 Case Study
17 Children’s Homes
19 How does your business compare?Jeremy Huband Head of Healthcare
32

North of England (North East and North West combined)
Nursing & Residential homes
Care homes in the North refl ect the average sizes for homes throughout England, whether measured by registrations or practical capacity. Occupancy rates also match national averages, although the proportion of local authority residents are far higher in both nursing and residential homes than elsewhere in the country.
This makes the area particularly sensitive to the fee rates set by local authorities and may go some way to explain the depressed average fees. The high reliance on local authority service users, who normally come with lower fees, makes running the home more challenging and may contribute to the inspection results they receive.
Staff costs as a percentage of turnover are at the top end of those seen in England and would refl ect the lower fee rates. After London and the South East, the North has the greatest usage of agency staff for both types of home.
We reviewed the next most signifi cant costs: heat and lighting, food and maintenance. Food costs are about £4 per day among residential and nursing homes. Maintenance spend is below the survey average, while heat and lighting are above.
Not surprisingly, sentiment among owners is relatively bearish, with few owners predicting that trading conditions will improve when compared with the rest of the country. That said, the majority of owners predict stable trading conditions for next year.
Specialist care homes
With an average registration of 10 beds, similar to other areas, just under half of the homes surveyed have en-suites, which is low. Occupancy levels are strong at 96% above market average of 94%. Fee rates are marginally lower than the national average.
Staff costs as a percentage of turnover were broadly in line with other areas, with agency use being one of the lowest. Inspection results were very good with 88% of the sample achieving a good CQC rating. Sentiment among some owners concerning future trading is cautious, with the majority seeing trading as stable.
After London and the South East, the North has the greatest usage of agency staff for nursing and residential homes.
72% of residents in nursing and residential homes are funded by the local authority, the highest percentage in England.
72%
Nursing Residential Specialist
Size of home (beds in use) 41 33 10
Rooms with en-suite 56% 59% 45%
Occupancy 93% 89% 96%
Staff cost as a percentage of turnover 57% 57% 47%
Homes using agency staff 65% 56% 37%
Fee rate per week – private £686 £530 -
Fee rate per week – local authority £595 £480 -
Fee rate per week – average £655 £509 £1,490
Annual food cost per bed £1,342 £1,356 £2,298
Annual heat and lighting cost per bed £779 £789 £1,205
Annual maintenance cost per bed £929 £820 £2,157
North of England Food costs are about £4 per day among residential and nursing care homes.
54

Midlands
Nursing & Residential homes
Our sample shows that homes in the Midlands are larger than those in most areas of England. The homes also benefi t from having a high number of en-suite rooms and low numbers of double bedrooms.
Occupancy levels in nursing homes are the highest in England. Residential home occupancy levels are lower but broadly in line with the survey at 89%. We also looked at private fee payers and this shows fewer local authority residents. Among residential homes, the differential from what a private fee payer and local authorities are charged is quite large at around £150 per week. In nursing homes, rates are much closer and slightly under national averages.
Staff costs among residential and nursing homes are marginally higher than other parts of England, which may refl ect lower fees or paying staff suffi ciently well to reduce reliance on agencies.
Agency use is something we had not previously tracked, but this is a key area of spending so we have gathered data. In the Midlands, usage of agency staff is lower than the rest of England.
We looked at average food costs, which are signifi cantly lower in residential homes than the rest of the country. Nursing homes are in line with national norms. Maintenance costs are just under £1,000 a bed and heat and lighting under £800 annually.
Sentiment among owners, concerning future trading conditions, are some of the most optimistic in England. Approximately half of residential and nursing home owners think that trading will improve in the next 12 months. The CQC fi ndings on these homes is good for 77% of residential and 82% of nursing homes, meaning they out-perform market norms.
Specialist care homes
Homes providing specialist care in the Midlands are the same in size to averages in England. Traditionally these tended to be six-bed units, but the national average is now 10 beds. Few of the homes have full en-suite provision, with the lowest percentage of en-suites in the sample. Occupancy levels are strong at 92% and fee rates are slightly below national average.
Half the homes use an agency, which is lower than most other areas. Staff costs are broadly in line with other areas, although fee rates are slightly below. Inspection results are very good, with 90% of the sample achieving a good rating from the CQC. Again, sentiment among owners concerning future trading conditions are some of the most optimistic, with 40% seeing trading improving.
Approximately half of residential and nursing home owners think that trading will improve in the next 12 months.Specialist care home occupancy levels are
strong at 92% and fee rates are slightly below national average.
92%
Nursing Residential Specialist
Size of home (beds in use) 48 31 10
Rooms with en-suite 71% 81% 30%
Occupancy 95% 89% 92%
Staff cost as a percentage of turnover 59% 55% 50%
Homes using agency staff 47% 40% 50%
Fee rate per week – private £725 £624 -
Fee rate per week – local authority £617 £474 -
Fee rate per week – average £658 £565 £1,328
Annual food cost per bed £1,315 £1,043 £1,874
Annual heat and lighting cost per bed £760 £783 £600
Annual maintenance cost per bed £974 £958 £1,267
Midlands
76

London and the South East
Nursing & Residential homes
Care homes in London and the South East are the most modest-sized in England, with an average of 31 and 38 registrations in residential and nursing homes respectively. In a highly urbanised area of the country, that has high population density and keen demand for residential building land, it is not surprising there are fewer larger homes. These homes also have comparatively fewer en-suites than most other regions.
Given the pressure on service provision, the area also has the highest usage of agency staff, with 59% of residential and 67% of nursing homes using this type of staffi ng. Average spend among nursing homes is signifi cantly higher than the average fi gure for England.
Food cost per bed is marginally higher among nursing homes, with residential homes the same as national averages. As expected, maintenance costs are higher than most areas.
Both types of homes have high occupancy levels, possibly refl ecting an undersupply of beds across the region.
The make up of occupants in the homes, was 50/50 local authorities and private. We had expected the fee rates to be higher than other regions, however they are broadly similar.
Altogether, staff, agency, food, heat, lighting and maintenance account for the majority of costs. Against turnover it would indicate this region to be one of the more profi table to operate, which is refl ected by the views of owners.
Sentiment among owners concerning future trading conditions nearly match those of England as a whole. A quarter of residential home owners think conditions will improve, while two thirds think they will remain stable over the coming year. In nursing homes, the view was more optimistic, with nearly half of owners predicting an upturn and a further half seeing stable conditions.
Specialist care homes
Homes that provide specialist care in this area are among some of the best-rated in England, with 90% receiving good inspection results. Average fees are high, although occupancy levels are at 90%, which may have been infl uenced by new units still being fi lled.
Agency use stands at 70%, which is well above the national average, yet spend on agency fees averages at £23k, beneath the national average of £28k per year. Staff costs are the highest in England, although these are offset by lower energy and food costs.
In residential homes only 25% of owners see improving trading conditions, with the majority seeing stable conditions.
Homes that provide specialist care in this area are among some of the best-rated in England, with 90% receiving good inspection results.
25%
Nursing Residential Specialist
Size of home (beds in use) 36 29 12
Rooms with en-suite 63% 75% 66%
Occupancy 94% 93% 90%
Staff cost as a percentage of turnover 50% 50% 54%
Homes using agency staff 67% 59% 70%
Fee rate per week – private £893 £708 -
Fee rate per week – local authority £605 £530 -
Fee rate per week – average £799 £651 £1,741
Annual food cost per bed £1,558 £1,727 £1,457
Annual heat and lighting cost per bed £778 £699 £881
Annual maintenance cost per bed £1,106 £1,145 £1,683
London and the South East
98

South West
Nursing & Residential homes
Nursing fee rates are higher than those seen across England while their homes are of similar size. The number of en-suite bedrooms is higher than average, with nursing homes particularly well served. Occupancy levels are 93% for both types of homes and local authorities account for just over half the beds.
Staff costs as a percentage of turnover among nursing homes is similar to other areas, but among residential homes it is signifi cantly lower. This may be due to higher weekly fee rates. We also looked at agency usage and cost, which show that comparatively few residential homes use agencies, although among nursing homes it is far more common. Nursing homes have been in the news due to diffi culties in recruiting nurses and the South West experience is similar to the rest of England.
We also reviewed the next most signifi cant costs: heat and lighting, food and maintenance. Food costs are around £4 per day among residential homes and £5 among nursing homes; nursing is slightly more expensive, but may refl ect quality of homes reviewed. Maintenance spend among residential homes was higher than the typical £1,000 annual cost we had expected. Heat and lighting spend in both types of home is lower than all areas surveyed, refl ecting the warmer climate enjoyed in the South West.
Inspection results for both types of home are among the best in England. The sentiment of the owners is also positive, with nursing homes particularly optimistic.
Specialist care homes
With an average registration of nine beds, similar to other areas, just under 70% of the homes surveyed have an en-suite, which is higher than any other area. Occupancy levels are strong at 98% and fee rates are marginally higher than the national average.
Over half of the homes use agency staff, higher than all other areas except from London and the South East. Staff costs are broadly in line with other areas. Inspection results are very good, with 85% of the sample achieving a good CQC rating. Sentiment among owners concerning future trading is cautious, with the majority seeing trading as stable.
Inspection results for both types of home are among the best in England.
Food costs are around £4 per day among residential homes and £5 among nursing homes; nursing is slightly more expensive, but may refl ect the quality of care homes reviewed.
Staff costs are broadly in line with other areas. Inspection results are very good, with 85% specialist homes achieving a good CQC rating.
85%
Nursing Residential Specialist
Size of home (beds in use) 41 29 9
Rooms with en-suite 86% 76% 67%
Occupancy 93% 93% 98%
Staff cost as a percentage of turnover 55% 46% 51%
Homes using agency staff 59% 35% 57%
Fee rate per week – private £885 £625 -
Fee rate per week – local authority £724 £492 -
Fee rate per week – average £837 £623 £1,844
Annual food cost per bed £1,727 £1,494 £1,727
Annual heat and lighting cost per bed £662 £667 £995
Annual maintenance cost per bed £947 £1,410 £1,816
South West
1110
94% 25%
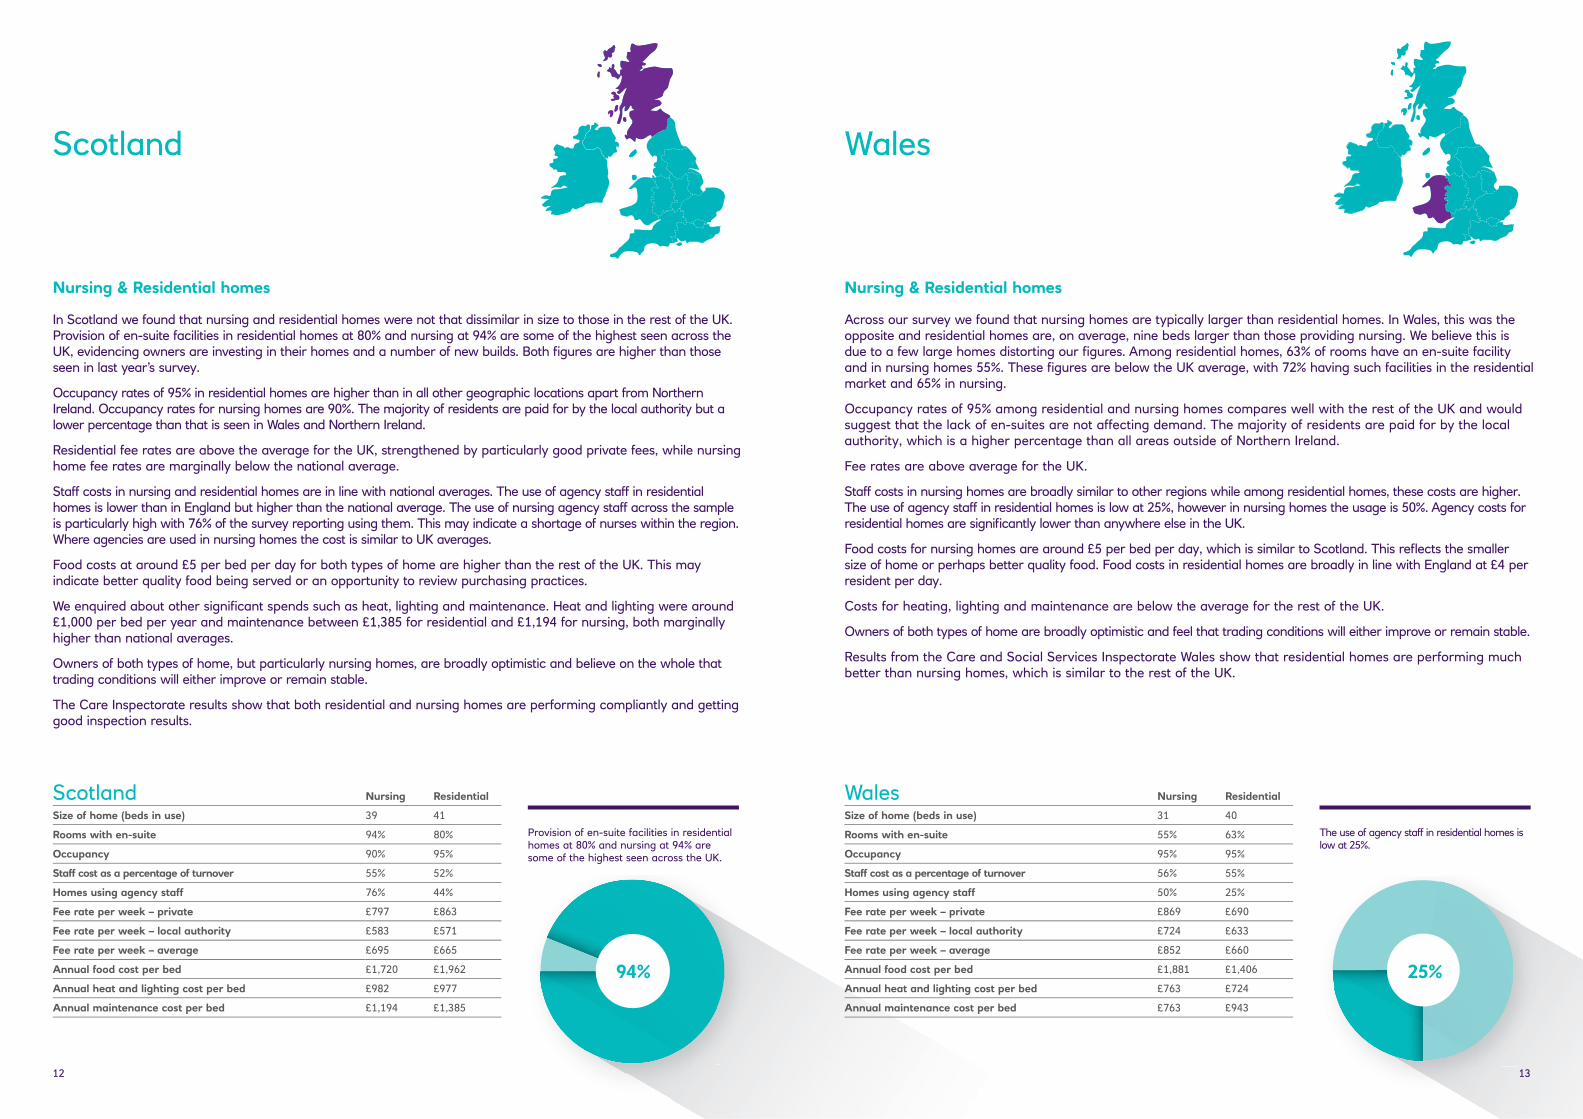
Provision of en-suite facilities in residential homes at 80% and nursing at 94% are some of the highest seen across the UK.
The use of agency staff in residential homes is low at 25%.
Scotland Wales
Nursing & Residential homes
In Scotland we found that nursing and residential homes were not that dissimilar in size to those in the rest of the UK. Provision of en-suite facilities in residential homes at 80% and nursing at 94% are some of the highest seen across the UK, evidencing owners are investing in their homes and a number of new builds. Both fi gures are higher than those seen in last year’s survey.
Occupancy rates of 95% in residential homes are higher than in all other geographic locations apart from Northern Ireland. Occupancy rates for nursing homes are 90%. The majority of residents are paid for by the local authority but a lower percentage than that is seen in Wales and Northern Ireland.
Residential fee rates are above the average for the UK, strengthened by particularly good private fees, while nursing home fee rates are marginally below the national average.
Staff costs in nursing and residential homes are in line with national averages. The use of agency staff in residential homes is lower than in England but higher than the national average. The use of nursing agency staff across the sample is particularly high with 76% of the survey reporting using them. This may indicate a shortage of nurses within the region. Where agencies are used in nursing homes the cost is similar to UK averages.
Food costs at around £5 per bed per day for both types of home are higher than the rest of the UK. This may indicate better quality food being served or an opportunity to review purchasing practices.
We enquired about other signifi cant spends such as heat, lighting and maintenance. Heat and lighting were around £1,000 per bed per year and maintenance between £1,385 for residential and £1,194 for nursing, both marginally higher than national averages.
Owners of both types of home, but particularly nursing homes, are broadly optimistic and believe on the whole that trading conditions will either improve or remain stable.
The Care Inspectorate results show that both residential and nursing homes are performing compliantly and getting good inspection results.
Nursing & Residential homes
Across our survey we found that nursing homes are typically larger than residential homes. In Wales, this was the opposite and residential homes are, on average, nine beds larger than those providing nursing. We believe this is due to a few large homes distorting our fi gures. Among residential homes, 63% of rooms have an en-suite facility and in nursing homes 55%. These fi gures are below the UK average, with 72% having such facilities in the residential market and 65% in nursing.
Occupancy rates of 95% among residential and nursing homes compares well with the rest of the UK and would suggest that the lack of en-suites are not affecting demand. The majority of residents are paid for by the local authority, which is a higher percentage than all areas outside of Northern Ireland.
Fee rates are above average for the UK.
Staff costs in nursing homes are broadly similar to other regions while among residential homes, these costs are higher. The use of agency staff in residential homes is low at 25%, however in nursing homes the usage is 50%. Agency costs for residential homes are signifi cantly lower than anywhere else in the UK.
Food costs for nursing homes are around £5 per bed per day, which is similar to Scotland. This refl ects the smaller size of home or perhaps better quality food. Food costs in residential homes are broadly in line with England at £4 per resident per day.
Costs for heating, lighting and maintenance are below the average for the rest of the UK.
Owners of both types of home are broadly optimistic and feel that trading conditions will either improve or remain stable.
Results from the Care and Social Services Inspectorate Wales show that residential homes are performing much better than nursing homes, which is similar to the rest of the UK.
Nursing Residential
Size of home (beds in use) 31 40
Rooms with en-suite 55% 63%
Occupancy 95% 95%
Staff cost as a percentage of turnover 56% 55%
Homes using agency staff 50% 25%
Fee rate per week – private £869 £690
Fee rate per week – local authority £724 £633
Fee rate per week – average £852 £660
Annual food cost per bed £1,881 £1,406
Annual heat and lighting cost per bed £763 £724
Annual maintenance cost per bed £763 £943
WalesNursing Residential
Size of home (beds in use) 39 41
Rooms with en-suite 94% 80%
Occupancy 90% 95%
Staff cost as a percentage of turnover 55% 52%
Homes using agency staff 76% 44%
Fee rate per week – private £797 £863
Fee rate per week – local authority £583 £571
Fee rate per week – average £695 £665
Annual food cost per bed £1,720 £1,962
Annual heat and lighting cost per bed £982 £977
Annual maintenance cost per bed £1,194 £1,385
Scotland
1312

Nursing & Residential homes
The size of residential and nursing homes vary throughout the UK, with nursing homes larger than residential homes. En-suite provision is highest in Scotland and the lowest in Northern Ireland. In the UK 72% of rooms in residential homes have en-suite facilities, while among nursing homes the figure is 65%.
Whilst across the survey, occupancy rates were the same at 93%, our nursing and residential home occupancy rates for residential homes were lower in the North and Midlands at 89%. Local authority use of beds is highest in the North of England, Wales and Northern Ireland. Average fee rates in Northern Ireland and the North of England are some of the lowest, reflecting the lower fees paid by some local authorities. The average fee among residential homes is £597 per week and among nursing homes it increases to £730 per week.
Staff costs are broadly where we expect them to be: among residential homes it is 52% of turnover and 55% among nursing homes. We also looked at agency costs, which appear to add a further 2% onto staff costs. The use of agencies is higher than we had thought, with 41% of residential and 52% of nursing homes using this service.
We also reviewed the next most significant costs – heat and lighting, food and maintenance. Food costs are around £4 per day among residential and nursing homes, or around £1,460 per year. Maintenance spend is around £1,000 per year, and the cost of heat and lighting is £830.
With so much change in the sector, it is pleasing to see the majority of operators feel that trading conditions are not declining at least. Among nursing homes, the mood is particularly positive with 43% predicting that trading is improving.
Specialist care homes
The data we hold for specialist care only covers England but we would expect other regions to be broadly similar: average registrations of 10 beds, with 52% of rooms having an en-suite facility. Occupancy levels reflect some new capacity in our sample from the North of England and reaches 88%. Fee rates at £1,601 per week were higher than last years benchmarking report at £1,458. The proportion of staff costs as a percentage of turnover is broadly in line with other types of care homes, while owner sentiment concerning future trading is relatively cautious, as the majority see this as stable.
Northern Ireland
Nursing & Residential homes
Residential and nursing homes in Northern Ireland are typically 10% smaller in bed numbers than the rest of the UK. The number of en-suites in residential homes is the same as the rest of the UK but less than a quarter of nursing homes offer the facility. This may reflect that in a nursing home residents are less likely to use their facilities unaided.
Residential homes have an occupancy rate of 97%. This is higher than all the other areas surveyed. Nursing home occupancy rates are broadly in line with rest of the UK at 94%. The majority of residents are paid for by the local authority, significantly more than all other regions surveyed.
Residential fee rates are below the average for the UK and are not greatly impacted by private fee payers who appear to pay only slightly more than the local authority rate. Operators may wish to review their private fee rate to see if this reflects the service they provide.
Staff costs in nursing and residential homes are in line with national averages. The use of agency staff in residential homes is lower than in the rest of the UK and our research showed that there is no agency spend in nursing homes. The lack of agency cost within nursing homes may reflect that there are a greater number of nurses available in Northern Ireland.
Food costs at around £3 per bed per day for both types of homes, are lower than the rest of the UK which may indicate better quality purchasing and negotiations.
Heat and lighting costs per bed are higher than in all other geographic areas surveyed. Annual maintenance costs of £658 for residential and £615 for nursing are both considerably lower than other areas and this brings into question whether operators’ fee rates are sufficient to maintain their homes. We would normally expect maintenance to be at least £1,000 per bed per year.
Owners of both types of home thought the trading environment was stable with nursing home owners being more optimistic.
UK
Residential homes have an occupancy rate of 97%. This is higher than all the other areas surveyed.
Maintenance spend is about £1,000 per year, and the cost of heat and lighting is £830 for residential and nursing homes.
Nursing Residential Specialist (England Only)
Size of home (beds in use) 39 33 10
Rooms with en-suite 65% 72% 52%
Occupancy 93% 93% 88%
Staff cost as a percentage of turnover 55% 52% 51%
Homes using agency staff 52% 41% 54%
Fee rate per week – private £782 £651 -
Fee rate per week – local authority £636 £527 -
Fee rate per week – average £730 £597 £1,601
Annual food cost per bed £1,497 £1,435 £1,839
Annual heat and lighting cost per bed £819 £842 £920
Annual maintenance cost per bed £933 £1,045 £1,731
UKNursing Residential
Size of home (beds in use) 35 26
Rooms with en-suite 30% 73%
Occupancy 94% 97%
Staff cost as a percentage of turnover 56% 52%
Fee rate per week – private £620 £515
Fee rate per week – local authority £603 £509
Fee rate per week – average £612 £509
Annual food cost per bed £937 £1,054
Annual heat and lighting cost per bed £1,006 £1,255
Annual maintenance cost per bed £615 £658
Northern Ireland
1514

Children’s homesChildren’s homes represent a small but important part of the care home sector, and it is an area where we look to support experienced operators in developing their businesses. Our review focuses on data published by the Department for Education and Ofsted and looks at children’s homes in England.
Three quarters of children who are provided with care are placed with foster parents, but a signifi cant number are accommodated in homes. According to data published by the Department of Education in 2014, there were 1,718 children’s homes, and 22% of these were run by local authorities. Charities and the private sector operate the remaining 78%.
Our review looked at 21 children’s home operators based in England. These operators have 156 homes and provide 522 beds. This represents more than 12% of all private or charitable run homes.
Operators in the sample are of different size, with some running one home and others running more than 20. The mean average is 7.65 homes. A number of operators rent property on ASTs, while others use their positive cash fl ows to purchase the freehold and accumulate assets.
The survey shows that children’s homes are typically three to four beds in size, with a mean average of 3.5 beds. While some operators run larger homes, the smallest has one bed. For operational reasons, some homes even run with empty beds. We did not gather information on en-suites, which are not a requirement for Ofsted registration.
Occupancy levels do not always refl ect the performance of the business. For example, a home with four beds may accommodate two residents who are on higher care packages. So some operators are trading “full” while technically they have some empty beds.
The mean fee rate is £3,631, although behind this fi gure there is a high degree of variance. Fees range from £2,100 to £7,000 per week.
The main cost is staff, which averages 56% of turnover. The range went from 45% to around 70%. Staff costs are therefore broadly similar to those among adult care homes.
Locality remains an issue, as 55% of children are placed more than 20 miles away from their family home. On average they stay for two and a half years, although this fi gure varies considerably.
Three quarters of children who are provided with care are placed with foster parents, but a signifi cant number are accommodated in homes.
Black Swan InternationalCASE-STUDY
Nestled in the leafy, residential surroundings of Ipswich Road in Norwich, the Laurel Lodge residential care home provides care for up to 27 residents. Whether it’s the en-suite facilities throughout to the paved garden, multiple lounge facilities or close proximity to the shops, churches and parks, the home’s owner Black Swan is rightly proud of the facilities the home offers.
But Laurel Lodge is just one of the homes in Black Swan’s portfolio, and in fi nding the right formula for residents, the company has been able to expand fast in recent years, extending its footprint to sites of Norfolk, Essex Cambridgeshire. Aside from the extensions made to four homes and funding for three new homes, Black Swan is also looking forward to using the funds approved for new purchases.
As with the rapid expansion of any company, fi nance has played the key part in helping Black Swan achieve its ambitions for growth.
Tom Lyons – Managing Director Black Swan International comments: “The NatWest Healthcare team have a real understanding of the sector and their local knowledge has proved invaluable to us. Their knowledge of our business and the funding they have provided has enabled our business to grow signifi cantly over the last three years with the purchases of three new care homes, extensions at four homes and funding already approved for future purchases. Black Swan specialises in turning around poorly performing care homes and it is our plan to continue to grow by taking advantage of our ability to do this well.”
Specialised fi nancial guidance and support is needed in a marketplace that has proved volatile in recent times. Like many care homer operators, Tom acknowledges the rigours of dealing with the Care Quality Commission, which is “being very thorough in the way they inspect.” Added to this pressure, he sees the higher than ever expectations as to what a care home should look and feel like, causing many homes to receive poor reports. Luckily, it’s not an issue that directly affects Black Swan, as its strategy has allowed it to be fl exible: “Fortunately, with our increasing size and ability to adapt in an ever changing environment, all our homes are currently compliant with the Care Quality Commission in all areas.”
Adaptation in the presence of headwinds is also a quality that Paul Barford, Relationship Director NatWest Healthcare Team, also appreciates. Having worked closely with Black Swan on its expansion plans, he says: “We are proud to support this successful regional care group through this exciting period of growth. While pressures continue to build in the industry, Black Swan is one of a number of established care operators who are leading the way in providing quality care homes to the area and creating jobs locally. It has been fantastic to see this wonderful environment in action and most importantly meet its residents.”
Security may be required. Over 18s only. Fees may apply.
ANY PROPERTY USED AS SECURITY WHICH MAY INCLUDE YOUR HOME, MAY BE REPOSSESSED IF
YOU DO NOT KEEP UP REPAYMENT
Black Swan International, which operates 15 private care homes across Norfolk, Essex and Cambridgeshire, recently secured a signifi cant seven fi gure sum from NatWest to help them acquire two care homes as part of its continued expansion plans.
From left: Andrew Harrison, NatWest; Susan Grieve, Black Swan International and Paul Barford, NatWest
1716

Your home
Region/country
UK Nursing
UK Residential
Size of home (beds in use) 39 33
Rooms with en-suite % % 65% 72%
Occupancy % % 93% 93%
Staff cost as a percentage of turnover £ £ 55% 52%
Fee rate per week – private £ £ £782 £651
Fee rate per week – local authority £ £ £636 £527
Fee rate per week – average £ £ £730 £597
Annual food cost per bed £ £ £1,497 £1,435
Annual heat and lighting cost per bed £ £ £819 £842
Annual maintenance cost per bed £ £ £933 £1,045
Nursing and Residential homes
Your home
Region/country England
Size of home (beds in use) 10
Rooms with en-suite % % 52%
Occupancy % % 94%
Staff cost as a percentage of turnover % % 51%
Fee rate per week £ £ £1,601
Annual food cost per bed £ £ £1,839
Annual heat and lighting cost per bed £ £ £920
Annual maintenance cost per bed £ £ £1,731
Specialist care homes
Your home England
Size of home (beds in use) 3.5
Fee rate per week £ £3,631
Staff cost as a percentage of turnover % 56%
Children’s homes
Find out for yourself
Use the table below to compare your business’s key metrics to UK averages. Whether you find areas to improve on, or your figures surpass national averages, contact us for added help and support.
How does your business compare?
1918

Care Home Benchmarking Report 2016/17Get in touch
Whether you’re considering reducing your energy costs, increasing your fee rates, occupancy levels or bed numbers, our healthcare specialists are based throughout the UK and are available to visit you on site to discuss your ambitions for your care home.
business.natwest.com/healthcare-expertise
0800 073 0261
Text talk 18001 0800 073 0261
Monday to Friday, 9am-5.30pm (excl. public holidays). Calls may be recorded.
Important Information
This document has been prepared by National Westminster Bank Plc and its affi liates (together “NatWest”) for the intended (the “Recipient”).This document has been delivered to the Recipient for information purposes only. It does not constitute an offer or invitation for the sale, purchase, exchange or transfer of any investment, loan or asset and is not intended to form the basis of any decision or evaluation by the Recipient and should not be regarded as a recommendation by NatWest that the Recipient should participate in any transaction. The Recipient should seek its own fi nancial and tax advice and perform its own independent investigation research and analysis, and shall rely solely on its own judgment, review and analysis to determine its interest in participating in any transaction. Nothing in this document should be construed as legal, tax, regulatory, valuation or accounting advice by NatWest for the Recipient; all of which the Recipient acknowledges that it should seek from its own advisors.
The content of this document refl ects prevailing conditions and NatWest’s views as at this date. NatWest reserves the right, but shall not be obliged, to revise, update or replace such content. NatWest has prepared this document based on information obtained from a number of different sources and assumed, without independent verifi cation, the accuracy and completeness of all such information. No representation, warranty, undertaking or assurance of any kind, express or implied, is or will or has been authorised to be made as to the accuracy or completeness of the document. Without prejudice to the generality of the foregoing, nothing contained in this document is, or shall be, relied upon as a promise or representation as to the achievability or reasonableness of any future projections, estimates, prospects or returns contained herein (or in such other written or oral information provided to the Recipient). The issue of this document shall not be deemed to be any form of commitment on the part of NatWest to proceed with any transaction.
NatWest shall not be liable for any direct, indirect or consequential loss or damage suffered by any person as a result of relying on any statement in or omission from this document or in any other information or communications made in connection with the matters set out herein. NatWest accepts no liability for the actions of any third party referred to in this document. By accepting this document, the Recipient agrees to be bound by the foregoing limitations.
The publication and distribution of this document may, in certain jurisdictions, be restricted by law. Recipients of this document should be aware of, and comply with, applicable legal requirements and restrictions. NatWest accepts no responsibility for any violation of any such restrictions.
National Westminster Bank Plc. Registered in England No. 929027. Registered Offi ce: 135 Bishopsgate, London EC2M 3UR.
Authorised by the Prudential Regulation Authority and regulated by the Financial Conduct Authority and the Prudential Regulation Authority.