Framework for Customer Loyalty and Measurement Whitepaper Old
Upload
rachit-parekhCategory
view
221download
1
UNDERSTANDING TRUE LOYALTYGaining Insight into Customer Loyalty Based on Whole-Wallet Spend
WHITE PAPER

| © 2014 Cardlytics, Inc., www.cardlytics.com
WHITE PAPER: Understanding True Loyalty
2
Understanding True LoyaltyLoyal customers are disproportionately important to any business, and businesses spend tremendous time, energy and money identifying and attracting those customers. However, the traditional definition of a loyal customer is a high spending customer, and that definition is flawed. Marketing to customers — based on true loyalty — requires more: more sophisticated measurement, better spend data, and the understanding that a frequent customer is not the same as a loyal customer.
Traditional View of LoyaltyRetailers typically define a loyal customer as a high spending customer. However, focusing on a customer’s spend within a single business — while important — tells only part of the story.
Consumers who spend frequently at one store are often heavy category spenders, and as such, spend across many competitive outlets within the category. Understanding true loyalty requires insight into a consumer’s Whole-Wallet spend — a 360-degree analysis of the customer’s purchase behavior, across all categories and stores.
Many marketers live by the 3 axioms of customer loyalty — loyal customers:
• spend more
• come more often
• create new customers through referral
In truth, some customers do behave this way, but overall, these axioms are more cliché than tested marketing strategy. There are a variety of strategies that tap into the insight that, “20% of my customers drive 80% of my volume.” The insight is fundamentally correct, but it masks a more important truth: those 20% of customers are not all alike.
Yes, the Top 20% of Customers Matter!
Restaurants Apparel Gas & Convenience Grocery General Retail
60%
56%
58%
58%
59%
66%
67%
63%
69%
68%
Top 20% of Customers Represent...What Percent of Trips? What Percent of Spend?
Retailer Category:
Source: Cardlytics Automated Transaction System (CATS)
| © 2014 Cardlytics, Inc., www.cardlytics.com
WHITE PAPER: Understanding True Loyalty
3
Rewarding loyalty is a tried-and-true marketing strategy. Having identified a set of customers who can be labeled loyal, marketers will then craft specific messages and incentives for this group. But if these customers aren’t truly loyal, these marketing efforts can misfire. Marketers are usually willing to provide a greater incentive to capture a new or lapsed customer than to a “loyal” customer. But what if that loyal customer isn’t all that loyal, but simply a heavy category user with limited loyalty? Why would these customers respond to a marketing communication crafted on the premise that they shop nowhere else?
Loyalty among a retailer’s best shoppers is much more complex and fragmented than most businesses realize. Retailers assume that any customer who shops in their store frequently is loyal, and that they capture the majority of that customer’s spend. The business has no precise way of knowing where else a shopper spends within the category, and quite reasonably, assumes that a high frequency customer is a loyal customer. Since a retailer typically has insight into shopper behavior for only their own stores, they mistake frequency for loyalty.
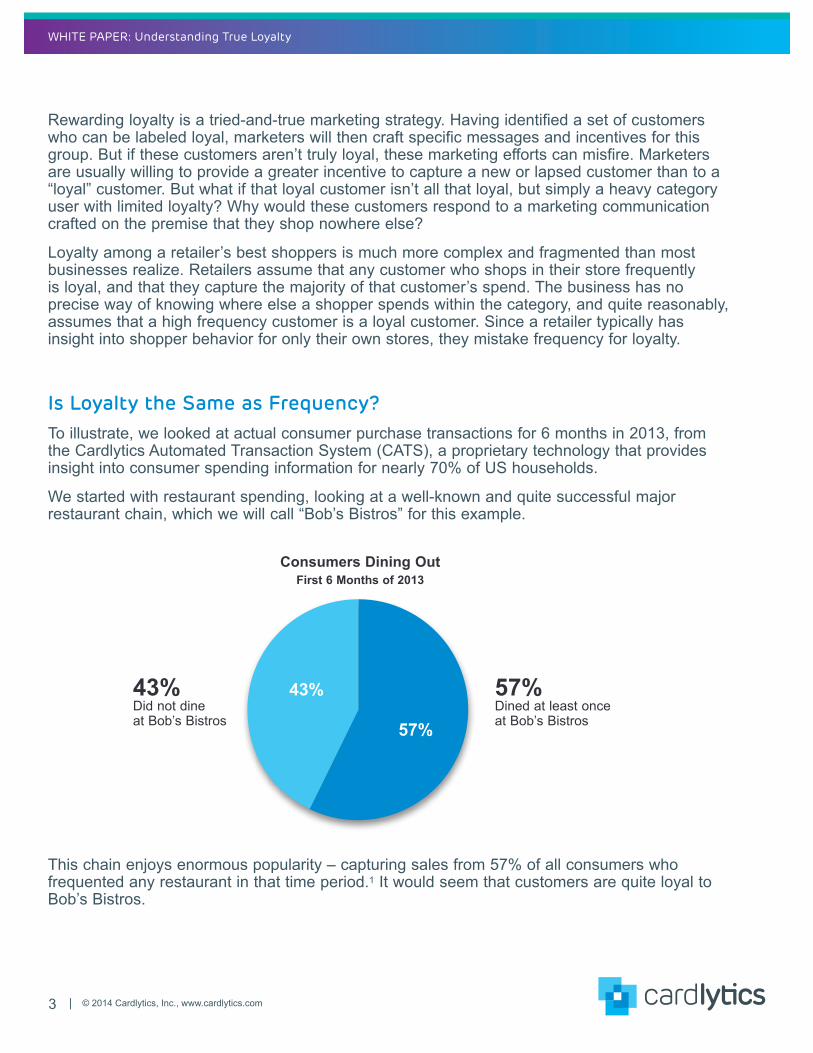
Is Loyalty the Same as Frequency?To illustrate, we looked at actual consumer purchase transactions for 6 months in 2013, from the Cardlytics Automated Transaction System (CATS), a proprietary technology that provides insight into consumer spending information for nearly 70% of US households.
We started with restaurant spending, looking at a well-known and quite successful major restaurant chain, which we will call “Bob’s Bistros” for this example.
Consumers Dining Out First 6 Months of 2013
This chain enjoys enormous popularity – capturing sales from 57% of all consumers who frequented any restaurant in that time period.1 It would seem that customers are quite loyal to Bob’s Bistros.
43% Did not dine at Bob’s Bistros
57% Dined at least once at Bob’s Bistros
43%
57%

| © 2014 Cardlytics, Inc., www.cardlytics.com
WHITE PAPER: Understanding True Loyalty
4
However, looking more carefully at the information available from CATS, we see a very different picture of consumer behavior. Within those 57% of all consumers who visited Bob’s, we can see how frequently Bob’s Bistros appeared as one of their dining out choices.
To do this, we created segments based on how many trips to Bob’s Bistros the consumer made, as a percentage of all restaurant trips. The insights are surprising, if you had assumed that Bob’s customers are loyal.
81%
15%4%
How Frequently Did Consumers Eat at Bob’s?
Customers who dined at least once at Bob’s
>50% of the time
25-50% of the time
<25% of the time
57%
No question — these are still quite frequent and important customers. However, for Bob’s Bistros, there is important information about their customers: for every trip Bob’s Bistros captures, there are about 3 other trips made to competitors.
An Apparel ExampleLooking at other verticals, we see similar examples, like this one from a major apparel retailer, which we will call “Fashion Fanatics” for this example.
71% Never shopped at Fashion Fanatics
29% Shopped at least once at Fashion Fanatics
71%
29%
Consumers Dining Out First 6 Months of 2013
Consumers Shopping Apparel First 6 Months of 2013

| © 2014 Cardlytics, Inc., www.cardlytics.com
WHITE PAPER: Understanding True Loyalty
5
Frequency Does Not Equal LoyaltyTruly loyal customers are a very small portion of a company’s customer base. Cardlytics’ insight across the Whole-Wallet spend of consumers would indicate that the vast majority of customers labeled as loyal by retailers are, in fact, switchers: they are heavy users of the category, but not exclusive to a single store. Retailers are mistaking frequency for loyalty, assuming that they capture the lion’s share of their most frequent customers’ spend.
However, it turns out that your most loyal customers are loyal to your competitors too. Or more bluntly, your loyal customers — aren’t.
The typical loyalty strategy falls into this trap. Most loyalty programs identify customers as loyal based on their frequency of purchases within a single store, since that is usually the only information available to the retailer. This mislabeling occurs when a retailer uses a simple analysis of spend — spending within their own stores. The completely understandable assumption is that the 10-20% of customers spending the most with a business must be the most loyal to the business, and therefore, the most important.
Retailers need data that tells them the entire spend of their customers, so they can better assess loyalty. They need a Whole-Wallet view of customer spend.
68%
22%
10%
How Frequently did Consumers Choose Fashion Fanatics?
Customers who shopped at least once at Fashion Fanatics
>50% of the time
25-50% of the time
<25% of the time
29%
Consumers Shopping Apparel First 6 Months of 2013
Similar to Bob’s Bistros, Fashion Fanatics enjoys a healthy market share – nearly a third of apparel shoppers patronized one of their stores.2 Again, however, a substantial majority of those shoppers went elsewhere for most of their trips.

| © 2014 Cardlytics, Inc., www.cardlytics.com
WHITE PAPER: Understanding True Loyalty
6
To the regional grocery chain, Anne and Chris both appear to be loyal customers, because their frequency is high and consistent – but only Chris is actually loyal. To the grocery chain looking to increase spend, Anne might be a better candidate for a targeted advertising offer. She is a high category spender, and has a pattern of spending across several stores.
Which is the Loyal Grocery Shopper?
Anne – shops for a family of 4: 1 trip a week to the local regional grocery store; 1 trip to the “natural foods” grocery store one town over; 1 trip a month to the warehouse chain, primarily for groceries.
Chris – shops for 1: Short on time, Chris averages a grocery shopping trip each week to the local regional grocery store.
Why Whole-Wallet Analytics is Possible NowUnderstanding a retailer’s share of wallet requires a complete picture of a consumer’s spending – not just in one store or category, but all spending within a household. In the past, getting the data for this analysis was nearly impossible, and so, when done, share of wallet was based on surveys, estimates, or econometric models. In the past decade, however, there has been an explosion in the use of cards – debit, credit and prepaid – as a substitute for cash and checks. Ten years ago, cash and check accounted for 57% of consumer in-store purchases3 – a market that still comprises 93% of the total U.S. retail dollar volume.4 Today, card payments currently make up 66% of in-store transactions,5 with debit card purchases accounting for the majority at approximately 70%.6
The increase in card use is what enables Whole-Wallet analytics now – there are transaction records for the majority of consumer debit, credit and prepaid card spending, held securely by the consumer’s bank.
Transaction data from banks can provide concrete, complete knowledge about how, when and where consumers shop. This is particularly true for debit card users. Debit cards are used to make everyday purchases, providing valuable data about where they choose to shop, how frequently they shop at a particular store, and how much they spend, within and across categories.

| © 2014 Cardlytics, Inc., www.cardlytics.com
WHITE PAPER: Understanding True Loyalty
7
With this better insight into customer spending, an understanding of the interaction between frequency and loyalty is possible. Again, we looked into the restaurant category for some initial insights. At first glance, restaurant customers look pretty loyal, given the category. We calculated the number of customers who make 50% or more of their visits – that is, more than half of all their dining out – to their favorite restaurant.
Based on our data, we discovered that about 44% of customers display this pattern of loyalty.7 In the restaurant industry, with its surplus of choices, this looks very attractive.
44% Dine at the same restaurant for more than half of their dining trips out
44%
Loyal Customers Spend LessThese loyal customers, however, look slightly less attractive when you dig deeper and segment them by frequency. For this exercise, we separated customers into 3 categories:
• Light: Guests making fewer than 52 trips a year: less than once a week
• Medium: Guests making between 52-129 trips a year: 1-2.5 times every week
• Heavy: Guests who made 130 or restaurant trips in a year: 2.5 times a week, or more
With these definitions, one can see far more going on within consumer spending.
All Restaurant Customers Segmented by Loyalty to their Favorite Restaurant
56%
56% Dine at the same restaurant less than half of the time

| © 2014 Cardlytics, Inc., www.cardlytics.com
WHITE PAPER: Understanding True Loyalty
8
This analysis varies by industry, but consistently yields deeper insights than the top-level view would allow.
Customer Loyalty to a Single Restaurant, based on Frequency
50%+ Loyal <50% Loyal
• Light
• Medium
• Heavy
100%80%60%40%20%0%
While the whole category looked quite loyal, 44% of customers dining out go to their favorite restaurant the majority of the time. However, the driver of that loyalty comes from relatively infrequent customers!
57% 43%
27% 73%
23% 77%
Not surprisingly, Light Customers spend less than Medium or Heavy Customers – significantly less. While a Light Customer might be very loyal, the less-loyal Heavy Customer might be more valuable to a restaurant.
56%
Restaurant Spending Dollars Spent First 6 Months of 2013
24%
Light
Medium
Heavy
20%

| © 2014 Cardlytics, Inc., www.cardlytics.com
WHITE PAPER: Understanding True Loyalty
9
of customers
Retailer Category Restaurants Apparel Gas & Convenience Grocery General Retail
Percent of all Customers who are 50%+ Loyal
Percent of Light Customers who are 50%+ Loyal
Percent of Medium Customers who are 50%+ Loyal
Percent of Heavy Customers who are 50%+ Loyal
44% 53% 57% 81% 80%
57% 75% 69% 86% 89%
27% 26% 44% 74% 70%
23% 15% 39% 72% 65%
Customer Segmentation Based on True LoyaltyThe basic issue that complicates an understanding of true loyalty is that, without a view of Whole-Wallet spend, there is no way to understand whether a frequent customer is a truly loyal customer or not. Customers who are heavy spenders on one brand tend to be heavy category spenders, particu-larly in frequent-consumption categories (e.g., restaurants). So, the top decile customer of a typi-cal fast-food outlet might be a top decile customer of multiple fast-food outlets – and, their high category activity can be misread as loyalty to a specific restaurant.
Applying a Whole-Wallet analysis to customer spend uncovers the elements of true loyalty. Our analysis identifies four segments for most retailers and restaurants:
• New Customers – who haven’t spent with a retailer at all, but have spend within the category or within adjacent categories • Infrequent Customers – those who have spent some with the retailer, and who are infrequent users of the category • Heavy Switchers are heavy spenders within the category, and who spend heavily across several retailers in the category • Heavy Loyals are customers who are heavy spenders in the category, and who spend almost exclusively with one retailer – meaning, they are truly loyal
For most industries and retailers, the percentage of Heavy Loyals is far smaller than expected. While it is true that 20% of customers account for 60-70% of sales, as we saw earlier in the pa-per, those 20% of customers simply aren’t all that loyal.
Loyalty to a Single Retailer % of Customers Who are 50%+ Loyal

| © 2014 Cardlytics, Inc., www.cardlytics.com
WHITE PAPER: Understanding True Loyalty
10
Customer Segments
New Customers: Haven’t spent with a retailer at all, but have spend within the category or within adjacent categories
Infrequent Customers: Have spent some with the retailer, and who are infrequent users of the category
Heavy Switchers: Heavy spenders within the category, and who spend heavily across competitors in the category
Heavy Loyals: Heavy spenders in the category, and who spend almost exclusively with one retailer
Marketing Strategy in Light of True LoyaltyWhen marketers have deeper insight into Whole-Wallet spending, they can precisely target the right communication, messaging and promotional incentive to their customers.
Heavy Loyals
The classic reflex is to lavish rewards and attention on Heavy Loyals to drive additional con-sumption. However, this group does not have a lot of upside in their purchase behavior – they are already truly loyal! In this case, it is a benefit that Heavy Loyals are often a very small portion of a retailer’s volume. Marketing efforts for Heavy Loyals should be focused on customer experi-ence and preserving margin, for these customers need little incentive to continue shopping with their favored retailer.
Heavy Switchers
Heavy Switchers, on the other hand, have significant upside potential. These customers spend heavily in a retailer’s category, and spread their spend across a number of competitors regularly. An advertising offer made to such a customer has a good chance of successfully changing that customer’s behavior – perhaps capturing a planned purchase from a competitor. Switchers are good candidates for promotions, seasonal incentives and messaging, and competitive messaging. They also respond well to a drip campaign that targets multiple purchases in a desired cadence over time.
New Customers
Marketing to New Customers is least affected by this new definition of loyalty. These customers need incentives to try a retailer, and thus will respond to advertising, promotions and traditional communication of benefits.
The advantage that Whole-Wallet analytics provides is insight into category spend behavior. That is, Whole-Wallet analytics can identify New Customers – having not shopped at a particular

| © 2014 Cardlytics, Inc., www.cardlytics.com
WHITE PAPER: Understanding True Loyalty
11
retailer – who have spent within the category, and further, with which competitors. This allows refined messaging and offers to these customers based on this insight.
Infrequent Customers
Infrequent Customers are perhaps the most elusive in crafting effective marketing messages. These are customers who simply don’t shop frequently in either the category, or at any specific store. Again, though, Whole-Wallet analytics can help identify an effective approach. Consumers who are low spenders in a particular category might be high spenders in an adjacent category. For example, a Fast Casual restaurant might target the Infrequent Fast Casual customer who is a more active spender in Casual Dining. The message could emphasize the quality of their food and dining experience – elements of the Casual Dining experience. Whole-Wallet analytics al-lows the identification of this customer, which is critical to the success of the campaign.
Jamie – coffee enthusiast – shops 4-5 times a week in both high-end specialty coffee roasters and popular chain coffee stores. Jamie has not shopped with NewCoffeeCo in the past 6 months.
RECOMMENDATIONS
Two New Customers for “NewCoffeeCo”, a coffee chain looking to acquire new customers in a major MSA
Sam – convenience enthusiast – shops 4-5 times a week in convenience stores and popular chain coffee & pastry stores. Sam has not shopped with NewCoffeeCo in the past 6 months.
Target Jamie with modest promotional advertising (e.g., 10% off purchase), with particular emphasis on the quality of the coffee at NewCoffeeCo. The Goal? Induce Jamie to try NewCoffee, and ultimately capture just one of Jamie’s 5 coffee purchases a week.
Target Sam with a more aggressive promotional strategy – 15% off purchase, with emphasis on the convenience of NewCoffeeCo’s locations and variety of food & beverage options, in addition to coffee.
| © 2014 Cardlytics, Inc., www.cardlytics.com
WHITE PAPER: Understanding True Loyalty
12
Loyalty is not FrequencyA Whole-Wallet view of consumer shopping behavior is needed to distinguish between custom-ers that are frequent and those that are loyal. Cardlytics has done hundreds of analyses in doz-ens of categories, and we consistently find similar results: truly loyal customers are rare.
The importance of a loyal customer remains a key tenet of marketing. Businesses require a better understanding of loyalty, based on a whole-wallet view of spending, to craft appropriate programs, messages and marketing. A frequent customer may be loyal, or simply frequent, and the difference can have a significant impact on the effectiveness of marketing campaigns.
About Cardlytics
Cardlytics is a leading advertising and technology company, and the pioneer in Card-Linked Marketing. Cardlytics partners with nearly 400 financial institutions including Bank of America, PNC, Regions and Lloyds Banking Group, providing insight into consumer purchase behavior for ~70% of U.S. and ~30% of U.K. households, across all stores and categories. Cardlytics’ patented technology allows advertisers to make a direct connection to millions of active buyers, through online banking and mobile banking applications. Cardlytics advertisers are retailers, restaurants and consumer-facing brands, and represent hundreds of national companies and thousands of regional and local businesses.
Cardlytics is headquartered in Atlanta, with offices in London, New York and San Francisco. The company is funded by leading investors in Boston and Silicon Valley, as well as a strategic investment from the world’s leading loyalty company, Aimia.
§

| © 2014 Cardlytics, Inc., www.cardlytics.com
WHITE PAPER: Understanding True Loyalty
13
Citations
1. Data from Cardlytics Automated Transaction System (CATS), 2013.
2. See note 1 above.
3. “Highlights from the 2008 Study of Consumer Payment Preferences.” Hitachi Consulting. www.hitachiconsulting.com.
http://www.hitachiconsulting.com/files/Fast%20and%20Without%20Cash%20-%20CPPS%20Highlights.pdf
4. “Javelin Strategy & Research Releases Point of Sale (POS) Forecast Report.” Javelin Strategy.
https://www.javelinstrategy.com/news/1402/58/Javelin-Strategy-Research-Releases-Point-of-Sale-POS-Forecast-Report
5. “Cash Dying As Credit Card Payments Predicted To Grow In Volume: Report.” Huffington Post. www.huffingtonpost.com.
http://www.huffingtonpost.com/2012/06/07/credit-card-payments-growth_n_1575417.html
6. “Transaction Volume Share.” The Nilson Report 1008 (2012): 9.
7. See note 1 above.