Carcinogenicity prediction for Regulatory Use Natalja Fjodorova Marjana Novič, Marjan Vračko,...
36
Carcinogenicity prediction for Regulatory Use Natalja Fjodorova Marjana Novič, Marjan Vračko, Marjan Tušar National institute of Chemistry, Ljubljana, Slovenia
-
Upload
dorcas-hines -
Category
Documents
-
view
224 -
download
3
Transcript of Carcinogenicity prediction for Regulatory Use Natalja Fjodorova Marjana Novič, Marjan Vračko,...

Carcinogenicity prediction for Regulatory Use
Natalja FjodorovaMarjana Novič, Marjan Vračko,
Marjan Tušar
National institute of Chemistry, Ljubljana, Slovenia
Kemijske Dnevi 25-27 September 2008
UNIVERZA MARIBOR
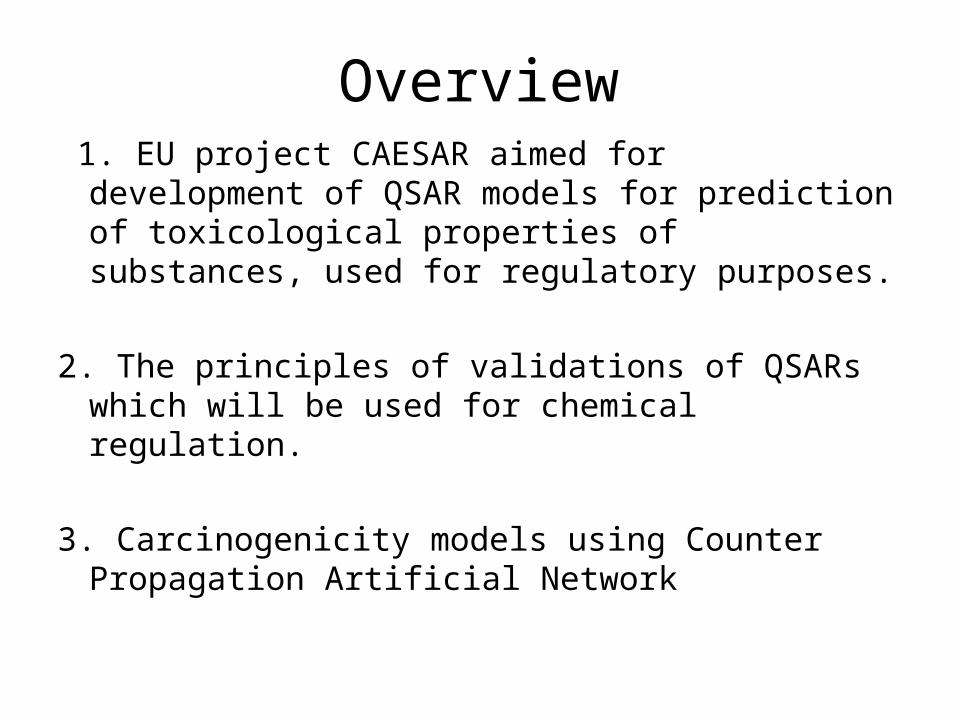
Overview 1. EU project CAESAR aimed for
development of QSAR models for prediction of toxicological properties of substances, used for regulatory purposes.
2. The principles of validations of QSARs which will be used for chemical regulation.
3. Carcinogenicity models using Counter Propagation Artificial Network

• It is estimated that over 30000 industrial chemicals used in Europe require additional safety testing to meet requirements of new chemical regulation REACH.
• If conducted on animals this testing would require the use of an extra 10-20 million animal experiments.
• Quantitative Structure Activity Relationships (QSAR) is one major prospect between alternative testing methods to be used in a regulatory context.
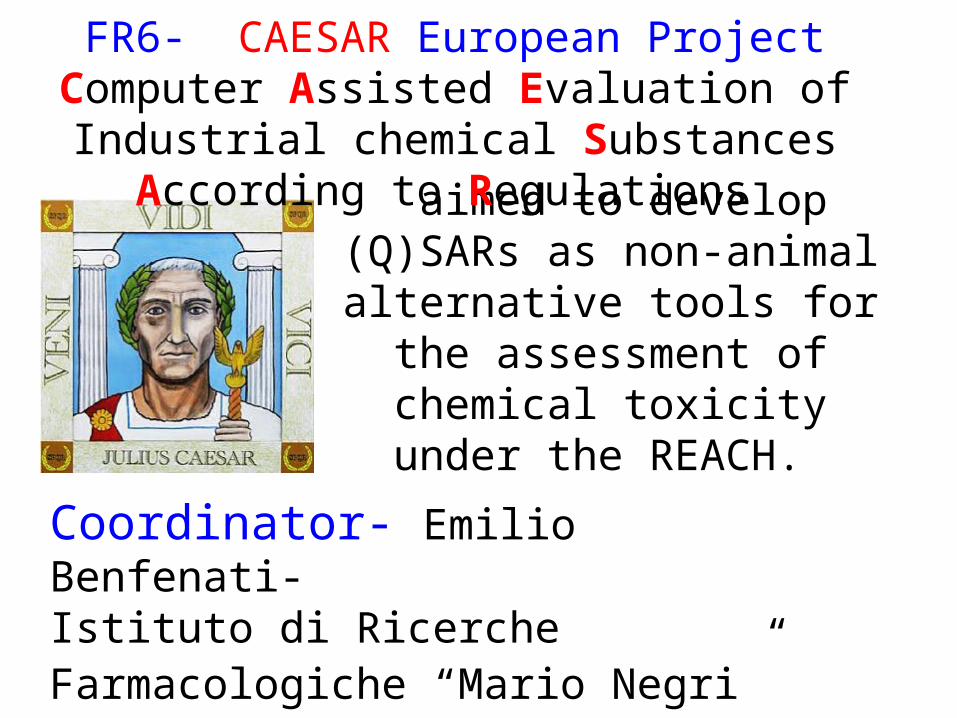
aimed to develop (Q)SARs as non-animal alternative tools for the assessment of chemical
toxicity under the REACH.
FR6- CAESAR European ProjectComputer Assisted Evaluation of Industrial chemical Substances
According to Regulations
Coordinator- Emilio Benfenati- Istituto di Ricerche Farmacologiche “Mario Negri”

The general aim of CAESAR is
1. To produce QSAR models for toxicity prediction of chemical
substances, to be used for regulatory purposes under REACH
in a transparent manner by applying new and unique modelling and validation
methods.
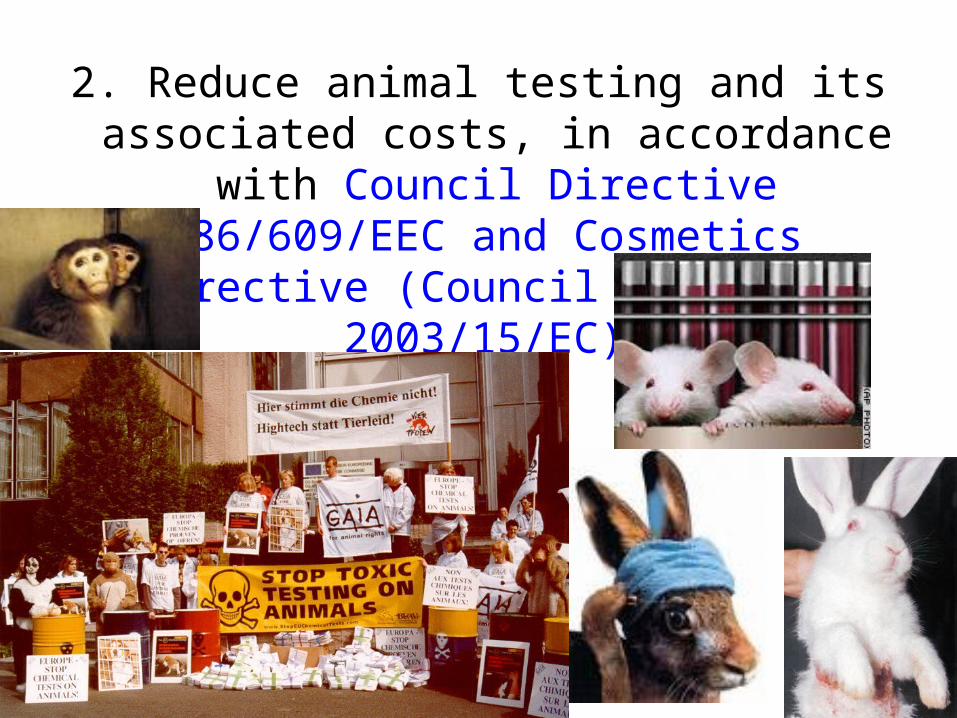
2. Reduce animal testing and its associated costs, in accordance with
Council Directive 86/609/EEC and Cosmetics Directive (Council
Directive 2003/15/EC)
CAESAR is solving several problems:
•Ethical- save animal lifes;
•Economical- cost reduction on testing;
•Political- REACH implementation- new chemical legislation
CAESAR aimed to develop new (Q)SAR models for 5 end-points:
Bioaccumulation (BCF),Skin sensitisation
Mutagenicity Carcinogenicity Teratogenicity
The characterization of the QSAR models follows the general
scheme of 5 OECD principles:
1. A defined endpoint 2. An unambiguous algorithm3. A defined domain of applicability4. Appropriate measures of goodness-
of-fit, robustness and predictivity5. A mechanistic interpretation, if
possible.

Principle1- A defined endpoint
Endpoint is the property or biological activity determined in experimental
protocol, (OECDTest Guideline).
Carcinogenicity is a defined endpoint addressed by an officially recognized test method (Method B.32 Carcinogenicity test – Annex V to Directive 67/548/EEC).

Principle2- An unambiguous algorithm
• Algorithm is the form of relationship between chemical structure and property or biological activity being modelled.
• Examples:1. Statistically (regression) based QSARs2. Neural network model, which includes
both learning process and prediction process.

Transparency in the (Q)SAR algorithm can be provided by means of the following information:
a) Definition of the mathematical form of a QSAR model, or of the decision rule (e.g. in the case of a SAR)
b) Definitions of all descriptors in the algorithm, and a description of their derivation
c) Details of the training set used to develop the algorithm.

Principle3- A Defined Domain of Applicability
The definition of the Applicability Domain (AD) is based on the assumption that a model is capable of making reliable predictions only within the structural, physicochemical and response space that is known from its training set.
• List of basic structures (for example, aniline, fluorene..)
• The range of chemical descriptors values.
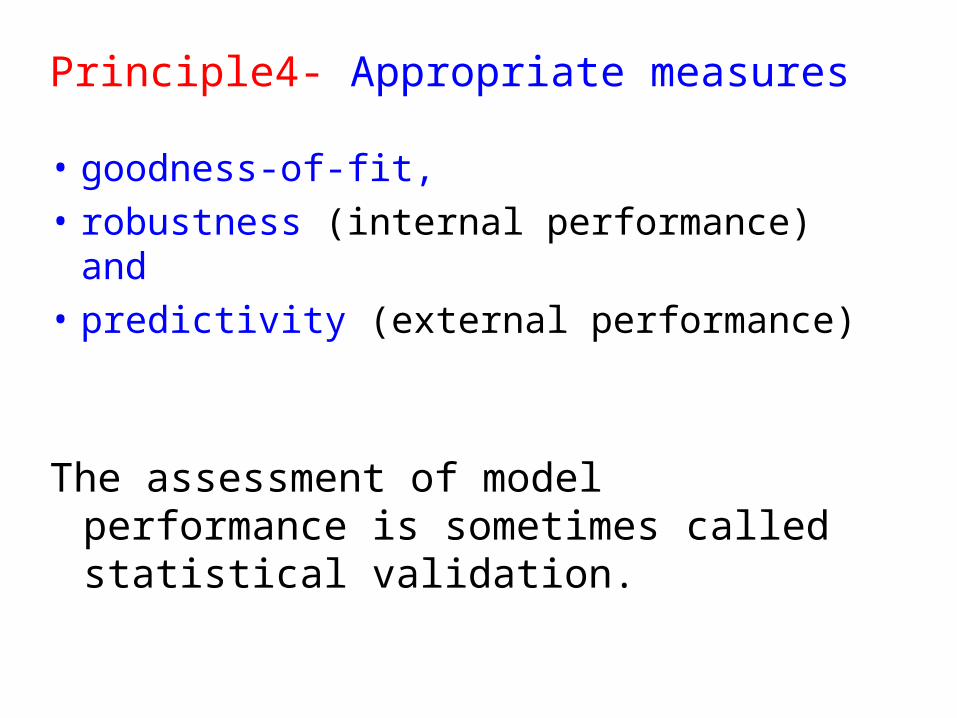
The assessment of model performance is sometimes called statistical validation.
Principle4- Appropriate measures
• goodness-of-fit,• robustness (internal performance)
and • predictivity (external performance)

Principle5- A mechanistic interpretation, if possible
Mechanistic interpretation of (Q)SAR provides a ground for interaction and dialogue between model developer, and toxicologists and regulators, and permits the integration of the (Q)SAR results into wider regulatory framework, where different types of evidence and data concur or compliment each other as a basis for making decisions and taking actions.
Example: enhancing/inhibition the metabolic activation of substances may be discussed.

National Institute of Chemistry in Ljubljana (NIC-LJU)
is responsible for development of models for predicton of
carcinogenicity

DATA ON CARCINOGENICITY 1.Studies of carcinogenicity in humans2.Carcinogenicity studies in animals3.Other relevant data
additional evidence related to the possible carcinogenicity
•Genetic Toxicology •Structure-Activity Comparisons •Pharmacokinetics and Metabolism•Pathology
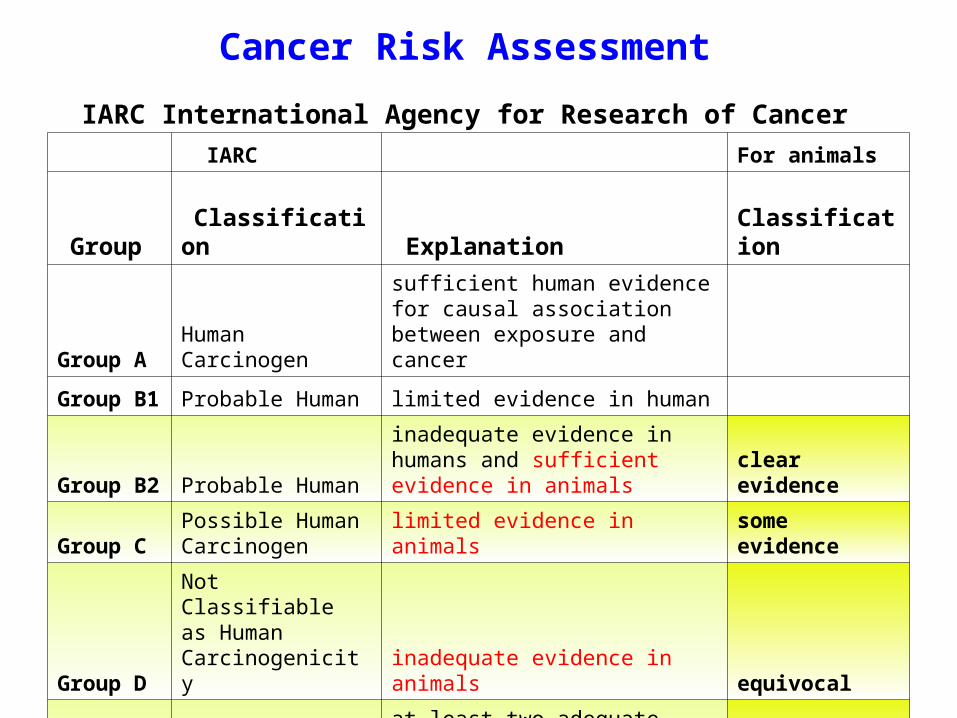
Cancer Risk Assessment IARC International Agency for Research of Cancer
IARC For animals
Group Classification Explanation
Classification
Group AHuman Carcinogen
sufficient human evidence for causal association between exposure and cancer
Group B1 Probable Human limited evidence in human
Group B2 Probable Human
inadequate evidence in humans and sufficient evidence in animals
clear evidence
Group CPossible Human Carcinogen limited evidence in animals
some evidence
Group D
Not Classifiable as Human Carcinogenicity
inadequate evidence in animals equivocal
Group E
No Evidence of Carcinogenicity in Human
at least two adequate animal tests or both negative epidemiology and animal studies no evidence
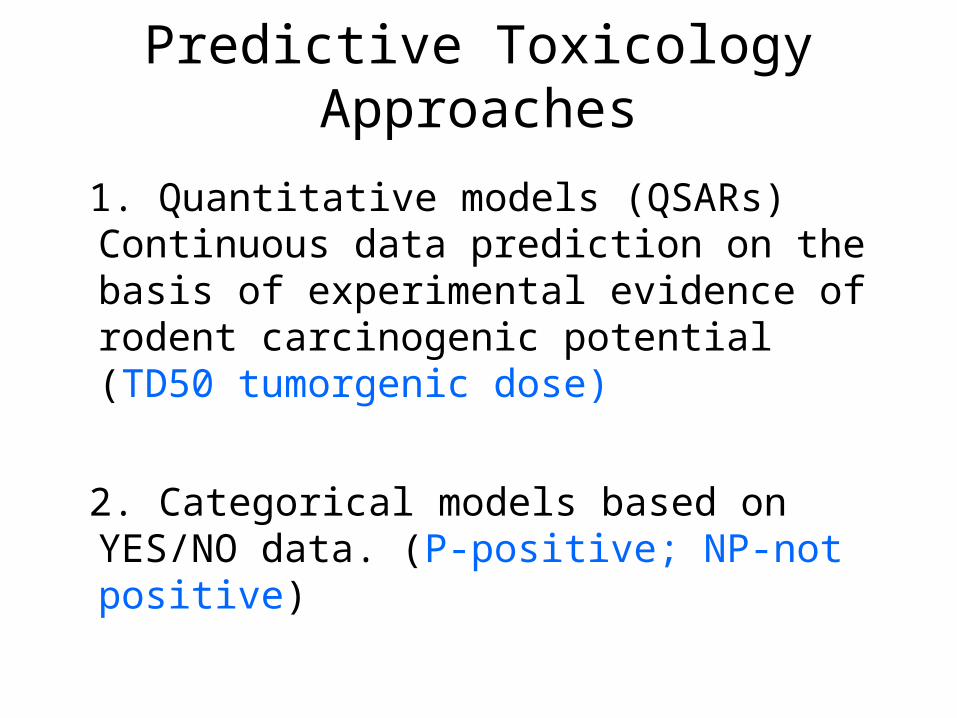
Predictive Toxicology Approaches
1. Quantitative models (QSARs) Continuous data prediction on the basis of experimental evidence of rodent carcinogenic potential (TD50 tumorgenic dose)
2. Categorical models based on YES/NO data. (P-positive; NP-not positive)
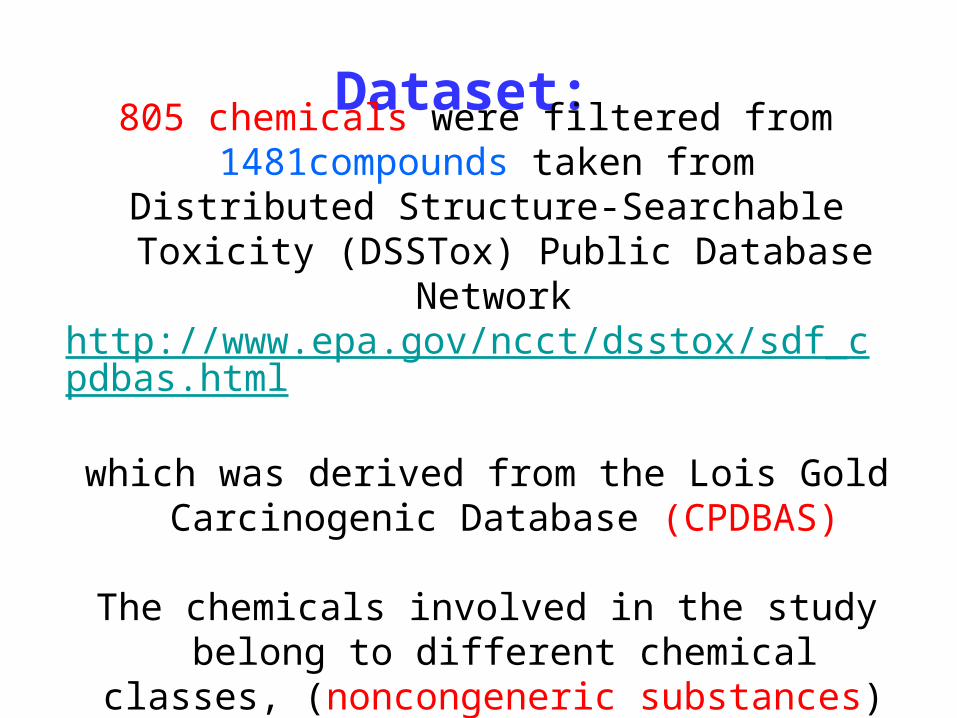
Dataset: 805 chemicals were filtered from
1481compounds taken fromDistributed Structure-Searchable Toxicity
(DSSTox) Public Database Network http://www.epa.gov/ncct/dsstox/sdf_cpdbas.html
which was derived from the Lois Gold
Carcinogenic Database (CPDBAS)
The chemicals involved in the study belong to different chemical classes, (noncongeneric substances)

Descriptors:
1. 252 MDL descriptors were calculated in program MDL QSAR.
2. Descriptors dataset was reduced to
27 MDL descriptors, using Kohonen map and Principle Component Analisis.
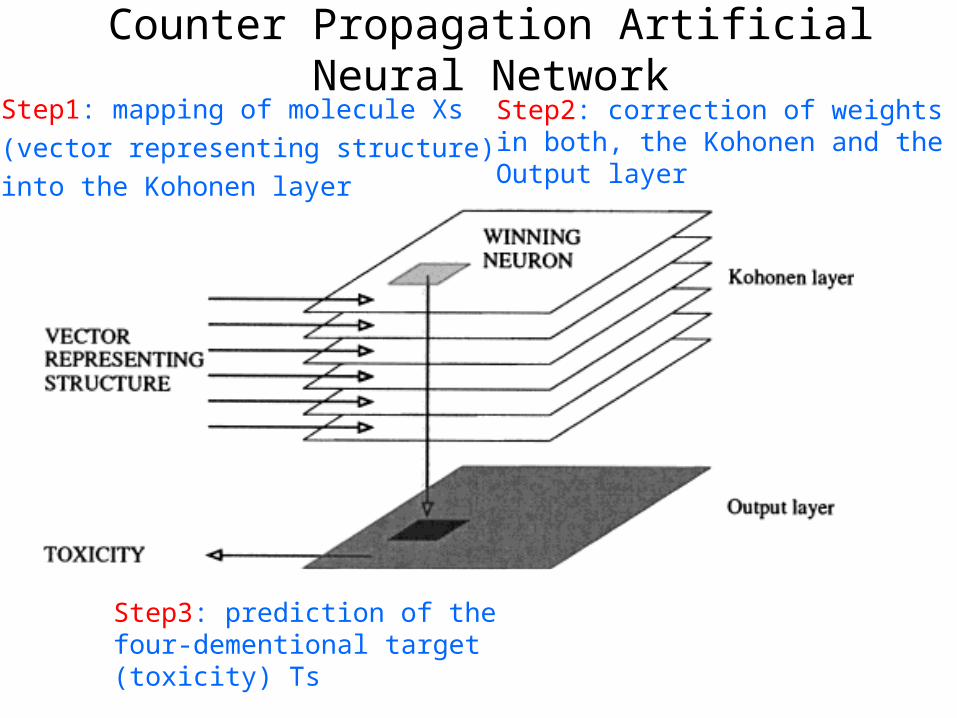
Counter Propagation Artificial Neural NetworkStep1: mapping of molecule Xs (vector representing structure) into the Kohonen layer
Step2: correction of weights in both, the Kohonen and the Output layer
Step3: prediction of the four-dementional target (toxicity) Ts

Investigation of quantitative modelsshows us low results
RESPONCE- TD50mmol1.
Correlation coefficient in the external validation is lower then 0.5
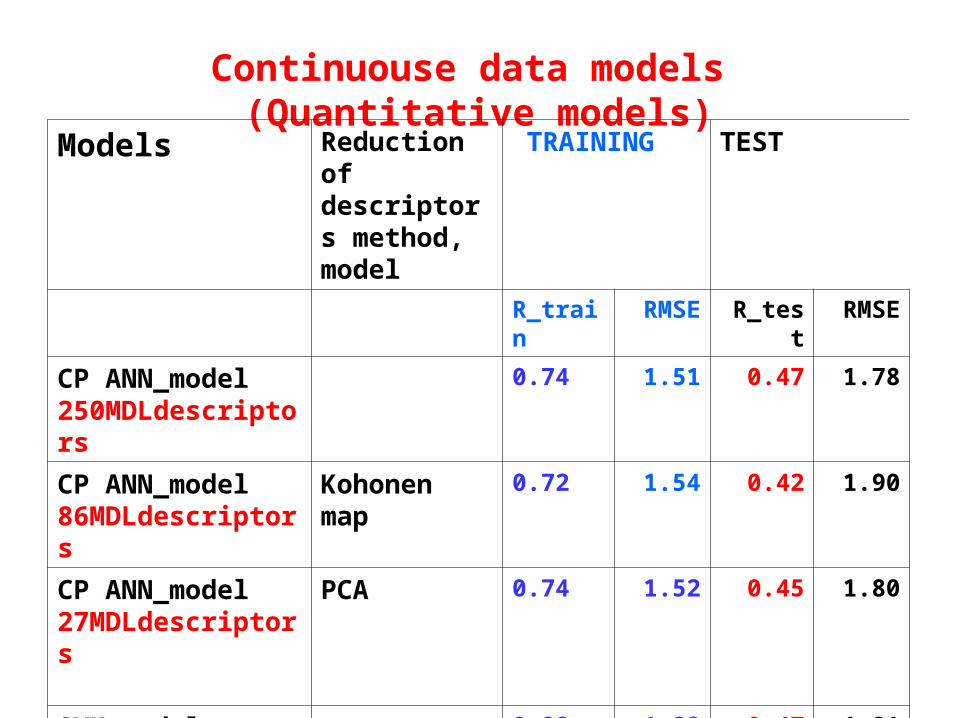
Continuouse data models (Quantitative models)
Models Reduction of descriptors method, model
TRAINING TEST
R_train RMSE R_test RMSE
CP ANN_model250MDLdescriptors
0.74 1.51 0.47 1.78
CP ANN_model86MDLdescriptors
Kohonen map
0.72 1.54 0.42 1.90
CP ANN_model27MDLdescriptors
PCA 0.74 1.52 0.45 1.80
SVM_model(Thomas Ferrary)86MDLdescriptors
0.82 1.23 0.47 1.81

Investigation of categorical modelsshows us satisfactory results
YES/NO principe
RESPONCE:P-positive-active
NP-not positive-inactive
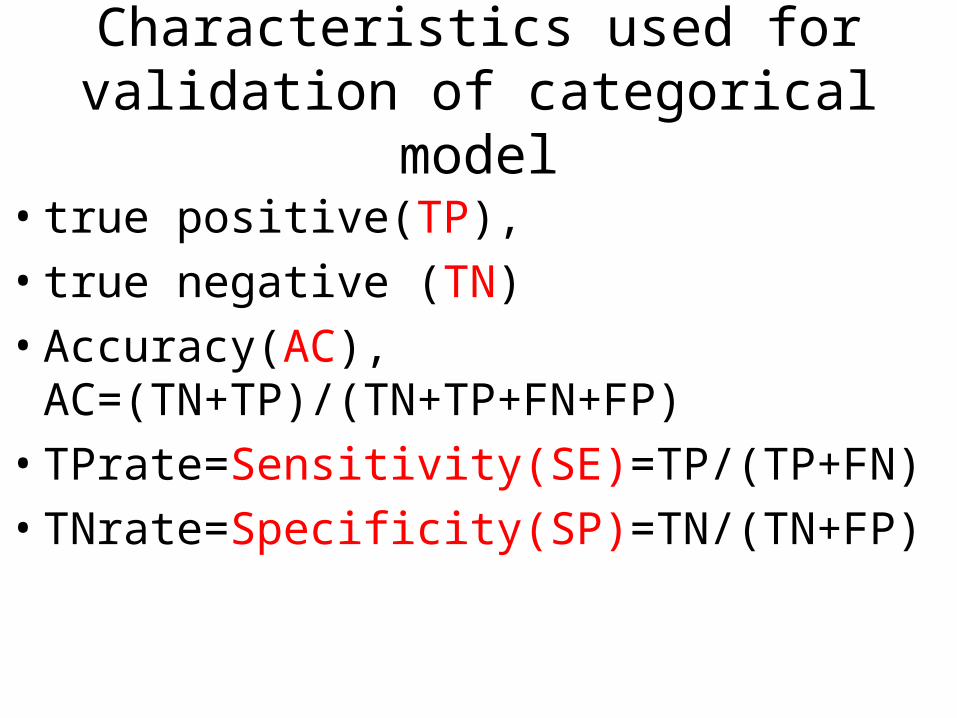
Characteristics used for validation of categorical model
• true positive(TP), • true negative (TN)• Accuracy(AC),
AC=(TN+TP)/(TN+TP+FN+FP)• TPrate=Sensitivity(SE)=TP/(TP+FN)• TNrate=Specificity(SP)=TN/(TN+FP)
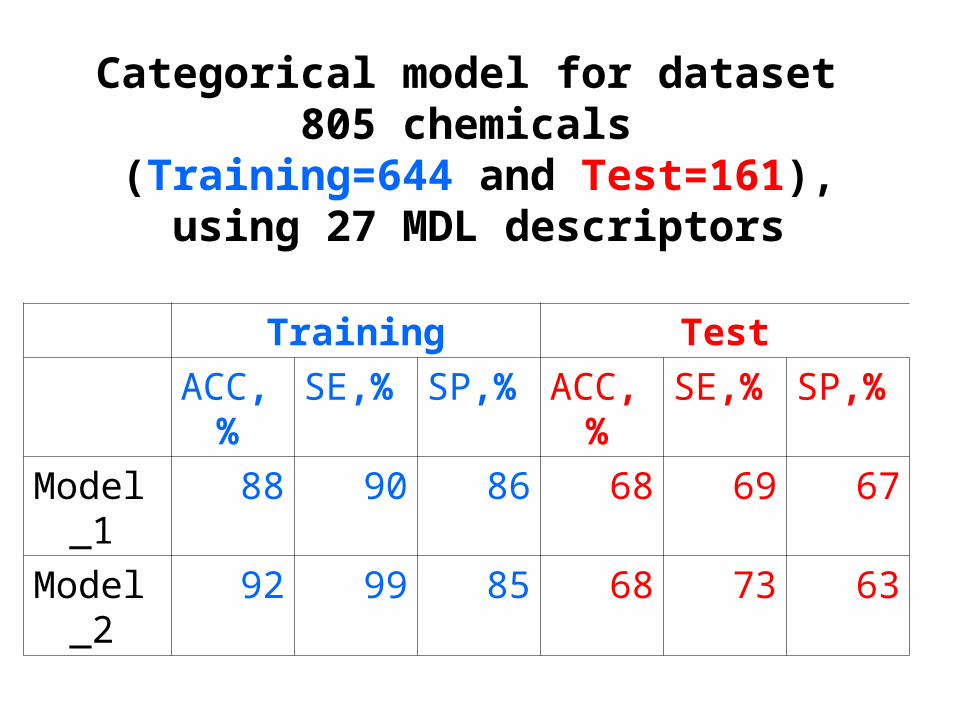
Categorical model for dataset 805 chemicals
(Training=644 and Test=161), using 27 MDL descriptors
Training Test
ACC,%
SE,% SP,% ACC,%
SE,% SP,%
Model_1
88 90 86 68 69 67
Model_2
92 99 85 68 73 63
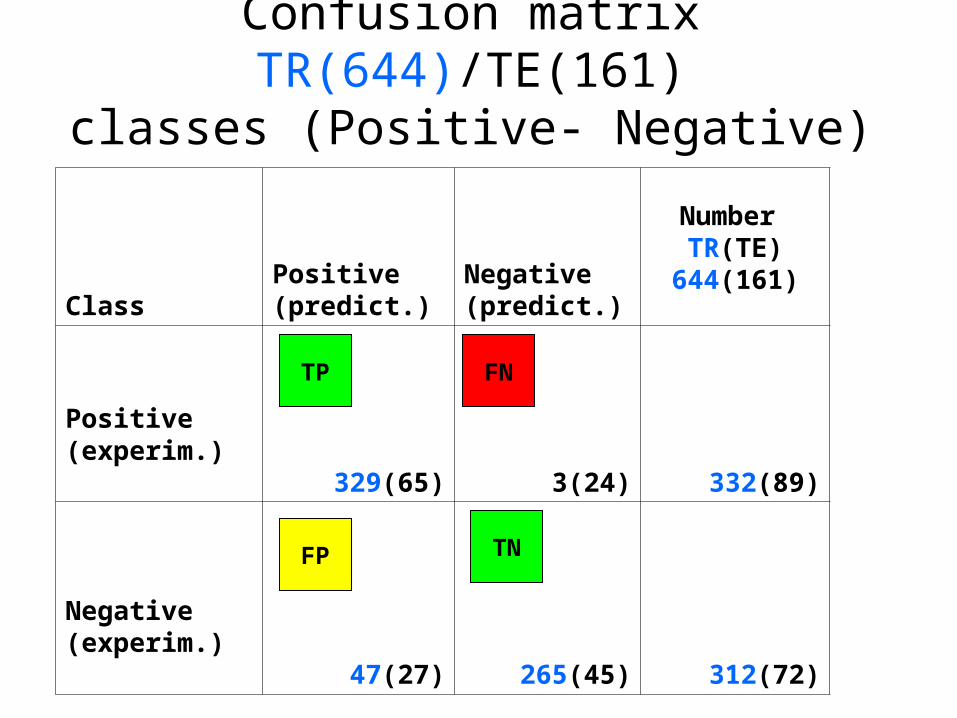
Confusion matrix TR(644)/TE(161)classes (Positive- Negative)
ClassPositive(predict.)
Negative(predict.)
Number TR(TE)
644(161)
Positive (experim.)
329(65) 3(24) 332(89)
Negative(experim.)
47(27) 265(45) 312(72)
FP
FNTP
TN

How we find optimal model, using threshold
Threshold for SE_SP_Accuracy for test set
0
0.2
0.4
0.6
0.8
1
1.2
0 0.2 0.4 0.6 0.8 1 1.2
Threshold
SE
_SP
_Acc
ura
cy
SE
SP
ACC
Threshold=0.45
Accuracy=0.68
SE=0.73
SP=0.63

Changing of threshold allows us to get models with different statistical performances.
Tr SE SP ACC0.05 0.91 0.15 0.57
0.1 0.83 0.36 0.62
0.15 0.8 0.47 0.65
0.2 0.79 0.47 0.65
0.25 0.79 0.47 0.65
0.3 0.79 0.53 0.67
0.35 0.78 0.57 0.68
0.4 0.73 0.6 0.67
0.45 0.73 0.63 0.68
0.5 0.65 0.63 0.64
0.55 0.62 0.72 0.66
0.6 0.62 0.74 0.67
0.65 0.6 0.76 0.67
0.7 0.58 0.76 0.66
0.75 0.54 0.78 0.65
0.8 0.52 0.79 0.64
0.85 0.45 0.83 0.62
0.9 0.31 0.89 0.57
0.95 0.24 0.93 0.55
1 0 1 0.45
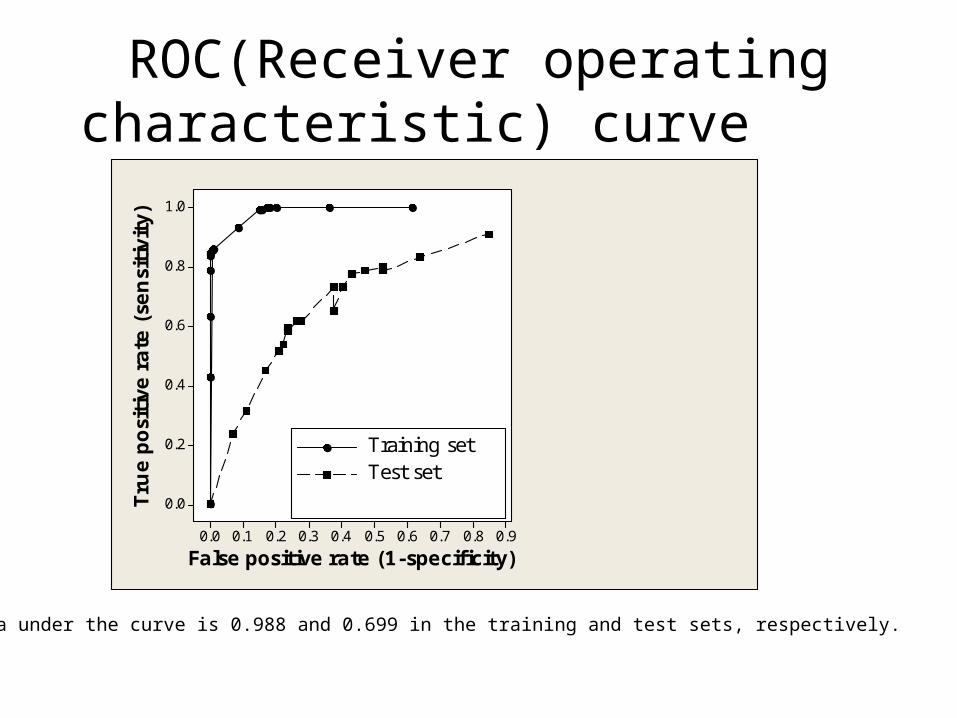
ROC(Receiver operating characteristic) curve
Training set
Test set
0.90.80.70.60.50.40.30.20.10.0
1.0
0.8
0.6
0.4
0.2
0.0
False positive rate (1-specificity)
Tru
e p
osi
tive
rate
(se
nsi
tivi
ty)
Training setTest set
The area under the curve is 0.988 and 0.699 in the training and test sets, respectively.
How requrements of REACH reflect development of models
• To focus model to high sensitivity in prediction of carcinogenicity
• From regulatory perspective, the higher sensitivity in predicting carcinogens is more desirable than high specificity
• Sensitivity- percentage of correct predictions of carcinogens
• Specificity- percentage of correct predictions of non-carcinogens
Conclusion• 1.We have bult the carcinogenicity models in
accordance with 5 OECD principles principle of validation
• 2. We have got satisfactory results for categorical models with accuracy 68% which is good for carcinogenicity as it meet the level of uncertanty of test data.
• 3. The goal of our future investigation will be dedicated to research of relationship between results of carcinogenicity tests and presence of Genotoxic, non Genotoxic alerts using TOX TREE program.
Acknowledgements
The financial support of the European Union through CAESAR project (SSPI-022674) as well as of the Slovenian Ministry of Higher Education, Science and Technology (grant P1-017) is gratefully acknowledged.

THANK YOU