Carbon Management Plan 2017 - 2022 · Carbon Management Plan 2017 - 2022 . DBKL Carbon Management...
40
DBKL Carbon Management Plan Page | 1 Dewan Bandaraya Kuala Lumpur Carbon Management Plan 2017 - 2022
Transcript of Carbon Management Plan 2017 - 2022 · Carbon Management Plan 2017 - 2022 . DBKL Carbon Management...

DBKL Carbon Management Plan
Page | 1
Dewan Bandaraya Kuala Lumpur
Carbon Management Plan
2017 - 2022

DBKL Carbon Management Plan
Page | 2
Kuala Lumpur has ambitious plans for growth and
development as set out in the Kuala Lumpur Structure Plan
2020, which contains the goal to transform Kuala Lumpur
into a world-class city by 2020. The four principal
constituents of a world-class city are a world-class working
environment, a world-class living environment, a world-class
business environment and a world-class governance.
We have taken several significant steps towards attaining that goal. In
recognition of this, we have attained membership of the C40 Cities Climate
Leadership Group C40, a network of the world's megacities committed to
addressing climate change. In addition, we are currently developing the
Kuala Lumpur Low Carbon Society Blueprint 2030, which will provide a
roadmap for the city to reduce its emissions by 2030.
As the local authority guiding such developments, we believe it is important
to lead by example. Through this plan, we are making a commitment to
reduce emissions arising from our own operations – from the building
energy and transport fuel we use in carrying out our activities.
We are proud to be taking an active role in the fight against climate change
and we are making it a key priority within our own municipality. This
demonstrates we are contributing to the commitments Malaysia has made
at the world conventions on climate change, the United Nations Framework
Convention on Climate Change (UNFCC). We are proud to communicate our
plan that commits us to reducing emissions by 20% by 2022 (against a
2015 baseline).
YBhg. Datuk Seri Hj. Mhd. Amin Nordin bin Abd. Aziz
Mayor, Kuala Lumpur
Foreword from the Mayor

DBKL Carbon Management Plan
Page | 3
Foreword from the Carbon Trust
Cutting carbon emissions as part of the fight against
climate change should be a key priority for local and
city governments around the world. The need to bring
down carbon emissions to prevent global temperature
increasing by more than two degrees over pre-
industrial averages is now urgent. Local government
action is a key enabler of this, as municipalities hold
many planning, housing, community engagement,
taxation and transport powers. Taking action in these areas is necessary
to bring about a successful and prosperous low carbon transition. A clear
mitigation strategy for the municipal estate and operations is a vital first
step - it helps to save money on energy, whilst also allowing local
governments to lead by example in reducing the risk of dangerous climate
change.
Dewan Bandaraya Kuala Lumpur (DBKL) worked with the Carbon Trust in
2016-17 in order to develop a carbon plan through to 2022. This Carbon
Management Plan commits DBKL to a target of reducing CO2e by
20% between 2017 and 2022, and underpins potential financial
savings to the organisation of around RM76.1m over this time
period.
There are those that can and those that do. Public bodies can contribute
significantly to reducing CO2e emissions. The Carbon Trust is very proud
to support DBKL in their on-going implementation of carbon management
and city climate planning.
Tim Pryce,
Head of Public Sector, The Carbon Trust

DBKL Carbon Management Plan
Page | 4
FOREWORD FROM THE MAYOR ..................................................... 2
FOREWORD FROM THE CARBON TRUST .......................................... 3
1. EXECUTIVE SUMMARY ............................................................. 5
2. CONTEXT ................................................................................. 7
3. CURRENT EMISSIONS .............................................................. 9
4. CARBON REDUCTION TARGET .................................................12
5. ACTIONS TO REDUCE EMISSIONS ...........................................13
6. FINANCE .................................................................................16
7. GOVERNANCE AND MANAGEMENT ..........................................18
8. MONITORING AND REPORTING ..............................................20
9. CLIMATE CHANGE ADAPTATION .............................................22
APPENDIX 1 – CARBON INVENTORY ..............................................24
APPENDIX 2 – PROJECT LIST .........................................................25
APPENDIX 3 – DETAILED PROJECT INFORMATION ........................27
APPENDIX 4 – ASSUMPTIONS .......................................................39
APPENDIX 5 - EMBEDDING CARBON MANAGEMENT .......................40
ACKNOWLEDGEMENTS ...................................................................40

DBKL Carbon Management Plan
Page | 5
1. Executive Summary
Dewan Bandaraya Kuala Lumpur (DBKL) is committed to leading by example and taking
action to reduce the impact its own estate and operations have on the environment.
Climate change is globally recognised as one of the greatest environmental and economic
threats, and DBKL is determined to play a full part in delivering on our collective
responsibility to reduce carbon emissions. Estimates suggest cities are responsible for
producing 75% of carbon dioxide emissions. Kuala Lumpur is part of the network of the
world’s leading cities, The C40 Cities Climate Leadership Group, which is committed to
addressing this impact cities have. As part of that, DBKL is creating a Blueprint for
reducing Kuala Lumpur’s emissions by 2030. The Kuala Lumpur Low Carbon Society
Blueprint 2030 sets out how the city of KL will reduce its carbon emissions by 70% by
2030.
Leading by example, this Carbon Management Plan provides DBKL’s vision for managing
and reducing emissions arising from its own activities between 2017 and 2022. DBKL has
committed to reducing its emissions by 20% by 2022, against 2015 levels. This amounts to
a decrease in cumulative emissions of 134,345 tCO2e1 and a financial saving in energy costs
of RM76.1m over this time period, compared to business as usual. Emissions in 2015
amounted to 120,906 tCO2e.
The inventory of Greenhouse Gas (GHG) emissions has been compiled in accordance with
the World Resources Institute’s globally recognised accounting methodology, the
Greenhouse Gas Protocol (GHG Protocol). Emissions arise from our activities as a result of
the consumption of energy in our buildings, transport and outdoor lighting. The cost of these
activities has been calculated to be approximately RM51m (excluding taxes and fixed
charges).
This Plan contains the actions and projects DBKL will undertake to reduce these emissions
and associated costs. This will be achieved through a variety of different projects,
including upgrading building and street lighting to LEDs and upgrading building cooling
systems. The cost of implementing the projects in this plan has been estimated at
RM64m, with anticipated financial savings of RM10.6m per annum by 2022. If all the
projects in this plan were implemented, the overall payback period on the capital
investment has been calculated as six years. Due to the long duration of the projects to be
implemented, these projects will yield savings well beyond the lifetime of this plan.
We will embed carbon management into our organisational structures and processes by
setting up a Task Force who will oversee the management and progress of our Carbon
Management Plan. We will undertake a review of our policies to understand how carbon
management can be further integrated into our organisational strategy.
1 CO2e refers to carbon dioxide equivalent. An explanation of the term can be found on page 10.
DBKL Carbon Management Plan
Page | 6
The progress of the Carbon Management Plan will be discussed and reviewed by the
Task Force and project team. Progress will be monitored against the targets set within this
plan and established KPIs at defined intervals.
Tackling carbon emissions within our own estate is the first step in understanding and
identifying the emissions released by the municipality as a whole. This plan provides a
platform from which we can extend our focus and catalyse action on carbon management
across the city.
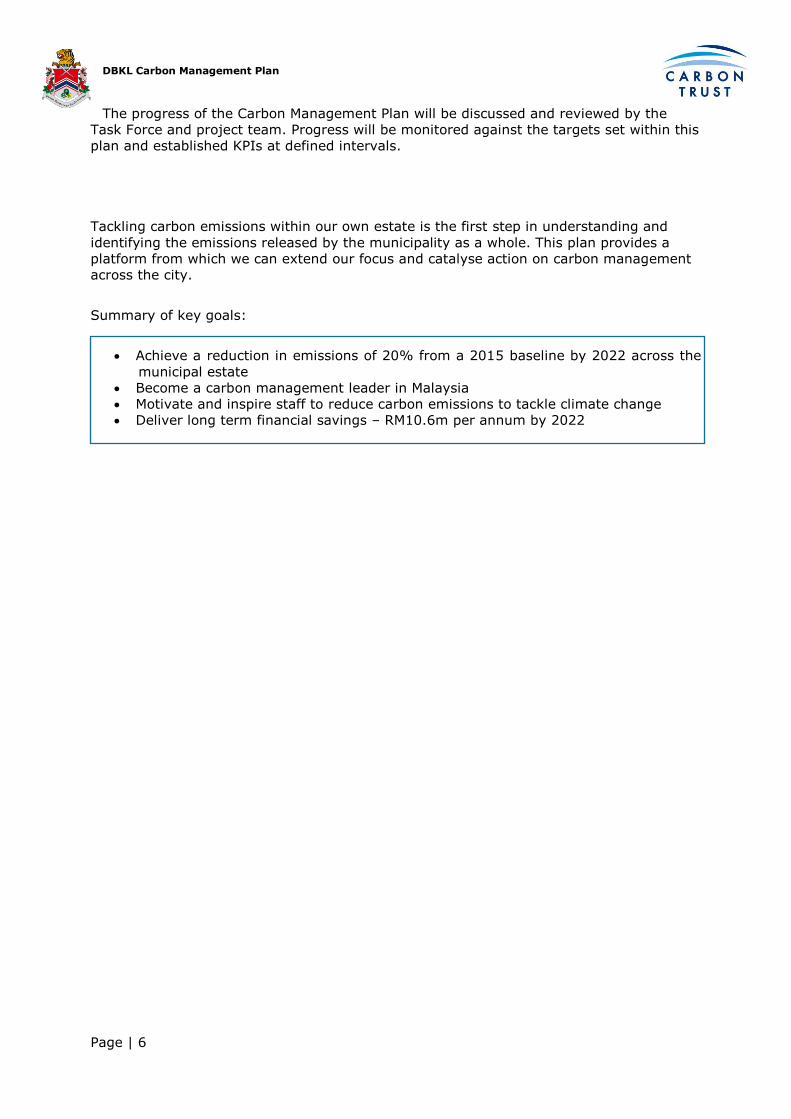
Summary of key goals:
Achieve a reduction in emissions of 20% from a 2015 baseline by 2022 across the
municipal estate
Become a carbon management leader in Malaysia
Motivate and inspire staff to reduce carbon emissions to tackle climate change
Deliver long term financial savings – RM10.6m per annum by 2022

DBKL Carbon Management Plan
Page | 7
2. Context
Why is carbon management important?
Over the past century, human activities have released large amounts of greenhouse gases,
such as carbon dioxide (CO2), into the atmosphere. The majority of these emissions have
come from burning fossil fuels to produce energy, although industrial processes,
deforestation and some agricultural practices also emit greenhouse gases into the
atmosphere. These gases cause more heat to be trapped in the Earth’s atmosphere, leading
to an increase in global temperatures. This is known as global warming.
A warming planet will lead to a variety of mainly adverse effects on natural systems,
causing increases in extreme weather conditions, changing rainfall patterns and rising sea
levels. The latest Intergovernmental Panel on Climate Change (IPCC) report is very clear
that this will affect water supplies, agriculture, power, transport and infrastructure, as well
as human health. Many of these impacts are already becoming apparent. Climate change
is globally recognised as one of the greatest environmental and economic threats, and
Dewan Bandaraya Kuala Lumpur (DBKL) is determined to play a full part in delivering on
our collective responsibility to reduce carbon emissions.
Climate change legislation in Malaysia
Malaysia has specific domestic and international commitments to reducing emissions of
greenhouse gases and improving the deployment rates of low carbon technology.
Additionally, a number of Government Departments and Government funded bodies now
exist with a remit to action reductions and increase deployment rates. Some of the national
policies in place include:
• Malaysia has commited to reducing the country's carbon emission intensity (relative to GDP) by 40% by 2020, compared to 2005 levels. It has also committed to a target of 45% carbon intensity reduction by 2030 (again relative to 2005 levels).
National 40% reduction
target
• An Act passed in 2011 to provide for the establishment and implementation of a special tariff system to catalyse the generation of renewable energy and to provide for related matters.
Renewable Energy Act
• The policy aims to be the key driver in accelerating the national economy and promoting sustainable development in Malaysia by providing green training and education in the country and a conducive environment for Green Technology development, using a variety of finanical mechanisms.
National Green
Technology Policy
• The Plan presents a strategy for the well coordinated and cost-effective implementation of energy efficiency measures in the industrial, commercial and residential sectors, which will lead to reduced energy consumption and economic savings.
National Energy
Efficiency Plan
• Aims to mitigate climate change through wise management of resources, enhanced environmental conservation, more sustainable development and strengthened capacity of institutions to reduce the negative impacts of climate change.
National Policy on Climate Change

DBKL Carbon Management Plan
Page | 8
Drivers for Action for DBKL
Below we set out, in priority order, the main drivers for taking action to reduce our carbon
emissions and energy consumption.
3) Energy Costs
The costs of fossil fuels are volatile and projected to rise. The nature of the Council’s wide ranging activities means it is an intensive user of energy. It is important that the Council minimises these financial liabilities associated with energy costs. Up until recently, electricity and fuel prices have been kept artificially low, due to fuel subsidies and unit
costs and have not reflected the real cost of the production and supply of energy. The situation is now rapidly changing with the removal of the
subsidies. To ensure that maximum budget is available to focus on delivering core services, we must act now to significantly reduce our carbon and energy cost footprint.
2) Legislation & Regulation
Over the last 5 to 10 years a number of Government initiatives and policies have been introduced to tackle rising
greenhouse gas emissions. By using this legislation and mechanisms as an enabler we hope to pave the way towards a low carbon economy.
Towns and cities have a huge impact on carbon emissions, because of the growing number of people who live and work in
them. We are a member of the C40 Cities Climate Leadership Group and are developing the Kuala Lumpur Low Carbon Society Blueprint 2030, which will set out how the city will reduce emissions by 2030. As a public body and major
employer, we are well placed to take the first steps to mitigating our emissions by achieving reductions in our own
buildings, outdoor lighting and transport, and by raising awareness about the potential to reduce emissions in our communities.
1) C40 Membership - The leadership role of the Council

DBKL Carbon Management Plan
Page | 9
3. Current emissions In order to reduce our emissions effectively, it is critical that we understand our
current emissions: where they come from, what is within our sphere of control,
what they amount to and who is responsible for them. This section provides an
inventory of our greenhouse gas emissions in 2015, which forms the baseline
against which future progress will be evaluated.
Scope
The globally accepted carbon accounting standard known as the World Resources Institute
(WRI) Greenhouse Gas (GHG) Protocol defines direct and indirect emissions as follows:
Direct GHG emissions are emissions from sources that are owned or controlled by
the reporting entity.
Indirect GHG emissions are emissions that are a consequence of the activities of
the reporting entity, but occur at sources owned or controlled by another entity.
The GHG Protocol further categorises these direct and indirect emissions into three broad
scopes:
Scope 1: All direct GHG emissions.
Scope 2: Indirect GHG emissions from consumption of purchased electricity, heat or
steam.
Scope 3: Other indirect emissions, such as the extraction and production of
purchased materials and fuels, transport-related activities in vehicles not owned or
controlled by the reporting entity, electricity-related activities (e.g. T&D losses) not
covered in Scope 2, outsourced activities, waste disposal, etc.
In this plan, we are primarily focussing on energy consumption associated with our own
estate (i.e. those areas we have most management control and influence over) but we
recognise that there are other emission sources associated with our operations including:
Water use
Figure 1 Source: Bahtia and Ranganathan, 2004
DBKL Carbon Management Plan
Page | 10
Procurement & supply chain
Waste Disposal
Refrigerant gas fugitive emissions from air-conditioning systems
Staff commuting and business travel
However, data quality for the above emissions sources is not of sufficient quality to
accurately establish the resulting greenhouse gas emissions. Therefore, whilst we recognise
that the above emissions sources can be significant, these are currently outside of the scope
of this plan. Instead, we have focussed on Scope 1 and 2 emissions over which we have
control, and will likely have greater potential for carbon and cost reduction. As our approach
to emissions accounting matures over the coming years, we will look to expand the scope
of our emissions inventory to include the above emission sources.
The emission sources we have included in our baseline are listed below, divided into
Scopes 1 and 2, 3 in accordance with the WRI standards, to enable comparison with other
organisations. The emissions volumes identified are approximate, and limited by the
accuracy and completeness of available data.
Emissions sources included in baseline scope
Scope 1 – includes all direct emissions from sources directly controlled by DBKL (fuels
consumed on site and from owned vehicles)
Fleet transport emissions (e.g. petrol, diesel and biodiesel)
Scope 2 – emissions from purchased electricity, heat or steam produced off site
Electricity consumption in buildings and estates
Electricity consumption of outdoor lighting, including street lighting
Greenhouse gas inventory for 2015
The inventory is a record of our greenhouse gas emissions in the calendar year 2015. Data
quality for this year is considered to be of a reasonable standard and undertakings and
operations at the council in 2015 are considered comparable to current activities.
Greenhouse gas emissions are reported in units of carbon dioxide equivalents (CO2e). This
allows the impact of each different greenhouse gas to be expressed in terms of the amount
of CO2 that would create the same amount of warming, allowing easy comparison of the
impact of different emission types. Throughout this report all greenhouse gas emissions are
given in terms of carbon dioxide equivalent.
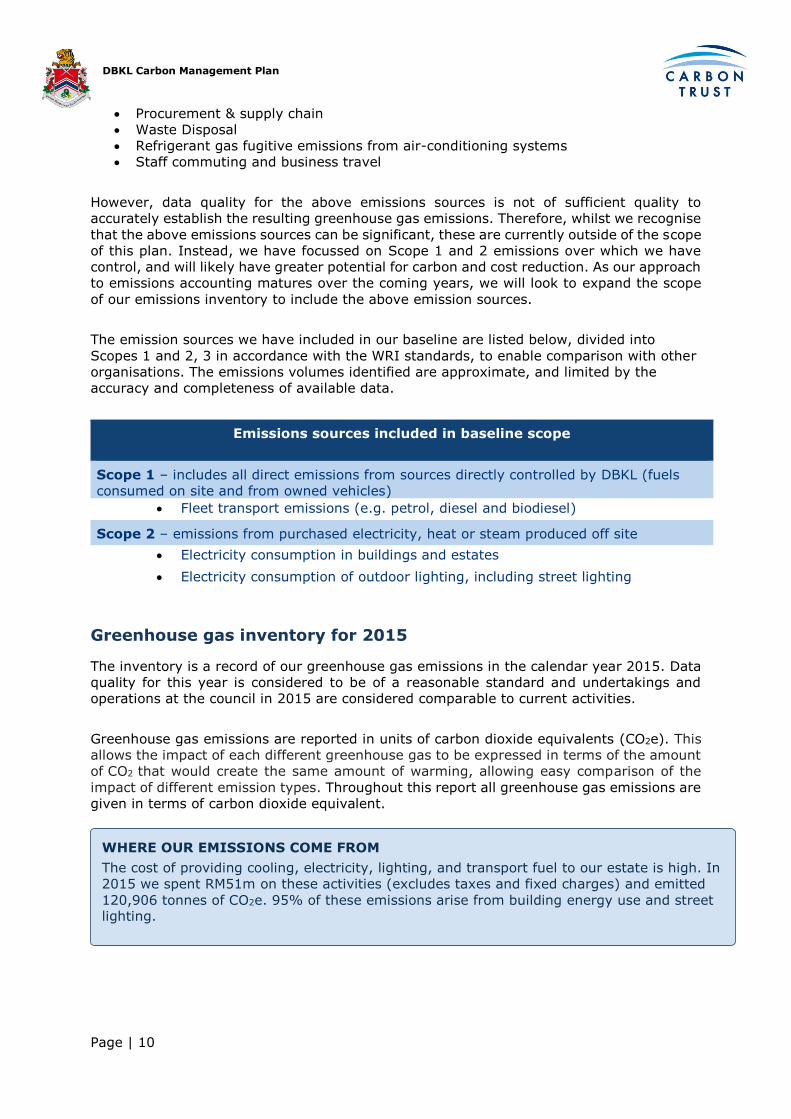
WHERE OUR EMISSIONS COME FROM
The cost of providing cooling, electricity, lighting, and transport fuel to our estate is high. In
2015 we spent RM51m on these activities (excludes taxes and fixed charges) and emitted
120,906 tonnes of CO2e. 95% of these emissions arise from building energy use and street lighting.

DBKL Carbon Management Plan
Page | 11
29.4%
70.6%
0.0%
Breakdown of Transport
Emissions by Vehicle Type
Petrol Vehicles
Diesel Vehicles
Biodiesel Vehicles55%
40%
5%
Buildingenergy
Outdoor &Street
lighting
Transport
Carbon emissions (tCO2e)
Total DBKL emissions in 2015 by
emission type
64%
9%5% 4% 3% 3% 3% 2%
7%
-
5,000
10,000
15,000
20,000
25,000
30,000
35,000
40,000
Publichousing
Tower 1 Sportscentres and
Halls
Tower 3 Tower 2 Libraries Menara PT80
Klinik &Kesihatan
Other
Car
bo
n e
mis
sio
ns
(tC
O2
e)
Emissions from building energy sources in 2015

DBKL Carbon Management Plan
Page | 12
4. Carbon Reduction Target Our vision is to maintain a leading role in local efforts to reduce
the impacts of climate change. To achieve this aim the Council
has set targets that are challenging, yet realistic.
The Value at Stake
The Value at Stake (VAS) shows the cumulative potential savings, or avoidable
costs/carbon emissions, associated with implementing our Carbon
Management Plan and achieving our target against the alternative of doing
nothing, i.e. Business as Usual (BAU) costs.
Achieving a 20% reduction in carbon emissions by 2022, against a 2015
baseline will result in final year emissions savings of 32,903 tCO2e and
cumulative savings of 134,345 tCO2e.
With no action on carbon, annual utility costs for DBKL could increase from
RM51.3m to RM82.2m by 2022 – an increase of approx. RM30.9m. Achieving
a 20% reduction in carbon emissions over the whole five years could result in
cumulative savings of RM76.1m.
The VAS is a useful high level analysis that has been used early in the
development process of producing our Carbon Management Plan to help
support the case for action. It should be noted that project specific details
about savings and costs should be read alongside this analysis. The capital
costs of projects are not included in this analysis (see section 4) and all
assumptions are listed in Appendix 2.
0
20,000
40,000
60,000
80,000
100,000
120,000
140,000
2015 2016 2017 2018 2019 2020 2021 2022
CO
2e E
mis
sio
ns (
tonnes)
Year
Comparision of Carbon Emissions - Business as Usual & Carbon Reduction Scenarios
BAU 20% reduction
RM0
RM10
RM20
RM30
RM40
RM50
RM60
RM70
RM80
RM90
2015 2016 2017 2018 2019 2020 2021 2022
Cost
(RM
)M
illions
Year
Comparision of Carbon Related Costs - Business as Usual & Carbon Reduction Scenarios
BAU Target Reduction 1
We will reduce the carbon
emissions from our activities by 20% by
2022, from a 2015 baseline
of 120,906 tonnes CO2e.
TARGET FOR 2020
Cost savings
Compliance with
legislation
Raised awareness of climate change amongst
staff, stakeholders and the public
Positive community leadership
Contribute towards national targets
BENEFITS OF
ACHIEVING THE TARGET

DBKL Carbon Management Plan
Page | 13
5. Actions to reduce emissions This section of the plan lists and prioritises the opportunities identified for carbon
emissions savings and the sustainable practices that are critical to ensuring DBKL
achieves the five-year reduction target.
To meet the 2022 target, on average 26,869 tCO2e will need to be saved each year once
BAU growth has been taken into account. In order to achieve this reduction, a range of
energy efficiency projects have been identified, targeting the emissions ‘hot spots’ in our
estate.
A summary of common projects to be implemented in different hot spot areas is shown
below. More detailed project information can be found in Appendix 1.
The following table summarises the key costs and savings associated with the projects in
the project list.
Project Category
Capital (RM) Annual energy
cost saving (RM)
Annual
carbon saving (tCO2e)
Average Payback
(yrs)
% project
contributes to meeting
target
LED lighting RM39,363,560 RM5,365,029 16,406 7 49%
Lighting controls
RM10,564,277 RM3,683,814 9,408 3 28%
Air
conditioning upgrade
RM8,406,594 RM834,034 1,486 10 4%
Air conditioning controls
RM - RM288,350 570 <0.1 2%
Ligh
tin
g u
pgr
ade •Location:
•Street lighting
•Menara 1
•Bangsar Sports Complex
•PT80
•TIDI Community Centre
•Public Housing
Ligh
tin
g co
ntr
ols •Location:
•Street lighting
•PT80
•Public Housing
Air
co
nd
itio
nin
g u
pgr
ade •Location:
•Menara 1
•Bangsar Sports Complex
•TIDI Community Centre
Air
co
nd
itio
nin
g co
ntr
ols •Location:
•Menara 1
Oth
er •Description:
•Lift replacement in public housing blocks
•Installation of variable speed drive on pumps in chilled water and air conditioning system at Menara 1
DBKL Carbon Management Plan
Page | 14
Other RM5,541,835 RM457,404 1,067 12 3%
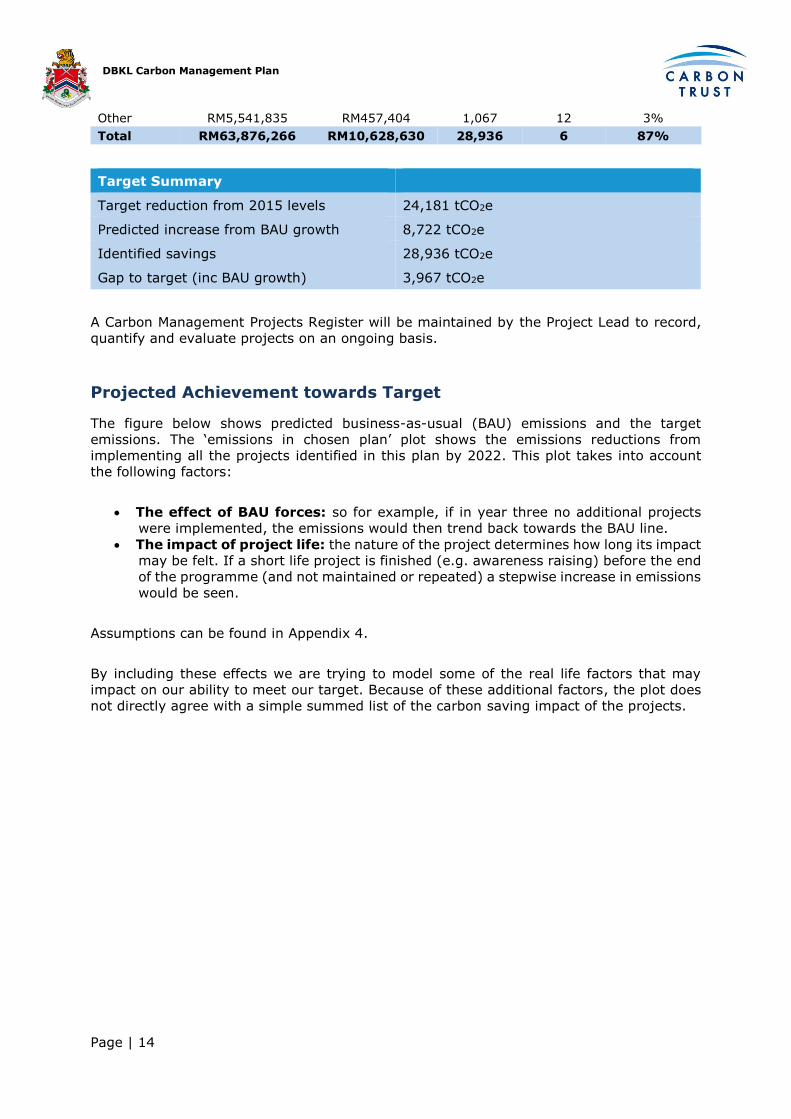
Total RM63,876,266 RM10,628,630 28,936 6 87%
Target Summary
Target reduction from 2015 levels 24,181 tCO2e
Predicted increase from BAU growth 8,722 tCO2e
Identified savings 28,936 tCO2e
Gap to target (inc BAU growth) 3,967 tCO2e
A Carbon Management Projects Register will be maintained by the Project Lead to record,
quantify and evaluate projects on an ongoing basis.
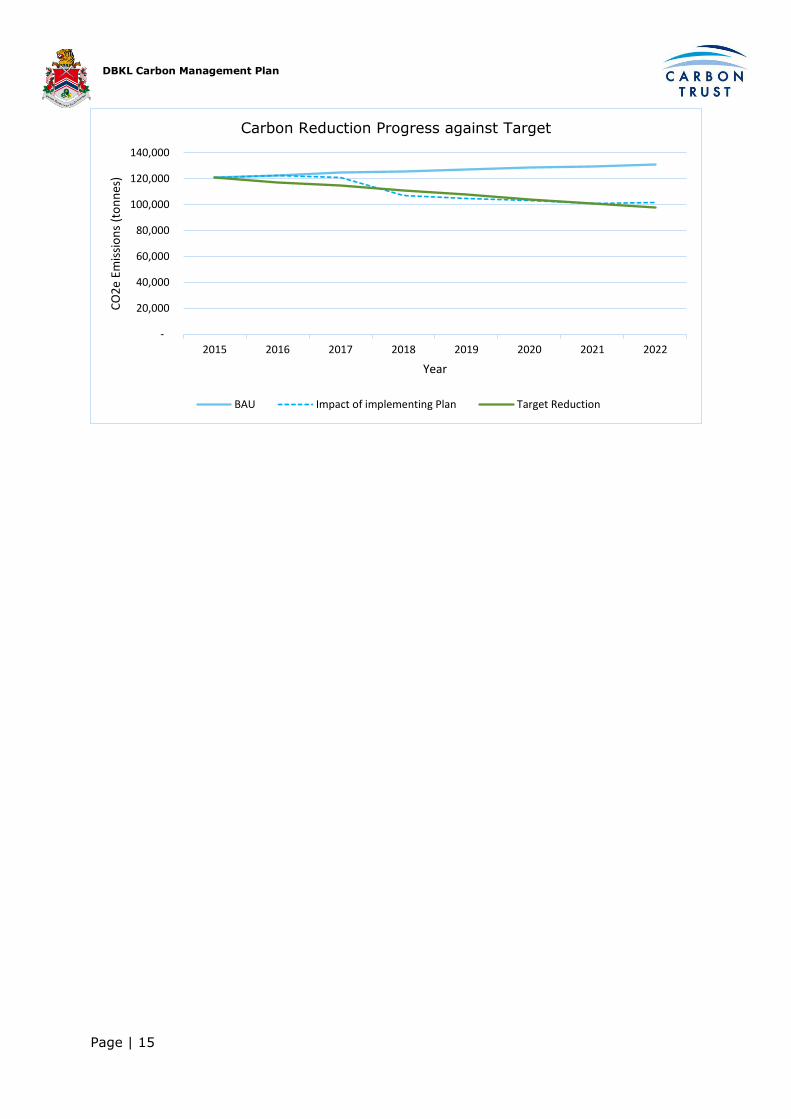
Projected Achievement towards Target
The figure below shows predicted business-as-usual (BAU) emissions and the target
emissions. The ‘emissions in chosen plan’ plot shows the emissions reductions from
implementing all the projects identified in this plan by 2022. This plot takes into account
the following factors:
The effect of BAU forces: so for example, if in year three no additional projects
were implemented, the emissions would then trend back towards the BAU line.
The impact of project life: the nature of the project determines how long its impact
may be felt. If a short life project is finished (e.g. awareness raising) before the end
of the programme (and not maintained or repeated) a stepwise increase in emissions
would be seen.
Assumptions can be found in Appendix 4.
By including these effects we are trying to model some of the real life factors that may
impact on our ability to meet our target. Because of these additional factors, the plot does
not directly agree with a simple summed list of the carbon saving impact of the projects.
DBKL Carbon Management Plan
Page | 15
-
20,000
40,000
60,000
80,000
100,000
120,000
140,000
2015 2016 2017 2018 2019 2020 2021 2022
CO
2e
Emis
sio
ns
(to
nn
es)
Year
Carbon Reduction Progress against Target
BAU Impact of implementing Plan Target Reduction

DBKL Carbon Management Plan
Page | 16
6. Finance
The value at stake shows that over the next five years approximately RM76.1m
could be saved by implementing the plan. However, to achieve these savings,
significant capital investment will be needed. The project register tool that
accompanies this plan contains the calculations to assist with the selection of
carbon reduction projects.
Capital costs
The table below summarises the total capital costs for our Carbon Management Plan by
year. These figures include only the upfront cost of the project and do not include any
operation or maintenance costs.
The cost of implementing the projects in this plan has been estimated at RM63.9m by 2022,
of which RM37.6m has already been allocated to the upgrade of street lighting to LEDs. The
sources to fund the remaining projects have yet to be confirmed.
We believe that our Carbon Management Plan offers a compelling and robust business case
for implementation, taking into account direct cost savings to DBKL, enhanced staff comfort,
improved visitor experience, benefits to DBKL’s corporate reputation, and the vital
leadership role of local government in tackling climate change.
Project Year
2016 2017 2018 2019 2020 2021 2022
Total Costs
RM7,52m RM27,5m RM8,02m RM7,58m RM13,3m RM - RM -
Key Points
To implement the projects defined in this plan will cost RM63.9m.
RM37.6m of funding has already been sourced, with RM26.3m still to be
achieved.
When all these projects are implemented, it will result in an estimated annual
financial savings of RM10.6m. The overall payback period of projects in this plan is 6 years.

DBKL Carbon Management Plan
Page | 17
Plan costs and savings
If all the projects are implemented as planned it would result in estimated reduced energy
costs of RM10.6m per annum by 2022, based on 2017 prices. The overall payback period of
the projects in this plan is approx. 6.0 years. Whilst this payback time is longer than the
lifetime of the plan, it reflects the long duration of a substantial number of projects outlined
in the plan. These projects will provide cost and carbon savings well beyond 2022 and will
payback their capital investment over this longer time period.
It should be noted that the analysis in the tables included in this section does not account
for inflation and all figures are shown at today’s prices. If inflation was included, we would
expect energy cost savings to be higher (as energy prices are increasing at a rate well above
RPI, partly due to the withdrawal of energy subsidies in Malaysia). It should also be noted
that costs for certain projects scheduled for later years may also be higher for the same
reason but this will not be the case for all projects – certain technologies such as LED lighting
continue to reduce in cost.
RM-30
RM-25
RM-20
RM-15
RM-10
RM-5
RM-
RM5
RM10
RM15
2015 2016 2017 2018 2019 2020 2021 2022
Net
Co
st (
RM
mill
ion
s)
Project Cost and Savings
Total Capex for year Energy cost savings for year Total Cash flow for year

DBKL Carbon Management Plan
Page | 18
7. Governance and management Beyond the set of initiatives identified above, it is important that organisational
changes are put in place to maintain a focus on carbon management over time.
This section describes the main activities and changes we will undertake to embed
Carbon Management into our organisation. The Carbon Management Maturity
Matrix (located in Appendix 3) provides a framework for evaluating the extent to
which an organisation has embedded carbon management into its organisational
culture, practices and processes. We will use this framework to guide the progress
we make in this area.
Programme Governance and Task Force
The Carbon Management Programme will be managed by the Task Force. The scope of the
task force is to oversee the implementation of the Carbon Management Plan so that the
carbon reduction target is met within the timescales set out.
This group has a number of key functions specifically related to carbon management;
1. to provide regular, strategic oversight and monitoring of progress towards our target
2. to raise ‘blockages’ to a level where they can be removed e.g. resource issues
3. to ensure that carbon management stays on the high level agenda at DBKL
4. to manage the expectations of key stakeholders and recognise achievements on
carbon reduction
Overall organisation of the programme will fall to the Project Lead and Project Sponsor who
will report project highlights, risks and issues to the Task Force. The Project Sponsor will
have overall responsibility to make sure the progress of the Plan is reported to senior
stakeholders and that the projects within the Plan are delivered. The Project Lead, and
colleagues, will focus on the day to day delivery of the programme projects.
The task force meet on a quarterly basis and include the following representatives from the
following departments:
City Planning (Jabatan Perancangan Bandaraya) Civil Engineering & Urban Transportation (Jabatan Kejuruteraan Awam dan
Pengangkutan Bandar)
Administrative (Jabatan Pentadbiran)
Human Resources (Jabatan Pengurusan Sumber Manusia)
Licensing and vendor management (Jabatan Pelesenan dan Pengurusan Penjaja)
Branch Services (Jabatan Perkhidmatan Kawasan)
Culture, Arts and Sport (Jabatan Kebudayaan, Kesenian dan Sukan)
Housing and Community Development (Jabatan Pengurusan Perumahan dan
Pembangunan Komuniti)
Landscape and Recreation (Jabatan Pembangunan Landskap dan Rekreasi)
Mechanical and Electrical Engineering (Jabatan Kejuruteraan Mekanikal dan
Elektrikal)
Health and Environment (Jabatan Kesihatan dan Alam Sekitar)
Enforcement (Jabatan Penguatkuasaan)
Training Institute (Institut Latihan)
Kuala Lumpur Library (Perpustakaan Kuala Lumpur)
The Task Force is also responsible for implementing the projects contained within this Plan.
The Task force will oversee the activity within the programme which will be overseen by the
Project Lead.
DBKL Carbon Management Plan
Page | 19
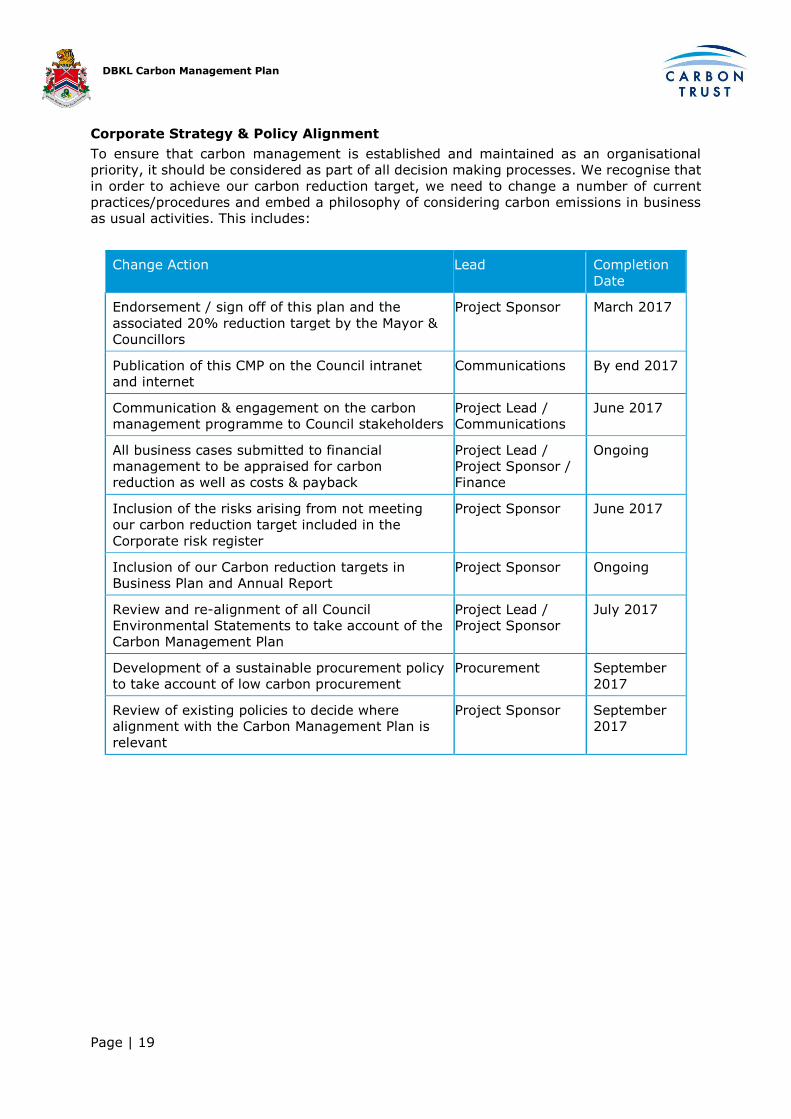
Corporate Strategy & Policy Alignment
To ensure that carbon management is established and maintained as an organisational
priority, it should be considered as part of all decision making processes. We recognise that
in order to achieve our carbon reduction target, we need to change a number of current
practices/procedures and embed a philosophy of considering carbon emissions in business
as usual activities. This includes:
Change Action Lead Completion
Date
Endorsement / sign off of this plan and the
associated 20% reduction target by the Mayor &
Councillors
Project Sponsor March 2017
Publication of this CMP on the Council intranet
and internet
Communications By end 2017
Communication & engagement on the carbon
management programme to Council stakeholders
Project Lead /
Communications
June 2017
All business cases submitted to financial
management to be appraised for carbon
reduction as well as costs & payback
Project Lead /
Project Sponsor /
Finance
Ongoing
Inclusion of the risks arising from not meeting
our carbon reduction target included in the
Corporate risk register
Project Sponsor June 2017
Inclusion of our Carbon reduction targets in
Business Plan and Annual Report
Project Sponsor Ongoing
Review and re-alignment of all Council
Environmental Statements to take account of the
Carbon Management Plan
Project Lead /
Project Sponsor
July 2017
Development of a sustainable procurement policy
to take account of low carbon procurement
Procurement September
2017
Review of existing policies to decide where
alignment with the Carbon Management Plan is
relevant
Project Sponsor September
2017

DBKL Carbon Management Plan
Page | 20
8. Monitoring and Reporting This section describes actions we will take to improve the quality of carbon
emissions data, and how we will report on our progress. Robust data will provide
us with the basis to monitor and report on the results of our actions – enabling us
to realise reputational benefits and to lead by example.
Progress Reporting
The progress of the Carbon Management Plan will be
discussed and reviewed by the Task Force and project team.
Progress will be monitored against the targets set within this
plan and the KPIs set out below.
Fuel and electrical data per month for each Menara
and per year for the overall Council estate
Carbon emissions by year
% increase/decrease carbon emissions by year
Achievement against projected carbon savings
Number of projects completed
Number of projects submitted for approval and
progressing towards completion.
For each meeting of the Task Force, the progress of the Carbon Management Plan as a
whole, as well as individual projects, will be discussed against these KPIs. It is important
that we adopt a way of flagging the projects that are perhaps stalling or not progressing as
expected. We will do this by using the Red, Amber & Green (RAG) risk register.
An annual report of progress towards our carbon management target will be
produced and presented to the Task Force. This report will provide an update on progress
against the KPIs above and embedding actions included in this plan. The report will be
prepared by the Project Lead and signed off by the Project Sponsor. This report will also be
circulated to the wider organisation and uploaded on the DBKL intranet.
Data Management
Effective data management has been a critical element of developing this plan. It underpins
our strategy and target and it will continue to be a critical element as we monitor
implementation progress. Having confidence in our figures, assumptions and data sources
helps ensure that:
High priority areas are targeted: a good understanding of where our emissions
are coming from will allow us to identify high emitters and prioritise projects that
tackle these.
Suitable carbon reduction targets are set: targets should be challenging but
achievable to ensure maximum impact.
Carbon reduction projects are accurately quantified: this will allow us to predict
the impact a project will have on carbon emissions and how effective our portfolio of
projects will be at achieving our target.
Business / investment cases are credible and accurate: accurate estimations
of costs and savings ensures that funds are used in the most cost effective way.

DBKL Carbon Management Plan
Page | 21
The effectiveness of carbon reduction projects can be measured and
demonstrated: this allows progress against target to be tracked and strengthens
the business case for future investment.
Continuity and succession planning is not problematic (data sources /
referencing): all activities should be well documented and referenced to ensure
smooth hand over of responsibility.
Stakeholder Engagement & Communication
To keep carbon management a priority in people’s minds and behaviours, we need to
regularly communicate with stakeholders at various levels. Effective and timely
communications with our staff is an important aspect to delivering our target. We will do
this by rolling out the following change actions.
Control of Risks and Issues
Any member of the Project Board or Project Team may raise an Issue or Risk with the Project
Manager. They should be communicated verbally and confirmed in writing within 24hrs. The
Project Manager will then record the Issue/Risk on the appropriate log and allocate a
reference number. The Logs will be maintained with each Issue or Risk being allocated a
status of either “Acknowledged”, “In Progress” or “Resolved”. All risks are monitored and
updated in a detailed Risk Register maintained by the Project Manager.
Some of the key risks associated with the plan are set out below:
Resources unavailable to achieve actions identified
Reputational risk to authority for not pursuing or meeting carbon reduction targets
Carbon management not seen as a strategic priority at DBKL
Lack of buy-in by staff reduces participation in relevant carbon reduction projects
Potential for a higher than predicted increase in energy demand threatening the
ability to meet the carbon reduction target
Change Action Completion Date
Develop a communications plan July 2017
Publication of the Carbon Management Plan on the Council
intranet and internet
June 2017
Communication & engagement on the Carbon Management Plan
to Council stakeholders
March 2017
Produce a Progress Report on an annual basis for the Project
Board / wider organisation
Annual
Use social media to increase awareness on environmental projects
& benefits with internal & external stakeholders
Ongoing
Regular column in internal newsletter Ongoing
DBKL Carbon Management Plan
Page | 22
9. Climate Change Adaptation This section describes the study that has been undertaken to understand the
potential effects of climate change on Greater Kuala Lumpur. It also outlines the
follow-on actions our municipality is committed to taking.
Objective: Develop an adaptation strategy
While transitioning to low carbon, energy efficient cities is absolutely necessary, it is also
important to consider the climate risks to low carbon urban infrastructure, as well as
potential synergies and conflicts between adaptation and mitigation activities.
In the face of rapid urbanisation, the municipalities of Greater Kuala Lumpur are exposed
to a number of weather and climate-related hazards as a result of a changing climate. A
climate risk scoping study has been undertaken for Kuala Lumpur which has highlighted
that its infrastructure is exposed to a number of weather and climate-related hazards that
include:
1. Heat waves and air pollution (haze). These are exacerbated by the urban heat
island effects of the conurbation. Climate change is likely to increase the frequency
of heat waves and lead to overall higher daytime and night time temperatures.
2. Wind loads. Severe convective storms can be associated with sudden gusts of
wind – there is a risk these could get worse in future.
3. Increase in rainfall intensity and flooding. The intensity (amount of rain falling
in a particular period of time) of heavy rainstorms in Greater KL has been
increasing. Future changes are not entirely certain due to the absence of
convective scale climate modelling for Malaysia, but rainfall intensity is likely to
continue to increase due to climate change as absolute humidity rises.
4. More variable rainfall and drought. Higher temperatures and potential
evaporation, along with population growth, risks significant water stress in Greater KL.
In addition to that, our municipality includes hazard prone areas such as steep slopes,
low-lying terrain, and areas adjacent to rivers. We are also experiencing rapid population
growth. These hazards will produce adverse effects. Air pollution corrodes building façades
and exposed structural elements. Excessive heat conditions increase building energy
usage to keep occupants comfortable. Wind loads can place significant deformation forces
on multi-storied buildings, as well as cause increased use of resources for building
replacement costs. Heavy rain can permeate building materials and cause damage from
the top and sides, while flash floods triggered by the storms can erode foundations and
damage structures and internal assets.
Buildings are often the first line of defence protecting people and assets from
hazard impacts. Resilient infrastructure needs to be robust and functional during hazard
events. The climate risk scoping study that has been conducted for Kuala Lumpur sets out
3 main recommendations for increasing resilience to the impacts of climate change and
adapting to it effectively.
1. Integrate mitigation and adaptation climate policies. A lack of coherence
between the two components of climate action may result not only in shortfall or
failure to achieve projected policy targets, but can also lead to inefficient use of
limited resources as co-benefit and synergies go unharnessed. The lack of
consideration of mitigation in adaptation initiatives could lead to increased
greenhouse gas emissions, while lack of consideration of adaptation in mitigation

DBKL Carbon Management Plan
Page | 23
initiatives could lead to underperformance, due to direct climate hazards, as well as
increase the vulnerability of communities.
2. Create a risk management process. Adaptation and disaster management uses
a significant amount of resource and capacity if it is not adequately prepared for.
By being aware, and preparing for the potential hazards through an iterative and
learning risk management process, the depth and breadth of impacts can be
reduced and some disasters can even be prevented.
3. Ensure local and structural development plans are updated with latest
climate projections. Some of the measures that could build resilience to weather
and climate-related hazards, such as building codes and zoning regulations, may
be less effective if they are not regularly updated to incorporate the latest climate
change projections, as well as other changes including shifts to societal structures,
demography, environmental degradation, poverty and inequality. Policy tools for
urban and country planning should incorporate climate change mitigation, climate
change adaptation and disaster risk management considerations and good practice.
We will use these recommendations to develop an adaptation strategy and implementation
plan. Within our adaptation strategy, we will consider the viability of implementing the
following adaptation measures:
insulation of building facades
higher albedo urban surfaces
raising essential services above flood level
building orientation to minimise solar gain
use of sustainable urban drainage to reduce the impacts of floods and droughts.

DBKL Carbon Management Plan
Page | 24
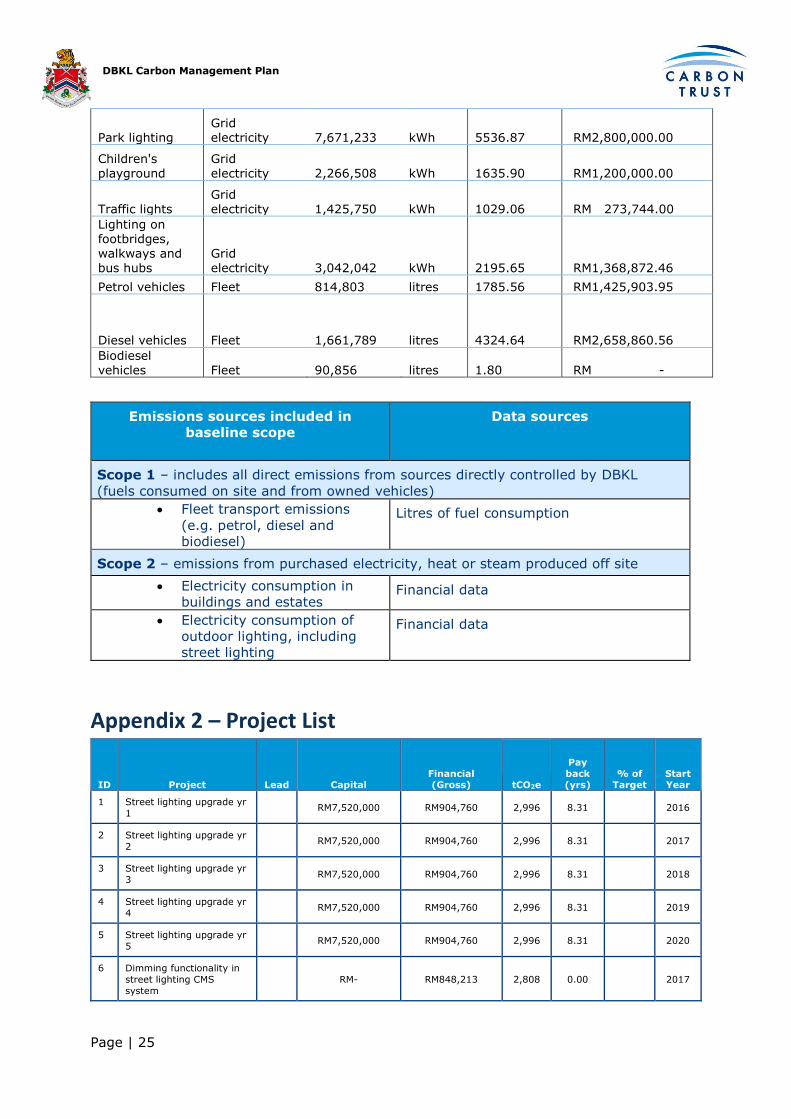
Appendix 1 – Carbon Inventory
Name Emissions source Amount Units
CO2 (tonnes) Cost (RM)
Tower 1 Grid electricity 7,972,162 kWh 5754.07 RM2,909,839.13
Tower 2
Grid
electricity 3,141,273 kWh 2267.28 RM1,146,564.80
Tower 3 Grid electricity 4,166,890 kWh 3007.54 RM1,520,914.74
Menara PT 80 Grid electricity 2,427,437 kWh 1752.05 RM 886,014.63
Branch offices Grid electricity 1,222,623 kWh 882.45 RM 446,257.25
Libraries Grid electricity 2,730,552 kWh 1970.83 RM1,228,706.60
Sports centres, Multipurpose halls and Community Centres
Grid electricity 7,384,698 kWh 5330.05 RM3,323,001.21
JKME Grid electricity 683,350 kWh 493.22 RM 249,422.68
Enforcement
building
Grid
electricity 1,343,209 kWh 969.49 RM 490,271.40
Training
institute (IDB)
Grid
electricity 1,105,175 kWh 797.68 RM 403,388.95
Public housing Type 1 (common areas)
Grid electricity
32,352,727 kWh 23351.23 RM 7,052,894.42
Public housing Type 2 (common areas)
Grid electricity
23,593,387 kWh 17029.00 RM 10,263,123.55
Public Hawker Centres (street food court)
Grid electricity 806,208 kWh 581.90 RM 294,266.07
Indoor food courts/markets
Grid electricity 107,588 kWh 77.65 RM 39,269.75
DBKL Locked Stores
Grid electricity 22,286 kWh 16.09 RM 8,134.25
Klinik & Kesihatan
Grid electricity 2,401,015 kWh 1732.98 RM1,080,420.08
Rest Houses
Grid
electricity 102,078 kWh 73.68 RM 22,252.96
Transport management building
Grid electricity 1,198,131 kWh 864.78 RM 539,140.86
Street lights Grid electricity
51,878,457 kWh 37444.31 RM9,960,663.69
DBKL Carbon Management Plan
Page | 25
Park lighting Grid electricity 7,671,233 kWh 5536.87 RM2,800,000.00
Children's playground
Grid electricity 2,266,508 kWh 1635.90 RM1,200,000.00
Traffic lights Grid electricity 1,425,750 kWh 1029.06 RM 273,744.00
Lighting on footbridges, walkways and bus hubs
Grid electricity 3,042,042 kWh 2195.65 RM1,368,872.46
Petrol vehicles Fleet 814,803 litres 1785.56 RM1,425,903.95
Diesel vehicles Fleet 1,661,789 litres 4324.64 RM2,658,860.56
Biodiesel vehicles Fleet 90,856 litres 1.80 RM -
Emissions sources included in
baseline scope
Data sources
Scope 1 – includes all direct emissions from sources directly controlled by DBKL
(fuels consumed on site and from owned vehicles)
Fleet transport emissions
(e.g. petrol, diesel and
biodiesel)
Litres of fuel consumption
Scope 2 – emissions from purchased electricity, heat or steam produced off site
Electricity consumption in
buildings and estates Financial data
Electricity consumption of
outdoor lighting, including
street lighting
Financial data
Appendix 2 – Project List
ID Project Lead
Capital Financial (Gross) tCO2e
Pay
back (yrs)
% of Target
Start Year
1 Street lighting upgrade yr
1
RM7,520,000 RM904,760 2,996 8.31 2016
2 Street lighting upgrade yr
2
RM7,520,000 RM904,760 2,996 8.31 2017
3 Street lighting upgrade yr
3
RM7,520,000 RM904,760 2,996 8.31 2018
4 Street lighting upgrade yr
4
RM7,520,000 RM904,760 2,996 8.31 2019
5 Street lighting upgrade yr
5
RM7,520,000 RM904,760 2,996 8.31 2020
6 Dimming functionality in
street lighting CMS
system
RM- RM848,213 2,808 0.00 2017
DBKL Carbon Management Plan
Page | 26
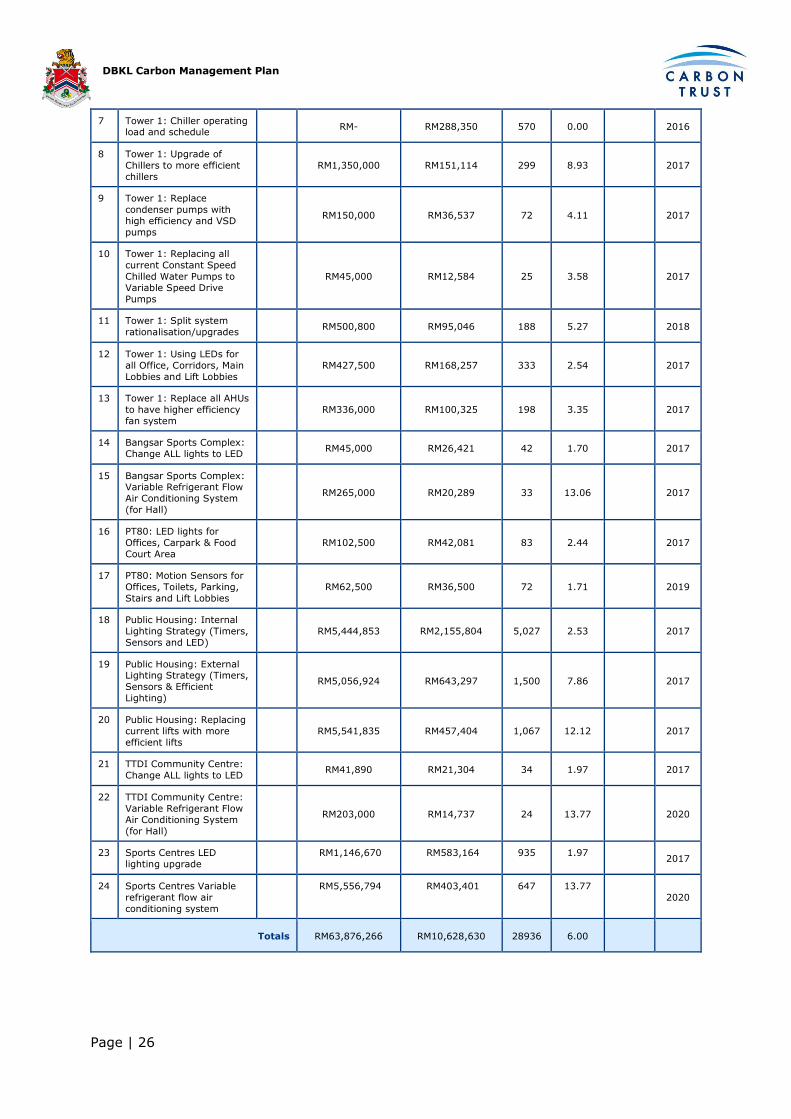
7 Tower 1: Chiller operating load and schedule
RM- RM288,350 570 0.00 2016
8 Tower 1: Upgrade of
Chillers to more efficient
chillers
RM1,350,000 RM151,114 299 8.93 2017
9 Tower 1: Replace
condenser pumps with
high efficiency and VSD
pumps
RM150,000 RM36,537 72 4.11 2017
10 Tower 1: Replacing all
current Constant Speed
Chilled Water Pumps to
Variable Speed Drive
Pumps
RM45,000 RM12,584 25 3.58 2017
11 Tower 1: Split system
rationalisation/upgrades
RM500,800 RM95,046 188 5.27 2018
12 Tower 1: Using LEDs for
all Office, Corridors, Main
Lobbies and Lift Lobbies
RM427,500 RM168,257 333 2.54 2017
13 Tower 1: Replace all AHUs
to have higher efficiency
fan system
RM336,000 RM100,325 198 3.35 2017
14 Bangsar Sports Complex:
Change ALL lights to LED
RM45,000 RM26,421 42 1.70 2017
15 Bangsar Sports Complex: Variable Refrigerant Flow
Air Conditioning System
(for Hall)
RM265,000 RM20,289 33 13.06 2017
16 PT80: LED lights for
Offices, Carpark & Food
Court Area
RM102,500 RM42,081 83 2.44 2017
17 PT80: Motion Sensors for
Offices, Toilets, Parking,
Stairs and Lift Lobbies
RM62,500 RM36,500 72 1.71 2019
18 Public Housing: Internal
Lighting Strategy (Timers,
Sensors and LED)
RM5,444,853 RM2,155,804 5,027 2.53 2017
19 Public Housing: External Lighting Strategy (Timers,
Sensors & Efficient
Lighting)
RM5,056,924 RM643,297 1,500 7.86 2017
20 Public Housing: Replacing
current lifts with more
efficient lifts
RM5,541,835 RM457,404 1,067 12.12 2017
21 TTDI Community Centre:
Change ALL lights to LED
RM41,890 RM21,304 34 1.97 2017
22 TTDI Community Centre:
Variable Refrigerant Flow
Air Conditioning System
(for Hall)
RM203,000 RM14,737 24 13.77 2020
23 Sports Centres LED
lighting upgrade
RM1,146,670 RM583,164 935 1.97 2017
24 Sports Centres Variable
refrigerant flow air
conditioning system
RM5,556,794 RM403,401 647 13.77
2020
Totals RM63,876,266 RM10,628,630 28936 6.00

DBKL Carbon Management Plan
Page | 27
Project Table Key Description
ID Corresponding reference in the Project
Register Tool
Project Project name / description
Lead Lead department for project
Cost - Capital Up front capital expenditure
Cost - Revenue Operating / maintenance expenditure for
running a project
Annual Savings (yr 1) Financial gross Cumulative annual savings
Annual Savings yr 1 – tCO2e Tonnes of Carbon Dioxide savings
Payback years Measures how long a project takes to "pay for
itself
% of Target Percentage reduction towards meeting overall
carbon target
Start year Estimated implementation date of projects
Appendix 3 – Detailed project information
DBKL Menara 1
Recommendation
1
Chiller Operating Load and Schedule
Issue Decreasing the capacity of running chillers and decreasing chiller plant operating time
Rationale The Chiller Plant System of the DBKL Tower 1 represents approximately 40% of the total energy use of the building.
The building management and energy committee of Tower 1 have started decreasing the capacity of chillers, and hours the chillers and the chiller plant as a whole is operating. From November 2016, they have been
operating the Chiller Plant at the following hours & capacity:-
i. Chiller 1 @ 500RT: 7.00am to 5.00pm
ii. Chiller 2 @ 500 RT: not in use
iii. Chiller 3 @ 200 RT: 7.00am to 5.00pm
By decreasing the both the total chiller plant capacity as well as the hours at which it runs, the total amount of energy used is significantly decreased
by an approximate 10%.
Benefits Energy, carbon emissions and cost savings
Risks Dissatisfied occupants are a risk that may need mitigating
Next Steps Monitoring occupant feedback over a few months, and then make the
necessary adjustments to the
profile and possibly, capacity
Representative Facility Manager
Target Date Implemented in November 2016

DBKL Carbon Management Plan
Page | 28
Cost Savings (RM/yr)
RM 288,350.00
CO2e Savings (tonnes/yr)
553.00
Energy Savings (kWh/yr)
790,000.00
Capital RM 0
Payback 0
Recommendation 2 Upgrade of Chillers to more efficient chillers
Issue Increasing the efficiency of the current chiller from COP 4.2 to 5.5
Rationale As noted from 'Recommendation 1' above, the Chiller Plant uses a large
portion of the energy within the
DBKL Tower 1 building. Chillers use the bulk of this energy, therefore,
by increasing the efficiency of the
Chillers from a COP of 4.2 to 5.5, an approximate 5% of the total energy consumption can be saved.
In addition, the last time the entire mechanical system was refurbished was in 1998; 19 years ago, and
therefore, the replacement of the chiller plant is likely necessary within
the next few years- provide the
budget is obtained.
Benefits Using the same cooling load/capacity, energy savings can be achieved
Risks Lack of budget
Next Steps DBKL to ensure specification of efficiency for Chiller Plant Replacement
Representative Energy Committee & Facility Management Team
Target Date Implemented with Chiller Plant Replacement- 2017/2018
Cost Savings (RM/yr) RM 151,114.38
CO2e Savings (tonnes/yr)
289.81
Energy Savings
(kWh/yr)
414,012.00
Capital RM 1,350,000.00
Payback 8.93
Recommendation 3
Replace condenser pumps with high efficiency and VSD pumps
Issue Replace with higher efficiency VSD Condenser Pumps
Rationale As mentioned in recommendation 2 above, the entire HVAC system has not had an upgrade since 19 years ago, therefore, there is a need to replace the entire equipment of Tower 1 within the near future.
As part of the HVAC system refurbishment, IEN propose higher efficiency variable speed controls on the condenser pumps, to ensure pump is
running at the optimal speed, as opposed to a constant speed, as it is now
DBKL Carbon Management Plan
Page | 29
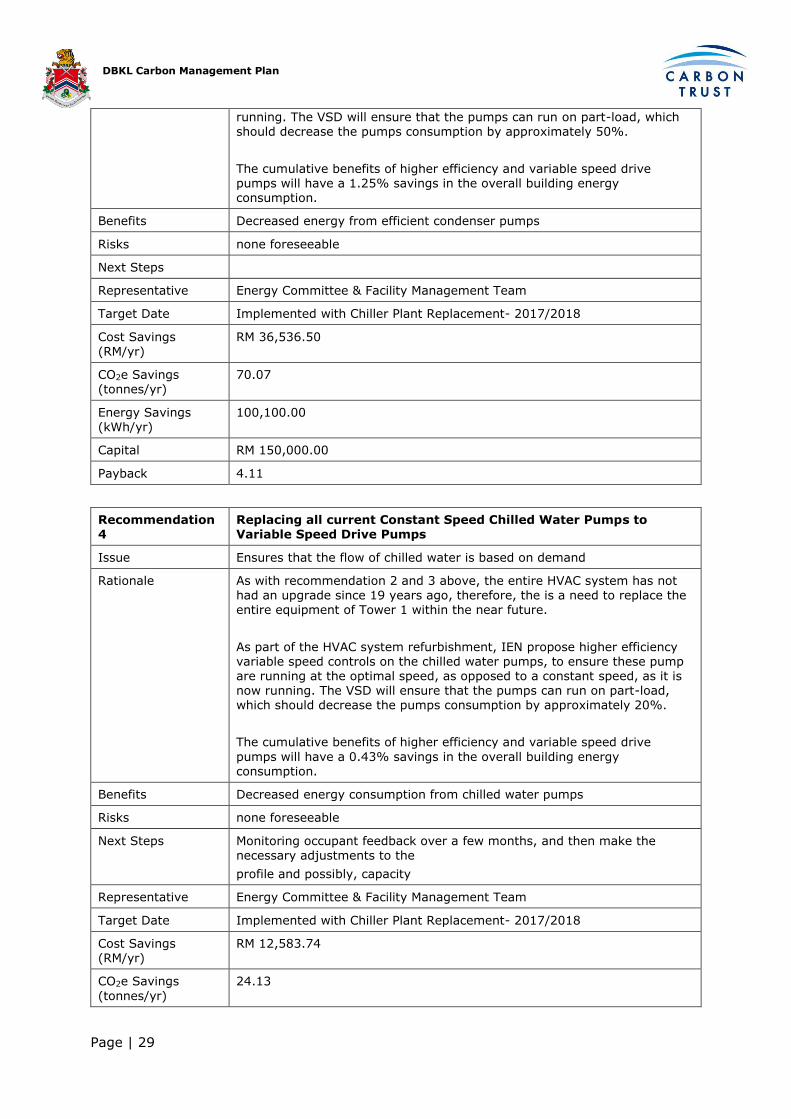
running. The VSD will ensure that the pumps can run on part-load, which should decrease the pumps consumption by approximately 50%.
The cumulative benefits of higher efficiency and variable speed drive pumps will have a 1.25% savings in the overall building energy consumption.
Benefits Decreased energy from efficient condenser pumps
Risks none foreseeable
Next Steps
Representative Energy Committee & Facility Management Team
Target Date Implemented with Chiller Plant Replacement- 2017/2018
Cost Savings (RM/yr)
RM 36,536.50
CO2e Savings (tonnes/yr)
70.07
Energy Savings (kWh/yr)
100,100.00
Capital RM 150,000.00
Payback 4.11
Recommendation 4
Replacing all current Constant Speed Chilled Water Pumps to Variable Speed Drive Pumps
Issue Ensures that the flow of chilled water is based on demand
Rationale As with recommendation 2 and 3 above, the entire HVAC system has not
had an upgrade since 19 years ago, therefore, the is a need to replace the entire equipment of Tower 1 within the near future.
As part of the HVAC system refurbishment, IEN propose higher efficiency variable speed controls on the chilled water pumps, to ensure these pump are running at the optimal speed, as opposed to a constant speed, as it is now running. The VSD will ensure that the pumps can run on part-load, which should decrease the pumps consumption by approximately 20%.
The cumulative benefits of higher efficiency and variable speed drive
pumps will have a 0.43% savings in the overall building energy consumption.
Benefits Decreased energy consumption from chilled water pumps
Risks none foreseeable
Next Steps Monitoring occupant feedback over a few months, and then make the necessary adjustments to the
profile and possibly, capacity
Representative Energy Committee & Facility Management Team
Target Date Implemented with Chiller Plant Replacement- 2017/2018
Cost Savings (RM/yr)
RM 12,583.74
CO2e Savings
(tonnes/yr)
24.13
DBKL Carbon Management Plan
Page | 30
Energy Savings (kWh/yr)
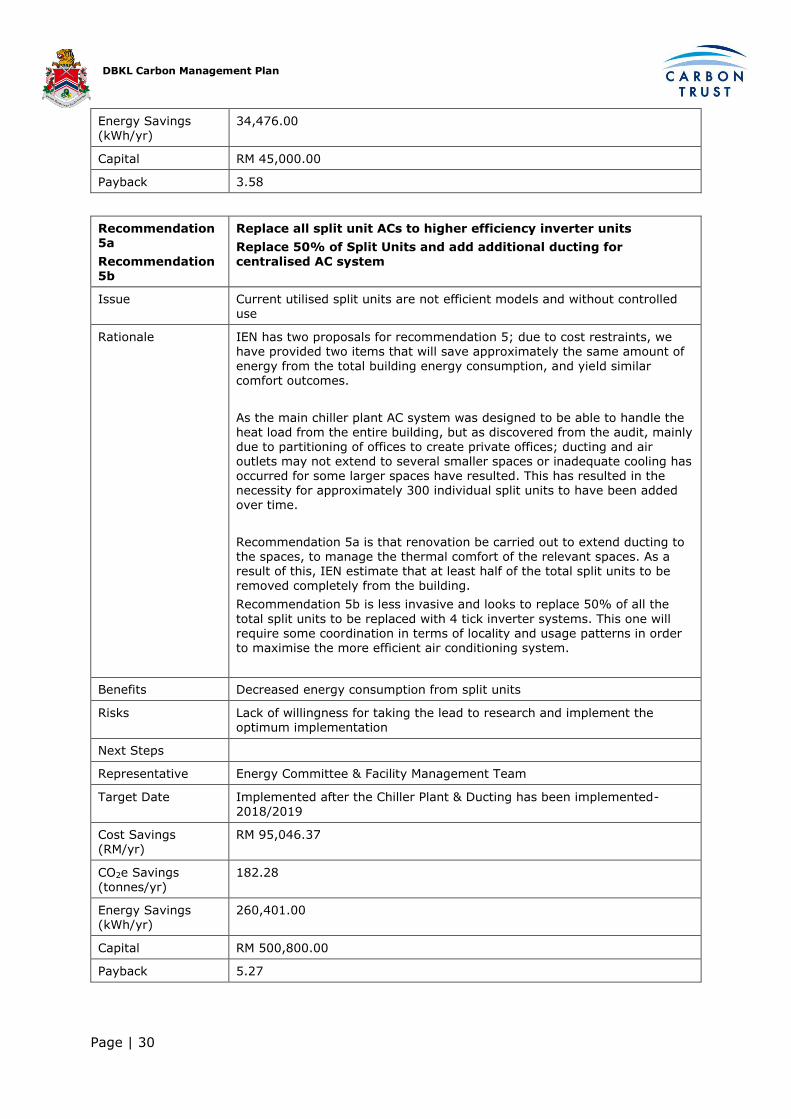
34,476.00
Capital RM 45,000.00
Payback 3.58
Recommendation 5a
Recommendation 5b
Replace all split unit ACs to higher efficiency inverter units
Replace 50% of Split Units and add additional ducting for centralised AC system
Issue Current utilised split units are not efficient models and without controlled use
Rationale IEN has two proposals for recommendation 5; due to cost restraints, we have provided two items that will save approximately the same amount of
energy from the total building energy consumption, and yield similar comfort outcomes.
As the main chiller plant AC system was designed to be able to handle the heat load from the entire building, but as discovered from the audit, mainly due to partitioning of offices to create private offices; ducting and air outlets may not extend to several smaller spaces or inadequate cooling has occurred for some larger spaces have resulted. This has resulted in the necessity for approximately 300 individual split units to have been added over time.
Recommendation 5a is that renovation be carried out to extend ducting to the spaces, to manage the thermal comfort of the relevant spaces. As a result of this, IEN estimate that at least half of the total split units to be removed completely from the building.
Recommendation 5b is less invasive and looks to replace 50% of all the
total split units to be replaced with 4 tick inverter systems. This one will require some coordination in terms of locality and usage patterns in order to maximise the more efficient air conditioning system.
Benefits Decreased energy consumption from split units
Risks Lack of willingness for taking the lead to research and implement the optimum implementation
Next Steps
Representative Energy Committee & Facility Management Team
Target Date Implemented after the Chiller Plant & Ducting has been implemented-2018/2019
Cost Savings (RM/yr)
RM 95,046.37
CO2e Savings (tonnes/yr)
182.28
Energy Savings (kWh/yr)
260,401.00
Capital RM 500,800.00
Payback 5.27

DBKL Carbon Management Plan
Page | 31
Recommendation 6
Using LEDs for all Office, Corridors, Main Lobbies and Lift Lobbies
Issue Efficient lighting selection
Rationale Current T8 and CFL fluorescent lighting is used for indoor lighting, and as lighting works out to approximately to 17% of the total energy use of the Tower 1. Therefore, improving the efficiency of lights, particularly in areas of higher usage and larger area, could greatly decrease the total energy
use from lighting.
The proposal would be for all office, corridors, main lobby area and lift lobbies to have the current fluorescent lights be replaced by LED lights; this will decrease the energy consumption by approximately 5.8% of the total building energy consumption.
This will result in a decrease of energy consumption for lighting, as well as decrease the frequency of replacement for fixtures, as the life of LED lamps are longer. All lighting can be replaced over a timeframe, as and when replacement is required. This in order not for any wastage of lights (resources) to occur immediately.
Ongoing replacement of lights throughout 2017 to 2019 as part of the building management strategy will ensure energy reduction from electric lighting.
Benefits Decreased energy consumption by lighting fixtures & longer life span;
ensuring cost savings
Risks Implementation will need to be planned out very thoroughly, as areas involved are office areas that are
used throughout the weekday office hour periods
Next Steps
Representative Energy Committee & Facility Management Team
Target Date Implement as part of the building maintenance strategy- purchasing guide for lighting replacement
Cost Savings (RM/yr)
RM 168,256.61
CO2e Savings (tonnes/yr)
322.68
Energy Savings (kWh/yr)
460,977.00
Capital RM 427,500.00
Payback 2.54
Recommendation 7
Replace all AHUs to have higher efficiency fan system
Issue Ensures that the air distribution to served areas are conducted more
efficiently
Rationale Improving the efficiency of new AHU's to 65% fan and 85% motor power (from an assumed 50% fan and 75% motor power efficiency).
Benefits As mentioned in the preceding recommendations, the entire HVAC system has not had an upgrade since 19 years ago, therefore, there is a need to
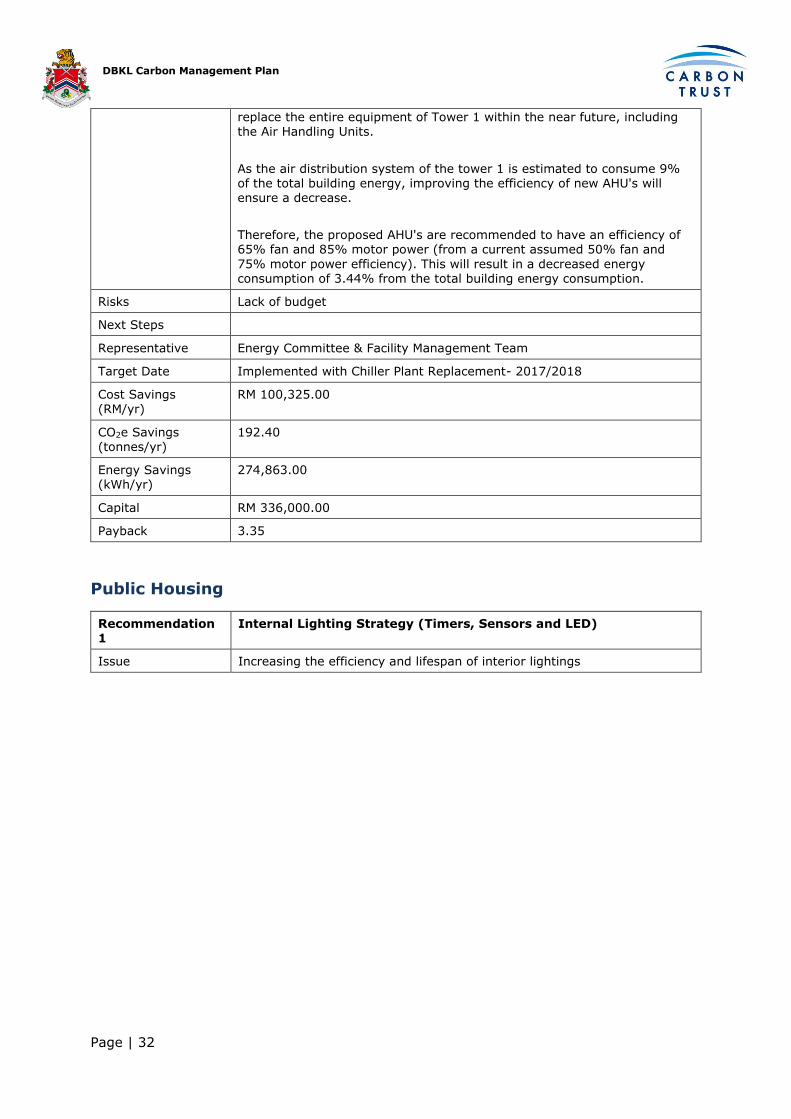
DBKL Carbon Management Plan
Page | 32
replace the entire equipment of Tower 1 within the near future, including the Air Handling Units.
As the air distribution system of the tower 1 is estimated to consume 9% of the total building energy, improving the efficiency of new AHU's will ensure a decrease.
Therefore, the proposed AHU's are recommended to have an efficiency of 65% fan and 85% motor power (from a current assumed 50% fan and
75% motor power efficiency). This will result in a decreased energy consumption of 3.44% from the total building energy consumption.
Risks Lack of budget
Next Steps
Representative Energy Committee & Facility Management Team
Target Date Implemented with Chiller Plant Replacement- 2017/2018
Cost Savings (RM/yr)
RM 100,325.00
CO2e Savings (tonnes/yr)
192.40
Energy Savings (kWh/yr)
274,863.00
Capital RM 336,000.00
Payback 3.35
Public Housing
Recommendation 1
Internal Lighting Strategy (Timers, Sensors and LED)
Issue Increasing the efficiency and lifespan of interior lightings

DBKL Carbon Management Plan
Page | 33
Rationale As interior lighting works out to approximately to 50% of the total energy use of the public housing complex, improving the efficiency of lights could greatly decrease the total energy use from lighting.
Currently, T8 fluorescent lighting is used for the office areas lighting and CFL's for hall lighting- both these areas can change the lights to LED lighting, in order for energy savings. Timers should be installed for all corridor lighting, as opposed to manual
turning on of lights, as this allows for lights to be accidentally left on for longer than necessary. Lastly, corridor and stairwell lighting to be re-circuited to ensure that only 50% of all lights are used throughout the night. The remaining 50% of all lights will be fitted with motion sensors in order for energy savings to be achieved when the particular levels are not utilised.
The proposals above this will decrease the energy consumption by approximately 12% of the total energy consumption. As all lighting is generally replaced every year (even if the lights still work); rolling out this project should be relatively quickly achievable; with remaining public housing estates to be fitted throughout the next several years. *Shifting common area lighting to LED is not an option due to theft of
lights being a common problem in many estates
Benefits Energy savings in lighting from efficient fixtures as well as decreased usage
Risks Limitation in DBKL Policy for lighting replacements
Next Steps Implementation as part of maintenance procedure
Representative Facility Management Team
Target Date Implemented with throughout 2017 to 2020
Cost Savings (RM/yr)
RM2,155,804
CO2e Savings
(tonnes/yr)
5,027
Energy Savings (kWh/yr)
6,965,163
Capital RM5,444,853
Payback 2.53
Recommendation
2
External Lighting Strategy (Timers, Sensors & Efficient Lighting)
Issue Decreasing energy usage and increasing lifespan of exterior lightings
DBKL Carbon Management Plan
Page | 34
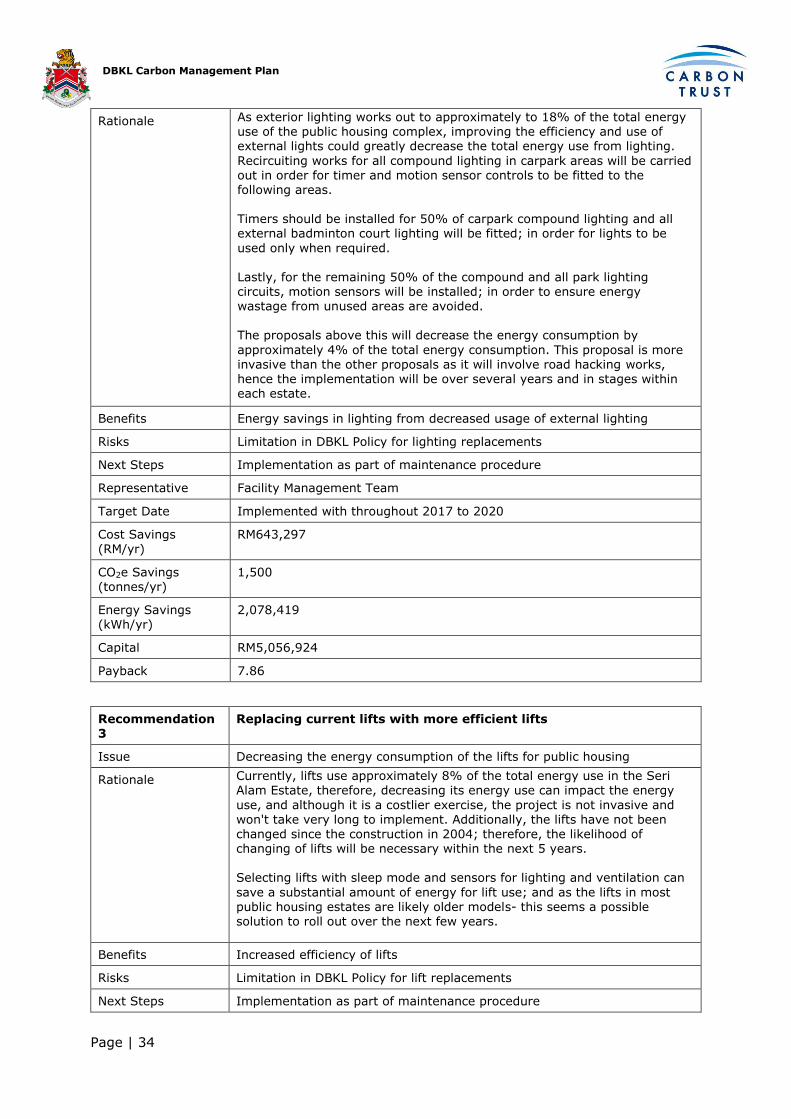
Rationale As exterior lighting works out to approximately to 18% of the total energy use of the public housing complex, improving the efficiency and use of external lights could greatly decrease the total energy use from lighting.
Recircuiting works for all compound lighting in carpark areas will be carried out in order for timer and motion sensor controls to be fitted to the following areas. Timers should be installed for 50% of carpark compound lighting and all external badminton court lighting will be fitted; in order for lights to be
used only when required. Lastly, for the remaining 50% of the compound and all park lighting circuits, motion sensors will be installed; in order to ensure energy wastage from unused areas are avoided. The proposals above this will decrease the energy consumption by
approximately 4% of the total energy consumption. This proposal is more
invasive than the other proposals as it will involve road hacking works, hence the implementation will be over several years and in stages within each estate.
Benefits Energy savings in lighting from decreased usage of external lighting
Risks Limitation in DBKL Policy for lighting replacements
Next Steps Implementation as part of maintenance procedure
Representative Facility Management Team
Target Date Implemented with throughout 2017 to 2020
Cost Savings (RM/yr)
RM643,297
CO2e Savings (tonnes/yr)
1,500
Energy Savings (kWh/yr)
2,078,419
Capital RM5,056,924
Payback 7.86
Recommendation 3
Replacing current lifts with more efficient lifts
Issue Decreasing the energy consumption of the lifts for public housing
Rationale Currently, lifts use approximately 8% of the total energy use in the Seri Alam Estate, therefore, decreasing its energy use can impact the energy
use, and although it is a costlier exercise, the project is not invasive and won't take very long to implement. Additionally, the lifts have not been
changed since the construction in 2004; therefore, the likelihood of changing of lifts will be necessary within the next 5 years. Selecting lifts with sleep mode and sensors for lighting and ventilation can
save a substantial amount of energy for lift use; and as the lifts in most public housing estates are likely older models- this seems a possible solution to roll out over the next few years.
Benefits Increased efficiency of lifts
Risks Limitation in DBKL Policy for lift replacements
Next Steps Implementation as part of maintenance procedure

DBKL Carbon Management Plan
Page | 35
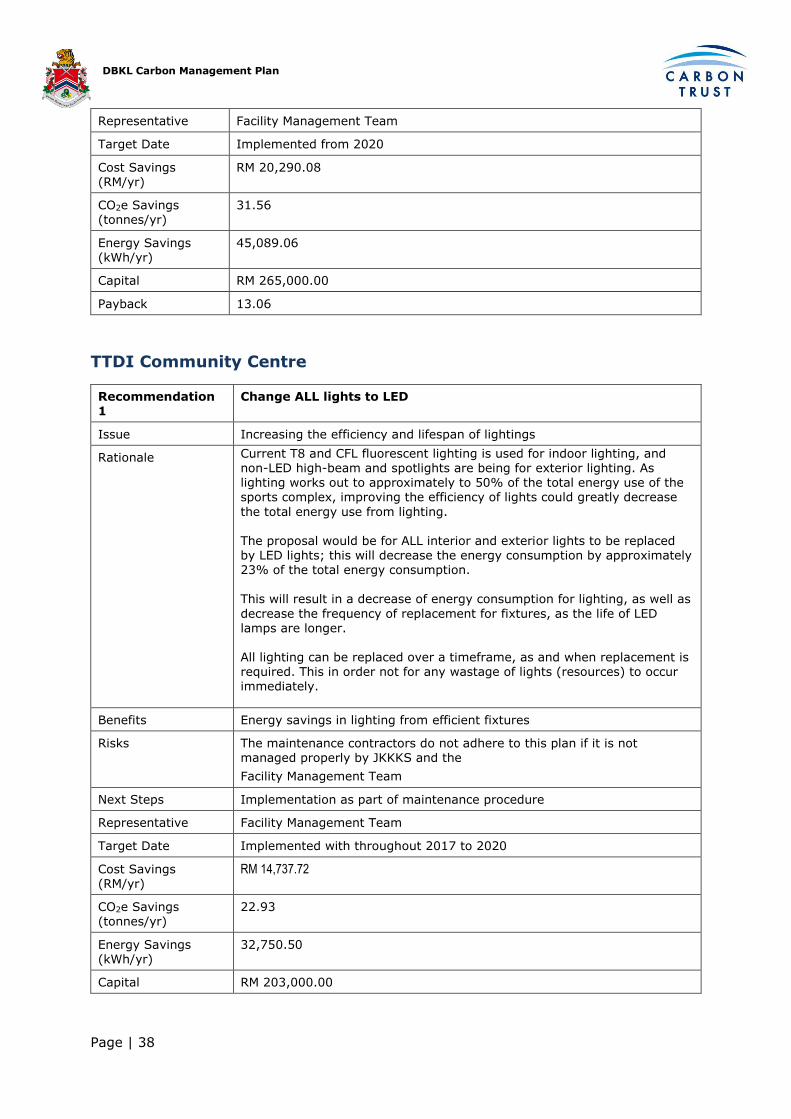
Representative Facility Management Team
Target Date Implemented with throughout 2017 to 2020
Cost Savings (RM/yr)
RM457,404
CO2e Savings (tonnes/yr)
1067
Energy Savings (kWh/yr)
1,477,823
Capital RM5,541,835
Payback 12.12
Menara PT80
Recommendation 1
LED lights for Offices, Carpark & Food Court Area
Issue Increasing the efficiency and lifespan of lightings
Rationale Current T8 and CFL fluorescent lighting is used for indoor lighting, and as lighting works out to approximately to 22% of the total energy use of the sports complex, improving the efficiency of lights could greatly decrease the total energy use from lighting.
The proposal would be for ALL office, carpark and food court area lights to be replaced by LED lights; this will decrease the energy consumption by approximately 5% of the total energy consumption. This will result in a decrease of energy consumption for lighting, as well as
decrease the frequency of replacement for fixtures, as the life of LED
lamps are longer. All lighting can be replaced over a timeframe, as and when replacement is required. This in order not for any wastage of lights (resources) to occur immediately.
Benefits Energy savings in lighting from efficient fixtures
Risks There is no budget for implementing projects with a smaller impact
Next Steps Implementation as part of maintenance procedure
Representative Facility Management Team
Target Date Implemented with throughout 2017 to 2020
Cost Savings (RM/yr)
42,081.22
CO2e Savings (tonnes/yr)
80.70
Energy Savings (kWh/yr)
115,291.00
Capital RM 102,500.00
Payback 2.44

DBKL Carbon Management Plan
Page | 36
Recommendation 2
Motion Sensors for Offices, Toilets, Parking, Stairs and Lift Lobbies
Issue Decreasing energy from lighting of lesser-occupied spaces
Rationale Current there are many areas where circuiting of lighting is not optimally designed, and lights are being left on for areas that are severely underutilised. The addition of re-circuiting certain areas as well as adding motion sensors, can decrease the total energy use from lighting.
The proposal would be for all office, toilets, parking bays, stairs and lift lobby area lights to have motion (or, where appropriate- areas with daylight access such as stairs and lift lobbies to have dual motion and photo sensors) to be fitted. This will decrease the energy consumption by approximately 4% of the total energy consumption of the building. This will result in a decrease of energy consumption for lighting, as well as
decrease the frequency of replacement for fixtures, as the lights will be used less frequently.
Decreasing the energy consumption of major light usage areas, as well as decreasing the frequency of replacement for fixtures, additionally the lifespan of lights will increase through decreased usage.
Benefits Energy savings in lighting from decreased usage of lighting
Risks There is no budget for implementing projects with a smaller impact
Next Steps
Representative Facility Management Team
Target Date Implemented by 2020
Cost Savings (RM/yr)
RM 36,500.00
CO2e Savings
(tonnes/yr)
70.00
Energy Savings (kWh/yr)
100,000.00
Capital RM 62,500.00
Payback 1.71
Bangsar Sports Complex
Recommendation 1
Change ALL lights to LED
Issue Increasing the efficiency and lifespan of lightings
Rationale Current T8 and CFL fluorescent lighting is used for indoor lighting, and
non-LED high-beam and spotlights are being for exterior lighting. As lighting works out to approximately to 50% of the total energy use of the sports complex, improving the efficiency of lights could greatly decrease the total energy use from lighting. The proposal would be for ALL interior and exterior lights to be replaced by LED lights; this will decrease the energy consumption by approximately
23% of the total energy consumption.

DBKL Carbon Management Plan
Page | 37
This will result in a decrease of energy consumption for lighting, as well as decrease the frequency of replacement for fixtures, as the life of LED lamps are longer.
All lighting can be replaced over a timeframe, as and when replacement is required. This in order not for any wastage of lights (resources) to occur immediately.
Benefits Energy savings in lighting from efficient fixtures
Risks The maintenance contractors do not adhere to this plan if it is not managed properly by JKKKS and the
Facility Management Team
Next Steps Implementation as part of maintenance procedure
Representative Facility Management Team
Target Date Implemented with throughout 2017 to 2020
Cost Savings (RM/yr)
RM 26,421.70
CO2e Savings (tonnes/yr)
41.10
Energy Savings (kWh/yr)
58,714.89
Capital RM 45,000.00
Payback 1.70
Recommendation
2
Variable Refrigerant Flow Air Conditioning System (for Hall)
Issue Increasing the efficiency of the AC System
Rationale Air Cooled AC systems are generally not very efficient, and therefore, by replacing the current system with a more efficient system such as a Variable Refrigerant Flow (VRF) system is encouraged.
A VRF system not only has a higher efficiency, but also has better part load performance compared to traditional air-cooled systems. This will result in a decrease of energy consumption for the AC System; as compared to the current from the air-cooled system (with an assumed COP 2.8) to a new VRF system (with a target COP 4.5).
Lastly, the year of installation for the AC System was circa 2006; this means the system likely will need to be changed approximately, by 2025. This means that the possibly of this change to be implemented is possible before 2030, and sufficient funding allocation can be prepared for not only this sports complex, but also other sports complexes to replace the current air cooled system with a VRF system.
Benefits Energy savings from AC System.
Risks Risk of not being implemented- as the target implementation timeframe is between 2020 and 2025
Next Steps Implementation as part of maintenance procedure
DBKL Carbon Management Plan
Page | 38
Representative Facility Management Team
Target Date Implemented from 2020
Cost Savings (RM/yr)
RM 20,290.08
CO2e Savings (tonnes/yr)
31.56
Energy Savings (kWh/yr)
45,089.06
Capital RM 265,000.00
Payback 13.06
TTDI Community Centre
Recommendation 1
Change ALL lights to LED
Issue Increasing the efficiency and lifespan of lightings
Rationale Current T8 and CFL fluorescent lighting is used for indoor lighting, and non-LED high-beam and spotlights are being for exterior lighting. As lighting works out to approximately to 50% of the total energy use of the sports complex, improving the efficiency of lights could greatly decrease
the total energy use from lighting. The proposal would be for ALL interior and exterior lights to be replaced by LED lights; this will decrease the energy consumption by approximately 23% of the total energy consumption.
This will result in a decrease of energy consumption for lighting, as well as
decrease the frequency of replacement for fixtures, as the life of LED lamps are longer. All lighting can be replaced over a timeframe, as and when replacement is required. This in order not for any wastage of lights (resources) to occur immediately.
Benefits Energy savings in lighting from efficient fixtures
Risks The maintenance contractors do not adhere to this plan if it is not managed properly by JKKKS and the
Facility Management Team
Next Steps Implementation as part of maintenance procedure
Representative Facility Management Team
Target Date Implemented with throughout 2017 to 2020
Cost Savings (RM/yr)
RM 14,737.72
CO2e Savings (tonnes/yr)
22.93
Energy Savings (kWh/yr)
32,750.50
Capital RM 203,000.00

DBKL Carbon Management Plan
Page | 39
Payback 13.77
Recommendation 2
Variable Refrigerant Flow Air Conditioning System (for Hall)
Issue Increasing the efficiency of the AC System
Rationale Air Cooled AC systems are generally not very efficient, and therefore, by replacing the current system with a more efficient system such as a Variable Refrigerant Flow (VRF) system is encouraged.
A VRF system not only has a higher efficiency, but also has better part load performance compared to traditional air-cooled systems.
This will result in a decrease of energy consumption for the AC System; as
compared to the current from the air-cooled system (with an assumed COP 2.8) to a new VRF system (with a target COP 4.5).
Lastly, the year of installation for the AC System was circa 2003; this means the system likely will need to be changed approximately, by 2020. This means that the possibly of this change to be implemented is possible before 2030, and sufficient funding allocation can be prepared for not only
this community centre, but also other sports complexes to replace the current air cooled system with a VRF system.
Benefits Energy savings from AC System.
Risks Risk of not being implemented- as the target implementation timeframe is about 2020
Next Steps
Representative Facility Management Team
Target Date Implemented from 2020
Cost Savings
(RM/yr)
RM 14,737.72
CO2e Savings (tonnes/yr)
22.93
Energy Savings (kWh/yr)
32,750.50
Capital RM 203,000.00
Payback 13.77
Remaining Sports Complexes and Community Centres
Due to time limitations it has not been possible to conduct detailed audits of all buildings
managed by JKKS. However, due to the similarities in building design and energy
consumption it has been assumed that similar opportunities will be present across these
buildings and potential energy savings have been scaled up accordingly.
Appendix 4 – Assumptions Key assumptions underlying our financial projections are:
An annual increase in electricity costs of 6% per annum. This is based on the
projected increase to natural gas prices.

DBKL Carbon Management Plan
Page | 40
Diesel and Petrol cost of RM 2.20/l and RM 2.66/l respectively in the baseline year
and an annual increase of 5 % in the following years
BAU consumption annual increase of 1% and a RPI inflation of 3%
Appendix 5 - Embedding Carbon Management
Acknowledgements
Thank you to the British Foreign and Commonwealth Office for supporting this study as
well as IEN Consultants and Sayers and Partners for contributing to it.