Carbon Footprints Rick Munro 0268156 Broderick Nickelberry Jr. 0268152.
14
Carbon Footprints Rick Munro 0268156 Broderick Nickelberry Jr. 0268152
-
Upload
rebecca-wood -
Category
Documents
-
view
214 -
download
0
Transcript of Carbon Footprints Rick Munro 0268156 Broderick Nickelberry Jr. 0268152.

Carbon Footprints
Rick Munro 0268156Broderick Nickelberry Jr. 0268152

About Broderick
Car gets ~36 MPG
Drives ~12,000 miles per year
2,000 sq. foot house
2 people home
Works in town, about 5 miles from home
Leaves TV on at night
2-3 showers per day
Generally waters plants, or uses sprinklers twice a week.
Garbage and recycling is picked up once a week.

About Rick
Car gets ~26 MPG
Drives ~12,000 miles per year
2,200 sq. foot house
3 people home
Unemployed
Extreme heater use in winter, as well as extreme AC use in the summer time
4-5 showers per day
Generally waters plants, or uses sprinklers 3-4 times a week
Garbage and recycling is picked up once a week.

Personal Use of Energy
Broderick
KwH Per Year
11160
KwH Per Month
930
Threms Per Year
960
Threms Per Month
80
Co2 Tons For Electricity
2.9
Co2 Tons For Natural Gas
6.5
Rick
KwH Per Year
9600
KwH Per Month
800
Threms Per Year
1200
Threms Per Month
100
Co2 Tons For Electricity
2.5
Co2 Tons For Natural Gas
8.1
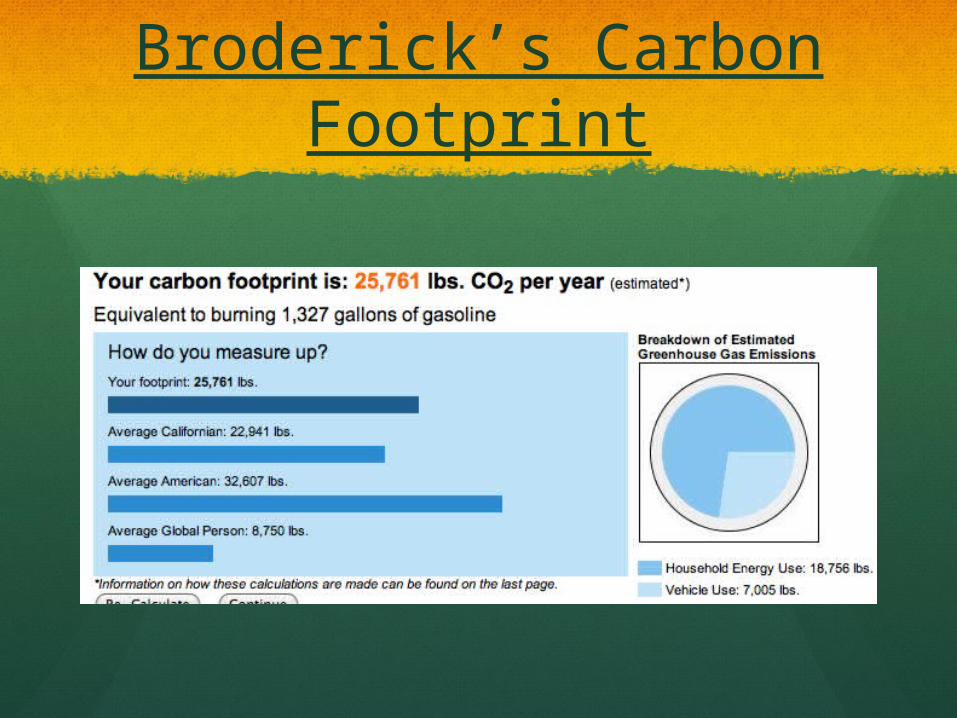
Broderick’s Carbon Footprint

How Does Broderick Compare?
About 300 lbs. higher than most Californians
About 600 lbs. less than most Americans
About 17,000 lbs. more than the average global person

Rick’s Carbon Footprint

How Does Rick Compare?
Greater than 1000 lbs. difference compared to most Californians
About 500 lbs. less than the typical American
Just about quadruples the global person average

Napa’s Emissions
1.2 million metric tons of emissions
5.9 tons per person.
The Global Warming Solutions Act of California was put in place to bring us back to our levels from 20 years ago
Napa ranks in the lower bracket of Bay Area cities in emissions

California Emissions
Carbon Score – 46
Per Capita Carbon Output – 2nd
Carbon Emissions Score – 2nd
California Commercial Energy Consumption Ranking – 1st
California Industrial Energy Consumption Ranking – 3rd
California Residential Energy Consumption Ranking – 2nd
California Transportation Energy Consumption Ranking – 1st
California actually ranks higher in most emission output stats than a lot of countries

U.S.A. Emissions
5,833,381(in thousands) Annual Co2 emissions, which is 19.91% of the the worldwide total, which ranks 2nd behind only China
Worldwide we produce 29,321,302(in thousands) metric tons of Co2 emissions

Small Picture Changes
Turn lights off you don’t need
Turn the TV off
Unplugged unused appliances to avoid the use of vampire energy
Turn off engine is possible, and don’t redline every gear

Big Picture Changes
Don’t just threaten to penalize companies for too much emissions, also offer greater tax levies for meeting really low numbers
Make recycling centers easier to access, and also offer greater rewards for cans, bottles, etc.
Maintaining your car properly will go a long way, making sure your tire pressure is right, your filters are fresh, and not getting rid of your oil too soon.
It’s also key to bring your old oil to the proper oil collection centers

Work Cited
http://www.eredux.com/states/state_detail.php?id=1111
http://www.eredux.com/states/index.php
http://en.wikipedia.org/wiki/List_of_countries_by_carbon_dioxide_emissions
http://test.nctpa.net/index.cfm
Eco calculator that was provided