Carbon Footprinting A Retailer’s Perspective Annie Graham Head of Brand Sustainability,...
37
Carbon Footprinting A Retailer’s Perspective Annie Graham Head of Brand Sustainability, Agriculture & Health
-
Upload
merryl-palmer -
Category
Documents
-
view
216 -
download
0
Transcript of Carbon Footprinting A Retailer’s Perspective Annie Graham Head of Brand Sustainability,...

Carbon Footprinting
A Retailer’s Perspective
Annie GrahamHead of Brand Sustainability, Agriculture & Health
Agenda
Introduction
Background
Process & Results
Expectations
Summary
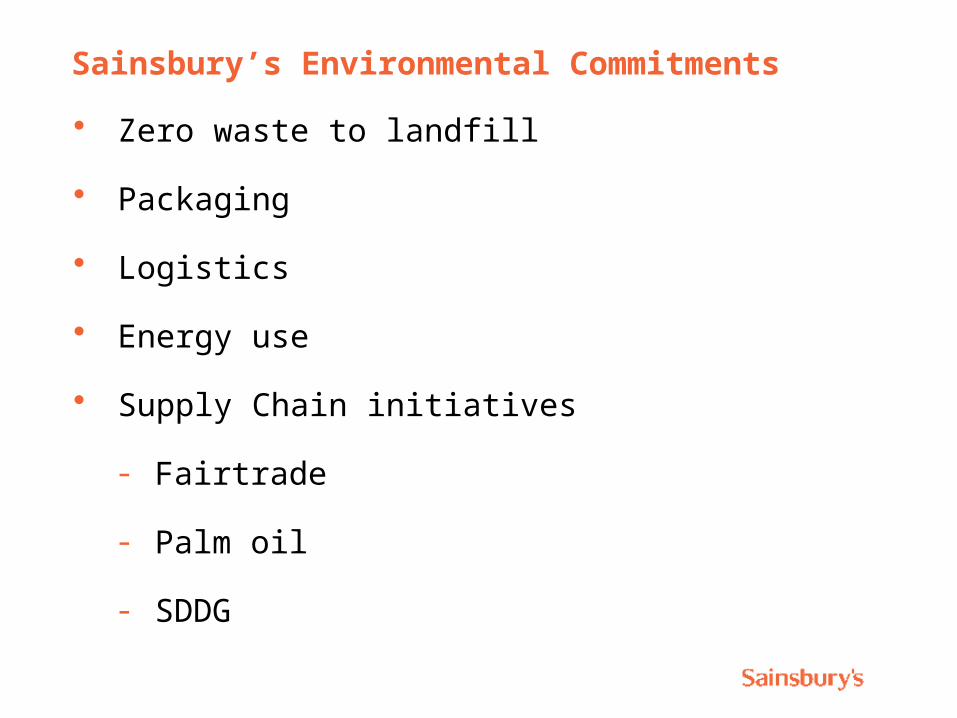
Sainsbury’s Environmental Commitments
Zero waste to landfill
Packaging
Logistics
Energy use
Supply Chain initiatives
- Fairtrade
- Palm oil
- SDDG
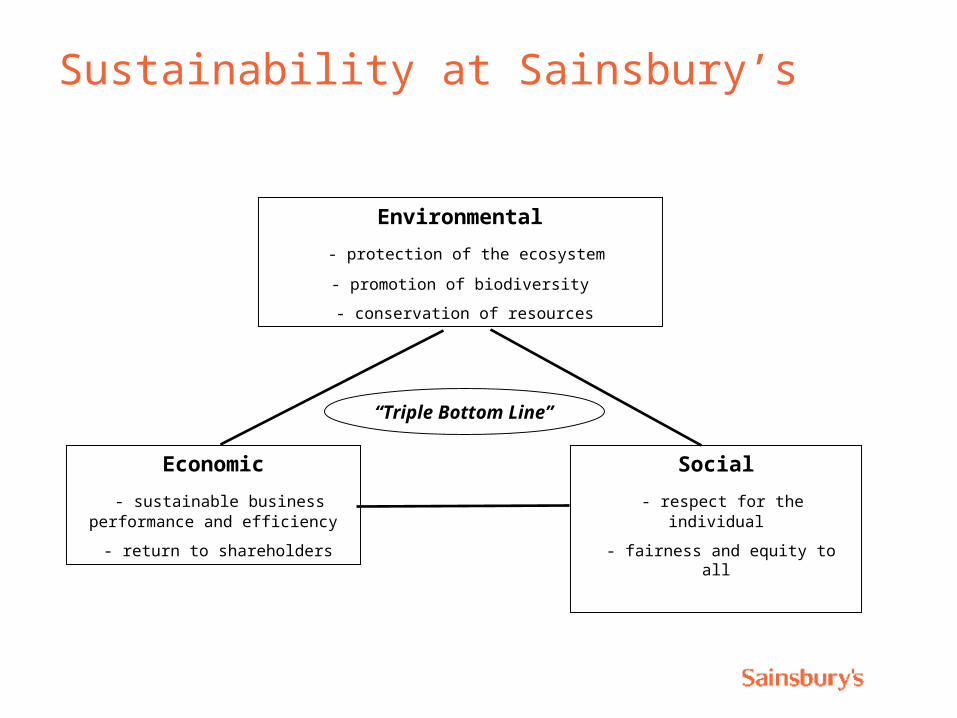
Sustainability at Sainsbury’s
Environmental
- protection of the ecosystem
- promotion of biodiversity
- conservation of resources
Economic
- sustainable business performance and efficiency
- return to shareholders
Social
- respect for the individual
- fairness and equity to all
“Triple Bottom Line”
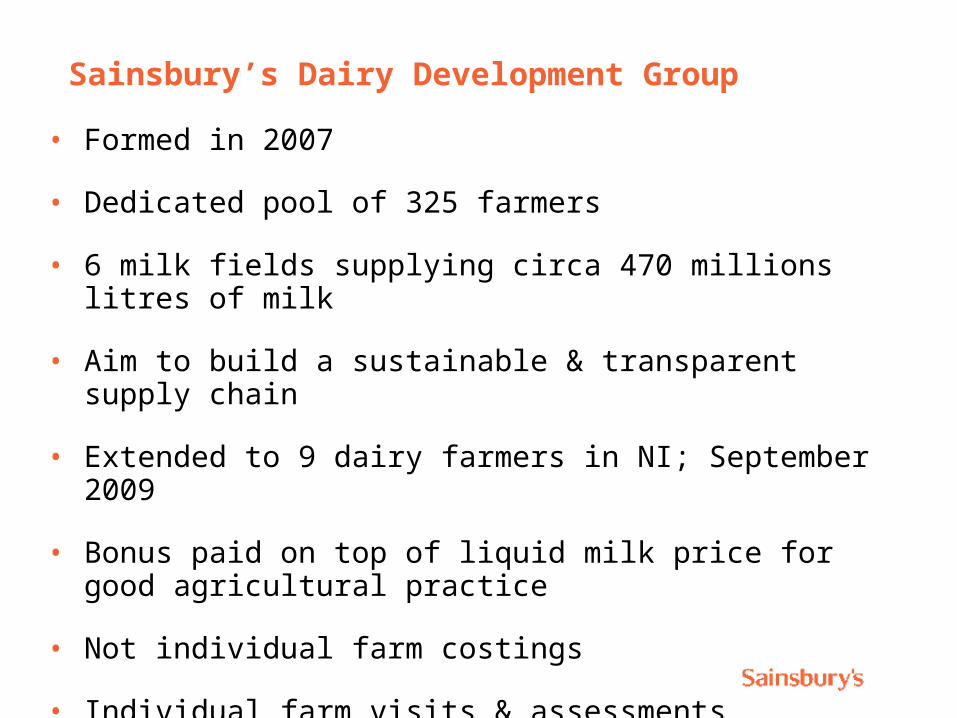
Sainsbury’s Dairy Development Group
• Formed in 2007
• Dedicated pool of 325 farmers
• 6 milk fields supplying circa 470 millions litres of milk
• Aim to build a sustainable & transparent supply chain
• Extended to 9 dairy farmers in NI; September 2009
• Bonus paid on top of liquid milk price for good agricultural practice
• Not individual farm costings
• Individual farm visits & assessments

Sainsbury’s Dairy Development Group
• Execution through a steering group &
by taking a collaborative approach
• Sainsbury’s only sees aggregated data
• Initiatives identified by farmers
• Initiatives supported and fully funded by Sainsbury’s
Herd health & Husbandry
Carbon footprinting
Collaborative working
Business Improvement
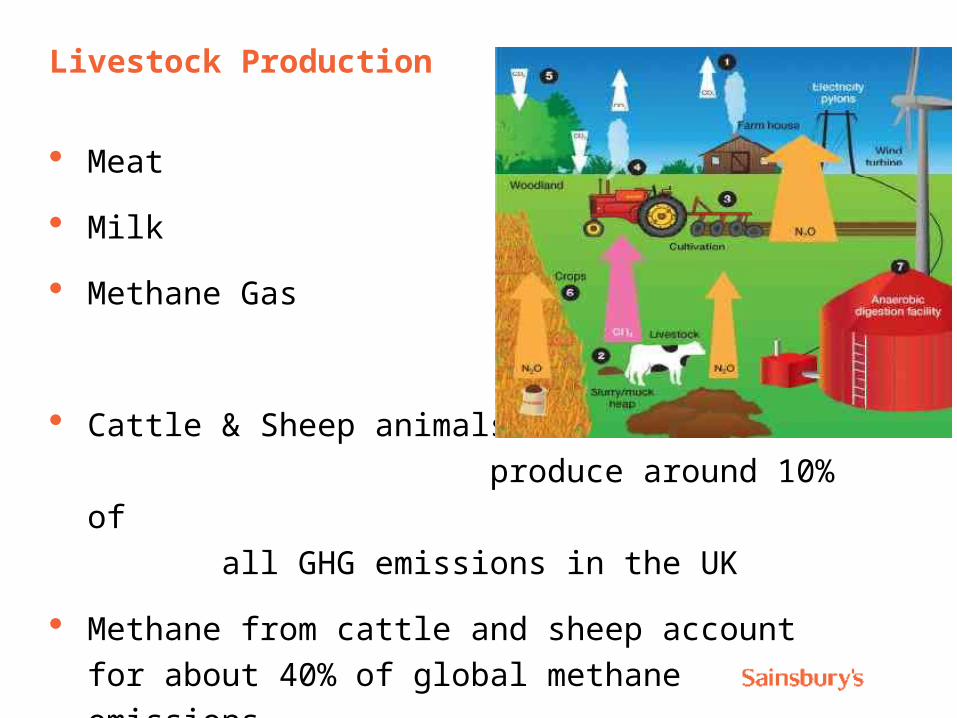
Livestock Production
Meat
Milk
Methane Gas
Cattle & Sheep animals
produce around 10% of
all GHG emissions in the UK
Methane from cattle and sheep account for about
40% of global methane emissions
Carbon Footprinting – The Issue
Dairy cows produce around 10% of all GHG
emissions
Dairy cows produce around 10% of all GHG
emissions in the UK
Methane from cattle and sheep account for circa
40% of global methane emissions
Why?
1 cow produces up to 500 litres of methane per day

The Challenge Ahead
Huge public awareness of
Carbon foot printing and
GHG emissions
The Kyoto Agreement states
that GHG emissions in the UK
will be cut by 20% by 2010
By 2050 the meat and dairy product consumption will
double globally

Carbon Footprint Model
Objective
Enhance the understanding and improve the
carbon footprint / environmental performance on
SDDG supplier farms
• How
Employing external experts: AB Sustain
By benchmarking current practice using:-
• Environmental Scorecard
• Electronic GHG Model

Environmental Scorecard
Results
Provides farmer with own benchmark score
Allows the farmer to
Evaluate your own system for GHG emissions
Review current management practice
Consider areas of potential improvement
Investigate potential cost saving
Enhance future benchmark score
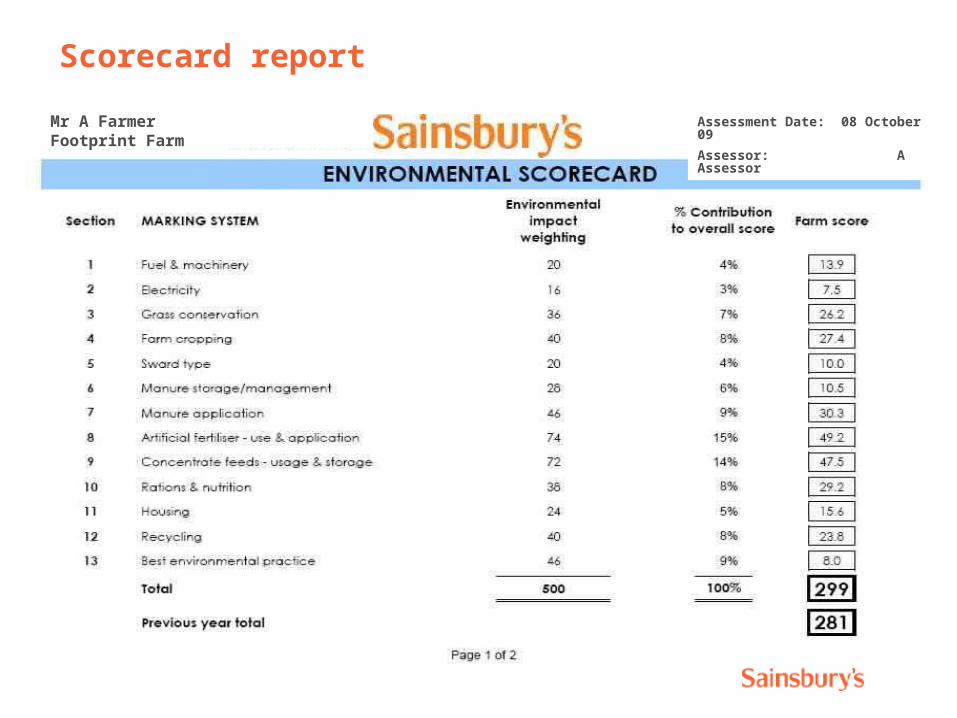
Scorecard report
Mr A FarmerFootprint Farm
Assessment Date: 08 October 09
Assessor: A Assessor

Sample
Benchmark report
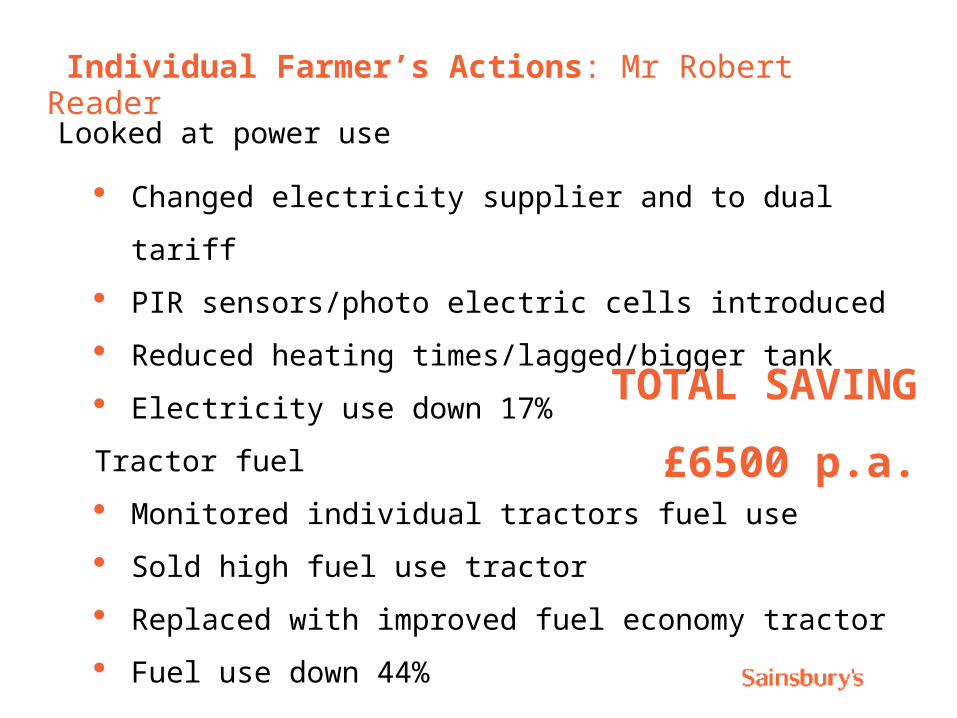
Looked at power use
Changed electricity supplier and to dual tariff
PIR sensors/photo electric cells introduced
Reduced heating times/lagged/bigger tank
Electricity use down 17%
Tractor fuel
Monitored individual tractors fuel use
Sold high fuel use tractor
Replaced with improved fuel economy tractor
Fuel use down 44%
Individual Farmer’s Actions: Mr Robert Reader
TOTAL SAVING
£6500 p.a.
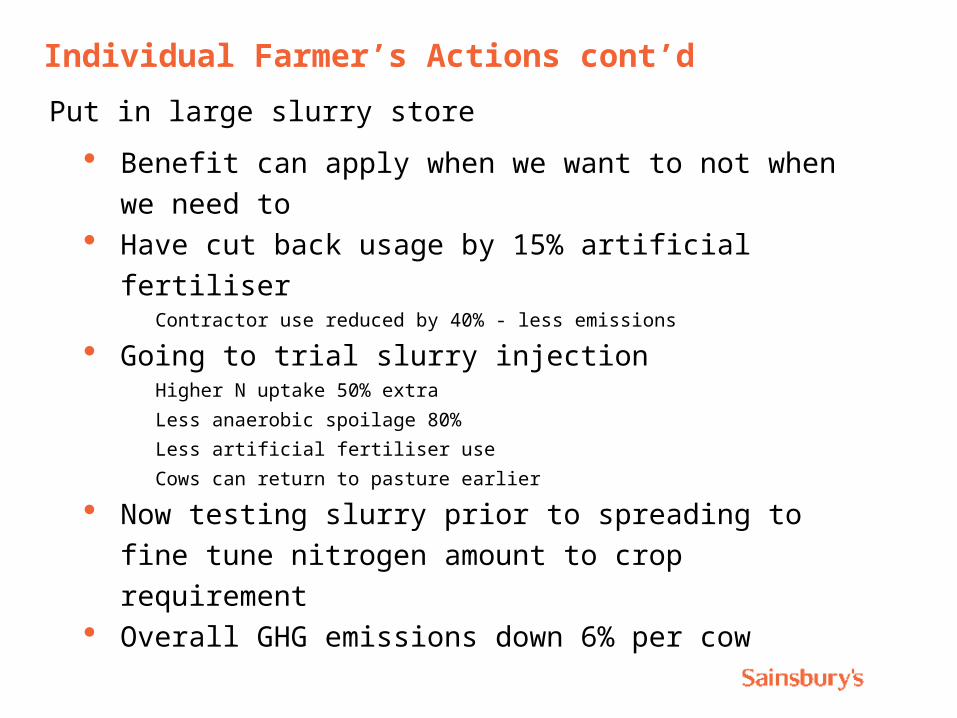
Put in large slurry store
Benefit can apply when we want to not when we
need to Have cut back usage by 15% artificial fertiliser
Contractor use reduced by 40% - less emissions
Going to trial slurry injectionHigher N uptake 50% extra
Less anaerobic spoilage 80%
Less artificial fertiliser use
Cows can return to pasture earlier
Now testing slurry prior to spreading to fine tune
nitrogen amount to crop requirement Overall GHG emissions down 6% per cow
Individual Farmer’s Actions cont’d

Electronic GHG Model
Objective
Provides quantitative assessment of GHG
emissions using a mathematical model
Report provides
CO2 per cow
CO2 per litre of milk
CO2 per litre of milk adjusted to 4% butterfat
Provides farmer with their own benchmark score
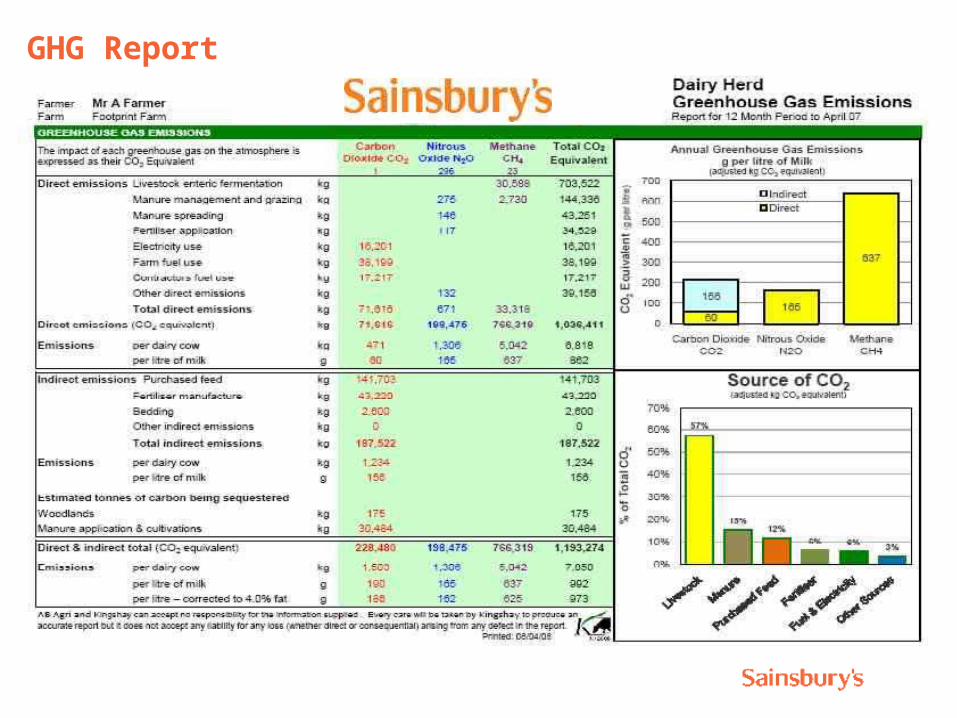
GHG Report
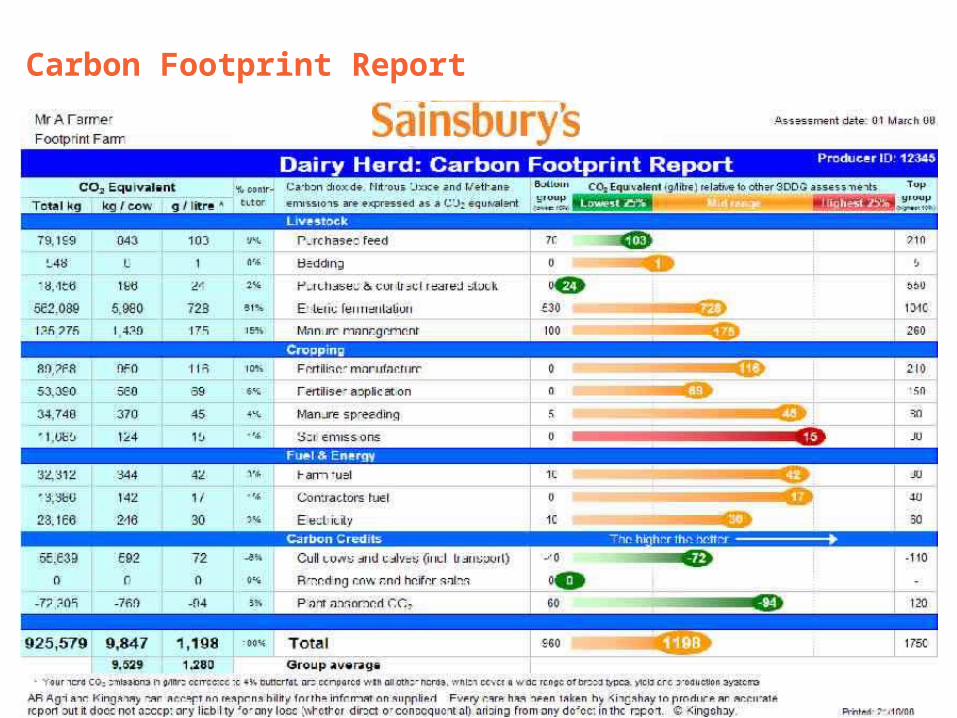
Carbon Footprint Report
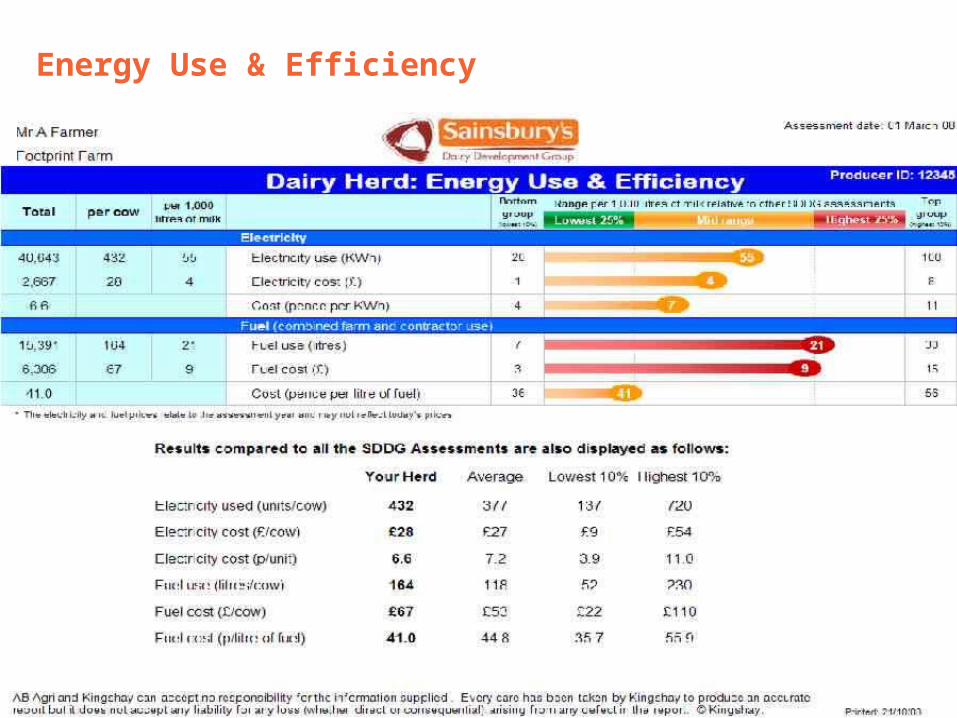
Energy Use & Efficiency
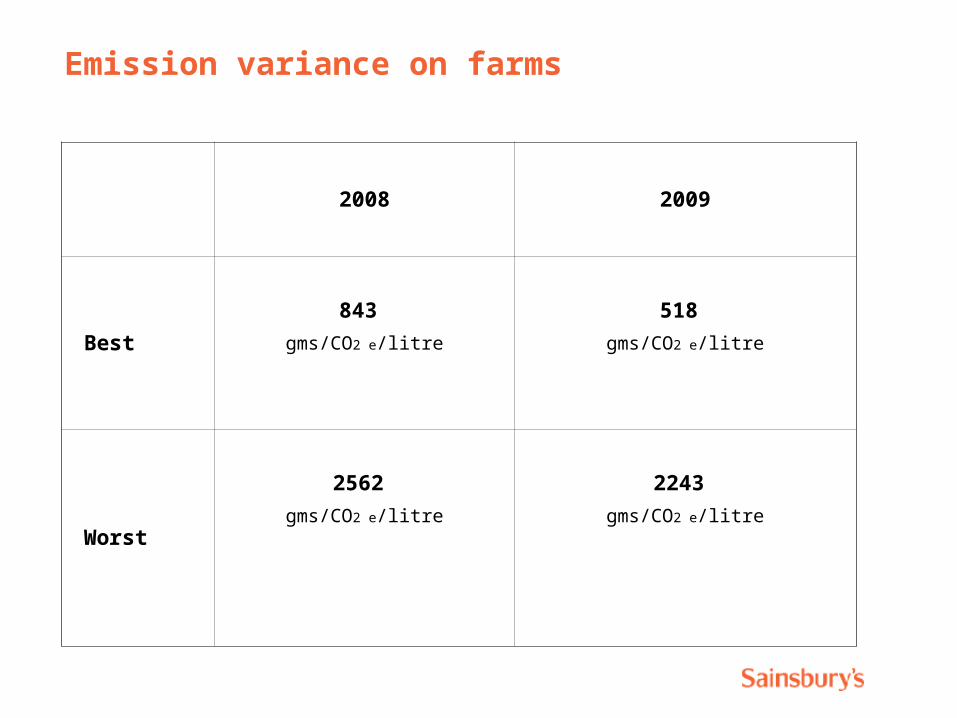
Emission variance on farms
2008 2009
Best
843
gms/CO2 e/litre
518
gms/CO2 e/litre
Worst
2562
gms/CO2 e/litre
2243
gms/CO2 e/litre
Year on year
Good improvements, but………
Weather impact Cows housed longer More bedding used More manure produced Increased levels purchased feed Poor quality conserved fodder
Stocking Increase young stock levels on farm Increase in cow numbers Lower milk yield
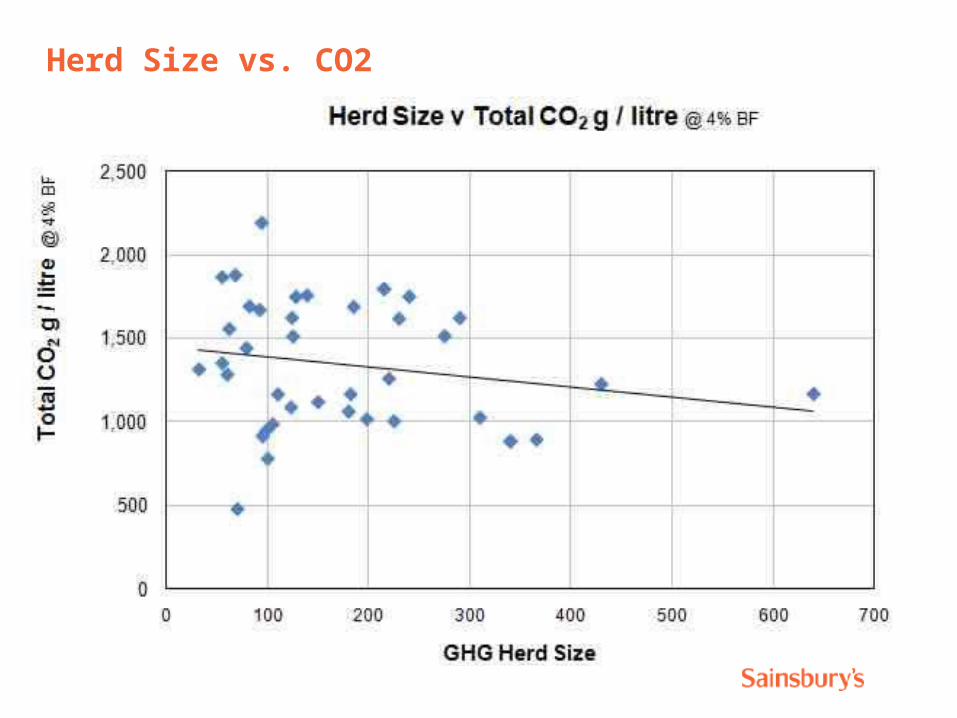
Herd Size vs. CO2
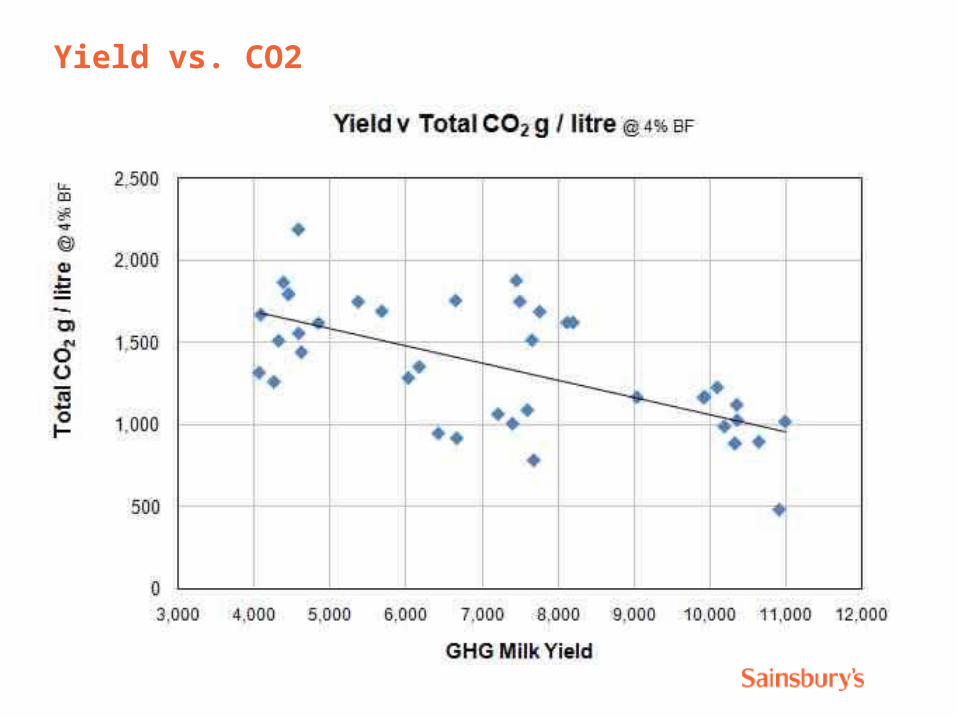
Yield vs. CO2
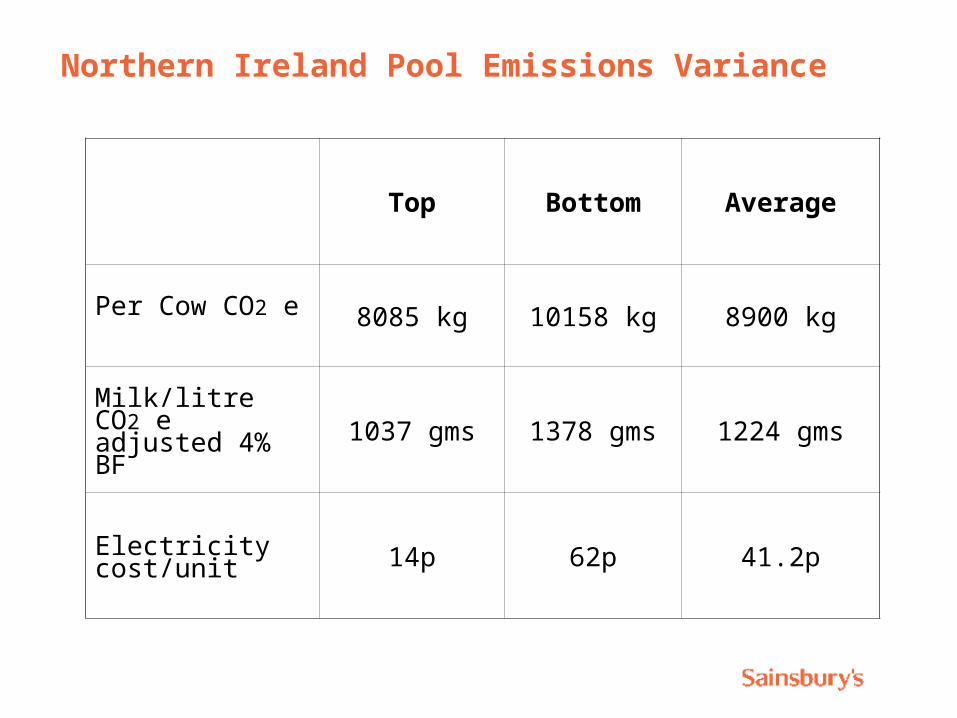
Northern Ireland Pool Emissions Variance
Top Bottom Average
Per Cow CO2 e 8085 kg 10158 kg 8900 kg
Milk/litre CO2 e adjusted 4% BF 1037 gms 1378 gms 1224 gms
Electricity cost/unit 14p 62p 41.2p

Northern Ireland SDDG Results
N Ireland SDDG Mainland SDDG
No. Cows 100 168
Yield/cow litres 7180 7467
Feed Equiv (kg/cow) 2300 2659
Feed Equiv (kg/lt) 0.32 0.36
Stock rate (LSU/Ha) 2.01 1.95
Fertiliser (kg/N/ha) 114 122
Electricity (units/cow) 292 375
Electricity (£/cow) 28 32

Northern Ireland Emissions CO2 e
NI SDDG Mainland SDDG
Per cow (kg) 8900 9524
Per litre/milk (gms) 1240 1276
Per litre/milk (gms) adjusted 4% BF 1224 1270
Northern Ireland / Mainland Comparison
Northern Ireland / Cow 7.4% better CO2 e than Mainland
Northern Ireland milk / litre 3.5% better CO2 e than Mainland

Beef & Sheep Model Fundamentals
Enteric and manure methane
Animals historic footprint
System created to capture the diversity of
beef & sheep finishing systems
Our system recognises the ME needs for breeds and sex
Impact of dietary composition
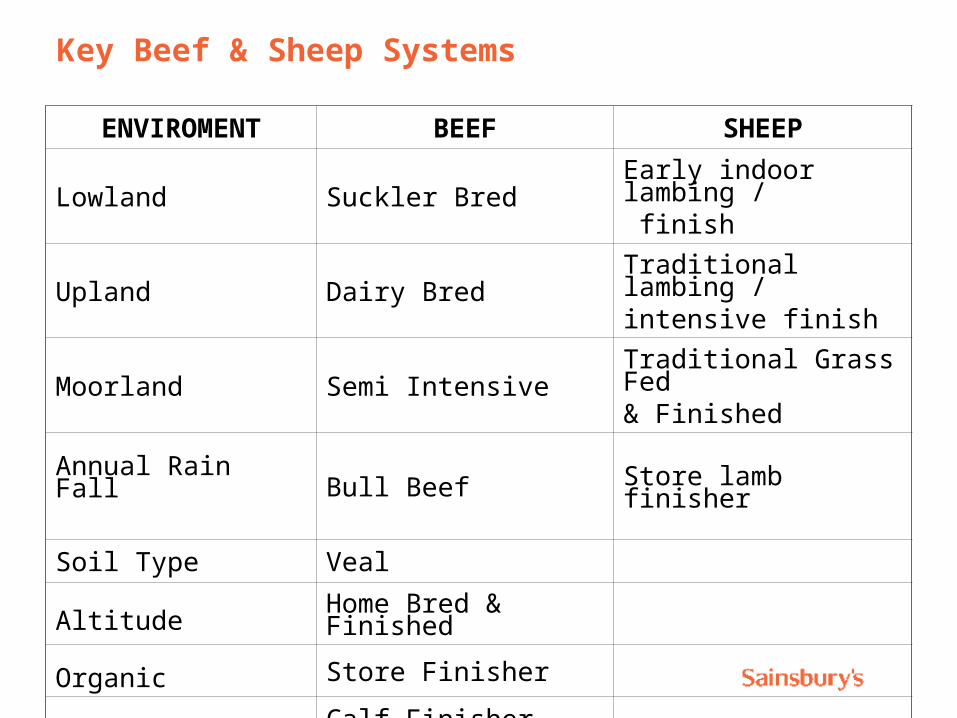
Key Beef & Sheep Systems
ENVIROMENT BEEF SHEEP
Lowland Suckler BredEarly indoor lambing / finish
Upland Dairy BredTraditional lambing /intensive finish
Moorland Semi IntensiveTraditional Grass Fed & Finished
Annual Rain Fall Bull Beef Store lamb finisher
Soil Type Veal
Altitude Home Bred & Finished
Organic Store Finisher
Calf Finisher

Beef Production
In 200851% of prime beef was derived from the dairy herd30% from upland suckler herds 19% from lowland suckler enterprises
Assessments to dateAv. beef production 14kg of CO2e per kilo
Farms assessed variance of 25%
Initial findings show key driver of improvementReduce age at finish

Lamb Production
In 200839% of lamb production was hill30% upland31% from lowland enterprises
Assessments to dateAv. sheep production 15kg of CO2e per kilo
Farms assessed variance of 36%
Initial findings show key driver of improvementlambing percentagespeed to finish

Carbon Trust
AB Sustain has been pilot partners to the Carbon Trust in the creation of PAS 2050. Their unique methodology is recognised by them as containing detail at tier 3.
The model has obtained the highest level that can be achieved by the International Panel on Climate Change (IPCC)
All farms adjusted to CO2 equivalent
Working with

The Sainsbury’s Carbon Footprint Initiative
Delivering
Meaningful data specific to individual farms
An opportunity for farms to review current practice
Model based on:
monitor, review, improve, monitor, review, improve….
not targets!
All mainland SDDG farms now in Year 3 of assessments
A reduction of over 5000 tonnes of Carbon in Year 2
Our Unique Approach
Every Sainsbury’s farm visited and audited annually
Bespoke reporting system to maximise farmer understanding and interpretation of data
Specialist guidance and assistance provided to implement CO2 reduction on farm
“Hands on” practical solutions delivered through group workshops: Manure Management
NutritionGrassland ManagementForage Quality

The Challenge Ahead
Huge public awareness of
climate change
UK to set new targets for reduction?
Link between carbon & SFP?
Future livestock tax?
Methane impact:
21 x CO2e 1996 / 25 x CO2e 2007
Summary
• The initiative has demonstrated that by working directly with farmers, they can reduce emissions and make financial savings
• It is counter-intuitive : the highest yielding herds have the lowest carbon footprint OR? the best managed
• The model has stimulated farmers in a positive way, by altering attitudes and driving change
• Agriculture will be enhanced by demonstrating green credentials
• Awards now highlight the success of our approach
The Future
Based on this success of the dairy work so far,
Sainsbury’s are extending the carbon footprinting project
across an additional 6,500 farmers in the following
sectors;
Beef
Sheep
Pigs
Poultry meat & Eggs
Cheese

Thank you
[JO] [SM] [GEJ] [RH] [SM] [GEJ] [RH] [AG ] [NM [NM]]