CARBON FOOTPRINT CALCULATOR CARBON ......carbon footprint calculator Climate change has become an...
3
9 8 Fertilizer FOCUS | SEPTEMBER/OCTOBER 2019 Fertilizer FOCUS | SEPTEMBER/OCTOBER 2019 Fertilizer carbon footprint calculator Climate change has become an ever-increasing concern and there is growing pressure to reduce greenhouse gas (GHG) emissions resulting from human activities, which includes the need for carbon accounting. A famous business aphorism explains it rather well: ‘what gets measured gets managed’. While measuring GHG emissions alone can not save the planet, it is undoubtedly an essential part of managing climate change. Firstly it is important to take a look at the relation between fertilizers and climate change, the EU climate policy context and the origins of carbon accounting and footprinting. The Carbon Footprint Calculator is a tool developed by Fertilizers Europe to measure the carbon footprint of fertilizer production. Here we will explain the basic principles, elements, data sources and uses of the calculator, together with the results of its calculations comparing the carbon footprint of selected fertilizers across different regions of the world. entities such as countries or country blocs. The amount of emissions (and removals) measured for the given product/service is referred to as the carbon footprint. Depending on the subject of carbon accounting, the term ‘carbon’ often covers other GHG. The exact scope of carbon accounting and the measurement methodology depends on the boundaries set for the given activity. They can range from a specific production process to the whole supply chain. The objective of carbon accounting is to build a GHG inventory for research, compliance, disclosure, benchmarking, auditing, information, marketing or other purposes. Initially, carbon accounting was carried out by countries reporting national level emissions for the purposes of United Nations Framework Convention on Climate Change (UNFCCC). To assist them, the International Panel on Climate Change (IPCC) published its first guideline on national GHG inventories in 1995. Carbon accounting gained more prominence also in the corporate world. In 2001, Greenhouse Gas Protocol (a partnership of businesses, NGOs and others) published the first corporate emission accounting methodology (WBCSD, n.d.). Five years later, the first international standard on Corporate Accounting (ISO 14064) was issued. In 2008, UK’s Department for Environment, Food & Rural Affairs (DEFRA), in collaboration with UK’s standards body BSI and Carbon Trust developed the first Product Carbon Footprinting methodology based on the life-cycle analysis (LCA), looking at all stages of the product life from raw materials extraction to its disposal or recycling, also known as cradle-to-grave analysis. Following these pioneering efforts, a number of carbon footprinting initiatives and methodologies have appeared worldwide, especially in Europe. Carbon Footprint Calculator Commissioned by Fertilizers Europe, the European mineral fertilizer manufacturers’ association, the Carbon Footprint Calculator was first Fertilizers and climate change According to scientists, human activities since the industrial revolution have been responsible for the increase in GHG concentration in the atmosphere and the resulting climate change. Among human activities, industry and agriculture (together with forestry and other land use) represent 18% and 24% of global GHG emissions respectively. The International Fertilizer Association estimates that the fertilizer industry represents 2.5% of the global GHG emissions, including 1.5% related to fertilizer use. The production of nitrogen fertilizers is characterised developed in 2014 and serves as a tool for assessing direct and indirect GHG emissions related to the production of selected fertilizer products. It follows the ‘cradle to gate’ approach where emissions associated with all stages of the product life are taken into account, from the raw material extraction, energy supply, the manufacturing process to the product storage at the production site . The tool is available for free at: http://www.calcfert.com/ account/login/?next=/ The Carbon Footprint Calculator is based on the scheme proposed in 1998 at the IFA Technical Conference (see figure 1). The tool calculates GHG emissions for selected fertilizers based on production parameters for ammonia and nitric acid. These values can by high carbon-intensity due to its use of fossil fuels, mainly natural gas, as fuel and feedstock, whereas GHG emissions related to fertilizer use are mainly nitrous oxide (N2O) emissions due to the soil effects of fertilization. Carbon accounting and footprinting Carbon accounting can be defined and interpreted in many ways. Primarily, it is defined as the measurement of the amount of carbon dioxide (CO2) or GHG emissions (and removals) resulting from activities associated with a product, service, company, sector, city or even larger political subsequently be used in calculating emission factors required in the Life Cycle Assessment (LCA) calculators for the products in the broader agri-food chain, such as the Cool Farm Tool. The tool was developed primarily for benchmarking purposes. It allows the user to compare results from across the world: European Union, North America, Latin America, Africa, Middle East, Commonwealth of Independent States (CIS), South East Asia, South Asia, Oceania and China. The Carbon Footprint Calculator facilitates companies internal and external carbon accounting for legal or corporate social responsibility (CSR) purposes. In the case of external reporting, an independent auditor is required to verify the data used as input in the calculator. The Carbon Footprint Calculator serves as a tool for assessing direct and indirect GHG feature CARBON FOOTPRINT CALCULATOR feature CARBON FOOTPRINT CALCULATOR by Michał Wendołowski, Senior Energy and Climate Advisor, Fertilizers Europe, Belgium Figure 1. Principles of carbon footprint calculator for fertilizer products. A number of carbon footprinting initiatives and methodologies have appeared worldwide
Transcript of CARBON FOOTPRINT CALCULATOR CARBON ......carbon footprint calculator Climate change has become an...

98 Fertilizer FOCUS | SEPTEMBER/OCTOBER 2019 Fertilizer FOCUS | SEPTEMBER/OCTOBER 2019
Fertilizer carbon footprint calculator
Climate change has become an ever-increasing concern and there is growing pressure to reduce greenhouse gas (GHG) emissions resulting from human activities, which includes the need for carbon accounting. A famous business aphorism explains it rather well: ‘what gets measured gets managed’. While measuring GHG emissions alone can not save the planet, it is undoubtedly an essential part of managing climate change.
Firstly it is important to take a look at the relation between fertilizers and climate change, the EU climate policy context and the origins of carbon accounting and footprinting. The Carbon Footprint Calculator is a tool developed by Fertilizers Europe to measure the carbon footprint of fertilizer production. Here we will explain the basic principles, elements, data sources and uses of the calculator, together with the results of its calculations comparing the carbon footprint of selected fertilizers across different regions of the world.
entities such as countries or country blocs. The amount of emissions (and removals) measured for the given product/service is referred to as the carbon footprint. Depending on the subject of carbon accounting, the term ‘carbon’ often covers other GHG. The exact scope of carbon accounting and the measurement methodology depends on the boundaries set for the given activity. They can range from a specific production process to the whole supply chain. The objective of carbon accounting is to build a GHG inventory for research, compliance, disclosure, benchmarking, auditing, information, marketing or other purposes.
Initially, carbon accounting was carried out by countries reporting national level emissions for the purposes of United Nations Framework Convention on Climate Change (UNFCCC). To assist them, the International Panel on Climate Change (IPCC) published its first guideline on national GHG inventories in 1995.
Carbon accounting gained more prominence also in the corporate world. In 2001, Greenhouse Gas Protocol (a partnership of businesses, NGOs and others) published the first corporate emission accounting methodology (WBCSD, n.d.). Five years later, the first international standard on Corporate Accounting (ISO 14064) was issued. In 2008, UK’s Department for Environment, Food & Rural Affairs (DEFRA), in collaboration with UK’s standards body BSI and Carbon Trust developed the first Product Carbon Footprinting methodology based on the life-cycle analysis (LCA), looking at all stages of the product life from raw materials extraction to its disposal or recycling, also known as cradle-to-grave analysis. Following these pioneering efforts, a number of carbon footprinting initiatives and methodologies have appeared worldwide, especially in Europe.
Carbon Footprint CalculatorCommissioned by Fertilizers Europe, the European mineral fertilizer manufacturers’ association, the Carbon Footprint Calculator was first
Fertilizers and climate change According to scientists, human activities since the industrial revolution have been responsible for the increase in GHG concentration in the atmosphere and the resulting climate change. Among human activities, industry and agriculture (together with forestry and other land use) represent 18% and 24% of global GHG emissions respectively. The International Fertilizer Association estimates that the fertilizer industry represents 2.5% of the global GHG emissions, including 1.5% related to fertilizer use. The production of nitrogen fertilizers is characterised
developed in 2014 and serves as a tool for assessing direct and indirect GHG emissions related to the production of selected fertilizer products. It follows the ‘cradle to gate’ approach where emissions associated with all stages of the product life are taken into account, from the raw material extraction, energy supply, the manufacturing process to the product storage at the production site . The tool is available for free at: http://www.calcfert.com/account/login/?next=/
The Carbon Footprint Calculator is based on the scheme proposed in 1998 at the IFA Technical Conference (see figure 1).
The tool calculates GHG emissions for selected fertilizers based on production parameters for ammonia and nitric acid. These values can
by high carbon-intensity due to its use of fossil fuels, mainly natural gas, as fuel and feedstock, whereas GHG emissions related to fertilizer use are mainly nitrous oxide (N2O) emissions due to the soil effects of fertilization.
Carbon accounting and footprintingCarbon accounting can be defined and interpreted in many ways. Primarily, it is defined as the measurement of the amount of carbon dioxide (CO2) or GHG emissions (and removals) resulting from activities associated with a product, service, company, sector, city or even larger political
subsequently be used in calculating emission factors required in the Life Cycle Assessment (LCA) calculators for the products in the broader agri-food chain, such as the Cool Farm Tool.
The tool was developed primarily for benchmarking purposes. It allows the user to compare results from across the world: European Union, North America, Latin America, Africa, Middle East, Commonwealth of Independent States (CIS), South East Asia, South Asia, Oceania and China.
The Carbon Footprint Calculator facilitates companies internal and external carbon accounting for legal or corporate social responsibility (CSR) purposes. In the case of external reporting, an independent auditor is required to verify the data used as input in the calculator.
The Carbon Footprint Calculator serves as a tool for assessing direct and indirect GHG
featureCARBON FOOTPRINT CALCULATOR
feat
ure CARBON FOOTPRINT CALCULATOR
by Michał Wendołowski, Senior Energy and Climate Advisor, Fertilizers Europe, Belgium
Figure 1. Principles of carbon footprint calculator for fertilizer products.
A number of carbon footprinting initiatives and methodologies have appeared worldwide
1110 Fertilizer FOCUS | SEPTEMBER/OCTOBER 2019 Fertilizer FOCUS | SEPTEMBER/OCTOBER 2019
featureCARBON FOOTPRINT CALCULATOR
feat
ure CARBON FOOTPRINT CALCULATOR
Calculation of carbon footprintDuring the first stage of the calculation, the user can select a specific fertilizer for which they wish to calculate the carbon footprint. The next step is the specification of the energy sources and components used in the production process.
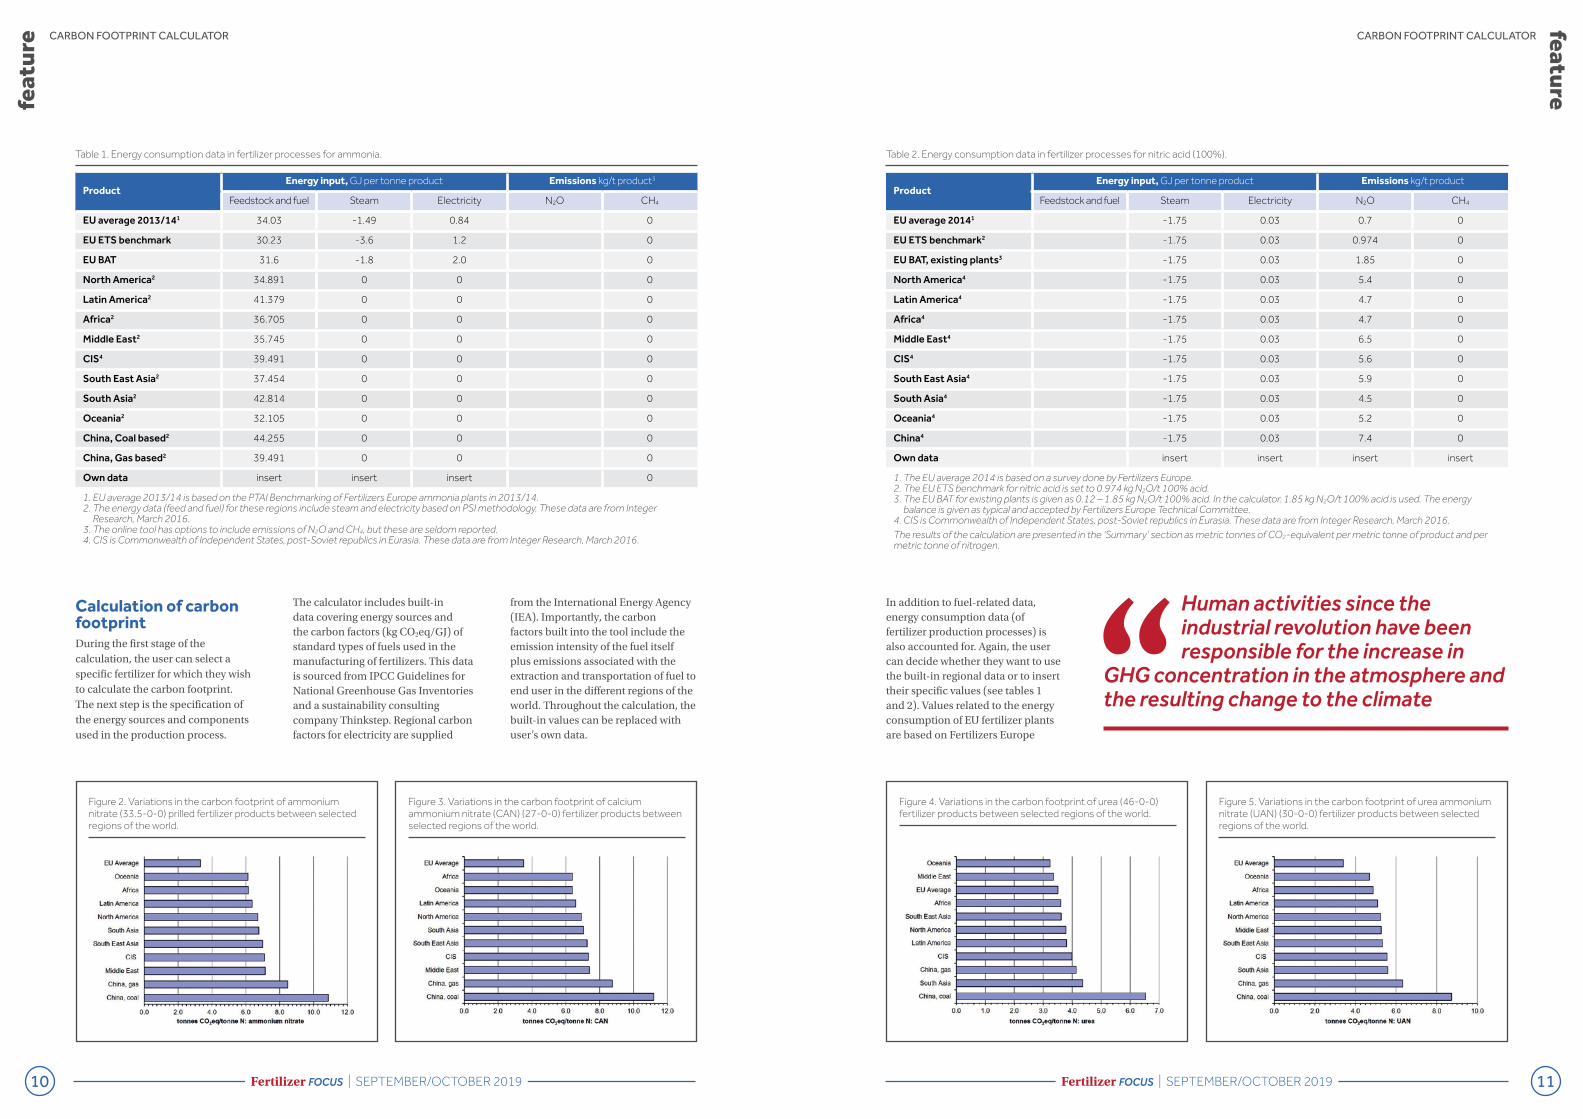
In addition to fuel-related data, energy consumption data (of fertilizer production processes) is also accounted for. Again, the user can decide whether they want to use the built-in regional data or to insert their specific values (see tables 1 and 2). Values related to the energy consumption of EU fertilizer plants are based on Fertilizers Europe
The calculator includes built-in data covering energy sources and the carbon factors (kg CO2eq/GJ) of standard types of fuels used in the manufacturing of fertilizers. This data is sourced from IPCC Guidelines for National Greenhouse Gas Inventories and a sustainability consulting company Thinkstep. Regional carbon factors for electricity are supplied
from the International Energy Agency (IEA). Importantly, the carbon factors built into the tool include the emission intensity of the fuel itself plus emissions associated with the extraction and transportation of fuel to end user in the different regions of the world. Throughout the calculation, the built-in values can be replaced with user’s own data.
Table 2. Energy consumption data in fertilizer processes for nitric acid (100%).
ProductEnergy input, GJ per tonne product Emissions kg/t product
Feedstock and fuel Steam Electricity N2O CH4
EU average 20141 -1.75 0.03 0.7 0
EU ETS benchmark2 -1.75 0.03 0.974 0
EU BAT, existing plants3 -1.75 0.03 1.85 0
North America4 -1.75 0.03 5.4 0
Latin America4 -1.75 0.03 4.7 0
Africa4 -1.75 0.03 4.7 0
Middle East4 -1.75 0.03 6.5 0
CIS4 -1.75 0.03 5.6 0
South East Asia4 -1.75 0.03 5.9 0
South Asia4 -1.75 0.03 4.5 0
Oceania4 -1.75 0.03 5.2 0
China4 -1.75 0.03 7.4 0
Own data insert insert insert insert
1. The EU average 2014 is based on a survey done by Fertilizers Europe. 2. The EU ETS benchmark for nitric acid is set to 0.974 kg N2O/t 100% acid.3. The EU BAT for existing plants is given as 0.12 – 1.85 kg N2O/t 100% acid. In the calculator. 1.85 kg N2O/t 100% acid is used. The energy
balance is given as typical and accepted by Fertilizers Europe Technical Committee.4. CIS is Commonwealth of Independent States, post-Soviet republics in Eurasia. These data are from Integer Research, March 2016.The results of the calculation are presented in the ‘Summary’ section as metric tonnes of CO2-equivalent per metric tonne of product and per metric tonne of nitrogen.
Table 1. Energy consumption data in fertilizer processes for ammonia.
ProductEnergy input, GJ per tonne product Emissions kg/t product3
Feedstock and fuel Steam Electricity N2O CH4
EU average 2013/141 34.03 -1.49 0.84 0
EU ETS benchmark 30.23 -3.6 1.2 0
EU BAT 31.6 -1.8 2.0 0
North America2 34.891 0 0 0
Latin America2 41.379 0 0 0
Africa2 36.705 0 0 0
Middle East2 35.745 0 0 0
CIS4 39.491 0 0 0
South East Asia2 37.454 0 0 0
South Asia2 42.814 0 0 0
Oceania2 32.105 0 0 0
China, Coal based2 44.255 0 0 0
China, Gas based2 39.491 0 0 0
Own data insert insert insert 0
1. EU average 2013/14 is based on the PTAI Benchmarking of Fertilizers Europe ammonia plants in 2013/14.2. The energy data (feed and fuel) for these regions include steam and electricity based on PSI methodology. These data are from Integer
Research, March 2016.3. The online tool has options to include emissions of N2O and CH4, but these are seldom reported.4. CIS is Commonwealth of Independent States, post-Soviet republics in Eurasia. These data are from Integer Research, March 2016.
Figure 2. Variations in the carbon footprint of ammonium nitrate (33.5-0-0) prilled fertilizer products between selected regions of the world.
Figure 4. Variations in the carbon footprint of urea (46-0-0) fertilizer products between selected regions of the world.
Figure 3. Variations in the carbon footprint of calcium ammonium nitrate (CAN) (27-0-0) fertilizer products between selected regions of the world.
Figure 5. Variations in the carbon footprint of urea ammonium nitrate (UAN) (30-0-0) fertilizer products between selected regions of the world.
Human activities since the industrial revolution have been responsible for the increase in
GHG concentration in the atmosphere and the resulting change to the climate

1312 Fertilizer FOCUS | SEPTEMBER/OCTOBER 2019 Fertilizer FOCUS | SEPTEMBER/OCTOBER 2019
feat
ure CARBON FOOTPRINT CALCULATOR
benchmarking surveys, whereas consultants from Integer Research supplied the data representing fertilizer production in other regions.
Regional comparison of the carbon footprint of nitrogen fertilizersBased on EU and other regions data, the Carbon Footprint Calculator provides a comparison of the carbon footprint of ammonium nitrate (AN), calcium ammonium nitrate (CAN), urea and urea ammonium nitrate (UAN with 30% nitrogen content) produced in the EU and other regions, both in terms of product tonnes and nitrogen tonnes (see figures 2-5). Importantly, urea’s carbon footprint includes CO2 that is temporarily stored in the product but emitted upon use.
The results of the calculations in figures 2, 3, 4 and 5 indicate that the EU industry represents the least emission-intensive production (per tonne of product and nutrient) for all fertilizers presented, with the exception of urea produced in Oceania. The EU average carbon footprint is lower than in other regions mainly due to the higher average energy efficiency of EU plants and GHG abatement technology, primarily nitrous oxide abatement in the nitric acid installations.
In all results above, coal-based fertilizer production in China has the highest carbon footprint worldwide due the high carbon-intensity of the fuel and feedstock.
Cool Farm Tool Going beyond fertilizer production, the results of the Carbon Footprint Calculator can also be used in another calculator: the Cool Farm Tool, which was developed by the Cool Farm Alliance, a partnership of food retailers, manufacturers, input suppliers, NGOs, universities and consultancies. This carbon footprinting tool for crop and livestock products offers instant results broken down by emission source (indicating also the emissions from fertilizer use) and the ability to run ‘what-if’ scenarios for optimised farm management.
Available online, it is mainly used by farmers, agronomists and a broader range of users from the food supply chain.
Carbon footprinting and the EU climate policyThe EU has been at the forefront of combating climate change. It has the ambition to lead by example in meeting the targets set in the Paris Agreement and to become the first climate-neutral continent by 2050. The bloc is already on its way to meet the 2020 target of reducing GHG emissions by 20% compared with 1990 levels and has set the intermediate target of GHG emissions reduction of 40% by 2030. The key legislative instrument aimed at reducing the emissions of the European industry (including the fertilizer industry) is the EU Emissions Trading System (EU ETS), a cap-and-trade scheme with a decreasing annual cap on the number of emission allowances (EUA) which can be traded among its participants.
EU ETS is a carbon pricing mechanism, designed to internalize the costs of carbon in the costs of product, following the ‘polluter pays’ principle. In the case of the fertilizer industry, ETS costs are linked to the GHG emissions resulting from the production of ammonia and nitric acid.
Following the implementation of additional mechanisms meant to reduce the oversupply of EUA on the market that had depressed the price of EUA for years, the price of EUA increased within one year from EUR5.00-8.00 to nearly EUR30.00 in August 2019. The price increase has put the EU fertilizer industry, a sector with a particularly high carbon intensity, under significant financial pressure.
EU ETS does not tackle the cost of carbon emissions associated with
imported fertilizers. If at some point in the future there is a carbon pricing mechanism of internalising the costs of carbon in products including imports, there will be a need for a methodology and for tools to calculate the carbon footprint of those products in order to establish the cost of carbon, which could take a form of a carbon tax. The Carbon Footprint Calculator could then serve as a building block in such calculations in the case of fertilizers.
Industry commitmentWith the increasing number of emission-reduction commitments coming from businesses and governments alike, the importance of carbon accounting is growing. The ability to assess and monitor emissions is the key to identifying the most effective abatement strategies, set the reduction targets and communicate the results. It could also be used to establish the cost of carbon emissions associated with products and services in future carbon pricing mechanisms.
Leading the global fertilizer manufacturing in energy efficiency and emission abatement technologies, the EU industry developed tools that allow businesses and individuals to be better informed on the fertilizer products they produce, use or research. Based on robust methodology and verified data, the Carbon Footprint Calculator and the Cool Farm Tool are uniquely equipped to calculate and combine the carbon footprint data of fertilizers across different products, raw materials and regions, throughout the whole life cycle.
The European Union has been at the forefront of combating climate change
SACKETT DO BRASIL
EUA BRASIL
EQUIPAMENTOS & SISTEMAS
Notes:• Fertilizers Europe is the European mineral fertilizer manufacturers’ association• The details of the Carbon Footprint Calculator and the calculations results have
been described based on the International Fertilizer Society paper• Fertilizers Europe appointed Carbon Trust as its official auditor• The Cool Farm Tool is available at: https://coolfarmtool.org/