Plan Today. Power Tomorrow. The Utility Perspective PNUCC June 11, 2009.

Carbon Emissions – a Northwest Perspective
July 2014

Acknowledgements
This paper was developed and reviewed by members of the PNUCC System Planning Committee. A special thank you to subgroup members:
John Lyons Avista Stefan Brown Portland General Electric
Larry Stene BPA Brendan McCarthy Portland General Electric
Tom Haymaker Clark PUD Steve Schue Portland General Electric
Terry Toland Clark PUD Elysia Treanor Portland General Electric
Phil DeVol Idaho Power Keith Faretra Puget Sound Energy
Mark Stokes Idaho Power Phillip Popoff Puget Sound Energy
Tomás Morrissey PNUCC (lead author) Zac Yanez Snohomish PUD
Shauna McReynolds PNUCC Cathy Carruthers Tacoma Power
101 SW Main Street, Suite 1605
Portland, OR 97204
For further information contact Tomás Morrissey at [email protected]
Electronic copies of this report are available at
www.PNUCC.org

Carbon Emissions – a Northwest Perspective
Contents
Executive Summary ....................................................................................................................................... 1
The Challenge: Defining a Carbon Footprint ................................................................................................. 2
The Global CO2 Emissions Trend is Up .......................................................................................................... 4
Northwest Electric Power Emissions are One Piece of the Pie ..................................................................... 5
The Northwest Produces Low Carbon Power ............................................................................................... 6
Northwest Emissions Change Yearly ............................................................................................................. 7
Every Utility Produces a Different Amount of CO2 ....................................................................................... 9
The Northwest is Cutting Carbon on Many Fronts ..................................................................................... 10
Looking Forward: Options and Costs .......................................................................................................... 13
Further Study .............................................................................................................................................. 17
Report Sources ............................................................................................................................................ 18
Appendix A – The Northwest and 111(d).................................................................................................... 21
Appendix B – Electric Power Carbon Reduction Efforts by State ............................................................... 24
1 July 16, 2014
0.0
0.1
0.2
0.3
0.4
0.5
0.6
0.7
Northwest Remaining US
Metric tons CO2/M
Wh
Executive Summary
Electric generation is one of several main contributors to carbon dioxide emissions globally. This paper puts into context the emissions produced in the Pacific Northwest of the United States, focusing on the electric power sector. From local, state and regional efforts to federal action through the Environmental Protection Agency, the conversation around reducing carbon emissions is escalating. To aid in this discussion, the Pacific Northwest Utilities Conference Committee (PNUCC) has prepared this paper to add context to the region’s carbon footprint and discuss current and potential future carbon reduction efforts in the electric power industry. The key takeaways are:
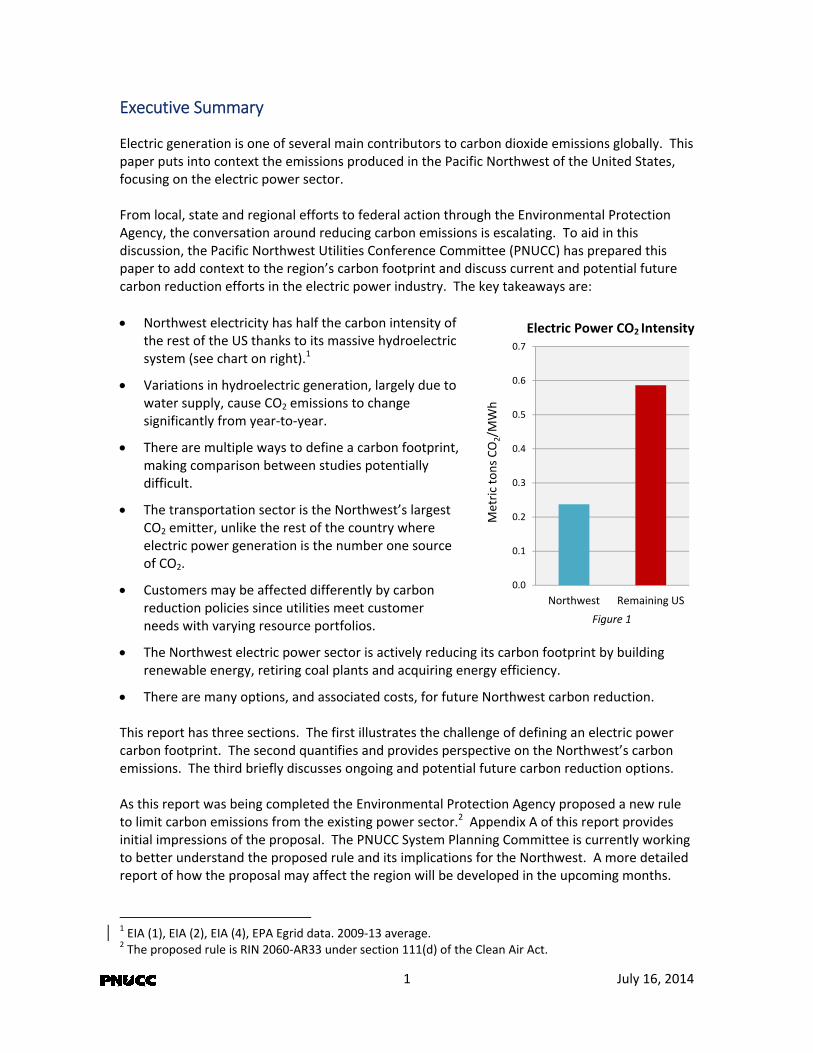
Northwest electricity has half the carbon intensity of the rest of the US thanks to its massive hydroelectric system (see chart on right).1
Variations in hydroelectric generation, largely due to water supply, cause CO2 emissions to change significantly from year‐to‐year.
There are multiple ways to define a carbon footprint, making comparison between studies potentially difficult.
The transportation sector is the Northwest’s largest CO2 emitter, unlike the rest of the country where electric power generation is the number one source of CO2.
Customers may be affected differently by carbon reduction policies since utilities meet customer needs with varying resource portfolios.
The Northwest electric power sector is actively reducing its carbon footprint by building renewable energy, retiring coal plants and acquiring energy efficiency.
There are many options, and associated costs, for future Northwest carbon reduction. This report has three sections. The first illustrates the challenge of defining an electric power carbon footprint. The second quantifies and provides perspective on the Northwest’s carbon emissions. The third briefly discusses ongoing and potential future carbon reduction options. As this report was being completed the Environmental Protection Agency proposed a new rule to limit carbon emissions from the existing power sector.2 Appendix A of this report provides initial impressions of the proposal. The PNUCC System Planning Committee is currently working to better understand the proposed rule and its implications for the Northwest. A more detailed report of how the proposal may affect the region will be developed in the upcoming months.
1 EIA (1), EIA (2), EIA (4), EPA Egrid data. 2009‐13 average. 2 The proposed rule is RIN 2060‐AR33 under section 111(d) of the Clean Air Act.
Electric Power CO2 Intensity
Figure 1
2 July 16, 2014
The Challenge: Defining a Carbon Footprint
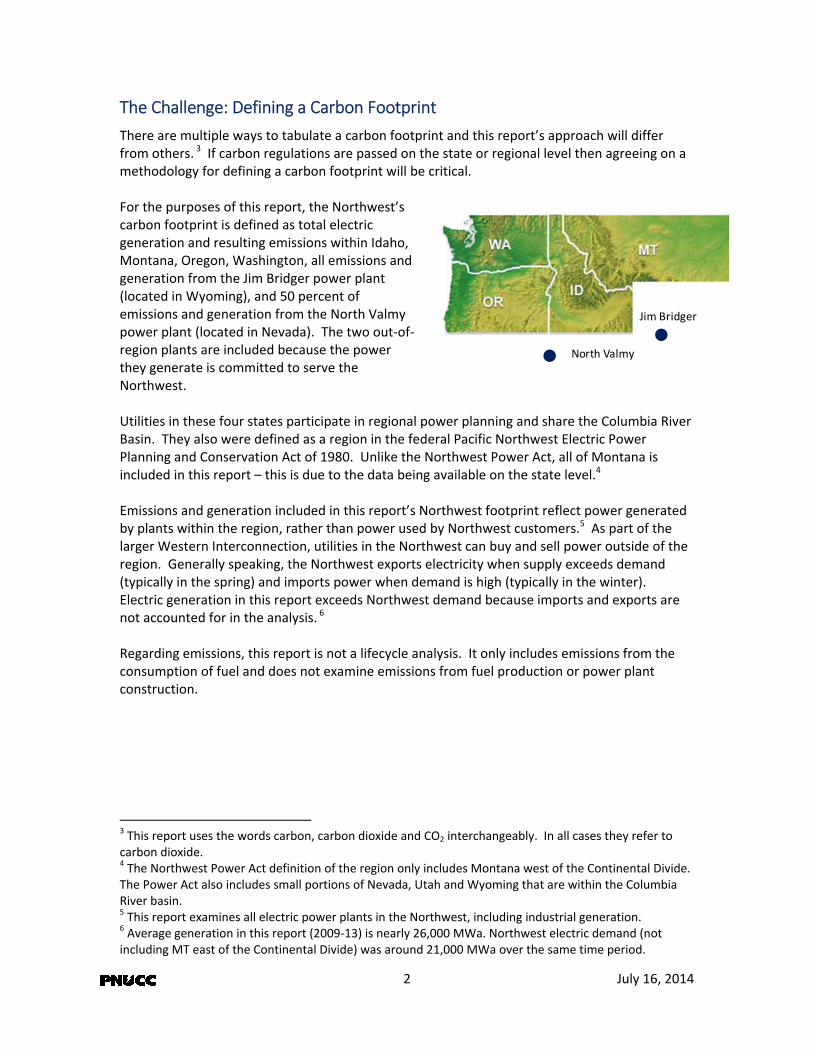
There are multiple ways to tabulate a carbon footprint and this report’s approach will differ from others. 3 If carbon regulations are passed on the state or regional level then agreeing on a methodology for defining a carbon footprint will be critical. For the purposes of this report, the Northwest’s carbon footprint is defined as total electric generation and resulting emissions within Idaho, Montana, Oregon, Washington, all emissions and generation from the Jim Bridger power plant (located in Wyoming), and 50 percent of emissions and generation from the North Valmy power plant (located in Nevada). The two out‐of‐region plants are included because the power they generate is committed to serve the Northwest. Utilities in these four states participate in regional power planning and share the Columbia River Basin. They also were defined as a region in the federal Pacific Northwest Electric Power Planning and Conservation Act of 1980. Unlike the Northwest Power Act, all of Montana is included in this report – this is due to the data being available on the state level.4 Emissions and generation included in this report’s Northwest footprint reflect power generated by plants within the region, rather than power used by Northwest customers.5 As part of the larger Western Interconnection, utilities in the Northwest can buy and sell power outside of the region. Generally speaking, the Northwest exports electricity when supply exceeds demand (typically in the spring) and imports power when demand is high (typically in the winter). Electric generation in this report exceeds Northwest demand because imports and exports are not accounted for in the analysis. 6 Regarding emissions, this report is not a lifecycle analysis. It only includes emissions from the consumption of fuel and does not examine emissions from fuel production or power plant construction.
3 This report uses the words carbon, carbon dioxide and CO2 interchangeably. In all cases they refer to carbon dioxide. 4 The Northwest Power Act definition of the region only includes Montana west of the Continental Divide. The Power Act also includes small portions of Nevada, Utah and Wyoming that are within the Columbia River basin. 5 This report examines all electric power plants in the Northwest, including industrial generation. 6 Average generation in this report (2009‐13) is nearly 26,000 MWa. Northwest electric demand (not including MT east of the Continental Divide) was around 21,000 MWa over the same time period.
Jim Bridger
North Valmy

3 July 16, 2014
The chart below shows average Northwest and remaining US (not including the Northwest)
generation as defined by this report’s footprint. 7 The Northwest is set apart from the remaining
US because of its large hydroelectric system. On average, the Northwest generates over half of
its power from hydroelectricity.
Power Generation Mix
Carbon Footprints in Other Reports
Other groups, including the Northwest Power and Conservation Council and various state agencies, have drafted reports that include carbon footprint definitions. The footprint used in this report is very similar to the definition the Council used at its 2013 Greenhouse Gas Symposium and in a 2007 report, “Carbon Dioxide Footprint of the Northwest Power System.” Comparing this footprint to state agency reports is more challenging. For example, the Washington Department of Commerce publishes a fuel mix report that estimates the fuel used to meet electric demand in Washington. They include fuel that is consumed out‐of‐state to provide electricity for Washington. To address the issue of market purchases, they use a year specific estimate for power generated in the Northwest Power Pool.8 It is difficult to compare state specific estimates to this report. This report does not attempt to calculate state specific CO2 values. Additionally, it examines emissions/generation within a geographic area and does not provide a use based estimate. Although the data are not presented at the state level in this report, the key takeaways and concepts are still largely applicable to the individual states of Idaho, Montana, Oregon and Washington.
7 EIA (1) and EIA (4) data, five year (2009‐2013) average. 2013 data are preliminary. Due to variations in water supply, the electric generation mix changes yearly. The “Other, CO2 free” category is primarily nuclear power. Petroleum is the largest component of the “Other, CO2 emitting” category. 8 The estimate they use is for Power Pool resources after utilities’ claims on specific resources are deducted and is not the aggregate system mix. Washington Department of Commerce.
60%
6%
5%
18%
11%
1%
Northwest
4% 3%
22%
43%
27%
2%
Hydro
Wind
Other, CO2 free
Coal
Natural gas
Other, CO2 emitting
Remaining US Figure 2

4 July 16, 2014
The Global CO2 Emissions Trend is Up
The Northwest can play a role in reducing global CO2 emissions. However, carbon dioxide is a global pollutant and the Northwest cannot reduce global emissions on its own. The chart below shows total global CO2 emissions from energy use as well as emissions from China, the United States and the European Union. 9 Emissions from energy use include emissions from the electric power sector, transportation and other end use fuel consumption.10 From 2001 to 2011, global CO2 emissions increased over 30 percent. Over the same time period emissions from China rose 160 percent. US emissions increased slowly from 2001 to 2007 and then decreased to 2011. This decrease was in part due to the 2008 recession. European Union emissions have been trending downward since 2006.
Global CO2 Emissions from Energy Use
Over the next 20 years under a business‐as‐usual scenario, emissions from developed nations are expected to be flat. In contrast, emissions from developing nations are expected to increase.11 It is important to note that emissions per capita are typically higher in developed nations than in developing nations.
9 EU‐28 is built with CO2 emissions data from all 28 current member states for each year. 10 EIA (5) data. The data are only for emissions from the use of energy. Ecofys, a consultancy, estimated total global 2010 greenhouse gas emissions to be 48,629 million metric tons CO2 equivalent. Their value includes emissions from agriculture, land use change and other factors. 11 EIA (6) data. Total global emissions from energy use are forecasted to be over 40,000 million metric tons by 2030.
‐
5,000
10,000
15,000
20,000
25,000
30,000
35,000
2001 2002 2003 2004 2005 2006 2007 2008 2009 2010 2011
Million m
etric tons CO2
Global
China
US
EU 28
Figure 3

5 July 16, 2014
Northwest Electric Power Emissions are One Piece of the Pie
Emissions from the region’s electric power sector are one piece of the emissions pie. In the US overall, the largest CO2 emitting sector is electric power. That’s not true in the Northwest. The top carbon emitting sector in the Northwest is transportation. The figure below embodies two concepts. 12 The pie chart on the left compares total 2010 US and Northwest CO2 emissions from energy use. Emissions from the Northwest are shown in gray and remaining US emissions are in salmon. The Northwest as a whole represents around 3% of US CO2 emissions. The pie chart on the right shows the breakdown of how different sectors contributed to Northwest carbon emissions in 2010. The blue piece of the pie, representing about a third of Northwest CO2 emissions, is the electric power sector. The largest piece of the pie is the transportation sector, shown in green. The third piece is for other end use fuel consumption (natural gas for heating, fuel used for industrial processes, etc).
CO2 Emissions from Energy Use (2010)
12 EIA (3), EIA (4) and EPA EGRID data. These data differ slightly from other report data: in these data some industrial electric generation is included under “Other end use” rather than “Electric power.” The difference is around 4 percent. The chart only shows emissions from the consumption of energy and does not include agriculture greenhouse gas emissions. In 2010 US agriculture emissions (comprised mostly of methane and nitrous oxide) were 534 million metric tons of CO2 equivalent (EPA(1)).
Electricity
Transportation
Other
Northwest(184 million metric tons)
44%
32%
24%
Remaining US(5,448 million metric tons)
Figure 4

6 July 16, 2014
The Northwest Produces Low Carbon Power
Carbon intensity is a metric that describes how much CO2 is produced in the generation of electricity. A value for carbon intensity can be derived by dividing emissions by generation (metric tons of CO2 per megawatt hour). By this metric, electricity produced in the Northwest has half the carbon intensity of the US average.13
The chart below compares the carbon intensity of the Northwest and the top ten global economies in 2010.14 Looking at the three lowest intensity nations, France has invested heavily in nuclear power, whereas Brazil and Canada have large hydroelectric systems. Note that this chart shows carbon intensity, not total emissions by country or emissions per capita.
13 EIA (1), EIA (2), EIA (4), EPA Egrid data. 2013 value based on preliminary generation data and historic emission rates. The US CO2 intensity decline is in part to increased natural gas generation relative to coal generation. 14 International Energy Agency data used for non‐US intensity values. Note that the accounting methodology in the IEA data may differ from the methodology in this report. World Bank data used for determining top 10 global economies, 2010 nominal GDP.
‐
0.10
0.20
0.30
0.40
0.50
0.60
0.70
2001 2003 2005 2007 2009 2011 2013f
Metric tons CO2/M
Wh
Electric Power CO2 Intensity
Remaining US
Northwest
0.0 0.1 0.2 0.3 0.4 0.5 0.6 0.7 0.8 0.9 1.0
India
China
Remaining US
Germany
United Kingdom
Japan
Italy
Northwest
Canada
Brazil
France
Metric tons CO2/MWh
2010 Electric Power CO2 Intensity
Figure 6
Figure 5

7 July 16, 2014
Northwest Emissions Change Yearly
There are multiple factors that affect Northwest electric power CO2 emissions. Many of these factors, such as water supply, are outside the control of electric utilities. This section discusses why Northwest emissions change year‐to‐year.
Water Supply
The Northwest’s low carbon power is mostly the result of the region’s large hydroelectric system. In high water years, more hydroelectricity is produced than in low water years. 15 This extra hydropower reduces the need to operate coal and gas power plants and thus reduces overall emissions, all other factors held constant. Looking at the chart below, the light blue solid line shows CO2 emissions from 2001 to 2013.16 The dark blue dashed line shows water supply as a percent of average and corresponds with the right hand axis.17 Note that during high water years CO2 emissions tend to be lower.
Northwest Electric Power CO2 Emissions and Water Supply
Given the significant yearly variations of carbon emissions, caution should be taken when comparing emissions of specific years. For example, there was a 25 percent drop in CO2 emissions from 2010 to 2011. Water supply was likely the most important factor in the drop: 2010 was an 84 percent water year and 2011 was a 141 percent water year.
There have been studies done that estimate how CO2 emissions increase when Northwest hydropower is decreased. In 2007, the Northwest Power and Conservation Council estimated that the removal of the Lower Snake River dams would increase CO2 emissions by around four million metric tons per year.18 The Lower Snake dams generate around 1,000 megawatts of
15 Water supply is not the only factor that affects hydroelectric generation. Timing of water and other river uses affect generation as well. 16 EIA (1), EIA (2), EIA (4), EPA EGrid data. Values for 2013 are forecasted. 17 NOAA data. 1981‐2010 used as baseline for average. 18 Northwest Power and Conservation Council (2). The Council assumed that natural gas would replace the lost hydropower.
0%
25%
50%
75%
100%
125%
150%
‐
10
20
30
40
50
60
70
2001 2003 2005 2007 2009 2011 2013f
Percent of average water supply
Million m
etric tons CO2
CO2 emissions
Water supply
Figure 7

8 July 16, 2014
average energy per year.19 This roughly translates to 4,000 metric tons of CO2 per 1 MWa lost (around 0.45 metric tons of CO2 per megawatt hour of hydroelectricity lost).
Demand for Northwest Electricity
Hydroelectric generation is not the only driver of Northwest emissions. Looking at the chart above, 2001 emissions are slightly lower than 2008 emissions even though 2001 was a lower water year.
This rise in emissions was in part due to increased demand for Northwest electricity, both inside and outside of the region. In 2008 the Northwest produced over 25 percent more electricity than in 2001. Although much of the increased production was hydroelectric, some of the extra power was produced with natural gas, which increased total emissions.20
Production of Coal, Gas and Wind Electricity
Other factors that influence carbon dioxide emissions include the amount of coal, natural gas and other CO2 free resource production. Although gas and coal power plants have different resource characteristics, they are both dispatchable resources and to some extent are substitutable. Typically, natural gas power plants generate electricity with less than half the carbon emissions of coal. When natural gas generation replaces equal amounts of coal, carbon emissions decrease.21 Other CO2 free generating resources, such as wind power, can lower the need to utilize coal/gas resources, further reducing emissions.
2007 and 2013 provide a good example of this effect. In 2007 and 2013 water supply levels were nearly identical. Additionally, the Northwest produced more electricity in 2013 than in 2007. However, 2013 CO2 emissions are expected to be 56‐57 million metric tons whereas 2007 emissions were 62 million metric tons. The table below looks at total generation by fuel source in 2007 and 2013.22 Note that the region used less coal and more natural gas in 2013 than 2007. In net, this decreased emissions. Although the region produced more electricity in 2013, much of this increased production came from a CO2 free resource, wind generation.
Northwest Generation Comparison
Energy in MWa 2007 201323 Coal 5,498 4,722
Natural gas 2,729 3,322
Wind 497 2,131
Hydro 14,932 14,888
Other, CO2 free 1,217 1,301
Other, CO2 emitting 161 221
Total generation 25,034 26,585
Total CO2, million metric tons 62 56‐57
19 BPA. 20 Coal use was similar in 2001 and 2008. 21 The usage of natural gas relative to coal is a function of various factors, including fuel prices. 22 EIA (1), EIA (2), EIA (4), EPA EGrid data. 23 2013 energy values are preliminary, CO2 value is forecasted.
Figure 8

9 July 16, 2014
Every Utility Produces a Different Amount of CO2
The electric power needs of Northwest customers are met with electricity of varying carbon intensity depending on their electric utility/provider. As such, Northwest customers may be affected differently by carbon reduction policies. This report provides a regional perspective of carbon in the electric power sector. It does not drill down to look at carbon emissions, implications of new carbon reduction policies or carbon reduction efforts on a utility or customer basis. Utilities in the Northwest have different resource mixes. Coal‐fired power plants produce over 75 percent of the CO2 emissions in the Northwest electric power sector.24 Natural gas power plants are the second biggest CO2 emitter. Some utilities are hydropower dominant. Others rely more heavily on thermal resources, such as coal and natural gas. The figure below shows the annual power supply mix of three sample Northwest utilities.25
Annual Energy Supply (MWa)
24 EIA (1), EIA (2), EIA (4) and EPA EGrid data. 2009 – 2013 average. 25 PNUCC.
Utility x
Hydro
Wind
Other, CO2 free
Coal
Natural gas
Contracts/imports
Utility y
Utility z
Figure 9

10 July 16, 2014
‐
250
500
750
1,000
2015 2016 2017 2018 2019
Annual energy (MWa)
The Northwest is Cutting Carbon on Many Fronts
The Northwest electric power sector is undertaking many efforts to reduce its carbon footprint. Some of these efforts have carbon reduction as the primary goal; others have carbon reduction as an auxiliary goal. Appendix B contains a matrix of select carbon reduction policies and regulations in Idaho, Montana, Oregon and Washington. Yearly variations in emissions can make tracking the impact of CO2 reduction efforts difficult. To evaluate their effectiveness, carbon reduction efforts are often given an offset value, which are commonly expressed as tons of CO2 reduced per megawatt hour. For example, in their 2013 Integrated Resource Plans, Puget Sound Energy and Portland General Electric estimated that future wind projects would offset CO2 at a rate of 0.25 and 0.41 metric tons per megawatt hour, respectively.26 Offset values vary by the methodology used to determine them and by the balancing authority that the CO2 reduction effort is located in. As such, regional offset values (even the ones used in this report) are estimates, not absolutes.
Energy Efficiency Programs
By reducing the need to build coal or gas power plants, energy efficiency avoids CO2 emissions. The Northwest is a national leader in energy efficiency, saving 5,300 annual average megawatts since 1978. The Northwest Power and Conservation Council estimated that these savings prevented nearly 21 million metric tons of CO2 emissions in 2012.27 The Council derived this estimate by assuming that without energy efficiency the region would have generated 47 million extra megawatt hours (5,300 MWa) of electricity at a rate of 0.45 metric tons of CO2 per MWh.
Going forward, utilities are planning to continue aggressive conservation efforts. The chart below shows forecasted cumulative energy efficiency savings from Northwest utility programs over the next five years.28
Northwest Utility Energy Efficiency Savings Forecast
26 PGE value was estimated by E3. 27 Northwest Power and Conservation Council (3). 28 PNUCC.
Figure 10
11 July 16, 2014
Coal Plant Retirements
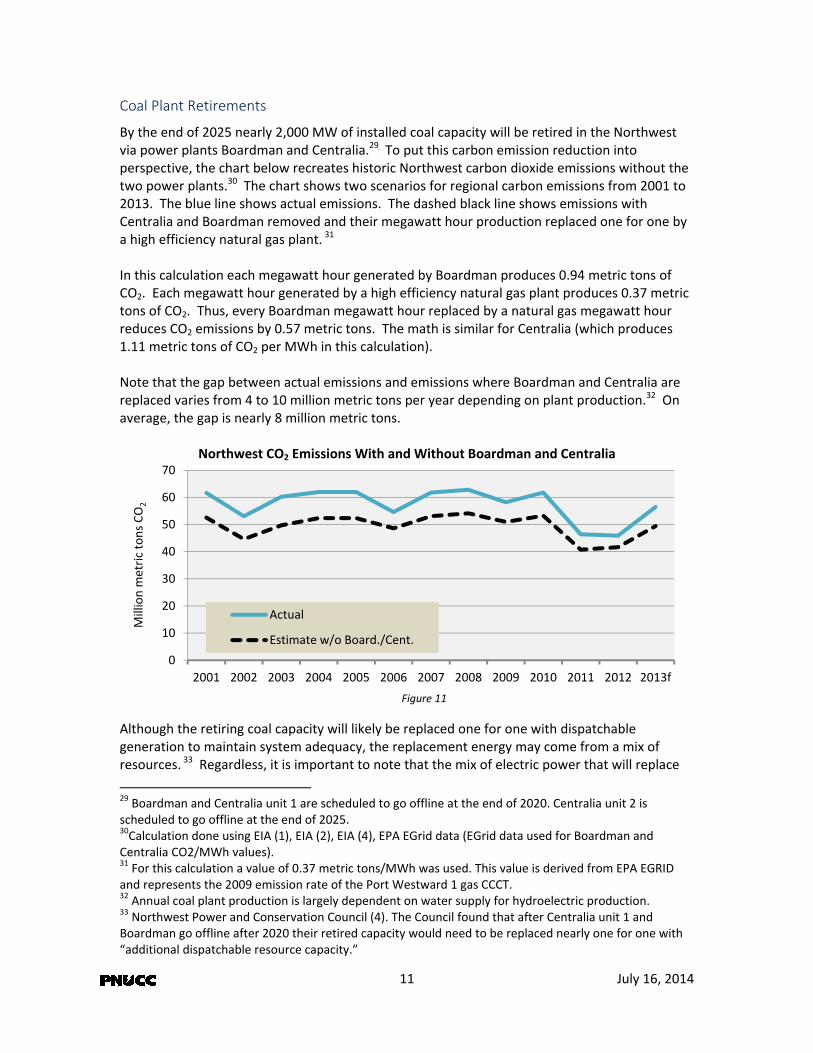
By the end of 2025 nearly 2,000 MW of installed coal capacity will be retired in the Northwest via power plants Boardman and Centralia.29 To put this carbon emission reduction into perspective, the chart below recreates historic Northwest carbon dioxide emissions without the two power plants.30 The chart shows two scenarios for regional carbon emissions from 2001 to 2013. The blue line shows actual emissions. The dashed black line shows emissions with Centralia and Boardman removed and their megawatt hour production replaced one for one by a high efficiency natural gas plant. 31 In this calculation each megawatt hour generated by Boardman produces 0.94 metric tons of CO2. Each megawatt hour generated by a high efficiency natural gas plant produces 0.37 metric tons of CO2. Thus, every Boardman megawatt hour replaced by a natural gas megawatt hour reduces CO2 emissions by 0.57 metric tons. The math is similar for Centralia (which produces 1.11 metric tons of CO2 per MWh in this calculation). Note that the gap between actual emissions and emissions where Boardman and Centralia are replaced varies from 4 to 10 million metric tons per year depending on plant production.32 On average, the gap is nearly 8 million metric tons.
Northwest CO2 Emissions With and Without Boardman and Centralia
Although the retiring coal capacity will likely be replaced one for one with dispatchable generation to maintain system adequacy, the replacement energy may come from a mix of resources. 33 Regardless, it is important to note that the mix of electric power that will replace
29 Boardman and Centralia unit 1 are scheduled to go offline at the end of 2020. Centralia unit 2 is scheduled to go offline at the end of 2025. 30Calculation done using EIA (1), EIA (2), EIA (4), EPA EGrid data (EGrid data used for Boardman and Centralia CO2/MWh values). 31 For this calculation a value of 0.37 metric tons/MWh was used. This value is derived from EPA EGRID and represents the 2009 emission rate of the Port Westward 1 gas CCCT. 32 Annual coal plant production is largely dependent on water supply for hydroelectric production. 33 Northwest Power and Conservation Council (4). The Council found that after Centralia unit 1 and Boardman go offline after 2020 their retired capacity would need to be replaced nearly one for one with “additional dispatchable resource capacity.”
0
10
20
30
40
50
60
70
2001 2002 2003 2004 2005 2006 2007 2008 2009 2010 2011 2012 2013f
Million m
etric tons CO2
Actual
Estimate w/o Board./Cent.
Figure 11

12 July 16, 2014
retiring coal generation will likely have carbon emissions. Lastly, some of the power currently produced by Boardman and Centralia is sold out of region – depending on carbon accounting methods, we may not be able to attribute those reductions to the Northwest.
State Renewable Portfolio Standards
Renewable portfolio standards have contributed to the development of around 8,000 megawatts of installed wind capacity in the Northwest.34 The chart below shows an estimate of how wind development has reduced Northwest carbon emissions. The blue line shows reported regional emissions. The black dashed line shows Northwest emissions with the region’s historic wind production replaced one for one by a high efficiency natural gas plant. For example, in 2013 the Northwest produced nearly 19 million megawatt hours of wind power. This production was multiplied by 0.37 (the metric tons of CO2 per MWh a high efficiency natural gas plant produces) and then added to actual regional emissions to produce the 2013 estimate of CO2 without wind. The gap in 2013 is nearly 7 million metric tons. 35
Impact of Wind on Northwest CO2 Emissions
Figure 12 Readers should keep in mind that it is not known how much wind would have been built without the renewable portfolio standards. Additionally, some Northwest wind is committed out of region. 36 Since this report is examining generation within a geographic boundary, no adjustment was made for imports or exports.
34 PNUCC. 35 As a point of reference, Environment Oregon estimated that in 2012 “Renewable Electricity Policies” saved 5 million metric tons of CO2 in MT, ID, OR & WA. The 2012 gap in this report is 6 million metric tons. 36 The PNUCC 2014 Northwest Regional Forecast shows just under 5,000 MW of Northwest wind (out of roughly 8,000 MW) committed to Northwest load.
‐
10
20
30
40
50
60
70
2001 2002 2003 2004 2005 2006 2007 2008 2009 2010 2011 2012 2013f
Million m
etric tons CO2
Actual
Estimate w/o wind

13 July 16, 2014
Looking Forward: Options and Costs
Going forward, utilities have a range of options for reducing carbon emissions.37 The costs and benefits of these options will be different for each utility. Dollars per metric ton is a common way to express the per unit cost of reducing CO2. It is calculated by dividing the net cost of a measure by the avoided emissions. For example, if a carbon reduction measure has a net cost of $25 and reduces 0.5 metric tons of CO2 then it costs $50 per metric ton (25 / 0.5 = 50).
What constitutes a reasonable price to pay for carbon reduction is a hotly debated subject. Various calculations on the social cost of carbon exist and present a large range of values due to various assumptions, including the discount rate.38 There are also various carbon pricing programs around the world. A selection of current CO2 prices is shown below.
Sample of Current CO2 Market Prices
Group Measure US dollars/metric ton Notes
California Air Resources Board Cap & Trade $11 Feb. 2014 auction
European Union Cap & Trade $7 ICE, for Jul. 2014
British Columbia Tax $28 2014 price
Wind and other Variable Energy Renewable Resources
Beyond renewable portfolio requirements, wind and other variable energy renewable resources could be built for carbon reduction. Variable energy renewable resources provide energy to the electric power system. However, they do not provide significant peak capacity. Today, the Northwest is showing a need for additional peak capacity and potentially for more flexibility. In regards to energy, the region looks largely sufficient.39 As such, utilities will likely have to build dispatchable generating resources in addition to variable energy renewable resource.
Various studies have been conducted by Northwest utilities and national groups on the cost of reducing carbon using variable energy renewable resources. It is important to remember that costs will vary by region, utility and project. Additionally, future technologies, such as storage, may reduce the cost of using variable energy renewable resources for carbon reduction.
37 If applicable, and unless otherwise noted, values in this section have been converted to 2014$ US dollars using the Bureau of Labor Statistics inflation calculator and to metric tons. 38 The US Interagency Working Group on Social Cost of Carbon report has a range of $12 to $66 per metric ton of CO2 for discount year 2015 using a discount rate ranging from 5% to 2.5%. 39 Northwest Power and Conservation Council and BPA. PNUCC.
Cost per ton =
Net cost of measure
Avoided emissions
Figure 13

14 July 16, 2014
E3, a consultancy, estimated the cost for Portland General Electric to use wind power located in the Columbia River Gorge in 2030 to reduce carbon dioxide at around $160 per metric ton.40 They derived this value using the following assumptions:
Cost of Reducing CO2 with Wind, E3 for PGE
Levelized cost/MWh $ 95
Transmission cost $ 6
Integration cost $ 10
Energy value $ (40)
Capacity value $ (4)
Net Cost $ 66
Metric tons CO2 offset 0.41
Cost/metric ton CO2 $ 162
Puget Sound Energy came to a similar wind cost estimate in its 2013 Integrated Resource Plan. Avista estimated that increasing renewable portfolio standards across the Western Interconnection would reduce carbon dioxide at a cost of nearly $200 per metric ton.41 In a 2010 national study, Bloomberg New Energy Finance estimated that the US would be able to reduce CO2 using wind at a cost ranging from $0 to $30 per metric ton in 2030.42 The study assumed that the wind was being built in lieu of high efficiency coal plants. Although that assumption is not applicable in the Northwest, it does help highlight that the cost of using variable energy renewable resources to reduce carbon will vary widely by region. In a study of elevating California’s renewable standard from 33 percent to 40 or 50 percent, E3 found that the higher renewable standards would reduce CO2 at a cost of $350 to $1,050 per metric ton, depending on the scenario.43 Notably, E3 found that the cost of reducing carbon with renewables rises as renewable penetration increases and that a solar‐only strategy was more expensive than a diversified renewable strategy. Similarly, Berkley National Laboratory has found that that the value of variable energy resources exhibits diminishing marginal returns.44 Other studies have indicated that variable energy renewable resources have a greater impact on carbon reduction in regions with high carbon intensity as opposed to regions with lower carbon intensity. 45 None of these aforementioned studies focused expressly on the Northwest – most focused on California which has higher variable energy resource penetration rates than the Northwest.
40 E3 for Portland General Electric’s 2013 Integrated Resource Plan. 41 Avista 2013 Integrated Resource Plan. 42 The study also estimated that solar and nuclear power would reduce CO2 at a cost of around $50 per metric ton. 43 E3, “Investigating a Higher Renewables Portfolio Standard in California.” 44 Mills and Wiser, 2013. Interestingly, solar power was found to have a higher value than wind power at low penetration rates, but wind maintained its value better than solar at higher penetration rates. 45 Siler‐Evans, et. al., 2013 and Kaffine, et. al., 2012.
Figure 14

15 July 16, 2014
Coal Plant Retirements and Operational Changes
Beyond Boardman and Centralia, the region could prematurely retire other coal plants to reduce carbon emissions. If this is done, it will be necessary to build dispatchable generating resources to replace the lost capacity. In its 2013 Integrated Resource Plan Avista estimated that prematurely retiring coal plants in the Western Interconnection reduces carbon dioxide at a cost of $95 per metric ton. Ultimately, the cost will depend on many factors, including future environmental regulations.
Another option could be to limit coal fired generation use. Due to low marginal costs coal units typically run more often than natural gas units. It could be possible to reduce Northwest carbon emissions by restricting the use of coal generation and running natural gas generation more frequently. For example, a yearly (or multiyear) usage cap could be imposed on coal fired generation. This strategy only works when there is idle natural gas generation available to run instead of coal. The cost of this strategy is directly related to the fuel cost spread between natural gas and coal. The efficiency of different natural gas plants and the cost of dispatching coal units differently would factor into the cost effectiveness formula as well.
Energy Efficiency
As noted in this report (see Figure 10), the Northwest will continue to develop high levels of energy efficiency. New energy efficiency measures will reduce CO2 emissions by reducing the need to operate coal and gas power plants. The cost per ton of using energy efficiency to reduce carbon emissions varies by energy efficiency measure. Some energy efficiency measures may reduce overall system costs and carbon emissions and thus reduce carbon at a zero or negative cost per ton.
Carbon Cap and Trade
A cap and trade program sets a cap on the amount of carbon that can be emitted. Allowances to emit up to the cap are then distributed and traded. A notable example of cap and trade is the California Air Resources Board program which went into effect in 2013. At current California auctions one metric ton of CO2 can be bought for $11.
46 Today, most of California’s CO2 allowances are given away – the number of free allowances will be reduced in the future.47
Carbon Tax
A carbon tax is a penalty paid on each unit of carbon emitted. The penalty sends a price signal to emit less carbon. One notable carbon tax example is British Columbia’s $30 (Canadian) per metric ton of CO2 tax.
48 The BC carbon tax is revenue neutral – the proceeds are used to reduce other taxes.
In the short run, a carbon tax may cause electric utilities to run coal plants less often and natural gas units more often. In the long run, a tax may provide an incentive to build low/zero carbon
46 CARB. February 2014 auction. 2014 and 2017 vintage allowances cleared at $11.48 and $11.38, respectively. 47 Environmental Defense Fund. 48 British Columbia Ministry of Finance.

16 July 16, 2014
generation. The amount of carbon reduced through a tax is dependent on the tax amount, fuel prices, generating resource costs, availability of substitutes and price elasticities. Portland State University, in conjunction with the Northwest Economic Research Center, published a 2013 report estimating the impact of a carbon tax in Oregon.49 The report found that a tax of $60 per metric ton would reduce Oregon’s CO2 emissions in 2035 by around 6 million metric tons (including transportation and other sectors) and collect $2 billion of revenue.50 The study did not take into account emissions associated with electricity imported from outside of Oregon. A 2013 Washington study conducted by Regional Economic Models, Inc, a consultancy, estimated that a tax of $50 per metric ton would reduce Washington’s 2035 CO2 emissions by around 7 million metric tons (including transportation and other sectors) and collect around $3 billion of revenue.51 The analysis did not seem to take into account electricity imported from outside of Washington. Both studies ran simulations of carbon taxes at different levels, and both studies found that a carbon tax could have positive employment and economic outcomes, depending on treatment of tax revenues. However, the Oregon report cautioned that “it is impossible to institute a Carbon Tax without negatively affecting some industries.”
Other Options
There are other carbon reduction options available that are not discussed in this report including increased market efficiency, increased/new hydropower, new nuclear power, carbon capture and sequestration, increased distribution system efficiency and carbon offsets.
49 Liu and Renfro, 2013. 50 The tax was modeled to start in 2013 at $10 per metric ton and increase $10 per year until it hit $60. The study did not expressly indicate if it uses real or nominal dollars. 51 The tax was modeled to start in 2015 at $10 per metric ton and increase $5 per year until it hit $50. The study reports revenue amounts in 2013 dollars but did not expressly indicate if the proposed tax is in real or nominal dollars.

17 July 16, 2014
Further Study
This report discusses the challenge of defining a regional carbon footprint, provides perspective on Northwest electric power emissions and broadly examines ongoing and future carbon reduction options. If the Northwest takes further steps to reduce its electric power carbon footprint the following topics should be explored and/or discussed:
Northwest specific carbon reduction supply curves (the Northwest Power and Conservation Council has indicated that they may address this topic in its upcoming Seventh Power Plan).
The challenge of reducing emissions from power plants with multiple owners located in different states.
The stranded assets problem.
The issue of equity in regards to carbon reduction.
The value of regulatory certainty in carbon reduction plans.

18 July 16, 2014
Report Sources
Avista. “2013 Electric Integrated Resource Plan.” 2013. Accessed via: http://www.avistautilities.com/inside/resources/irp/electric/Documents/Avista_2013_Electric_IRP_Final.pdf Bloomberg New Energy Finance. “Carbon Markets – North America – Research Note.” 2010. Accessed via: https://www.bnef.com/InsightDownload/7100/pdf BLS. “CPI Inflation Calculator.” Accessed in 2014 via: http://www.bls.gov/data/inflation_calculator.htm BPA. “Power benefits of the lower Snake River dams.” 2009. Accessed via: http://www.bpa.gov/news/pubs/FactSheets/fs200901‐Power%20benefits%20of%20the%20lower%20Snake%20River%20dams.pdf British Columbia Ministry of Finance. “Budget and Fiscal Plan, 2014/15 – 2016/17.” 2014. Accessed via: http://bcbudget.gov.bc.ca/2014/bfp/2014_budget_and_fiscal_plan.pdf CARB. “California Air Resources Board Quarterly Auction 6 February 2014 Summary Results Report.” 2014. Accessed via: http://www.arb.ca.gov/cc/capandtrade/auction/february‐2014/results.pdf E3. “Investigating a Higher Renewables Portfolio Standard in California.” 2014. Accessed via: https://ethree.com/documents/E3_Final_RPS_Report_2014_01_06_with_appendices.pdf E3 (for Portland General Electric’s 2013 Integrated Resource Plan). “PGE Low Carbon IRP Portfolios.” 2013. Accessed via: https://ethree.com/documents/E3_PGE_LowC_FinalReport_5‐28‐2013.pdf Ecofys. “World GHG Emissions Flow Chart, 2010.” 2013. Accessed via: http://www.ecofys.com/files/files/asn‐ecofys‐2013‐world‐ghg‐emissions‐flow‐chart‐2010.pdf EIA (1). “Net Generation by State by Type of Producer by Energy Source (EIA‐906, EIA‐920, and EIA‐923).” 2013. Accessed via: http://www.eia.gov/electricity/data/state/ EIA (2). “U.S. Electric Power Industry Estimated Emissions by State (EIA‐767, EIA‐906, EIA‐920, and EIA‐923).” 2013. Accessed via: http://www.eia.gov/electricity/data/state/ EIA (3) “State‐Level Energy‐Related Carbon Dioxide Emissions, 2000‐2010.” EIA, 2013. Accessed via: http://www.eia.gov/environment/emissions/state/analysis/ EIA (4) Website, “Electricity Data Browser.” EIA, accessed in 2014 for North Valmy and Jim Bridger generation data. Accessed via: http://www.eia.gov/electricity/data/browser/ EIA (5). Website, “International Energy Statistics.” Accessed in 2014 via: http://www.eia.gov/cfapps/ipdbproject/iedindex3.cfm?tid=90&pid=44&aid=8

19 July 16, 2014
EIA (6). “International Energy Outlook 2013.” 2013. Accessed via: http://www.eia.gov/forecasts/ieo/pdf/0484(2013).pdf Environmental Defense Fund. “AB 32 Cap‐and‐Trade Auction, Frequently Asked Questions.” 2013. Accessed via: https://www.edf.org/sites/default/files/Cap_and_trade_auction_FAQ‐FINAL_March_1_2013.pdf EPA (1). DRAFT Inventory of U.S. Greenhouse Gas Emissions and Sinks: 1990 – 2012. 2014. Accessed via: http://www.epa.gov/climatechange/Downloads/ghgemissions/US‐GHG‐Inventory‐2014‐Main‐Text.pdf EPA EGrid. “Eighth edition with year 2009 data (eGRID2012 Version 1.0).” 2012. Accessed via: http://www.epa.gov/cleanenergy/energy‐resources/egrid/index.html Environment Oregon. “Moving America Forward.” 2014. Accessed via: http://environmentoregon.org/sites/environment/files/reports/OR_Moving_Forward_scrn.pdf Interagency Working Group on Social Cost of Carbon. “Technical Support Document: ‐ Technical Update of the Social Cost of Carbon for Regulatory Impact Analysis ‐ Under Executive Order 12866.” US Government, 2013. Accessed via: http://www.whitehouse.gov/sites/default/files/omb/inforeg/social_cost_of_carbon_for_ria_2013_update.pdf Intercontinental Exchange (ICE). “Futures and options, energy.” Website, accessed in 2014 via: https://www.theice.com/emissions.jhtml International Energy Agency. “CO2 Emissions from Fuel Combustion, Highlights.” 2013. Accessed via: http://www.iea.org/publications/freepublications/publication/CO2EmissionsFromFuelCombustionHighlights2013.pdf Kaffine, D; McBee, B and Lieskovsky J. “Emissions Savings from Wind Power Generation: Evidence from Texas, California and the Upper Midwest.” Working paper, Colorado School of Mines, 2012. Accessed via: http://econbus.mines.edu/working‐papers/wp201203.pdf Liu, J and Renfro, J. “Carbon Tax and Shift: How to make it work for Oregon’s Economy.” Northwest Economic Research Center Report. Accessed via: http://www.pdx.edu/nerc/carbontax2013.pdf Mills, Andrew and Wiser, Ryan. “Changes in the Economic Value of Variable Generation at High Penetration Levels: A Pilot Case Study of California.” 18th Annual POWER Conference on Energy Research and Policy, 2013. Accessed via: http://emp.lbl.gov/publications/changes‐economic‐value‐variable‐generation‐high‐penetration‐levels‐pilot‐case‐study‐c‐0 NOAA. “Northwest River Forecast Center Monthly Runoff Information.” Website accessed in 2014 via: http://www.nwrfc.noaa.gov/water_supply/ws_normals.cgi?id=TDAO3t

20 July 16, 2014
Northwest Power and Conservation Council (1). “Regional GHG Emissions – Status.” 2013. Accessed via: http://www.nwcouncil.org/media/6865106/G‐Charles‐Council‐Staff‐GHG‐Symposium.pdf Northwest Power and Conservation Council (2). ”Carbon Dioxide Footprint of the Northwest Power System.” 2007. Accessed via: http://www.nwcouncil.org/media/29399/2007_15.pdf Northwest Power and Conservation Council (3). “2012 Regional Conservation Achievements and Projections for 2013‐2015.” 2014. Accessed via: http://www.nwcouncil.org/media/6914345/8.pdf Northwest Power and Conservation Council (4). “Briefing on Resource Adequacy after Coal Plant Retirements.” 2013. Accessed via: http://www.nwcouncil.org/media/104950/6.pdf Northwest Power and Conservation Council and BPA. “Pacific Northwest Power Supply Adequacy Assessment for 2017.” 2012. Accessed via: http://www.nwcouncil.org/media/30104/2012_12.pdf PNUCC. “Northwest Regional Forecast of Power Loads and Resources, 2015 through 2024.” 2014. Accessed via: http://pnucc.org/system‐planning/northwest‐regional‐forecast Puget Sound Energy. “2013 Integrated Resource Plan.” 2013. Accessed via: http://pse.com/aboutpse/EnergySupply/Documents/IRP_2013_Chapters.pdf Regional Economic Models, Inc. “The Economic, Demographic, and Climate Impact of Environmental Tax Reform in Washington and King County.” 2013. Accessed via: http://www.remi.com/the‐economic‐demographic‐and‐climate‐impact‐of‐environmental‐tax‐reform‐in‐washington‐and‐king‐county Siler‐Evans, K; Azevedo, I; Morgan, M and Apt, J. “Regional Variations in the Health, Environmental, and Climate benefits of Wind and Solar Generation.” Proceedings from the National Academy of Sciences, Early Edition, 2013. Accessed via: http://www.pnas.org/content/110/29/11768.abstract Washington Department of Commerce. “Fuel Mix Disclosure.” Website, accessed in 2014 via: http://www.commerce.wa.gov/Programs/Energy/Office/Utilities/Pages/FuelMix.aspx World Bank. “GDP (current US$).” Website, accessed in 2014 via: http://data.worldbank.org/indicator/NY.GDP.MKTP.CD

21 July 16, 2014
Appendix A – The Northwest and 111(d)
On June 2, 2014, the US Environmental Protection Agency proposed RIN 2060‐AR33 under section 111(d) of the Clean Air Act. The proposal seeks to reduce carbon dioxide emissions from the existing electric power sector. The EPA has the authority to regulate CO2 emissions due to a 2009 public endangerment finding.52 The proposed rule is relatively new and complex. As such, this appendix should be viewed as a working draft. All data and statements are subject to change and should be double checked before being quoted. Additionally, the proposed rule may change through the comment process and/or legal action. A final rule is expected in June 2015.
The proposal sets electric power CO2 intensity targets for state emissions in 2030. It does not prescribe a strategy to meet the targets – states must come up with their own individual plans (states may form multistate regions as well). Additionally, states can ask the EPA for a mass (tonnage) based target rather than an intensity target. State plans are due in June 2016, with extensions available until June 2018. The EPA estimates that the net effect of the proposal will be a 30% reduction in electric power CO2 emissions from 2005 to 2030.53 The proposed reduction targets vary by state, and the baseline for setting targets is 2012, not 2005. The 2012 baselines and 2030 targets for the four Northwest states are below:54
Proposed EPA CO2 Intensity Targets for Existing Generation
State
2012 CO2 Emissions
Intensity (pounds/MWh)
2030 CO2 Emission Intensity Goal (pounds/MWh)
Percent Reduction
Idaho 339 228 33%
Montana 2,246 1,771 21%
Oregon 717 372 48%
Washington 756 215 72%
111(d) Carbon Footprint
The carbon footprint in the proposed EPA rule has some similarities to the footprint used in this report. For example, both the EPA proposal and this report examine generation/emissions within a geographic boundary. However, the EPA proposal looks at generation/emissions within individual state boundaries. This report presents a four state region including two power plants outside of the four states. Although the EPA proposal does allow the formation of multistate regions, it is not known if a region as presented in this report, with two out of region power plants being included, could be formed under the EPA proposal.
52 This finding was a direct consequence of the 2007 Supreme Court case Massachusetts v. EPA. 53 EPA RIN 2060‐AR33, page 14. 54 Note the Washington value may differ than the value in other EPA documents. The value in this chart is sourced from EPA Goal Computation Technical Support Document.
Figure 15

22 July 16, 2014
111(d) Intensity Calculation
In the proposed rule the EPA focuses on carbon intensity (expressed in pounds per megawatt hour) for both the 2012 baseline and the 2030 goal. The EPA’s approach differs significantly from this report’s approach for calculating electric power carbon intensity. This report calculates carbon intensity by dividing total emissions by total generation. The EPA calculation is more selective: it divides emissions from most thermal power plants (excluding some industrial and/or small generation) by generation from the same thermal plants, wind and other renewables. This methodology excludes hydro and the majority of nuclear generation.55 Due to these exclusions the EPA intensity values are different than the values calculated in this report. The table below compares the results of PNUCC’s and the EPA’s carbon intensity calculations for the Northwest and remaining US. For the purpose of comparison, the footprint for both estimates includes all of Jim Bridger’s and 50% of North Valmy’s generation/emissions. It is not know if such a region could be formed under the EPA proposal.
CO2 Intensity Methodology Comparison (2012)
PNUCC Report Intensity (pounds/MWh)
EPA Intensity56 (pounds/MWh)
Northwest 430 1,315
Remaining US 1,220 1,451
Note that the difference in intensity between the PNUCC value and the EPA value is larger for the Northwest than the remaining US. This is mostly because the EPA’s calculation excludes hydropower – in 2012 hydropower accounted for over 60% of the region’s generation and less than 5% of remaining US generation. Water Year and 111(d) When calculating the 2030 carbon targets the EPA uses 2012 data for the baseline. Part of the equation is emissions from select thermal generation. In the Northwest, emissions from thermal generation fluctuate significantly each year, and are inversely correlated to water supply. High water supply leads to increased hydroelectric generation, which reduces the need to operate coal and natural gas units and thus reduces emissions. As this report illustrates (see Figure 7), 2012 had high levels of water supply. Due to the high level of water supply, and other factors including low natural gas prices and other CO2 free energy generation, in 2012 the Northwest electric power sector had the lowest CO2 emissions since 2001 (and possibly beyond). It does not appear that the EPA took into consideration the interaction between water supply and emissions in the Northwest. As such, using 2012 as a baseline may result in targets that are unintentionally difficult for Northwest states to meet.
55 The 2030 goal formation assigns 6% of existing nuclear generation (in MWh) to the denominator of the intensity equation. 56 PNUCC estimate using EPA 111(d) criteria.
Figure 16
23 July 16, 2014
Impact of Proposed Rule on the Northwest The impact of the proposal on the Northwest is unclear. States have considerable latitude to create their own carbon reduction plans and it is unlikely that those plans will be finalized before 2016. Additionally, the proposed rule may change based on comments and/or legal action. Once state level plans are crafted the impact of the proposed rule will be better known. Northwest utilities own and operate power plants outside of Idaho, Montana, Oregon and Washington. It is important to remember that the rule will impact other states in the Western Interconnection and that those impacts will reverberate back to the Northwest.
24 July 16, 2014
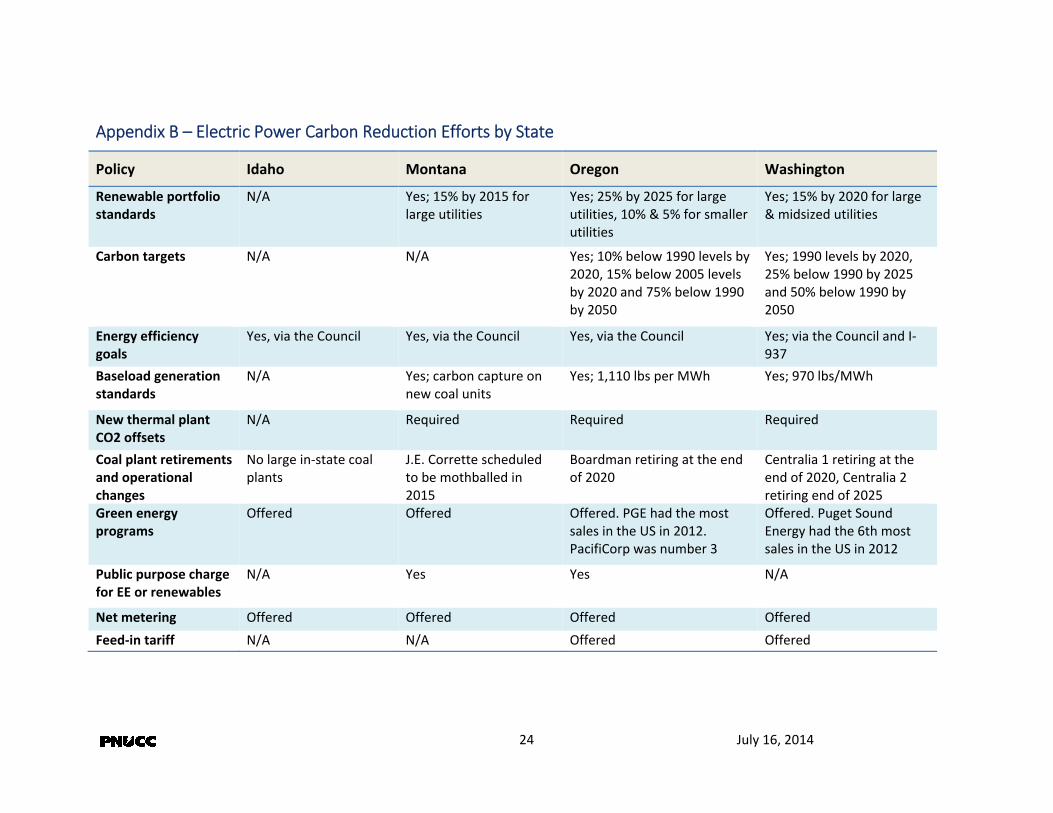
Appendix B – Electric Power Carbon Reduction Efforts by State
Policy Idaho Montana Oregon Washington
Renewable portfolio standards
N/A Yes; 15% by 2015 for large utilities
Yes; 25% by 2025 for large utilities, 10% & 5% for smaller utilities
Yes; 15% by 2020 for large & midsized utilities
Carbon targets N/A N/A Yes; 10% below 1990 levels by 2020, 15% below 2005 levels by 2020 and 75% below 1990 by 2050
Yes; 1990 levels by 2020, 25% below 1990 by 2025 and 50% below 1990 by 2050
Energy efficiency goals
Yes, via the Council Yes, via the Council Yes, via the Council Yes; via the Council and I‐937
Baseload generation standards
N/A Yes; carbon capture on new coal units
Yes; 1,110 lbs per MWh Yes; 970 lbs/MWh
New thermal plant CO2 offsets
N/A Required Required Required
Coal plant retirements and operational changes
No large in‐state coal plants
J.E. Corrette scheduled to be mothballed in 2015
Boardman retiring at the end of 2020
Centralia 1 retiring at the end of 2020, Centralia 2 retiring end of 2025
Green energy programs
Offered Offered Offered. PGE had the most sales in the US in 2012. PacifiCorp was number 3
Offered. Puget Sound Energy had the 6th most sales in the US in 2012
Public purpose charge for EE or renewables
N/A Yes Yes N/A
Net metering Offered Offered Offered Offered
Feed‐in tariff N/A N/A Offered Offered