Hydrosphere 3 rd Period. The Hydrosphere and the Water Cycle.
283
NSave Nature to Survive
ISSN: 0973 - 7049
: Special issue, Vol. 2;
Paper presented in International Conference onEnvironment, Energy and Development (from
Stockholm to Copenhagen and beyond)December 10 - 12, 2010, Sambalpur University
Debashis Raha and P. C. Mishra
283-293; 2010
CARBON COST FOR SAFE WATER SUPPLY THROUGH
ADVANCED TREATMENT OF RIVER WATER TO A COUNTRY
TOWN
Greenhouse gas
Global warming
Climate change
Water supply
Emission trading
Carbon costs

284
NSave Nature to Survive
DEBASHIS RAHA* AND P. C. MISHRA
Department of Environmental Science, Sambalpur University,Jyoti Vihar, INDIA
E mail: [email protected]
ABSTRACT
*Corresponding author
Greenhouse gas emission from fossil fuel burning is causing global warming and climatic change,
whose negative impact on economy, human development, environment and society will be manifested
through water. Importance of Carbon Footprint Accounting (CFA) for climate change mitigation
and adaptation are illustrated. CFA calculation process steps, methodology and mathematical
equations that applies, are explained for Meadow Town Water Supply. MTWS’s carbon footprint
report reveals that fossil fuel- based grid electricity contributes to 97% of greenhouse gas emission.
Carbon pollution reduction scheme (CPRS) or carbon emission trading (CET) is likely to increase
prices of carbon and water usage prices in the future, if the current trend in energy consumption
at water utilities continues. The challenge for the water utility engineers, scientists, operators,
accountants and customers are to minimize the energy and carbon intensity of water supply
services through diverse portfolio of measures.
285
INTRODUCTION
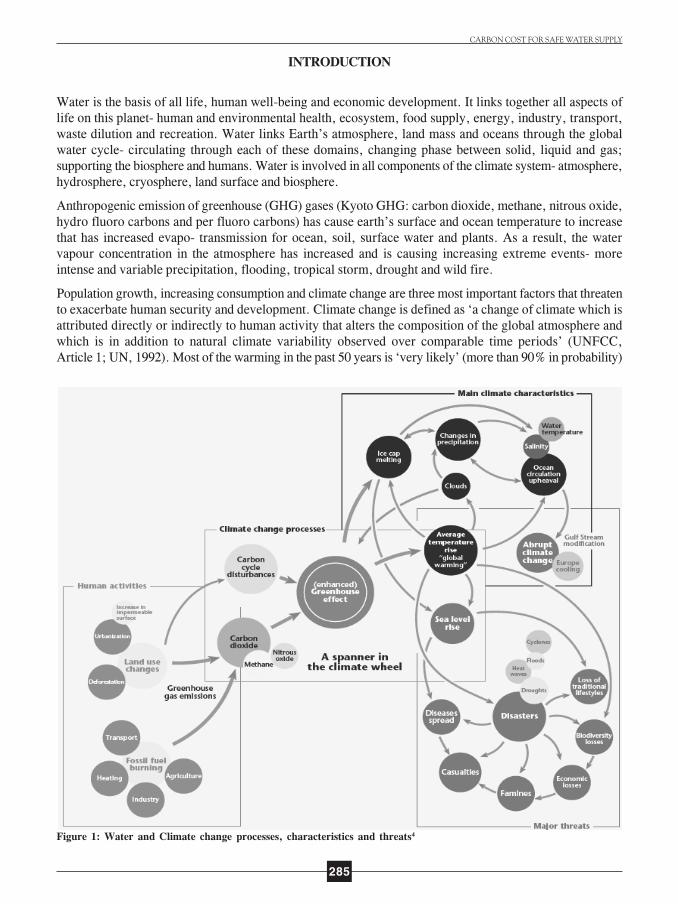
Water is the basis of all life, human well-being and economic development. It links together all aspects oflife on this planet- human and environmental health, ecosystem, food supply, energy, industry, transport,waste dilution and recreation. Water links Earth’s atmosphere, land mass and oceans through the globalwater cycle- circulating through each of these domains, changing phase between solid, liquid and gas;supporting the biosphere and humans. Water is involved in all components of the climate system- atmosphere,hydrosphere, cryosphere, land surface and biosphere.
Anthropogenic emission of greenhouse (GHG) gases (Kyoto GHG: carbon dioxide, methane, nitrous oxide,hydro fluoro carbons and per fluoro carbons) has cause earth’s surface and ocean temperature to increasethat has increased evapo- transmission for ocean, soil, surface water and plants. As a result, the watervapour concentration in the atmosphere has increased and is causing increasing extreme events- moreintense and variable precipitation, flooding, tropical storm, drought and wild fire.
Population growth, increasing consumption and climate change are three most important factors that threatento exacerbate human security and development. Climate change is defined as ‘a change of climate which isattributed directly or indirectly to human activity that alters the composition of the global atmosphere andwhich is in addition to natural climate variability observed over comparable time periods’ (UNFCC,Article 1; UN, 1992). Most of the warming in the past 50 years is ‘very likely’ (more than 90% in probability)
Figure 1: Water and Climate change processes, characteristics and threats4
CARBON COST FOR SAFE WATER SUPPLY

286
due to the observed increase in greenhouse gas (GHG) concentrations from burning of fossil fuels and landuse change (CSIRO, 2009; IPCC, 2008).
Water is the principal medium through which climate change will affect economic, social and environmentalconditions (Fig. 1; UNESCO, 2009). The main impacts of climate change on humans and the environmentoccur through water.
If the current trend in fossil fuel consumption continues, it is estimated that Earth’s temperature will rise by5 degrees Celsius and sea level rise by 140 cm is plausible by 2100, with associated droughts, heat waves,floods and cyclones, causing for water utilities (CA, 2008).
• reduced freshwater supplies and increased customer demand for water
• increased algal blooms, taste, odour and toxicity in water
• higher incidence of bushfires, storms to impact water quality and infrastructure operation
• increase infrastructure failure from changed soil structure, stability and corrosion
• up to 34% increase in cost of supplying urban water supply (CSIRO Australia, 2007)3
• drought threatens water security, requiring costly water infrastructure projects such as $1.2 billiondesalination plant in South- East Queensland to address current water supply problems
• increased evapotranspiration with associated increase in aridity and the severity of droughts
• increase in ground water salinity
• Reduced health of waterways due to lower environmental flowsStrategies and action to manage global warming and climate change are mitigation and adaptation. A fairand effective global agreement delivering deep cuts in emissions consistent with stabilizing concentrationsof greenhouse gases at around 450 parts per million or lower would be in everyone’s interests. Tacklingclimate change is the pro-growth strategy for the longer term, and it can be done in a way that does not capthe aspirations for growth of rich or poor countries. The Stern Review in 2006 concluded that by 2050extreme weather could reduce global GDP by 1% and that, unabated climate change could cost the world atleast 5% and up to more than 20% in GDP each year (Stern, 2007) . Economies that act earlier face lowerlong-term costs of around 15 per cent lower than with uniform international action (Australia, 2008; CA,2008).
Water is both life and livelihood (Blue Gold) and is vital to economy, development, society and naturalenvironment. In this paper, the process and calculation of GHG inventory, carbon footprint and carbon cost(applying the Australian Carbon Pollution Reduction Scheme (CPRS) framework), is described.
Meadow Town Water Supply (MTWS) facility
MTWS operates and manages the water supply for residential, commercial and industrial customers foraround 41,000 population in the Meadow Town by carrying out the following activities (Fig. 2 and Table 1):
Figure 2: Meadow Town Water Supply Processes
Screening Coagulation FlocculationRaw
Water
Raw water
Pump
Sedimentation
Flow and Quality
Monitoring (1)
Dual Media
FiltrationGranular activated
carbon adsorption
Fluoridation, pH
adjustment, Chlorine
and UV disinfection
Ferric chloride PolymerMeadow River
To Water Distribution
Networks for Customer
consumption
Quality
Monitoring (3)
Flow & Quality
Monitoring (4)
DEBASHIS RAHA AND P. C. MISHRA

287
1. extracts quality raw water from the Meadow River while complying with the environmental flowrequirements of the river, which is monitored by the upstream river flow gauging station
2. carries out water treatment through screening, coagulation, flocculation, dissolved air floatation (DAF),sedimentation, dual media filtration, granular activated carbon (GAC) adsorption, chlorine disinfection,fluoridation and pH adjustment
3. treats dual media backwash and other process wastewater in the lagoon and discharges treated effluentinto the Meadow River in compliance with the Pollution Control Act.
4. Measure, monitor, control and report drinking water quality (DWQ) in compliance with the WorldHealth Organisation (WHO) and/ or the Australian Drinking Water Guidelines (ADWG) in Table 2before pumping to the potable water reservoir for town water supply
5. Monitors and maintains total chlorine and minimum pressure of 20 meter head at customers’ tap
6. Measure, monitor and control operation and instrumentation through Systems Control and Data Acquisition(SCADA) and Integrated Instrumentation and Control (IICATS)
7. Receives customer feedback, complaints relating drinking water supply; analyse data, identify rootcauses, take corrective and preventive action to address the issue or opportunities for improvement;and respond to customers in compliance with its Customer Service Policy, Charter and Protocol.
Scope of MTWS’s Carbon Footprint Accounting (CFA)
For CFA, Scope 1 GHG emission (UNFCCC Category 1.A, 1B, 6) means emissions from fuel combusted,energy generated and used at MTWS facility site; Scope 2 GHG emission means energy produced by othercorporation outside MTWS facility and used by MTWS; and Scope 3 GHG emission means GHG emissionsthat are generated in the wider economy as a consequence of a facility’s activities but that are physicallyproduced by another facility e.g. employees’ business travels on a commercial airline.
For water utilities, ‘production of energy’ (Scope 1) normally means generation of renewable energy (gigajoule)from biogas cogeneration plants, hydro- electric plants, wind farm and solar panel and non- renewableenergy from diesel generator for back up electricity supply.
For water utilities, ‘consumption of energy’ normally means use or disposal of energy) for operation of the facility
(e.g. grid electricity for running motors, offices), transport fleet and losses in extraction, production and transmission.
CARBON COST FOR SAFE WATER SUPPLY
Table 1: Controlling Corporation, Facilities and Identification of GHG Sources
Meadow town Water Supply Corporation/Facility
60,000 PopulationGE, F Raw water transport from riverGE, F FiltrationGE, F Coagulation and FloculationGE, F SedimentationGE, F Dissolve air floatation (DAF)GE, F Dual Media FiltrationGE, F FluoridationGE, F Granular activated carbon (GAC) adsorptionGE, F Chlorine disinfectionGE, F Dual media filter backwash wastewater treatment and disposalGE, F Potable water compliant Water Guidelines 2004 pumed to ReservoirGE, F DWQ quality and free chlorine monitoring in the distribution networksGE, F RechlorinationGE, F Potable water distribution to customersF* Transport fleetGE, F Offices, laboratoryGE, F* Contractors
Note: GE: Grid electricity; F: Diesel for back-up generator; F*: Liquid and gaseous fuel
288
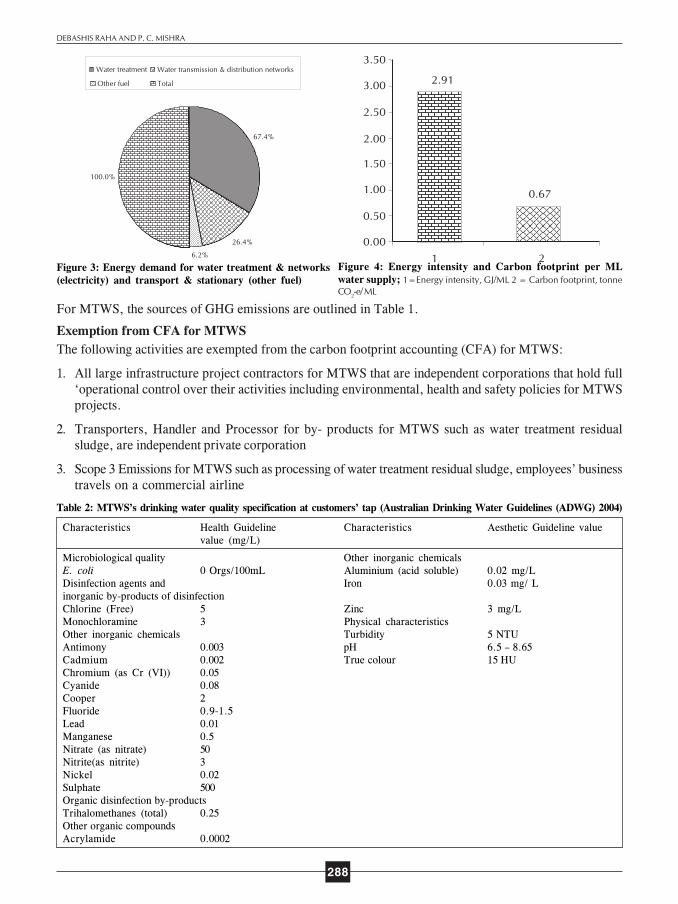
67.4%
26.4%
6.2%
100.0%
Water treatment Water transmission & distribution networks
Other fuel Total
Figure 3: Energy demand for water treatment & networks
(electricity) and transport & stationary (other fuel)
Figure 4: Energy intensity and Carbon footprint per ML
water supply; 1=Energy intensity, GJ/ML 2 = Carbon footprint, tonne
CO2-e/ ML
3.50
2.91
0.67
0.00
0.50
1.00
1.50
2.00
2.50
3.00
1 2
Characteristics Health Guideline Characteristics Aesthetic Guideline valuevalue (mg/L)
Microbiological quality Other inorganic chemicalsE. coli 0 Orgs/100mL Aluminium (acid soluble) 0.02 mg/LDisinfection agents and Iron 0.03 mg/ Linorganic by-products of disinfectionChlorine (Free) 5 Zinc 3 mg/LMonochloramine 3 Physical characteristicsOther inorganic chemicals Turbidity 5 NTUAntimony 0.003 pH 6.5 – 8.65Cadmium 0.002 True colour 15 HUChromium (as Cr (VI)) 0.05Cyanide 0.08Cooper 2Fluoride 0.9-1.5Lead 0.01Manganese 0.5Nitrate (as nitrate) 50Nitrite(as nitrite) 3Nickel 0.02Sulphate 500Organic disinfection by-productsTrihalomethanes (total) 0.25Other organic compoundsAcrylamide 0.0002
Table 2: MTWS’s drinking water quality specification at customers’ tap (Australian Drinking Water Guidelines (ADWG) 2004)
For MTWS, the sources of GHG emissions are outlined in Table 1.
Exemption from CFA for MTWS
The following activities are exempted from the carbon footprint accounting (CFA) for MTWS:
1. All large infrastructure project contractors for MTWS that are independent corporations that hold full‘operational control over their activities including environmental, health and safety policies for MTWSprojects.
2. Transporters, Handler and Processor for by- products for MTWS such as water treatment residualsludge, are independent private corporation
3. Scope 3 Emissions for MTWS such as processing of water treatment residual sludge, employees’ businesstravels on a commercial airline
DEBASHIS RAHA AND P. C. MISHRA

289
Step Task Explanation
1 Identifying key GHG sources To focus effort, resources and priority for GHG sources that contributes most to theoverall inventory or inventory uncertainty.1. Scope 2 grid electricity consumed2. Scope 1 Fuel e.g. diesel, gasoline, E10, natural gas, LPG consumed
2 Determining appropriate GHG · Estimation methodology depends upon whether the source is ‘key’ or ‘not key’inventory estimation and by data and resources available.methodology · Tier 1 is the basic method (refer Table 2)
· Tier 2 intermediate and Tier 3 most demanding in terms of complexity anddata requirements. They are more accurate.
3 Data collection activities or · Focus on the collection of data needed to improve estimates of key GHGMeasurement and Monitoring · establish and maintain good verification, documentation and checking
procedures (QA/QC) to minimize errors(MandM) Program · Develop comprehensive Annual Energy and GHG MandM program
4 GHG emission estimation Emissions are estimated for GHG sources in Step 1 applying methodology chosen inStep 2
5 Estimation uncertainty and Estimates of uncertainty are needed for all relevant source and sink categories,key GHG sources greenhouse gases, inventory totals and their trends.
6 Report inventory Present the inventory in an as concise and clear way as possible to enable users tounderstand the data, methods and assumptions used in the inventory.
Table 3: Process steps in preparing CFR
Table 4: CFR Parameters measurement and monitoring program (UNESCO, 2009)
Parameter Unit Minimum Method (Example)Frequency
CO2
mg/L Continuous ISO 10396:2007 Stationary source emissionsemissionmonitoring(CEM)
N2O mg/L CEM ISO 11564:1998 Stationary source emissions
Gas velocity CEM ISO 14164:1999 Stationary source emissions.CH
4mg/L CEM US EPA Method 3C - Determination of carbon dioxide, methane,
nitrogen and oxygen from stationary sources (i.e., landfills)General ISO/IEC 17025:2005 General requirements for the competence oftesting and calibration laboratories
ISO 10012:2003 Measurement management systems- Requirementsfor measurement processes and measuring equipmentWater flow kL ContinuousGaseous fuel GJ or Nm3 at Indirect method- invoices and adjustment for financial year beginning(1consumption a pressure of 101.323 Jul) and closing (30 Jun) stocks.
kilopascals; andtemperature of 15ºC(Standard condition)Nm3 at standard Direct measurement at point of consumptionconditions
Liquid fuels Kilolitres (kL) at 150C Using bulk filling meters corrected to 15° CGrid electricity GJ Invoices or industry metering records.consumption atfacilities
Scientific methodology and legislative framework
In Australia, the National Greenhouse and Energy Reporting Act 2007 (NGER Act; Aus. Govt, 2007), NGERRegulation 2008 (Aus. Govt, 2007) and NGER (Measurement) Determination (MD) 2009 (NGER MD,2009) provide the legal framework, technical guidelines and governance requirements for carbon footprintaccounting.
For MTWS, Method 1 of the NGER MD 2009 for calculating GHG emission, energy consumption andenergy production is applied, as MTWS does not carry out direct GHG emission monitoring and measurementfrom energy consumption.
CARBON COST FOR SAFE WATER SUPPLY
290
Carbon footprint accounting (CFA) principles
The following principles, at minimum, are applied for carbon footprint accounting for MTWS:
1. Transparency: There is sufficient and clear documentation such that individuals or groups other thanthe CFA compilers can understand and verify how the inventory was compiled.
2. Completeness: all identifiable GHG emission sources, energy production and consumption sourcesmust be accounted for. Where elements are missing their absence should be clearly documented togetherwith a justification for exclusion.
3. Consistency: Estimates for different inventory years, GHG emission sources, energy production andconsumption categories are made using the same method and data sources in all years, as far aspossible.
4. Comparability: GHG emissions, energy production and energy consumption is reported in a way thatallows it to be compared with the CFA for another water utilities using the same method.
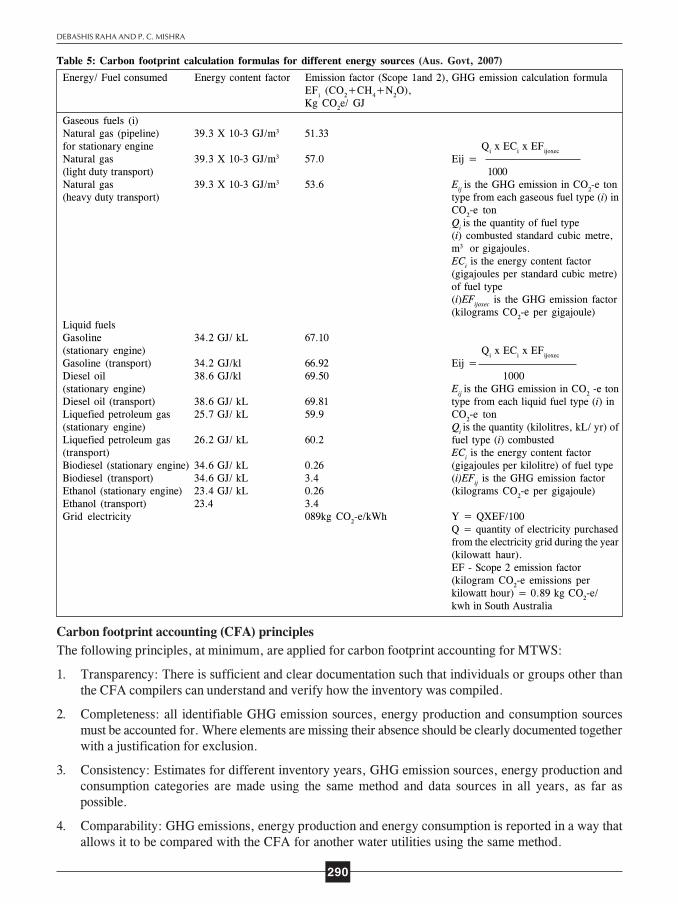
Table 5: Carbon footprint calculation formulas for different energy sources (Aus. Govt, 2007)
Energy/ Fuel consumed Energy content factor Emission factor (Scope 1and 2), GHG emission calculation formulaEF
i (CO
2+CH
4+N
2O),
Kg CO2e/ GJ
Gaseous fuels (i)Natural gas (pipeline) 39.3 X 10⁻³ GJ/m3 51.33for stationary engine Q
i x EC
i x EF
ijoxec
Natural gas 39.3 X 10⁻³ GJ/m3 57.0 Eij =(light duty transport) 1000Natural gas 39.3 X 10⁻³ GJ/m3 53.6 E
ij is the GHG emission in CO
2-e ton
(heavy duty transport) type from each gaseous fuel type (i) inCO
2-e ton
Qi is the quantity of fuel type
(i) combusted standard cubic metre,m3 or gigajoules.EC
i is the energy content factor
(gigajoules per standard cubic metre)of fuel type(i)EF
ijoxec is the GHG emission factor
(kilograms CO2-e per gigajoule)
Liquid fuelsGasoline 34.2 GJ/ kL 67.10(stationary engine) Q
i x EC
i x EF
ijoxec
Gasoline (transport) 34.2 GJ/kl 66.92 Eij =Diesel oil 38.6 GJ/kl 69.50 1000(stationary engine) E
ij is the GHG emission in CO
2 -e ton
Diesel oil (transport) 38.6 GJ/ kL 69.81 type from each liquid fuel type (i) inLiquefied petroleum gas 25.7 GJ/ kL 59.9 CO
2-e ton
(stationary engine) Qi is the quantity (kilolitres, kL/ yr) of
Liquefied petroleum gas 26.2 GJ/ kL 60.2 fuel type (i) combusted(transport) EC
i is the energy content factor
Biodiesel (stationary engine) 34.6 GJ/ kL 0.26 (gigajoules per kilolitre) of fuel typeBiodiesel (transport) 34.6 GJ/ kL 3.4 (i)EF
ij is the GHG emission factor
Ethanol (stationary engine) 23.4 GJ/ kL 0.26 (kilograms CO2-e per gigajoule)
Ethanol (transport) 23.4 3.4Grid electricity 089kg CO
2-e/kWh Y = QXEF/100
Q = quantity of electricity purchasedfrom the electricity grid during the year(kilowatt haur).EF - Scope 2 emission factor(kilogram CO
2-e emissions per
kilowatt hour) = 0.89 kg CO2-e/
kwh in South Australia
DEBASHIS RAHA AND P. C. MISHRA

291
CARBON COST FOR SAFE WATER SUPPLY
97%92.80%
3%6.20%
0%
20%
40%
60%
80%
100%
120%
% GHG (CO2-e) contribution % Energy contribution
Grid electricity
Other fuel
Figure 5: % Contribution to energy and Carbon emission of electricity and fuel
5. Accuracy: Uncertainties in GHG emission, energy production and consumption must be minimised andany estimates must neither be over nor under estimates of the true values at a 95% confidence level.
Carbon footprint report preparation steps
To describe in simple terms, compilation of CFR is a six- step process as explained in Table 3.
Measurement and monitoring program for the CFR
Sampling, measurement and monitoring program and analytical methods for key CFA parameters is illustrated in Table 4.
Carbon Footprint or GHG inventory methodology
Meadow Town Water Supply consumes grid electricity, gaseous fuel (natural gas), liquid fuel (gasoline,diesel, LPG and ethanol). The energy content factor, Tier 1 GHG emission factor and the formula used tocompile GHG inventory for MTWS is provided in Table 5.
Analysis of carbon footprint for
Meadow Town Water Supply
Over the research period (1 July2003 to 30 June 2007), MTWS hasconsumed 66,018 GJ energy andemitted 4,169 tonne CO
2-e for
supplying 22,713 ML potabledrinking water to customers.
Grid electricity contributes 92.8%(water treatment 67.4%;transmission and distribution26.4%) and other fossil fuels (diesel,LPG, gasoline and E10) of 6.2% inmeeting total energy demand forMTWS of 43.068 GJ (Table 6, Fig.3). Out of total grid electricity
Table 6: Carbon footprint for Meadow Town Water Supply for research period
Average population in the MWS catchment for the research period 41,000Water supplied, ML 22,713Energy/ Emission Energy Greenhouse gas
consumption, emission, tonneGJ CO
2-e
Scope 1Diesel (stationary engine) 1,006 69.9Diesel (transport) 2,150 150.1LPG (transport) 344 20.7Gasoline: unleaded (transport) 2,586 173Ethanol (as E10) 21 0.002Scope 2Grid electricity in water treatment 43,068 10,647Grid electricity in water transmission and distribution 16,843 4,168Total (Scope 1 and Scope 2) energy consumption, GJ 66,018Total (Scope 1 and Scope 2) GHG emission, tonne CO
2-e 15,225
Energy intensity, GJ per ML drinking water supplied 2.9GHG emission intensity, tonne CO
2-e per ML drinking water supplied 0.67
Carbon cost $ per ML drinking water supplied @ $40/ tonne 26.8CO
2-e (refer Australian Government Carbon Pollution Reduction
Scheme (CPRS) White Paper, 2008)Carbon cost as % of water usage price (@ $1,870/ ML 1.4%drinking water in 2008-10)Annual carbon footprint per capita for water supply, kg CO
2-e 90
Annual carbon footprint cost $ per capita for water supply, kg CO2-e 3.7

292
consumption of 59,911 GJ, water treatmentincurs 72% and water transmission anddistribution incurs remaining 28%.
Energy intensity and carbon footprint forwater supplied by MWS are 2.91 G/MLand 0.67 tonne CO
2-e/ML (Table 6, Fig.
4).
Grid electricity contributes to 92.8% ofenergy demand and 97% of GHG emission.On the other hand, other fuels (diesel,gasoline, LPG and E10) contribute to 6.8%of energy demand and 3% of GHG emission(Fig. 5, Table 6). Therefore, there is scopefor improvement in improving carbon
1870
26.8
0
200
400
600
800
1000
1200
1400
1600
1800
2000
Water usage cost $/ML (100%) Carbon cost, $/ML (1.4%)
Figure 6: Water usage and Carbon cost for water supply to customer
footprint for MWS through alternate energy resourcing for MWS, such as biogas, natural gas, LPG.
Carbon pollution cost for MWS
The proposed carbon pollution reduction scheme (CPRS; CA, 2008) in Australia is a market- based cap andtrade mechanism to reduce GHG emissions in the most cost- effective way. CPRS uses carbon pollutionpermit (CPP) as the measure of carbon footprint or greenhouse intensity of a process or activity. One CPPis equivalent to one tonne CO
2 -e of GHG emission. CPP has personal property right with a unique identification
number in the National Registry and are marked with the first year in which it can validly be surrendered(its ‘vintage’). CPPs do not have an expiry date and are regulated as financial products for the purposes ofthe Corporations Act 2001 and the Australian Securities and Investments Commission Act 2001, and normalGST rules applies to CPP transaction. CPRS obligations will not apply to emissions from combustion ofbiofuels and biogas for energy.
Under the CPRS, MWS shall require 3,806 CPPs annually. Considering a price cap of $405 per tonne CO2e
or CPP, annual carbon pollution cost for operating the Meadow Town Water Supply will be $152,250.Carbon pollution cost will increase the price of water by $26.8/ ML (1.4%) over and above the currentwater usage price of $1870/ ML (Fig. 6).
REFERENCES
Australian Government, 2007. National Greenhouse and Energy Reporting (NGER) Act 2007.
Australian Government, 2007. National Greenhouse and Energy Reporting (NGER) Regulation 2008.
Commonwealth of Australia 2008. Carbon Pollution Reduction Scheme: Australia’s Low Pollution Future,
December, White Paper Vol. 1.
CSIRO and Bureau of Meteorology, Australian Government 2007. Climate change in Australia: Technical
report 2007
NGER MD 2009. Department of Climate Change, Commonwealth of Australia 2008. National Greenhouse and
Energy Reporting (Measurement) Determination (NGER MD).
Intergovernmental Panel on Climate Change (IPCC), 2008. Fourth assessment report, Synthesis report (IPCC,
2008a).
NHMRC, 2003. Australian government National Health and Medical Research Council (NHMRC) and National
Resource Management Ministerial Council, 2003, Water made clear: A consumer guide to accompany the Australian
Drinking Water Guidelines 2004, 10-11 Apr 2003, ISBN (online): 1 86496 171 6 (NHMRC, 2003)
Stern, N. 2007. HM Treasury, The Economics of Climate Change: The Stern Review, Cambridge University Press
DEBASHIS RAHA AND P. C. MISHRA

293
2007 (Stern, 2007a).
UNESCO 2009. World Water Assessment Programme 2009, The United Nations World Water Development Report
3: Water in a Changing World. Paris: UNESCO, and London: Earthscan
United Nations (UN) 1992. United Nations Framework Convention on Climate Change (UNFCC) 1992, New
York, 9 May 1992).
CARBON COST FOR SAFE WATER SUPPLY