Costs for CO2 capture in cement manufacture - Duncan Barker, Mott MacDonald

University of Calgary
PRISM: University of Calgary's Digital Repository
Graduate Studies Master of Public Policy Capstone Projects
2017-09-15
Carbon Capture in Alberta: Costs, Benefits, and
Policy
Arthur, Jessie; Arthur, Jessie
Arthur, Jessie. (2015). Carbon Capture in Alberta: Costs, Benefits, and Policy. (Unpublished
master's thesis). University of Calgary, Calgary, AB.
http://hdl.handle.net/1880/106792
master thesis
Downloaded from PRISM: https://prism.ucalgary.ca


[iii]
Acknowledgements
I would like to sincerely thank my advisor Dr. Jennifer Winter, for her thoughtful and in-depth review of this paper, valuable feedback and discussions, and challenging me to think critically. I would also like to thank Dr. Kent Fellows
for discussions connecting economics and the real world. I am grateful to The School of Public Policy, and Geoff Webb in particular, for providing opportunities to attend events that expanded my views and generated new ideas
for my research. I am also grateful to my fellow students, Karen Spencer and Braeden Larson, for their support, discussions, and friendship.
My studies and research would not have been possible without support from my family. With two young boys in
my life, it took a village to complete this degree. Thank you from the bottom of my heart to Mike and Diana Guenette, and Rick and Nathene Arthur. I am forever obliged to my sister, Bonnie Arthur, for helping me through
the final stretch. And most importantly, to Danny Guenette for love and support into new ventures.

[iv]
Table of Contents
Contents 1 INTRODUCTION ....................................................................................................................................................... 7
1.1 Background ........................................................................................................................................................ 8
1.2 Methodology .................................................................................................................................................... 10
2 CARBON CAPTURE AND STORAGE IN ALBERTA ..................................................................................... 12
2.1 Geologic Storage Potential ......................................................................................................................... 12
2.2 Regulation ......................................................................................................................................................... 12
2.3 CCS Projects in Alberta ................................................................................................................................ 12
2.4 Carbon Capture Technology ...................................................................................................................... 14
3 MULTIPLE ACCOUNT BENEFIT-COST ANALYSIS .................................................................................... 15
3.1 Multiple Account Evaluation Methodology ......................................................................................... 16
3.2 Costs: Background and Assumptions .................................................................................................... 16
3.2.1 Cost estimates for carbon capture in the industrial sector .................................................. 20
3.2.2 Cost estimates for carbon capture in the power sector ......................................................... 22
3.3 Market Valuation Account .......................................................................................................................... 23
3.3.1 Costs ............................................................................................................................................................ 23
3.3.2 Benefits....................................................................................................................................................... 26
3.4 Alberta Taxpayer Account .......................................................................................................................... 27
3.5 Environment Account .................................................................................................................................. 28
3.6 Social Account ................................................................................................................................................. 30
3.7 Economic Activity .......................................................................................................................................... 31
3.8 Other considerations .................................................................................................................................... 31
3.9 Overall assessment of costs and benefits ............................................................................................. 32
[v]
3.10 Multiple account benefit-cost summary ............................................................................................... 35
4 RATIONALE FOR GOVERNMENT INVOLVEMENT ................................................................................... 37
4.1 Policy instruments to correct pollution ................................................................................................ 38
4.2 Policy instruments for CCS R&D .............................................................................................................. 39
4.3 Recommendations ......................................................................................................................................... 41
5 CONCLUSION ........................................................................................................................................................... 44
REFERENCES ........................................................................................................................................................................... 46
APPENDIX A. CCS TECHNOLOGIES ................................................................................................................................ 57
A.1 Post-combustion capture ....................................................................................................................................... 57
A.2 Pre-combustion capture ........................................................................................................................................ 59
A.3 Oxyfuel combustion ................................................................................................................................................. 61
A4. Chemical looping combustion.............................................................................................................................. 63
A.5 Emerging technologies ........................................................................................................................................... 64
APPENDIX B. LEVELIZED COST OF ELECTRICITY ................................................................................................... 66
APPENDIX C. COST ESTIMATES OF CO2 AVOIDED ................................................................................................. 67
C1. Cost estimates for carbon capture in the industrial sector ...................................................................... 67
C2. Cost estimates for carbon capture in the power sector ............................................................................ 68
C3. Cost estimates for carbon transport .................................................................................................................. 69
APPENDIX D. THE SCC DISCOUNT RATE ..................................................................................................................... 73
APPENDIX E. SELECTED INDUSTRIAL FACILITIES IN ALBERTA ..................................................................... 74

[vi]
Capstone Executive Summary Alberta’s industrial and power sectors have many facilities classified as large emitters, with high-concentration carbon dioxide emissions from large point sources. Carbon capture and storage (CCS) reduces high-concentration carbon dioxide emissions from large point sources. CCS is a technically feasible technology that reduces greenhouse gas emissions in existing industries, and is recognized as a key factor in reaching international climate change targets. Alberta hosts two commercial-scale CCS projects funded by the provincial government and private industry. However, even with regulatory approvals for CCS projects, including the province’s property right to subsurface pore space for CO2 sequestration, future CCS commercial-scale projects are non-existent. CCS deployment is often obstructed by high project costs and risks in developing an emerging technology to commercial scale. Recent carbon pricing in Alberta may provide an incentive for investment in CCS and deployment.
This research includes a Multiple Account Benefit-Cost Analysis of carbon capture and storage projects in Alberta, from the perspective of Albertans. There is a significant cost to private firms and industry to invest in CCS. However, as carbon prices escalate to $50 per tonne by 2022, CCS becomes more economical for the cement industry, and hydrogen processing, ammonia, and chemical production. When impacts in the taxpayer, environment, social, and economic activity accounts are considered, there is an overall benefit to Albertans to reduce carbon emissions with CCS. Regardless, public perception of CCS projects remains a crucial factor. Recent public opposition to a CCS pilot project in Alberta demonstrates the power of negative public opinion to cancel projects, and should not be underestimated. Both industry and the government need to ensure trust and a sense of fairness is established when engaging with communities regarding CCS initiatives.
To reduce barriers to CCS development and increase investment in CCS, a policy strategy is needed. The policy strategy needs to address both the market failures that lead to pollution and an underinvestment in research. Therefore, in addition to carbon pricing, environmental taxation such as tax credits specifically for CCS projects can encourage research and development. To also signal government support to the public and investors, existing low-carbon and clean-energy projects that are incentivized by provincial and federal governments should extend to include CCS in both the industrial and power sectors. With recent carbon pricing, this research provides the opportunity to reexamine CCS in Alberta and consider complementary policies for CCS deployment that can benefit Albertans as a whole.

[7]
Carbon Capture in Alberta: Costs, Benefits, and Policy
1 Introduction Alberta has a strong natural resource sector that drives the provincial and national economy.1,2 The industrial and power sectors that develop provincial resources result in Alberta producing the highest level of greenhouse gas (GHG) emissions compared to other provinces. Industrial sources of carbon dioxide (CO2) include natural gas power generation plants, fertilizer operations, hydrocarbon refineries and upgraders, oil sands operations, cement production, and chemical facilities. Both Canada and Alberta have set emissions reduction targets, and both levels of government have recently phased in or announced carbon pricing regimes. Although the two targets are not aligned, they both share the same goal to reduce GHG emissions.
A solution to reducing GHG emissions is to capture CO2 emissions at the source, and store or utilize the captured emissions. Carbon capture and storage (CCS) is a technology recognized by the United Nations Intergovernmental Panel on Climate Change (IPCC) and the International Energy Agency (IEA) as a key solution to meet global emission reduction targets.3,4 In addition, CCS can reduce GHG emissions while maintaining industrial activity that provides an economic benefit.5 However, CCS development at the commercial scale in Alberta is progressing slowly. Alberta is the sole Canadian province that has a regulatory regime for CO2 storage, yet industrial partners and subsequently the province cancelled funding for two large CCS demonstration projects in 2012 and 2013.6 Large-scale CCS is needed to meet international targets of limiting global temperatures to less than 2°C above pre-industrial levels, even with recent growth and projected increases in renewable energy.7 Recently expanded carbon pricing in Alberta may provide an incentive for
1Alberta, “Our Business,” Alberta Energy, December 28, 2006, http://www.energy.alberta.ca/OurBusiness.asp. 2Alberta, “Alberta’s Economic Recovery Bolsters National Growth | Alberta.ca,” Alberta Government Announcement, 2017, https://www.alberta.ca/release.cfm?xID=4835270BD3670-00AA-800E-34DDE78949A0A6EA. 3 IPCC, Climate Change 2014: Mitigation of Climate Change, Working Group III Contribution to the Fifth Assessment Report of the Intergovernmental Panel on Climate Change, 2014, doi:10.1017/CBO9781107415416. 53. 4International Energy Agency, “Carbon Capture and Storage,” accessed August 28, 2017, https://www.iea.org/topics/ccs/. 5 Alberta Department of Energy, “Carbon Capture and Storage: Why Do We Need CCS,” accessed December 5, 2016, http://www.solutionsstarthere.ca/20.asp. 6 Richard Blackwell, “Alberta Cancels Funding for Carbon Capture Project,” The Globe and Mail, February 25, 2013, https://beta.theglobeandmail.com/report-on-business/industry-news/energy-and-resources/alberta-cancels-funding-for-carbon-capture-project/article9024237/?ref=http://www.theglobeandmail.com&. 7 Glen P. Peters et al., “Key Indicators to Track Current Progress and Future Ambition of the Paris Agreement,” Nature Climate Change 7, no. 118 (2017), doi:10.1038/nclimate3202. 120-121.

[8]
CCS investment, and an updated cost-benefit analysis of CCS in Alberta will help inform this decision.
The barriers that obstruct CCS development are the same that often face new first-generation technologies: cost and risk. Government tax policies could provide incentives for private firms to invest in CCS and share risk with the government. Carbon pricing and tax credits specifically for CCS development offer near-term policies to support commercial CCS project development by 2030 – when Canada is obliged to meet its emission reduction targets.
With the recent introduction of provincial and federal carbon pricing schemes, this paper examines the industrial and power sectors in Alberta, to determine which types of facilities are best suited to utilize CCS as a technology to reduce emissions. CCS opportunities evaluated in the industrial sector are gas refining and processing, hydrogen production, cement, and chemicals. In the power sector, natural gas-fired power plants and biomass energy are evaluated. Given Alberta’s phase-out of coal-fired power generation by 2030, coal is excluded. With carbon pricing in Alberta, it may now be more economical to invest in and develop CCS for high purity CO2 sources, the cement industry, and gasifiers in petroleum refineries.
This paper also identifies the relative costs and benefits of CCS to large emitters in Alberta’s power and industrial sectors, and to the province as a whole. The following are considered: the cost of CO2 emissions avoided from carbon capture, carbon pricing, and the social cost of carbon. Furthermore, factors that have created barriers and stalled development of CCS in Alberta are discussed, and policy instruments that facilitate and accelerate deployment of CCS are identified. Environmental taxation combined with tax credits is identified as a policy option to address the underinvestment in research and development for CCS.
This paper is organized as follows. The remainder of the introduction provides a background on the emission levels and targets for both Alberta and Canada, answers why CCS is recognized as a viable technology to reduce GHG emissions, and presents the methodology of this research. Section 2 discusses the potential for CCS in Alberta, existing demonstration projects, and CCS technology. Section 3 presents a multiple account benefit-cost analysis that examines the costs and benefits of CCS projects in Alberta from the viewpoint of Albertans, analyzes the costs to private firms and industry, and provides information on the impacts from CCS projects. Section 4 provides a rationale for government involvement and discusses a policy strategy to reduce barriers for CCS deployment.
1.1 Background Alberta has the highest greenhouse gas emissions in all of Canada, emitting 274 MT of carbon dioxide equivalent (CO2e)8 in 2014, which is 37 percent of the national
8 CO2e, or the carbon dioxide equivalent, is a unit of measure that allows any GHG to be compared in a common unit. GHG’s (such as methane or nitrous oxide) have different global warming potentials (GWPs). To compare in a common unit, the mass of the GHG (in tonnes) is multiplied by the GWP.

[9]
total.9,10 Alberta’s largest emitters (producing greater than 1 MT CO2e per year) in the industrial and power sectors produce a total of 108 MT CO2e per year.11 Following the upcoming coal phase-out under the Alberta Climate Leadership Plan (CLP), Alberta will still have over 70 MT CO2e per year produced by large industrial emitters. Alberta’s CLP aims to maintain cost competitiveness in the resource sector through investment in technology and innovation.12
Canada has also made efforts to reduce GHG emissions through international collaboration. In November 2015, Canada attended the annual United Nations Climate Change Conference in Paris (the 21st Conferences of the Parties (COP21)), where goals of reducing GHG concentrations were discussed and negotiated. Canada committed to economy-wide emissions reduction targets set for 2020 and 2030 relative to emissions in 2005. Canada’s emission reduction target for 2020 is 17 percent below 2005 levels, and for 2030 is 30 percent below 2005 levels. By late 2016, Canada ratified the legally binding Paris agreement. However, between 2005 and 2014, Canada’s total GHG emissions have only decreased 1.5 percent, by 11 MT CO2e;13 and Alberta’s greenhouse gas emissions increased nearly 18 percent, by 41 MT CO2e.14 If Alberta were to meet Canada’s national climate change targets on a proportional basis, Alberta’s emissions would need to decrease by approximately 111 MT CO2e from 2014 levels, which is 30 percent below 2005 levels and does not account for projected economic and industrial growth.15
Alberta’s emissions are projected to increase to 320 MT CO2e by 2030.16 The CLP proposes to stabilize emissions to just above 2014 levels by 2030.17 The CLP recognizes that Alberta’s emission reduction targets are not aligned with national and global targets, and to do so would come “at a significant cost to Alberta,” and by extension Canada. Alberta’s carbon tax is $20 per tonne in 2017, increasing to $30 per tonne in 2018. The overarching pan-Canadian climate plan will price carbon at
9 Canada, “Canadian Environmental Sustainability Indicators Greenhouse Gas Emissions” (Gatineau, 2016), https://www.ec.gc.ca/indicateurs-indicators/18F3BB9C-43A1-491E-9835-76C8DB9DDFA3/GHGEmissions_EN.pdf. 10 1 MT = 1 Megatonne, or 1 million metric tons (1000 kilograms). 11 Government of Canada, “Environment and Climate Change Canada - Results of GHG Facility Data Search,” 2015, http://www.ec.gc.ca/ges-ghg/donnees-data/index.cfm?do=results&lang=en&year=2015&prov=AB&submit=Send&order_field=data_co2eq&order=DESC. 12 Andrew Leach et al., “Climate Leadership Report to Minister” (Edmonton, 2015), https://www.alberta.ca/documents/climate/climate-leadership-report-to-minister.pdf. 9. 13 Canada, “Greenhouse Gas Emissions,” Environment and Climate Change Canada, 2017, https://www.ec.gc.ca/indicateurs-indicators/?lang=en&n=FBF8455E-1. 14 Government of Canada, “Environment and Climate Change Canada - Climate Change - National Inventory Report 1990-2014: Greenhouse Gas Sources and Sinks in Canada,” accessed February 22, 2017, https://ec.gc.ca/ges-ghg/default.asp?lang=En&n=662F9C56-1. 15 From 2005 to 2014, Alberta’s CO2e emissions increased from 233 to 274 MT CO2e. If Alberta were to reduce emissions thirty percent below 2005 levels, the target is 163 MT CO2e. 16 Leach et al., “Climate Leadership Report to Minister.” 41. 17 Ibid. 10.

[10]
$40 per tonne in 2021 and $50 per tonne by 2022. The new carbon pricing framework may provide an incentive for CCS investment and development.
Alberta is a prime candidate for CCS. Along with carbon pricing in place, the Western Canadian Sedimentary Basin in Alberta meets suitable geologic criteria for subsurface storage capacity of CO2.18 Alberta is also at the forefront of legislation and regulation for CCS development in Canada: it has legislated the Carbon Capture and Storage States Amendment Act (2010), has completed a Regulatory Framework Assessment, and with China, co-leads an ISO committee for CCS international standards. In addition, two large scale CCS demonstration projects in Alberta have each received significant public funding. The Shell Canada Energy Quest Project is a large-scale CCS demonstration project that captures 1 million tonnes of CO2 per year.19 The Enhance Energy Alberta Carbon Trunk Line (ACTL) project, which is currently under construction, is designed to capture 14.6 million tonnes of CO2 per year.20 Given Alberta’s projected emission increases and newly imposed carbon pricing, progress may be made in large-scale CCS deployment by 2030.
1.2 Methodology This research methodology includes a multiple account benefit-cost analysis to identify the trade-offs from implementing CCS in the industrial and power sectors, from the perspective of current Albertans. First, a background for CCS project costs is given to explain the uncertainties and assumptions made in carbon capture cost estimates. A review of recent literature is conducted to assess the costs of CO2 avoidance by sector and technology, and the costs associated with CO2 transportation and storage. Next, the costs and benefits of CCS projects in Alberta’s power and industrial sectors are evaluated. The multiple account evaluation considers various stakeholders affected by the project, and is from the public perspective of Albertans. The cost of CO2 avoided for selected industries, the social cost of carbon, and the carbon tax in Alberta are assessed to identify which industries should consider carbon capture technologies to reduce emissions; otherwise a carbon tax will have greater financial cost than the cost of CO2 emissions avoided.
This research also provides a rationale for government involvement by identifying market failures that lead to inefficiently allocated resources. Policy strategies are presented to correct negative externalities, such as pollution; and, positive externalities, such as information spillovers that contribute to underinvestment of research and development for new technologies. 18 Stefan Bachu and W.D. Gunter, “Storage Capacity of CO2 in Geological Media in Sedimentary Basins with Application to the Alberta Basin,” in Greenhouse Gas Control Technologies: Proceedings of the 4th International Conference on Greenhouse Gas Control Technologies, 30 August - 2 September 1998., ed. Baldur Eliasson, Pierce Riemer, and Alexander Wokaun (Interlaken, Switzerland: Elsevier Science Ltd., 1999), 1205. 19 Canada, “Shell Canada Energy Quest Project,” Natural Resources Canada, accessed May 11, 2017, http://www.nrcan.gc.ca/energy/funding/current-funding-programs/18168. 20 Enhance Energy Inc., “Alberta Carbon Trunk Line Q & A,” accessed May 11, 2017, http://www.enhanceenergy.com/q_a.

[11]
2 Carbon Capture and Storage in Alberta
2.1 Geologic Storage Potential The Western Canadian Sedimentary Basin in Alberta meets suitable geologic criteria for geologic storage of CO2, which considers the tectonic setting, the hydrodynamic regime, basin maturity, and hydrocarbon potential.21 Bachu (2004) determined that of the western provinces, Alberta has the largest CO2 sequestration capacity. Alberta also has deep coal beds and saline aquifers that are suitable for long-term CO2 storage.22
2.2 Regulation In 2010, Bill 24 (the Carbon Capture and Storage Statutes Amendment Act) was passed, amending existing resource development legislation to include provisions for carbon capture and storage projects. Bill 24 amends the Mines and Minerals Act to include the provincial Crown’s property right to subsurface pore space of all land in Alberta. Pore space is defined as “the pores contained in, occupied by or formerly occupied by minerals or water below the surface of land”.23 The 2011 Carbon Sequestration Tenure Regulation provides a more detailed regulatory framework for evaluation permits to investigate reservoir potential for CO2 storage and carbon sequestration leases that grant the right to drill and inject captured CO2 into subsurface reservoirs deeper than 1000 metres. The regulations also outline the framework for monitoring and closure plans. The property rights of private landowners are set forth in the Mines and Minerals Act, but prior to Bill 24, ownership of pore space was not defined.
With Bill 24 granting the Crown pore space ownership throughout all of Alberta, the province has the right to store CO2 anywhere. However, a CCS operator still requires surface access to inject CO2, and requires a right of entry order by the Surface Rights Act.24 The Surface Rights Act25 allows the Surface Rights Board to grant orders for right of entry access, drilling operations for injection wells, necessary facilities and pipelines, storage of CO2, and monitoring related to CCS projects.26
2.3 CCS Projects in Alberta Enhanced oil recovery using captured carbon dioxide has successfully been implemented in Alberta since the 1957-58 North Pembina Cardium Unit 21 Bachu and Gunter, “Storage Capacity of CO2 in Geological Media in Sedimentary Basins with Application to the Alberta Basin.” 199-200. 22 Ibid. 199. 23 Alberta, Carbon Sequestration Tenure Regulation, Alta Reg 68/2011 (CanLII), accessed November 13, 2016, http://canlii.ca/t/52q6b. 24 Nigel Bankes, “Legal Issues Associated with the Adoption of Commercial Scale CCS Projects” (Calgary, 2008), https://www.pembina.org/reports/ccs-discuss-legal.pdf. 25 Alberta, Surface Rights Act, RSA 2000, c S-24 (CanLII), accessed November 13, 2016, http://canlii.ca/t/52ddk. 26 Bankes, “Legal Issues Associated with the Adoption of Commercial Scale CCS Projects.” Section 13(2).
[12]
hydrocarbon miscible pilot project.27 From then onward, CO2 was viewed as a valuable commodity for hydrocarbon recovery.28 To reduce emissions and support innovation, the Alberta government has recently committed funding in partnership with private companies for two commercial-scale CCS projects: the Quest project and the Alberta Carbon Trunk Line project.
The Shell Canada Quest project near Edmonton, Alberta, uses industrial separation and pre-combustion CCS.29 Shell’s Scotford Upgrader takes viscous oil sands bitumen and upgrades it to a lighter synthetic crude oil by increasing the hydrogen-to-carbon ratio. Upgrading bitumen requires significant amounts of hydrogen to increase the hydrogen-to-carbon ratio, and hydrogen production is energy intensive.30 The hydrogen needed for bitumen upgrading is produced in the upgrader’s steam methane reformer units; and as a by-product, high-purity streams of CO2 are produced and are available for capture. Since operations commenced in 2015, the Shell Quest project captures over 1 million tonnes of CO2 per annum.
Alberta is also investing in commercial-scale pre-combustion carbon capture with Enhance Energy’s Alberta Carbon Trunk Line (ACTL), scheduled to begin operations in 2018.31 The project is in partnership with Agrium and the North West Redwater Sturgeon bitumen refinery, and is promoted as “form[ing] the backbone of a growing CO2 gathering and transportation infrastructure” for wide scale CCS in Alberta.32 Agrium’s Redwater fertilizer plant will supply CO2 via a retrofit pre-combustion carbon capture unit. The North West Redwater Sturgeon bitumen refinery is a first-of-a-kind new construction project that will integrate carbon capture. The ACTL’s maximum CO2 capture capacity is 2 MT per annum, and the CO2 will be transported 240 kilometers by pipeline for EOR.33
Several pilot projects have also been tested in Alberta, particularly for oxyfuel combustion carbon capture systems, chemical looping combustion, and other emerging technologies. These technologies and projects are discussed in Appendix A.
27 Barbara Howes, “Enhanced Oil Recovery in Canada: Success in Progress,” Journal of Canadian Petroleum Technology 27, no. 6 (1988). 28 Susan Cole and Sarah Itani, “The Alberta Carbon Trunk Line and the Benefits of CO2,” Energy Procedia 37 (2013): 6133–39, doi:10.1016/j.egypro.2013.06.542. 6136. 29 Shell Canada, “Quest Carbon Capture and Storage Project,” accessed November 14, 2016, http://www.shell.ca/en_ca/about-us/projects-and-sites/quest-carbon-capture-and-storage-project.html. 30 Balwinder Nimana, Christina Canter, and Amit Kumar, “Energy Consumption and Greenhouse Gas Emissions in the Recovery and Extraction of Crude Bitumen from Canada’s Oil Sands,” Applied Energy 143 (2015): 189–99, doi:10.1016/j.apenergy.2015.01.024. 68. 31 Enhance Energy Inc., “The Alberta Carbon Trunk Line,” accessed November 15, 2016, http://www.enhanceenergy.com/. 32 Alberta’s Industrial Heartland, “Alberta Carbon Trunk Line Project Status,” 2017, http://industrialheartland.com/project-status/. 33 Enhance Energy Inc., “The Alberta Carbon Trunk Line.”
[13]
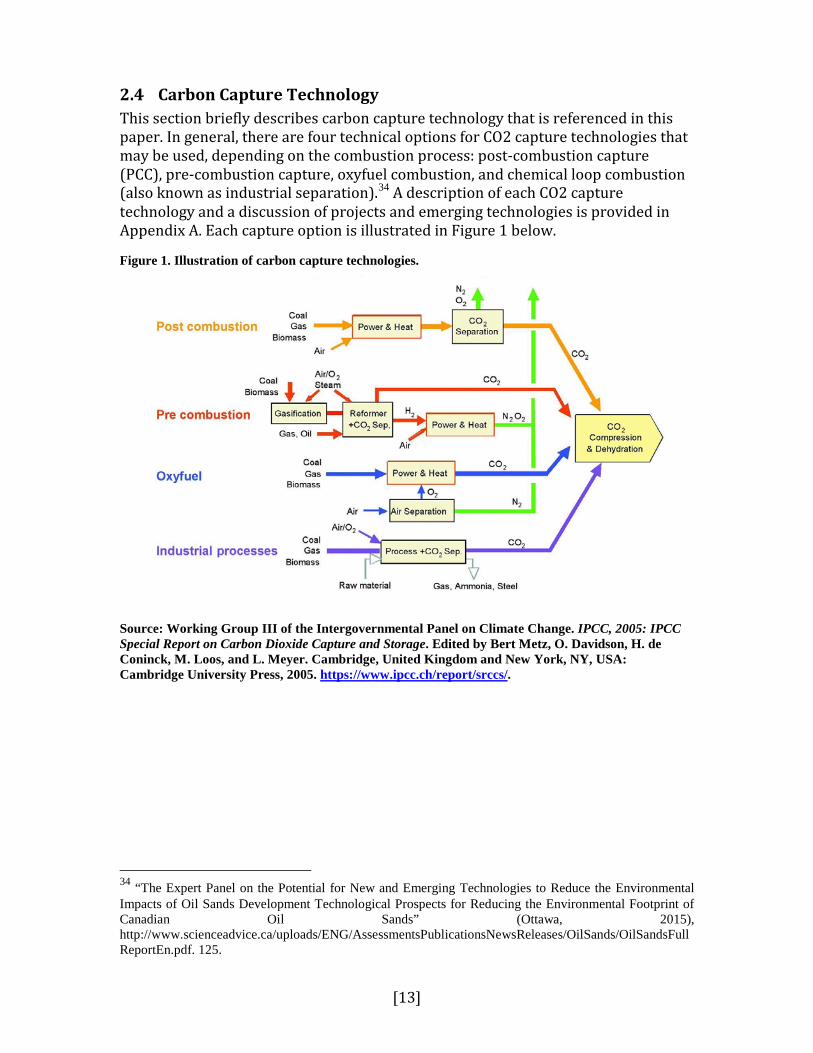
2.4 Carbon Capture Technology This section briefly describes carbon capture technology that is referenced in this paper. In general, there are four technical options for CO2 capture technologies that may be used, depending on the combustion process: post-combustion capture (PCC), pre-combustion capture, oxyfuel combustion, and chemical loop combustion (also known as industrial separation).34 A description of each CO2 capture technology and a discussion of projects and emerging technologies is provided in Appendix A. Each capture option is illustrated in Figure 1 below.
Figure 1. Illustration of carbon capture technologies.
Source: Working Group III of the Intergovernmental Panel on Climate Change. IPCC, 2005: IPCC Special Report on Carbon Dioxide Capture and Storage. Edited by Bert Metz, O. Davidson, H. de Coninck, M. Loos, and L. Meyer. Cambridge, United Kingdom and New York, NY, USA: Cambridge University Press, 2005. https://www.ipcc.ch/report/srccs/.
34 “The Expert Panel on the Potential for New and Emerging Technologies to Reduce the Environmental Impacts of Oil Sands Development Technological Prospects for Reducing the Environmental Footprint of Canadian Oil Sands” (Ottawa, 2015), http://www.scienceadvice.ca/uploads/ENG/AssessmentsPublicationsNewsReleases/OilSands/OilSandsFullReportEn.pdf. 125.
[14]
3 Multiple Account Benefit-Cost Analysis This section provides an overview of the relative costs and benefits for CCS in Alberta, based on the Multiple Account Benefit-Cost Analysis35 framework by Marvin Shaffer. The relative costs and benefits to larger emitters (industrial facilities that emit over 300,000 tonnes CO2) in Alberta’s power and industrial sectors and to the province as a whole are explored to identify with whom the maximum net benefit resides to implement CCS in Alberta. Facilities with emissions over 300,000 tones CO2 was selected as a cut-off point that is large enough to support large-scale CCS demonstration projects. Carbon capture is best applied to high-concentration CO2 emissions from large point sources, as capture costs increase when impurities must be removed from low concentration CO2 streams.36,37
Benefit-cost analysis (BCA) is a valuable tool in policy analysis, and has traditionally been used as a procedure for evaluating projects and decisions in terms of costs and benefit—from the point of view of their consequences.38 Welfare economics lays the foundation for BCA, where projects are preferred if benefits outweigh the cost in a bottom-line calculation. However, it has not been without controversy. Criticism of BCA is on the “monetary metric” used to place costs and benefits on common ground, when often these categories are incomparable.39 Critics are also concerned with “distributional issues”, where an individual’s income or socioeconomic status limits their willingness to pay, and lowers their decision weight.40 Also common in environmental policy is a “status-quo bias”, which arises as it is easier to quantify costs compared to benefits.41 As a result, policy decisions tend to place more weight on cost considerations and the status-quo is favoured. Assessing the costs and benefits of a project relies on many assumptions, incomplete information, and the compensation demanded for exceeding willingness to pay is subjective. However, BCA is still important in informing policy decisions.
Multiple account benefit-cost analysis (MABCA) provides an advantage where alternative perspectives of shareholders are evaluated. Costs and benefits to each group are accounted for, including how they are distributed, and decision-making alternatives are considered. MABCA recognizes that not all consequences have a monetary metric, and that the summation of costs and benefits to obtain a net
35 Marvin Shaffer, Multiple Account Benefit-Cost Analysis: A Practical Guide for the Systematic Evaluation of Project and Policy Alternatives, Kindle (Toronto: University of Toronto Press, 2010). 36 Jiri van Straelen et al., “CO2 Capture for Refineries, a Practical Approach,” International Journal of Greenhouse Gas Control 4, no. 2 (2010): 316–20, doi:10.1016/j.ijggc.2009.09.022. 37 Perry D Bergman, Edward M Winter, and Zhong-Ying Chen, “Disposal of Power Plant CO2 in Depleted Oil and Gas Reservoirs in Texas,” Energy Conversion and Management 38 (1997): S211–16, doi:10.1016/0196-8904(95)00058-L. S213. 38 Jean Drèze and Nicholas Stern, “The Theory of Cost-Benefit Analysis,” in Handbook of Public Economics, vol. 2, 1987, 909–89, doi:10.1016/S1573-4420(87)80009-5. 910. 39 Robert H. Frank, “Why Is Cost-Benefit Analysis so Controversial?,” The Journal of Legal Studies 29, no. S2 (2000): 913–30, doi:10.1086/468099. 914. 40 Ibid. 916. 41 Ibid. 928.

[15]
bottom line is often not as important as understanding the trade-offs of consequences.42
3.1 Multiple Account Evaluation Methodology The multiple account evaluation of overall benefits and costs considers various stakeholders affected by the project: the private market value of CCS project development to firms, and the public perspective of Albertans with regards to their overall welfare and direct interests, including economic impacts related to CCS projects. The evaluation accounts that are considered are described in Table 1.
Table 1. Multiple account benefit-cost analysis evaluation accounts
Account Purpose
Market Valuation Account Assesses private project costs and benefits. Taxpayer Account Benefits and costs to taxpayers in Alberta. Environmental Account Environmental impacts in Alberta Social Account Consequences for communities and their interests. Other Considerations Public perception and opposition of CCS projects.
3.2 Costs: Background and Assumptions The goal of this section is to provide definitions and discuss assumptions for CCS cost estimates. The cost for carbon capture includes both the capital expenditure and net efficiency loss as a result of energy used by the carbon capture system. Efficiency penalties are due to the additional energy requirements for the carbon capture process and compression prior to transport. Additional costs include operations, transport, and storage. All capture technologies face constraints, and opportunities for low-cost capture are sought by industries and governments wanting to reduce emissions.
Carbon capture is technically feasible to reduce emissions; however, the high cost prevents investment in large-scale projects. Carbon capture cost estimates vary throughout both academic literature and sources such as the Intergovernmental Panel on Climate Change (which includes both peer and non-peer reviewed references). Capital expenditure and operations for carbon capture is estimated to be 70 percent of the total CCS project cost, with the remaining costs allocated to CO2 transport and storage.43 For example, a recent meta-analysis of several studies estimates capital expenditure for post-combustion carbon capture to be approximately 28 percent and operational costs for heat regeneration to be 44 percent.44 However, capital expenditure cost depends entirely on the project
42 Shaffer, Multiple Account Benefit-Cost Analysis: A Practical Guide for the Systematic Evaluation of Project and Policy Alternatives. Kindle locations 119-121. 43 King Abdullah Petroleum Studies et al., Carbon Capture and Storage: Technologies, Policies, Economics, and Implementation Strategies (CRC Press, 2011). 311. 44 Wenbin Zhang et al., “Process Simulations of Post-Combustion CO2 Capture for Coal and Natural Gas-Fired Power Plants Using a Polyethyleneimine/silica Adsorbent,” International Journal of Greenhouse Gas Control 58 (2017): 276–89, doi:10.1016/j.ijggc.2016.12.003. 277.

[16]
capture methodology. The actual cost of CCS varies significantly from project to project, and is difficult to estimate. As more large-scale demonstration projects are commissioned, estimates for carbon capture will improve.
Carbon capture cost estimates have various discrepancies. Large ranges in cost estimates are a result of differences in cost definition, outdated data and studies, cost model details (economic assumptions regarding facility lifetime, fuel prices, interest rates, etc.), capacity factors for power plants, and technological uncertainties. Carbon capture cost is dependent on the type of capture technology, facility size, whether the technology is employed in a new facility versus a retrofit, facility lifespan, target capture rate, baseline cost of a non-CCS facility, facility location, uptime of capture usage, fuel type (whether gas, coal, or biomass), the fuel price when cost estimates were made, and the discount rate to calculate the present value of the project.45 In addition, if CO2 is produced in concentrated and high-purity steams with higher emissions intensity (e.g. natural gas processing compared to natural gas power plants post-combustion capture), it is easier to capture.46
In 2005, the Intergovernmental Panel on Climate Change issued a special report that defines four measures commonly used to quantify the cost of CCS:47,48
• Cost per tonne captured ($ per tonne) • Cost per tonne avoided of CO2 ($ per tonne) • Capital Cost (usually reported in $ per kW) • Cost of electricity supplied, also known as the incremental product cost
The cost of CO2 captured in $ per tonne CO2 is:
𝐶𝐶𝐶𝐶𝐶𝐶𝐶𝐶 𝐶𝐶𝑜𝑜 𝐶𝐶𝐶𝐶2 𝑐𝑐𝑐𝑐𝑐𝑐𝐶𝐶𝑐𝑐𝑐𝑐𝑐𝑐𝑐𝑐 = 𝐷𝐷𝐷𝐷𝐶𝐶𝑐𝑐𝐶𝐶𝑐𝑐𝐷𝐷𝐶𝐶𝑐𝑐𝑐𝑐 𝑐𝑐𝑐𝑐𝑐𝑐𝐶𝐶𝐷𝐷𝑐𝑐𝑐𝑐 𝑐𝑐𝐶𝐶𝐶𝐶𝐶𝐶 𝐶𝐶𝐶𝐶 𝑐𝑐𝑐𝑐𝑐𝑐𝐶𝐶𝑐𝑐𝑐𝑐𝑐𝑐 𝐶𝐶𝐶𝐶2
𝐴𝐴𝐴𝐴𝐶𝐶𝑐𝑐𝐷𝐷𝐶𝐶 𝐶𝐶𝑜𝑜 𝐶𝐶𝐶𝐶2 𝑐𝑐𝑐𝑐𝑐𝑐𝐶𝐶𝑐𝑐𝑐𝑐𝑐𝑐𝑐𝑐 𝐶𝐶𝑜𝑜𝑐𝑐𝑐𝑐 𝑐𝑐𝐷𝐷𝑜𝑜𝑐𝑐𝐶𝐶𝐷𝐷𝐴𝐴𝑐𝑐 𝐶𝐶𝑜𝑜 𝑜𝑜𝑐𝑐𝑐𝑐𝐷𝐷𝑐𝑐𝐷𝐷𝐶𝐶𝑓𝑓
= (𝐿𝐿𝐶𝐶𝐶𝐶𝐿𝐿)𝑐𝑐𝑐𝑐𝑐𝑐𝑡𝑡𝑢𝑢𝑢𝑢𝑢𝑢𝑢𝑢 − (𝐿𝐿𝐶𝐶𝐶𝐶𝐿𝐿)𝑢𝑢𝑢𝑢𝑟𝑟𝑢𝑢𝑢𝑢𝑢𝑢𝑟𝑟𝑐𝑐𝑢𝑢
(𝐶𝐶𝐶𝐶𝐷𝐷𝐷𝐷𝑐𝑐 𝐶𝐶𝐶𝐶2 𝑐𝑐𝑐𝑐𝑐𝑐 𝑘𝑘𝑘𝑘ℎ)𝑐𝑐𝑐𝑐𝑐𝑐𝑡𝑡𝑢𝑢𝑢𝑢𝑢𝑢𝑢𝑢 (1)
where captured = facility with carbon capture, reference = baseline facility without carbon capture, and LCOE = levelized cost of electricity in dollars per kilowatt hour ($/kWh). The LCOE is dependent on several variables including fuel cost and is
45 Robin Mills, Capturing Carbon: The New Weapon in the War against Climate Change (New York: Columbia University Press, 2011). 188-190. 46 “Carbon Capture Use and Storage | Center for Climate and Energy Solutions,” accessed March 27, 2017, https://www.c2es.org/technology/factsheet/CCS#_edn38. 47 Edward S. Rubin, “Methods and Measures for CCS Cost,” in CCS Cost Workshop (Paris, 2011), 19, http://www.cmu.edu/epp/iecm/rubin/PDF files/2011/Rubin_CCS cost methods and measures_3-22-11.pdf. 48 Working Group III of the Intergovernmental Panel on Climate Change, IPCC, 2005: IPCC Special Report on Carbon Dioxide Capture and Storage, ed. Bert Metz et al. (Cambridge, United Kingdom and New York, NY, USA: Cambridge University Press, 2005), https://www.ipcc.ch/report/srccs/. 147.

[17]
defined in Appendix B. For equal comparisons, the reference facility and the facility with carbon capture should be the same type and design.
The cost of CO2 emissions avoided (COA) in $ per tonne CO2 for power plants is:49
𝐶𝐶𝐶𝐶𝐴𝐴 = 𝐷𝐷𝐷𝐷𝐶𝐶𝑐𝑐𝐶𝐶𝑐𝑐𝐷𝐷𝐶𝐶𝑐𝑐𝑐𝑐 𝑐𝑐𝑐𝑐𝑐𝑐𝐷𝐷𝐶𝐶𝑐𝑐𝑐𝑐 𝑐𝑐𝐶𝐶𝐶𝐶𝐶𝐶 𝐶𝐶𝐶𝐶 𝑐𝑐𝑐𝑐𝑐𝑐𝐶𝐶𝑐𝑐𝑐𝑐𝑐𝑐 𝐶𝐶𝐶𝐶2
𝑐𝑐𝑐𝑐𝑐𝑐𝑐𝑐𝑐𝑐𝐶𝐶𝐷𝐷𝐶𝐶𝐷𝐷 𝐷𝐷𝐷𝐷 𝐶𝐶𝐶𝐶𝐶𝐶𝑐𝑐𝑐𝑐 𝐶𝐶𝐶𝐶2 𝑤𝑤𝐷𝐷𝐶𝐶ℎ 𝐶𝐶𝐶𝐶 𝑜𝑜𝐶𝐶. 𝑐𝑐𝑐𝑐𝑜𝑜𝑐𝑐𝑐𝑐𝑐𝑐𝐷𝐷𝑐𝑐𝑐𝑐 𝑜𝑜𝑐𝑐𝑐𝑐𝐷𝐷𝑐𝑐𝐷𝐷𝐶𝐶𝑓𝑓 𝑐𝑐𝑐𝑐𝐶𝐶𝑐𝑐𝑐𝑐𝑐𝑐𝐷𝐷𝐷𝐷𝑝𝑝 𝐶𝐶𝑐𝑐𝐴𝐴𝑐𝑐 𝐶𝐶𝑐𝑐𝐶𝐶𝑐𝑐𝑐𝑐𝐶𝐶
= (𝐿𝐿𝐶𝐶𝐶𝐶𝐿𝐿)𝑐𝑐𝑐𝑐𝑐𝑐𝑡𝑡𝑢𝑢𝑢𝑢𝑢𝑢𝑢𝑢 − (𝐿𝐿𝐶𝐶𝐶𝐶𝐿𝐿)𝑢𝑢𝑢𝑢𝑟𝑟𝑢𝑢𝑢𝑢𝑢𝑢𝑟𝑟𝑐𝑐𝑢𝑢
(𝐶𝐶𝐶𝐶𝐷𝐷𝐷𝐷𝑐𝑐 𝐶𝐶𝐶𝐶2 𝑐𝑐𝑐𝑐𝑐𝑐 𝑘𝑘𝑘𝑘ℎ)𝑢𝑢𝑢𝑢𝑟𝑟𝑢𝑢𝑢𝑢𝑢𝑢𝑟𝑟𝑐𝑐𝑢𝑢 − (𝐶𝐶𝐶𝐶𝐷𝐷𝐷𝐷𝑐𝑐 𝐶𝐶𝐶𝐶2 𝑐𝑐𝑐𝑐𝑐𝑐 𝑘𝑘𝑘𝑘ℎ)𝑐𝑐𝑐𝑐𝑐𝑐𝑡𝑡𝑢𝑢𝑢𝑢𝑢𝑢𝑢𝑢 (2)
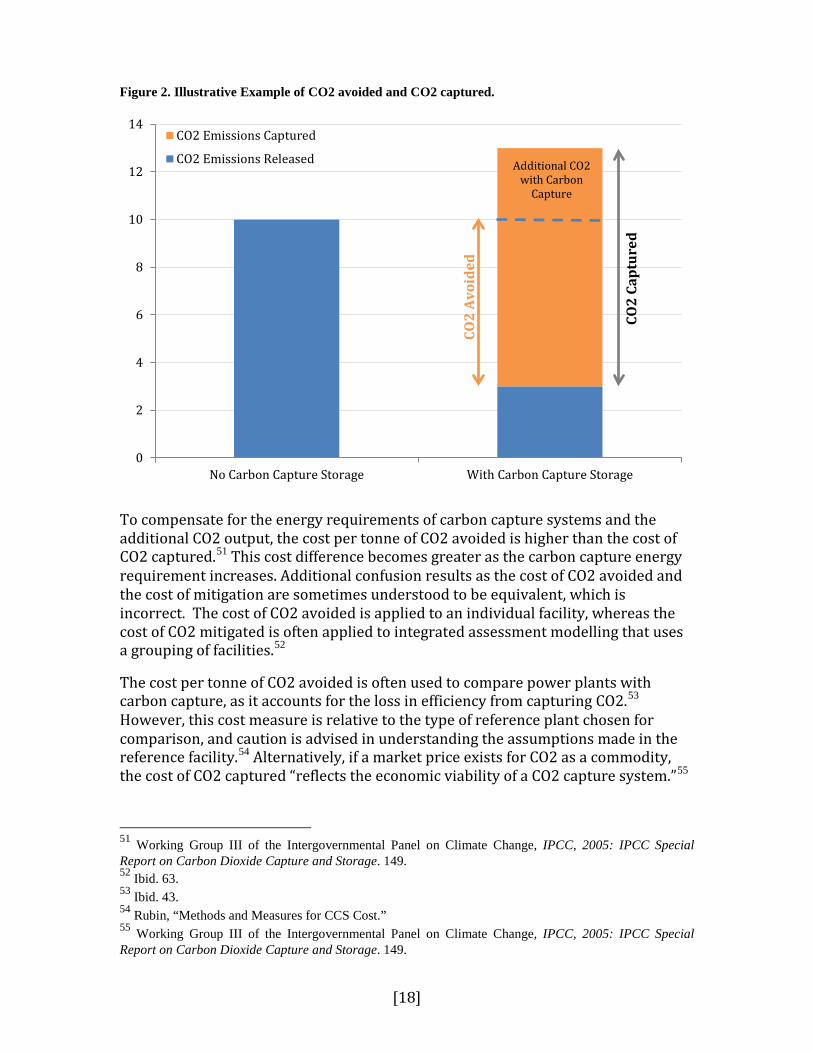
Figure 2 illustrates how the amount of CO2 captured and the amount of CO2 avoided are distinct. The extra energy requirement to capture CO2 results in decreased efficiency (measured by a power derating), which increases emissions output and the cost of electricity.50 As a result, the total amount of CO2 avoided is less than the total amount captured.
49 Ibid. 148. 50 Edward S Rubin and Haibo Zhai, “The Cost of Carbon Capture and Storage for Natural Gas Combined Cycle Power Plants,” Environmental Science & Technology 46, no. 6 (2012): 3076–84, doi:10.1021/es204514f. 3078.
[18]
Figure 2. Illustrative Example of CO2 avoided and CO2 captured.
To compensate for the energy requirements of carbon capture systems and the additional CO2 output, the cost per tonne of CO2 avoided is higher than the cost of CO2 captured.51 This cost difference becomes greater as the carbon capture energy requirement increases. Additional confusion results as the cost of CO2 avoided and the cost of mitigation are sometimes understood to be equivalent, which is incorrect. The cost of CO2 avoided is applied to an individual facility, whereas the cost of CO2 mitigated is often applied to integrated assessment modelling that uses a grouping of facilities.52
The cost per tonne of CO2 avoided is often used to compare power plants with carbon capture, as it accounts for the loss in efficiency from capturing CO2.53 However, this cost measure is relative to the type of reference plant chosen for comparison, and caution is advised in understanding the assumptions made in the reference facility.54 Alternatively, if a market price exists for CO2 as a commodity, the cost of CO2 captured “reflects the economic viability of a CO2 capture system.”55
51 Working Group III of the Intergovernmental Panel on Climate Change, IPCC, 2005: IPCC Special Report on Carbon Dioxide Capture and Storage. 149. 52 Ibid. 63. 53 Ibid. 43. 54 Rubin, “Methods and Measures for CCS Cost.” 55 Working Group III of the Intergovernmental Panel on Climate Change, IPCC, 2005: IPCC Special Report on Carbon Dioxide Capture and Storage. 149.
0
2
4
6
8
10
12
14
No Carbon Capture Storage With Carbon Capture Storage
CO2 Emissions Captured
CO2 Emissions Released
CO2
Avoi
ded
CO2
Capt
ured
Additional CO2 with Carbon
Capture

[19]
Other measures used to estimate cost are to use the cost of systems with and without carbon capture, and the capital cost of carbon capture systems. The cost of systems is dependent on the cost of generation ($ per kWh) and the amount of CO2 emissions generated per unit of electricity (t CO2 per kWh).56 This measure helps compare the cost if there are options for energy supply, and is often used to help select a baseline facility. The capital cost of carbon capture systems is a metric of technology cost, often used to estimate “the total expenditure required to design, purchase and install the system of interest.”57 Capital cost estimates vary between organizations, and additional factors such as the year of the cost estimate and accrued interest costs during construction have an effect.58 In addition, the cost of electricity has a major impact on project cost - especially to power plants. The levelized cost of electricity includes factors such as facility type, operations and fuel costs, in addition to the facility capacity factor and net plant power.59 As each project is unique, assumptions of these elements can significantly affect carbon capture cost estimates.
Understanding the assumptions of how carbon capture costs and power plant costs are estimated is critical. In a presentation at a 2011 CCS cost workshop, Rubin discusses how CCS costs are easily reduced if any or all of the following assumptions are used:60 high-efficiency power plants, high-quality fuel sources, low fuel costs, whether enhanced oil recovery (EOR) is combined with CO2 storage, only partial capital costs are included, short tons are used rather than metric tonnes, facility lifespan is long, the discount rate applied is low, and the facility has a high capacity factor. Rubin also shows that capital cost elements and private costs are not consistent across various studies and organizations, and that even within the same organization reported CCS costs increased with costing-method revisions.61 This leads to uncertainty and variability in knowing the true cost of CCS.
3.2.1 Cost estimates for carbon capture in the industrial sector Recent cost estimates for CO2 avoided and scenarios that are applicable to Alberta for the cement, petroleum refining, and pulp and paper industries, and for high purity sources such as natural gas processing and chemical production (ammonia, hydrogen, ethanol, and ethylene oxide) are provided in detail in Appendix C, Table C-1. The cost estimates are from research conducted by Leeson et al. (2017), who reviewed academic literature and “grey” literature (major industry and NGOs) for carbon capture avoidance costs applied to heavy industrial emissions.62 The costs
56 Ibid. 62. 57 Ibid. 147. 58 Ibid. 147. 59 See Appendix B for LCOE calculation (IPCC, 2005). 60 Rubin, “Methods and Measures for CCS Cost.” 61 Ibid. 12. 62 D. Leeson et al., “A Techno-Economic Analysis and Systematic Review of Carbon Captureand Storage (CCS) Applied to the Iron and Steel, Cement, Oil Refining and Pulp and Paper Industries, as Well as Other High Purity Sources,” International Journal of Greenhouse Gas Control 61 (2017): 71–84, doi:http://dx.doi.org/10.1016/j.ijggc.2017.03.020.
[20]
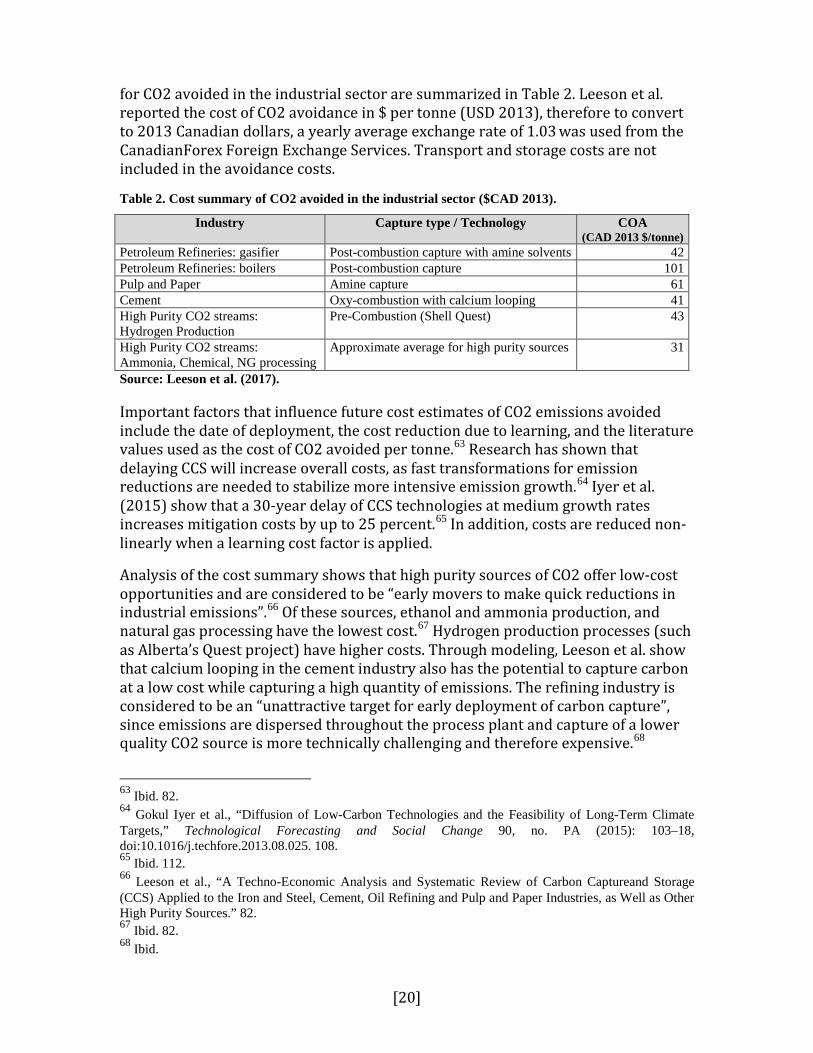
for CO2 avoided in the industrial sector are summarized in Table 2. Leeson et al. reported the cost of CO2 avoidance in $ per tonne (USD 2013), therefore to convert to 2013 Canadian dollars, a yearly average exchange rate of 1.03 was used from the CanadianForex Foreign Exchange Services. Transport and storage costs are not included in the avoidance costs.
Table 2. Cost summary of CO2 avoided in the industrial sector ($CAD 2013).
Industry Capture type / Technology COA (CAD 2013 $/tonne)
Petroleum Refineries: gasifier Post-combustion capture with amine solvents 42 Petroleum Refineries: boilers Post-combustion capture 101 Pulp and Paper Amine capture 61 Cement Oxy-combustion with calcium looping 41 High Purity CO2 streams: Hydrogen Production
Pre-Combustion (Shell Quest) 43
High Purity CO2 streams: Ammonia, Chemical, NG processing
Approximate average for high purity sources 31
Source: Leeson et al. (2017).
Important factors that influence future cost estimates of CO2 emissions avoided include the date of deployment, the cost reduction due to learning, and the literature values used as the cost of CO2 avoided per tonne.63 Research has shown that delaying CCS will increase overall costs, as fast transformations for emission reductions are needed to stabilize more intensive emission growth.64 Iyer et al. (2015) show that a 30-year delay of CCS technologies at medium growth rates increases mitigation costs by up to 25 percent.65 In addition, costs are reduced non-linearly when a learning cost factor is applied.
Analysis of the cost summary shows that high purity sources of CO2 offer low-cost opportunities and are considered to be “early movers to make quick reductions in industrial emissions”.66 Of these sources, ethanol and ammonia production, and natural gas processing have the lowest cost.67 Hydrogen production processes (such as Alberta’s Quest project) have higher costs. Through modeling, Leeson et al. show that calcium looping in the cement industry also has the potential to capture carbon at a low cost while capturing a high quantity of emissions. The refining industry is considered to be an “unattractive target for early deployment of carbon capture”, since emissions are dispersed throughout the process plant and capture of a lower quality CO2 source is more technically challenging and therefore expensive.68
63 Ibid. 82. 64 Gokul Iyer et al., “Diffusion of Low-Carbon Technologies and the Feasibility of Long-Term Climate Targets,” Technological Forecasting and Social Change 90, no. PA (2015): 103–18, doi:10.1016/j.techfore.2013.08.025. 108. 65 Ibid. 112. 66 Leeson et al., “A Techno-Economic Analysis and Systematic Review of Carbon Captureand Storage (CCS) Applied to the Iron and Steel, Cement, Oil Refining and Pulp and Paper Industries, as Well as Other High Purity Sources.” 82. 67 Ibid. 82. 68 Ibid.

[21]
3.2.2 Cost estimates for carbon capture in the power sector Cost estimates for CO2 avoidance in the power generation sector are given in Table 3 for natural gas-fired power plants and bio-energy with CCS (BECCS). Costs for coal-fired power plants are not included, as these facilities will be phased-out of Alberta by 2030.
Table 3. Cost of CO2 avoided in the power sector.
Industry Capture type / Technology COA (CAD 2013
$/tonne) Natural Gas Combined Cycle: Post-combustion capture
Post-combustion capture (amine based) 90
Natural Gas Combined Cycle: Post-combustion capture with enhanced efficiency
Post-combustion capture with new proposed system integration
66
Bio-Energy with CCS Energy production combustion 125
Source: Rubin et al. (2015), Hu et al. (2017), and Bhave et al. (2017).
Bhave et al. (2017) show that when a BECCS 50 MWe scale plant uses biomass wood pellets as feedstock, a fairly consistent cost of CO2 avoided in the range of $101 to 151 per tonne (CAD 2013) is found for BECCS deployment over a modeled time frame.69 A coal-fired power plant without CCS was used as the reference case to calculate the cost of CO2 avoidance. Costs vary with both the technology type and the feedstock type. For example, the COA is reduced by up to 50 percent when locally sourced (U.K.) wood chips are used as feedstock rather than pellets.70 In this analysis, to bring the estimated COA in the power sector to CAD 2013 dollars, yearly average exchange rates were applied, and costs were escalated using the North American PCCI.71
Care is needed when considering costs estimates with differing assumptions, which are quite common across the literature. When calculating the COA, the levelized cost of electricity of a reference capture plant is sensitive to fuel costs and varies over the lifetime of a facility. In European studies where gas prices are higher compared to North America, the LCOE and therefore the COA are often cited as being higher.
69 Amit Bhave et al., “Screening and Techno-Economic Assessment of Biomass-Based Power Generation with CCS Technologies to Meet 2050 CO2 Targets,” Applied Energy 190 (2017): 481–89, doi:10.1016/j.apenergy.2016.12.120. 487. 70 Ibid. 488. 71 Bhave et al. (2017) reported the cost of CO2 emissions avoided in £2010/tonne CO2. To bring estimated costs of CO2 avoided in the power sector to $CAD 2013 dollars, a yearly average exchange rate in 2010 of $1.5929/£2010 was used to convert to 2010 Canadian dollars. The IHS North American Power Capital Costs Index (NAPCCI) from 2010 to 2013 increased by 5.3 percent, which was used to escalate costs to 2013 Canadian dollars. A learning curve factor was not applied.
[22]
3.3 Market Valuation Account
3.3.1 Costs Potential CCS projects in the industrial and power sectors are assessed using the cost of CO2 emissions avoided (or the cost of CO2 avoidance). The cost of CO2 emissions avoided (COA) is a metric used to compare a reference facility without carbon capture to a facility with the same output that has carbon capture. The avoidance costs do not include CO2 transport, sequestration, and monitoring. Figure 3 shows the COA relevant to the industrial and power sectors in Alberta, adjusted to CAD 2013.72 High purity CO2 sources in the industrial sector (natural gas processing, ammonia and chemical production) have the lowest COA (average of $30 per tonne CO2), as additional costs are not incurred for more expensive separation methodologies. The Shell Quest demonstration project is considered to be on the upper end of costs for hydrogen production with carbon capture.73
72 See Appendix C for a detailed summary on CO2 avoidance costs. 73 Leeson et al., “A Techno-Economic Analysis and Systematic Review of Carbon Captureand Storage (CCS) Applied to the Iron and Steel, Cement, Oil Refining and Pulp and Paper Industries, as Well as Other High Purity Sources.” 76.

[23]
Figure 3. Estimated cost of CO2 avoided in the industrial and power sectors ($ per tonne, CAD 2013)
Source: see Appendix C, Table C-1.
42
101
61
41
43
31
90
66
125
Petroleum Refineries:Post-combustion capture with amine solvents
Gasifier
Petroleum Refineries:Post-combustion capture
Boilers
Pulp and Paper:Amine capture
Cement:Oxy-combustion with calcium looping
High Purity CO2 streams:Hydrogen Production
Pre-Combustion (Shell Quest)
High Purity CO2 streams:Ammonia, Chemical, NG processing
Approximate average for high purity sources
Natural Gas Combined Cycle:Post-combustion capture
(monoethanolamine-based)
Natural Gas Combined Cycle:Post-combustion capture
Enhanced efficiency and new proposedsystem integration
Bio-Energy with Carbon Capture and Storage:Energy production combustion
Cost of CO2 avoided, $ per tonne (CAD 2013)

[24]
The cement industry, using oxy-combustion with chemical looping, and petroleum refineries, using post-combustion CO2 capture units with gasifiers, also have a low COA compared to other sectors at $41 and $42 per tonne (CAD 2013) respectively. Although these two sectors have similar avoidance costs, carbon capture for the cement industry captures approximately 70 percent of emissions, whereas a post-combustion capture unit on the refinery gasifier captures approximately 15 percent of emissions. A post-combustion capture unit on the boiler of a refinery captures approximately 50 percent of emissions but has a higher avoidance cost compared to a refinery without carbon capture. The pulp and paper industry has a $60 per tonne COA with post-combustion capture (PCC) on the recovery boiler, and approximately 60 percent of the emissions are captured.
In Alberta’s power sector, natural gas is used for single-cycle, combined cycle (NGCC), and cogeneration power plants. Carbon capture systems for NGCC power plants can reduce CO2 emissions by approximately 90 percent.74 The cost of CO2 avoided using carbon capture technology is $90 per tonne for post-combustion capture, but can be reduced to $66 per tonne if new proposed systems are adopted, such as the integration system proposed by Hu et al. (2017)75. For BECCS, the average avoidance cost of $125 per tonne with a 90 percent emission capture rate using wood pellets as feedstock is compared to an unabated coal-plant. However, this is highly dependent on the feedstock fuel price. Research by Bhave et al. (2017) show that the avoidance cost can decrease by 50 percent by using wood chips rather than wood pellets in the UK.76
Once CO2 is captured and leaves the facility, additional costs are incurred for transportation, storage, and monitoring. These costs are highly variable, and are project dependent. Knoope et al. (2013) harmonized cost estimates for CO2 pipeline transport using common economic assumptions and compared CO2 pipeline cost model outcomes.77 Costs include capital, and operation and maintenance (O&M) such as construction, materials, labour, right-of-way, feedstock, and energy prices. Cost range estimates for a 300 km CO2 pipeline are shown in Table 4.
74 Working Group III of the Intergovernmental Panel on Climate Change, IPCC, 2005: IPCC Special Report on Carbon Dioxide Capture and Storage.168. 75 Yue Hu et al., “Thermodynamic Analysis and Techno-Economic Evaluation of an Integrated Natural Gas Combined Cycle (NGCC) Power Plant with Post-Combustion CO2 Capture,” Applied Thermal Engineering 111 (2017): 308–16, doi:10.1016/j.applthermaleng.2016.09.094. 76 Bhave et al., “Screening and Techno-Economic Assessment of Biomass-Based Power Generation with CCS Technologies to Meet 2050 CO2 Targets.” 77 M. M.J. Knoope, A. Ramírez, and A. P.C. Faaij, “A State-of-the-Art Review of Techno-Economic Models Predicting the Costs of CO2 Pipeline Transport,” International Journal of Greenhouse Gas Control 16 (2013): 241–70, doi:10.1016/j.ijggc.2013.01.005.

[25]
Table 4. CO2 pipeline cost estimates.
Pipeline diameter (m) CO2 pipeline cost range estimate (in Millions C$2013 km)
0.3 0.17 to 0.99 1.3 2.31 to 19.95
Source: Knoope et al. (2013).
Knoope et al. (2013) modeled costs for the Alberta Carbon Trunk Line (distance of 240 km and diameter of 0.41 m), and found cost ranges of $0.41 to 4.0 million per km (CAD 2013).78,79 The planned specific costs for the Alberta Carbon Trunk Line falls within this cost range, at $1.28 million per km (CAD 2013).80 Pipeline transport cost estimates can be significantly impacted by the pipeline diameter, distance travelled between source and terminal, and whether a booster station is required. Cost savings are realized if large CO2 “backbone” pipeline transport infrastructure is constructed, where CO2 from multiple carbon capture projects are collected and transported together.81
Capital costs for geologic storage are incurred by drilling wells, in-field pipelines, and additional oil and gas activities and facilities if enhanced oil recovery (EOR) is combined with CO2 storage.82 Storage costs depend on the site location – both geographically and geologically, reuse of infrastructure such as existing wells, monitoring, and whether storage costs may be offset by EOR. These costs are project dependent and should be included in a full life-cycle cost assessment.
3.3.2 Benefits Industrial emitters are subject to Alberta’s carbon tax, and large emitters83 will also receive free emissions credits through the new output-based allocation system, effective January 2018. 84 If CCS is utilized, financial returns are expected for firms that would otherwise be paying a carbon price on emissions, if the carbon price is higher than avoidance cost. With reduced emissions, savings include reduced purchases of Alberta-based carbon offset credits, lower contributions to Alberta’s
78 Ibid. 266. 79 Knoope et al. 2013 cost ranges in M€2010/km. An average exchange rate in 2010 of C$1.37/€2010 is used to convert to Canadian dollars. The IHS Upstream Capital Costs Index (UCCI) is then used to escalate costs from 2010 to 2013, by approximately 12 percent. For example, cost range estimates of 0.11 to 0.64 M€2010/km for a pipeline diameter of 0.30 m is converted to 2013 Canadian dollars: 0.15 to 0.88 M C$2010 /km. A 12 percent increase in upstream construction costs are observed in the UCCI from 2010 to 2013. Therefore, costs are escalated 12 percent to: 0.17 to 0.99 M C$2013/km. 80 Ibid. 266. 81 Joris Morbee, “International Transport of Captured CO 2 : Who Can Gain and How Much?,” Environmental and Resource Economics 57, no. 3 (2014): 299–322, doi:10.1007/s10640-013-9670-y. 300. 82 Working Group III of the Intergovernmental Panel on Climate Change, IPCC, 2005: IPCC Special Report on Carbon Dioxide Capture and Storage. 259. 83 Facilities with emissions greater than 100,000 tonnes of CO2e per year, and those smaller emitters that choose to opt-in and be treated as large emitters. 84 Government of Alberta, “Output Based Allocation System Engagement,” 2017, https://www.alberta.ca/output-based-allocation-engagement.aspx.

[26]
Climate Change and Emissions Management Fund, or the sale of emission performance credits to other facilities.85
Financial revenue is expected if captured CO2 is utilized for EOR or for other industrial or commercial projects. The CO2 market price for EOR projects is a wide range that depends on the project location, subsurface geology, characteristics of the target field, and amount of CO2 required.86 CO2 suppliers will likely to be “price takers” and accept the given CO2 market price.87
3.4 Alberta Taxpayer Account The Alberta taxpayer account considers incremental provincial government revenues a benefit to the province. Government revenues are accrued from corporate taxes, carbon taxes, and oil and gas royalties. Corporate taxes are paid by corporations at the provincial level, and are applied to taxable income earned in Alberta. CCS projects decrease income to corporations if the cost of carbon capture is considered as a percentage of annual industrial profits, as a result government revenue is reduced. In addition, revenues that the government collects from heavy industrial emitters through the carbon tax is reduced if carbon capture is utilized. Linear infrastructure tax revenues which are collected by municipalities that host CO2 pipeline infrastructure are a benefit to regional taxpayers.
The Alberta government has committed $1.24 billion to commercial-scale CCS projects in Alberta, in support of the Quest and ACTL projects that aim to capture 2.76 MT CO2 per year.88 The province also contributes funding for CCS research and innovation through provincially-funded corporations Alberta Innovates and Emissions Reduction Alberta (ERA). ERA has provided $2.3 million towards carbon capture research for oil sands production.89 Government funded projects present an opportunity cost of public expenditure, which could be spent on other provincial priorities, as well as an overall cost to taxpayers.
For facilities that use natural gas as a feedstock for industrial processes or to produce energy, additional energy is required to deliver the same output when carbon capture is applied. Natural gas is not taxed under the Fuel Tax Act. However, as the resource owner of natural gas, Alberta collects royalties for natural gas production, which is a benefit to taxpayers. The amount collected depends on the amount of resource produced and the resource price. Furthermore, if CO2 is utilized for EOR there is an incremental benefit to taxpayers as the province receives extra 85 Ibid. 86 The United Nations Industrial Development Organization and the International Energy Agency, “Summary of Costs for CO2-EOR,” Global CCS Institute, 2011, https://hub.globalccsinstitute.com/publications/global-technology-roadmap-ccs-industry-sectoral-assessment-co2-enhanced-oil-recovery-10. 87 Ibid. 88 Alberta Government, “Carbon Capture and Storage,” Alberta Energy, accessed August 16, 2017, http://www.energy.alberta.ca/OurBusiness/3815.asp. 89 Emissions Reduction Alberta, “CCS Funded Projects,” 2017, http://era.redaffect.com/projects/?search=ccs#project-results.

[27]
revenue for increased oil and gas production. The CO2 captured and utilized for EOR in the ACTL project has the potential to generate more than $15 billion in provincial royalties.90
3.5 Environment Account This account considers the impact on the environment and the valuation of positive externalities in which people do not pay for, or negative externalities in which people are not compensated. The environment is defined broadly as including “the entire interrelated chain of life, and all of its parts of are equal value”.91 Environmental resources that are publicly consumed, such as clean air, are considered a public good that people do not have to pay for. It is non-excludable, where no one can be prevented from consuming clear air; and it is often considered non-rivalrous, where there is no additional cost for increased use. However, if emissions from a polluting company negatively affect air quality for others, then clean air is considered rivalrous.92 Environmental public goods often require the government to play a role in ensuring the costs of pollution are accounted for.
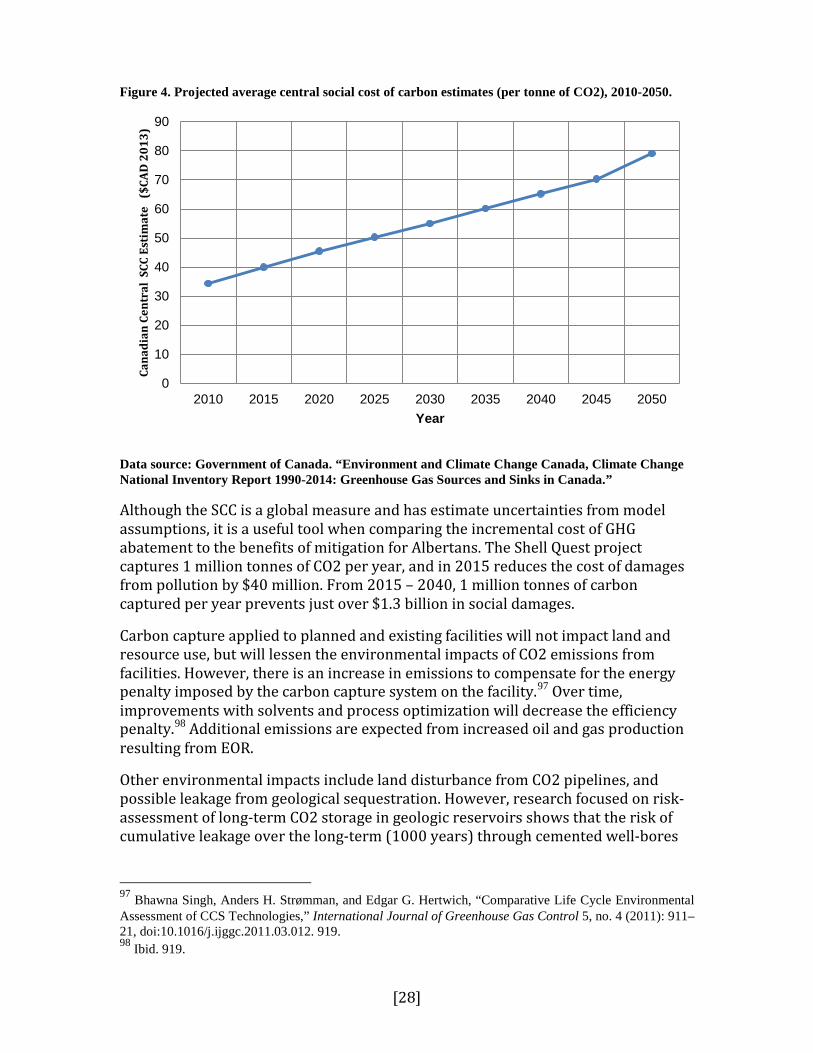
CO2 emissions play a critical part in anthropogenic climate change and reduce environmental quality.93 The social cost of carbon (SCC) is an economic concept used to quantify the present value cost of damages paid by society caused by emitting an additional ton of CO2e pollution.94 SCC estimates consider the global impacts from emissions and the economic damages due to climate change.95 Using data from Environment and Climate Change Canada, the projected average central SCC estimate for CO2, using a constant 3 percent discount rate from 2010 to 2050, is shown in Figure 4.96 The data was adjusted from 2012 to 2013 using a 0.9 percent increase in the annual average Consumer Price Index. A note on the discount rate used is provided in Appendix D.
90 Enhance Energy Inc., “The Alberta Carbon Trunk Line.” 91 Lydia Miljan, Public Policy in Canada, 6th ed. (Oxford University Press, 2012). 281. 92 Robert S. Pindyck and Daniel L. Rubinfeld, Microeconomics, 8th ed. (Prentice Hall, 2013). 691. 93 P. Friedlingstein et al., “Update on CO2 Emissions,” Nature Publishing Group 3, no. 12 (2010): 811–12, doi:10.1038/ngeo1022. 811. 94 William Nordhaus, “Revisiting the Social Cost of Carbon,” Proceedings of the National Academy of Sciences 114, no. 7 (2017): 1518–23, doi:https://doi.org/10.1073/pnas.1609244114. 1518. 95 Ibid. 96 Government of Canada, “Technical Update to Environment Canada’s Social Cost of Carbon Estimates,” Environment and Climate Change Canada, 2016, http://ec.gc.ca/cc/default.asp?lang=En&n=BE705779-1#SCC-Sec1.
[28]
Figure 4. Projected average central social cost of carbon estimates (per tonne of CO2), 2010-2050.
Data source: Government of Canada. “Environment and Climate Change Canada, Climate Change National Inventory Report 1990-2014: Greenhouse Gas Sources and Sinks in Canada.”
Although the SCC is a global measure and has estimate uncertainties from model assumptions, it is a useful tool when comparing the incremental cost of GHG abatement to the benefits of mitigation for Albertans. The Shell Quest project captures 1 million tonnes of CO2 per year, and in 2015 reduces the cost of damages from pollution by $40 million. From 2015 – 2040, 1 million tonnes of carbon captured per year prevents just over $1.3 billion in social damages.
Carbon capture applied to planned and existing facilities will not impact land and resource use, but will lessen the environmental impacts of CO2 emissions from facilities. However, there is an increase in emissions to compensate for the energy penalty imposed by the carbon capture system on the facility.97 Over time, improvements with solvents and process optimization will decrease the efficiency penalty.98 Additional emissions are expected from increased oil and gas production resulting from EOR.
Other environmental impacts include land disturbance from CO2 pipelines, and possible leakage from geological sequestration. However, research focused on risk-assessment of long-term CO2 storage in geologic reservoirs shows that the risk of cumulative leakage over the long-term (1000 years) through cemented well-bores
97 Bhawna Singh, Anders H. Strømman, and Edgar G. Hertwich, “Comparative Life Cycle Environmental Assessment of CCS Technologies,” International Journal of Greenhouse Gas Control 5, no. 4 (2011): 911–21, doi:10.1016/j.ijggc.2011.03.012. 919. 98 Ibid. 919.
0
10
20
30
40
50
60
70
80
90
2010 2015 2020 2025 2030 2035 2040 2045 2050
Cana
dian
Cen
tral
SCC
Est
imat
e (
$CAD
201
3)
Year
[29]
and impacts on shallow aquifers is very low.99 Leakage through faults and fractures in geologic formations is also a low concern if sequestration sites are properly modeled, mapped, and monitored.100 There is also the potential of induced seismic activity from CCS projects when CO2 is injected into deep geologic formations. The probability of an induced seismic event from CO2 sequestration is deemed as “remote”;101,102 however, risk uncertainty increases as greater volumes of CO2 from commercial-scale projects are injected. Risks are mitigated by geologic modeling and monitoring.
3.6 Social Account Social impacts of CCS projects to landowners and nearby communities, such as housing and community development for residents and businesses are identified as potential increased traffic and disruption near CO2 injection sites. Additional impacts include human toxicity potential, which increases with producing amine solvents used in carbon capture infrastructure.103 Yet, there are health benefits for communities near industrial facilities that implement CCS. CCS reduces local air contaminants and particulate matter that impose health damages such as respiratory diseases and premature mortality.104
Minimizing air pollution emissions will benefit nearby communities regarding health concerns. In 2002, the Inland cement facility in Edmonton, Alberta was granted approval by Alberta Environment to use coal rather than natural gas as a feedstock fuel source in cement kilns. This was met by opposition and an appeal from local residents concerned with “the health and nuisance impacts of emissions from Inland”.105 As a result of the 2002 appeal against Inland cement and Alberta Environment, the Alberta Environmental Appeal Board recommended installing a baghouse system to remove air particulates, an updated screening level risk assessment, and lower particulate emission limits. There is often a great deal of
99 Rajesh Pawar et al., “Quantification of Key Long-Term Risks at CO2 Sequestration Sites: Latest Results from US DOE’s National Risk Assessment Partnership (NRAP) Project,” in Energy Procedia, vol. 63, 2014, 4816–23, doi:10.1016/j.egypro.2014.11.512. 4822-4823. 100 Stefan Bachu and Theresa L. Watson, “Review of Failures for Wells Used for CO2 and Acid Gas Injection in Alberta, Canada,” in Energy Procedia, vol. 1, 2009, 3531–37, doi:10.1016/j.egypro.2009.02.146. 3532. 101 James P. Verdon, “Using Microseismic Data Recorded at the Weyburn CCS-EOR Site to Assess the Likelihood of Induced Seismic Activity,” International Journal of Greenhouse Gas Control 54 (2016): 421–28, doi:10.1016/j.ijggc.2016.03.018. 427. 102 Steven T Anderson, “Risk, Liability, and Economic Issues with Long-Term CO2 Storage---A Review,” Natural Resources Research, 2016, 1–24, doi:10.1007/s11053-016-9303-6.e 103 Singh, Strømman, and Hertwich, “Comparative Life Cycle Environmental Assessment of CCS Technologies.” 918. 104 Statistics Norway, Social Costs of Air Pollution and Fossil Fuel Use – A Macroeconomic Approach, ed. Knut Einar Rosendahl, Social and (Statistisk sentralbyrå, 1998), https://brage.bibsys.no/xmlui/bitstream/id/174699/sos99.pdf. 73-81. 105 Maga et al. v. Director, Northern Region, Regional Services, Alberta Environment re: Inland Cement Limited, Appeal Nos (2003).

[30]
public concern when emissions from industrial sources are close to populated areas, and reducing emissions improves health impacts in communities.
3.7 Economic Activity The economic activity account considers the incremental impacts on the labour market and substitute markets. If CO2 is utilized for EOR there is an incremental economic benefit for increased oil and gas production. However, EOR project economics are highly dependent on the price of oil, and large-scale EOR production may in turn reduce the market price of oil.106
CCS projects implemented in the near-term may provide labour market benefits as extra activity is induced in engineering, geosciences, and trades that do not have alternate employment. New employment opportunities arise to develop infrastructure for carbon capture and transport, and CO2 injection and post-injection monitoring. Since the oil price crash mid-2014, Alberta has undergone a long, and “well-above-average” recession in terms of GDP.107 As a result, Alberta’s unemployment rate in the resource sector (forestry, fishing, mining, quarrying, oil and gas) of 3.5 percent in 2014 surged to 9.0 percent in 2016, for people aged 25 to 54 years.108 Tens of thousands of jobs for professionals, scientists, and trades were lost.109 The market benefit of employment will depend on the stage of CCS deployment: from research, development, and demonstration (RD&D) to full-scale operational projects. If BECCS is deployed, then upstream employment impacts are expected in the agriculture and forestry industries to produce bio-energy fuel.
3.8 Other considerations In Alberta, public perception of CCS projects is often met with resistance. In 2010, the Carbon Capture and Storage Statutes Amendment Act (Bill 24),110 a controversial piece of subsurface rights legislation that assigns pore space to the province, was passed with opposition from landowners. The opposing landowners claimed pore space ownership falls under their property rights, and they were concerned with the potential risk from CCS projects beneath their property. Landowners are also
106 Andrew Leach, Charles F. Mason, and Klaas van t Veld, “Co-Optimization of Enhanced Oil Recovery and Carbon Sequestration,” Resource and Energy Economics 33, no. 4 (2011): 893–912, doi:10.1016/j.reseneeco.2010.11.002. 25. 107 TD Economics, “Alberta’s Recession Not Quite like the Others,” 2016, https://www.td.com/document/PDF/economics/special/AlbertaRecession2016.pdf. 108 Statistics Canada, “Table 282-0008 - Labour Force Survey Estimates (LFS), by North American Industry Classification System (NAICS), Sex and Age Group Annual,” CANSIM Database, 2017, http://www5.statcan.gc.ca/cansim/a47. 109 Claudia Cattaneo, “Jobless in Alberta: Tens of Thousands of Energy Professionals Are out of Work and out of Hope,” Financial Post, 2016, http://business.financialpost.com/commodities/energy/jobless-in-alberta-tens-of-thousands-of-energy-professionals-are-out-of-work-and-out-of-hope/wcm/42676bd6-bb07-4a75-91fd-75ece0a02b73. 110 Alberta, Carbon Capture and Storage Statues Amendment Act (Bill 24), 2010, The Ministry of Energy, 2010, http://www.assembly.ab.ca/ISYS/LADDAR_files/docs/bills/bill/legislature_27/session_3/20100204_bill-024.pdf.

[31]
concerned with environmental impacts, decrease of property value, and impacts on health and safety as a result of CCS projects.111 In 2011, a University of Calgary research project for carbon capture sequestration near Priddis, Alberta was cancelled due to local resistance. Major concerns regarding the project included potential impacts to groundwater and the wildlife corridor in the community.112 CCS projects that lack support are often believed to stem from a ‘not in my backyard’ (NIMBY) phenomenon, but studies show that protest of CCS projects are more often a result from a distrust in government and authorities.113,114
American carbon sequestration projects have also seen a lack of public acceptance, where “social factors, such as existing low socioeconomic status, desire for compensation, benefits to the community and past experience with government were of greater concern than concern about the risks of the technology itself.”115 Bradbury et al. (2009) discovered that communities are more willing to consider CO2 sequestration on their land if they feel a sense of empowerment.116 They cited the following influences that effect a community’s sense of empowerment: historical environmental issues, relationship with the petroleum industry and government, socioeconomic status, sense of fairness, and concerns of rights, liability, safety, and ownership.117 From these influences, the most significant to communities are having a sense of fairness and a trusting relationship with industry and government.118 These community concerns are not restricted to CCS projects, but are found to extend to other energy development projects such as shale gas, hydropower, and wind power turbines.119
3.9 Overall assessment of costs and benefits This section provides a discussion on the advantages and disadvantages of CCS projects in Alberta, considering the evaluation accounts in the MABCA from the 111 Heleen de Coninck and Sally M. Benson, “Carbon Dioxide Capture and Storage: Issues and Prospects,” Annual Review of Environment and Resources 39, no. 1 (October 17, 2014): 243–70, doi:10.1146/annurev-environ-032112-095222. 258. 112 Amanda Boyd, “A Case Study of Carbon Capture and Storage Development in Three Communities: Understanding the Role of Community and Sense of Place in Local Risk Perspectives” (University of Calgary, 2013), http://theses.ucalgary.ca/jspui/bitstream/11023/782/2/ucalgary_2013_boyd_amanda.pdf. 150. 113 Bart W. Terwel and Dancker D.L. Daamen, “Initial Public Reactions to Carbon Capture and Storage (CCS): Differentiating General and Local Views,” Climate Policy 12, no. March (2012): 288–300, doi:10.1080/14693062.2011.637819. 289 114 Karena Shaw et al., “Conflicted or Constructive? Exploring Community Responses to New Energy Developments in Canada,” Energy Research and Social Science 8 (2015): 41–51, doi:10.1016/j.erss.2015.04.003. 42. 115 Judith Bradbury et al., “The Role of Social Factors in Shaping Public Perceptions of CCS: Results of Multi-State Focus Group Interviews in the U.S.,” in Energy Procedia, vol. 1, 2009, 4665–72, doi:10.1016/j.egypro.2009.02.289. 4666. 116 Ibid. 4666. 117 Ibid. 4666. 118 Ibid. 4668. 119 Shaw et al., “Conflicted or Constructive? Exploring Community Responses to New Energy Developments in Canada.” 41.

[32]
viewpoint of Albertans. The greatest monetary cost rests with private firms in the industrial and power sector that invest in CCS. A list of selected industrial facilities in Alberta that emit over 300,000 tonnes CO2 that could potentially utilize CCS to reduce emissions are listed in Appendix E.
The total quantity of emissions in 2015 from these selected industrial facilities are shown in Figure 5. Large scale commercial in-situ oil sands extraction projects are omitted, as CO2 emissions are reported as site-wide emissions (from cogeneration units, bitumen upgraders, fugitive emissions, and non-combustive sources) rather than facility based.120 SAGD bitumen batteries were also excluded; although cogeneration power produces emissions at these sites, other on-site processes may also be contributing to emissions that were not listed. Some of these selected industrial facilities may also have emissions from mixed sources. For example, Agrium’s Carseland Nitrogen Operations (0.56 million tonnes of CO2 emissions in 2015) not only produces emissions directly from ammonia production, but also from an 80 MW cogeneration plant, where exhaust gases are used in the nitrogen operations process. For the gas processing industry, seven natural gas processing facilities were selected from over 500 gas processing plants in Alberta.121,122
120 As an example of site-wide emissions, Suncor Energy’s Firebag site reported 4.95 million tonnes of CO2 emissions in 2015, and has emissions that are dispersed between five cogeneration systems and other extraction and processing facilities on site for in-situ oil sands production. 121 Alberta Energy Regulator, “Alberta Plants and Facilities,” Statistics and Reports, 2017, http://www.aer.ca/data-and-publications/statistical-reports/plants-and-facilities. 122 Gas processing facilities who reported emissions to Environment and Climate Change Canada’s Greenhouse Gas Emissions Reporting Program (2015) of over 300,000 tones CO2 were selected as a cut-off point that is large enough to support large-scale CCS demonstration projects. Not all facilities reported emissions in 2015.

[33]
Figure 5. Emissions from selected industries in Alberta in 2015 (tonnes CO2).
Source: Data summarized from Canada, “Environment and Climate Change Canada, Results of GHG Facility Data Search,” 2015. See Appendix E for the list of selected facilities.
High purity CO2 sources (blue bars in Figure 5) produce over 32 million tonnes of CO2 emissions. Using an approximate average of $30 per tonne of CO2 avoided for high purity sources (see Appendix C, Table C-1) over an assumed facility lifetime of 30 years, approximately $29 billion of investment in carbon capture will reduce emissions by 29 million tonnes (capturing approximately 90 percent).123 Similarly, in the cement industry where 1.6 million tonnes of CO2 emissions are produced, investing in an oxy-combustion chemical looping carbon capture system with a lifetime cost of $40 per tonne of CO2 avoided over 30 years, requires an investment of $1.9 billion to reduce emissions by 1.1 million tonnes (capturing approximately 70 percent). Petroleum refineries are not as competitive; even though the costs of CO2 avoidance with carbon capture applied to the gasifier are relatively low compared to other sectors, the average emissions captured are only 15 percent.
For NGCC facilities, post-combustion capture can reduce emission by over 90 percent. Natural gas fueled power is set to grow in Alberta with the upcoming coal-power phase out as baseload power is replaced. With 6.2 million tonnes of annual CO2 emissions and a COA of $91 per tonne, this means that it costs approximately $16.9 billion over a 30 year facility lifetime to reduce annual CO2 emissions by 5.6 million tonnes (90 percent of emissions captured).124 With technological improvements, such as using an integrated post-combustion integrated system proposed by Hu et al. (2017), the cost could be reduced to $12.3 billion over a 30 year facility lifetime, or $66 per tonne.125
123 (32 million tonnes of CO2 per year)($30 per tonne avoidance cost)(30 years) = $28.8 billion 124 (6.2 million tonnes of CO2 per year)($91 per tonne avoidance cost)(30 years) = $16.9 billion 125 (6.2 million tonnes of CO2 per year)($66 per tonne avoidance cost)(30 years) = $12.3 billion
6,197,833
4,673,859
4,797,386
4,845,922
4,156,881
1,584,091
332,757
3,848,634
Power Sector
Gas Processing
Hydrogen Production
Chemical Manufacturing
Ammonia Production
Cement
Pulp and Paper
Petroleum Refineries

[34]
The cost of CO2 avoided for selected industries, the social cost of carbon, and the carbon tax in Alberta are illustrated in Figure 6. By 2020, for the cement industry and high purity CO2 sources it costs less to avoid emitting one tonne of CO2 with carbon capture than the estimated social damage that results for emitting one tonne of CO2. By 2022, the carbon tax of $50 per tonne is higher than the COA for high purity CO2 sources, the cement industry, and post-combustion capture (PCC) gasifiers in petroleum refineries. This means that these sectors should consider carbon capture technologies to reduce emissions since paying a carbon tax will have greater financial cost than the avoided cost of CO2. If these sectors invest in CCS, it is a benefit to Albertans as the COA is less than the social cost of carbon. BECCS may also be considered feasible; as discussed in the market valuation account, the COA is highly variable depending on the feedstock type, and costs may be reduced by up to 50 percent. In this case the COA would be between $50 and 109 per tonne (CAD 2013).126 With a reduced COA, investment in BECCS may be feasible with a carbon tax of $50 per tonne in 2022.
Figure 6. Cost of CO2 avoided and the social cost of carbon ($CAD 2013).
Data sources: Government of Canada. 2016. “Technical Update to Environment Canada’s Social Cost of Carbon Estimates.” Environment and Climate Change Canada. See Appendix C for CO2 Avoidance Cost.
Since CO2 capture technologies still are in the development and demonstration stage with some commercial-scale projects deployed in recent years, first-of-a-kind (FOAK) capital costs remain high until the technology matures and more Nth-of-a Kind (NOAK) commercial-scale projects become operational.127 As such, there is risk to investing in high cost FOAK CCS projects to ensure a successful project outcome. Risks related to executing FOAK CCS projects include: cost overruns due to 126 Bhave et al. (2017) cite that feedstock costs dominate, and avoidance costs of 30-65 £2010/tCO2 ($50 to 109 per tonne CAD 2013) if wood chips are used rather than pellets. 127 Edward S. Rubin, John E. Davison, and Howard J. Herzog, “The Cost of CO2 Capture and Storage,” International Journal of Greenhouse Gas Control 40 (2015): 378–400, doi:10.1016/j.ijggc.2015.05.018. 380.

[35]
exploration and construction delays, performance risks in the CCS lifecycle, long-term fuel price uncertainty, potential for changes in policy and regulatory policies on carbon pricing, other lower cost abatement options become available, and long-term liability.128
3.10 Multiple account benefit-cost summary The goal of this MABCA is to examine the costs and benefits of carbon capture and storage projects in Alberta from the viewpoint of Albertans. Rather than calculate a bottom line, this MABCA provides information on the impacts of CCS projects to Albertans, but also shows there is a significant cost to private firms and industry that invest in the technology. This section provides a summary of the benefits and costs from each account.
In the market valuation account, the cost of CO2 avoided for the industrial and power sectors are estimated for the lifetime of a facility. This cost measure is used to compare a reference facility without carbon capture to the same facility that utilizes carbon capture. Carbon capture from high purity streams (hydrogen processing, ammonia and chemical production), are the most financially feasible CCS projects at $30 to 40 per tonne of CO2 avoided. Future scenario forecasting by Leeson et al. (2017) revealed that the cement industry has significant potential to avoid emissions, where by 2050 the avoidance cost could be reduced by half.
Additional costs from transportation, storage, and monitoring are project dependent. There is also risk and liability of investing in FOAK while CCS projects are in the development and demonstration stage. Benefits are gained through financial returns if a firm avoids paying a carbon price on emissions that is higher than the avoidance cost, and if revenue from CO2 utilization is earned.
In the Alberta taxpayer account, costs include reduced government revenue of corporate tax income if the cost for carbon capture reduces annual industrial profits. If firms use carbon capture to reduce emissions by industrial emitters, then government revenue is also reduced from firms that participate in Alberta’s output-based allocation system. Addition costs are incurred when the government funds CCS projects. Benefits include linear tax revenue to municipalities that host CO2 pipeline infrastructure, and royalties collected from incremental natural gas production and EOR.
In the environmental account, the most significant impact of CCS is a benefit as it reduces the social cost of carbon. Other potential negative environmental impacts were identified, such as post-injection CO2 leakage from geologic formations into aquifers and induced seismic events, however the risk of this happening is cited from several sources as low.
128 Global CCS Institute, “Building CCS Pipeline Infrastructure: Risk and Uncertainty,” n.d., https://hub.globalccsinstitute.com/publications/development-carbon-capture-and-storage-infrastructure/32-building-ccs-pipeline.

[36]
In the social account, there is a benefit to communities if CCS is utilized in nearby facilities, as health impacts are reduced from local air contaminants and particulate matter.
In the economic activity account, if CCS is deployed in the near-term there is a potential benefit to Alberta’s labour market, which has seen unemployment rates rise to 9.0 percent in 2016 in the resource sector due to the oil crash mid-2014. If CCS is not used, it is business-as-usual and there is no impact to economic activity.
How each account is ranked in terms of importance or whether the accounts have equivalent weight is subjective. What is important is that the results in each account are considered without monetary bias. Overall, the cost and risk involved to invest in CCS is high, however there is a benefit to Albertans to reduce carbon emissions with CCS with the reasons stated above. For some industrial products, such as cement and high purity CO2 sources (i.e. ammonia and chemical production), there are no close substitutes and their demand is relatively inelastic. With no alternatives to these products, CCS is a viable option for these industrial sectors to reduce emissions. However, public perception of CCS is often met with resistance, and should not be underestimated. Public opposition of CCS have the power to cancel CCS projects. If CCS projects are to succeed, support is needed from Albertans, especially landowners who may store CO2 deep beneath their soil.

[37]
4 Rationale for Government Involvement This section identifies market failures that justify government intervention to reduce emissions and incentivize research that increases the efficiency of CCS and reduces costs. Policy options are evaluated to address the lack of incentives to bring CCS to the commercial scale.
Market failures lead to inefficiently allocated resources, and arise when “the market, if left alone, lacks any mechanism by which to account for external costs and/or benefits”.129 When a firm produces goods in the industrial or power sectors, pollution is often a by-product. In a free market with a lack of regulatory controls on pollution, firms freely dispose of pollution into the environment.130 Pollution is considered a negative externality as it affects the welfare of others and imposes external damages where costs are not accounted for. If the external costs from pollution are not paid for by polluters or consumers that demand the product, then the total costs of a project—including pollution—are greater than private costs and result in a net loss to society.
Market failures also arise when an innovating firm invests in research and development (R&D), and benefits less than society from the knowledge spillover. When both the innovating firm and society benefit, a positive externality occurs. In the 1962 paper Economic Welfare and the Allocation of Resources for Invention,131 Kenneth Arrow remarks that knowledge and invention are public goods that produce information. Knowledge is considered a public good by economists, because it is non-rivalrous—meaning that it remains intact with additional consumption, and non-excludable—others can access that knowledge. When producing information with outcome uncertainty, it is difficult to assess the amount of resources that are allocated towards research and invention.
Once knowledge is developed to efficiently capture carbon emissions and utilize or store emissions, this knowledge will not diminish and others will learn from or use the technology. However, when investing in research to produce desirable outcomes such as emission reduction from CCS on a commercial scale, there is risk of investment losses. Rivals also gain from information spillovers as a positive externality produced by the firm that conducts the research. Because of risk and uncertainty in research, there is a reluctance to invest in CCS research when projects are high-risk and outcomes are uncertain.
Some companies may still choose to invest in research to gain an edge against their competitors; however, it may be difficult for those firms to keep that knowledge for their own benefit. Patents and licensing may help incentivize innovation, however 129 Ahmed Hussen, Principles of Environmental Economics, Second (New York: Routledge of the Taylor and Francis group, 2004). 56. 130 Heather Kerr, Ken McKenzie, and Jack Mintz, eds., Tax Policy in Canada (Toronto: Canadian Tax Foundation, 2012). 10:2. 131 Kenneth Arrow, “Economic Welfare and the Allocation of Resources for Invention,” National Bureau of Economical Research: The Rate and Direction of Inventive Activity: Economic and Social Factors I (1962): S. 609-626, doi:10.1521/ijgp.2006.56.2.191.

[38]
other issues may arise such as “patent thickets” (multiple overlapping patent rights), which “obstruct entry to some markets and therefore impede innovation”.132 Patent thickets are expected for new membrane technologies that separate CO2 in post-combustion carbon capture.133 Patents also expire after 20 years in Canada. Although patents with long lifetimes incentivize innovation, inefficiencies result by monopolistic supply held by the patent holder.134 However, competitors can develop substitute technologies.135
It is likely that there is underinvestment in CCS research for a number of reasons. First, there is risk aversion to a first-generation technology. Firms cannot justify investing in technologies that will not be commercial for thirty years. Second, the information gained from research activities may have little benefit to a private firm—unless there is a large enough incentive such as a high carbon pricing mechanism for the firm to reduce their emissions. Third, there is the issue of how intellectual property (IP) is managed. A private firm may profit if they retain the IP for their research and enforce it, but then the information gained is underutilized and the amount of further research is reduced.
The government can provide an intervening role to correct negative externalities such as pollution, and positive externalities such as R&D knowledge spillovers that lead to underinvestment in innovation. There are many policy instruments that can incentivize reducing emissions and encourage CCS innovation, and options may be combined to address the identified market failures in this section. The key is choosing the appropriate policy that increases net social welfare.
4.1 Policy instruments to correct pollution Environmental taxation is a market-based instrument and aims to “affect behaviour in environmentally positive ways”.136 Externalities such as pollution can be priced with an environmental tax—also known as a Pigouvian tax—which is a method of government intervention to correct the inefficiencies of an unregulated market. By setting a price on carbon emissions with a tax, the government aims to discourage both the supply and demand of the activity that produces the externality. When a carbon tax is imposed, it aims to produce a socially efficient allocation of private cost equated to social benefit and social cost.137 An efficient carbon price would
132 Ian Hargreaves, “Digital Opportunity: A Review of Intellectual Property and Growth,” 2011, http://orca.cf.ac.uk/30988/1/1_Hargreaves_Digital Opportunity.pdf. 5. 133 Global CCS Institute, “Status of Patent Filed on Carbon Capture and Storage,” n.d., https://hub.globalccsinstitute.com/publications/carbon-dioxide-capture-and-storage-demonstration-developing-countries-analysis-key-19. 134 Reyer Gerlagh, Snorre Kverndokk, and Knut Einar Rosendahl, “Optimal Timing of Climate Change Policy: Interaction between Carbon Taxes and Innovation Externalities,” Environmental and Resource Economics 43, no. 3 (2009): 369–90, doi:10.1007/s10640-009-9271-y. 371. 135 Ibid. 136 Janet E. Milne, “Approach to Environmental Taxation,” in Handbook of Research on Environmental Taxation, ed. Janet E. Milne and Mikael Skou Anderson (Cheltenham: Edward Ekgar Publishing Inc., 2012). 4. 137 Kerr, McKenzie, and Mintz, Tax Policy in Canada.

[39]
sufficiently incentivize firms to invest in low emitting technologies on their own. For emerging technologies that reduce GHG emissions, “high levels of incentives require high carbon prices to bridge the incentive gap”.138
As seen in Figure 6, carbon pricing in Alberta remains below Canada’s SCC. In 2022, the carbon price of $50 per tonne is higher than the cost of CO2 avoided for high purity CO2 sources, the cement industry, and PCC gasifiers in petroleum refineries. Reducing emissions using CCS in these sectors is viable, otherwise they are paying a carbon price that is higher than the CO2 avoidance cost. For firms to be compensated for their investment in CCS, the cost of CO2 avoided needs to be lower than the carbon price.
However, even with a high carbon price, firms would face a volunteer’s dilemma where one firm invests in research to provide a public good while other firms free ride on the investment. For example, with the joint funding partnership of the Quest project between Shell and the Alberta and federal governments (Shell secured $845M of the $1.35B project), Shell agreed to share the CCS technology.139 As a result, additional incentives are needed to correct the knowledge spillovers gained by other firms and compensate firms for risks related to investing in FOAK CCS projects.
The motivation behind a government carbon price mandate needs to be considered. Motivations could be to lower emissions, generate revenue, or a combination of both. Ideally, a tax should be neutral. Tax neutrality promotes an ideal and neutral tax structure where decisions are made “on their economic merits and not for tax reasons”.140 Tax neutrality promotes fairness in allocated tax levies, and avoids bias from a horizontal and vertical equity perspective. Yet sometimes tax neutrality is unavoidable or undesirable, and policymakers need to examine the consequences of withdrawal from neutrality in their decision analysis. Revenues from the pan-Canadian carbon pricing mechanism returns to the provinces, whereas Alberta’s tax levy revenues are recycled to reducing small business taxes, refunded to low-income households, and reinvested to further reduce emissions. An assessment on the outcome of Alberta’s carbon levy is needed to determine if the effective tax rate has succeeded in reducing emissions, and if the revenue allocation can be improved.
4.2 Policy instruments for CCS R&D Tax credits are a desirable complimentary policy to implement in addition to the carbon tax due to the R&D market failure currently present in CCS development. While the carbon tax is sufficient to address the environmental externality (assuming it is priced at the social damages from emissions), it is not meant to 138 Yi Luo and Shelie Miller, “A Game Theory Analysis of Market Incentives for US Switchgrass Ethanol,” Ecological Economics 93 (2013): 42–56, doi:10.1016/j.ecolecon.2013.04.015. 52. 139 Hydrocarbons Technology, “Quest Carbon Capture and Storage Project, Alberta, Canada,” n.d., http://www.hydrocarbons-technology.com/projects/quest-carbon-capture-and-storage-project-alberta/. 140 Jason Furman, “The Concept of Neutrality in Tax Policy, Testimony Before the U.S. Senate Committee on Finance Hearing on ‘Tax: Fundamentals in Advance of Reform,’ April 15, 2008,” 2008, https://www.brookings.edu/wp-content/uploads/2016/06/0415_tax-_neutrality_furman-1.pdf.

[40]
address other market failures. Tax credits for CCS projects offered in conjunction with a carbon tax provides an incentive for firms to invest in R&D and receive compensation for their actions while benefiting the collective interest. Tax credits are also a policy instrument that can be used to combat the high investment cost of executing a new technology such as CCS. Tax credits are subtracted from income tax owing, allowing firms to earn a greater return on their investments, and are considered a tax subsidy to encourage behavior.
Scientific research and development tax credits are available through both the federal and provincial governments. Alberta offers a Scientific Research and Experimental Development Tax Credit (SR&ED) program to qualified corporations, and is refundable at the rate of 10 percent, for a maximum credit of $400,000.141 Qualified corporations must have permanent establishment in Alberta during the taxation year.
In addition, a federal SR&ED program is offered as a refundable input tax credit (ITC) where the paid GST is recovered to Canadian-controlled private corporations (CCPC’s) at a 35 percent rate that is 100 percent refundable up to a maximum threshold of $3 million. A qualifying corporation may also earn a rate of 15% that is 40% refundable on an ITC for an amount over $3 million.142 However, the Alberta SR&ED tax credit reduces the deductible federal SR&ED expenditures. Eligible expenditures for the federal SR&ED tax credit include research and development employee wages, overhead costs, and materials. Capital expenditures are excluded, such as machinery, equipment, and buildings. The eligible expenditures of a qualified corporation claiming the Alberta SR&ED tax credit are the same as those in the federal SR&ED qualified expenditure pool.
Both the provincial and federal SR&ED tax credits are an incentive to support innovation in R&D. However, as mentioned above, the SR&ED tax credit expenditure exclusions exempt the bulk cost of CCS projects—which are capital expenditure for carbon capture.
Expenditures for CCS projects are also excluded from incentives provided by the federal government for Canadian corporations to invest in clean energy projects under classes 43.1 and 43.2 in Schedule II of the Income Tax Regulations. These incentives, which are capital cost allowances (CCAs), are restricted to capital costs for renewable or thermal waste energy production, or systems that conserve energy. Capital costs for CCS are not included, although CO2 pipelines are provided an increased CCA rate to 8 percent.143
141 Government of Alberta, “Alberta Corporate Tax Act - Information Circular SRED-1 - Alberta Scientific Research and Experimental Development Tax Credit,” Alberta Treasury Board and Finance, 2015, http://www.finance.alberta.ca/publications/tax_rebates/corporate/sred1.html. 142 Canada Revenue Agency Government of Canada, “Claiming SR and ED Tax Incentives,” accessed March 19, 2017, http://www.cra-arc.gc.ca/txcrdt/sred-rsde/clmng/clmngsrd-eng.html#N101C2. 143 Canadian Energy Tax Group of Pricewaterhouse Coopers, “Oil and Gas Taxation in Canada: Framework for Investment in the Canadian Oil and Gas Sector,” 2012, https://www.pwc.com/ca/en/energy-utilities/publications/pwc-oil-gas-taxation-2012-10-en.pdf.

[41]
Governments attempt to correct market failures with tax expenditures in the form of tax credits.144 Tax expenditures are viewed as an incentive to reach a desired effect, and include “pollution control machinery credits” to provide monetary support and encourage a preferred development145 – such as investment in CCS. As an expenditure, overall tax revenue is then reduced and needs to be recovered from another source of tax payment to maintain the same level of government spending.
Rather than a tax credit, an argument can be made for a direct government expenditure. In the 1970 paper Tax Incentives as a Device for Implementing Government Policy, Surrey is in favor of direct government expenditure rather than tax incentives.146 He argues that tax incentives such as credits distort the allocation of government resources, and contravenes the concept of tax neutrality that promotes efficiency and minimizes the burden of taxation. However, direct subsidies alone have not promoted the advancement of carbon capture technology, which is needed to correct the market failure of GHG emissions. Although the rollout of direct subsidies from the federal and provincial governments have helped fund individual large-scale projects like Quest and the ACTL, these subsidies alone have not been effective in advancing future carbon capture projects. The federal government Clean Energy Fund awarded $120 million to Quest, and $745 million was awarded from the Government of Alberta; further subsidies were offered to the ACTL.
When a government wants to encourage activities such as reducing emissions, it may be more efficient to subsidize desired activities through the tax code.147 A tax credit directed specifically towards carbon capture rewards those that invest in reducing emissions through this technology, and offers risk sharing between the federal government and the private sector. The tax credit design is also important, where a cap is imposed at an efficient level to encourage investment, but also limits the government budget where resources may be shifted away from another sector. Tax credits for environmentally productive technologies such as CCS incentivize R&D, as well as earlier adoption of carbon capture technology since the net cost is subsidized and underinvestment in R&D is corrected.148
4.3 Recommendations A policy strategy is needed to increase investment in CCS and reduce barriers to successfully mitigating carbon emissions in existing industries. Environmental 144 Neil Brooks, “The Logic, Policy and Politics of Tax Law: An Overview,” in Materials on Canadian Income Tax, ed. Tim Edgar et al., 12th ed. (Scarborough, Ont: Carswell, 2000, 2000), http://www.yorku.ca/thwong/tax llm foundational readings/Brooks-Introductory Chapter.01-3.pdf. 54. 145 SS Surrey, “Tax Incentives as a Device for Implementing Government Policy: A Comparison with Direct Government Expenditures,” Harvard Law Review 83, no. 4 (1970): 705–38, doi:10.2307/1339837. 146 Ibid. 147 Furman, “The Concept of Neutrality in Tax Policy, Testimony Before the U.S. Senate Committee on Finance Hearing on ‘Tax: Fundamentals in Advance of Reform,’ April 15, 2008.” 3. 148 Herman Vollebergh, “The Role of Environmental Taxation in Spurring Technological Change,” in Handbook of Research on Environmental Taxation, ed. Janet E. Milne and Mikael Skou Anderson (Cheltenham: Edward Elgar Publishing Inc., 2012), 367.

[42]
taxation, such as carbon pricing, provides market demand for CCS technology to reduce carbon emissions. In addition, environmental taxation such as tax credits specifically for CCS projects can incentivize industrial CCS projects by promoting R&D and earlier market entry for carbon capture technologies. More firms would invest in a technology “if the expected rate of return exceeds the market rate of return”.149 Each policy alone is insufficient, and should be used as a to complement each other.
Carbon pricing in Alberta is expected to increase from $30 in 2017, to $50 by 2022. By 2022, the carbon price encourages carbon capture investment for high purity CO2 sources, the cement industry, and PCC gasifiers in petroleum refineries, since the avoided cost of CO2 from carbon capture is less than the cost of paying a carbon tax. Targeting these industries with a lower cost of CO2 avoidance that are clustered along the ACTL can also reduce costs for CO2 transport and storage. However, as CCS is still facing barriers to reach commercial-scale, additional incentives aside from carbon pricing is needed to overcome the high-costs and risks associated with developing a new technology and advance CCS deployment.
A Canadian tax credit specifically for CCS programs would help incentivize CCS demonstration and commercial projects. In advance of the 2017 federal budget, a pre-budget consultation process for the House of Commons Standing Committee on Finance was launched in June 2016. In response, Watt Capital proposed a carbon capture tax credit (CCTC) as “a new fiscal incentive to support access to capital for Canadian carbon capture projects”.150 The proposed 20 percent tax credit is directed to Canadian investors who invest in pilot and commercial carbon capture projects. The tax credit proposal targets smaller operations in industrial sectors such as transportation, manufacturing, mining, forestry, oil and gas, agriculture, and waste management. Eliminated from this proposal are large scale projects in the power sector. Unfortunately, the 2017 federal budget tabled on 22 March 2017 did not include a tax credit for carbon capture projects.
Instead, the federal government established a broader Low Carbon Economy Fund in 2016 as a strategy to support Canadian provinces and territories reduce carbon pollution. The $2 billion fund to reduce greenhouse gas emissions is available late 2017, and will span five years.151 Seventy percent of the fund ($1.4 billion) will be allocated to provinces and territories, with funding allocations based on population.152 The remainder ($600 million) is reserved for the “Low Carbon Economy Challenge” that supports larger and more ambitious projects.153 As of 149 Arrow, “Economic Welfare and the Allocation of Resources for Invention.” 613. 150 James S. Hershaw, “Federal Budget 2017 Pre-Submission: Carbon Tax Policies,” Parliament of Canada, 2016, http://www.parl.gc.ca/Content/HOC/Committee/421/FINA/Brief/BR8397869/br-external/JamesHershaw-e.pdf. 151 Government of Canada, “Building a Strong Middle Class: Budget 2017” (Ottawa, 2017), http://www.budget.gc.ca/2017/docs/plan/budget-2017-en.pdf. 152 Canada, “Low Carbon Economy Fund,” Environment and Climate Change Canada, 2017, https://www.canada.ca/en/environment-climate-change/news/2017/06/low_carbon_economyfund.html. 153 Ibid.
[43]
September 2017, more details are not available, but are expected in fall 2017. Although the Low Carbon Economy Fund aims to reduce GHG emissions, it does not specifically target investment in carbon capture and storage projects. Without a specific incentive in the form of a tax credit for research and development of carbon capture programs, investment in CCS R&D and commercial-scale projects are delayed.
Moving forward with CCS requires a guarantee from the government that signals support for CCS projects. To incentivize technological change and innovation, Vollebergh (2012) states, “An optimal response from a social welfare perspective would be to stimulate the market for new knowledge by using a subsidy or equivalent tax expenditure to guarantee a socially optimal amount of R&D spending.”154 This ensures specific support for CCS projects that are challenged by market entry barriers commonly faced by newer technologies.
In addition, both the provincial and federal governments need to acknowledge that large-scale CCS is required to meet Canada’s national climate change targets, and signal this acknowledgment to both the public and investors. This includes educating and engaging the public to improve perception and gain community trust and support for CCS projects. For investor support, CCS should be included in existing policies that support low-carbon initiatives. Existing provincial and federal policies that incentivize renewable energy and low-carbon projects, such as Alberta’s Renewable Electricity Program,155 and tax savings for clean energy projects,156 exclude CCS projects from reducing emissions. These existing policies could be extended to include CCS for the industrial and power sectors. As Arrow aptly stated, “The government is going to be in the business of supporting research and development on a large scale for a long time, and it is important that it use policies that take advantage of the incentives present in the economy.”157
154 Vollebergh, “The Role of Environmental Taxation in Spurring Technological Change.” 365. 155 Alberta Electric System Operator, “Renewable Electricity Program,” accessed September 9, 2017, https://www.aeso.ca/market/renewable-electricity-program/. 156 Canada, “Tax Savings for Industry: Class 43.1, Class 43.2 and Canadian Renewable and Conservation Expenses,” Natural Resources Canada, 2017, http://www.nrcan.gc.ca/energy/efficiency/industry/financial-assistance/5147. 157 Arrow, “Economic Welfare and the Allocation of Resources for Invention.” 626.

[44]
5 Conclusion CCS presents an opportunity to significantly reduce CO2 emissions in both the industrial and power sectors, and meet future emissions targets set by the international community. However, once the Alberta Carbon Trunk Line is completed in late 2017, there are no other large CCS demonstrations or commercial scale projects planned for the future in Alberta. CCS projects face deployment barriers related to high project costs, and risks related to bringing FOAK projects to commercial scale. This research shows that as the carbon price in Alberta escalates, CCS becomes more economical – particularly for the cement industry if oxyfuel combustion calcium looping is used, and CO2 emissions from high purity streams such as hydrogen processing, and ammonia and chemical production are captured. With technological improvements, increased scale, and more NOAK projects, other sectors may soon benefit from lower CO2 avoidance costs.
The multiple account benefit-cost analysis is from the perspective of Albertans, and evaluates and provides transparency of the cost and benefits for CCS projects to taxpayers, the environment, communities, and economic activity in Alberta’s labour market. The presented above analysis shows that CCS projects provide an overall benefit to Albertans. Yet an increasing carbon price and the identified benefits of CCS projects in Alberta does not ensure CCS project deployment.
A policy strategy to overcome the high-costs and risks associated with CCS projects through environmental taxation is needed, using both carbon pricing and a tax credit designed specifically for carbon capture. In addition, CCS projects should explicitly be included in existing policies that support low-carbon initiatives, but currently favour and incentivize renewable energy and other clean energy projects. Regardless of these recommendations, resistive public perception of CCS projects presents an obstacle to deployment. The public may be more willing to support CCS projects if there is more confidence in the technology given increased project demonstrations. Both the government and industry need to educate and engage the public to provide a sense of fairness and gain trust. It is also recognized that global collaboration is needed to accelerate progress in CCS development and mitigate climate change.158
Future research includes investigating whether there are more efficient alternatives to reducing emissions than CCS. For example, in the power sector avoidance costs for alternative renewable energy sources may be compared with existing facilities that have implemented CCS. However, if renewable energies are considered then additional costs such as new transmission lines, and building and operating a back-up source of baseload power also needs to be considered.159 It is beyond the scope of this research to consider the economic costs of alternatives. It is also beyond the scope of this research to evaluate the capital costs of CCS for each sector and determine the economic viability of specific projects, particularly since few CCS 158 Peters et al., “Key Indicators to Track Current Progress and Future Ambition of the Paris Agreement.” 159 Nick Hanley and Edward B. Barbier, Pricing Nature: Cost-Benefit Analysis and Environmental Policy (Cheltenham: Edward Elgar Publishing Inc., 2009). 288.

[45]
projects have been deployed at the commercial scale. Additional work could also include a deeper examination of a tax credit design for CCS investment, and investigate whether tax-credit expenditures lead to full scale commercial projects in other clean-tech industries. Also, alternate means to fund CCS initiatives could be explored, such as revenues from the carbon tax, oil and gas royalties, CO2 utilization, or pooled funds from electricity providers.

[46]
References
Alberta. “Alberta Corporate Tax Act - Information Circular SRED-1 - Alberta Scientific Research and Experimental Development Tax Credit.” Alberta Treasury Board and Finance, 2015. http://www.finance.alberta.ca/publications/tax_rebates/corporate/sred1.html.
Alberta. “Alberta’s Economic Recovery Bolsters National Growth | Alberta.ca.” Alberta Government Announcement, 2017. https://www.alberta.ca/release.cfm?xID=4835270BD3670-00AA-800E-34DDE78949A0A6EA.
Alberta. “Carbon Capture and Storage.” Alberta Energy. Accessed August 16, 2017. http://www.energy.alberta.ca/OurBusiness/3815.asp.
Alberta. Carbon Capture and Storage Statues Amendment Act (Bill 24), 2010. The Ministry of Energy, 2010. http://www.assembly.ab.ca/ISYS/LADDAR_files/docs/bills/bill/legislature_27/session_3/20100204_bill-024.pdf.
Alberta. Carbon Sequestration Tenure Regulation, Alta Reg 68/2011. CanLII. Accessed November 13, 2016. http://canlii.ca/t/52q6b.
Alberta. Mines and Minerals Act, 2016. RSA 2000, c M-17. CanLII. Accessed November 12. http://canlii.ca/t/8272.
Alberta. “Our Business.” Alberta Energy, December 28, 2006. http://www.energy.alberta.ca/OurBusiness.asp..
Alberta. “Output Based Allocation System Engagement,” 2017. https://www.alberta.ca/output-based-allocation-engagement.aspx.
Alberta. Surface Rights Act, RSA 2000, c S-24. CanLII. Accessed November 13, 2016. http://canlii.ca/t/52ddk
Alberta’s Industrial Heartland. “Alberta Carbon Trunk Line Project Status,” 2017. http://industrialheartland.com/project-status/.
Alberta Department of Energy. “Carbon Capture and Storage: Why Do We Need CCS.” Accessed December 5, 2016. http://www.solutionsstarthere.ca/20.asp.
Alberta Electric System Operator. “Renewable Electricity Program.” Accessed September 9, 2017. https://www.aeso.ca/market/renewable-electricity-program/.
Alberta Energy Regulator. “Alberta Plants and Facilities.” Statistics and Reports, 2017. http://www.aer.ca/data-and-publications/statistical-reports/plants-and-facilities.
Allam, Rodney J. “NET Power’s CO2 Cycle: The Breakthrough That CCS Needs.” Modern Power Systems, 2013. http://www.modernpowersystems.com/features/featurenet-powers-co2-cycle-the-breakthrough-that-ccs-needs.
Anderson, Steven T. “Risk, Liability, and Economic Issues with Long-Term CO2 Storage---A Review.” Natural Resources Research, 2016, 1–24. doi:10.1007/s11053-016-9303-6.
Arasto, Antti, Eemeli Tsupari, Janne Kärki, Risto Sormunen, Timo Korpinen, and Sari Hujanen. “Feasibility of Significant CO2 Emission Reductions in Thermal Power Plants–comparison of

[47]
Biomass and CCS.” Energy Procedia 63 (2014): 6745–55. doi:10.1016/j.egypro.2014.11.710.
Arrow, K., M. Cropper, C. Gollier, B. Groom, G. Heal, R. Newell, W. Nordhaus, et al. “Determining Benefits and Costs for Future Generations.” Science 341, no. 6144 (2013): 349–50. doi:10.1126/science.1235665.
Arrow, Kenneth. “Economic Welfare and the Allocation of Resources for Invention.” National Bureau of Economical Research: The Rate and Direction of Inventive Activity: Economic and Social Factors I (1962): S. 609-626. doi:10.1521/ijgp.2006.56.2.191.
Bachu, Stefan, and W.D. Gunter. “Storage Capacity of CO2 in Geological Media in Sedimentary Basins with Application to the Alberta Basin.” In Greenhouse Gas Control Technologies: Proceedings of the 4th International Conference on Greenhouse Gas Control Technologies, 30 August - 2 September 1998., edited by Baldur Eliasson, Pierce Riemer, and Alexander Wokaun, 1205. Interlaken, Switzerland: Elsevier Science Ltd., 1999.
Bachu, Stefan, and Theresa L. Watson. “Review of Failures for Wells Used for CO2 and Acid Gas Injection in Alberta, Canada.” In Energy Procedia, 1:3531–37, 2009. doi:10.1016/j.egypro.2009.02.146.
Bankes, Nigel. “Legal Issues Associated with the Adoption of Commercial Scale CCS Projects.” Calgary, 2008. https://www.pembina.org/reports/ccs-discuss-legal.pdf.
Basavaraja, R. J., and S. Jayanti. “Comparative Analysis of Four Gas-Fired, Carbon Capture-Enabled Power Plant Layouts.” Clean Technologies and Environmental Policy 17, no. 8 (2015): 2143–56. doi:10.1007/s10098-015-0936-7.
Bergman, Perry D., Edward M. Winter, and Zhong-Ying Chen. “Disposal of Power Plant CO2 in Depleted Oil and Gas Reservoirs in Texas.” Energy Conversion and Management 38 (1997): S211–16. doi:10.1016/0196-8904(95)00058-L.
Bhave, Amit, Richard H.S. Taylor, Paul Fennell, William R. Livingston, Nilay Shah, Niall Mac Dowell, John Dennis, et al. “Screening and Techno-Economic Assessment of Biomass-Based Power Generation with CCS Technologies to Meet 2050 CO2 Targets.” Applied Energy 190 (2017): 481–89. doi:10.1016/j.apenergy.2016.12.120.
Blackwell, Richard. “Alberta Cancels Funding for Carbon Capture Project.” The Globe and Mail, February 25, 2013. https://beta.theglobeandmail.com/report-on-business/industry-news/energy-and-resources/alberta-cancels-funding-for-carbon-capture-project/article9024237/?ref=http://www.theglobeandmail.com&.
Bohm, Mark, Scott Goold, Stefan Laux, Ben Neu, Apoorva Sharma, and Knut Aasen. “Application of Oxy-Fuel CO2 Capture for in-Situ Bitumen Extraction from Canada’s Oil Sands.” Energy Procedia 4, no. 4 (2011): 958–65. doi:10.1016/j.egypro.2011.01.142.
Bolea, I., G. Ordorica-Garciab, M. Nikoo, and M. Carbo. “Techno-Economics of CCS in Oil Sands Thermal Bitumen Extraction: Comparison of CO2 Capture Integration Options.” Energy Procedia 37 (2013): 2754 – 2764. doi:10.1016/j.egypro.2013.06.160.
Boyd, Amanda. “A Case Study of Carbon Capture and Storage Development in Three Communities: Understanding the Role of Community and Sense of Place in Local Risk Perspectives.” University of Calgary, 2013. http://theses.ucalgary.ca/jspui/bitstream/11023/782/2/ucalgary_2013_boyd_amanda.pdf.

[48]
Bradbury, Judith, Isha Ray, Tarla Peterson, Sarah Wade, Gabrielle Wong-Parodi, and Andrea Feldpausch. “The Role of Social Factors in Shaping Public Perceptions of CCS: Results of Multi-State Focus Group Interviews in the U.S.” In Energy Procedia, 1:4665–72, 2009. doi:10.1016/j.egypro.2009.02.289.
Brooks, Neil. “The Logic, Policy and Politics of Tax Law: An Overview.” In Materials on Canadian Income Tax, edited by Tim Edgar, Jinyan Li, Daniel Sandler, and Richard Bird, 12th ed. Scarborough, Ont: Carswell, 2000, 2000. http://www.yorku.ca/thwong/tax llm foundational readings/Brooks-Introductory Chapter.01-3.pdf.
Business Wire. “FuelCell Energy and ExxonMobil Announce Location for Fuel Cell Carbon Capture Pilot Plant,” 2016. http://www.businesswire.com/news/home/20161027005404/en/FuelCell-Energy-ExxonMobil-Announce-Location-Fuel-Cell.
Canada. “Claiming SR and ED Tax Incentives.” Canada Revenue Agency. Accessed March 19, 2017. http://www.cra-arc.gc.ca/txcrdt/sred-rsde/clmng/clmngsrd-eng.html#N101C2.
Canada. “Building a Strong Middle Class: Budget 2017.” Department of Finance. Ottawa, 2017. http://www.budget.gc.ca/2017/docs/plan/budget-2017-en.pdf.
Canada. “Canadian Environmental Sustainability Indicators Greenhouse Gas Emissions.” Environment and Climate Change Canada, 2016, Gatineau. https://www.ec.gc.ca/indicateurs-indicators/18F3BB9C-43A1-491E-9835-76C8DB9DDFA3/GHGEmissions_EN.pdf.
Canada. “Climate Change - National Inventory Report 1990-2014: Greenhouse Gas Sources and Sinks in Canada.” Environment and Climate Change Canada. Accessed February 22, 2017. https://ec.gc.ca/ges-ghg/default.asp?lang=En&n=662F9C56-1.
Canada. “Greenhouse Gas Emissions.” Environment and Climate Change Canada, 2017. https://www.ec.gc.ca/indicateurs-indicators/?lang=en&n=FBF8455E-1.
Canada. “Low Carbon Economy Fund.” Environment and Climate Change Canada, 2017. https://www.canada.ca/en/environment-climate-change/news/2017/06/low_carbon_economyfund.html.
Canada. “Results of GHG Facility Data Search,” Environment and Climate Change Canada, 2015. http://www.ec.gc.ca/ges-ghg/donnees-data/index.cfm?do=results&lang=en&year=2015&prov=AB&submit=Send&order_field=data_co2eq&order=DESC.
Canada. “Technical Update to Environment Canada’s Social Cost of Carbon Estimates.” Environment and Climate Change Canada, 2016. http://ec.gc.ca/cc/default.asp?lang=En&n=BE705779-1#SCC-Sec1.
Canada. “Near-Zero Emissions Oxy-Fuel Combustion.” Natural Resources Canada, 2016. https://www.nrcan.gc.ca/energy/coal/carbon-capture-storage/4307.
Canada. “Shell Canada Energy Quest Project.” Natural Resources Canada. Accessed May 11, 2017. http://www.nrcan.gc.ca/energy/funding/current-funding-programs/18168.
Canada. “Tax Savings for Industry: Class 43.1, Class 43.2 and Canadian Renewable and Conservation Expenses.” Natural Resources Canada, 2017. http://www.nrcan.gc.ca/energy/efficiency/industry/financial-assistance/5147.

[49]
Canadian Energy Tax Group of Pricewaterhouse Coopers. “Oil and Gas Taxation in Canada: Framework for Investment in the Canadian Oil and Gas Sector,” 2012. https://www.pwc.com/ca/en/energy-utilities/publications/pwc-oil-gas-taxation-2012-10-en.pdf.
Massachusetts Institute of Technology. “Boundary Dam Fact Sheet: Carbon Dioxide Capture and Storage Project.” Carbon Capture and Sequestration Technologies at MIT. Accessed October 2, 2016. http://sequestration.mit.edu/tools/projects/boundary_dam.html.
Massachusetts Institute of Technology. "Schwarze Pumpe Fact Sheet: Carbon Dioxide Capture.” Carbon Capture and Sequestration Technologies at MIT. Accessed June 12, 2017. http://sequestration.mit.edu/tools/projects/vattenfall_oxyfuel.html.
Cattaneo, Claudia. “Jobless in Alberta: Tens of Thousands of Energy Professionals Are out of Work and out of Hope.” Financial Post, 2016. http://business.financialpost.com/commodities/energy/jobless-in-alberta-tens-of-thousands-of-energy-professionals-are-out-of-work-and-out-of-hope/wcm/42676bd6-bb07-4a75-91fd-75ece0a02b73.
Center for Climate and Energy Solutions. “Carbon Capture Use and Storage.” Accessed March 27, 2017. https://www.c2es.org/technology/factsheet/CCS#_edn38.
Cole, Ivan S., Penny Corrigan, Samson Sim, and Nick Birbilis. “Corrosion of Pipelines Used for CO 2 Transport in CCS: Is It a Real Problem?” International Journal of Greenhouse Gas Control, 2011. doi:10.1016/j.ijggc.2011.05.010.
Cole, Susan, and Sarah Itani. “The Alberta Carbon Trunk Line and the Benefits of CO2.” Energy Procedia 37 (2013): 6133–39. doi:10.1016/j.egypro.2013.06.542.
Coninck, Heleen de, and Sally M. Benson. “Carbon Dioxide Capture and Storage: Issues and Prospects.” Annual Review of Environment and Resources 39, no. 1 (October 17, 2014): 243–70. doi:10.1146/annurev-environ-032112-095222.
Cormos, Calin Cristian. “Evaluation of Iron Based Chemical Looping for Hydrogen and Electricity Co-Production by Gasification Process with Carbon Capture and Storage.” International Journal of Hydrogen Energy 35, no. 6 (2010): 2278–89. doi:10.1016/j.ijhydene.2010.01.033.
Cormos, Calin Cristian. “Evaluation of Reactive Absorption and Adsorption Systems for Post-Combustion CO2 Capture Applied to Iron and Steel Industry.” Applied Thermal Engineering 105 (2016): 56–64. doi:10.1016/j.applthermaleng.2016.05.149.
Davison, John. “Performance and Costs of Power Plants with Capture and Storage of CO2.” Energy 32, no. 7 (2007): 1163–76. doi:10.1016/j.energy.2006.07.039.
Dowell, N. Mac, and M. Fajardy. “On the Potential for BECCS Efficiency Improvement through Heat Recovery from Both Post-Combustion and Oxy-Combustion Facilities.” Faraday Discuss. 0 (2016): 1–10. doi:10.1039/C6FD00051G.
Drèze, Jean, and Nicholas Stern. “The Theory of Cost-Benefit Analysis.” In Handbook of Public Economics, 2:909–89, 1987. doi:10.1016/S1573-4420(87)80009-5.
Emissions Reduction Alberta. “CCS Funded Projects,” 2017. http://era.redaffect.com/projects/?search=ccs#project-results.

[50]
Enhance Energy Inc. “Alberta Carbon Trunk Line Q & A.” Accessed May 11, 2017. http://www.enhanceenergy.com/q_a.
Enhance Energy Inc. “The Alberta Carbon Trunk Line.” Accessed November 15, 2016. http://www.enhanceenergy.com/.
European Commission. “CORDIS : CEMCAP Report Summary - CEMCAP (CO2 Capture from Cement Production).” Community Research and Development Information Service, 2016. http://cordis.europa.eu/result/rcn/190404_en.html.
Frank, Robert H. “Why Is Cost-Benefit Analysis so Controversial?” The Journal of Legal Studies 29, no. S2 (2000): 913–30. doi:10.1086/468099.
Friedlingstein, P., R.a. Houghton, G. Marland, J. Hackler, T.a. Boden, T.J. Conway, J.G. Canadell, M.R. Raupach, P. Ciais, and Corinne Le Quéré. “Update on CO2 Emissions.” Nature Publishing Group 3, no. 12 (2010): 811–12. doi:10.1038/ngeo1022.
Furman, Jason. “The Concept of Neutrality in Tax Policy, Testimony Before the U.S. Senate Committee on Finance Hearing on ‘Tax: Fundamentals in Advance of Reform,’ April 15, 2008,” 2008. https://www.brookings.edu/wp-content/uploads/2016/06/0415_tax-_neutrality_furman-1.pdf.
Gerlagh, Reyer, Snorre Kverndokk, and Knut Einar Rosendahl. “Optimal Timing of Climate Change Policy: Interaction between Carbon Taxes and Innovation Externalities.” Environmental and Resource Economics 43, no. 3 (2009): 369–90. doi:10.1007/s10640-009-9271-y.
Giddey, S., S. P S Badwal, A. Kulkarni, and C. Munnings. “A Comprehensive Review of Direct Carbon Fuel Cell Technology.” Progress in Energy and Combustion Science 38, no. 3 (2012): 360–99. doi:10.1016/j.pecs.2012.01.003.
Global CCS Institiute. “CO2 Capture Technologies: Technology Options for CO2 Capture,” 2012. https://hub.globalccsinstitute.com/sites/default/files/publications/29701/co2-capture-technologies.pdf.
Global CCS Institute. “Building CCS Pipeline Infrastructure: Risk and Uncertainty,” n.d. https://hub.globalccsinstitute.com/publications/development-carbon-capture-and-storage-infrastructure/32-building-ccs-pipeline.
Global CCS Institute. “Development Trends in CO2 Capture Technologies.” Accessed June 19, 2017. https://hub.globalccsinstitute.com/publications/global-status-ccs-2014/75-development-trends-co2-capture-technologies.
Global CCS Institute. “Effects of CO2 Capture Efficiency on Plant Performance.” Accessed August 3, 2017. https://hub.globalccsinstitute.com/publications/co2-control-technology-effects-igcc-plant-performance-and-cost/effects-co2-capture-efficiency-plant-performance.
Global CCS Institute. “Large Scale CCS Projects.” Accessed October 4, 2016. https://www.globalccsinstitute.com/projects/large-scale-ccs-projects.
Global CCS Institute. “Status of Patent Filed on Carbon Capture and Storage,” n.d. https://hub.globalccsinstitute.com/publications/carbon-dioxide-capture-and-storage-demonstration-developing-countries-analysis-key-19.
[51]
Granados, D. A., F. Chejne, and J. M. Mejía. “Oxy-Fuel Combustion as an Alternative for Increasing Lime Production in Rotary Kilns.” Applied Energy 158 (2015): 107–17. doi:10.1016/j.apenergy.2015.07.075.
Hanley, Nick, and Edward B. Barbier. Pricing Nature: Cost-Benefit Analysis and Environmental Policy. Cheltenham: Edward Elgar Publishing Inc., 2009.
Hargreaves, Ian. “Digital Opportunity: A Review of Intellectual Property and Growth,” 2011. http://orca.cf.ac.uk/30988/1/1_Hargreaves_Digital Opportunity.pdf.
Hassan, B., O.V. Ogidiama, M.N. Khan, and T. Shamim. “Energy and Exergy Analyses of a Power Plant with Carbon Dioxide Capture Using Multistage Chemical Looping Combustion.” Journal of Energy Resources Technology, Transactions of the ASME 139, no. 3 (2017). doi:10.1115/1.4035057.
Hershaw, James S. “Federal Budget 2017 Pre-Submission: Carbon Tax Policies.” Parliament of Canada, 2016. http://www.parl.gc.ca/Content/HOC/Committee/421/FINA/Brief/BR8397869/br-external/JamesHershaw-e.pdf.
Hester, Ronald E, and Roy M Harrison, eds. Carbon Capture Sequestration and Storage. Issues in Environmental Science and Technology Vol. 29. Cambridge: The Royal Society of Chemistry, 2010.
Hill, Richard, Stephen Scott, David Butler, Song P. Sit, Dan Burt, Raman Narayanan, Todd Cole, Christine Li, Vicki Lightbown, and Z. John Zhou. “Application of Molten Carbonate Fuel Cell for CO2 Capture in Thermal in Situ Oil Sands Facilities.” International Journal of Greenhouse Gas Control 41 (2015): 276–84. doi:10.1016/j.ijggc.2015.07.024.
Howes, Barbara. “Enhanced Oil Recovery in Canada: Success in Progress.” Journal of Canadian Petroleum Technology 27, no. 6 (1988).
Hu, Yue, Gang Xu, Cheng Xu, and Yongping Yang. “Thermodynamic Analysis and Techno-Economic Evaluation of an Integrated Natural Gas Combined Cycle (NGCC) Power Plant with Post-Combustion CO2 Capture.” Applied Thermal Engineering 111 (2017): 308–16. doi:10.1016/j.applthermaleng.2016.09.094.
Hussen, Ahmed. Principles of Environmental Economics. Second. New York: Routledge of the Taylor and Francis group, 2004.
Hydrocarbons Technology. “Quest Carbon Capture and Storage Project, Alberta, Canada,” n.d. http://www.hydrocarbons-technology.com/projects/quest-carbon-capture-and-storage-project-alberta/.
International Energy Agency. “Energy Technology Perspectives 2012: Pathways to a Clean Energy System.” Paris, 2012. doi:10.1787/energy_tech-2012-en.
International Energy Agency. “Carbon Capture and Storage.” Accessed August 28, 2017. https://www.iea.org/topics/ccs/.
Intergovernmental Panel on Climate Change. Climate Change 2014: Mitigation of Climate Change. Working Group III Contribution to the Fifth Assessment Report of the Intergovernmental Panel on Climate Change, 2014. doi:10.1017/CBO9781107415416.

[52]
Intergovernmental Panel on Climate Change. Working Group III, 2005: IPCC Special Report on Carbon Dioxide Capture and Storage. Edited by Bert Metz, O. Davidson, H. de Coninck, M. Loos, and L. Meyer. Cambridge, United Kingdom and New York, NY, USA: Cambridge University Press, 2005. https://www.ipcc.ch/report/srccs/.
Iyer, Gokul, Nathan Hultman, Jiyong Eom, Haewon McJeon, Pralit Patel, and Leon Clarke. “Diffusion of Low-Carbon Technologies and the Feasibility of Long-Term Climate Targets.” Technological Forecasting and Social Change 90, no. PA (2015): 103–18. doi:10.1016/j.techfore.2013.08.025.
Kerr, Heather, Ken McKenzie, and Jack Mintz, eds. Tax Policy in Canada. Toronto: Canadian Tax Foundation, 2012.
King Abdullah Petroleum Studies, Saud M. Al-Fattah, Murad F. Barghouty, and Bashir O. Dabbousi. Carbon Capture and Storage: Technologies, Policies, Economics, and Implementation Strategies. CRC Press, 2011.
Knoope, M. M.J., A. Ramírez, and A. P.C. Faaij. “A State-of-the-Art Review of Techno-Economic Models Predicting the Costs of CO2 Pipeline Transport.” International Journal of Greenhouse Gas Control 16 (2013): 241–70. doi:10.1016/j.ijggc.2013.01.005.
Korre, Anna, Z Nie, and Sevket Durucan. “Life Cycle Modelling of Fossil Fuel Power Generation with Post-Combustion CO2 Capture.” International Journal of Greenhouse Gas Control 4, no. 2 (2010): 289–300. doi:10.1016/j.ijggc.2009.08.005.
Kuramochi, Takeshi, Hao Wu, Andrea Ramírez, André Faaij, and Wim Turkenburg. “Techno-Economic Prospects for CO2 Capture from a Solid Oxide Fuel Cell-Combined Heat and Power Plant. Preliminary Results.” In Energy Procedia, 1:3843–50, 2009. doi:10.1016/j.egypro.2009.02.186.
Leach, Andrew, Angela Adams, Stephanie Cairns, Linda Coady, and Gordon Lambert. “Climate Leadership Report to Minister.” Edmonton, 2015. https://www.alberta.ca/documents/climate/climate-leadership-report-to-minister.pdf.
Leach, Andrew, Charles F. Mason, and Klaas van t Veld. “Co-Optimization of Enhanced Oil Recovery and Carbon Sequestration.” Resource and Energy Economics 33, no. 4 (2011): 893–912. doi:10.1016/j.reseneeco.2010.11.002.
Leeson, D., N. Mac Dowell, N. Shah, C. Petit, and P.S. Fennell. “A Techno-Economic Analysis and Systematic Review of Carbon Captureand Storage (CCS) Applied to the Iron and Steel, Cement, Oil Refining and Pulp and Paper Industries, as Well as Other High Purity Sources.” International Journal of Greenhouse Gas Control 61 (2017): 71–84. doi:http://dx.doi.org/10.1016/j.ijggc.2017.03.020.
Leung, Dennis Y C, Giorgio Caramanna, and M. Mercedes Maroto-Valer. “An Overview of Current Status of Carbon Dioxide Capture and Storage Technologies.” Renewable and Sustainable Energy Reviews, 2014. doi:10.1016/j.rser.2014.07.093.
Levasseur, A., J. Marion, and F. Vitse. “Alstom’s [GE] Chemical Looping Combustion Technology with CO2 Capture for New and Existing Coal-Fired Power Plants (FE0009484).” In 2016 NETL CO2 Capture Technology Meeting. Pittsburgh, PA, 2016. https://www.netl.doe.gov/File Library/Events/2016/c02 cap review/5-Friday/A-Levasseur-GE-Alstom-Chemical-Looping.pdf.
Li, Jing, Hedong Zhang, Zuopeng Gao, Jie Fu, Wenya Ao, and Jianjun Dai. “CO2 Capture with Chemical

[53]
Looping Combustion of Gaseous Fuels: An Overview.” Energy & Fuels, 2017, acs.energyfuels.6b03204. doi:10.1021/acs.energyfuels.6b03204.
Luo, Yi, and Shelie Miller. “A Game Theory Analysis of Market Incentives for US Switchgrass Ethanol.” Ecological Economics 93 (2013): 42–56. doi:10.1016/j.ecolecon.2013.04.015.
Lupion, Monica, Andrea Pérez, Fernando Torrecilla, and Belén Merino. “Lessons Learned from the Public Perception and Engagement Strategy-Experiences in CIUDEN’s CCS Facilities in Spain.” Energy Procedia 37 (2013): 7369–79. doi:10.1016/j.egypro.2013.06.678.
MacDowell, Niall, Nick Florin, Antoine Buchard, Jason Hallett, Amparo Galindo, George Jackson, Claire S. Adjiman, Charlotte K. Williams, Nilay Shah, and Paul Fennell. “An Overview of CO2 Capture Technologies.” Energy & Environmental Science 3, no. 11 (2010): 1645–69. doi:10.1039/c004106h.
Maga et al. v. Director, Northern Region, Regional Services, Alberta Environment re: Inland Cement Limited, Appeal Nos (2003).
Miljan, Lydia. Public Policy in Canada. 6th ed. Oxford University Press, 2012.
Mills, Robin. Capturing Carbon: The New Weapon in the War against Climate Change. New York: Columbia University Press, 2011.
Milne, Janet E. “Approach to Environmental Taxation.” In Handbook of Research on Environmental Taxation, edited by Janet E. Milne and Mikael Skou Anderson. Cheltenham: Edward Ekgar Publishing Inc., 2012.
Monne, J., L. Jammes, E. Gaucher, N. Labat, C. Urbancyk, S. Thibeau, C. Prinet, et al. “Carbon Capture and Storage. The Lacq Pilot.” Paris, 2015. http://hub.globalccsinstitute.com/sites/default/files/publications/194253/carbon-capture-storage-lacq-pilot.pdf.
Morbee, Joris. “International Transport of Captured CO 2 : Who Can Gain and How Much?” Environmental and Resource Economics 57, no. 3 (2014): 299–322. doi:10.1007/s10640-013-9670-y.
Nimana, Balwinder, Christina Canter, and Amit Kumar. “Energy Consumption and Greenhouse Gas Emissions in the Recovery and Extraction of Crude Bitumen from Canada’s Oil Sands.” Applied Energy 143 (2015): 189–99. doi:10.1016/j.apenergy.2015.01.024.
Noorden, Richard Van. “Two Plants to Put ‘clean Coal’ to Test.” Nature 509, no. 7498 (April 29, 2014): 20–20. doi:10.1038/509020a.
Nordhaus, William. “Revisiting the Social Cost of Carbon.” Proceedings of the National Academy of Sciences 114, no. 7 (2017): 1518–23. doi:https://doi.org/10.1073/pnas.1609244114.
Pawar, Rajesh, Grant Bromhal, Susan Carroll, Shaoping Chu, Robert Dilmore, Jason Gastelum, Curt Oldenburg, Philip Stauffer, Yingqi Zhang, and George Guthrie. “Quantification of Key Long-Term Risks at CO2 Sequestration Sites: Latest Results from US DOE’s National Risk Assessment Partnership (NRAP) Project.” In Energy Procedia, 63:4816–23, 2014. doi:10.1016/j.egypro.2014.11.512.
Perrin, Nicolas, Richard Dubettier, Frederick Lockwood, Philippe Court, Jean Pierre Tranier, Claire Bourhy-Weber, and Michel Devaux. “Oxycombustion for Carbon Capture on Coal Power Plants and Industrial Processes: Advantages, Innovative Solutions and Key Projects.” In Energy

[54]
Procedia, 37:1389–1404, 2013. doi:10.1016/j.egypro.2013.06.015.
Peters, Glen P., Robbie M. Andrew, Josep G. Canadell, Sabine Fuss, Robert B. Jackson, Jan Ivar Korsbakken, Corinne Le Quéré, and Nebojsa Nakicenovic. “Key Indicators to Track Current Progress and Future Ambition of the Paris Agreement.” Nature Climate Change 7, no. 118 (2017). doi:10.1038/nclimate3202.
Pindyck, Robert S., and Daniel L. Rubinfeld. Microeconomics. 8th ed. Prentice Hall, 2013.
Power Engineering. “Kemper County Power Plant Cost Surpasses $7 Billion.” Power Engineering, 2017. http://www.power-eng.com/articles/2017/01/kemper-county-power-plant-cost-surpasses-7-billion.html.
Rubin, Edward S. “Methods and Measures for CCS Cost.” In CCS Cost Workshop, 19. Paris, 2011. http://www.cmu.edu/epp/iecm/rubin/PDF files/2011/Rubin_CCS cost methods and measures_3-22-11.pdf.
Rubin, Edward S., John E. Davison, and Howard J. Herzog. “The Cost of CO2 Capture and Storage.” International Journal of Greenhouse Gas Control 40 (2015): 378–400. doi:10.1016/j.ijggc.2015.05.018.
Rubin, Edward S., Hari Mantripragada, Aaron Marks, Peter Versteeg, and John Kitchin. “The Outlook for Improved Carbon Capture Technology.” Progress in Energy and Combustion Science, 2012. doi:10.1016/j.pecs.2012.03.003.
Rubin, Edward S, and Haibo Zhai. “The Cost of Carbon Capture and Storage for Natural Gas Combined Cycle Power Plants.” Environmental Science & Technology 46, no. 6 (2012): 3076–84. doi:10.1021/es204514f.
Sanchez, Daniel L., James H. Nelson, Josiah Johnston, Ana Mileva, and Daniel M. Kammen. “Biomass Enables the Transition to a Carbon-Negative Power System across Western North America.” Nature Climate Change 5, no. February (2015): 3–7. doi:10.1038/nclimate2488.
Shaffer, Marvin. Multiple Account Benefit-Cost Analysis: A Practical Guide for the Systematic Evaluation of Project and Policy Alternatives. Kindle. Toronto: University of Toronto Press, 2010.
Shaw, Karena, Stephen D. Hill, Amanda D. Boyd, Lindsay Monk, Joanna Reid, and Edna F. Einsiedel. “Conflicted or Constructive? Exploring Community Responses to New Energy Developments in Canada.” Energy Research and Social Science 8 (2015): 41–51. doi:10.1016/j.erss.2015.04.003.
Shell Canada. “Quest Carbon Capture and Storage Project.” Accessed November 14, 2016. http://www.shell.ca/en_ca/about-us/projects-and-sites/quest-carbon-capture-and-storage-project.html.
Singh, Bhawna, Anders H. Strømman, and Edgar G. Hertwich. “Comparative Life Cycle Environmental Assessment of CCS Technologies.” International Journal of Greenhouse Gas Control 5, no. 4 (2011): 911–21. doi:10.1016/j.ijggc.2011.03.012.
Sit, S. P., A. Reed, U. Hohenwarter, V. Horn, K. Marx, and T. Proell. “Cenovus 10 MW CLC Field Pilot.” In Energy Procedia, 37:671–76, 2013. doi:10.1016/j.egypro.2013.05.155.
Smith, Pete, Steven J Davis, Felix Creutzig, Sabine Fuss, Jan Minx, Benoit Gabrielle, Etsushi Kato, et al. “Biophysical and Economic Limits to Negative CO2 Emissions.” Nature Clim. Change 6, no. 1

[55]
(2016): 42–50. doi:10.1038/nclimate2870\rhttp://www.nature.com/nclimate/journal/v6/n1/abs/nclimate2870.html#supplementary-information.
Spero, Chris. “Callide Oxyfuel Project - Lessons Learned,” 2014. http://hub.globalccsinstitute.com/sites/default/files/publications/157873/callide-oxyfuel-project-lessons-learned.pdf.
Stanger, Rohan, Terry Wall, Reinhold Spörl, Manoj Paneru, Simon Grathwohl, Max Weidmann, Günter Scheffknecht, et al. “Oxyfuel Combustion for CO2 Capture in Power Plants.” International Journal of Greenhouse Gas Control 40 (2015): 55–125. doi:10.1016/j.ijggc.2015.06.010.
Statistics Canada. “Table 282-0008 - Labour Force Survey Estimates (LFS), by North American Industry Classification System (NAICS), Sex and Age Group Annual.” CANSIM Database, 2017. http://www5.statcan.gc.ca/cansim/a47.
Statistics Norway. Social Costs of Air Pollution and Fossil Fuel Use – A Macroeconomic Approach. Edited by Knut Einar Rosendahl. Social and. Statistisk sentralbyrå, 1998. https://brage.bibsys.no/xmlui/bitstream/id/174699/sos99.pdf.
Straelen, Jiri van, Frank Geuzebroek, Nicholas Goodchild, Georgios Protopapas, and Liam Mahony. “CO2 Capture for Refineries, a Practical Approach.” International Journal of Greenhouse Gas Control 4, no. 2 (2010): 316–20. doi:10.1016/j.ijggc.2009.09.022.
Surrey, S.S. “Tax Incentives as a Device for Implementing Government Policy: A Comparison with Direct Government Expenditures.” Harvard Law Review 83, no. 4 (1970): 705–38. doi:10.2307/1339837.
Sustainable Energy Solutions. “Cryogenic Carbon Capture.” Accessed June 12, 2017. https://sesinnovation.com/technology/carbon_capture/.
TD Economics. “Alberta’s Recession Not Quite like the Others,” 2016. https://www.td.com/document/PDF/economics/special/AlbertaRecession2016.pdf.
Terwel, Bart W., and Dancker D.L. Daamen. “Initial Public Reactions to Carbon Capture and Storage (CCS): Differentiating General and Local Views.” Climate Policy 12, no. March (2012): 288–300. doi:10.1080/14693062.2011.637819.
“The Expert Panel on the Potential for New and Emerging Technologies to Reduce the Environmental Impacts of Oil Sands Development Technological Prospects for Reducing the Environmental Footprint of Canadian Oil Sands.” Ottawa, 2015. http://www.scienceadvice.ca/uploads/ENG/AssessmentsPublicationsNewsReleases/OilSands/OilSandsFullReportEn.pdf.
United Nations Industrial Development Organization and the International Energy Agency. “Summary of Costs for CO2-EOR.” Global CCS Institute, 2011. https://hub.globalccsinstitute.com/publications/global-technology-roadmap-ccs-industry-sectoral-assessment-co2-enhanced-oil-recovery-10.
United Nations Industrial Development Organization. “Carbon Capture and Storage in Industrial Applications: Technology Synthesis Report - Working Paper.” Vienna, 2010. https://www.unido.org/fileadmin/user_media/Services/Energy_and_Climate_Change/Energy_Efficiency/CCS/synthesis_final.pdf
Verdon, James P. “Using Microseismic Data Recorded at the Weyburn CCS-EOR Site to Assess the

[56]
Likelihood of Induced Seismic Activity.” International Journal of Greenhouse Gas Control 54 (2016): 421–28. doi:10.1016/j.ijggc.2016.03.018.
Vollebergh, Herman. “The Role of Environmental Taxation in Spurring Technological Change.” In Handbook of Research on Environmental Taxation, edited by Janet E. Milne and Mikael Skou Anderson, 510. Cheltenham: Edward Elgar Publishing Inc., 2012.
Zeman, Frank. “Oxygen Combustion in Cement Production.” In Energy Procedia, 1:187–94, 2009. doi:10.1016/j.egypro.2009.01.027.
ZeroCO2. “Century Plant — zeroco2.” Accessed June 20, 2017. http://www.zeroco2.no/projects/century-plant.
Zhang, Wenbin, Chenggong Sun, Colin E. Snape, Robin Irons, Simon Stebbing, Tony Alderson, David Fitzgerald, and Hao Liu. “Process Simulations of Post-Combustion CO2 Capture for Coal and Natural Gas-Fired Power Plants Using a Polyethyleneimine/silica Adsorbent.” International Journal of Greenhouse Gas Control 58 (2017): 276–89. doi:10.1016/j.ijggc.2016.12.003.

[57]
APPENDIX A. CCS Technologies Contaminants in the CO2 stream also have corrosive effects on pipeline transport and are subject to strict regulatory restrictions.160 The knowledge gained from developing CCS technologies from high-purity industrial CO2 sources offer further opportunity to develop CCS in other sectors.161
A.1 Post-combustion capture Post-combustion capture (PCC) of CO2 is applicable to fossil fuel fired power plants that produce power from pulverized coal or natural gas.162 Other industries such as cement production, iron and steel manufacturing, oil refining, and petrochemicals may also utilize post-combustion CO2 capture technologies.163,164 Post-combustion capture may be applied to new plants, or retrofitted to existing plants. In post-combustion capture systems, CO2 is removed from fossil fuel combustion exhaust gas (known as flue gas). CO2 concentration by volume in the flue gas is typically low, at 3 to 15 percent, while the main component is nitrogen.165 An advanced solvent absorption (or “scrubbing”) process using chemical or physical absorption is used to capture and bond with CO2 in this system. During absorption, CO2 bonds with the chemical solvent to produce a rich CO2 solvent stream – at concentrations of 85 percent or higher.166 The solvent stream is then heated using steam in a reboiler for desorbtion – a solvent regeneration process that breaks the strong chemical bonds between the CO2 and solvent.167 The solvent regeneration process requires a significant amount of energy, and is where the bulk of operating costs occur.168 Following desorbtion, the solvent is recycled and the CO2 is ready to be compressed for transportation.
160 Ivan S. Cole et al., “Corrosion of Pipelines Used for CO 2 Transport in CCS: Is It a Real Problem?,” International Journal of Greenhouse Gas Control, 2011, doi:10.1016/j.ijggc.2011.05.010. 749. 161 United Nations Industrial Development Organization, “Carbon Capture and Storage in Industrial Applications: Technology Synthesis Report - Working Paper” (Vienna, 2010). 4. 162 Gibbons, J. and Chalmers, H. ‘Fossil Power Generation with Carbon Capture and Storage (CCS): Policy Development for Technology Development. In Carbon Capture Sequestration and Storage, Issues in Environmental Science and Technology Vol. 29, ed. Ronald E. Hester and Roy M. Harrison (Cambridge: The Royal Society of Chemistry, 2010), 57. 163 Global CCS Institiute, “CO2 Capture Technologies: Technology Options for CO2 Capture,” 2012, https://hub.globalccsinstitute.com/sites/default/files/publications/29701/co2-capture-technologies.pdf. 3. 164 Calin Cristian Cormos, “Evaluation of Reactive Absorption and Adsorption Systems for Post-Combustion CO2 Capture Applied to Iron and Steel Industry,” Applied Thermal Engineering 105 (2016): 56–64, doi:10.1016/j.applthermaleng.2016.05.149. 165 Anna Korre, Z Nie, and Sevket Durucan, “Life Cycle Modelling of Fossil Fuel Power Generation with Post-Combustion CO2 Capture,” International Journal of Greenhouse Gas Control 4, no. 2 (2010): 289–300, doi:10.1016/j.ijggc.2009.08.005. 292. 166 John Davison, “Performance and Costs of Power Plants with Capture and Storage of CO2,” Energy 32, no. 7 (2007): 1163–76, doi:10.1016/j.energy.2006.07.039. 1166. 167 Niall MacDowell et al., “An Overview of CO2 Capture Technologies,” Energy & Environmental Science 3, no. 11 (2010): 1645-1669, doi:10.1039/c004106h. 1646. 168 Ibid.

[58]
A major challenge to overcome in post-combustion CO2 capture is the energy requirement associated with desorption, which imposes a parasitic load on the power plant and increases operating costs.169 The net loss of energy or electricity on power plant performance is an energy penalty imposed on power plant performance. With carbon capture systems, plant efficiencies are reduced by 7 to 10 percentage points.170,171 This means that to produce the same output with carbon capture, more fuel and other resources are needed.172 The energy efficiency penalty is defined as the impact the CO2 capture system has on the energy performance of a reference plant, and is measured by:173
𝐿𝐿𝐷𝐷𝑐𝑐𝑐𝑐𝑝𝑝𝑓𝑓 𝐿𝐿𝑜𝑜𝑜𝑜𝐷𝐷𝑐𝑐𝐷𝐷𝑐𝑐𝐷𝐷𝑐𝑐𝑓𝑓 𝑃𝑃𝑐𝑐𝐷𝐷𝑐𝑐𝑐𝑐𝐶𝐶𝑓𝑓 = 𝑅𝑅𝑐𝑐𝑜𝑜𝑐𝑐𝑐𝑐𝑐𝑐𝐷𝐷𝑐𝑐𝑐𝑐 𝑃𝑃𝑐𝑐𝑐𝑐𝐷𝐷𝐶𝐶 𝐿𝐿𝑜𝑜𝑜𝑜𝐷𝐷𝑐𝑐𝐷𝐷𝑐𝑐𝐷𝐷𝑐𝑐𝑓𝑓 − 𝐶𝐶𝑐𝑐𝑐𝑐𝐶𝐶𝑐𝑐𝑐𝑐𝑐𝑐 𝑃𝑃𝑐𝑐𝑐𝑐𝐷𝐷𝐶𝐶 𝐿𝐿𝑜𝑜𝑜𝑜𝐷𝐷𝑐𝑐𝐷𝐷𝑐𝑐𝐷𝐷𝑐𝑐𝑓𝑓
𝑅𝑅𝑐𝑐𝑜𝑜𝑐𝑐𝑐𝑐𝑐𝑐𝐷𝐷𝑐𝑐𝑐𝑐 𝑃𝑃𝑐𝑐𝑐𝑐𝐷𝐷𝐶𝐶 𝐿𝐿𝑜𝑜𝑜𝑜𝐷𝐷𝑐𝑐𝐷𝐷𝑐𝑐𝐷𝐷𝑐𝑐𝑓𝑓 (1)
Current research and development is focused on optimizing efficiency to lower energy use in chemical solvent performance and improve cost effectiveness.174,175 The most effective measure to improve plant efficiency for post-combustion capture is to reduce the required thermal energy for the regeneration process.176 Other areas of post-combustion capture research focus on solid sorbents (adsorption) or membranes to separate CO2 from other gases. Next generation technologies in post-combustion carbon capture include cryogenic carbon capture™ (CCC), where CO2 is cooled to form dry ice and removed.177 A pilot project by Canadian-based CO2 Solutions for enzyme-enabled post-combustion carbon capture has been successful in reducing emissions from in-situ oil sands operations.
Presently there are two operating commercial post-combustion CO2 capture projects worldwide: the Boundary Dam CCS Project in Saskatchewan (operations began in 2014), and the Petra Nova Carbon Capture Project in Texas, United States
169 Dennis Y C Leung, Giorgio Caramanna, and M. Mercedes Maroto-Valer, “An Overview of Current Status of Carbon Dioxide Capture and Storage Technologies,” Renewable and Sustainable Energy Reviews, 2014, doi:10.1016/j.rser.2014.07.093. 170 IEA, “Energy Technology Perspectives 2012: Pathways to a Clean Energy System” (Paris, 2012), doi:10.1787/energy_tech-2012-en. 275. 171 Leung, Caramanna, and Maroto-Valer, “An Overview of Current Status of Carbon Dioxide Capture and Storage Technologies.” 172 IEA, “Energy Technology Perspectives 2012: Pathways to a Clean Energy System.” 344. 173 Global CCS Institute, “Effects of CO2 Capture Efficiency on Plant Performance,” accessed August 3, 2017, https://hub.globalccsinstitute.com/publications/co2-control-technology-effects-igcc-plant-performance-and-cost/effects-co2-capture-efficiency-plant-performance. 174 Global CCS Institute, “Development Trends in CO2 Capture Technologies,” accessed June 19, 2017, https://hub.globalccsinstitute.com/publications/global-status-ccs-2014/75-development-trends-co2-capture-technologies. 175 Rubin, Davison, and Herzog, “The Cost of CO2 Capture and Storage.” 381. 176 Zhang et al., “Process Simulations of Post-Combustion CO2 Capture for Coal and Natural Gas-Fired Power Plants Using a Polyethyleneimine/silica Adsorbent.” 277. 177 Sustainable Energy Solutions, “Cryogenic Carbon Capture,” accessed June 12, 2017, https://sesinnovation.com/technology/carbon_capture/.

[59]
(operations began in 2017).178 Both projects are a CCS retrofit to an existing coal-fired power plant. The amount of CO2 capture per annum for each project is 1 MT and 1.4 MT respectively. The Boundary Dam project suffered from technological first-generation problems as the world’s first-of-a-kind (FOAK) commercial scale CCS power plant, and construction costs for the power plant and capture reached $1.5 billion CAD, over-budget by $200 million.179 Construction costs for the Petra Nova project were on target at $1 billion USD ($1.3 billion Canadian in 2017). Globally, there are four other commercial large-scale post-combustion CO2 capture projects in development: Netherland’s Rotterdam Capture and Storage Demonstration Project, China’s Sinopec Shengli Power Plant, China’s Resource Power Haifeng Plant demonstration, and South Korea is evaluating locations for CO2 captured from a power plant.180 Each of these projects are coal or biomass power plants with CCS, and they aim to capture approximately 1 million tonnes of CO2 per annum.
A.2 Pre-combustion capture Gasification is an industrial process that converts solid feedstock fuels such as coal, biomass, and refinery wastes into hydrogen and carbon monoxide gases (syngas) to be combusted. Integrated gasification combined cycle (IGCC) plants, and methane or Natural gas combined cycle (NGCC) plants use gasification to generate power. Following gasification, CO2 is captured pre-combustion. The process involves a “water-gas shift” reaction, producing more hydrogen and converting the carbon monoxide to high concentrations of CO2.181 The gases are then separated, where CO2 is absorbed using a solvent, and hydrogen is used as a carbon-free fuel in power production. Like post-combustion capture, pre-combustion capture technologies also impose an energy penalty on power plant performance.
Globally, there are no pre-combustion carbon capture power plants operating at the commercial scale. However, there are three large-scale pre-combustion facilities for power generation that are in construction or early development. The Kemper Project in Mississippi, a new build IGCC power plant and the world’s largest power plant with CCS, was due to start operation in late 2017. The Kemper Project is planning to capture two thirds of its CO2 emissions, or approximately 3.5 million tonnes per annum (MTPA).182 The original budget of the project was estimated to be $2.9 billion USD, however project delays over the past two years have resulted in
178 Global CCS Institute, “Large Scale CCS Projects | Global Carbon Capture and Storage Institute,” Global CCS Institute, 2017, http://www.globalccsinstitute.com/projects/large-scale-ccs-projects. 179 “Carbon Capture and Sequestration Technologies @ MIT,” accessed October 2, 2016, http://sequestration.mit.edu/tools/projects/boundary_dam.html. 180 Global CCS Institute, “Large Scale CCS Projects,” accessed October 4, 2016, https://www.globalccsinstitute.com/projects/large-scale-ccs-projects. 181 Leung, Caramanna, and Maroto-Valer, “An Overview of Current Status of Carbon Dioxide Capture and Storage Technologies.” 429. 182 Richard Van Noorden, “Two Plants to Put ‘clean Coal’ to Test,” Nature 509, no. 7498 (April 29, 2014): 20–20, doi:10.1038/509020a.

[60]
costs of over $7 billion USD and future status of the project is uncertain.183 Additional projects include the UK’s Caledonia Clean Energy IGCC project and China’s Huaneng GreenGen IGCC system, which are planned to begin operation in the early 2020s.184
Besides power generation, there are several other industrial processes that separate CO2 as a “purification step” prior to combustion.185 This includes industrial CO2 separation processes for refineries, natural gas processing (“sweetening” to lower CO2 concentrations and prevent pipeline corrosion), hydrogen, chemical, steel, and fertilizer production. In these industrial operations, high-purity streams of CO2 are usually vented to the atmosphere or sometimes used in other on-site processes.186 Since CO2 is already separated as part of these industrial processes, pre-combustion capture would generally have a low incremental capture cost, with costs remaining for CO2 compression, transport, and storage.187
The world’s first operating commercial scale pre-combustion CCS facility is the Great Plains Synfuels Plant in the United States, which transports CO2 by pipeline to the Weyburn-Midale Carbon Dioxide Project in Saskatchewan. Sequestration started in 2000, and a 95 percent pure CO2 stream is captured for enhanced oil recovery (EOR) operations. The carbon capture project uses industrial separation, and captures 3 million tonnes of CO2 per annum with pre-combustion capture.188 Other by-products include anhydrous ammonia for the agriculture sector, and liquid nitrogen for refrigeration.189 Other Canadian CCS projects that use industrial separation and pre-combustion CCS include Shell’s Quest and Enhance Energy’s Alberta Carbon Trunk Line projects, where both are located in Alberta.
Globally there are fourteen other operating large-scale CCS projects using industrial separation.190 These projects are located in Australia, Brazil, China, Norway, Saudi Arabia, the United Arab Emirates, and the United States. Several other projects are in the development or construction phase. Over half of existing commercial scale CCS projects in operation that use industrial separation are applied to natural gas
183 Power Engineering, “Kemper County Power Plant Cost Surpasses $7 Billion,” Power Engineering, 2017, http://www.power-eng.com/articles/2017/01/kemper-county-power-plant-cost-surpasses-7-billion.html. 184 Global CCS Institute, “Large Scale CCS Projects | Global Carbon Capture and Storage Institute.” 185 Edward S. Rubin et al., “The Outlook for Improved Carbon Capture Technology,” Progress in Energy and Combustion Science, 2012, doi:10.1016/j.pecs.2012.03.003. 633. 186 Ibid. 637-638. 187 Ibid. 638. 188 Global CCS Institute, “Large Scale CCS Projects | Global Carbon Capture and Storage Institute.” 189 Ibid. 190 Global CCS Institute, “Large Scale CCS Projects.”
[61]
processing.191 The largest is the Century gas processing plant in Texas, which captures over 8 MTPA of CO2 that is transported and utilized for EOR.192
A.3 Oxyfuel combustion Oxyfuel combustion systems are considered one of the most promising for capturing CO2 in the power sector, and industrial processes such as cement, lime, and steel production.193,194,195,196 Oxyfuel combustion has also been used in the metallurgical and glass industries where high processing temperatures are required. Recent research is also investigating the potential of carbon capture oxyfuel technology with biomass firing for electricity production.197,198 What sets this technology apart from other capture technologies is that there is no requirement for a CO2 capture unit.199 Instead, an air separator unit (ASU) is needed to produce high purity oxygen for combustion. Additional advantages of this system over other capture technologies include reduced nitrogen and nitrous oxide emissions,200 no required amine solvents, and lower total energy requirements and operating costs.201
The most energy and cost intensive aspect of oxyfuel combustion systems is the upstream process of separating oxygen from air, which results in an energy efficiency loss of up to 7 percent compared to a facility without CCS.202 A cryogenic air separator unit (ASU) produces high purity oxygen that acts as an oxidant to combust a fuel source in a boiler, resulting in a flue gas made of water vapour and
191 Global CCS Institute, “Large Scale CCS Projects | Global Carbon Capture and Storage Institute.” 192 ZeroCO2, “Century Plant — zeroco2,” accessed June 20, 2017, http://www.zeroco2.no/projects/century-plant. 193 Rohan Stanger et al., “Oxyfuel Combustion for CO2 Capture in Power Plants,” International Journal of Greenhouse Gas Control 40 (2015): 55–125, doi:10.1016/j.ijggc.2015.06.010. 55. 194 Frank Zeman, “Oxygen Combustion in Cement Production,” in Energy Procedia, vol. 1, 2009, 187–94, doi:10.1016/j.egypro.2009.01.027. 195 D. A. Granados, F. Chejne, and J. M. Mejía, “Oxy-Fuel Combustion as an Alternative for Increasing Lime Production in Rotary Kilns,” Applied Energy 158 (2015): 107–17, doi:10.1016/j.apenergy.2015.07.075. 196 Nicolas Perrin et al., “Oxycombustion for Carbon Capture on Coal Power Plants and Industrial Processes: Advantages, Innovative Solutions and Key Projects,” in Energy Procedia, vol. 37, 2013, 1389–1404, doi:10.1016/j.egypro.2013.06.015. 197 N. Mac Dowell and M. Fajardy, “On the Potential for BECCS Efficiency Improvement through Heat Recovery from Both Post-Combustion and Oxy-Combustion Facilities,” Faraday Discuss. 0 (2016): 1–10, doi:10.1039/C6FD00051G. 198 Antti Arasto et al., “Feasibility of Significant CO2 Emission Reductions in Thermal Power Plants–comparison of Biomass and CCS,” Energy Procedia 63 (2014): 6745–55, doi:10.1016/j.egypro.2014.11.710. 199 Rubin et al., “The Outlook for Improved Carbon Capture Technology.” 633. 200 Leung, Caramanna, and Maroto-Valer, “An Overview of Current Status of Carbon Dioxide Capture and Storage Technologies.” 429. 201 Mark Bohm et al., “Application of Oxy-Fuel CO2 Capture for in-Situ Bitumen Extraction from Canada’s Oil Sands,” Energy Procedia 4, no. 4 (2011): 958–65, doi:10.1016/j.egypro.2011.01.142. 959. 202 Leung, Caramanna, and Maroto-Valer, “An Overview of Current Status of Carbon Dioxide Capture and Storage Technologies.”

[62]
high CO2 concentrations (typically 80 to 98 percent).203 The CO2 stream separates easily from water vapour, and can be further purified prior to capture. CO2 capture rates in this system are near 100 percent.204 The system also includes a steam turbine to produce electricity, an enhanced oxygen combustion unit, and recirculation of exhaust gas.205
Oxyfuel combustion carbon capture is not yet operating at the commercial scale, although pilot projects and large-scale demonstrations have been successful. Plans for the large-scale Shanxi International Energy Oxyfuel Project in China are in the early development stage.206 The project is a new build that is expected to operate in the 2020s, and aims to capture 2 MTPA of CO2. Other recent large-scale pilot projects include CEMCAP, a European research project that is preparing for large-scale CO2 capture at cement plants using oxyfuel technology207; the CIUDEN capture technology plant, a Spanish research demonstration project that aims to develop oxyfuel combustion technology for coal and gas fired power plants208; the Vattenfall Schwarze Pumpe Project in Germany, using lignite coal as feedstock and oxyfuel combustion and post-combustion capture209; the Callide oxyfuel project in Australia, a retrofit to a coal-fired power unit and two ASUs210; Total’s Lacq project in France, capturing CO2 through an oxyfuel combustion gas boiler and delivers steam for gas production and treatment211; and the NET Power Clean Energy demonstration project in Texas, which is demonstrating the use of supercritical CO2 as a working fluid to drive a combustion turbine. The NET Power Clean Energy project replaces the steam cycle components with Allam Cycle technology, where a lower-cost fluid turbine is driven by CO2 as a working fluid.212
203 Working Group III of the Intergovernmental Panel on Climate Change, IPCC, 2005: IPCC Special Report on Carbon Dioxide Capture and Storage. 122. 204 Ibid. 205 R. J. Basavaraja and S. Jayanti, “Comparative Analysis of Four Gas-Fired, Carbon Capture-Enabled Power Plant Layouts,” Clean Technologies and Environmental Policy 17, no. 8 (2015): 2143–56, doi:10.1007/s10098-015-0936-7. 2154. 206 Global CCS Institute, “Large Scale CCS Projects | Global Carbon Capture and Storage Institute.” 207 European Commission, “CORDIS : CEMCAP Report Summary - CEMCAP (CO2 Capture from Cement Production),” Community Research and Development Information Service, 2016, http://cordis.europa.eu/result/rcn/190404_en.html. 208 Monica Lupion et al., “Lessons Learned from the Public Perception and Engagement Strategy-Experiences in CIUDEN’s CCS Facilities in Spain,” Energy Procedia 37 (2013): 7369–79, doi:10.1016/j.egypro.2013.06.678. 209 Carbon Capture and Sequestration Technologies at MIT, “Schwarze Pumpe Fact Sheet: Carbon Dioxide Capture,” accessed June 12, 2017, http://sequestration.mit.edu/tools/projects/vattenfall_oxyfuel.html. 210 Chris Spero, “Callide Oxyfuel Project - Lessons Learned,” 2014, http://hub.globalccsinstitute.com/sites/default/files/publications/157873/callide-oxyfuel-project-lessons-learned.pdf. 211 J. Monne et al., “Carbon Capture and Storage. The Lacq Pilot” (Paris, 2015), http://hub.globalccsinstitute.com/sites/default/files/publications/194253/carbon-capture-storage-lacq-pilot.pdf. 212 Rodney J. Allam, “NET Power’s CO2 Cycle: The Breakthrough That CCS Needs,” Modern Power Systems, 2013, http://www.modernpowersystems.com/features/featurenet-powers-co2-cycle-the-breakthrough-that-ccs-needs.
[63]
In Canada, several initiatives in oxyfuel combustion CCS research and development projects have been executed. CanmetENERGY’s Oxy-Fuel Combustion Program supports industrial and government collaboration, where current research efforts are focused on improving ASU efficiency and economic competitiveness of gas turbine oxyfuel combustion technologies.213 In addition, energy companies and government organizations have partnered together in evaluating pilot oxyfuel combustion projects for in-situ bitumen in Alberta’s oil sands.214 Research shows that oxyfuel combustion may be the best short-term option for carbon capture used with steam-assisted gravity drainage processes for bitumen extraction.215
A4. Chemical looping combustion Chemical looping combustion (CLC) is considered a second-generation capture technology. CLC is similar to oxyfuel combustion (sometimes it is referred to as “advanced oxyfuel combustion”), but the upstream gas separation process is avoided. Instead, the process is simplified into two steps: oxidation and reduction. In an oxidation reactor, a metal oxide is created and acts as an oxygen carrier material, typically using metals such as iron, nickel, copper, and manganese.216 A fuel source (gaseous, liquid, or solid) reacts with the metal oxide by combustion in a fuel reactor, producing CO2 and water, which is easily separated by condensation.217 The concentration of the CO2 exhaust gas is 99 percent and does not contain impurities. The metal oxide is reduced in a reduction reactor to regenerate the metal, which is reused in the oxidation reactor.218 An advantage for CLC technology is that since the upstream gas separation is avoided, there is a low energy penalty. However, the oxygen carrier particles must be stable to endure repeated reactions.219 Comparative analysis of gas-fired power plants with oxyfuel combustion and CLC carbon capture shows that CLC has a higher overall efficiency.220
213 Canada, “Near-Zero Emissions Oxy-Fuel Combustion,” Natural Resources Canada, 2016, https://www.nrcan.gc.ca/energy/coal/carbon-capture-storage/4307. 214 Bohm et al., “Application of Oxy-Fuel CO2 Capture for in-Situ Bitumen Extraction from Canada’s Oil Sands.” 215 I. Bolea et al., “Techno-Economics of CCS in Oil Sands Thermal Bitumen Extraction: Comparison of CO2 Capture Integration Options,” Energy Procedia 37 (2013): 2754 – 2764, doi:10.1016/j.egypro.2013.06.160. 2756. 216 B. Hassan et al., “Energy and Exergy Analyses of a Power Plant with Carbon Dioxide Capture Using Multistage Chemical Looping Combustion,” Journal of Energy Resources Technology, Transactions of the ASME 139, no. 3 (2017), doi:10.1115/1.4035057. 1. 217 Jing Li et al., “CO2 Capture with Chemical Looping Combustion of Gaseous Fuels: An Overview,” Energy & Fuels, 2017, acs.energyfuels.6b03204, doi:10.1021/acs.energyfuels.6b03204. 3476. 218 Hassan et al., “Energy and Exergy Analyses of a Power Plant with Carbon Dioxide Capture Using Multistage Chemical Looping Combustion.” 2. 219 Ibid. 2. 220 Basavaraja and Jayanti, “Comparative Analysis of Four Gas-Fired, Carbon Capture-Enabled Power Plant Layouts.” 2153-2154.

[64]
CLC systems have high potential to reduce emissions for electricity and hydrogen co-production221, cement production using a calcium looping process222, and can potentially be retrofitted to existing power plants223. To progress to commercial scale, pilot and large demonstration CLC projects are being researched globally. In Europe, the CEMCAP Horizon 2020 project is focused on research for carbon capture in the cement industry using the calcium looping process.224 In the United States, GE is researching CLC for new and existing coal-fired power plants, and has commissioned a large-scale CLC pilot project (3 MW) with a goal to capture CO2 at a cost of less than $25 per tonne.225 CLC has been tested in Alberta at the Christina Lake Thermal Project to capture CO2 emissions created by fossil fuel combustion used for steam generation in extracting bitumen.226
A.5 Emerging technologies Other emerging technologies in early development include direct carbon fuel-cell (DCFC) capture solutions for power plants, where solid carbon is converted into electricity without gasification.227 An output from this process is a nearly pure CO2 stream that can be captured. Fuel cells used for power generation are nearly 90 percent efficient, have small footprints, and provide steady power.228 Challenges remain with high operating temperatures that corrode system parts and bringing the technology to commercial scale.229 Modelling results indicate that molten carbonate fuel cell technology for carbon capture for steam-assisted gravity drainage oil sands facilities “has the potential to be a breakthrough technology” where capture costs and emissions are significantly reduced.230 Exxon Mobil, in partnership with FuelCell Energy, announced in late 2016 a pilot project testing
221 Calin Cristian Cormos, “Evaluation of Iron Based Chemical Looping for Hydrogen and Electricity Co-Production by Gasification Process with Carbon Capture and Storage,” International Journal of Hydrogen Energy 35, no. 6 (2010): 2278–89, doi:10.1016/j.ijhydene.2010.01.033. 222 European Commission, “CORDIS : CEMCAP Report Summary - CEMCAP (CO2 Capture from Cement Production).” 223 Li et al., “CO2 Capture with Chemical Looping Combustion of Gaseous Fuels: An Overview.” 3510. 224 European Commission, “CORDIS : CEMCAP Report Summary - CEMCAP (CO2 Capture from Cement Production).” 225 A. Levasseur, J. Marion, and F. Vitse, “Alstom’s [GE] Chemical Looping Combustion Technology with CO2 Capture for New and Existing Coal-Fired Power Plants (FE0009484),” in 2016 NETL CO2 Capture Technology Meeting (Pittsburgh, PA, 2016), https://www.netl.doe.gov/File Library/Events/2016/c02 cap review/5-Friday/A-Levasseur-GE-Alstom-Chemical-Looping.pdf. 226 S. P. Sit et al., “Cenovus 10 MW CLC Field Pilot,” in Energy Procedia, vol. 37, 2013, 671–76, doi:10.1016/j.egypro.2013.05.155. 227 S. Giddey et al., “A Comprehensive Review of Direct Carbon Fuel Cell Technology,” Progress in Energy and Combustion Science 38, no. 3 (2012): 360–99, doi:10.1016/j.pecs.2012.01.003. 362. 228 Ibid. 363. 229 Ibid. 395. 230 Richard Hill et al., “Application of Molten Carbonate Fuel Cell for CO2 Capture in Thermal in Situ Oil Sands Facilities,” International Journal of Greenhouse Gas Control 41 (2015): 276–84, doi:10.1016/j.ijggc.2015.07.024. 282.

[65]
carbonate fuel cell and carbon capture project at a power plant in Alabama.231 The development of solid oxide fuel cell (SOFC) technology - a type of DCFC - accompanied with combined heat and power (CHP) systems and oxyfuel combustion carbon capture is also shown to be economically efficient.232 Kuramochi et al. (2009) assess that for carbon pricing of approximately $37 per tonne CO2, SOFC-CHP systems with carbon capture are economically competitive for large-scale systems.233
231 Business Wire, “FuelCell Energy and ExxonMobil Announce Location for Fuel Cell Carbon Capture Pilot Plant,” 2016, http://www.businesswire.com/news/home/20161027005404/en/FuelCell-Energy-ExxonMobil-Announce-Location-Fuel-Cell. 232 Takeshi Kuramochi et al., “Techno-Economic Prospects for CO2 Capture from a Solid Oxide Fuel Cell-Combined Heat and Power Plant. Preliminary Results,” in Energy Procedia, vol. 1, 2009, 3843–50, doi:10.1016/j.egypro.2009.02.186. 3849. 233 Note: Units are not clarified in the Kuramochi et al. (2009) paper in terms of year or currency.

[66]
APPENDIX B. Levelized Cost of Electricity Carbon capture has an economic impact on the cost of electricity that should be considered.234 The levelized cost of electricity (LCOE) is a metric that represents the simplified capital and operating cost of a power plant in dollars per kilowatt hour ($/kWh) over the economic lifetime of the facility. The LCOE for a power plant is calculated as:235
LCOE = [(FCF*TCR)+(FOM+VOM)*LCF] / [(CF*8766)*kWnet]
Where TCR = total capital requirement, $;
FCF = fixed charge factor, also known as capital recovery factor, (fraction/yr);
FOM = fixed O&M cost, ($/yr);
VOM = variable O&M cost, ($/yr);
LCF = levelization cost factor that accounts for inflation, default value 1.0;
CF = levelized annual capacity factor (fraction);
8677 = total hours in a year;
kWnet = net power plant output, kW.
Any assumptions made in the variables of the will have a significant impact on the total cost. For economic analysis of carbon capture, the variables in the above equation remain fixed over the facility lifetime to present a levelized cost of electricity.236
234 Working Group III of the Intergovernmental Panel on Climate Change, IPCC, 2005: IPCC Special Report on Carbon Dioxide Capture and Storage. 147. 235 Rubin and Zhai, “The Cost of Carbon Capture and Storage for Natural Gas Combined Cycle Power Plants.” 3078. 236 Working Group III of the Intergovernmental Panel on Climate Change, IPCC, 2005: IPCC Special Report on Carbon Dioxide Capture and Storage. 148.
[67]
APPENDIX C. Cost Estimates of CO2 Avoided This section discusses the cost estimates of CO2 avoided from research conducted by Leeson et al. (2017) in the industrial sector and includes: the cement, petroleum refining, and pulp and paper industries, and high purity sources such as natural gas processing and chemical production.237 For the power sector, cost estimates for the cost of CO2 avoided from Rubin et al. (2015), Hu 35 al. (2017), and Bhave et al. (2017) are included. Tables C-1 and C-2 provides a detailed summary of CO2 avoidance costs for carbon capture of selected industrial processes and power systems, applicable in Alberta. Assumptions on the cost of CO2 transport are also discussed.
C1. Cost estimates for carbon capture in the industrial sector To compare costs, Leeson et al. first converted cost estimates based on the year of publication to USD, and then used the Chemical Engineering Plant Cost Index (CEPCI) process plant index to escalate (inflate) costs to 2013 – chosen as the comparison year in the study. Leeson et al. also projected the cost of CO2 avoided in a model from 2020 to 2050. Future costs were extrapolated from the CEPCI, and modeled to estimate the costs of CCS to 2050 – assuming 80 percent CCS deployment.238 The learning curve factor in the Leeson et al. study is assumed to be a 25 percent cost reduction for every technological generation, which is assumed to be every five years.239
In Leeson et al.’s future scenario forecasting, oxyfuel combustion calcium looping is used for the cement industry, and post-combustion capture is used for the petroleum refining and iron industries. The model results use the mean cost per tonne of CO2 avoided, and show that the cement industry has the highest potential to avoid the most emissions at the lowest cost, at C$2013 29 per tonne of CO2 avoided. By 2050 as technological learning increases, the avoidance cost falls to C$2013 21 per tonne of CO2.240 Due to lack of cost information for technologies in the pulp and paper industry and for high purity CO2 sources, these sectors were excluded by Leeson et al. from modeling future CO2 avoidance costs. Reduced costs in the petroleum refining and iron industries are anticipated if other technologies besides post-combustion capture are used – such as oxyfuel combustion, and learning of technological advances between the industries are shared.241
237 Leeson et al., “A Techno-Economic Analysis and Systematic Review of Carbon Captureand Storage (CCS) Applied to the Iron and Steel, Cement, Oil Refining and Pulp and Paper Industries, as Well as Other High Purity Sources.” 238 Ibid. 78. 239 Ibid. 80. 240 Leeson et al. 2017 COA reported in $US2013/tonne CO2 avoided. In 2013, a yearly average exchange rate of 1.03 was used to convert to 2013 Canadian dollars. 241 Ibid. 82.

[68]
C2. Cost estimates for carbon capture in the power sector Cost estimates for CO2 avoidance in the power generation sector are given in Table C-1 for natural gas-fired power plants and bio-energy with CCS (BECCS). In this analysis, the cost of CO2 avoided of carbon capture for a gas-fired cogeneration power plant (a combined heat and power system) is assumed to be approximately the same as the cost of CO2 avoided of carbon capture for a NGCC power plant, since the same type of post-combustion carbon capture technology is used.
Similar to Leeson et al.’s 2017 review of industrial carbon capture costs, Rubin et al. (2015) also provide a carbon capture cost update, but for new fossil fuel power plants, escalating capital costs using the Power Capital Cost Index (PCCI) and adjusting to 2013 US dollars.242 Costs of CO2 avoided (COA) for a proposed integrated system with NGCC power generation and post-combustion CO2 capture are given by Hu et al. (2017).243 Hu et al. used 2007 plant cost details from the National Energy Technology Laboratory (U.S. Department of Energy) for base case scenarios in their study.
Bioenergy with CCS (BECCS or bio-CCS) shows potential to generate an energy supply with negative carbon emissions and could be a key factor in climate change mitigation by 2050.244 The 2014 IPCC Fifth Assessment Report on the mitigation of climate change asserts that BECCS may play an important role in reducing emissions, but there is limited evidence and uncertainty in large-scale development.245 Biomass production sequesters (captures and stores) atmospheric CO2 by photosynthesis. Biomass fueled energy production releases CO2 during combustion, which can then be captured using the same suite of capture technologies available to the industrial and power sectors. However, there are challenges and concerns - particularly in land use. Biomass supply competes with food production on arable land, increases water demand, and soil nutrients are reduced from ecosystems when biomass is removed.246 Quantifying CO2 sequestration is difficult, as data varies and decisions on whether to include soil carbon sequestration with biomass needs to be stated in the assumptions.
Bhave et al. (2017) assessed eight BECCS technologies over the period 2010 to 2050, with common plant scales of 50 and 250 MWe. 247 A coal-fired power plant
242 Rubin, Davison, and Herzog, “The Cost of CO2 Capture and Storage.” 243 Hu et al., “Thermodynamic Analysis and Techno-Economic Evaluation of an Integrated Natural Gas Combined Cycle (NGCC) Power Plant with Post-Combustion CO2 Capture.” 244 Daniel L. Sanchez et al., “Biomass Enables the Transition to a Carbon-Negative Power System across Western North America,” Nature Climate Change 5, no. February (2015): 3–7, doi:10.1038/nclimate2488. 231. 245 IPCC, Climate Change 2014: Mitigation of Climate Change. 21. 246 Pete Smith et al., “Biophysical and Economic Limits to Negative CO2 Emissions,” Nature Clim. Change 6, no. 1 (2016): 42–50, doi:10.1038/nclimate2870\rhttp://www.nature.com/nclimate/journal/v6/n1/abs/nclimate2870.html#supplementary-information. 247 Bhave et al., “Screening and Techno-Economic Assessment of Biomass-Based Power Generation with CCS Technologies to Meet 2050 CO2 Targets.”

[69]
without CCS was used as the reference case to calculate the cost of avoidance. At the larger 250 MWe scale, BECCS technology type did not influence specific investment costs.248
C3. Cost estimates for carbon transport Transport costs for CO2 pipeline infrastructure are significantly less than capture costs, but also have large ranges and are location specific. For onshore projects, pipelines are used to transport CO2 as a liquid, gas, or supercritical fluid.249 CO2 pipelines are more expensive than natural gas pipelines because they require thicker walls for higher operation pressure.250 Transport costs are generally less for larger pipelines that travel shorter distances, and for transporting CO2 from several sources in a single pipeline rather than multiple individual pipelines. Capital costs for CO2 transport will vary with pipeline design (pipeline length, diameter, operating pressure), terrain and geographic locations, regulation requirements, cost model assumptions, purity of the CO2 stream, the price of steel, and whether booster stations are included to maintain pipeline pressure.251 CO2 pipeline costs are often underestimated in academic literature, because most models use the cost of natural gas pipelines.252
248 Ibid. 485. 249 Knoope, Ramírez, and Faaij, “A State-of-the-Art Review of Techno-Economic Models Predicting the Costs of CO2 Pipeline Transport.” 244. 250 Ibid. 245. 251 Ibid. 242 252 Ibid. 263.

[70]
Table C-1. Summary from Table C-2 of CO2 avoidance costs for carbon capture used in this paper.
Industry Capture type / Technology Study Year
Cost of CO2 avoided (COA), $/tonne,
CAD 2013
Estimated Emissions Captured
(%)
Reference Assumptions
Petroleum Refineries: gasifier
Post-combustion capture with amine solvents - gasifier
2010 42 15% van Straelen et al. (2010), in Leeston et al. (2017)
Lowest gas refinery cost as it processes a concentrated CO2 stream.
Petroleum Refineries: boilers
Post-combustion capture - boilers
2005-2011 101 50% various sources, in Leeston et al. (2017)
Pulp and Paper Amine capture 2012 61 62% McGrail et al. (2012), in Leeston et al. (2017)
Cement Oxy-combustion with calcium looping
2009-2013 41 70% various sources, in Leeston et al. (2017)
Mean cost of CO2 avoided from four studies.
High Purity CO2 streams: Hydrogen Production, Shell Quest
Pre-Combustion (Shell Quest)
2016 43 1 Mt (approx 40%)
CCS Cost Network Workshop IEAGHG (2016), in Leeson et al. (2017)
Cost of CO2 avoided from Leeston et al. (2017).
High Purity CO2 streams: Ammonia, Chemical, NG processing
Approximate average for high purity sources
Various 31 not reported various sources, Leeston et al. (2017)
NGCC Post-combustion capture (MEA-based)
2015; 2017 90 90% Rubin et al. (2015); Hu et al. (2017)
NGCC: enhanced efficiency
Post-combustion capture with new proposed system integration
2017 66 90% Hu et al. (2017) COA based on new integrated stytem with NGCC power generation, where costs are saved by improving the efficiency penalty.
BECCS Energy production combustion
2017 125 not reported Bhave et al. (2017) Plant economic lifetime 30 years, 10% discount rate, 50 and 250 MW scale plant. Study uses eight bio-power technology combinations. Model based.

[71]
Table C-2. CO2 avoidance costs for carbon capture for selected industrial processes and power systems, applicable in Alberta. (Page 1 of 2).
Industry Capture type / Technology
Study Year CO2 Source
Cost of CO2
avoided (COA)
USD 2013 $/tonne
Cost of CO2
avoided (COA) CAD 2013
$/tonne
Emissions Captured
(%) Assumptions Reference
Iron and Steel n/a in Alberta Petroleum Refineries
Post-combustion capture with amine solvents
2010 Gasifier (high purity)
40.70 41.92 15% van Straelen et al. (2010), in Leeson et al. (2017)
Chemical looping 2009 Boiler 49.90 51.40 unknown Melien and Roijen (2009), in Leeson et al. (2017)
Oxyfuel combustion 2005 Boilers/furnaces 65.70 67.67 unknown Melien (2005), in Leeson et al. (2017)
Oxyfuel combustion 2009 Boilers/furnaces 66.50 68.50 unknown DNV (2010), in Leeson et al. (2017) Post-combustion capture 1995 Combined stack 68.20 70.25 50% Farla et al. (1995), in Leeson et al.
(2017) Amine scrubbing of gases
(PCC?) 2005 Stack 68.70 70.76 50% Melien (2005), in Leeson et al.
(2017) Pre-combustion 2010 Heaters/boilers 74.00 -
75.50 76.22 - 77.77
unknown DNV (2010), in Leeson et al. (2017)
MEA capture (PCC) 2011 Combined stack 83.90 86.42 50% Ho et al. (2011), in Leeson et al. (2017)
Post-combustion capture 2009 Heaters/boilers 116.30 - 145.00
119.79 - 149.35
unknown DNV (2010), in Leeson et al. (2017)
Post-combustion capture 2010 Combined stack 121.80 125.45 50% van Straelen et al. (2010), in Leeson et al. (2017)
Post-combustion capture MEAN
Boilers from combined stack, Mean cost avoided
98.00 100.94 50%
Oxyfuel combustion 2009 Fuel catalytic cracking (FCC)
128.40 132.25 unknown DNV (2010), in Leeson et al. (2017)
Post-combustion capture 2009 Fuel catalytic cracking (FCC)
128.40 132.25 unknown DNV (2010), in Leeson et al. (2017)
Post-combustion with ammonia/amine
2009 FCC or CHP 182-250 187.46 - 257.50
unknown Al Juaied and Whitmore (2009), in Leeson et al. (2017)
Note: Emissions from boilers are captured in a combined stack
Pulp and Paper Unknown 2013 unknown 56.40 58.09 75% IEA (2013), in Leeson et al. (2017) Amine capture 2012 Boiler flue gas 59.00 60.77 62% McGrail et al. (2012), in Leeson et
al. (2017) Note: Lack of carbon capture cost data in this industry. Most emissions are from boilers. Cement Oxy-combustion with
calcium looping 2009-2013
Kiln (Mean cost avoided)
39.40 40.58 70% Mean over 4 studies Leeson et al. (2017)
Note: 60% of emissions from calcination (will affect production if these emissions are lowered) and 40% from kiln heat generation. Promising technology for this sector (IEA).

[72]
Industry Capture type / Technology
Study Year CO2 Source
Cost of CO2
avoided (COA)
USD 2013 $/tonne
Cost of CO2
avoided (COA)
CAD 2013 $/tonne
Emissions Captured
(%) Assumptions Reference
High purity sources
Not mentioned 2011 Ammonia (flue gas) 3.90 - 45.30
4.02 - 46.66
not listed *All summarized from 'grey' literature in Leeson et al. (2017)
" " 2005 Hydrogen production
6.00 - 66.00
6.18 - 67.98
" " " "
" " 2011 Liquid Natural Gas production
8.70 8.96 " " " "
" ", gas processing usually pre-combustion
2013 Natural gas processing
10.25 10.56 " " IEA 2013
" " 2013 Ethanol production 12.30 12.67 " " " " " " 2011 Hydrogen
production 14.50 14.94 " " " "
" " 2013 Ethylene oxide production
15.40 15.86 " " " "
" " 2011 Natural gas processing
15.40 15.86 " " " "
" " 2011 Ammonia production
16.60 17.10 " " " "
" " 2008 Natural gas processing
19.00 - 39.00
19.57 - 50.17
" " " "
" " 2012 Hydrogen production
25.00 - 74.00
25.75 - 76.22
" " 76.22 " "
" " 2013 Hydrogen production
35.90 36.977 " " " "
Pre-combustion capture 2016 Hydrogen production (Shell QUEST)
41.60 42.85 " " CCS Cost Network Workshop IEAGHG (2016), in Leeson et al. (2017)
High-purity average Average of approx .$30/ t CO2 avoided
30.00 30.90 " "
Power generation
Post-combustion capture (MEA-based) + NGCC
2017 87.76 (USD 2007 $/t)
91.46 unknown NGCC power plant with 555MW net power generation, plant capacity factor = 0.85. NG price = 0.00689 ($USD/MJ), Amine price = 2249.89 ($USD/t), operating years = 30, t = metric tonne
Hu et al. (2017)
New system integration proposed (PCC + NGCC)
2017 63.66 (USD 2007 $/t)
66.35 unknown " " Hu et al. (2017)
Post-combustion capture at new NGCC power plants
2015 87.00 (USD 2013 $/t)
89.61 90% Assuming current post-combustion capture technology; mean plant capacity factor w/o carbon capture = 0.85; mean plant capacity factor with carbon capture = 0.84; COA using a Rep. Value = Representative value based on the average of values reported in the studies reviewed
Rubin et al. (2015)

[73]
APPENDIX D. The SCC Discount Rate The 3 percent discount rate used by Environment and Climate Change Canada for the social cost of carbon is also used in the United States and is aligned with the social time preference rate set by the Canada's Treasury Board Secretariat.253 An appropriate discount rate, which is the time value of costs and benefits, attempts to balance equity of the current generation with future generations. If a lower discount rate is used, then the present value cost of polluting one tonne of carbon increases. An alternative to a constant discount rate is a declining discount rate (DDR), where the discount rate declines over time. Proponents support a DDR because it captures the uncertainty of future discount rates.254
253 Government of Canada, “Technical Update to Environment Canada’s Social Cost of Carbon Estimates.” 254 K. Arrow et al., “Determining Benefits and Costs for Future Generations,” Science 341, no. 6144 (2013): 349–50, doi:10.1126/science.1235665. 350.

[74]
APPENDIX E. Selected Industrial Facilities in Alberta SECTOR NAME LOCATION TONNES (CO2/YR) Petroleum Refineries Strathcona Refinery – Imperial Oil Edmonton 1,542,591 Edmonton Refinery – Suncor Energy Products Partnership Sherwood Park 1,278,551 Shell Scotford Refinery – Shell Canada Products Fort Saskatchewan 936,572 Lloydminster Refinery – Husky Oil Operations Limited Lloyminister 90,920 REFINERIES TOTAL 3,848,634 Pulp & Paper Hinton pulp - West Fraser Mills Ltd. Hinton 145,325 Peace River Pulp Division - Daishowa-Marubeni International
Ltd-Peace River Pulp M.D. of Northern Lights 131,795
Whitecourt Pulp Divison – Millar Western Forest Products Ltd. Whitecourt 55,637 PULP & PAPER TOTAL 332,757 Cement Exshaw Cement Plant – Lafarge Canada Inc. Exshaw 867,852 Edmonton Plant – Lehigh Hanson Materials Ltd. Edmonton 716,239 CEMENT TOTAL 1,584,091 High purity CO2 streams, ammonia Canadian Fertilizers Limited Medicine Hat 1,785,869 Redwater Fertilizer Operations – Agrium Inc. Sturgeon County (ACTL) 1,179,083 Ft. Saskatchewan Nitrogen Operations – Agrium Inc. Fort Saskatchewan 622,855 Carseland Nitrogen Operations – Agrium Inc. Carseland 569,074 AMMONIA TOTAL 4,156,881 High purity CO2 streams, chemical manufacturing
Western Canada Operations – Dow Chemical Canada ULC Fort Saskatchewan 1,106,442 NOVA Chemicals Corporation (Joffre) – NOVA Chemicals Corporation
Red Deer 2,902,743
Prentiss Chemical Manufacturing Facility – MEGlobal Canada ULC.
Lacombe County 135,350
Fort Saskatchewan EOEG – MEGlobal Canada ULC. Fort Saskatchewan 82,466 Scotford Chemical Plant – Shell Chemicals Canada Limited. Fort Saskatchewan 318,652 Alberta Envirofuels – Keyera Corp Edmonton 300,269 CHEMICAL MANUFACTURING TOTAL 4,845,922 High purity CO2 streams, steam methane reforming for hydrogen production
Scotford Upgrader and Upgrader Cogeneration – Shell Canada Energy Ltd.
Fort Saskatchewan (Shell Quest)
3,248,628
Methanex Medicine Hat Methanol Plant – Methanex Corporation
Medicine Hat 346,640
Edmonton Hydrogen Facility - Air products Canada Edmonton 1,202,118 HYDROGEN PRODUCTION TOTAL 4,797,386
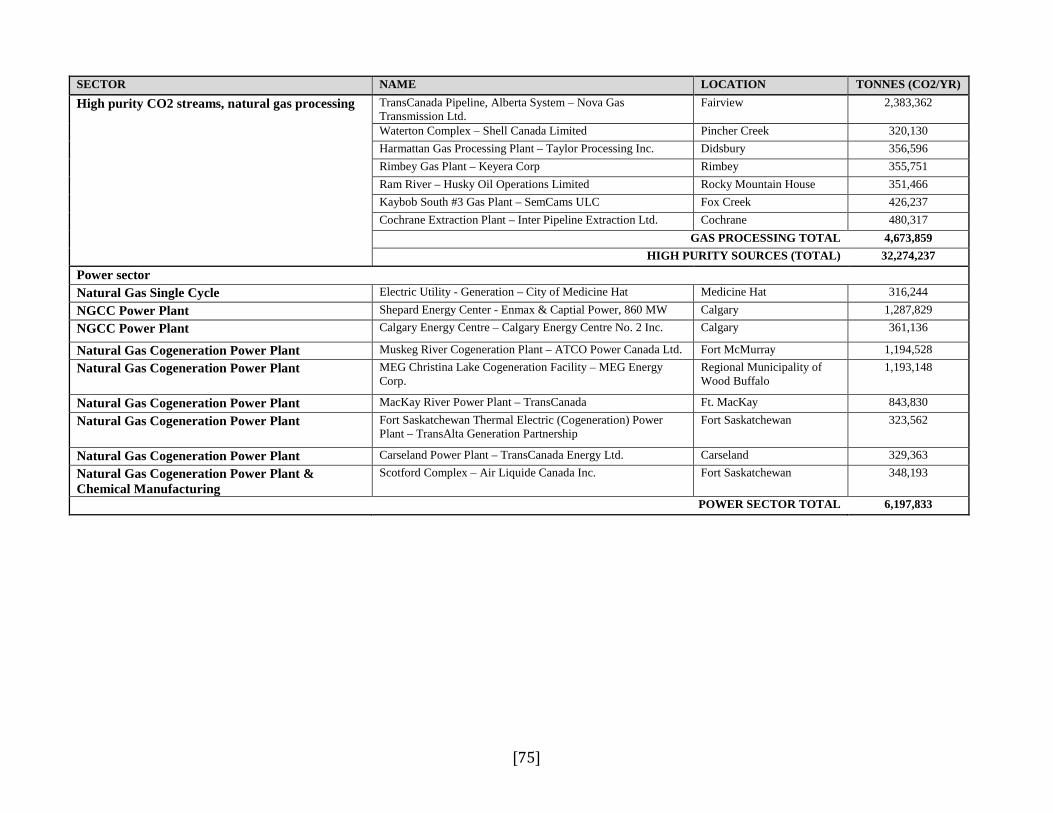
[75]
SECTOR NAME LOCATION TONNES (CO2/YR) High purity CO2 streams, natural gas processing TransCanada Pipeline, Alberta System – Nova Gas
Transmission Ltd. Fairview 2,383,362
Waterton Complex – Shell Canada Limited Pincher Creek 320,130 Harmattan Gas Processing Plant – Taylor Processing Inc. Didsbury 356,596 Rimbey Gas Plant – Keyera Corp Rimbey 355,751 Ram River – Husky Oil Operations Limited Rocky Mountain House 351,466 Kaybob South #3 Gas Plant – SemCams ULC Fox Creek 426,237 Cochrane Extraction Plant – Inter Pipeline Extraction Ltd. Cochrane 480,317 GAS PROCESSING TOTAL 4,673,859 HIGH PURITY SOURCES (TOTAL) 32,274,237 Power sector Natural Gas Single Cycle Electric Utility - Generation – City of Medicine Hat Medicine Hat 316,244 NGCC Power Plant Shepard Energy Center - Enmax & Captial Power, 860 MW Calgary 1,287,829 NGCC Power Plant Calgary Energy Centre – Calgary Energy Centre No. 2 Inc. Calgary 361,136
Natural Gas Cogeneration Power Plant Muskeg River Cogeneration Plant – ATCO Power Canada Ltd. Fort McMurray 1,194,528 Natural Gas Cogeneration Power Plant MEG Christina Lake Cogeneration Facility – MEG Energy
Corp. Regional Municipality of Wood Buffalo
1,193,148
Natural Gas Cogeneration Power Plant MacKay River Power Plant – TransCanada Ft. MacKay 843,830 Natural Gas Cogeneration Power Plant Fort Saskatchewan Thermal Electric (Cogeneration) Power
Plant – TransAlta Generation Partnership Fort Saskatchewan 323,562
Natural Gas Cogeneration Power Plant Carseland Power Plant – TransCanada Energy Ltd. Carseland 329,363 Natural Gas Cogeneration Power Plant & Chemical Manufacturing
Scotford Complex – Air Liquide Canada Inc. Fort Saskatchewan 348,193
POWER SECTOR TOTAL 6,197,833