Carbon Capture and Storage in Developing Countries: a...
134
Carbon Capture and Storage in Developing Countries: a Perspective on Barriers to Deployment Natalia Kulichenko Eleanor Ereira ENERGY AND MINING SECTOR BOARD DISCUSSION PAPER PAPER NO.25 JUNE 2011 The Energy and Mining Sector Board THE WORLD BANK GROUP
Transcript of Carbon Capture and Storage in Developing Countries: a...
Carbon Capture and Storagein Developing Countries:a Perspective on Barriersto Deployment
Natalia KulichenkoEleanor Ereira
E N E R G Y A N D M I N I N G S E C T O R B O A R D D I S C U S S I O N P A P E R
P A P E R N O . 2 5
J U N E 2 0 1 1
The Energy andMining Sector Board
THE WORLD BANKGROUP

E N E R G Y A N D M I N I N G S E C T O R B O A R D D I S C U S S I O N P A P E R
P A P E R N O . 2 5
J U N E 2 0 1 1
Carbon Capture and Storage in Developing Countries: a Perspective on Barriers to DeploymentNatalia KulichenkoEleanor Ereira
The World Bank, Washington, DC
Copyright © 2011 The International Bank for Reconstruction and Development/The World Bank. All rights reserved
The Energy andMining Sector Board
THE WORLD BANKGROUP
©2011 The International Bank for Reconstruction and Development / The World Bank
1818 H Street NW Washington DC 20433 Telephone: (202) 473-1000 Internet: www.worldbank.org E-mail: [email protected]
All rights reserved
This volume is a product of the staff of the International Bank for Reconstruction and Development / The World Bank. The findings, interpretations, and conclusions expressed in this volume do not necessarily reflect the views of the Executive Directors of the World Bank or the governments they represent. The World Bank does not guarantee the accuracy of the data included in this work. The boundaries, colors, denominations, and other information shown on any map in this work do not imply any judgment on the part of the World Bank concerning the legal status of any territory or the endorsement or acceptance of such boundaries.
Rights and Permissions
The material in this publication is copyrighted. Copying and/or transmitting portions or all of this work without permission may be a violation of applicable law. The International Bank for Reconstruction and Development / The World Bank encourages dissemination of its work and will normally grant permission to reproduce portions of the work promptly. For permission to photocopy or reprint any part of this work, please send a request with complete information to the Copyright Clearance Center Inc., 222 Rosewood Drive, Danvers, MA 01923, USA; telephone: (978) 750-8400; fax: (978) 750-4470; Internet: www.copyright.com.
All other queries on rights and licenses, including subsidiary rights, should be addressed to the Office of the Publisher, The World Bank, 1818 H Street NW, Washington, DC 20433, USA; fax: (202) 522-2422; e-mail: [email protected].
The World Bank Country Office Reports disseminate the findings of work in progress to encourage the exchange of ideas about development issues, especially in national languages.
iii
CONTENTS
ACRONYMS AND ABBREVIATIONS ...............................................................................................................vii
UNITS OF MEASURE .......................................................................................................................................vii
FOREWORD .................................................................................................................................................... viii
ACKNOWLEDGMENTS..................................................................................................................................... x
EXECUTIVE SUMMARY ...................................................................................................................................xii
1. INTRODUCTION .........................................................................................................................................1
2. TECHNOLOGY OVERVIEW AND STATUS OF CCS DEVELOPMENT ...........................................................3CCS Technology ����������������������������������������������������������������������������������������������������������������������������������������3
Capture ................................................................................................................................................3Transport ...............................................................................................................................................4Injection ................................................................................................................................................4Monitoring ............................................................................................................................................5Current Status of Technology ..................................................................................................................5
Economics �������������������������������������������������������������������������������������������������������������������������������������������������6Enhanced Oil Recovery ..........................................................................................................................7
3. TECHNO-ECONOMIC ASSESSMENT OF CARBON CAPTURE AND STORAGE DEPLOYMENT IN THE POWER SECTOR IN THE SOUTHERN AFRICAN AND BALKAN REGIONS ..................................9Overview of Results ......................................................................................................................................9Methodology ..............................................................................................................................................12Southern African Region .............................................................................................................................13
Scenarios Modeled ..............................................................................................................................13Modeling Results for Southern Africa ....................................................................................................14Conclusions for the Southern African Region .........................................................................................18
The Balkan Region ......................................................................................................................................18Scenarios Modeled ..............................................................................................................................19Modeling Results for the Balkan Region ................................................................................................19Conclusions for the Balkan Region .......................................................................................................22
4. ADDRESSING THE LEGAL AND REGULATORY BARRIERS IN DEVELOPING COUNTRIES ....................25Key International and Multilateral Legal Instruments Relevant to CCS Projects ...........................................25
UNFCCC and the Kyoto Protocol ..........................................................................................................25United Nations Convention on the Law of the Sea, 1982 ......................................................................27Convention on the Prevention of Marine Pollution by Dumping of Wastes and
Other Matter 1972 (London Convention) ..........................................................................................27Basel Convention on the Control of Trans-Boundary Movements of Hazardous Wastes
and Their Disposal, 1989 (Basel Convention) ...................................................................................27Review of Regional and National Legal Regimes Applicable to CCS Activities in the Southern African Region ...................................................................................................................27
Regional Framework ............................................................................................................................28National Frameworks...........................................................................................................................28
Review of Regional and National Legal Regimes Applicable to CCS Activities in the Balkan Region ...........33Regional Framework—European Union CCS Directive ...........................................................................34National Frameworks...........................................................................................................................34
5. THE ROLE OF CLIMATE FINANCE SOURCES IN ACCELERATING CARBON CAPTURE AND STORAGE DEMONSTRATION AND DEPLOYMENT IN DEVELOPING COUNTRIES ................................43Mapping Climate Finance to a Deployment Pathway .................................................................................43
Current Technology Status and Future Outlook for CCS in Developing Countries: A Reading of the IEA ETP Blue Map Scenario ........................................................................................................45
The Funding Needs to Deploy CCS in Developing Countries and Current Level of Support .....................46Combining Climate Finance Instruments for Near-Term Support up to 2020...........................................47
iv
Longer-term support for CCS demonstration through climate finance (beyond 2020) ..............................49Challenges for CCS Projects in Developing Countries to Access Carbon Finance .......................................49
Key Policy Issues Defining CCS Attractiveness for Climate Finance..........................................................49Other Policy and Methodology Factors Affecting the Level of Support for CCS from Climate Finance .......52Potential In-Country Limitations for CCS Deployment in Developing Countries .......................................53
6. PROJECT FINANCE FOR POWER PLANTS WITH CARBON CAPTURE AND STORAGE IN DEVELOPING COUNTRIES .................................................................................................55Key Findings ...............................................................................................................................................55Methodology ..............................................................................................................................................55Description of the Model ............................................................................................................................59Assumptions ...............................................................................................................................................59
Financing Assumptions ........................................................................................................................59Technology Assumptions ......................................................................................................................59Scenarios ............................................................................................................................................61
Results ����������������������������������������������������������������������������������������������������������������������������������������������������61Impact of Coal Price ............................................................................................................................62Impact of CO2 Price .............................................................................................................................63Impact of Enhanced Hydrocarbon Recovery ..........................................................................................63Impact of Different Financial Structures .................................................................................................63Impact of Concessional Finance ...........................................................................................................64Required Level of Concessional Finance for Break-Even LCOE ...............................................................64
APPENDIX A: INTERNATIONAL ORGANIZATIONS INVOLVED IN CCS WORK .......................................68
APPENDIX B: TECHNO-ECONOMIC ASSESSMENT OF CCS DEPLOYMENT IN THE POWER SECTOR IN SOUTHERN AFRICA AND THE BALKANS .....................................69
The Model ..................................................................................................................................................69Modeling CCS Technology ...................................................................................................................69Storage Options ..................................................................................................................................69
Assumptions in the Model for Southern Africa ............................................................................................69Scenario Assumptions ..........................................................................................................................74
Assumptions in the Model for the Balkan Region........................................................................................74Scenario Assumptions ..........................................................................................................................78
APPENDIX C: ASSESSMENT OF LEGAL AND REGULATORY FRAMEWORKS APPLICABLE TO POTENTIAL CCS DEPLOYMENT IN SOUTHERN AFRICA AND THE BALKANS ..............81
Key Findings and Recommendations ..........................................................................................................82Key Findings and Recommendations at the Domestic Level—Southern African Region ...............................82Key Findings and Recommendations at the Domestic Level—the Balkan Region ........................................86
APPENDIX D: THE ROLE OF CLIMATE FINANCE SOURCES IN ACCELERATING CARBON CAPTURE AND STORAGE DEMONSTRATION AND DEPLOYMENT IN DEVELOPING COUNTRIES ...............................................................................................93
APPENDIX E: PROJECT FINANCE STRUCTURES AND THEIR IMPACTS ON THE LEVELIZED COST OF ELECTRICITY FOR POWER PLANTS WITH CCS ............................99
Technology Assumptions .............................................................................................................................99Additional Results .....................................................................................................................................102
BIBLIOGRAPHY ...........................................................................................................................................103
BOXESBox 4�1: Key Findings and Recommendations ................................................................................................... 26Box 5�1: Summary of Findings and Conclusions ................................................................................................ 44Box 6�1: LCOE Structure ................................................................................................................................. 58Box D�1: Metrics Used to Describe CCS Deployment in This Report .................................................................... 95
v
FIGURESFigure 2�1: Diagram of a Power Plant with CCS with Offshore Storage and Enhanced Oil Recovery .................... 3Figure 2�2: Comparison of Studies of LCOE Increase and Net Efficiency Decrease
for Post-Combustion Power Plants with CCS .................................................................................... 7Figure 3�1: Electricity Generation for Southern African Region—Reference Scenario .......................................... 14Figure 3�2: Electricity Generation for Southern African Region—Baseline Scenario ............................................ 14Figure 3�3: Electricity Generation Portfolio for Southern African Region—US$100/Ton CO2 Price Scenario......... 15Figure 3�4: Cumulative CO2 Storage for Southern African Region—US$100/Ton CO2 Scenario ........................ 16Figure 3�5: Summary of Results for Southern African Region, 2030 ................................................................. 17Figure 3�6: Comparison of Average Generation Costs across Scenarios for the Southern African Region ............ 17Figure 3�7: Comparison of Annual CO2 Emissions across Scenarios for the Southern African Region ................. 18Figure 3�8: Electricity Generation for the Balkan Region—Reference Scenario .................................................. 19Figure 3�9: CO2 Emissions for the Balkan Region—Reference Scenario............................................................ 19Figure 3�10: Share of CCS in Coal-Based Power Generation in the Balkan Region—Reference Scenario
with EOR/ECBM benefits ............................................................................................................. 20Figure 3�11: Share of CCS-Based Generation in the Balkan Region—US$100/Ton CO2 Price Scenario ............... 21Figure 3�12: CO2 Stored in the Balkan Region—US$100/Ton CO2 Price Scenario ............................................. 21Figure 3�13: CO2 Emissions for the Balkan Region—US$100/Ton CO2 Price Scenario ....................................... 21Figure 3�14: Comparison of Average Generation Costs across Scenarios for the Balkan Region .......................... 23Figure 3�15: Comparison of Total CO2 Emissions across Scenarios for the Balkan Region ................................... 23Figure 5�1: Marginal Abatement Cost Curves for CCS in 2020 by Sector and Region ....................................... 45Figure 5�2: Marginal Abatement Cost Curves for CCS in 2030 by Sector and Region ....................................... 45Figure 6�1: LCOE for Reference Plants without CCS and Plants with CCS for the Five Technologies Examined .... 61Figure 6�2: LCOE for Full Capture Coal Plants with CCS with Different Coal Prices .......................................... 62Figure 6�3: Percentage Increase in LCOE from Reference Plant to Corresponding Plant with
Full Capture CCS for Different Coal Prices ................................................................................... 62Figure 6�4: Percentage Increase in LCOE from Reference Plant to Plant with CCS for Different CO2 Prices ......... 63Figure 6�5: Percentage Increase in LCOE for a Reference Plant without CCS to a Plant with CCS and
Enhanced Hydrocarbon Recovery ................................................................................................. 63Figure 6�6: LCOE Variations with Different Financial Structures ........................................................................ 64Figure 6�7: LCOE with Different Levels of Concessional Financing for IGCC plant ............................................ 64Figure 6�8: Concessional Financing Required to Set LCOE for Plant with Full Capture Equal to
Reference Plant, for Financing Structure Case 1 ............................................................................ 65Figure E�1: Percentage Change in LCOE from Reference Plant without CCS to Plant with CCS with
Enhanced Hydrocarbon Recovery and CO2 Price ........................................................................ 102
TABLESTable 2�1: Active Large-Scale Integrated CCS Projects ........................................................................................ 6Table 3�1: Summary of Findings ...................................................................................................................... 10Table 3�2: Summary of Installed Capacity in 2030 for the Southern African Region ............................................. 16Table 3�3: Summary of Installed Capacity in 2030 for the Balkan Region ........................................................... 22Table 6�1: Summary of Findings and Conclusions ............................................................................................. 56Table 6�2: Terms of Financing Instruments and Resulting Blended Debt Interest Rates ........................................... 60Table 6�3: Blended Debt Interest Rate for Different Levels of Concessional Financing ........................................... 64Table B�1: References Used to Develop CO2 Storage Estimates in the Model ...................................................... 70Table B�2: Fuel Price Assumptions for Southern African Region .......................................................................... 71Table B�3: Generic Energy Technology Options Available in the Region and Associated Model
Input Parameters for the Southern African Region .............................................................................. 71Table B�4: South Africa DOE 2011 IRP “Revised Balance” Expansion Plan ......................................................... 72Table B�5: CO2 Storage Options, Volumes, and Costs for Southern Africa .......................................................... 73Table B�6: CO2 Transport Options for the Southern African Region .................................................................... 73Table B�7: Comparison of Results across Scenarios for Southern African Region .................................................. 74Table B�8: Fuel Prices Used in Simulation for the Balkan Region ........................................................................ 75Table B�9: Generic Energy Technology Options Available in the Region and Associated Model
Input Parameters for the Balkan Region ............................................................................................ 76
vi
Table B�10: CO2 Storage Options, Volumes, and Costs for Balkan Region ................................................................78Table B�11: Descriptions of CO2 Price Scenarios in the Balkan Region ......................................................................79Table B�12: Comparison of Results across Scenarios for the Balkan Region ...............................................................80Table C�1: Summary of Legal Obligations of the Reviewed Countries under Relevant International Conventions ..... 81Table C�2: Summary of the EU CCS Directive ................................................................................................... 81Table C�3: Key Findings for Botswana, Mozambique, and South Africa ............................................................... 82Table C�4: Key Findings for Bosnia and Herzegovina, Kosovo, and Serbia .......................................................... 86Table D�1: Summary of Near-Term Demonstration Challenges for CCS ............................................................... 93Table D�2: Status of CCS in Developing Countries: Policy Initiatives, Project Implementation,
and Other Enabling Activities, Select Examples ................................................................................. 94Table D�3: Main Components for Good Practice for CCS Project Design and Operation ..................................... 96Table D�4: Focus Areas for CCS Capacity Building Efforts in Developing Countries ............................................. 98Table E�1: Financial Assumptions Used in LCOE Model .................................................................................... 99Table E�2: Cost and Technical Assumptions for PC Technologies in Model .......................................................... 99Table E�3: Cost and Technical Assumptions for IGCC Technologies in Model ................................................... 100Table E�4: Cost and Technical Assumptions for Oxy-fuel Technologies in Model ................................................ 100Table E�5: Explanation of Varied Parameters and Justifications ......................................................................... 101Table E�6: Oil and Methane Recovery Rates Assumed for EOR/ECBM .............................................................. 101Table E�7: Assumed Revenue Streams for EOR and ECBM Recovery................................................................. 102
vii
ACRONYMS AND ABBREVIATIONS
ADB Asian Development BankAPA Atmospheric Pollution (Prevention) Act
(Botswana)BECCS Bio-energy combined with carbon capture
and storageCCGT Combined cycle gas turbineCCS Carbon capture and storageCDM Clean Development MechanismCO2 Carbon dioxideCOACH Co-operation Action within CCS China-EUCOP Conference of PartiesCSLF Carbon Sequestration Leadership ForumDOE Department of EnergyEBRD European Bank for Reconstruction and
DevelopmentECBM Enhanced coal-bed methaneEEZ Exclusive economic zoneEIA Environmental impact assessmentEIHP Energy Institute Hrvoje Požar (Croatia)EOR Enhanced oil recoveryERC Energy Research Centre (South Africa)ETP Energy Technology PerspectivesETS Emission trading schemeEU European UnionGHG Greenhouse gasesHW Hazardous wasteIEA International Energy AgencyIEAGHG IEA Greenhouse Gas R&D ProgrammeIGCC Integrated gasification combined cycleIPCC Intergovernmental Panel on Climate
ChangeIRP Integrated Resource PlanLCOE Levelized cost of electricityLNG Liquefied natural gasMARKAL MARKet ALlocation modelMDB Multilateral development bankMESSAGE Model for Energy Supply Strategy
Alternatives and Their General Environmental Impact
MICOA Ministry for Coordination for Environmental Action (Mozambique)
MMA Mines and Minerals Act (Botswana)MOP Meeting of the partiesMRV Measuring, reporting, and verificationNEMA National Environmental Management Act
(South Africa)NETL National Energy Technology LaboratoryNWA National Water Act (South Africa)
NZEC Near-Zero Emissions CoalO&M Operations and maintenanceOECD Organization for Economic Co-operation
and DevelopmentOxy Oxy-fuelPC Pulverized coalR&D Research and developmentREQSEE Regulations on Environmental Quality
Standards and Effluent Emissions (Mozambique)
RWM Regulation on Waste Management (Mozambique)
SADC Southern African Development CommunitySANS South African National StandardsSAPP Southern African Power PoolSBSTA Subsidiary Body for Scientific and
Technological AdviceSEA Strategic Environmental Impact AssessmentTIMES The Integrated MARKAL/EFOM SystemUNCLOS United Nations Convention on the Law of
the SeaUNFCCC United Nations Framework Convention on
Climate ChangeVITO Flemish Institute for Technological
Research (Belgium)UK United KingdomWB World BankWB CCS TF World Bank Carbon Capture and Storage
Trust FundWBG World Bank GroupWRI World Resources InstituteZEP EU Zero Emissions Platform
UNITS OF MEASURE
bbl BarrelGJ GigajoulekW KilowattkWh Kilowatt hourm3 Cubic metermcf Million cubic feetmill/kWh Tenth of a U.S. cent per kWhMMBtu Million British thermal unitsMt MegatonsMtCO2-e Megatons of CO2 equivalentMWh Megawatt-hourPpm Parts per milliont Metric TontCO2 Metric Ton CO2
viii
FOREWORD
Many scientists and analysts identify carbon capture and storage (CCS) technologies as potentially capable of making a significant contribution to meeting global greenhouse gas (GHG) mitigation objectives. CCS technology could provide a technological bridge for achieving near to midterm GHG emission reduction goals. Integrated CCS technology is still under development and has noteworthy challenges, which would be possible to overcome through the implementation of large-scale demonstration projects. Several governments, noticeably among industrialized countries, are currently undertaking efforts aimed at advancing the deployment of CCS technologies in the industrial and power generation sectors. However, before the technology can be deployed in industries in developing countries and countries in transition, substantial efforts should be carried out to exchange knowledge to understand all aspects of CCS to reduce investor risk, and help design policies to mitigate economic impacts, including increases in electricity prices and financing mechanisms to facilitate investment in the technology use.
The World Bank Group (WBG) has been engaged in providing assistance to its partner countries on carbon capture capacity building since the establishment of the World Bank Multi-Donor CCS Trust Fund (WB CCS TF) in December 2009. The Government of Norway and the Global Carbon Capture and Storage Institute are the two donors of the WB CCS TF at present. The objectives of the WB CCS TF are to support strengthening capacity and knowledge sharing, to create opportunities for WBG partner countries to explore CCS potential, and to facilitate the inclusion of CCS options into low-carbon growth strategies and policies developed by national institutions.
In order to assist our partner countries better, there is a need to start analyzing various numerous challenges facing CCS within the economic and legal context of developing countries and countries in transition. This report is the first effort of the WBG to contribute to a deeper understanding of (a) the integration of power generation and CCS technologies, as well as their costs; (b) regulatory barriers to the deployment of CCS; and (c) global financing requirements for CCS and applicable project finance structures involving instruments of multilateral development institutions.

ix
We expect that this report will provide insights for policy makers, stakeholders, private financiers, and donors in meeting the challenges of the deployment of climate change mitigation technologies and CCS in particular.
Lucio Monari Sector Manager, Sustainable Energy Department
x
ACKNOWLEDGMENTS
The broad scope of this report drew extensively on the expertise of many individuals with project and analytical experience in the field of carbon capture and storage (CCS). Natalia Kulichenko (Task Team Leader) and Eleanor Ereira led the preparation of this report under the guidance of Lucio Monari, Sector Manager of the Sustainable Energy Unit, World Bank (WB). Charles Di Leva, Sachiko Morita, and Yuan Tao (WB International and Environmental Law Unit, Legal Department) reviewed related legal documents and prepared Chapter 4. Alexandrina Platonova-Oquab (Carbon Finance Unit, WB Environmental Department) and Philippe Ambrosi (WB Environment Department) led the preparation of Chapter 5 on the applicability of climate finance for CCS projects. Concepcion Aisa Otin, Fatima Revuelta, and Ricardo Antonio Tejada (WB Treasury Department) provided support for model development in Chapter 6 on project finance for CCS.
This report also benefited from advice, suggestions, and corrections on the numerous technical, financial, economic, and regulatory issues involved in the development and deployment of CCS. The authors would like to express their gratitude to the following colleagues inside and outside the World Bank Group: Alex Huurdeman (WB Sustainable Energy Department), Supriya Kulkarni (WB consultant), and Stratos Tavoulareas (WB consultant); Jeffrey James at Tenaska Energy; Jon Kelafant at Advanced Resources International; Steve Melzer at Melzer Consulting, Andy Paterson at CCS Alliance, Pamela Tomski at EnTech Strategies LLC, Gøril Tjetland at Bellona Foundation; and Scott Smouse and John Wimer at the National Energy Technology Laboratory, U.S. Department of Energy.
Several sections are based on the work of external consultants. Jan Duerinck, Helga Ferket and Arnoud Lust of the Flemish Institute for Technological Research (VITO, Belgium) in cooperation with Mario Tot and Damir Pešut of the Energy Institute Hrvoje Požar, EIHP (Croatia), and Alison Hughes, Catherine Fedorski, Bruno Merven, and Ajay Trikam of the Energy Research Centre (ERC), University of Cape Town (South Africa), contributed to the preparation of Chapter 3. Yvonne Chilume of Chilume and Company (Botswana), Andrew Gilder of IMBEWU (South Africa), Samuel Levy and Antonio Bungallah of Sal and Caldeira Advogados (Mozambique), and Gretta Goldenman and Caroline Nixon of Milieu Ltd (Belgium) provided

xi
inputs for the preparation of Chapter 4. Paul Zakkour and Greg Cook of Carbon Counts (UK), and Anthea Carter, Charlotte Streck, and Thiago Chagas of Climate Focus (UK) supported the preparation of Chapter 5.
The financial support by the World Bank Carbon Capture and Storage Capacity Building Trust Fund (WB CCS TF) is gratefully acknowledged. The WB CCS TF is a multi-donor trust fund supported by the Government of Norway and the Global CCS Institute, with the objective of providing CCS capacity building support to developing countries.

xii
EXECUTIVE SUMMARY
Carbon capture and storage (CCS) could have significant impact as a carbon mitigation technology in greenhouse gas– (GHG-) emitting industries. Given the nascence of CCS technology, with only eight large-scale integrated projects in the world (Global CCS Institute 2010), significant challenges still must be overcome for large-scale deployment, such as addressing technical issues of integration and scale-up, legal and regulatory requirements to reduce investor risk, policies to create market drivers and mitigate economic impacts, including increases in electricity prices, and financing mechanisms to facilitate investment in the technology. This report does not provide prescriptive solutions to overcome these barriers, since action must be taken on a country-by-country basis, taking account of different circumstances and national policies. Individual governments should decide their priorities on climate change mitigation and adopt appropriate measures accordingly. The analyses presented in this report may take on added relevance, depending on the future direction of international climate negotiations and domestic legal and policy measures, and how they serve to encourage carbon sequestration. Both international and domestic actions can further incentivize the deployment of CCS and its inclusion in project development. Incentives to promote CCS include adopting climate change policies that could provide revenues for CCS projects, but it is likely that a combination of domestic and international mechanisms will be required, alongside carbon revenues, to kick-start CCS project development and reduce investor risk in developing countries in particular.
This report assesses some of the most important barriers facing CCS deployment within the context of developing and transition economies. The selection of the case studies is based on several criteria, including the level of reliance on fossil fuels for power generation and the level of interconnection of electricity networks. The case studies selected for this analysis are the Balkans and Southern African regions. Many countries within the Balkan region are considered transition economies, a status recognized as different from middle-income and low-income developing countries. However, for the purposes of this report, countries within both regions are referred to as developing countries.
xiii
This comparison provides an initial cost estimate of that policy to society. For example, imposing a CCS target on power plants through the construction of three 500 MW coal plants with CCS in the Balkans generates cumulative savings of 37 Mton of CO2 by 2030, and increases total system costs by 1.5 percent compared to the Reference Scenario.
The modeled storage capacities are based on available data for each region, and constraints are incorporated into the model to reflect these capacities. The costs of CCS deployment in the model take account of the proximity to the storage site, and the uncertainty over storage capacity estimates for any given reservoir, such that where there is greater uncertainty over storage capacity, storage costs are modeled as higher.
Under the South African Department of Energy’s Integrated Resource Plan (IRP), which includes a limit on CO2 emissions of 275 Mton CO2/year, CCS in combined cycle gas turbines (CCGTs) could be economically competitive, making up 2 percent of the share in electricity generation by 2030.
Combining CCS with enhanced hydrocarbon recovery, such as enhanced oil recovery (EOR), and assuming associated revenues of US$40/ton CO2 from injections in oil fields, could make CCS technology in the power sector economically competitive in Albania and Croatia, as well as in South Africa, without additional policies.
In the Southern African region, a carbon price of US$50/ton CO2 could make capturing and transporting CO2 for storage from South Africa to depleted oil and gas fields in Mozambique economically feasible. At a CO2 price of US$100/ton, storage in Botswana and Namibia could also be utilized. In the Balkans, CCS would not be economically competitive at CO2 prices of US$25/ton. However, if nuclear power, as an energy technology option is excluded from the modeling scenario, and with a CO2 price of US$50/ton, constructing coal plants with CCS in Kosovo could be economical, since this area has the lowest costs for coal production within the region. At carbon prices of US$100/ton CO2, both building new plants and retrofitting existing plants with
Against this background of numerous challenges facing CCS, and assuming there is an ambition to reduce GHG emissions, this report (a) assesses the economic and environmental (GHG) impacts of potential CCS deployment in the power sector in the Balkan and Southern African regions using a techno-economic model; (b) analyzes legal and regulatory frameworks that could be applicable to potential CCS deployment in these regions; (c) assesses the role of climate finance to support prospective investment needs for CCS projects in developing countries; and (d) examines potential structures for financing power plants equipped with CCS and the impacts of CCS on the electricity rates through a levelized cost of electricity (LCOE) model.
Potential CCS Deployment in the Power Sector in Southern Africa and Balkans
The report presents the results of a techno-economic modeling exercise to investigate the impacts of a number of policies on CCS deployment in the power sector in the Balkan and Southern African regions.1 The analysis examines the effects of such policies on energy technology portfolios in the two regions, including the level of CCS deployment, the average generation costs, the CO2 emission reductions, and the costs of the policy. Policies considered in the analysis include the introduction of a carbon price (introduced into the model incrementally at the following three levels: US$25/ton CO2, US$50/ton CO2, and US$100/ton CO2) the availability of enhanced hydrocarbon recovery, and technology specific deployment targets. However, it should be noted that other measures that are not included in the model, but discussed in other sections of the report, could promote the development of CCS, such as government supporting policies, as seen in the United States, United Kingdom, European Union and Australia.
For any policy, such as the imposition of CCS deployment targets or a carbon price, the resulting total power system cost is compared to that under the Reference Scenario (where no policy is applied and capacity additions are made purely on the least-cost basis, where these costs are based on local data on energy technologies in Southern Africa or the Balkans).
1 For the purposes of this study, the Balkan region refers to the following countries, also often classified as South Eastern Europe (SEE): the Federation of Bosnia and Herzegovina, and the Republics of Albania, Croatia, Kosovo, Macedonia, Montenegro, and Serbia. Also for the purposes of this study, the Southern African region includes the Republics of Botswana, Mozambique, Namibia, and South Africa.
xiv
Assessment of Legal and Regulatory Frameworks Applicable to Potential CCS Deployment in Southern Africa and the Balkans
The report presents the results of an assessment of the existing legal frameworks and their potential applicability to CCS technology in the Southern African and Balkan region with the objective of identifying challenges to the development of cross-boundary and national CCS projects. The assessment involves an examination of the existing multilateral, bilateral, and national regulatory and legal frameworks, and suggests ways to bridge gaps in the regulations that should be addressed, should CCS technology be adopted in these regions.
None of the three countries examined in the Southern African region has adopted a CCS-specific legal instrument. However, all three countries appear to have the basic elements that touch on certain aspects of the relevant legal issues. The three countries examined in the Balkan region are candidate countries to European Union membership and, as such, at some point in the future will need to take steps to harmonize with Directive 2009/31/EC (The CCS Directive). At this stage, none of the three countries has transposed the directive into national laws.
There are grounds to recommend a platform for countries in the Southern African and the Balkan regions to discuss and agree on multilateral and regional treaties for important CCS-related issues, such as compliance, enforcement, and dispute resolution mechanisms, in case these countries decide to move towards using CCS technology in the future.
Multilateral and regional agreements on potential cross-boundary movement of CO2 for disposal, addressing the propriety rights over various segments of cross-boundary transportation, are needed so that operations can be conducted based on an agreement among the countries concerned.
At the point where CCS is poised to reach an operational level, several issues should be taken into consideration and addressed by regional and international regulatory frameworks for CCS activities, including enforcing robust criteria for selection of CO2 storage sites, stringent monitoring plans, frameworks for risk and safety assessments, assumption and allocation of liability, and a means of redress for those affected by release of stored CO2, among others.
CCS could be economically justified across the Balkan region, making up 70 percent of the electricity portfolio by 2030.
While carbon prices of US$100/ton can result in a significant increase in CCS deployment in the Balkans, such a result would not be observed in the Southern African region. At a CO2 price of US$100/ton, the share of electricity generation from CCS equipped power plants could reach 15 percent by 2030 in Southern Africa, compared to 70 percent in the Balkans. This is because coal plants in the Southern Africa region employ dry-cooling technology, and, therefore, have lower efficiencies. The addition of CCS equipment results in an energy penalty since the capture unit requires incremental power supply. Thus, based on the modeled results, carbon prices higher than US$100/ton CO2 would be necessary to show that CCS plants are competitive against non CCS plants in Southern Africa at the same scale as it could be projected in the Balkan region.
In both Southern Africa and the Balkans, the higher the CO2 price, the higher the average generation costs. This is because imposing a CO2 price in the model requires emitting power plants to buy permits at that price for every ton of CO2 released into the atmosphere. Average generation costs increase because of the additional costs of buying these permits, or from switching away from cheaper electricity sources, such as coal, to more expensive technologies with lower emissions. In both regions, imposing a CO2 price also results in higher total system costs. For example, for carbon prices of US$25/ton CO2 and US$100/ton CO2 in Southern Africa, the total system costs become between 11 and 28 percent greater than under the Reference Scenario, respectively. With the same carbon prices, in the Balkans, the total system cost increase ranges from 30 to 66 percent greater than under the Reference Scenario.
Although both the total system costs and average generation costs increase as carbon prices increase, as explained above, the level of CO2 emissions decreases. In Southern Africa, carbon prices of US$25 ton and US$50/ton CO2 result in CO2 emission levels that are largely lower than under the Reference Scenario. Carbon prices of US$100/ton reduce emissions even more noticeably. The same is seen in the Balkan region, where a carbon price of US$100/ton results in significantly lower emissions than the other prices modeled.
xv
The way, in which the following issues, among others, are addressed, will have lasting repercussions on the attractiveness of potential carbon assets generated by CCS projects:
1. Managing permanence and liability.2. Establishing good CCS project design and
operational standards (including measurement, monitoring, reporting, and verification (MRV) procedures).
3. Establishing national regulatory regimes for CCS projects in developing countries.
Addressing the regulatory requirements for CCS in developing countries should include consideration of funding sources to meet these regulations, for example, through accessing public sources of climate finance or leveraging private finance through carbon markets. The latter could cover methodological aspects (such as baseline approaches and MRV procedures) and other possible restrictions that may be imposed when linking regional emission trading schemes (ETSs) to international offsets. This will be vital to ensure fungibility of any CCS-generated carbon assets.
Timing is important, and fast-tracking of low-cost opportunities in demonstration projects could create prospects for targeted technical, regulatory, and institutional capacity building in developing countries. Establishing certainty in supporting climate finance policy frameworks for CCS would be crucial in creating an economically attractive and low-risk environment for project investors.
Finance Structures and Their Impacts on Levelized Cost of Electricity for Power Plants with CCS
The report presents the results of a model developed to investigate ways of structuring financing for power generation facilities equipped with CCS in the developing world, using instruments available from multilateral development banks and commercial financiers, as well as concessional funding sources. The objective is to assess whether a combination of such instruments could result in reductions in the overall cost of financing. The model calculates the resulting levelized cost of electricity (LCOE), and includes numerous variable parameters, such as coal prices, CO2 prices, and potential revenues from selling oil and gas obtained through enhanced hydrocarbon recovery.
The Role of Climate Finance Sources to Accelerate Carbon Capture and Storage Deployment in Developing Countries
The report presents the results of an assessment on the options for using climate finance to accelerate demonstration and deployment of CCS in developing countries over the next 20 years, which takes into account future uncertainties in the international policy frameworks for climate finance. The assessment involves comparing potential sources of climate finance to financing needs for CCS deployment in developing countries, according to a particular deployment pathway developed by the International Energy Agency (IEA). The comparison considers how such funding sources could meet these investment needs, as well as certain policy elements that could affect access to climate finance.
CCS is essentially a high-cost abatement option, and therefore widespread CCS deployment in developing countries would only occur in line with ambitious GHG emission reduction targets. There is a great deal of uncertainty about the future structure and specific features of climate finance instruments and channels. It is likely, however, that in a highly ambitious GHG Emission Mitigation Scenario, market-based climate finance instruments, as part of a mix of funding sources, will have to play an important role as a base for cost efficient solutions to attracting finance at the international level.
Based on the metrics developed in this analysis and the data from the IEA ETP Blue Map Scenario, the total incremental costs of CCS in developing countries (covering both capital and operating aspects of CCS deployment and financing costs) could amount to US$220 billion between 2010 and 2030. By 2020, this will be equivalent to an estimated of around US$4–5 billion per year, increasing tenfold to almost US$40 billion per year in 2030. The significant increase in the estimated annual requirement between 2020 and 2030 reflects progressive growth in the amount of projects as well as their scale.
CCS projects are highly heterogeneous, with considerable variations in marginal abatement costs, reflecting differences in energy requirements and unitary costs of technology, capital and operating costs, and project scale factors. A range of support mechanisms, both market and nonmarket approaches working in tandem, may, therefore, be required to support different types of CCS projects throughout their lifetime.
xvi
greater the portion of concessional financing, the lower the LCOE for plants with CCS.
There are a few cases where concessional financing of less than 50 percent of the entire financing package can reduce the LCOE for a coal plant with CCS – down to the point where it is equal to the LCOE of a reference plant without CCS (the latter is assumed to have no concessional funding). The total dollar amount of concessional financing for a single plant with CCS, ranges from US$53 million to US$1,338 million for these few cases. In these specific cases, for plants, capturing 90 percent of the plant’s total CO2 emissions, the oxy-fuel technology requires the least amount of concessional financing, followed by the IGCC technology, and then the PC technology. .
Conclusions
A common theme found throughout the analyses is that there could be potential for CCS deployment in the regions under consideration. Lower-cost opportunities—for example, in sectors practiced in handling CO2, such as gas processing, or where extra revenues could be made available from enhanced hydrocarbon recovery—could provide platforms for the first CCS projects in developing countries. However, broader CCS deployment is contingent upon a number of factors, including an availability of a mix of sources of finance from public funds and carbon market mechanisms, as well as concessional financing sources. In parallel, financing should be supported by legal and regulatory frameworks not only to define mechanisms for access to concessional and climate finance, but also to reduce investor risk and create market drivers to leverage all available sources of domestic and international support.
Of the generation technologies examined, integrated gasification combined cycle (IGCC) plants equipped with CCS demonstrate the least increase in LCOE compared to a reference plant of the same technology without CCS. Oxyfuel plants with capture experience greater cost increases, and pulverized coal (PC) plants with capture experience the greatest increase. At coal prices of 3$/MMBtu and assuming financing of 50 percent from multilateral development banks (MDBs) and 50 percent from commercial sources, the percentage increases in LCOE are 34 percent, 46 percent, and 60 percent, respectively.
Extra revenue streams from carbon prices reduce the LCOE of plants with CCS. The percentage change in the LCOE from a reference plant without CCS to a plant with CCS, ranges between 25 percent and 51 percent at US$15/ton CO2, and between 4 percent and 29 percent at US$50/ton CO2, depending on the plant technology type. This is a considerably greater impact than that is seen from revenues from EOR or enhanced coal-bed methane (ECBM) recovery, both of which, based on the assumptions used for this analysis, reduce the LCOE of a plant with CCS by only 1–2 percent.
Three financing structures are modeled, based on combinations of different financing instruments with average debt interest rates ranging from 5.91 percent to 6.59 percent. This small range in rates results in very little variations in the LCOE across the financing structures.
Including concessional funding for plants with CCS at cheaper terms than the original MDB loans, modeled in the financing packages, reduces the debt rate more considerably, thus lowering the resulting LCOE. The
1
1. INTRODUCTION
Many countries are dependent on fossil fuels for energy generation, and fossil fuels remain a vast energy resource, widely distributed around the world. Coal in particular is abundant in regions that have large existing or projected energy demand and limited alternative energy options. With an average of two coal-fired power stations being built in the developing world every week, reduction in local pollution and emissions of greenhouse gases (GHGs) from the combustion and processing of fossil fuels will remain one of the world’s biggest challenges in the years ahead.
At the 2009 Conference of the Parties to the United Nations Framework Convention on Climate Change (UNFCCC), a number of countries agreed that action should be taken to limit the increase in average global temperatures to 2°C (UNFCCC 2009a). In many studies (for example, van der Zwaan and Gerlagh 2008; IPCC 2007; Stern 2006; Lecocq and Chomitz 2001; Narita 2008), in determining pathways to achieve this goal by limiting carbon dioxide (CO2) concentrations in the atmosphere to 450 ppm, the application of carbon capture and storage (CCS) in a number of industrial sectors plays an important role—either as an interim solution until other options become economically and technologically viable or as a long-term solution.
One of the decisions of the UN Climate Change Conference (COP16) in Cancun (UNFCCC 2010e) in December 2010 calls for new rules governing the inclusion of CCS into the Clean Development Mechanism (CDM), including the measurement of the carbon savings from CCS projects. This decision is to be finalized by the next UNFCCC climate summit in Durban in December 2011. On its own, the decision on eligibility of CCS technology within the CDM framework would not make CCS projects financially viable. However, from the perspective of a developing country, this decision could help kick-start CCS projects in countries that have no climate policy incentives targeted specifically towards CCS.
During the last few years, a number of organizations and initiatives have been making continuous concentrated efforts to promote CCS deployment in both developed and developing countries (Appendix A). Some organizations, such as the Australia-based Global CCS Institute, and Carbon Sequestration
Leadership Forum (CSLF) have already established themselves as leaders in the field of CCS technical, regulatory, and economic knowledge. During discussions with these organizations and representatives of donor governments, it has been acknowledged that the WBG could play a facilitating and catalytic role for CCS promotion and deployment in developing countries, building upon its vast knowledge of and experience in infrastructure and energy sector policy and project development, as well as its close working relationships with the major CCS initiatives and organizations.
Because of the relatively new status of CCS technology, substantial capacity building gaps exist that need be addressed in WBG partner countries to enable government decision makers and private sector stakeholders to embark on the development and implementation of CCS related policies and projects. To help address these capacity building needs, the Multi-Donor World Bank CCS Capacity Building Trust Fund (WB CCS TF) was established, and became operational in December 2009. The initiation of the WB CCS TF was enabled with contributions from two donors—the government of Norway and the Global CCS Institute—with the total capitalization at about US$11 million. Relying on this fund, as well as internal WBG resources and other donor support, the World Bank started providing assistance to its developing partner countries for CCS knowledge sharing and capacity building to facilitate future deployment of CCS. This report is commissioned as one of the programs supported by the WB CCS TF.
It is widely acknowledged that there are a number of barriers that need to be overcome in order to achieve large scale CCS deployment in both developed and developing countries. Such barriers include the following:
• Technical barriers: Full integration of the CCS technology elements at scale is yet to be achieved.
To continue to extract and combust the world’s rich endowment of oil, coal, peat, and natural gas at current or increasing rates, and so release more of the stored carbon into the atmosphere is no longer environmentally sustainable, unless carbon dioxide capture and storage (CCS) technologies currently being developed can be widely deployed�
(IPCC 2007)
2
For the purposes of this report, the above analyses are carried out for case study regions, since potential deployment of CCS could have both regional and country-level impacts. The focus is on two regions, which are selected based on (a) their level of reliance on fossil fuels for power generation, (c) regional energy and electricity network interdependency, and (c) their potential to establish CCS regional networks linking CO2-emitting sources and sequestration sites across different countries within the region. Based on these criteria, the selected case study regions are Southern Africa and the Balkans.
It should be noted that many countries within the Balkan region are considered transition economies, and it is recognized that this status is different and distinct from the status of mid-income and low-income developing countries. However, for the purposes of this report, the states within both regions are referred to as developing countries.
An assessment of the financial barriers is conducted on a project level, as well as through examining financing needs on a global scale. These issues are not directly related to the case study regions, since the objective is to explore general frameworks for financing CCS projects that can be applicable in all developing countries, rather than in specific regions.
This report only considers CO2 storage in geological formations, and does not cover many aspects related to utilization of CO2 that are referred to as CCUS (carbon capture utilization and storage). CCUS is a new and promising aspect of the CCS cycle that requires further analysis on its technological prospects, scale, and associated costs. There are several ongoing projects in this area today, but such applications are at the early stages of development. Enhanced hydrocarbon recovery, is an example of CCUS that is well established and is therefore included in the analyses in this report. Other options for CCUS should be investigated in a separate study.
• Economic barriers: Sectoral economic issues could arise from potential increases in the cost of electricity production if CCS were to be employed in the power sector.
• Legal and regulatory barriers: Adequate legal frameworks are necessary to provide investors with the security for CCS deployment.
• Financial barriers: As a new and expensive technology, financing mechanisms are needed to help make CCS projects economically viable and financially attractive for investment by the private sector.
The objectives of this study are to inform Bank staff and partner country policy makers about the following:
• Technical, environmental (GHG emissions), regulatory, and socioeconomic issues related to potential CCS deployment in regional energy infrastructure.
• Existing and prospective financing mechanisms that that might encourage deployment of CCS in developing countries, where appropriate.
These objectives are achieved through addressing issues associated with three of the barriers described above. Technical barriers related to CCS deployment are not examined in this report, since CCS is a relatively new technology, and the WBG—as well as other MDBs—do not have specific project expertise or experience in the field.
The economic barriers are addressed through an examination of some of the impacts of potential CCS deployment in power sectors, including changes in electricity prices and GHG emission levels. The legal and regulatory barriers are assessed through a review of existing national and international regulations potentially applicable to CCS to define gaps and suggested approaches to address them.
3
2. TECHNOLOGY OVERVIEW AND STATUS OF CCS DEVELOPMENT
This chapter provides an overview of CCS technology, its application, the current status of its deployment and its cost.
CCS Technology
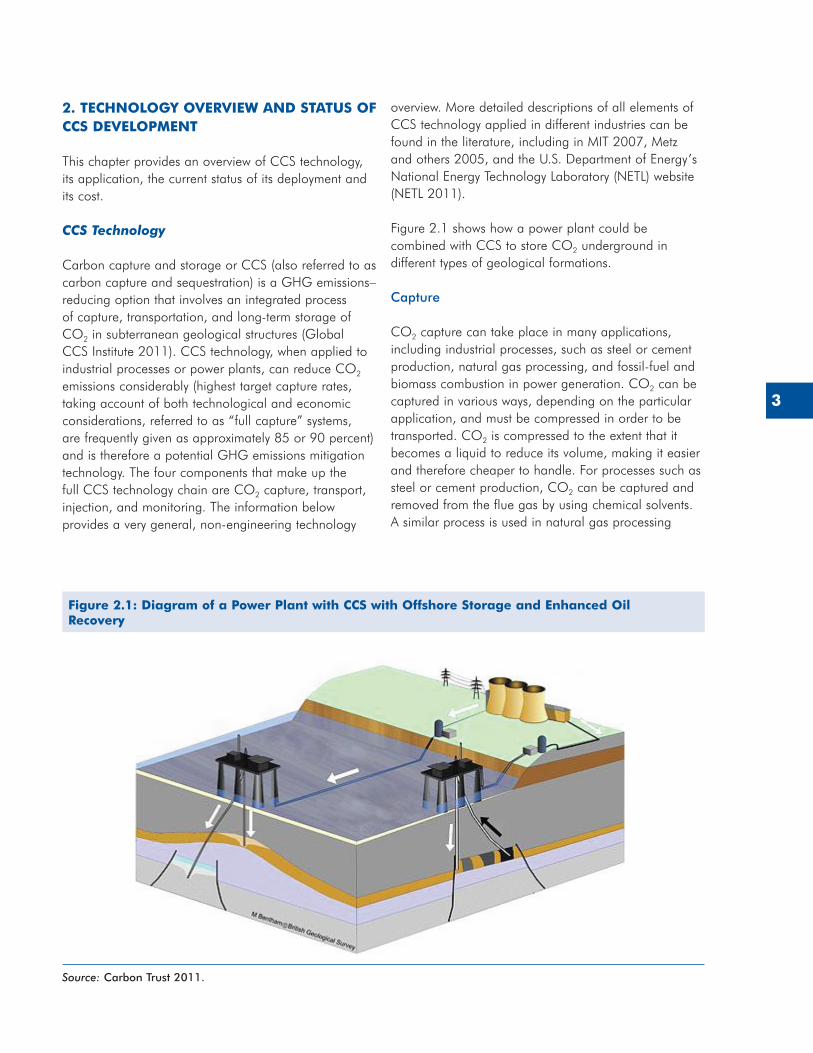
Carbon capture and storage or CCS (also referred to as carbon capture and sequestration) is a GHG emissions–reducing option that involves an integrated process of capture, transportation, and long-term storage of CO2 in subterranean geological structures (Global CCS Institute 2011). CCS technology, when applied to industrial processes or power plants, can reduce CO2 emissions considerably (highest target capture rates, taking account of both technological and economic considerations, referred to as “full capture” systems, are frequently given as approximately 85 or 90 percent) and is therefore a potential GHG emissions mitigation technology. The four components that make up the full CCS technology chain are CO2 capture, transport, injection, and monitoring. The information below provides a very general, non-engineering technology
overview. More detailed descriptions of all elements of CCS technology applied in different industries can be found in the literature, including in MIT 2007, Metz and others 2005, and the U.S. Department of Energy’s National Energy Technology Laboratory (NETL) website (NETL 2011).
Figure 2.1 shows how a power plant could be combined with CCS to store CO2 underground in different types of geological formations.
Capture
CO2 capture can take place in many applications, including industrial processes, such as steel or cement production, natural gas processing, and fossil-fuel and biomass combustion in power generation. CO2 can be captured in various ways, depending on the particular application, and must be compressed in order to be transported. CO2 is compressed to the extent that it becomes a liquid to reduce its volume, making it easier and therefore cheaper to handle. For processes such as steel or cement production, CO2 can be captured and removed from the flue gas by using chemical solvents. A similar process is used in natural gas processing
Figure 2.1: Diagram of a Power Plant with CCS with Offshore Storage and Enhanced Oil Recovery
Source: Carbon Trust 2011�
4
Pre-Combustion Method
In the case of CO2 pre-combustion capture, the fuel is gasified, applying high temperatures, steam, and pressure to produce carbon monoxide and hydrogen. The carbon monoxide is reacted with steam in a shift reactor to produce CO2 and more hydrogen. The hydrogen is then used in a gas turbine to generate power, while the waste heat from the combustion process is used to generate electricity in a steam turbine. The CO2-rich stream is derived after the gasification process is purified, typically using a physical solvent-based process, and then compressed and transported for storage. Plants that could adopt this technology are integrated gasification combined cycle (IGCC) power plants. IGCC plants with CO2 capture have an advantage over pulverized coal or fluidized bed combustion plants with capture, associated with a more concentrated CO2 stream that facilitates the capture process and reduces equipment and solvent costs. However, gasifiers are more costly and IGCC plants are less technologically mature than pulverized coal or fluidized bed combustion boilers (Bellona Foundation 2011a).
Transport
CO2 can be transported by pipeline or in containers by truck or by ship. There are already 3,400 miles of dedicated CO2 transport pipelines in the United States used for the purposes of delivering CO2 for enhanced oil recovery (EOR), which is explained in greater detail below. There is also experience in transporting CO2 in small volumes in containers by truck and in vessels by ship for the purpose of cooling and food production (Bellona Foundation 2011b).
Injection
CO2 can be injected into different types of geological formations, such as saline aquifers, depleted (or near depleted) oil and gas reservoirs, and deep unmineable coal seams, among others.
Saline aquifers: Estimates suggest that saline aquifers make up the largest potential storage volume for CO2 storage among all available geological sequestration options. Potential saline aquifers for storage have porous rock and are overlain by cap rock to ensure there is no leakage of CO2 into the surrounding environment (Global CCS Institute 2011). Under these
facilities, in which the removal of CO2 is a standard operational procedure required for meeting transmission pipeline standards. In power generation installations, the capture and removal of CO2 can be achieved through the following methods.
Post-Combustion Method
In the post-combustion capture chemical method, solvents such as aqueous amines or chilled ammonia are used to absorb the CO2 from the flue gas resulting from the combustion process. After the absorption, the CO2-rich solvent is heated to release the CO2, which then can be separated and compressed for transport and storage, while the solvent is regenerated and applied again to the flue gas to repeat the process.
CO2 Capture and Removal in Air-Oxygen Combustion
This process involves CO2 capture and removal from the flue gas after the fuel combustion process is completed. The combustion takes place in a mix of air and oxygen, and is typically used in conventional pulverized coal and fluidized bed power generation facilities. CO2 capture is applied at the end of the combustion process. Coal-fired power plants that are constructed without a CO2 capture unit can be retrofitted with the installation of a CO2 capture and compression plant.
CO2 Capture and Removal in Oxyfuel Combustion
By combusting the fuel in oxygen rather than a mix of air and oxygen, a higher concentration of CO2 in the flue gas can be achieved. The process of CO2 removal from a concentrated stream is more efficient and effective than in the case when CO2 is diluted in a large volume of various gases composing the flue stream. On the other hand, the oxygen is derived from air, requiring the addition of an air separation unit to the plant, which translates into additional capital investment. Under certain technical conditions, pulverized coal power generation facilities can be converted into Oxyfuel combustion plants and retrofitted with CCS, in order to benefit from the high CO2 concentration in the flue gas, as compared to the lower CO2 concentration in air-oxygen combustion plants (Doctor and Hanson 2010; Châtel-Pélage and others 2003).
5
more than 70 years ago (Herzog 2009). Transport, injection, and monitoring of CO2 have also been in use for EOR in the oil exploration industry since the 1950s. For CCS in power generation, however, the required capture equipment would need significant scale-up compared to process units that have been realized so far.
Despite the fact that these processes are technically established individually, there are very few integrated CCS systems connecting all the parts of the CCS chain. However, industry and government cooperation has led to significant developments in the field of CCS in the last few years, resulting in several operating CCS projects, and plans for more pilot, demonstration, and commercial plants to be constructed within the next decade.
The Australia-based Global CCS Institute recently released a report on the status of global CCS project development and deployment and, according to the study, eight large-scale integrated CCS projects are in operation today (Global CCS Institute 2010). The Global CCS Institute study defines large-scale integrated projects as those where at least 80 percent of 1 Mt/year of CO2 is captured and stored from a power plant, or that at least 80 percent of 0.5 Mt/year of CO2 is captured and stored from a non power generation source, such as industrial facilities. Table 2.1 lists the CCS programs considered large-scale integrated projects.
Of these eight projects, none are operational in the power sector. However, among the 234 active or planned CCS projects of various scale across all sectors identified in the 2010 study, 77 are defined as large-scale integrated projects, and 42 of these are in the power sector, demonstrating a shift towards developing CCS capacity for electricity generation. The study also found that cumulatively, governments have stated investment commitments of up to US$40 billion for CCS demonstration projects. Eight-seven percent of the funding is dedicated to 22 industrial and power generation projects in particular, and an additional US$2.4 billion is committed to research and development (R&D) (Global CCS Institute 2010).
conditions CO2 can be injected in a supercritical state.2
Depleted oil and gas fields: Injecting CO2 into depleted oil and gas fields has the advantage of the tested integrity of the reservoir, which is likely to be high, since oil or gas was previously naturally stored there. However, a downside of this is that since oil or gas has been removed, an additional number of wells are likely to have been drilled into the geological structure. This could lead to leakages and seepages that would need to be sealed, tested, and monitored. Enhanced hydrocarbon recovery, such as EOR is possible when CO2 is injected into near-depleted fields, since the increased pressure in the reservoir forces more of the hydrocarbon out to the surface. This in turn presents an opportunity to obtain additional revenues for a CCS project from selling extra oil or gas obtained as a result of CO2 injection.
Deep unmineable coal seams: There are coal deposits that are uneconomical to mine because of their depth. CO2 can be injected into such formations and stored there if left undisturbed. A potential extra upside to this storage process is the process called enhanced coalbed methane (ECBM) recovery, resulting in recovery of methane gas, which is pushed out of the coal seam during the CO2 injection. The obtained methane could be sold for profit.
Monitoring
Many tools and methods are available for monitoring CO2 migration once injected to ensure that it stays permanently in the ground. Examples of such methods include time-lapse 3D seismic monitoring, passive seismic monitoring, and cross-well seismic imaging (Herzog 2011).
Current Status of Technology
All four of the above components making up the CCS chain are established as individual technologies and processes in multiple sectors and practices. CO2 capture has been in use in natural gas processing and oil refining since the 1930s. The process of using amine-based solvents to remove gases such as CO2 and H2S from natural gas streams was also developed
2 A substance is in a supercritical state when it is at a temperature and pressure above the critical temperature and pressure of the substance concerned. The critical point represents the highest temperature and pressure at which the substance can exist as a vapor and liquid in equilibrium (Metz and others 2005).
6
verify these estimates. Therefore, there is significant uncertainty as to what the true costs of commercial-scale projects will be.
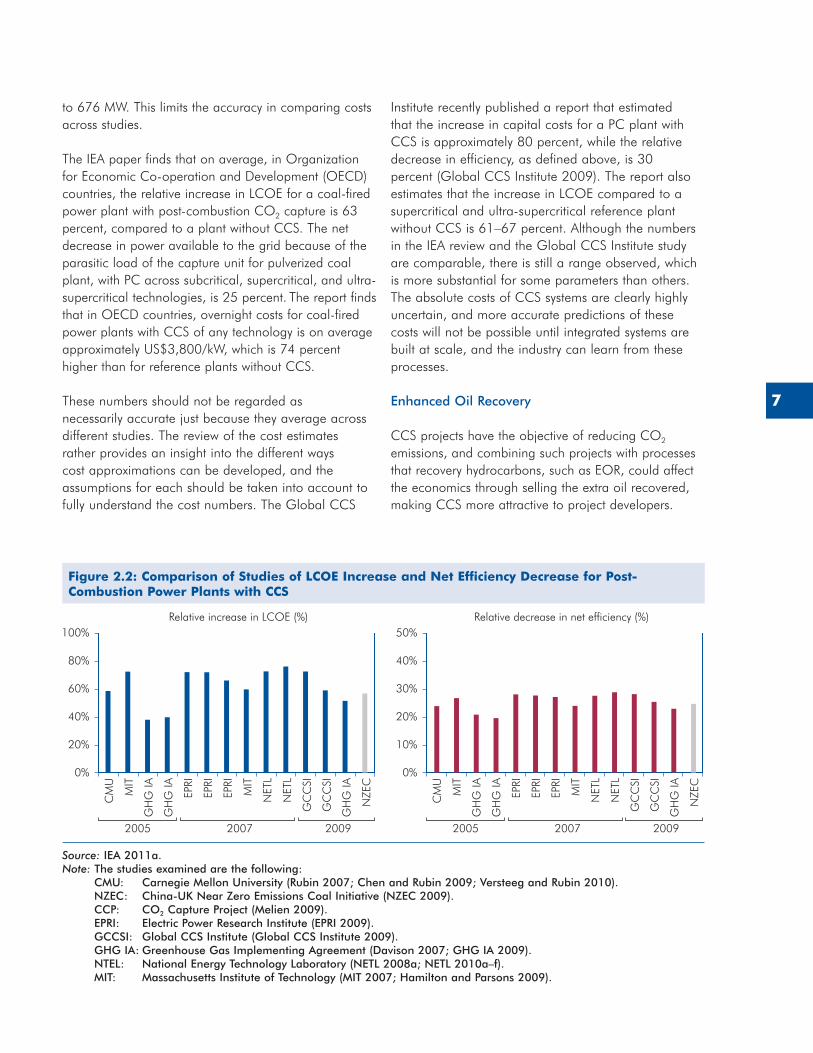
The International Energy Agency (IEA) recently published a report reviewing engineering studies from the last five years that give cost estimates of CO2 capture from power generation, including CO2 conditioning and compression (Finkenrath 2010). The report states that the presented numbers are “estimates for generic, early commercial plants based on feasibility studies, which have an accuracy of ±30 percent.” This demonstrates the scale of uncertainty and the difficulty of comparing cost numbers across different studies. Figure 2.2 shows how estimates of the increase in the levelized cost of electricity (LCOE) and decrease in efficiency for pulverized coal plants over 300 MW net power output with CCS vary across the studies. It should be noted that the technical efficiency of a coal plant remains the same if a capture unit is included compared to a coal plant without a capture unit. However, the capture unit requires energy to operate, referred to as parasitic load, and so the electricity sent out by the plant and the resulting capacity factor are reduced. There is therefore an energy penalty for a coal plant with CCS, often referred to as a net efficiency decrease.
Although the study calibrated the data by ensuring that the costing scope was aligned across compared studies, and converted the costs to 2010 U.S. dollars, the figures are not for a standardized reference plant, but rather for plants ranging in capacity from 399 MW
Economics
Leaving aside policy incentives, combining CCS with any industrial or power generation process will invariably be more expensive than the original process. In the case of CCS applied at a coal-fueled power generation plant, not only do capital and operation and maintenance (O&M) costs become expensive because of the extra equipment required, but the output of the plant will be reduced, since a portion of the produced energy will be used in the CO2 capture and compression units. This plays a significant role in contributing to overall higher costs for power generation units with CCS compared to those without. The cost of equipping power plants with CCS capture and compression units is considered an incremental cost increase, as opposed to gas processing facilities, for example, where the cost of a CO2 capture unit is a standard part of the plant capital expenditure.
For a power plant with an integrated CCS system, the majority of the costs for CCS are the result of the capture component (including compression of CO2) comprising of approximately 70 percent. Costs for CO2 transport (assuming a 200 km pipeline) and storage components are approximately 15 percent each, depending, of course, on the specifics of the project (IEA ETSAP 2010).
A multitude of studies give cost estimates for CCS projects. Since there are few existing integrated CCS projects in operation today, it is very difficult to
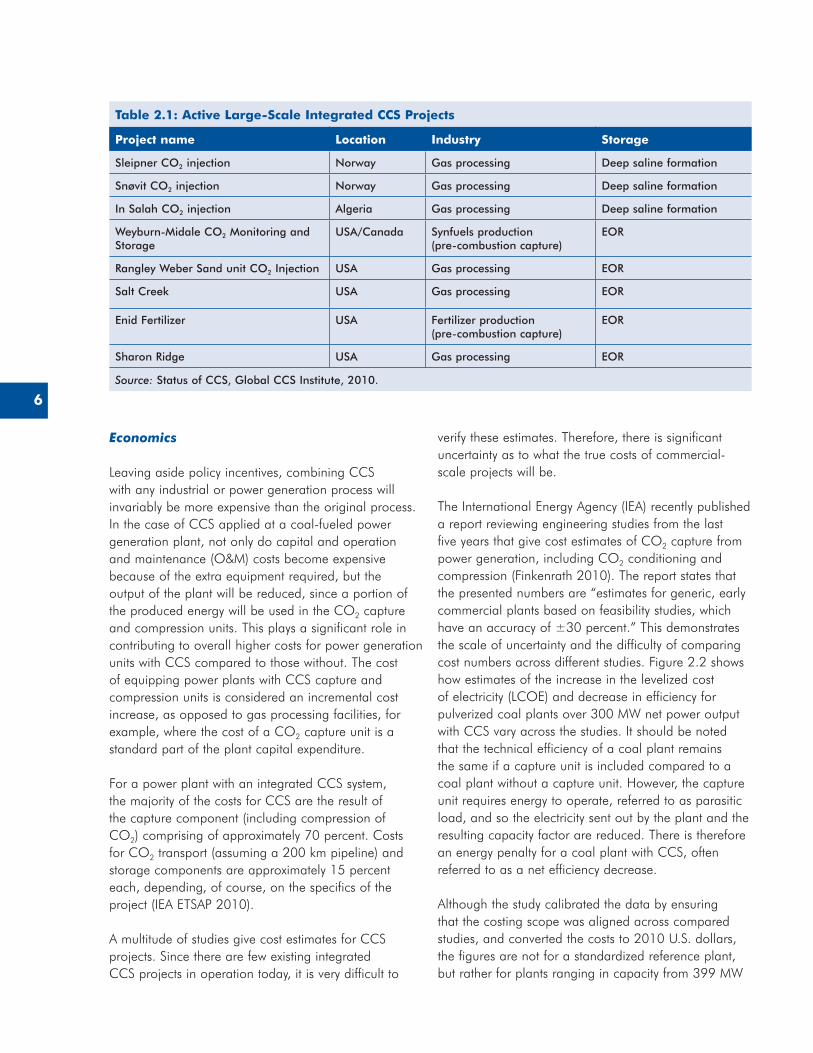
Table 2.1: Active Large-Scale Integrated CCS Projects
Project name Location Industry Storage
Sleipner CO2 injection Norway Gas processing Deep saline formation
Snøvit CO2 injection Norway Gas processing Deep saline formation
In Salah CO2 injection Algeria Gas processing Deep saline formation
Weyburn-Midale CO2 Monitoring and Storage
USA/Canada Synfuels production (pre-combustion capture)
EOR
Rangley Weber Sand unit CO2 Injection USA Gas processing EOR
Salt Creek USA Gas processing EOR
Enid Fertilizer USA Fertilizer production (pre-combustion capture)
EOR
Sharon Ridge USA Gas processing EOR
Source: Status of CCS, Global CCS Institute, 2010�
7
to 676 MW. This limits the accuracy in comparing costs across studies.
The IEA paper finds that on average, in Organization for Economic Co-operation and Development (OECD) countries, the relative increase in LCOE for a coal-fired power plant with post-combustion CO2 capture is 63 percent, compared to a plant without CCS. The net decrease in power available to the grid because of the parasitic load of the capture unit for pulverized coal plant, with PC across subcritical, supercritical, and ultra-supercritical technologies, is 25 percent. The report finds that in OECD countries, overnight costs for coal-fired power plants with CCS of any technology is on average approximately US$3,800/kW, which is 74 percent higher than for reference plants without CCS.
These numbers should not be regarded as necessarily accurate just because they average across different studies. The review of the cost estimates rather provides an insight into the different ways cost approximations can be developed, and the assumptions for each should be taken into account to fully understand the cost numbers. The Global CCS
Institute recently published a report that estimated that the increase in capital costs for a PC plant with CCS is approximately 80 percent, while the relative decrease in efficiency, as defined above, is 30 percent (Global CCS Institute 2009). The report also estimates that the increase in LCOE compared to a supercritical and ultra-supercritical reference plant without CCS is 61–67 percent. Although the numbers in the IEA review and the Global CCS Institute study are comparable, there is still a range observed, which is more substantial for some parameters than others. The absolute costs of CCS systems are clearly highly uncertain, and more accurate predictions of these costs will not be possible until integrated systems are built at scale, and the industry can learn from these processes.
Enhanced Oil Recovery
CCS projects have the objective of reducing CO2 emissions, and combining such projects with processes that recovery hydrocarbons, such as EOR, could affect the economics through selling the extra oil recovered, making CCS more attractive to project developers.
Figure 2.2: Comparison of Studies of LCOE Increase and Net Efficiency Decrease for Post-Combustion Power Plants with CCS
Relative increase in LCOE (%) Relative decrease in net efficiency (%)
20%
40%
60%
80%
100%
CM
U
MIT
GH
G IA
GH
G IA
EPRI
EPRI
EPRI
MIT
NET
L
NET
L
GC
CSI
GC
CSI
GH
G IA
NZE
C
2005 20092007
0%
10%
20%
30%
40%
50%
CM
U
MIT
GH
G IA
GH
G IA
EPRI
EPRI
EPRI
MIT
NET
L
NET
L
GC
CSI
GC
CSI
GH
G IA
NZE
C
2005 20092007
0%
Source: IEA 2011a� Note: The studies examined are the following:
CMU: Carnegie Mellon University (Rubin 2007; Chen and Rubin 2009; Versteeg and Rubin 2010)�NZEC: China-UK Near Zero Emissions Coal Initiative (NZEC 2009)�CCP: CO2 Capture Project (Melien 2009)�EPRI: Electric Power Research Institute (EPRI 2009)�GCCSI: Global CCS Institute (Global CCS Institute 2009)�GHG IA: Greenhouse Gas Implementing Agreement (Davison 2007; GHG IA 2009)�NTEL: National Energy Technology Laboratory (NETL 2008a; NETL 2010a–f)�MIT: Massachusetts Institute of Technology (MIT 2007; Hamilton and Parsons 2009)�

8
of actions. If the primary objective of the project is to recover oil, then once the process is uneconomical, absent some other driver to sequester CO2, the project is ended. Where other economic or regulatory drivers exist to encourage CCS projects, the CO2 would still be injected into the depleted field even though no more oil is produced, or else alternative sinks would need to be identified and developed. Building a connected network of pipelines to oil fields where EOR can be adopted, such that CO2 could be continually stored, would reconcile these two incentives.
In many cases, EOR has provided economic benefits and additional incentives for CCS projects. An example is the Tenaska Trailblazer project, where its inclusion in the scope is expected to add more than 10 million barrels of oil production annually to the West Texas economy (Tenaska 2011).
EOR processes only provide additional revenues for CCS projects as long as the costs of capturing, compressing, and re-injecting CO2 are lower than the revenues that can be generated from selling the additional oil recovered.3 This depends on the geological characteristics of the site that determine how much oil can ultimately be recovered, as well as the price at which oil can be sold. Since CO2 is recycled for EOR processes, the proportion of injected CO2 that comes directly from the CO2 source, as opposed to recycled CO2, will decrease over time. The result is that an individual site for EOR will be able to store less and less newly captured CO2. If the CO2 supply from the source, such as a power plant or natural gas processing facility, remains constant over time, either an alternative storage site would need to be identified or the CO2 would be vented into the atmosphere. This is where different interests result in a divergence
3 It should be noted that CO2 from CO2 capture systems could be sold to a market and purchased by EOR project developers, rather than integrating the capture and storage elements into one project. However the economic argument still holds that the revenues are only possible if the price at which CO2 is sold is greater than the cost of capturing it. This depends on the profitability of EOR, which in turn depends on oil prices, and the geology of particular storage sites where EOR could be implemented.
9
9. Availability of revenues for CCS projects from CO2 prices.
10. CCS deployment targets.5
It should be noted that further policies that would affect CCS deployment are not included in the modeling analysis, such as public funding and direct investment. These are discussed in detail in Chapters 5 and 6 on financing CCS.
Overview of Results
The techno-economic study finds that under some of the scenarios, CCS could be an economically competitive option, whereas in others it is not. The results are summarized in Table 3.1. The percentage difference in the total system cost is a way of measuring the cost of the policy. The Reference Scenario can be thought of as a no-policy scenario, and therefore any increases in the system, cost once a policy is applied, represent the costs related to the implementation of the policy. It should be noted that only the costs of policies, and not their associated benefits, are taken account of here. CO2 emission reductions for each scenario are investigated; they can be viewed as a benefit to weigh against costs, but they are not quantified here, as would be the case in a cost-benefit analysis.
In both regions, the results show that certain CO2 prices can result in the deployment of power plants with CCS and, in some cases, the higher the price, the greater the level of deployment. However, while a very high price (US$100/ton) in the Balkans results in a significant increase in CCS deployment, such an increase in CCS penetration is not observed in Southern Africa for similarly high prices. This is because coal plants in the Southern African regions are air-cooled, resulting in lower efficiencies. The application of CCS technology leads to additional losses in power output, and thus capacity factors, to the point where the total efficiency penalty becomes prohibitively costly, and reaches a level where CCS technology is less economically competitive than the wet-cooled plants in the Balkan region.
The modeling results show that in the Balkan region, with revenues achieved through enhanced hydrocarbon
3. TECHNO-ECONOMIC ASSESSMENT OF CARBON CAPTURE AND STORAGE DEPLOYMENT IN THE POWER SECTOR IN THE SOUTHERN AFRICAN AND BALKAN REGIONS
Developing policy recommendations to address the barriers to CCS deployment requires an understanding of the impacts of the potential policy options. The objective of this chapter is to describe the findings of the techno-economic modeling analysis to investigate the impacts of different climate policies on CCS deployment in the power sector in the Balkan and Southern African regions.4 Core assumptions and the main results are presented here. All supporting background information and other results can be found in the full report. All graphs and tables are from the report, on which this chapter is based. The study involved developing a model to examine the impacts of policies on the following criteria over time up to 2030 (2030 is selected as an appropriate end to the time horizon, since it is long enough to allow for capacity building and for CCS projects to be built and operated at scale, but short enough to account for timeframes often under consideration by policy makers):
1. Development of the energy technology mix, especially noting the level of CCS deployment.
2. Average generation costs.3. CO2 emissions.4. Total discounted system cost, which is the
discounted cost of the entire energy sector, including investment costs, operation costs, and any additional penalty costs associated with the particular policy.
5. These four criteria are found under variations of the following policy scenarios in the regions:
6. Least-Cost Expansion Planning or Reference Scenario.
7. Forced capacity additions as prescribed by government policies and energy plans in the regions (Baseline Scenario).
8. Availability of revenues for CCS projects from enhanced hydrocarbon recovery.
4 This chapter is based on the report, “Techno-Economic Assessment of Carbon Capture and Storage Deployment in Power Stations in the Southern African and Balkan Regions,” by VITO, EIHP, and ERC (Tot and others 2011) under a contract with the World Bank.
5 The techno-economic study includes further scenarios, including CO2 emission limits and energy efficiency policies. A selection of scenarios sufficient to demonstrate the trends in the results relating to CCS deployment, CO2 emissions and electricity prices are presented here. The results of all the scenarios modeled are available in the full report (Tot and others 2011).
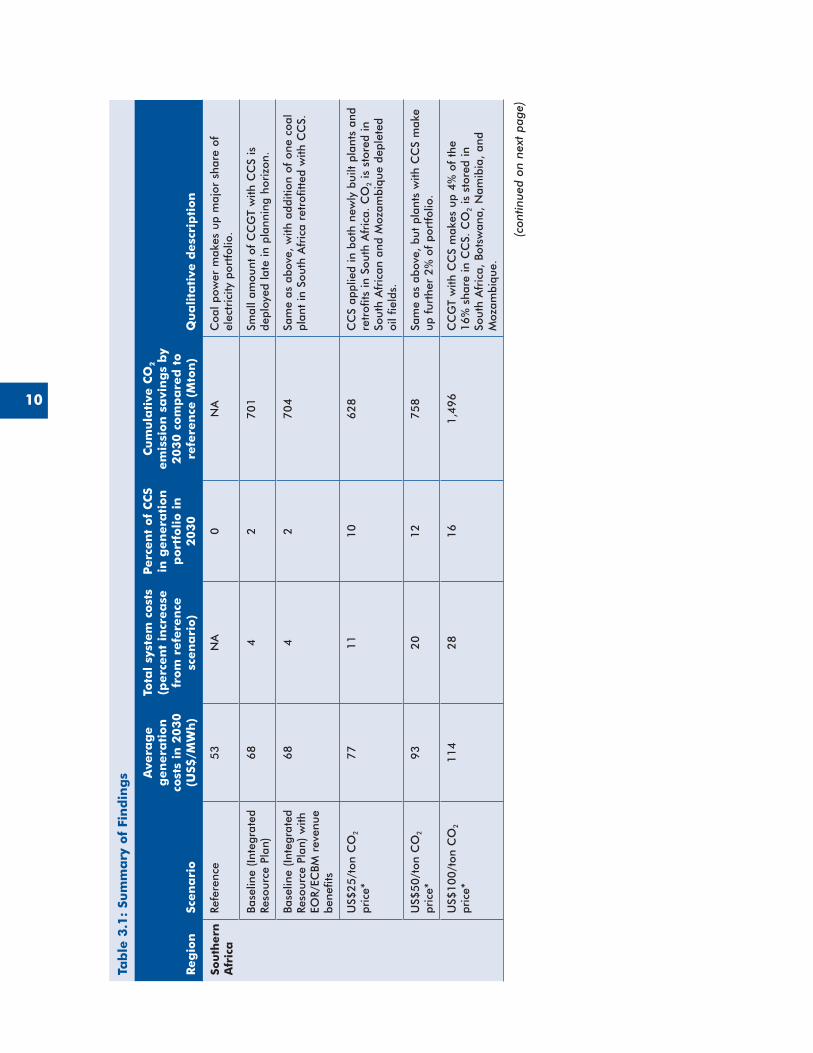
10
Tab
le 3
.1:
Sum
ma
ry o
f Fi
nd
ing
s
Reg
ion
Scen
ari
o
Ave
rag
e
gen
era
tion
co
sts
in 2
030
(US$
/MW
h)
Tota
l sy
stem
cost
s (p
erc
en
t in
crea
se
from
refe
ren
ce
scen
ari
o)
Perc
en
t of
CC
S in
gen
era
tion
p
ort
folio i
n
2030
Cu
mu
lati
ve C
O2
em
issi
on
sa
vin
gs
by
2030 c
om
pa
red
to
refe
ren
ce (
Mto
n)
Qu
alita
tive
desc
rip
tion
Sou
thern
A
fric
aRe
fere
nce
53
NA
0N
AC
oal p
ower
mak
es u
p m
ajor
sha
re o
f el
ectr
icity
por
tfol
io�
Base
line
(Inte
grat
ed
Reso
urce
Pla
n)6
84
27
01
Smal
l am
ount
of
CC
GT
with
CC
S is
de
ploy
ed la
te in
pla
nnin
g ho
rizo
n�
Base
line
(Inte
grat
ed
Reso
urce
Pla
n) w
ith
EOR/
ECBM
rev
enue
be
nefit
s
68
42
70
4Sa
me
as a
bove
, w
ith a
dditi
on o
f on
e co
al
plan
t in
Sou
th A
fric
a re
trof
itted
with
CC
S�
US$
25
/ton
CO
2
pric
e*7
71
11
06
28
CC
S ap
plie
d in
bot
h ne
wly
bui
lt pl
ants
and
re
trof
its in
Sou
th A
fric
a� C
O2 is
sto
red
in
Sout
h A
fric
an a
nd M
ozam
biqu
e de
plet
ed
oil f
ield
s�
US$
50
/ton
CO
2
pric
e*9
32
01
27
58
Sam
e as
abo
ve,
but
plan
ts w
ith C
CS
mak
e up
fur
ther
2%
of
port
folio
�
US$
10
0/t
on C
O2
pric
e*1
14
28
16
1,4
96
CC
GT
with
CC
S m
akes
up
4%
of
the
16%
sha
re in
CC
S� C
O2 is
sto
red
in
Sout
h A
fric
a, B
otsw
ana,
Nam
ibia
, an
d M
ozam
biqu
e�
(co
ntin
ued
on n
ext
page
)
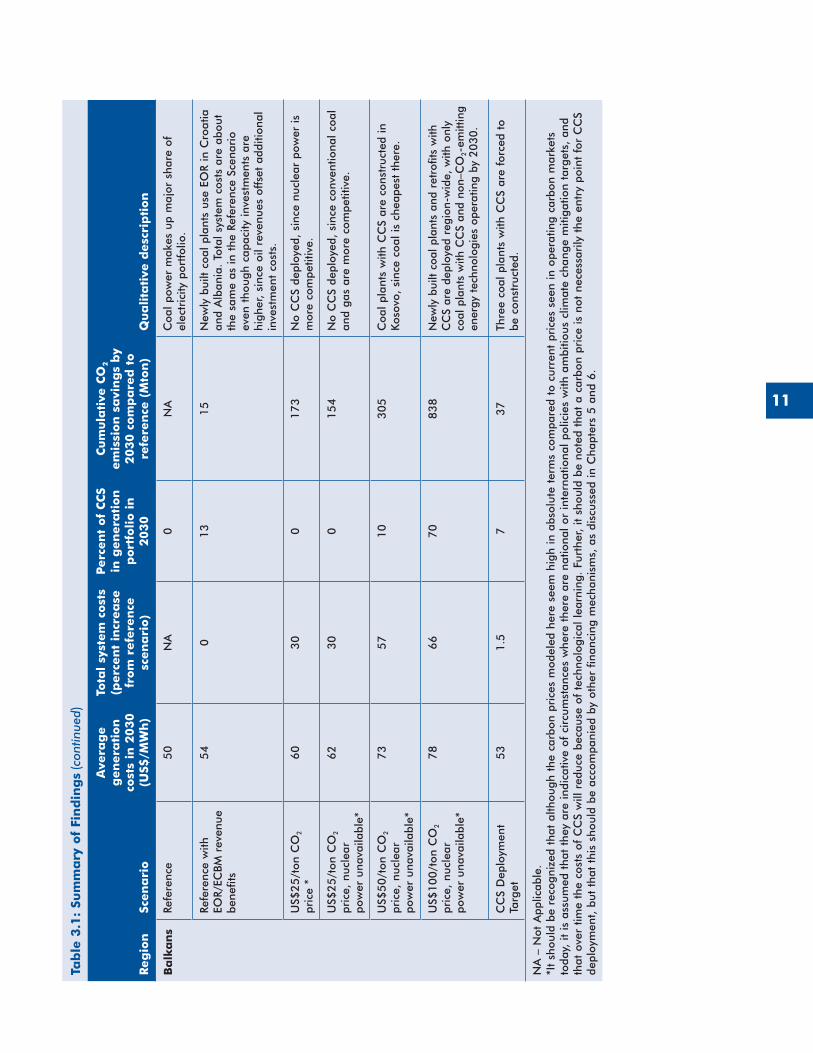
11
Tab
le 3
.1:
Sum
ma
ry o
f Fi
nd
ing
s
Reg
ion
Scen
ari
o
Ave
rag
e
gen
era
tion
co
sts
in 2
030
(US$
/MW
h)
Tota
l sy
stem
cost
s (p
erc
en
t in
crea
se
from
refe
ren
ce
scen
ari
o)
Perc
en
t of
CC
S in
gen
era
tion
p
ort
folio i
n
2030
Cu
mu
lati
ve C
O2
em
issi
on
sa
vin
gs
by
2030 c
om
pa
red
to
refe
ren
ce (
Mto
n)
Qu
alita
tive
desc
rip
tion
Ba
lka
ns
Refe
renc
e5
0N
A0
NA
Coa
l pow
er m
akes
up
maj
or s
hare
of
elec
tric
ity p
ortf
olio
�
Refe
renc
e w
ith
EOR/
ECBM
rev
enue
be
nefit
s
54
01
31
5N
ewly
bui
lt co
al p
lant
s us
e EO
R in
Cro
atia
an
d A
lban
ia�
Tota
l sys
tem
cos
ts a
re a
bout
th
e sa
me
as in
the
Ref
eren
ce S
cena
rio
even
tho
ugh
capa
city
inve
stm
ents
are
hi
gher
, si
nce
oil r
even
ues
offs
et a
dditi
onal
in
vest
men
t co
sts�
US$
25
/ton
CO
2
pric
e *
60
30
01
73
No
CC
S de
ploy
ed,
sinc
e nu
clea
r po
wer
is
mor
e co
mpe
titiv
e�
US$
25
/ton
CO
2
pric
e, n
ucle
ar
pow
er u
nava
ilabl
e*
62
30
01
54
No
CC
S de
ploy
ed,
sinc
e co
nven
tiona
l coa
l an
d ga
s ar
e m
ore
com
petit
ive�
US$
50
/ton
CO
2
pric
e, n
ucle
ar
pow
er u
nava
ilabl
e*
73
57
10
30
5C
oal p
lant
s w
ith C
CS
are
cons
truc
ted
in
Kos
ovo,
sin
ce c
oal i
s ch
eape
st t
here
�
US$
10
0/t
on C
O2
pric
e, n
ucle
ar
pow
er u
nava
ilabl
e*
78
66
70
83
8N
ewly
bui
lt co
al p
lant
s an
d re
trof
its w
ith
CC
S ar
e de
ploy
ed r
egio
n-w
ide,
with
onl
y co
al p
lant
s w
ith C
CS
and
non–
CO
2-em
ittin
g en
ergy
tec
hnol
ogie
s op
erat
ing
by 2
030�
CC
S D
eplo
ymen
t Ta
rget
53
1�5
73
7Th
ree
coal
pla
nts
with
CC
S ar
e fo
rced
to
be c
onst
ruct
ed�
NA
– N
ot A
pplic
able
�*I
t sh
ould
be
reco
gniz
ed t
hat
alth
ough
the
car
bon
pric
es m
odel
ed h
ere
seem
hig
h in
abs
olut
e te
rms
com
pare
d to
cur
rent
pri
ces
seen
in o
pera
ting
carb
on m
arke
ts
toda
y, it
is a
ssum
ed t
hat
they
are
indi
cativ
e of
cir
cum
stan
ces
whe
re t
here
are
nat
iona
l or
inte
rnat
iona
l pol
icie
s w
ith a
mbi
tious
clim
ate
chan
ge m
itiga
tion
targ
ets,
and
th
at o
ver
time
the
cost
s of
CC
S w
ill r
educ
e be
caus
e of
tec
hnol
ogic
al le
arni
ng�
Furt
her,
it sh
ould
be
note
d th
at a
car
bon
pric
e is
not
nec
essa
rily
the
ent
ry p
oint
for
CC
S de
ploy
men
t, b
ut t
hat
this
sho
uld
be a
ccom
pani
ed b
y ot
her
finan
cing
mec
hani
sms,
as
disc
usse
d in
Cha
pter
s 5
and
6�
(con
tinue
d)
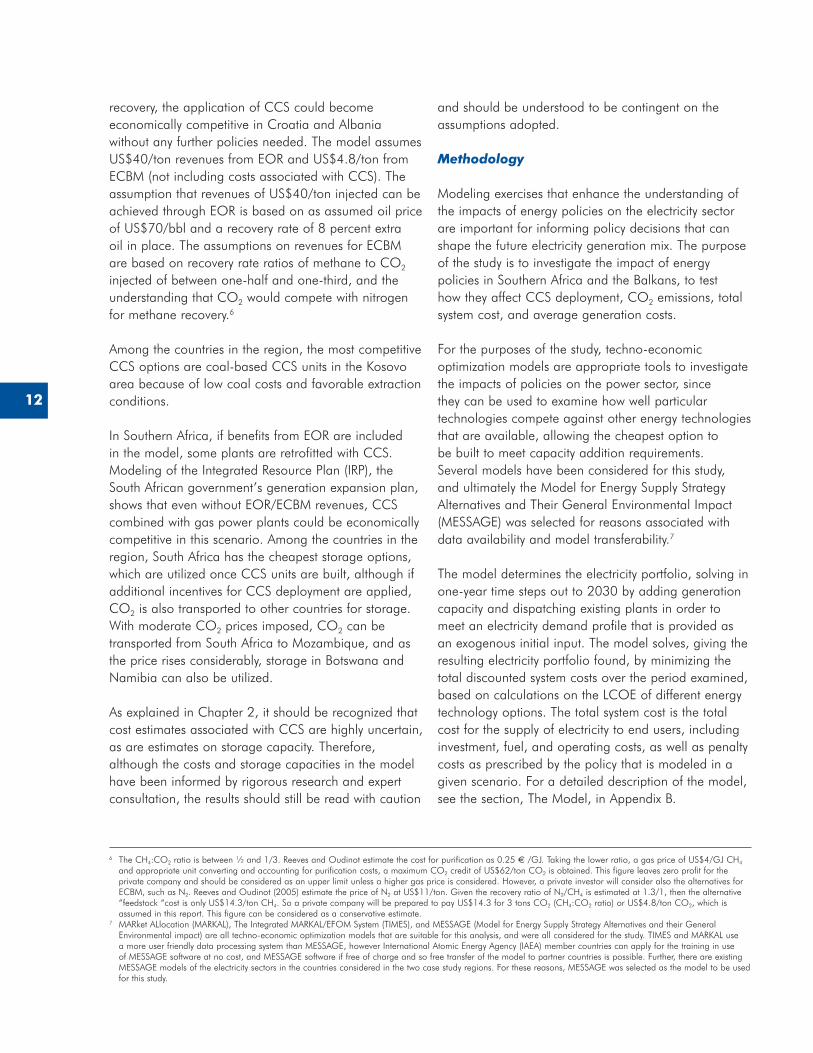
12
recovery, the application of CCS could become economically competitive in Croatia and Albania without any further policies needed. The model assumes US$40/ton revenues from EOR and US$4.8/ton from ECBM (not including costs associated with CCS). The assumption that revenues of US$40/ton injected can be achieved through EOR is based on as assumed oil price of US$70/bbl and a recovery rate of 8 percent extra oil in place. The assumptions on revenues for ECBM are based on recovery rate ratios of methane to CO2 injected of between one-half and one-third, and the understanding that CO2 would compete with nitrogen for methane recovery.6
Among the countries in the region, the most competitive CCS options are coal-based CCS units in the Kosovo area because of low coal costs and favorable extraction conditions.
In Southern Africa, if benefits from EOR are included in the model, some plants are retrofitted with CCS. Modeling of the Integrated Resource Plan (IRP), the South African government’s generation expansion plan, shows that even without EOR/ECBM revenues, CCS combined with gas power plants could be economically competitive in this scenario. Among the countries in the region, South Africa has the cheapest storage options, which are utilized once CCS units are built, although if additional incentives for CCS deployment are applied, CO2 is also transported to other countries for storage. With moderate CO2 prices imposed, CO2 can be transported from South Africa to Mozambique, and as the price rises considerably, storage in Botswana and Namibia can also be utilized.
As explained in Chapter 2, it should be recognized that cost estimates associated with CCS are highly uncertain, as are estimates on storage capacity. Therefore, although the costs and storage capacities in the model have been informed by rigorous research and expert consultation, the results should still be read with caution
and should be understood to be contingent on the assumptions adopted.
Methodology
Modeling exercises that enhance the understanding of the impacts of energy policies on the electricity sector are important for informing policy decisions that can shape the future electricity generation mix. The purpose of the study is to investigate the impact of energy policies in Southern Africa and the Balkans, to test how they affect CCS deployment, CO2 emissions, total system cost, and average generation costs.
For the purposes of the study, techno-economic optimization models are appropriate tools to investigate the impacts of policies on the power sector, since they can be used to examine how well particular technologies compete against other energy technologies that are available, allowing the cheapest option to be built to meet capacity addition requirements. Several models have been considered for this study, and ultimately the Model for Energy Supply Strategy Alternatives and Their General Environmental Impact (MESSAGE) was selected for reasons associated with data availability and model transferability.7
The model determines the electricity portfolio, solving in one-year time steps out to 2030 by adding generation capacity and dispatching existing plants in order to meet an electricity demand profile that is provided as an exogenous initial input. The model solves, giving the resulting electricity portfolio found, by minimizing the total discounted system costs over the period examined, based on calculations on the LCOE of different energy technology options. The total system cost is the total cost for the supply of electricity to end users, including investment, fuel, and operating costs, as well as penalty costs as prescribed by the policy that is modeled in a given scenario. For a detailed description of the model, see the section, The Model, in Appendix B.
6 The CH4:CO2 ratio is between ½ and 1/3. Reeves and Oudinot estimate the cost for purification as 0.25 € /GJ. Taking the lower ratio, a gas price of US$4/GJ CH4 and appropriate unit converting and accounting for purification costs, a maximum CO2 credit of US$62/ton CO2 is obtained. This figure leaves zero profit for the private company and should be considered as an upper limit unless a higher gas price is considered. However, a private investor will consider also the alternatives for ECBM, such as N2. Reeves and Oudinot (2005) estimate the price of N2 at US$11/ton. Given the recovery ratio of N2/CH4 is estimated at 1.3/1, then the alternative “feedstock “cost is only US$14.3/ton CH4. So a private company will be prepared to pay US$14.3 for 3 tons CO2 (CH4:CO2 ratio) or US$4.8/ton CO2, which is assumed in this report. This figure can be considered as a conservative estimate.
7 MARket ALlocation (MARKAL), The Integrated MARKAL/EFOM System (TIMES), and MESSAGE (Model for Energy Supply Strategy Alternatives and their General Environmental impact) are all techno-economic optimization models that are suitable for this analysis, and were all considered for the study. TIMES and MARKAL use a more user friendly data processing system than MESSAGE, however International Atomic Energy Agency (IAEA) member countries can apply for the training in use of MESSAGE software at no cost, and MESSAGE software if free of charge and so free transfer of the model to partner countries is possible. Further, there are existing MESSAGE models of the electricity sectors in the countries considered in the two case study regions. For these reasons, MESSAGE was selected as the model to be used for this study.
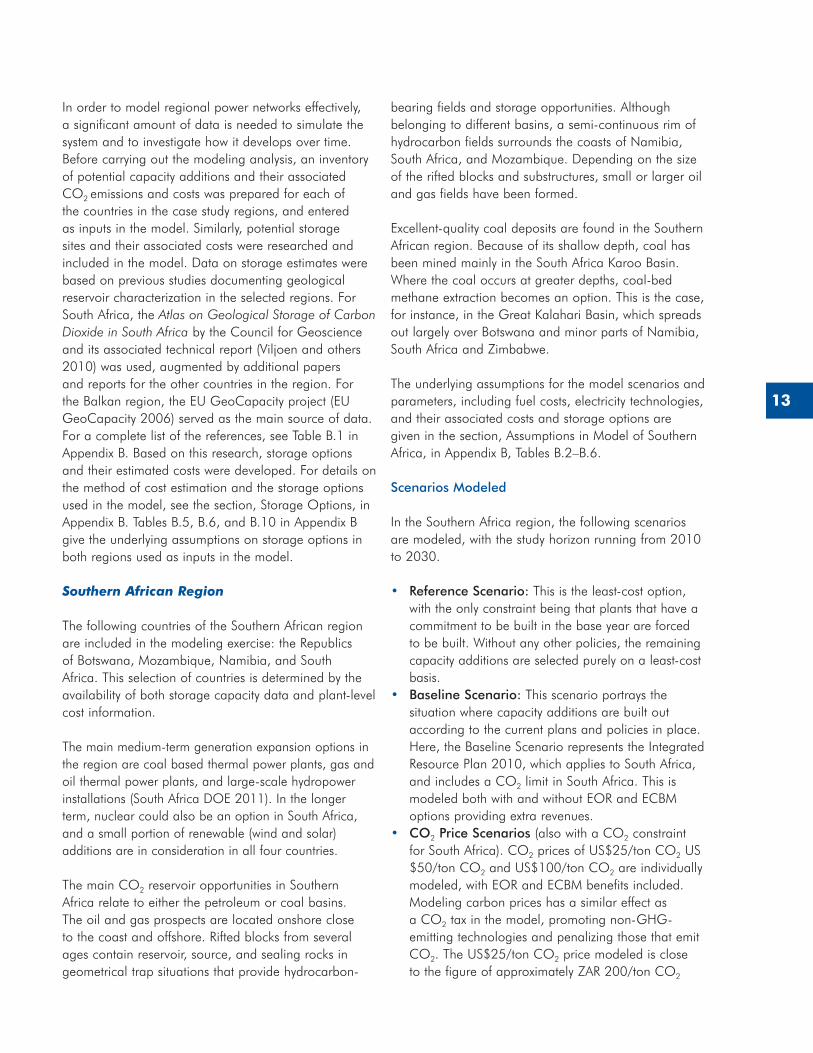
13
In order to model regional power networks effectively, a significant amount of data is needed to simulate the system and to investigate how it develops over time. Before carrying out the modeling analysis, an inventory of potential capacity additions and their associated CO2 emissions and costs was prepared for each of the countries in the case study regions, and entered as inputs in the model. Similarly, potential storage sites and their associated costs were researched and included in the model. Data on storage estimates were based on previous studies documenting geological reservoir characterization in the selected regions. For South Africa, the Atlas on Geological Storage of Carbon Dioxide in South Africa by the Council for Geoscience and its associated technical report (Viljoen and others 2010) was used, augmented by additional papers and reports for the other countries in the region. For the Balkan region, the EU GeoCapacity project (EU GeoCapacity 2006) served as the main source of data. For a complete list of the references, see Table B.1 in Appendix B. Based on this research, storage options and their estimated costs were developed. For details on the method of cost estimation and the storage options used in the model, see the section, Storage Options, in Appendix B. Tables B.5, B.6, and B.10 in Appendix B give the underlying assumptions on storage options in both regions used as inputs in the model.
Southern African Region
The following countries of the Southern African region are included in the modeling exercise: the Republics of Botswana, Mozambique, Namibia, and South Africa. This selection of countries is determined by the availability of both storage capacity data and plant-level cost information.
The main medium-term generation expansion options in the region are coal based thermal power plants, gas and oil thermal power plants, and large-scale hydropower installations (South Africa DOE 2011). In the longer term, nuclear could also be an option in South Africa, and a small portion of renewable (wind and solar) additions are in consideration in all four countries.
The main CO2 reservoir opportunities in Southern Africa relate to either the petroleum or coal basins. The oil and gas prospects are located onshore close to the coast and offshore. Rifted blocks from several ages contain reservoir, source, and sealing rocks in geometrical trap situations that provide hydrocarbon-
bearing fields and storage opportunities. Although belonging to different basins, a semi-continuous rim of hydrocarbon fields surrounds the coasts of Namibia, South Africa, and Mozambique. Depending on the size of the rifted blocks and substructures, small or larger oil and gas fields have been formed.
Excellent-quality coal deposits are found in the Southern African region. Because of its shallow depth, coal has been mined mainly in the South Africa Karoo Basin. Where the coal occurs at greater depths, coal-bed methane extraction becomes an option. This is the case, for instance, in the Great Kalahari Basin, which spreads out largely over Botswana and minor parts of Namibia, South Africa and Zimbabwe.
The underlying assumptions for the model scenarios and parameters, including fuel costs, electricity technologies, and their associated costs and storage options are given in the section, Assumptions in Model of Southern Africa, in Appendix B, Tables B.2–B.6.
Scenarios Modeled
In the Southern Africa region, the following scenarios are modeled, with the study horizon running from 2010 to 2030.
• Reference Scenario: This is the least-cost option, with the only constraint being that plants that have a commitment to be built in the base year are forced to be built. Without any other policies, the remaining capacity additions are selected purely on a least-cost basis.
• Baseline Scenario: This scenario portrays the situation where capacity additions are built out according to the current plans and policies in place. Here, the Baseline Scenario represents the Integrated Resource Plan 2010, which applies to South Africa, and includes a CO2 limit in South Africa. This is modeled both with and without EOR and ECBM options providing extra revenues.
• CO2 Price Scenarios (also with a CO2 constraint for South Africa). CO2 prices of US$25/ton CO2 US $50/ton CO2 and US$100/ton CO2 are individually modeled, with EOR and ECBM benefits included. Modeling carbon prices has a similar effect as a CO2 tax in the model, promoting non-GHG-emitting technologies and penalizing those that emit CO2. The US$25/ton CO2 price modeled is close to the figure of approximately ZAR 200/ton CO2
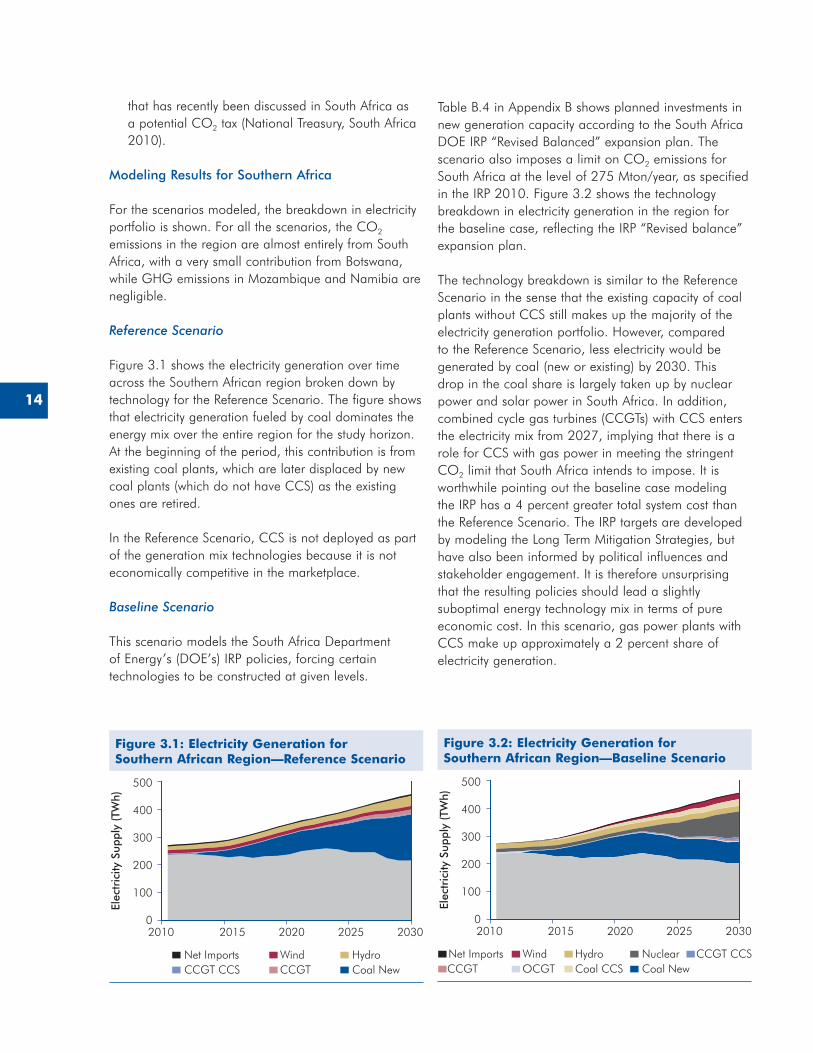
14
that has recently been discussed in South Africa as a potential CO2 tax (National Treasury, South Africa 2010).
Modeling Results for Southern Africa
For the scenarios modeled, the breakdown in electricity portfolio is shown. For all the scenarios, the CO2 emissions in the region are almost entirely from South Africa, with a very small contribution from Botswana, while GHG emissions in Mozambique and Namibia are negligible.
Reference Scenario
Figure 3.1 shows the electricity generation over time across the Southern African region broken down by technology for the Reference Scenario. The figure shows that electricity generation fueled by coal dominates the energy mix over the entire region for the study horizon. At the beginning of the period, this contribution is from existing coal plants, which are later displaced by new coal plants (which do not have CCS) as the existing ones are retired.
In the Reference Scenario, CCS is not deployed as part of the generation mix technologies because it is not economically competitive in the marketplace.
Baseline Scenario
This scenario models the South Africa Department of Energy’s (DOE’s) IRP policies, forcing certain technologies to be constructed at given levels.
Table B.4 in Appendix B shows planned investments in new generation capacity according to the South Africa DOE IRP “Revised Balanced” expansion plan. The scenario also imposes a limit on CO2 emissions for South Africa at the level of 275 Mton/year, as specified in the IRP 2010. Figure 3.2 shows the technology breakdown in electricity generation in the region for the baseline case, reflecting the IRP “Revised balance” expansion plan.
The technology breakdown is similar to the Reference Scenario in the sense that the existing capacity of coal plants without CCS still makes up the majority of the electricity generation portfolio. However, compared to the Reference Scenario, less electricity would be generated by coal (new or existing) by 2030. This drop in the coal share is largely taken up by nuclear power and solar power in South Africa. In addition, combined cycle gas turbines (CCGTs) with CCS enters the electricity mix from 2027, implying that there is a role for CCS with gas power in meeting the stringent CO2 limit that South Africa intends to impose. It is worthwhile pointing out the baseline case modeling the IRP has a 4 percent greater total system cost than the Reference Scenario. The IRP targets are developed by modeling the Long Term Mitigation Strategies, but have also been informed by political influences and stakeholder engagement. It is therefore unsurprising that the resulting policies should lead a slightly suboptimal energy technology mix in terms of pure economic cost. In this scenario, gas power plants with CCS make up approximately a 2 percent share of electricity generation.
Figure 3.1: Electricity Generation for Southern African Region—Reference Scenario
500
0
Elec
tric
ity S
uppl
y (T
Wh)
100
200
300
400
2010 2015 2020 2025 2030
Net Imports Wind HydroCCGT CCS CCGT Coal New
Figure 3.2: Electricity Generation for Southern African Region—Baseline Scenario
500
0
Elec
tric
ity S
uppl
y (T
Wh)
100
200
300
400
2010 2015 2020 2025 2030
Net Imports Wind Hydro CCGT CCSCCGT OCGT
NuclearCoal CCS Coal New
15Baseline Scenario with EOR/ECBM Benefits
This scenario includes the South Africa DOE 2011 IRP with the same CO2 limit of 275Mton for South Africa as an input into the model, but it also includes the potential to gain revenues from EOR/ECBM recovery. The only difference in this scenario compared to the baseline without EOR/ECBM is that a small portion of the electricity generation mix is from one plant retrofitted with CCS in South Africa. Approximately 1 Mton CO2/year is transported from this capture facility to depleted oil and gas fields in Mozambique towards the end of the study horizon. Again, CCS technologies contribute approximately 2 percent of electricity generation across the region.
CO2 Price Scenarios
Three price levels are modeled to investigate their impact on CCS deployment—US$25/ton CO2, US$50/ton CO2, and US$100/ton of CO2. All scenarios assume least-cost capacity additions without the baseline (IRP) build constraints, other than the committed build plans, and so other than the imposed prices are the same as the Reference Scenario. Including a carbon price in the model forces emitting units to buy permits for each ton of CO2 emitted equal to the carbon price, making CO2-emitting technologies more expensive.
The result of applying a US$25/ton of CO2 price is that the share in electricity generation from coal power plants without CCS drops from 86 percent to 61 percent in 2030, while shares of nuclear power and renewables in the electricity mix increase. Electricity generated from coal plants with CCS has a share of 10 percent by 2030, from both new build plants and retrofits, with CO2 stored in depleted South African oil fields and depleted Mozambican oil fields (transported from South Africa). In the US$50/ton CO2 price scenario, the electricity generation mix is similar to the US$25/ton scenario, but with a slightly greater role for coal power generation with CCS, with a share of 12 percent in the electricity generation portfolio by 2030. The amount of CO2 stored is also similar, with the same two storage sites being utilized, and approximately 20 Mt more CO2 cumulatively stored by 2030. Figure 3.3 shows the technology breakdown in the US$100/ton CO2 scenario.
With a CO2 price of US$100/ton, the share of electricity generation from coal without CCS drops from 86 percent to 29 percent in 2030, compared to the Reference Case, and the share of nuclear power generation rises from 5 percent to 28 percent in the same year. Electricity generation fueled by coal with CCS has a share of 15 percent, all from new build plants, since retrofits are more expensive than new builds, while CCGT with CCS makes up 4 percent by 2030.8 Renewables also increase their share to 18 percent by 2030. Figure 3.4 shows the cumulative CO2 stored by storage location.
Three extra storage sites are utilized in this scenario compared to the scenarios with US$25/ton and US$50/ton CO2 prices, namely, in Botswana, Namibia, and South Africa.
In summary, by 2030, a carbon price of US$25/ton CO2 results in a 10 percent share of power plants with CCS in the electricity generation portfolio. With US$50/ton CO2, a 12 percent share is achieved, and with US$100/ton CO2, a 15 percent share is reached.
Summary of Results
Table 3.2 shows the installed capacities by technology across the region for all the scenarios, and Figure 3.5
8 The CCS retrofits option in the model includes retrofitting existing or future plants (mainly those to be constructed by 2020) with CCS. Retrofits are more expensive when considering the initial cost of the original plant, as well as incremental cost of adding the capture component, compared to the new build CCS option. An increase in investment costs of 40 percent is assumed.
Figure 3.3: Electricity Generation Portfolio for Southern African Region—US$100/Ton CO2 Price Scenario
500
0
Elec
tric
ity S
uppl
y (T
Wh)
100
200
300
400
2010 2015 2020 2025 2030
Net Imports Wind HydroSolarCCGT CCS CCGT OCGT
NuclearCoal CCS Coal New
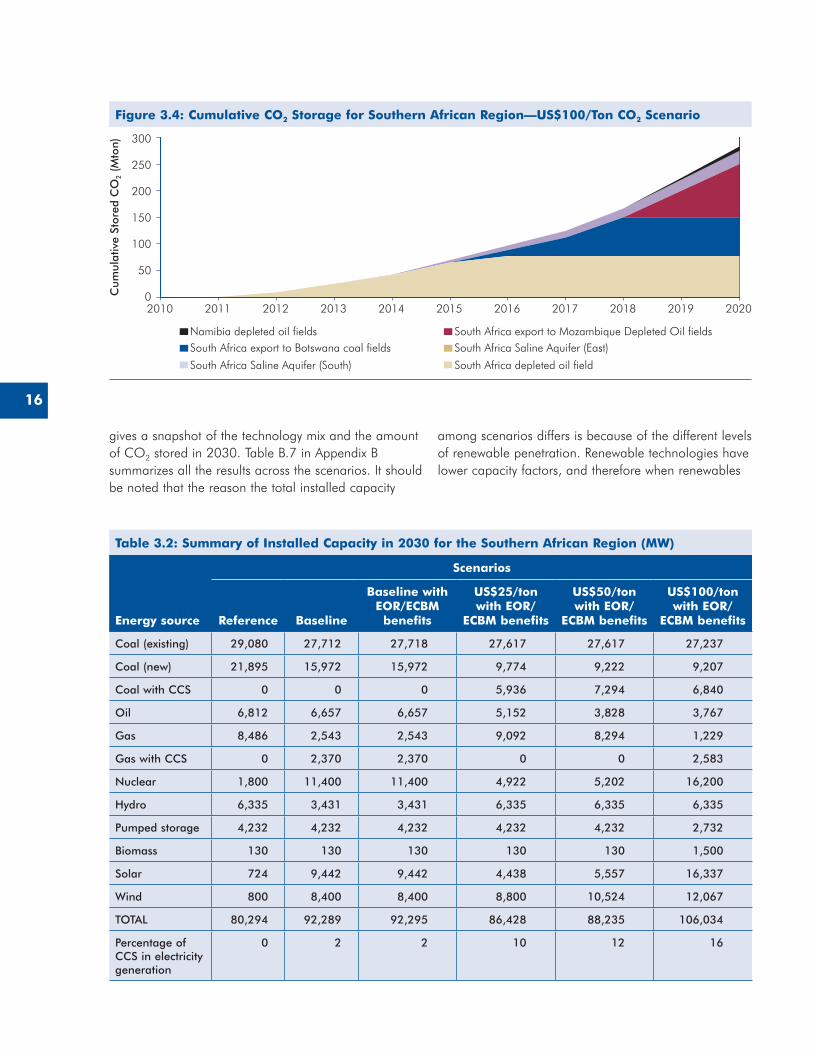
16
gives a snapshot of the technology mix and the amount of CO2 stored in 2030. Table B.7 in Appendix B summarizes all the results across the scenarios. It should be noted that the reason the total installed capacity
among scenarios differs is because of the different levels of renewable penetration. Renewable technologies have lower capacity factors, and therefore when renewables
Figure 3.4: Cumulative CO2 Storage for Southern African Region—US$100/Ton CO2 Scenario
300
0Cum
ulat
ive
Stor
ed C
O2 (
Mto
n)
100
50
150
200
250
2010 2020
Namibia depleted oil fields
2011 2012 2013 2014 2015 2016 2017 2018 2019
South Africa export to Mozambique Depleted Oil fieldsSouth Africa export to Botswana coal fields South Africa Saline Aquifer (East)
South Africa Saline Aquifer (South) South Africa depleted oil field
Table 3.2: Summary of Installed Capacity in 2030 for the Southern African Region (MW)
Energy source
Scenarios
Reference Baseline
Baseline with EOR/ECBM
benefits
US$25/ton with EOR/
ECBM benefits
US$50/ton with EOR/
ECBM benefits
US$100/ton with EOR/
ECBM benefits
Coal (existing) 29,080 27,712 27,718 27,617 27,617 27,237
Coal (new) 21,895 15,972 15,972 9,774 9,222 9,207
Coal with CCS 0 0 0 5,936 7,294 6,840
Oil 6,812 6,657 6,657 5,152 3,828 3,767
Gas 8,486 2,543 2,543 9,092 8,294 1,229
Gas with CCS 0 2,370 2,370 0 0 2,583
Nuclear 1,800 11,400 11,400 4,922 5,202 16,200
Hydro 6,335 3,431 3,431 6,335 6,335 6,335
Pumped storage 4,232 4,232 4,232 4,232 4,232 2,732
Biomass 130 130 130 130 130 1,500
Solar 724 9,442 9,442 4,438 5,557 16,337
Wind 800 8,400 8,400 8,800 10,524 12,067
TOTAL 80,294 92,289 92,295 86,428 88,235 106,034
Percentage of CCS in electricity generation
0 2 2 10 12 16
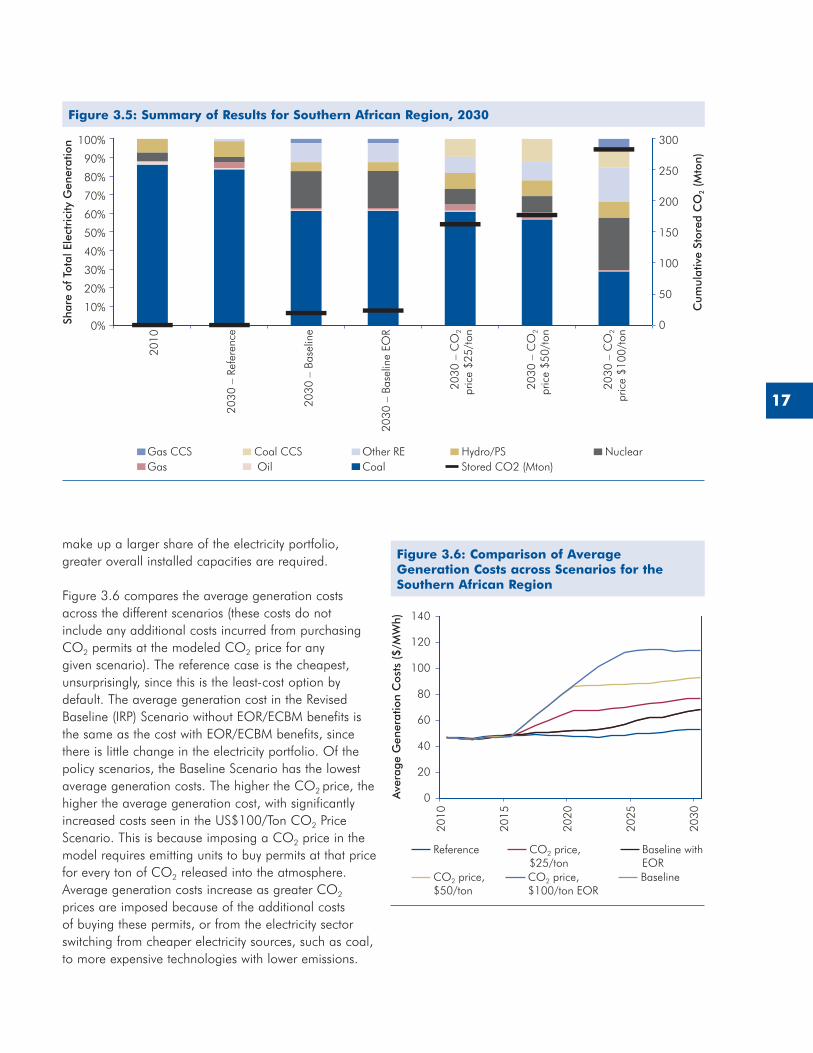
17
make up a larger share of the electricity portfolio, greater overall installed capacities are required.
Figure 3.6 compares the average generation costs across the different scenarios (these costs do not include any additional costs incurred from purchasing CO2 permits at the modeled CO2 price for any given scenario). The reference case is the cheapest, unsurprisingly, since this is the least-cost option by default. The average generation cost in the Revised Baseline (IRP) Scenario without EOR/ECBM benefits is the same as the cost with EOR/ECBM benefits, since there is little change in the electricity portfolio. Of the policy scenarios, the Baseline Scenario has the lowest average generation costs. The higher the CO2 price, the higher the average generation cost, with significantly increased costs seen in the US$100/Ton CO2 Price Scenario. This is because imposing a CO2 price in the model requires emitting units to buy permits at that price for every ton of CO2 released into the atmosphere. Average generation costs increase as greater CO2 prices are imposed because of the additional costs of buying these permits, or from the electricity sector switching from cheaper electricity sources, such as coal, to more expensive technologies with lower emissions.
Figure 3.5: Summary of Results for Southern African Region, 2030
300
0Shar
e of
Tot
al E
lect
rici
ty G
ener
atio
n
Cum
ulat
ive
Stor
ed C
O2 (
Mto
n)
Gas CCS
50
100
150
200
250
0%
10%
20%
30%
40%
50%
60%
70%
80%
90%
100%
Coal CCS Other RE Hydro/PS NuclearGas Oil Coal Stored CO2 (Mton)
2010
2030
– C
O2
pric
e $1
00/t
on
2030
– C
O2
pric
e $5
0/to
n
2030
– C
O2
pric
e $2
5/to
n
2030
– B
asel
ine
EOR
2030
– B
asel
ine
2030
– R
efer
ence
Figure 3.6: Comparison of Average Generation Costs across Scenarios for the Southern African Region
0Ave
rage
Gen
erat
ion
Cos
ts (
$/M
Wh)
Reference Baseline withEOR
CO2 price,$25/ton
CO2 price,$50/ton
CO2 price,$100/ton EOR
Baseline
20
40
60
80
100
120
140
2010
2015
2020
2025
2030
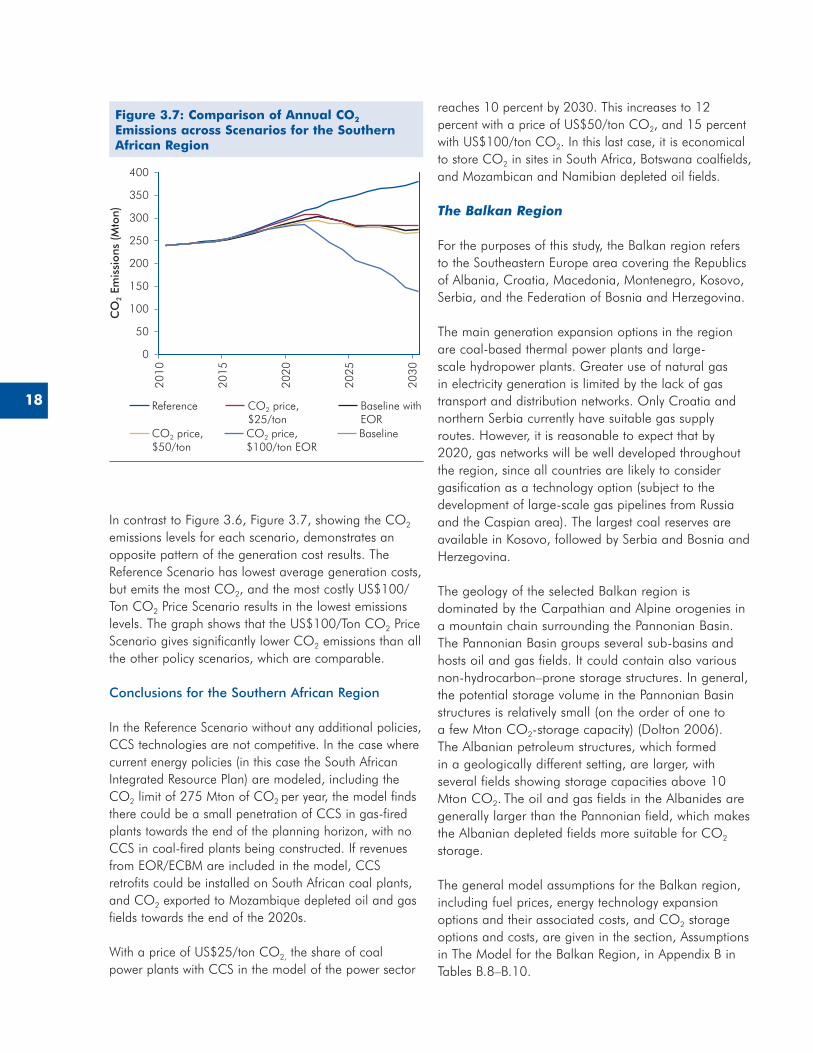
18
In contrast to Figure 3.6, Figure 3.7, showing the CO2 emissions levels for each scenario, demonstrates an opposite pattern of the generation cost results. The Reference Scenario has lowest average generation costs, but emits the most CO2, and the most costly US$100/Ton CO2 Price Scenario results in the lowest emissions levels. The graph shows that the US$100/Ton CO2 Price Scenario gives significantly lower CO2 emissions than all the other policy scenarios, which are comparable.
Conclusions for the Southern African Region
In the Reference Scenario without any additional policies, CCS technologies are not competitive. In the case where current energy policies (in this case the South African Integrated Resource Plan) are modeled, including the CO2 limit of 275 Mton of CO2 per year, the model finds there could be a small penetration of CCS in gas-fired plants towards the end of the planning horizon, with no CCS in coal-fired plants being constructed. If revenues from EOR/ECBM are included in the model, CCS retrofits could be installed on South African coal plants, and CO2 exported to Mozambique depleted oil and gas fields towards the end of the 2020s.
With a price of US$25/ton CO2, the share of coal power plants with CCS in the model of the power sector
reaches 10 percent by 2030. This increases to 12 percent with a price of US$50/ton CO2, and 15 percent with US$100/ton CO2. In this last case, it is economical to store CO2 in sites in South Africa, Botswana coalfields, and Mozambican and Namibian depleted oil fields.
The Balkan Region
For the purposes of this study, the Balkan region refers to the Southeastern Europe area covering the Republics of Albania, Croatia, Macedonia, Montenegro, Kosovo, Serbia, and the Federation of Bosnia and Herzegovina.
The main generation expansion options in the region are coal-based thermal power plants and large-scale hydropower plants. Greater use of natural gas in electricity generation is limited by the lack of gas transport and distribution networks. Only Croatia and northern Serbia currently have suitable gas supply routes. However, it is reasonable to expect that by 2020, gas networks will be well developed throughout the region, since all countries are likely to consider gasification as a technology option (subject to the development of large-scale gas pipelines from Russia and the Caspian area). The largest coal reserves are available in Kosovo, followed by Serbia and Bosnia and Herzegovina.
The geology of the selected Balkan region is dominated by the Carpathian and Alpine orogenies in a mountain chain surrounding the Pannonian Basin. The Pannonian Basin groups several sub-basins and hosts oil and gas fields. It could contain also various non-hydrocarbon–prone storage structures. In general, the potential storage volume in the Pannonian Basin structures is relatively small (on the order of one to a few Mton CO2-storage capacity) (Dolton 2006). The Albanian petroleum structures, which formed in a geologically different setting, are larger, with several fields showing storage capacities above 10 Mton CO2. The oil and gas fields in the Albanides are generally larger than the Pannonian field, which makes the Albanian depleted fields more suitable for CO2 storage.
The general model assumptions for the Balkan region, including fuel prices, energy technology expansion options and their associated costs, and CO2 storage options and costs, are given in the section, Assumptions in The Model for the Balkan Region, in Appendix B in Tables B.8–B.10.
Figure 3.7: Comparison of Annual CO2 Emissions across Scenarios for the Southern African Region
0
CO
2 E
mis
sion
s (M
ton)
Reference Baseline withEOR
CO2 price,$25/ton
CO2 price,$50/ton
CO2 price,$100/ton EOR
Baseline
100
50
150
200
250
300
350
40020
10
2015
2020
2025
2030
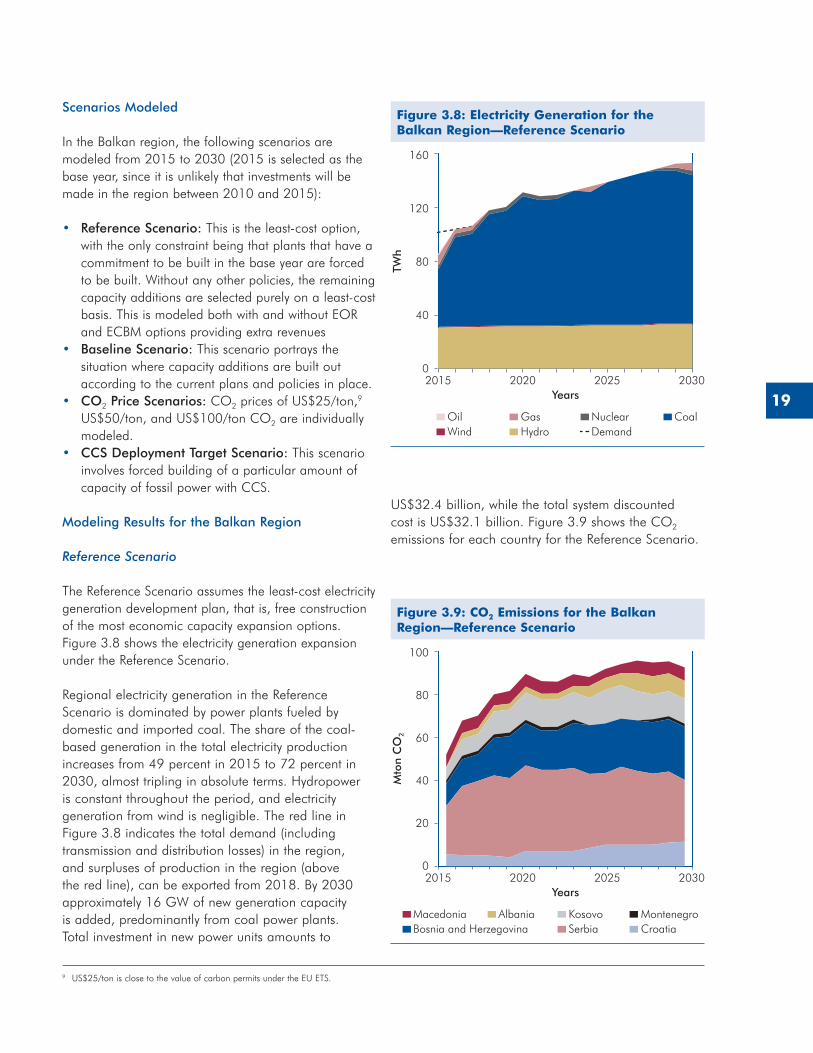
19
US$32.4 billion, while the total system discounted cost is US$32.1 billion. Figure 3.9 shows the CO2 emissions for each country for the Reference Scenario.
Scenarios Modeled
In the Balkan region, the following scenarios are modeled from 2015 to 2030 (2015 is selected as the base year, since it is unlikely that investments will be made in the region between 2010 and 2015):
• Reference Scenario: This is the least-cost option, with the only constraint being that plants that have a commitment to be built in the base year are forced to be built. Without any other policies, the remaining capacity additions are selected purely on a least-cost basis. This is modeled both with and without EOR and ECBM options providing extra revenues
• Baseline Scenario: This scenario portrays the situation where capacity additions are built out according to the current plans and policies in place.
• CO2 Price Scenarios: CO2 prices of US$25/ton,9 US$50/ton, and US$100/ton CO2 are individually modeled.
• CCS Deployment Target Scenario: This scenario involves forced building of a particular amount of capacity of fossil power with CCS.
Modeling Results for the Balkan Region
Reference Scenario
The Reference Scenario assumes the least-cost electricity generation development plan, that is, free construction of the most economic capacity expansion options. Figure 3.8 shows the electricity generation expansion under the Reference Scenario.
Regional electricity generation in the Reference Scenario is dominated by power plants fueled by domestic and imported coal. The share of the coal-based generation in the total electricity production increases from 49 percent in 2015 to 72 percent in 2030, almost tripling in absolute terms. Hydropower is constant throughout the period, and electricity generation from wind is negligible. The red line in Figure 3.8 indicates the total demand (including transmission and distribution losses) in the region, and surpluses of production in the region (above the red line), can be exported from 2018. By 2030 approximately 16 GW of new generation capacity is added, predominantly from coal power plants. Total investment in new power units amounts to
Figure 3.8: Electricity Generation for the Balkan Region—Reference Scenario
0
TWh
40
80
120
160
2015 2020 2025 2030Years
Oil Gas Nuclear CoalWind Hydro Demand
9 US$25/ton is close to the value of carbon permits under the EU ETS.
Figure 3.9: CO2 Emissions for the Balkan Region—Reference Scenario
0
Mto
n C
O2
2015 2020 2025 2030Years
20
40
60
80
100
Macedonia Albania Kosovo MontenegroBosnia and Herzegovina Serbia Croatia
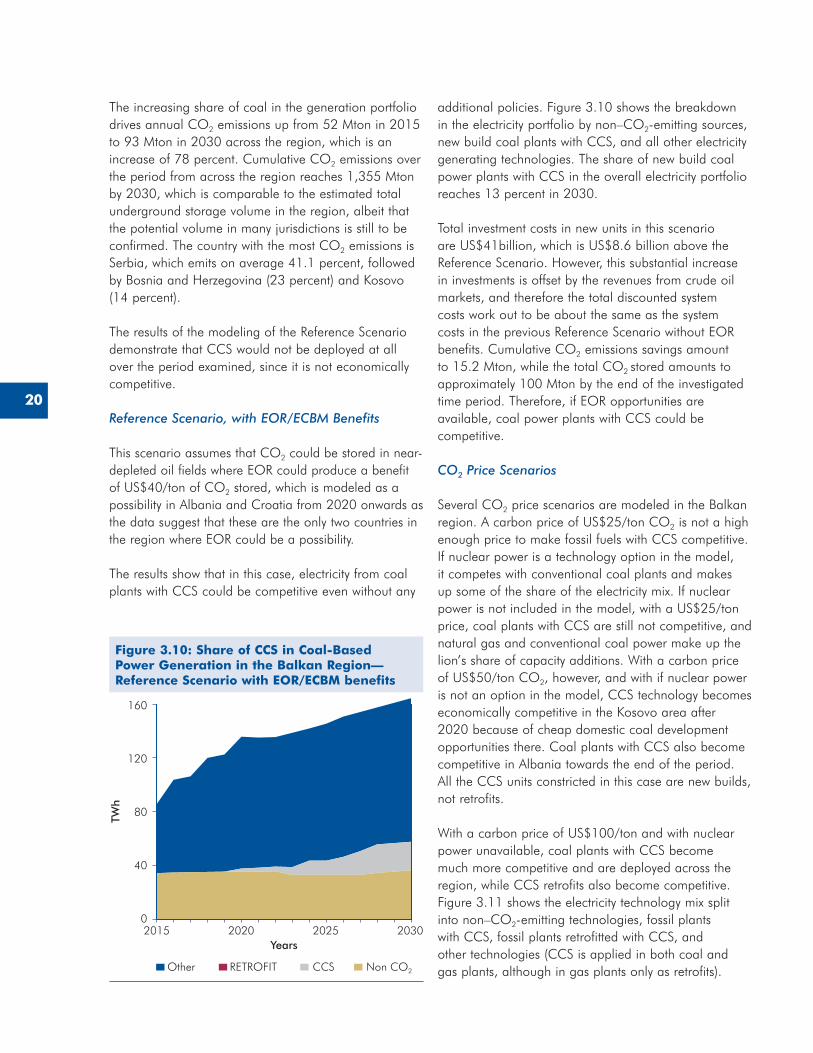
20
The increasing share of coal in the generation portfolio drives annual CO2 emissions up from 52 Mton in 2015 to 93 Mton in 2030 across the region, which is an increase of 78 percent. Cumulative CO2 emissions over the period from across the region reaches 1,355 Mton by 2030, which is comparable to the estimated total underground storage volume in the region, albeit that the potential volume in many jurisdictions is still to be confirmed. The country with the most CO2 emissions is Serbia, which emits on average 41.1 percent, followed by Bosnia and Herzegovina (23 percent) and Kosovo (14 percent).
The results of the modeling of the Reference Scenario demonstrate that CCS would not be deployed at all over the period examined, since it is not economically competitive.
Reference Scenario, with EOR/ECBM Benefits
This scenario assumes that CO2 could be stored in near-depleted oil fields where EOR could produce a benefit of US$40/ton of CO2 stored, which is modeled as a possibility in Albania and Croatia from 2020 onwards as the data suggest that these are the only two countries in the region where EOR could be a possibility.
The results show that in this case, electricity from coal plants with CCS could be competitive even without any
additional policies. Figure 3.10 shows the breakdown in the electricity portfolio by non–CO2-emitting sources, new build coal plants with CCS, and all other electricity generating technologies. The share of new build coal power plants with CCS in the overall electricity portfolio reaches 13 percent in 2030.
Total investment costs in new units in this scenario are US$41billion, which is US$8.6 billion above the Reference Scenario. However, this substantial increase in investments is offset by the revenues from crude oil markets, and therefore the total discounted system costs work out to be about the same as the system costs in the previous Reference Scenario without EOR benefits. Cumulative CO2 emissions savings amount to 15.2 Mton, while the total CO2 stored amounts to approximately 100 Mton by the end of the investigated time period. Therefore, if EOR opportunities are available, coal power plants with CCS could be competitive.
CO2 Price Scenarios
Several CO2 price scenarios are modeled in the Balkan region. A carbon price of US$25/ton CO2 is not a high enough price to make fossil fuels with CCS competitive. If nuclear power is a technology option in the model, it competes with conventional coal plants and makes up some of the share of the electricity mix. If nuclear power is not included in the model, with a US$25/ton price, coal plants with CCS are still not competitive, and natural gas and conventional coal power make up the lion’s share of capacity additions. With a carbon price of US$50/ton CO2, however, and with if nuclear power is not an option in the model, CCS technology becomes economically competitive in the Kosovo area after 2020 because of cheap domestic coal development opportunities there. Coal plants with CCS also become competitive in Albania towards the end of the period. All the CCS units constricted in this case are new builds, not retrofits.
With a carbon price of US$100/ton and with nuclear power unavailable, coal plants with CCS become much more competitive and are deployed across the region, while CCS retrofits also become competitive. Figure 3.11 shows the electricity technology mix split into non–CO2-emitting technologies, fossil plants with CCS, fossil plants retrofitted with CCS, and other technologies (CCS is applied in both coal and gas plants, although in gas plants only as retrofits).
Figure 3.10: Share of CCS in Coal-Based Power Generation in the Balkan Region—Reference Scenario with EOR/ECBM benefits
0
TWh
40
80
120
160
2015 2020 2025 2030Years
Other RETROFIT CCS Non CO2
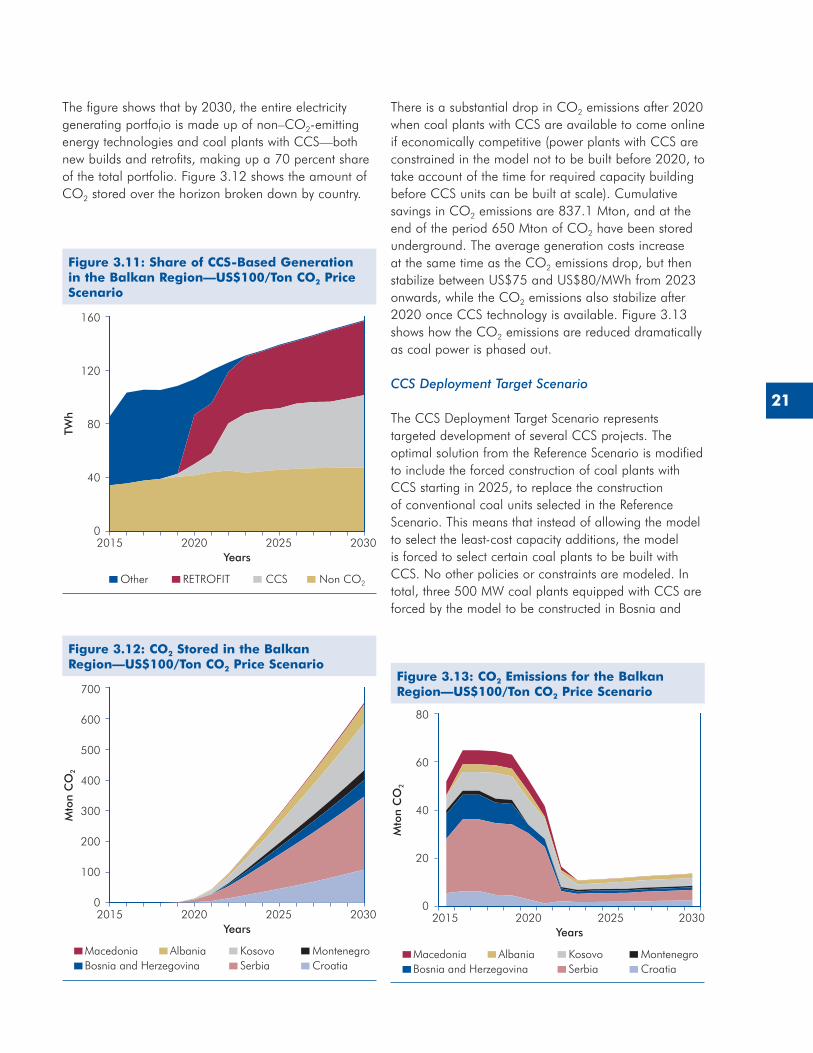
21
The figure shows that by 2030, the entire electricity generating portfolio is made up of non–CO2-emitting energy technologies and coal plants with CCS—both new builds and retrofits, making up a 70 percent share of the total portfolio. Figure 3.12 shows the amount of CO2 stored over the horizon broken down by country.
There is a substantial drop in CO2 emissions after 2020 when coal plants with CCS are available to come online if economically competitive (power plants with CCS are constrained in the model not to be built before 2020, to take account of the time for required capacity building before CCS units can be built at scale). Cumulative savings in CO2 emissions are 837.1 Mton, and at the end of the period 650 Mton of CO2 have been stored underground. The average generation costs increase at the same time as the CO2 emissions drop, but then stabilize between US$75 and US$80/MWh from 2023 onwards, while the CO2 emissions also stabilize after 2020 once CCS technology is available. Figure 3.13 shows how the CO2 emissions are reduced dramatically as coal power is phased out.
CCS Deployment Target Scenario
The CCS Deployment Target Scenario represents targeted development of several CCS projects. The optimal solution from the Reference Scenario is modified to include the forced construction of coal plants with CCS starting in 2025, to replace the construction of conventional coal units selected in the Reference Scenario. This means that instead of allowing the model to select the least-cost capacity additions, the model is forced to select certain coal plants to be built with CCS. No other policies or constraints are modeled. In total, three 500 MW coal plants equipped with CCS are forced by the model to be constructed in Bosnia and
Figure 3.11: Share of CCS-Based Generation in the Balkan Region—US$100/Ton CO2 Price Scenario
0
TWh
40
80
120
160
2015 2020 2025 2030Years
Other RETROFIT CCS Non CO2
Figure 3.12: CO2 Stored in the Balkan Region—US$100/Ton CO2 Price Scenario
0
Mto
n C
O2
2015 2020 2025 2030Years
Macedonia Albania Kosovo MontenegroBosnia and Herzegovina Serbia Croatia
100
200
300
400
500
600
700Figure 3.13: CO2 Emissions for the Balkan Region—US$100/Ton CO2 Price Scenario
0
Mto
n C
O2
2015 2020 2025 2030Years
20
40
60
80
Macedonia Albania Kosovo MontenegroBosnia and Herzegovina Serbia Croatia
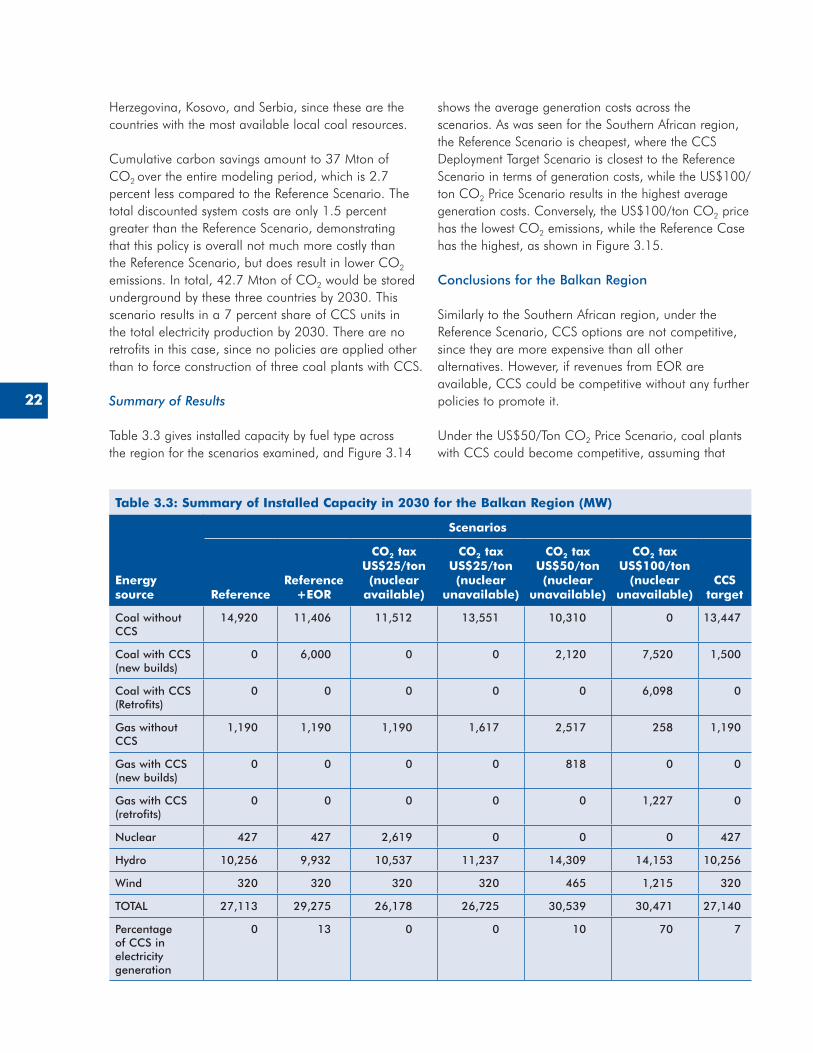
22
Herzegovina, Kosovo, and Serbia, since these are the countries with the most available local coal resources.
Cumulative carbon savings amount to 37 Mton of CO2 over the entire modeling period, which is 2.7 percent less compared to the Reference Scenario. The total discounted system costs are only 1.5 percent greater than the Reference Scenario, demonstrating that this policy is overall not much more costly than the Reference Scenario, but does result in lower CO2 emissions. In total, 42.7 Mton of CO2 would be stored underground by these three countries by 2030. This scenario results in a 7 percent share of CCS units in the total electricity production by 2030. There are no retrofits in this case, since no policies are applied other than to force construction of three coal plants with CCS.
Summary of Results
Table 3.3 gives installed capacity by fuel type across the region for the scenarios examined, and Figure 3.14
shows the average generation costs across the scenarios. As was seen for the Southern African region, the Reference Scenario is cheapest, where the CCS Deployment Target Scenario is closest to the Reference Scenario in terms of generation costs, while the US$100/ton CO2 Price Scenario results in the highest average generation costs. Conversely, the US$100/ton CO2 price has the lowest CO2 emissions, while the Reference Case has the highest, as shown in Figure 3.15.
Conclusions for the Balkan Region
Similarly to the Southern African region, under the Reference Scenario, CCS options are not competitive, since they are more expensive than all other alternatives. However, if revenues from EOR are available, CCS could be competitive without any further policies to promote it.
Under the US$50/Ton CO2 Price Scenario, coal plants with CCS could become competitive, assuming that
Table 3.3: Summary of Installed Capacity in 2030 for the Balkan Region (MW)
Energy source
Scenarios
ReferenceReference
+EOR
CO2 tax US$25/ton (nuclear
available)
CO2 tax US$25/ton (nuclear
unavailable)
CO2 tax US$50/ton (nuclear
unavailable)
CO2 tax US$100/ton
(nuclear unavailable)
CCS target
Coal without CCS
14,920 11,406 11,512 13,551 10,310 0 13,447
Coal with CCS (new builds)
0 6,000 0 0 2,120 7,520 1,500
Coal with CCS (Retrofits)
0 0 0 0 0 6,098 0
Gas without CCS
1,190 1,190 1,190 1,617 2,517 258 1,190
Gas with CCS (new builds)
0 0 0 0 818 0 0
Gas with CCS (retrofits)
0 0 0 0 0 1,227 0
Nuclear 427 427 2,619 0 0 0 427
Hydro 10,256 9,932 10,537 11,237 14,309 14,153 10,256
Wind 320 320 320 320 465 1,215 320
TOTAL 27,113 29,275 26,178 26,725 30,539 30,471 27,140
Percentage of CCS in electricity generation
0 13 0 0 10 70 7
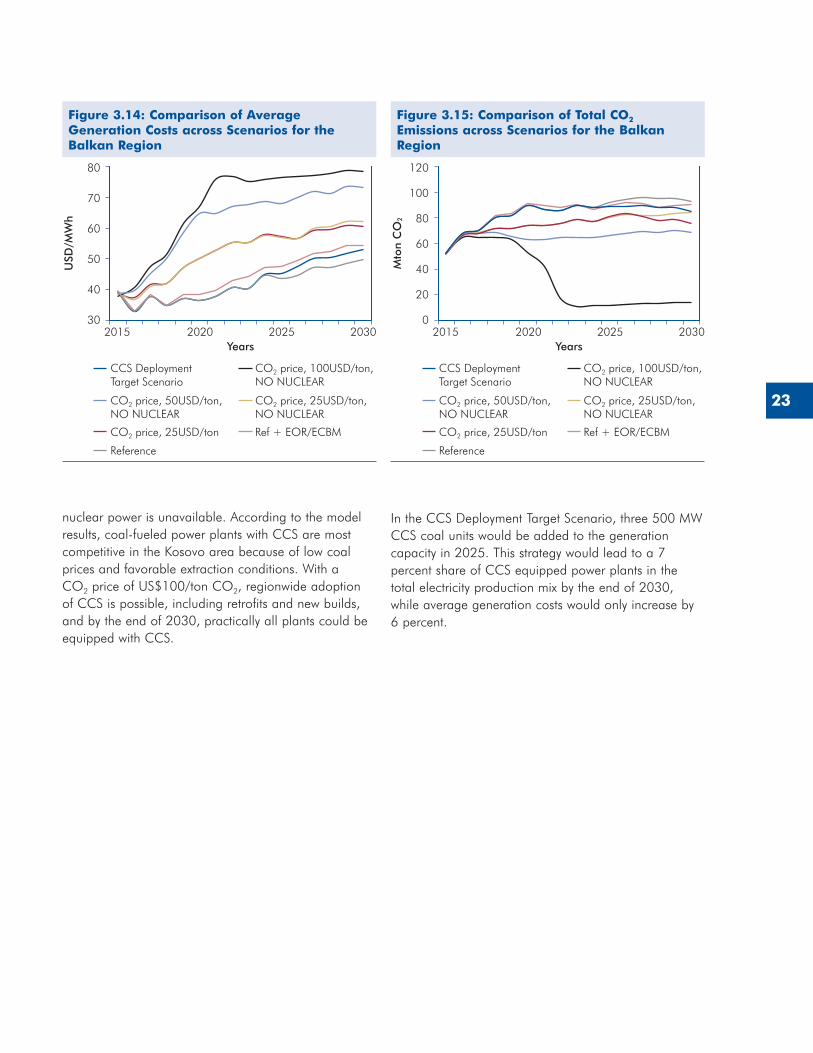
23
nuclear power is unavailable. According to the model results, coal-fueled power plants with CCS are most competitive in the Kosovo area because of low coal prices and favorable extraction conditions. With a CO2 price of US$100/ton CO2, regionwide adoption of CCS is possible, including retrofits and new builds, and by the end of 2030, practically all plants could be equipped with CCS.
In the CCS Deployment Target Scenario, three 500 MW CCS coal units would be added to the generation capacity in 2025. This strategy would lead to a 7 percent share of CCS equipped power plants in the total electricity production mix by the end of 2030, while average generation costs would only increase by 6 percent.
Figure 3.15: Comparison of Total CO2 Emissions across Scenarios for the Balkan Region
0
20
Mto
n C
O2
2015 2020 2025 2030Years
60
40
80
100
120
CCS DeploymentTarget Scenario
CO2 price, 100USD/ton,NO NUCLEAR
CO2 price, 50USD/ton,NO NUCLEAR
CO2 price, 25USD/ton,NO NUCLEAR
CO2 price, 25USD/ton Ref + EOR/ECBM
Reference
Figure 3.14: Comparison of Average Generation Costs across Scenarios for the Balkan Region
30
USD
/MW
h
2015 2020 2025 2030Years
50
40
60
70
80
CCS DeploymentTarget Scenario
CO2 price, 100USD/ton,NO NUCLEAR
CO2 price, 50USD/ton,NO NUCLEAR
CO2 price, 25USD/ton,NO NUCLEAR
CO2 price, 25USD/ton Ref + EOR/ECBM
Reference

25
4. ADDRESSING THE LEGAL AND REGULATORY BARRIERS IN DEVELOPING COUNTRIES
Addressing barriers to CCS deployment in any country involves creation of a regulatory base, among other things, to help reduce potential legal risks related to the implementation of CCS projects to be borne by both public and private sectors. The objective of this chapter is to identify potential challenges to the development of cross-boundary and national CCS projects, and to suggest approaches to remove them. This chapter is based on in-depth reports summarizing the findings for both the Southern Africa and Balkan regions as case studies.10 The analysis is developed based the examination of the existing multilateral, bilateral, and national regulatory and legal frameworks in the Southern African and Balkan regions, and focuses on the following key issues:
1. Classification of CO2 and its legal definition, including proprietary rights of stored CO2.
2. Jurisdiction over the control and management of domestic and cross-boundary pipelines and reservoirs (including monitoring, reporting, and verification requirements).
3. Proprietary rights to cross-boundary CO2 capture and storage sites and facilities.
4. Regulatory and/or licensing (permitting) schemes related to the operation and management of storage and transportation facilities.
5. Long-term management and liability issues arising out of accidents or leaks in domestic and cross-boundary CCS projects.
6. Financial assurance for long-term stewardship, including how long-term responsibility for a storage site is transferred to the relevant authority, and how CCS regulatory frameworks may reduce the financial exposure of the relevant authority by requiring the operator to contribute to the costs associated with long-term stewardship of the site.11
7. Third-party access rights to transportation networks, transit rights, and land rights with regard to pipeline routes.
8. Regulatory compliance and enforcement schemes.9. Environmental impact (including cumulative impact)
assessment process, risk assessment, and public consultation.
This chapter of the report is based on a summary of two analyses of existing regulatory frameworks in the Southern African and Balkan regions. The first section provides a review of the relevant legal instruments at the international and multilateral level that seeks to indicate and identify the relevance of each instrument for CCS and, where possible, the potential implications of the instruments for CCS projects in the Southern African region and Balkan region. The following two sections contain analyses of relevant national legislative and institutional frameworks in Botswana, Mozambique, and South Africa, and Bosnia and Herzegovina, Kosovo, and Serbia, respectively, organized by the key issues listed above.
A summary of key findings on the issues analyzed, along with recommendations for the adoption of national and regional regulatory frameworks that may be applicable to CCS activities,12 are provided in Box 4.1.
Key International and Multilateral Legal Instruments Relevant to CCS Projects
At this stage, there is no international instrument that is dedicated to CCS-related issues. However, certain sectoral agreements and conventions have or may have implications for CCS activities in the Southern African and Balkan regions. In this context, the most relevant conventions or agreements relate mainly to climate change and maritime law, and in particular, conventions concerning the protection of the marine environment.
UNFCCC and the Kyoto Protocol
Recent developments under the 1992 United Nations Framework Convention on Climate Change (UNFCCC) and the 1997 Kyoto Protocol may have important implications for CCS. At the 16th Conference of Parties (COP) in Cancun, Mexico, in December 2010, Decision
10 The country-specific reviews were conducted by independent consultants: Chilume and Company (Botswana); Sal and Caldeira Advogados, LDA (Mozambique); and IMBEWU Sustainability Legal Specialists (Pty) Ltd (South Africa) for the Southern African region; and by Milieu Ltd. for the Balkan region. The reports can be accessed at http://go.worldbank.org/MJIX0TRAB0.
11 This issue was examined only for the Balkan region.12 The recommendations are based on a high level analysis of relevant international and multilateral treaties and laws in the six countries, and it must be noted that laws
in this field are continually evolving at the national, regional and international levels. Therefore, the analyses of laws and the recommendations should be considered accurate as at the date of this report, and the proponents of CCS interventions are advised to revisit the assumptions and conclusions included herein at the time of the interventions.
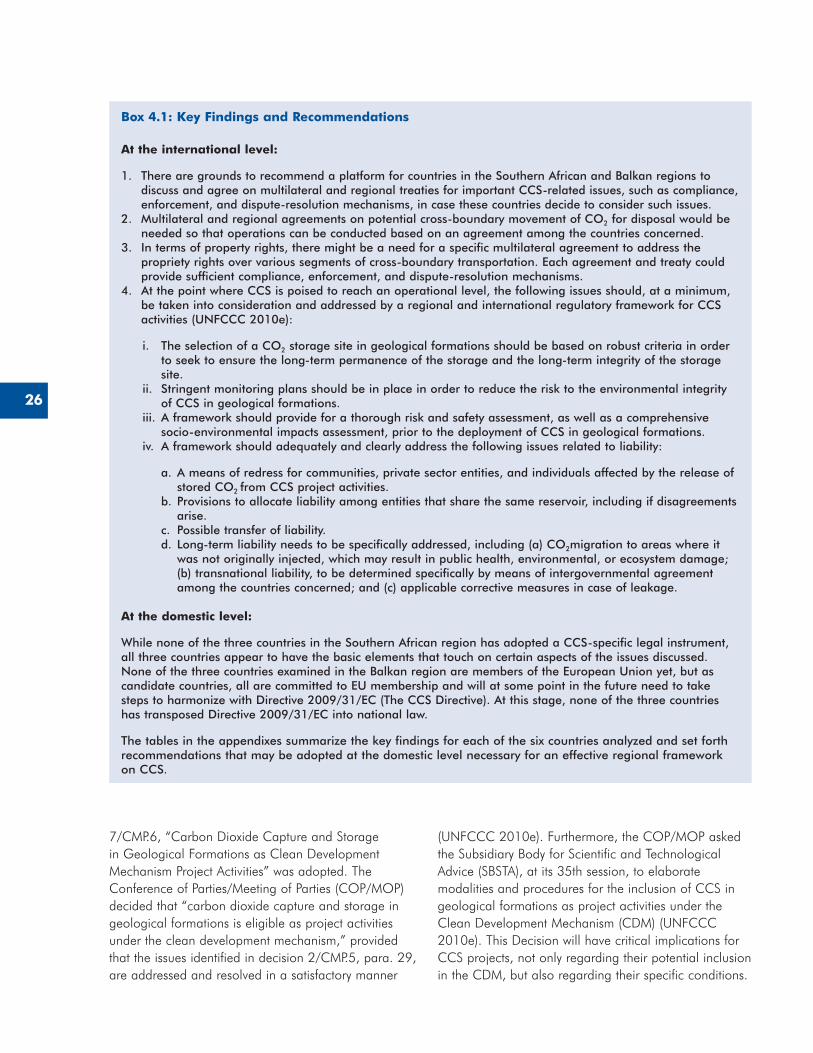
26
7/CMP.6, “Carbon Dioxide Capture and Storage in Geological Formations as Clean Development Mechanism Project Activities” was adopted. The Conference of Parties/Meeting of Parties (COP/MOP) decided that “carbon dioxide capture and storage in geological formations is eligible as project activities under the clean development mechanism,” provided that the issues identified in decision 2/CMP.5, para. 29, are addressed and resolved in a satisfactory manner
(UNFCCC 2010e). Furthermore, the COP/MOP asked the Subsidiary Body for Scientific and Technological Advice (SBSTA), at its 35th session, to elaborate modalities and procedures for the inclusion of CCS in geological formations as project activities under the Clean Development Mechanism (CDM) (UNFCCC 2010e). This Decision will have critical implications for CCS projects, not only regarding their potential inclusion in the CDM, but also regarding their specific conditions.
Box 4.1: Key Findings and Recommendations
At the international level:
1� There are grounds to recommend a platform for countries in the Southern African and Balkan regions to discuss and agree on multilateral and regional treaties for important CCS-related issues, such as compliance, enforcement, and dispute-resolution mechanisms, in case these countries decide to consider such issues�
2� Multilateral and regional agreements on potential cross-boundary movement of CO2 for disposal would be needed so that operations can be conducted based on an agreement among the countries concerned�
3� In terms of property rights, there might be a need for a specific multilateral agreement to address the propriety rights over various segments of cross-boundary transportation� Each agreement and treaty could provide sufficient compliance, enforcement, and dispute-resolution mechanisms�
4� At the point where CCS is poised to reach an operational level, the following issues should, at a minimum, be taken into consideration and addressed by a regional and international regulatory framework for CCS activities (UNFCCC 2010e):
i� The selection of a CO2 storage site in geological formations should be based on robust criteria in order to seek to ensure the long-term permanence of the storage and the long-term integrity of the storage site�
ii� Stringent monitoring plans should be in place in order to reduce the risk to the environmental integrity of CCS in geological formations�
iii� A framework should provide for a thorough risk and safety assessment, as well as a comprehensive socio-environmental impacts assessment, prior to the deployment of CCS in geological formations�
iv� A framework should adequately and clearly address the following issues related to liability:
a� A means of redress for communities, private sector entities, and individuals affected by the release of stored CO2 from CCS project activities�
b� Provisions to allocate liability among entities that share the same reservoir, including if disagreements arise�
c� Possible transfer of liability�d� Long-term liability needs to be specifically addressed, including (a) CO2migration to areas where it
was not originally injected, which may result in public health, environmental, or ecosystem damage; (b) transnational liability, to be determined specifically by means of intergovernmental agreement among the countries concerned; and (c) applicable corrective measures in case of leakage�
At the domestic level:
While none of the three countries in the Southern African region has adopted a CCS-specific legal instrument, all three countries appear to have the basic elements that touch on certain aspects of the issues discussed� None of the three countries examined in the Balkan region are members of the European Union yet, but as candidate countries, all are committed to EU membership and will at some point in the future need to take steps to harmonize with Directive 2009/31/EC (The CCS Directive)� At this stage, none of the three countries has transposed Directive 2009/31/EC into national law�
The tables in the appendixes summarize the key findings for each of the six countries analyzed and set forth recommendations that may be adopted at the domestic level necessary for an effective regional framework on CCS�
27
United Nations Convention on the Law of the Sea, 1982
The United Nations Convention on the Law of the Sea (UNCLOS) sets the limit of various zones, such as internal waters, territorial waters, archipelagic waters, contiguous zones, exclusive economic zones (EEZs), and the continental shelf. In essence, coastal states have jurisdiction over their territorial sea, EEZ, and continental shelf, and may therefore prescribe regulations within these areas (UNCLOS, article 21).13 It has been argued that a country has sovereign rights to use underground aquifers and reservoirs on the continental shelf and in the EEZ for injection of CO2 for both depositing purposes and enhanced oil recovery (Solomon and others 2007, p. 6). However, for oil and gas reservoirs, including aquifers in the continental shelf that are shared with neighboring countries, it has been argued that a country cannot unilaterally decide to use such reservoirs and aquifers for CO2 injection without an agreement among the parties, and such an approach might also apply to inland reservoirs (Solomon and others 2007, p. 6). UNCLOS, however, is silent on the rights of coastal states in relation to disposal of CO2 via pipeline into the EEZ or continental shelf. With regards to the high seas, CO2 disposal is a freedom that may be exercised by all states provided that they have due regard to the interests of other states and the requirements of international law (de Coninck and others 2006). Furthermore, in order to protect the marine environment from pollution, UNCLOS requires states “not to transfer, directly or indirectly, damage or hazards from one area to another” (UNCLOS 1982, Art. 195). At present, there is no conclusive opinion as to whether CO2 is considered a hazardous substance under UNCLOS. If CO2 is defined in this way, it may prevent states from transporting CO2
from the capture site to an offshore storage site.
Convention on the Prevention of Marine Pollution by Dumping of Wastes and Other Matter 1972 (London Convention)
The London Convention was one of the first international conventions to protect the marine environment from human activities and has been in force since 1975. In 2006, the Contracting Parties to the 1996 Protocol of the London Convention adopted amendments that allow and regulate the storage of CO2 streams from
CO2 capture processes in geological formations under the seabed. Specifically, it provides that “carbon dioxide streams from carbon dioxide capture processes for sequestration” can be stored if they meet three criteria: (a) disposal is into a sub-seabed geological formation; (b) the CO2 stream is of high purity containing only incidental amounts of associated substances; and (c) no wastes or other matter are added for the purpose of disposing of those wastes or other matter (London Protocol 1996). This Protocol was welcomed as an important step towards addressing the legal uncertainty surrounding CCS and is regarded by some scholars as the first international law explicitly addressing carbon sequestration in international waters and a step towards creating a positive international legal framework for CCS activities (WRI 2006).
Basel Convention on the Control of Trans-Boundary Movements of Hazardous Wastes and Their Disposal, 1989 (Basel Convention)
The Basel Convention imposes strict requirements on trans-boundary movements of hazardous waste, such as prior written notice by the state of export to the competent authorities of the state of import and transit, consent, and tracking of waste movements. The Basel Convention places outright bans on the export of hazardous wastes to certain countries. Cross-boundary movements are permissible if the state of export does not have the capability to manage or dispose of the hazardous waste in an environmentally sound manner. A cross-boundary movement of CO2 might trigger the application of the Basel Convention, although this is not yet certain, since CCS has not been considered in the context of this Convention. When it is considered, the key issue will be on the classification of CO2 and whether it should be considered a hazardous waste under the Convention.
A summary of the legal obligations of the reviewed countries under the above international treaties is provided in Table C.1 in Appendix C.
Review of Regional and National Legal Regimes Applicable to CCS Activities in the Southern African Region
This section is based on the 2011 World Bank report examining the relevant legal frameworks applicable
13 See, for example, UNCLOS 1982, Article 21, describing the rights of coastal states to adopt certain types of laws and regulations.
28
to CCS in the Southern African region (World Bank 2011c).
Regional Framework
Botswana, Mozambique, and South Africa are members of the Southern African Power Pool (SAPP)14 and the Southern African Development Community (SADC).15 Mozambique and South Africa also participate in the Regional Electricity Regulators Association of Southern Africa, which was established by SADC as a formal association of electricity regulators in July 2002 in terms of the SADC Protocol on Energy (1996), the SADC Energy Cooperation Policy and Strategy (1996), the SADC Energy Sector Action Plan (1997), and the SADC Energy Activity Plan (2000) in pursuit of the broader initiative of the New Partnership for Africa’s Development and the African Energy Commission (AFREC). The Regional Electricity Regulators Association of Southern Africa aims to facilitate the harmonization of regulatory policies, legislation, standards, and practices, and serves as a platform for effective cooperation among energy regulators within the SADC region.
National Frameworks
While none of the three countries has conducted a comprehensive review of existing regulatory frameworks for relevance to CCS, these countries all have relevant legislation that may be applicable to some aspects of CCS activities. This section of the report highlights the most relevant legal instruments that may be potentially applicable to CCS activities.
The Classification of CO2 and Its Legal Definition, Including the Proprietary Rights of Stored CO2
Legal Definition of CO2
There is no CCS-specific legislation in Botswana, Mozambique, or South Africa that defines “CO2” for the
purposes of CCS. The analyses of relevant legislation in the three countries suggest that CO2 could potentially be classified in the existing laws as a noxious or offensive gas, certain types of “waste,” or a dangerous good for the purposes of transport.
In Botswana, for example, under the Atmospheric Pollution (Prevention) Act (APA) (APA, Chapter 65:03), CO2 is not expressly included under the list of “noxious or offensive gases.”16 However, such gases include “any other gas, fumes or particular matter prescribed as noxious or offensive gas for the purposes of the Act.” The list of gases included as “noxious or offensive” under the Act are mostly produced as a by-product of industrial processes. Therefore, it is possible that CO2
in the context of CCS purposes may be prescribed as a “noxious or offensive” gas. Under the Waste Management Act (WMA), CO2 may be characterized as a “waste,” which is defined as “undesirable or superfluous by-products, any residue or remainder of any process or activity or any gaseous, liquid or solid matter” (see WMA).
In Mozambique, the Regulation on Waste Management (RWM), the primary law governing wastes, defines “Hazardous Waste” (HW) as containing risk characteristics because of its flammable, explosive, corrosive, toxic, infectious or radioactive nature, or because of the presence of any other characteristic that poses danger to life or health of humans and other living beings and to the quality of the environment (RWM 2006).17 Characteristics of HWs are duly identified in Annex III to the RWM, which include “substances consisting of compressed gases, liquefied or under pressure.” These substances are gases that are hazardous by virtue of being compressed or liquefied, dissolved under pressure, or refrigerated (ELI, Annex III, Item 2.H2). Based on (a) the definition of HWs cited above, and because CO2 is known to affect the quality of the environment; and (b) the fact that CCS involves carbon compression and liquefaction, which could make it potentially
14 SAPP has not developed any specific guidelines or agreements related to CCS. However, the SAPP has developed documentation for a number of environmental issues, which may be relevant for CCS, such as Environmental and Social Impact Assessment Guidelines For Transmission infrastructure for the SAPP Region, Guidelines for Environmental Impact Assessment (EIA) for Thermal Power Plants, SAPP Guidelines on the Management of Oil Spills, and Guidelines for Environmental and Social Impact Assessments for Hydro Projects in SAPP Region.
15 SADC has no protocol or agreement dealing specifically with CCS, although some of its protocols could potentially be relevant, to some extent, for CCS activities. These include, for example, Protocol on Shared Watercourse Systems in the SADC, 1997, Protocol on Mining in the SADC, 1999, Protocol on Energy in the SADC region, 1999, and Revised Protocol on Shared Watercourses in the SADC, 2002.
16 The “noxious or offensive gases” are defined as “any of the following groups of compounds when in the form of gas, namely hydrocarbons;…and any other gas, fumes or particular matter prescribed as noxious or offensive gas for the purposes of the Act; and includes dust from asbestos treatment or mining” (emphasis added).
17 Further, the Environmental Law defines “hazardous waste” as substances or objects that are disposed or are intended to be disposed, or are required, by law, to be disposed and which contain risk features given it flammable, explosive, corrosive, toxic, infectious or radioactive nature, or present any other feature that endangers mankind’s or other living beings’ life or health, or environmental quality (ELI).
29
dangerous, CO2 may be treated as a hazardous waste under the RWM.
In South Africa, in the absence of a carbon market, CO2 may fall under the definition of a “waste.” The National Environmental Management: Waste Management Act 59 of 2008 (NEM: WA) defines “waste” as “any substance” “that is surplus, unwanted, rejected, discarded, abandoned or disposed of;” “which the generator has no further use of for the purposes of production;” and “that must be treated or disposed of.” Furthermore, the South African National Standards (SANS) 10228 (2006) deals with the identification and classification of dangerous substances and goods for transport, and it classifies CO2 as a “Class 2 dangerous good” (Division 2.2 of Class 2), which is a gas that is nonflammable and nontoxic, as well as also either an asphyxiant or an oxidizing gas.
Proprietary Rights over Stored CO2
The concept of propriety rights or “ownership” of stored CO2 (CO2 that has been injected into the subsurface for the purposes of long-term sequestration) has not been specifically provided for in the legislation in any of the three countries. However, relevant legislation includes the regime applicable to the subsurface rights in the minerals and petroleum context. For example, in South Africa, the Mineral and Petroleum Resources Development Act 28 of 2002 (MPRDA) regulates rights with regards to minerals and petroleum and the mining and production (winning) thereof from the Earth. However, in its current formulation, these mining laws are unlikely to be applicable to CO2 captured from power generation or other processes for the purposes of long-term storage, among other things, for the reasons that (a) such substance is not a “mineral” in terms of the laws’ definition thereof;18 and (b) the injection of such substance into the subsurface does not constitute the “winning of a mineral.”19 Similar provisions are also in mining laws of Botswana (Mines and Minerals Act) and Mozambique (Mines and Minerals Act 2002; Regulation on the Mining Law 2002), and are not likely to be applicable in their current form, for the same reasons.
Jurisdiction over the Control and Management of Domestic and Cross-Boundary Pipelines and Reservoirs, Including Monitoring, Reporting, and Verification Requirements
In Botswana, the Water Act may be relevant to the cross-boundary CCS pipelines. Under this Act, the Water Apportionment Board has the power to create servitudes to build pipelines to transport water from the dams. The Board may negotiate compensation with those where land is acquired compulsorily to build pipelines. The same occurs in tribal areas, but through the Water Authorities, which are local authorities. Similar arrangement may be adopted for CCS pipelines.
In Mozambique, Decree N. 24/2004 (Petroleum Operations Regulations) may be relevant for CCS operation. The Decree includes provisions on oil and gas pipeline systems and establishes rules, among others, on pipeline operator approval, insurance, design and construction, risk analysis, environmental protection, site and route selection, and safety (Petroleum Operations Regulations 2004). Similar provisions may be adopted for CCS pipelines. The RWM may also be relevant, if as discussed above, CO2 is considered a “waste” or “hazardous waste” in Mozambique. The legislation currently focuses on the transportation of waste by mobile equipment (that is, vehicles) only, and not by pipelines.
In South Africa, the relevant legislation is the law applicable to the transportation of specific types of substances and “wastes” in pipelines if CO2 is classified as a waste. These include the Gas Act 48 of 2001 and the National Environmental Management Act. Typically, some form of approval or authorization is required prior to the construction of such pipelines, and relevant administrative authority would impose monitoring and reporting requirements and mechanisms to facilitate verification of legal compliance. Furthermore, the National Environmental Management: Integrated Coastal Management Act (NEM: ICMA 2008) extends the general duty of care to “the operator of a pipeline that ends in the coastal zone”.
18 The definition of “minerals” in the MPRDA is: “any substance, whether in solid, liquid or gaseous form, occurring naturally in or on the earth or in or under water and which was formed by or subjected to a geological process, and includes sand, stone, rock, gravel, clay, soil and any mineral occurring in residue stockpiles or in residue deposits….”
19 This applies unless there is enhanced oil recovery or enhanced coalbed methane recovery.
30
Proprietary Rights to Cross-Boundary CCS Sites and Facilities
In Botswana, for the acquisition of a CCS site, the relevant legislation, the State Land Act and Tribal Land Act, relates to land acquisition. Generally, if a project is deemed to be of benefit to Botswana, land can be allocated to the project holders by the responsible minister. The land so allocated remains state land and the user shall be granted a lease for a defined period (a period of either 50 years or 99 years). Such allocation often requires a prior fulfillment of environmental impact assessment (EIA) requirements for necessary licenses.
In Mozambique, the Civil Code provides that in the case of construction of immovable goods (hereinafter “works”),20 the property right belongs to the owner of the works provided that it holds land use rights. The property rights over immovable goods covers the airspace corresponding to the surface, as well as the subsurface, including the content in the said immovable goods, except if otherwise provided by law (Civil Code 1967). Therefore, it appears that the property rights over CO2 storage sites and facilities would belong to the owner of works. Because the property right would also cover the content in the storage sites or facilities, the property right over CO2 itself would likely belong to the owner of such infrastructures, unless otherwise is stipulated by law or contract.
In South Africa, property rights to potential CCS sites and facilities are not clearly defined. However, under NEM: ICMA (2008), if a CCS project is located in a coastal area, it can be stipulated that the site is held in trust by the state on behalf of the citizens. Furthermore, under the common law principle of cuius est solum, that is, whoever owns the soil, “it is their[s] up to the heavens and down to hell,” it appears that the owner of the soil should also own the subsoil and the elements comprising the subsoil. This principle has been applied by the South African courts to grant subsurface right to the land owner (London and SA Exploration Co v Rouliot 1891).
Regulatory and Licensing (Permitting) Schemes Related to the Operation and Management of Storage and Transportation Facilities
This section divides the discussion by the types of licensing and permitting requirements to protect the environment that are most relevant for CCS.
License Requirements Related to Waste and Hazardous Waste Management
In Botswana, under WMA, trans-boundary movement of waste refers to the import and export of waste into or from Botswana or the transit of waste in Botswana. If CO2 is classified as a “waste” under this Act, a waste carrier license may be required for any such movements of “waste” (CO2) in Botswana or for trans-boundary movements thereof. In Mozambique, under the RWM, CO2 is likely be characterized as an HW (RWM 2006). The RWM provides that the entities engaged in the disposal, recovery, or recycling of waste must prove, by risk assessment conducted during the development of waste management plan, the environmental feasibility of the operation of treatment, disposal, or recovery, as the case may be. The facilities referred to above are subject to environmental licensing under the Decree N. 45/2004 (see REIAP). In South Africa, under NEM: WA, it is likely that CO2 will be classified as “waste.” The Act provides that the holder21 of waste must, within all reasonable measures, avoid the generation of waste and, where it cannot be avoided, minimize the toxicity and amount of waste generated. The person transporting the waste must also take all reasonable measures to ensure that no spillage or littering of waste occurs while transporting such waste.22
Licensing Requirements Related to Water Pollution
In Botswana, the Water Act provides that “no person shall divert, dam, store, abstract, use, or discharge any effluent into public water or for any such purpose construct any works, except in accordance with a water right granted under this Act” (Water Act, Laws of Botswana, Article 9). Such a right may be granted by the Water Apportionment Board, which would specify
20 Pipelines would be classified as immovable goods.21 In terms of section 1 of NEM: WA. a “holder of waste” means any person who imports, generates, stores, accumulates, transports, processes, treats, or exports waste or
disposes of waste.22 In July 2009, the Minister published a list of waste management activities (GN 718), under which any person who wishes to commence, undertake or conduct a waste
management activity must apply for and be issued with an appropriate waste management license.
31
the quantity, period, and the purpose for which such a water right is granted (Water Act, Laws of Botswana, Articles 9 and 15). Any holder of a water right who contravenes or who fails to comply with any condition implied in a water right shall be liable to the penalties prescribed in the Act (Water Act, Laws of Botswana, Articles 9 and 17).
In Mozambique, Regulations on Environmental Quality Standards and Effluent Emissions (REQSEE) require emission or discharge sites to be approved for environmental licensing. Annex III of the REQSEE establishes the parameters and limits for discharge of liquid effluents by industries, including thermal power plants, although they do not refer to CO2. Furthermore, Law N. 16/91 (The Water Law, or WL) requires all activities that are likely to cause contamination and degradation of the public water domain, in particular the discharge of wastewater, other wastes or substances into the water, to be licensed by regional water administrations. Such activities shall be subject to standards on effluent quality (Water act, Laws of Botswana, Articles 9 and 54).
In South Africa, the National Water Act 36 of 1998 (NWA) states that the national Government is the “public trustee” of all of the nation’s water resources and therefore has the power to regulate the use, flow, and control of all water resources. Accordingly, authorization is required for water uses (NWA 1998). If it is determined that a license is required for a use, a person must apply for a license, and may also be required to undertake an environmental or other assessment, which may be subject to independent review.
Licensing Requirements Related to Air Pollution
In Botswana, APA prohibits a person from carrying out an industrial process23 on any premises that may involve the emission into the atmosphere of an “objectionable matter” without a registration certificate. If CO2 falls in the definition of an “objectionable matter,” as discussed above, such a registration certificate may be required. In Mozambique, the REQSEE defines air pollutants as “substances or energy that exert harmful action likely to endanger human health, cause harm to living resources and
ecosystems, damage material goods, and threaten or impair the recreational value or other legitimate uses of environmental elements” (REQSEE, Article 1, para. 17). Annex II of the REQSEE establishes the standards to be observed by industrial facilities, including thermal power plants, with regard to emission of air pollutants (REQSEE, Article 8). A similar license would be required for emission of air pollutants. In South Africa, the relevant legislation is the National Environmental Management: Air Quality Act 39 of 2004 (NEM: AQA). NEM: AQA provides that the minister must publish a “list of activities” that result in atmospheric emissions and that may have a significant detrimental effect on the environment, including health, social conditions, economic conditions, ecological conditions, or cultural heritage. Subject to the transitional provisions contained in Section 61 of the Act, a provisional atmospheric emission license (AEL) is required to undertake the published “listed activities,” some of which may be relevant for CO2-generating activities (“List of Activities Which Have or May Have a Significant Detrimental Effect on the Environment, Including Health, Social Conditions, Economic Conditions, Ecological Conditions or Cultural Heritage”, 2010).
Long-Term Management and Liability Issues Arising from Incidents or Leaks in Domestic and Cross-Boundary CCS Projects
In Botswana, the Environmental Impact Assessment Act (EIA Act) provides that the person responsible for the negative environmental impact shall rehabilitate the affected environment to its normal function. Furthermore, under the Mines and Minerals Act (MMA), the holder of a license is obliged to conduct the operations in accordance with good mining industry practice and to preserve the natural environment, minimize and control waste, prevent loss of biological resources, and treat pollution or contamination of the environment (see MMA). An EIA is required as part of the Project Feasibility Study Report, and a holder of a license shall rehabilitate or reclaim the mining area from time to time. Where government carries out restoration on behalf of the holder, he or she shall reimburse the government for any costs incurred. Noncompliance with the provisions of MMA is a criminal offense with penalties.
23 Industrial process is defined as “a process prescribed by the Minister which is involved in trade, occupation or manufacture devoted to production by physical, mechanical, electrical, chemical or thermal means, including…operations to generate power and ancillary operations.”
32
In Mozambique, Environmental Law requires persons conducting certain activities to meet their liability obligations, which must be covered by appropriate insurance policies against any damages caused. These obligations include the duty to indemnify the injured parties, regardless of fault, for damages to the environment or for causing temporary or definitive interruption of economic activities. It also provides for proactive action by the state, if so required, by means of adoption of necessary measures to prevent, mitigate, or eliminate any serious damage to the environment (ELI, Article 20). However, there is no provision for transnational liability, which raises uncertainty as to who is liable in the event of damage resulting from the trans-boundary movement of hazardous wastes and other wastes and their disposal, including illegal traffic in those wastes.
In South Africa, the National Environmental Management Act (NEMA) imposes a duty of care on every person who causes, has caused, or may cause significant pollution or environmental degradation to take reasonable measures to prevent such pollution from occurring, continuing, or recurring. The Act also requires that, insofar as harm to the environment is authorized by law or cannot reasonably be avoided or stopped, measures should be taken to minimize and rectify such pollution or degradation of the environment.24 This broad form of potential liability may be applicable to South African CCS projects. With respect to “waste” under NEM: WA, it is important to recognize that the contaminated land provisions under the Act have retrospective effect,25 and that they apply to contamination that originated on land other than the land that becomes contaminated, and to contamination that arises or is likely to arise at a different time from the actual activity that caused the contamination, or arises through an act or activity of a person that results in a change to pre-existing contamination. The landowner must take necessary steps set out in order to remediate the contaminated land. These contaminated land provisions may apply to CO2 leaks.
Third-Party Access Rights to Transportation Networks, Transit Rights, and Land Rights for Pipeline Routes
In Mozambique, with regard to third-party access to pipelines, Law No. 03/2001 (Petroleum Law) provides for the conclusion of contracts for purposes of establishing and operating oil or gas pipelines (Petroleum Law, Article 17, clause (b)). It also provides for access to such pipelines by third parties by requiring the holders of pipeline rights to transport, without discrimination and in commercially acceptable terms, oil belonging to third parties, provided that the pipeline system has sufficient capacity and that there are no unsolvable technical problems that may hinder the satisfaction of third parties’ demands (Petroleum Law, Article 18, para. 1). In case the capacity of the pipeline system is not sufficient, the respective holder of rights is required to increase the capacity, provided that it does not cause an adverse effect on the technical integrity or safe operation of the system, and that the third parties have secured funds to meet the costs of the increased capacity (Petroleum Law, Article 18, para. 2).
In South Africa, although the Gas Act and regulations thereunder are not applicable to CO2 transported by pipeline, this Act and regulations make provision for third-party access to hydrocarbon pipelines, and these provisions may serve as an indicator of the future architecture for regulating pipelines in the CCS context in South Africa.26 Concerning transmission pipelines and storage facilities, the Regulations state that the allocation mechanism to ensure third-party access to uncommitted capacity27 must comply with the following principles: (a) use it or lose it, taking into account diurnal and seasonal load profiles; (b) nondiscrimination; (c) defined time periods; and (d) technical feasibility.
In Botswana, while there are no specific laws identified that regulate third-party access rights, it is likely that a contract law, similar to that in Mozambique and South Africa, would generally govern such third-party access rights.
24 The persons on whom the NEMA imposes an obligation to take “reasonable measures” include an owner of land or premises, a person in control of land or premises, or a person who has the right to use the land or premises on which or in which any activity or process is or was performed or undertaken or any other situation exists, which causes, has caused or is likely to cause significant pollution or degradation of the environment.
25 NEM: WA section 35 provides that Part 5 of NEM: WA applies to the contamination of land even if the contamination occurred before the commencement of the Act.26 According to the Gas Act, a licensee may “lay and construct pipes for the distribution of gas under or over any such street, and may from time to time repair, alter or
remove any pipes so laid or constructed within its licensed area of supply.” Moreover, the Piped Gas Regulations (GN 321 of 20 April 2007) make provision for third party access to transmission pipelines and to storage facilities.
27 “Uncommitted capacity” means such capacity determined by the gas regulator in a transmission, storage, or distribution facility, since is not required to meet contractual obligations.
33
Regulatory Compliance and Enforcement Scheme
In Botswana, an authorized officer is provided with inspection powers to ascertain compliance of holders with requirements of various licenses, including under MMA, APA, and the Public Health Act. Furthermore, the EIA Act provides for inspectors to have access to a site in order to evaluate compliance with the Act and the residual environmental impact of the existing activity, the effectiveness of mitigation measures, and functioning of monitoring mechanisms. The Act also provides for powers of entry to the site. Under the EIA Act, a competent authority may revoke or modify authorization to implement an activity where there has been an unanticipated irreversible adverse environmental impact or a developer fails to comply with any term or conditions subject to which the developer’s authorization was issued. Similarly, WMA permits the state to order the immediate closure of any existing waste management facility on the grounds of risk of pollution to the environment and harm to animal or plant life.
In Mozambique, institutions including the Ministry for Coordination for Environmental Action (MICOA) are generally responsible for the regular inspection and oversight of monitoring actions and environmental management of the activity subject to an environmental license. These institutions are vested with punitive powers in case of breach of the regulations, under which fines can be imposed on offenders (REIAP, Articles 24 and 26). For instance, MICOA is responsible for enforcing REQSEE, and it is vested with powers to conduct tests, audits, and technical-scientific assessments in order to determine the quality of the environment and compliance with the law.
In South Africa, NEMA provides for the appointment of the Environmental Management Inspectors (EMIs) and their powers, including powers relating to the seizure of items, routine inspections, the power to issue compliance notices, and the forfeiture of items. EMIs may issue compliance notices where there is reason to believe that a person has failed to comply with a provision of the law the inspector is responsible for upholding, or has failed to comply with a term or condition of a permit, authorization, or instruction issued (NEMA, Section 31L). A person who fails to comply with a compliance notice commits an offense and may be liable for a fine or imprisonment. Similar
provisions are included in NEM: ICMA (2008, Section 59), NEM: AQA (2004), NWA (1998, Section 53), and NEM: WA (NEM: WA, Sections 67 and 68).
Environmental Impact (Including Cumulative Impact) Assessment Processes, Risk Assessment, and Public Consultation
In Botswana, the EIA Act applies to activities “likely” to cause significant adverse effects on the environment. Before a license is issued for an activity prescribed under the EIA Act, the licensing authority shall ensure that an “authorization” is granted. A preliminary EIA is required as a first step to obtaining such a license. Public participation is required by way of publication through media and meetings with affected communities. Information provided by the applicant may be subject to public review. Public comments must be taken into consideration in the decision making.
In Mozambique, a similar EIA law is in place. EIA requires an environmental license for any activity that may cause significant environmental impact. As a part of an environmental assessment, an activity proponent must conduct public consultations with all stakeholders directly or indirectly affected by the activity in question. Upon successful completion of environmental assessments and approval thereof by MICOA, it grants the concerned person or entity an environmental license for the activity it intends to carry out.
In South Africa, NEMA is the primary statute regulating the “listed activities,” which are the activities that require environmental authorization prior to their being undertaken (CO2 sequestration is not a “listed activity”). Section 24 of NEMA requires that an applicant for an environmental authorization consider, investigate, assess, and report the consequences for or impacts on the environment of the listed activity to the relevant competent authority. One requirement that is particularly important is the requirement of public participation.
Review of Regional and National Legal Regimes Applicable to CCS Activities in the Balkan Region
This section is based on the 2011 World Bank report examining the relevant legal frameworks applicable to CCS in the Balkan region (World Bank 2011b).
34
Regional Framework—European Union CCS Directive
In April 2009, the European Union adopted Directive 2009/31/EC on the geological storage of CO2 with the aim of establishing a legal framework for the environmentally safe geological storage of CO2 (Directive 2009/31/EC 2009). The objective of this Directive is to provide conditions for permanent containment of CO2 to prevent and, where this is not possible, eliminate the negative effects and any risk to the environment and human health. It covers all CO2 storage in geological formations within the EU common space, and lays down requirements covering the entire lifetime of a storage site. Existing legal frameworks in member countries are used to regulate the capture and transport components of CCS. It requires Member States to regulate this new area by, for example, the issuance of exploration permits, storage permits, and by ensuring that monitoring and inspections are carried out and that the storage site operator sets aside a financial guarantee. The CCS Directive also amends other legal instruments in order to remove legal barriers to the deployment of CCS technology (as summarized in Table C.2 in Appendix C).
In addition to Directive 2009/31/EC, on March 31, 2011 the European Commission published four guidance documents aimed at assisting stakeholders with implementation of the Directive so as to promote a coherent implementation of the CCS Directive throughout the European Union (European Commission, Climate Action 2011b). EU member states are obliged to transpose Directive 2009/31/EC by June 25, 2011. It is worth noting that the guidance documents are not binding on states (unlike the Directive itself), but in practice will be highly persuasive for EU Member States. Bosnia and Herzegovina, Kosovo, and Serbia are not yet members of the European Union, but as candidate countries, each committed to EU membership, they will, at some point in the future, need to take steps to harmonize with Directive 2009/31/EC. At this stage, none of the three countries has transposed Directive 2009/31/EC into national law.
National Frameworks
This section highlights the most relevant national legal instruments that may be potentially applicable to CCS activities in the Balkan region.
Classification of CO2 and Its Legal Definition, Including Proprietary Rights of Stored CO2
Legal Definition of CO2
In Bosnia and Herzegovina, CO2 has not been defined or regulated by legislation. Traditionally, CO2 has not been considered a pollutant, nor is it listed among the pollutants in any of the legislation in Bosnia and Herzegovina.
In Serbia, there is no legal definition of CO2 in national environmental legislation, though several existing laws may offer some guidance. For example, CO2 may fit into the definition of a pollutant, or waste, or a dangerous substance, under various sections of the Law on Environmental Protection (Official Journal of the Republic of Serbia, No. 135/04, 36/09, 36/09-other law, and 72/09-other law, Article 3). Under the Law on Air Quality, CO2 is classified as a GHG. The Law on Waste Management may define CO2 as a type of waste or hazardous waste, although the current list of waste categories does not include CO2.
In Kosovo, no legal definition of CO2 can be found in presently applicable legislation. For instance, the Law on Air Protection from Pollution (APP) does not include CO2 in the list of basic environmental indicators of air quality that indicate the concentration of solid, liquid, and gaseous substances in the air. Nor does APP provide any definition or classification of CO2. From all pertinent laws, it appears that CO2 in Kosovo would be more likely defined as a pollutant because (a) CO2 does not appear on the list of substances belonging to the category of waste in the Waste Law; and (b) in Annex II of the Law on Environmental Impact Assessment, “installations for the capture of CO2 streams for the purposes of geological storage” are listed under the “Energy Industry” section rather than under “Waste,” which is another section of the annex.
Proprietary Rights over Stored CO2
In Bosnia and Herzegovina, there is currently no legislation setting out the proprietary rights of stored CO2. The existing legal frameworks of the energy sector, geological exploration and mining, and environmental protection may be a basis for introduction of a legal regime of CCS in the country. The legislation on production, transportation, distribution, and storage of gas is perhaps the most likely to correspond to the
35
requirements of CCS. The legislation on geological exploration and mining is also pertinent, since the focus of Directive 2009/31/EC is geological storage of CO2. The legislation of Serbia provides that all activities in the gas sector, including storage of the gas, are public interest activities. A consequence of an activity being “public interest” is that ownership of the installation and facilities is considered “public” property or, more precisely, under the ownership of Serbia. A similar situation exists in Bosnia and Herzegovina with the Decree on Organization and Regulation of the Gas Sector (Law of Environmental Protection of Federation of Bosnia and Herzegovina, Official Gazette of Federation of Bosnia and Herzegovina, 40/02). Based on the provisions of the above-mentioned legislation, the Political Entities would be the owners of facilities within the gas sector on their territories.
In Serbia, with respect to the proprietary rights over stored CO2, the provisions of the Act on Bases of Property Relations, Act on Conveyance of Immovable Title, the Contracts and Torts Act, and the Concession Act could apply. The main question that arises in regard to CO2 is whether it could represent a “thing (matter)” that can be possessed, used, and disposed of, and which can be subject of property rights. Although there are no specific legal provisions to this effect, it is accepted in case law in Serbia that any “substance” (gas and natural sources of energy, such as wind, electricity, and heat) that is subjected to human intervention (such as capturing a gas) represents a matter, over which a person may have property rights. The same analogy could be applied to captured and stored CO2. As regards the ownership of stored CO2, the rule superficies solo cedit in principle applies—an improvement that stands on the surface of the ground, such as a structure, trees, or plants, and anything underground belongs to the owner of the land. If it concerns state land, the conveyance of title to natural or legal persons is possible, but it may only be done by public sale or by public procurement.
In Kosovo, since CCS is essentially not regulated by the existing legal framework, it is difficult to unequivocally set out the proprietary rights of stored CO2. However, one could apply the proprietary rights of the Law on Energy, which provides for two principal mechanisms. First, those energy enterprises that owned, used (or
had the right to use), operated, or otherwise possessed energy facilities sited on property, over which the energy enterprise had not formally acquired or been granted a servitude, right of use, or property ownership right, were granted all necessary servitudes, rights of use, and/or other property rights in or to the concerned property by the operation of the Law on Energy.28 The second aspect concerns the new developments, such as the construction of new, or expansion of existing, generation, transmission, or distribution facilities that require the acquisition of servitudes, rights of use, or other property rights. This aspect would be most likely to apply to proprietary rights over stored CO2. If the property concerned is privately owned, the law provides that the concerned energy enterprise shall give notice to the private land owner and agree with the owner on servitude, based on the fair market value of the land. Any servitude or other property rights agreed by the parties have to be registered with the competent Municipal Cadastral Office (Law on Energy, Article 25(1)). The Energy Regulatory Office can also determine that the new or expanded facilities are needed to meet the concerned energy enterprise’s license obligations, and such determination is deemed to meet the requirements of the Law on Expropriation of Immovable Property. The Energy Regulatory Office forwards that determination to the Government with its request for initiation of the proceedings for expropriation of the private land and the transfer of that land to the energy enterprise to determine the compensation in accordance with the relevant provisions of the Law on Expropriation of Immovable Property (Law on Energy, Article 15(4)).
Jurisdiction over the Control and Management of Domestic and Cross-Boundary Pipelines and Reservoirs, Including Monitoring, Reporting, and Verification Requirements
In Bosnia and Herzegovina, the national legislation does not yet explicitly regulate transportation of CO2
in pipelines, whether domestic or cross-boundary, but interpreting provisions of the Serbian Law on Gas and the Federation of Bosnia and Herzegovina Decree on the gas sector, there is a legal basis for transportation of gases that are technically acceptable for transportation by gas pipelines. In the case of CCS development, transportation of CO2 may be regulated on bilateral basis, following legal principles of mutual interest,
28 The Law was published in the Official Gazette on November 15, 2010, and as prescribed in the Law, it entered into force 15 days after its publication in the Official Gazette. The effective date of this particular law was also confirmed with the Office of the Official Gazette.
36
cooperation, and the need to ensure that no harm is caused to other countries. The above-mentioned acts (a) set out the procedure by which an operator can extend a network of pipelines and measures for implementation of the legislation, including inspection and enforcement; and (b) specify conditions that the operator must meet to obtain a permit for performing activities in gas sector. It is therefore considered that the gas legislation in Bosnia and Herzegovina provides a solid structure, which could be followed for the introduction of CO2 pipelines in the country.
In Serbia, the transportation of CO2 is not regulated by any specific law. However, the provisions of the Act on Pipeline Transport of Gaseous and Liquid Hydrocarbon and Distribution of Gaseous Hydrocarbons could apply. The act regulates different types of pipelines, namely oil, gas, and product pipelines and also pipeline transport conditions. The act distinguishes interstate systems for oil and natural gas transport or their products when it concerns the cross-boundary movement between other states or transit through Serbia.
In Kosovo, the law does not currently regulate the transportation of CO2, although it addresses aspects that relate to the transportation of CO2 for purposes of conducting an environmental impact assessment, required for granting an environmental consent by the Ministry of Environment and Spatial Planning to relevant public or private projects. National law, however, regulates the transportation of gas, oil, and energy through the respective Laws on Natural Gas, Energy, and Trade of Petroleum and Petroleum Products. No other general environmental law appears to be applicable to CO2 transportation.
Proprietary Rights to Cross-Boundary CO2 Capture and Storage Sites and Facilities
Currently, there are no CCS sites and facilities in Bosnia and Herzegovina. The Political Entities’ laws only regulate the gas sectors within their own territories. Thus, the laws of Bosnia and Herzegovina cannot create rights and obligations for persons and legal subjects in Serbia, and similarly, the laws of Serbia cannot create rights and obligations for persons in Bosnia and Herzegovina. Gas sector installations in Bosnia and Herzegovina are public property and owned by these entities. Installations within the territory of Serbia are owned by state. Inter-entity flow of gas is regulated on bilateral cooperation, and through inter-government
and inter-ministerial agreements, between Regulatory Commissions. On the operational level, cooperation is organized among operators. Inter-entity flows of CO2
are also likely to be regulated on the basis of such cooperation.
In Serbia, the Agreement on Succession Issues signed in 2001 regulates the division of existing movable and immovable property, which also includes cross-border sites and facilities. The use of cross-border sites is an issue to be regulated by separate agreements. Movable and immovable state property of the federation shall pass to the successor states in accordance with the provisions of the Agreement. Immovable and movable tangible state property, which was located within the territory of the Socialist Federal Republic of Yugoslavia (former Yugoslavia) shall pass to the successor state on whose territory that property is situated on the date on which it proclaimed independence. A Joint Committee on Succession to Movable and Immovable Property shall be established by the successor states, which shall ensure the proper implementation of the provisions of the Agreement. However, in relation to cross-border facilities or sites that do not currently exist, but may be built in the future, these shall be regulated by a separate agreement.
Kosovo is not a party to any succession agreement of the former Yugoslavia. It seems unlikely that there would be any scope for agreement between Kosovo and its neighboring countries on a cross-boundary CO2 capture and storage site and facilities.
Regulatory and Licensing (Permitting) Scheme Related to the Operation and Management of Storage and Transportation Facilities
In Bosnia and Herzegovina, there is no specific licensing system in place yet for CCS projects. However, the existing permitting system from the gas sector might be applicable. For example, Article 6 of the Federation of Bosnia and Herzegovina Decree on the Organization and Regulation of Gas Economy stipulates conditions that the system operator has to meet. The Serbian Law on Gas regulates action in case that operator does not fulfill the conditions of its permit. The Regulatory Commission may revoke the permit on a temporary basis and can set the operator a deadline by which time he must have achieved full compliance with the requirements. The Serbian Law on Gas gives the Inspector the option to initiate a procedure to revoke the permit where he finds noncompliance with the permit.
37
In Serbia, the lack of more precise information on CCS projects leaves uncertainty as to the permits that would be required. The existing licensing laws are divided into two categories: (a) permits according to the Mining Act, Geological Explorations Act and Energy Act; and (b) permits issued under the Spatial Planning and Construction Act, and environmental and other legislation. This classification comes from the idea that the use of CCS technology will include both permits required for certain hazardous activities and their effects on the environment and human heath, as well as permits required for geological explorations, mining sites, and energy facilities.
In Kosovo, no legal framework specifically directed at CCS is currently in place, but the current energy and natural gas legal framework may apply in the future to CCS projects. The Energy Regulatory Office has the authority to issue, amend, suspend, transfer, or terminate licenses to energy enterprises (Law on Energy Regulator, Article 14 (2.2)). The office also issues authorizations for the construction of new energy generation capacities, new facilities for the transmission and distribution of gas, and direct electricity lines and direct pipelines for the transition of natural gas (Law on Energy Regulator, Article 14(2.7)). It follows from this analysis that, for future CCS projects, the interested enterprises would most likely have to apply for an operating license from the Energy Regulatory Office or any other similarly designated independent body. It remains to be seen whether the Kosovo legislator also allocates any role to the Government, as in the Law on Natural Gas.
Long-Term Management and Liability Issues Arising from Accidents or Leaks in Domestic and Cross-Boundary CCS Projects
Bosnia and Herzegovina signed the Protocol on Civil Liability and Compensation for Damage Caused by the Transboundary Effects of Industrial Accidents on Transboundary Waters to the Water Convention during the Kiev Conference 2003, but has not ratified the Protocol. Also, the Political Entities have not introduced any legislation on environmental liability and have not started to harmonize with Directive 2004/35/EC. In situations where damage is caused, the laws on obligations and general rules on damages shall be applied, such as stipulated in Article 103 of Serbian Law on Environmental Protection and Article 103 of Federation of Bosnia and Herzegovina Law on Environmental Protection. Dangerous activities are
defined as those that may cause significant risk for people, health, property, and/or the environment. An entity that performs dangerous activities bears responsibility for damages caused by that activity. Although CCS projects are not expressly included in the laws as dangerous activities, it is possible that plants containing equipment to capture CO2, the pipelines used to transport concentrated CO2, and also the plant used to inject CO2 could be considered locations that are dangerous to the environment.
In Serbia, the responsibility for pollution to the date of privatization at state enterprises shall be borne by the state, not the new owner (NEPP 2010). According to the Law on Environmental Protection, any legal or natural person that causes environmental pollution by illegal or improper activities shall be liable, including the cases when the polluter goes into liquidation or bankruptcy (Official Journal of the Republic of Serbia, No. 135/04, 36/2009, 72/2009). When the ownership of a company changes an environmental assessment, liability for environmental pollution must be determined, and settlement of debts of the previous owner on account of pollution and/or environmental damage must be agreed. At the same time, any legal and natural person who enabled or allowed pollution of environment through illegal or incorrect action shall also be responsible. If several polluters are responsible for the environmental damage, and if it is not possible to determine the share of certain polluters, the costs shall be borne jointly and individually.
In Kosovo, the Law on Environmental Protection specifies a number of liability-related aspects, which could be applied to an accident or leak from a CCS project. The Law on Environmental Protection (Law on Environmental Protection, Article 81(1), (2) of Kosovo) addresses liabilities of all natural and legal entities that are obliged to ensure environmental protection while performing their activities. The Law on Environmental Protection also provides that the polluter—a legal or natural person—is responsible for the damage caused and for the evaluation and elimination of the damage resulting either from legal or illegal or inadequate action (Law on Environmental Protection, Articles 66(1) and 66(2)). It is important to note that the Law on Environmental Protection has been approximated to Directive 2004/35/EC on environmental liability with regard to prevention and remedying of environmental damage to the extent that it complies with the basic principles of the Directive. The Law establishes a legal
38
framework for environmental liability based on the “polluter pays” principle. The Waste Law (The Waste Law of Kosovo (02/L-30)) also sets forth responsibilities and obligations for waste management. However, it should be noted that these would only be applicable in the CCS context if captured CO2 was considered waste.
Financial Assurance for Long-Term Stewardship and Reduction of Financial Exposure through CCS Regulatory Frameworks
Since CCS is not specifically regulated by legislation in Bosnia and Herzegovina, the discussion can only focus on some guarantee scenarios from existing legislation that potentially could be taken into account when drafting legislation on financial assurance for long-term stewardship of a CCS site. The existing laws are practically the same in both Political Entities. Both Entities’ laws on environmental protection contain a provision that provides that the legal entity that carries out activities that are dangerous to the environment is responsible for the damage caused by that activity. Both laws on environmental protection require that the legal entity managing the dangerous activity provides sufficient financial security to cover any damage that potentially might occur to third parties and compensation through insurance or by some other means. However, it is unclear whether this general provision regarding liability also applies to closed facilities. The Entities’ laws on waste management requires that sites holding hazardous waste provide a financial or other guarantee to compensate against the costs related to risks, or costs related to minimizing damage and against costs produced by activities after closure of such facility. The financial guarantee shall be proportional to the size of the site, quantity of waste disposed, and expected risks. The financial guarantee has to be in place for maintenance of the facility after closure for at least 30 years.
In Serbia, under the Environment Protection Act (Official Journal of the Republic of Serbia 2004), an Environmental Protection Fund has been established to provide financial resources for the improvement and protection of the environment in Serbia (Official Journal of the Republic of Serbia 2004). According to the Amendment to the Environmental Protection Act (2009) and the Law on Environment Protection Fund, expanding the list of activities to be financed by the fund is envisaged, which could potentially cover CCS projects
(Official Journal of the Republic of Serbia 2004, no. 72/09).
In Kosovo, the EU Directive 2009/31/EC of April 2009 has not yet been approximated in the domestic legislation. Neither is it possible to observe the presence of any provision that in any way reflects the content of the Directive’s relevant Article 18 on transfer of responsibility and Article 20 on financial contribution. There is no other relevant legislation in Kosovo.
Third Party Access Rights to Transportation Networks, Transit Rights, and Land Rights with Regard to Pipeline Routes
There is no CCS legislation at present in Bosnia and Herzegovina on third party access rights to transportation networks. The gas sector legislation vis-à-vis third party access rights may be relevant. The Federation of Bosnia and Herzegovina Decree on Organization and Regulation of Gas Economy and Serbian Law on Gas define obligations of operator. With regard to the transportation network, the operator is responsible under both The Federation of Bosnia and Herzegovina Decree and the Serbian Law for providing access and use of the transportation network to third parties under transparent nondiscrimination rules with full protection of the user’s interest and provision of all information needed for efficient access to transportation network users.
In Serbia, the Act on Pipeline Transport of Gaseous and Liquid Hydrocarbon and Distribution of Gaseous Hydrocarbons prescribes the conditions for safe and uninterrupted pipeline transport of gaseous hydrocarbon and liquid hydrocarbons and distribution of gaseous hydrocarbons, industrial design, building, installation, and use of pipelines and internal gaseous installation. The Energy Act provides for third-party access, which may give an indication of the possible rules to be applied for CCS transport. The operator in the energy entity in charge of transmission, transportation or distribution systems shall allow access of third parties to the system based on the principles of transparency and nondiscrimination, in conformity with technical possibilities and depending on the load level of the transmission, transportation. or distribution systems. A system operator may refuse access to the system when technical possibilities do not so allow because of a lack of capacities, faulty operation, or system overload, for example, as a result of threatened system functioning
39
safety or the objection of an energy producer in Serbia on a lack of reciprocity.
In Kosovo, in the absence of the CCS legislature, it is relevant to look at similar applicable legislation that contains third-party access rights. For example, in the Law on Natural Gas, the transmission and distribution system operators should allow natural gas undertakings and eligible customers, including supply undertakings, to have nondiscriminatory access to transmission and distribution systems, in compliance with rules and transparent tariffs approved by the Energy Regulatory Office (Law on Natural Gas, Article 17(1)).
Regulatory Compliance and Enforcement Schemes
In Bosnia and Herzegovina, both Political Entities have adopted a Law on Inspections. The system consists of an entity-level Directorate for Inspections (Inspectorate) and inspections established at a local (cantonal or municipal) level. The Laws on Inspections specify certain areas for inspection, including “Technical inspection,” “Urbanism-construction and ecology inspection,” and “Sanitary inspection.” “Technical inspections” seem to be the most relevant in the context of CCS projects. After performing an inspection, the Inspector will prepare a report on these findings.
Enforcement measures and actions with regard to environmental protection are set on several levels. The Entities’ Laws on Offenses establish a system of offenses and sanctions and authorized bodies that may impose sanctions. The criminal laws provide for crimes relating to “destruction of facilities of public use” and “crimes against environment.” CCS installations can potentially be considered public interest facilities or facilities of public use, making the crime relating to “destruction of facilities of public use” potentially applicable. Additionally, the legislation on environmental protection and on air protection sets out several crimes and offenses related to air protection.
In Serbia, the responsibilities related to inspections and enforcement are determined by several legal acts. The Law on State Administration contains special provisions related to inspection control performed by ministries through their inspectors and other authorized persons. The inspector is obliged to undertake inspection if asked
by citizens, enterprises, and other organizations, in matters concerning their business, and to inform them about the results of the inspection,29 and proceed with competent authorities in case a criminal act, commercial offense, offense, or breach of working duty has been committed (Article 30). Inspections in the relevant fields are also regulated by sectoral laws, such as the Law on Environmental Protection, Law on Integrated Pollution Prevention and Control (IPPC), Law on Strategic Environmental Impact Assessment (SEA), Law on EIA, Law on Waste Management, Law on Chemicals, Law on Air Protection, Law on Mining, Energy Law, Law on Geological Explorations, and Law on Pipeline Transportation of Gaseous and Liquid Hydrocarbons and Distribution of Gaseous Hydrocarbons.
Competence for law enforcement in the field of environmental protection is divided between: republic inspections, provincial inspections, and local inspections. The Instruction on Environmental Inspection Reporting (No. 353-03-2197/2006-01) entered into force in 2007 and attempted to unify inspection work on all levels in Serbia.
In Kosovo, an institutional scheme that could apply to future CCS activities is the one prescribed in the Law on Environmental Protection. The Ministry of Environment and Spatial Planning could potentially be the authority responsible for implementing and enforcing laws related to CCS, adopting any sublegal act and carrying out administrative supervision (Law on Environmental Protection, Articles 50, 80, and 81(1)). Inspective activities would, in this case, be carried out by the Environmental Protection Inspectorate (Law on Environmental Protection, Article 81(1)). Inspections in municipalities are carried out by municipality environmental inspectors (Law on Environmental Protection, Article 81(2)), who may also be tasked with other duties by the Ministry of Environment and Spatial Planning.
Environmental Impact (Including Cumulative Impact) Assessment Process, Risk Assessment, and Public Consultation
Environmental Impact Assessment
In Bosnia and Herzegovina, with regard to transposition and implementation of Directive
29 The inspected parties are obliged to allow the inspector to perform his duties without any obstacle, to allow him to inspect documents and objects and to help him in other way if asked (Art. 29).
40
85/337/EC (the EIA Directive), both Bosnia and Herzegovina Political Entities have achieved good results. The Serbian General Administration Procedure on General Administration Procedure (Official Journal of the Republic of Serbia 13/02) sets basic rules of administrative procedure. The Serbian Law of Environmental Protection (LEP) sets rules for two administrative procedures: EIA and ecological permits. EIA is the procedure for obtaining an administrative decision on the acceptability of environmental impact in the process of project development. In a wider context, the decision on EIA is a precondition for obtaining a construction permit. The EIA procedure itself has two main parts. First, the screening process, which results in a decision on whether or not EIA is mandatory and the extent of the EIA procedure. Second, is the actual decision on EIA. The Serbian LEP prescribes rules on procedure, involvement of interested parties, and the public in the procedure. The Federation of Bosnia and Herzegovina LEP also has detailed provisions on EIA.
In Serbia, EIA has been carried out since the early 1990s. The basic legal act which currently regulates EIA in Serbia is the Law on Environmental Impact Assessment (Official Journal of the Republic of Serbia, No. 135/2004, 72/2009). The Law on EIA targets planned and implemented projects, changes in technology, reconstruction, the extension of capacity, the termination of operations, and the removal of projects that may have significant impact on the environment. In addition, the Law on SEA introduced strategic assessment of effects on the environment into the legal system of Serbia (Official Journal of the Republic of Serbia, No. 135/2004, 88/2010).
Kosovo’s Law on Environmental Impact Assessment has undergone the screening of its compliance with Directive 85/337/EC and is made in line with its content, making IEA explicitly address CCS, though it still does not cover it in its entirety. For example, it does not provide any guidance with regard to injection and storage, but rather speaks of this aspect in terms of a broader environmental dimension, of assessing all projects, public and private, that could significantly impact the environment to acquire the required consent to operate from the competent governmental body. Article 31 of Directive 2009/31/EC on the assessment of the effects of certain projects on the environment is also included in the Law on Environmental Impact Assessment, meaning that it is
applicable both to the capture and transport of CO2 streams for the purposes of geological storage and also to storage sites.
Public Participation in Environmental Matters
In Bosnia and Herzegovina, public participation is one of the principles of environmental protection under the law of both Political Entities that acceded to the Aarhus Convention in 2008, and that are currently preparing their First National Reports on implementation of the Aarhus Convention. The legal basis for free access to information and public involvement is also set by the Law on Free Access to Information (Official Gazette of the Federation of Bosnia and Herzegovina 32/01) and Law on Free Access to Information (Official Journal of the Republic of Serbia, no. 20/01). The existing legal instruments are clear in that (a) the publishing of information is mandatory, (b) there must be public participation possibilities open to all interested parties and to the general public, and (c) the public and interested parties are able to provide written comments and to participate in public scrutiny.
Serbia is also a member of the Aarhus Convention (Official Journal of the Republic of Serbia, no. 38/09), and public participation and while access to information is regulated at the national level. The 2004 Law on Environmental Protection (EPL) contains a number of provisions of systemic character relevant for access to environmental information and public participation (Articles 78–83). According to the relevant laws, the public should be informed at all stages of the process and has the right to voice its opinion at each of these stages. The authorities must, if requested to do so, at all stages, provide complete documentation related to an EIA procedure. The 2004 Law on Strategic Environmental Assessment provides that the public has the right to be informed about programs in preparation and their impact on the environment.
In Kosovo, an environmental consent is required by the Law on Environmental Impact Assessment (Law on Protection from Non-Ionized, Ionized Radiation and Nuclear Security of Kosovo (03/L-104) for every public or private project, which is likely to have significant effects on the environment by virtue, among other things, of its nature, size, or location (Law of Environmental Impact Assessment, Article 7(1)).

41
Environmental consents are issued by the Ministry of Environment. The Law on Environmental Impact Assessment requires that the main conclusions and recommendations included in the EIA Report and the proposed decision for environmental consent are
made subject to public debate, and that the results of these consultations must be taken into consideration in reaching the decision on the environmental consent (Law of Environmental Impact Assessment, Articles 20 and 22).

43
5. THE ROLE OF CLIMATE FINANCE SOURCES IN ACCELERATING CARBON CAPTURE AND STORAGE DEMONSTRATION AND DEPLOYMENT IN DEVELOPING COUNTRIES
This chapter examines the range of policy, legal, and regulatory, as well as methodological factors that will define access to climate finance for CCS.30 Understanding the above-mentioned factors, associated challenges, and possible options is essential in supporting efforts to maximize the use of climate finance by CCS at a time when the design of a future climate finance architecture is under negotiation. With a focus on eligibility of CCS in climate finance, the analysis in this chapter complements other studies that assess how policy and financing instruments, along with their combination and sequencing, can address the technical, financial and economic near-term demonstration challenges for CCS.31 The analysis is presented in two sections:
1. An analysis mapping a deployment pathway for CCS in developing countries with associated financing needs to climate finance instruments, in order to gain a better understanding of their potential in supporting CCS. Two broad categories of instruments are considered: market or performance-based instruments and nonmarket, or so-called “public” instruments. The latter could be critical for addressing upfront investment needs through grant and concessional loans or risk-mitigation instruments, as well as providing other forms of support, such as enabling activities through dedicated funds. The market-based instruments, in turn, could provide additional revenues to cover in part or in full, O&M costs. However, in general, market-based instruments have limited capacity to address challenges facing CCS technology build-out at the demonstration stage.
2. A discussion of the policy, legal, and regulatory, as well as methodological, issues that must be satisfactorily resolved, at the international and national level, for CCS to gain full access to climate finance. In general, these issues center around ensuring the environmental integrity of avoided emissions achieved through CCS.
The main findings of the study are summarized in Box 5.1.
Mapping Climate Finance to a Deployment Pathway
Detailed national strategies, deployment scenarios, and roadmaps for CCS have not yet been widely compiled at either a national or regional level for developing countries. The most comprehensive, detailed, and consistent analysis of CCS demonstration and deployment for both developed and developing countries to date, was prepared under the IEA ETP Blue Map Scenario (IEA 2010c) and described further in the IEA CCS Roadmap (IEA 2009). This is the scenario used as the basis for the analysis presented in this chapter. The IEA ETP Blue Map Scenario is a normative scenario that charts a cost-effective pathway consistent with bringing down global emissions from the energy sector to 50 percent of their 2005 levels in 2050. This is arguably a collective effort much more ambitious than current mitigation pledges. However, with CCS being essentially a high-cost abatement option, it is likely that widespread CCS deployment globally, let alone in developing countries, would only occur in line with ambitious emission reduction targets. In addition, while one must acknowledge today the large uncertainties about the future structure and specific features of climate finance instruments and channels, it is likely, however, that market-based climate finance instruments will, in the longer term, play an important role as part of the mix of finance sources in providing cost-efficient solutions in a highly ambitious GHG Emission Mitigation Scenario.
The analysis presented in this chapter is carried out by developing a set of metrics applied to the data on CCS deployment in developing countries under the IEA ETP Blue Map Scenario. These metrics include captured emissions, avoided emissions, number of CCS projects required, additional investments, additional costs, and the cost of abatement. These metrics are explained in detail in Box D.1 in Appendix D. Using the metrics, estimates of the potential contributions from different climate finance sources to meet the costs of CCS deployment in developing countries are developed, according to the deployment
30 This chapter summarizes the main findings of a background report commissioned by the World Bank under a contract with a consortium comprised of Carbon Counts Company Ltd and Climate Focus. The report is titled Assessment of Climate Finance Sources to Accelerate Carbon Capture and Storage Deployment in Developing Countries (Zakkour and others 2011)
31 Such studies include the recent report by the IEA (IEA 2011b), looking into a panoply of instruments to incentivize the deployment of CCS in power generation and industry globally (including the appropriate form of incentives over time, as technology matures).
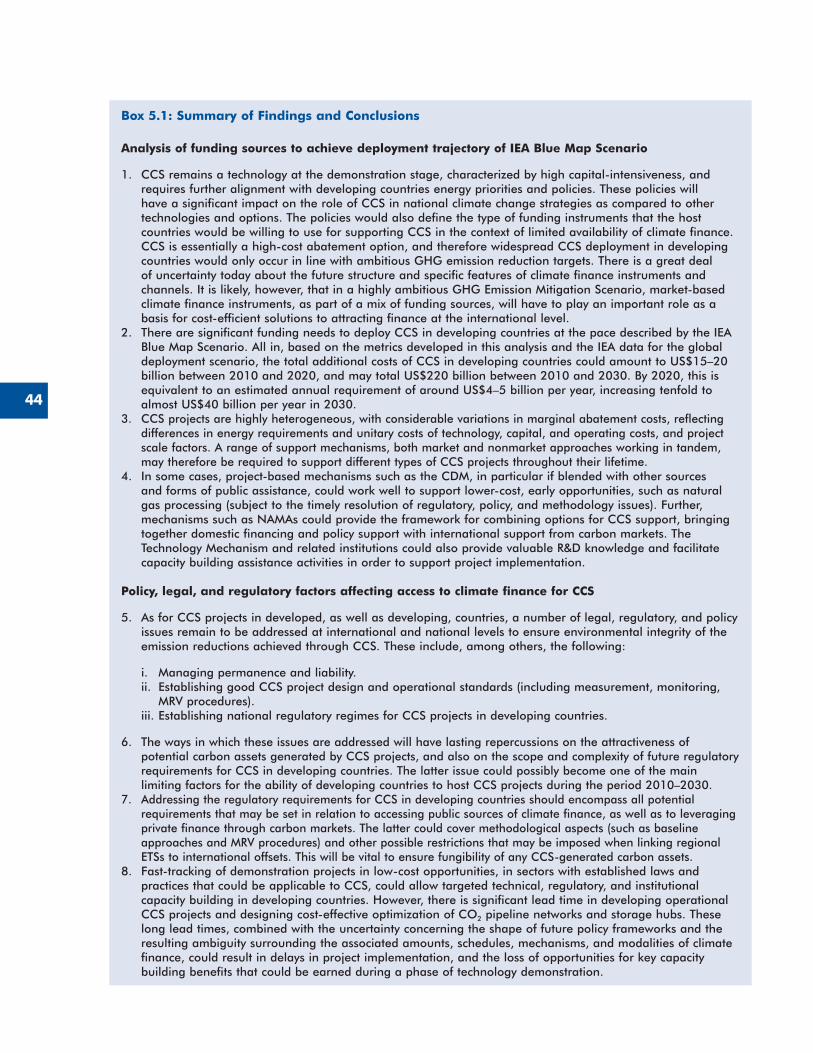
44
Box 5.1: Summary of Findings and Conclusions
Analysis of funding sources to achieve deployment trajectory of IEA Blue Map Scenario
1� CCS remains a technology at the demonstration stage, characterized by high capital-intensiveness, and requires further alignment with developing countries energy priorities and policies� These policies will have a significant impact on the role of CCS in national climate change strategies as compared to other technologies and options� The policies would also define the type of funding instruments that the host countries would be willing to use for supporting CCS in the context of limited availability of climate finance� CCS is essentially a high-cost abatement option, and therefore widespread CCS deployment in developing countries would only occur in line with ambitious GHG emission reduction targets� There is a great deal of uncertainty today about the future structure and specific features of climate finance instruments and channels� It is likely, however, that in a highly ambitious GHG Emission Mitigation Scenario, market-based climate finance instruments, as part of a mix of funding sources, will have to play an important role as a basis for cost-efficient solutions to attracting finance at the international level�
2� There are significant funding needs to deploy CCS in developing countries at the pace described by the IEA Blue Map Scenario� All in, based on the metrics developed in this analysis and the IEA data for the global deployment scenario, the total additional costs of CCS in developing countries could amount to US$15–20 billion between 2010 and 2020, and may total US$220 billion between 2010 and 2030� By 2020, this is equivalent to an estimated annual requirement of around US$4–5 billion per year, increasing tenfold to almost US$40 billion per year in 2030�
3� CCS projects are highly heterogeneous, with considerable variations in marginal abatement costs, reflecting differences in energy requirements and unitary costs of technology, capital, and operating costs, and project scale factors� A range of support mechanisms, both market and nonmarket approaches working in tandem, may therefore be required to support different types of CCS projects throughout their lifetime�
4� In some cases, project-based mechanisms such as the CDM, in particular if blended with other sources and forms of public assistance, could work well to support lower-cost, early opportunities, such as natural gas processing (subject to the timely resolution of regulatory, policy, and methodology issues)� Further, mechanisms such as NAMAs could provide the framework for combining options for CCS support, bringing together domestic financing and policy support with international support from carbon markets� The Technology Mechanism and related institutions could also provide valuable R&D knowledge and facilitate capacity building assistance activities in order to support project implementation�
Policy, legal, and regulatory factors affecting access to climate finance for CCS
5� As for CCS projects in developed, as well as developing, countries, a number of legal, regulatory, and policy issues remain to be addressed at international and national levels to ensure environmental integrity of the emission reductions achieved through CCS� These include, among others, the following:
i� Managing permanence and liability�ii� Establishing good CCS project design and operational standards (including measurement, monitoring,
MRV procedures)�iii� Establishing national regulatory regimes for CCS projects in developing countries�
6� The ways in which these issues are addressed will have lasting repercussions on the attractiveness of potential carbon assets generated by CCS projects, and also on the scope and complexity of future regulatory requirements for CCS in developing countries� The latter issue could possibly become one of the main limiting factors for the ability of developing countries to host CCS projects during the period 2010–2030�
7� Addressing the regulatory requirements for CCS in developing countries should encompass all potential requirements that may be set in relation to accessing public sources of climate finance, as well as to leveraging private finance through carbon markets� The latter could cover methodological aspects (such as baseline approaches and MRV procedures) and other possible restrictions that may be imposed when linking regional ETSs to international offsets� This will be vital to ensure fungibility of any CCS-generated carbon assets�
8� Fast-tracking of demonstration projects in low-cost opportunities, in sectors with established laws and practices that could be applicable to CCS, could allow targeted technical, regulatory, and institutional capacity building in developing countries� However, there is significant lead time in developing operational CCS projects and designing cost-effective optimization of CO2 pipeline networks and storage hubs� These long lead times, combined with the uncertainty concerning the shape of future policy frameworks and the resulting ambiguity surrounding the associated amounts, schedules, mechanisms, and modalities of climate finance, could result in delays in project implementation, and the loss of opportunities for key capacity building benefits that could be earned during a phase of technology demonstration�
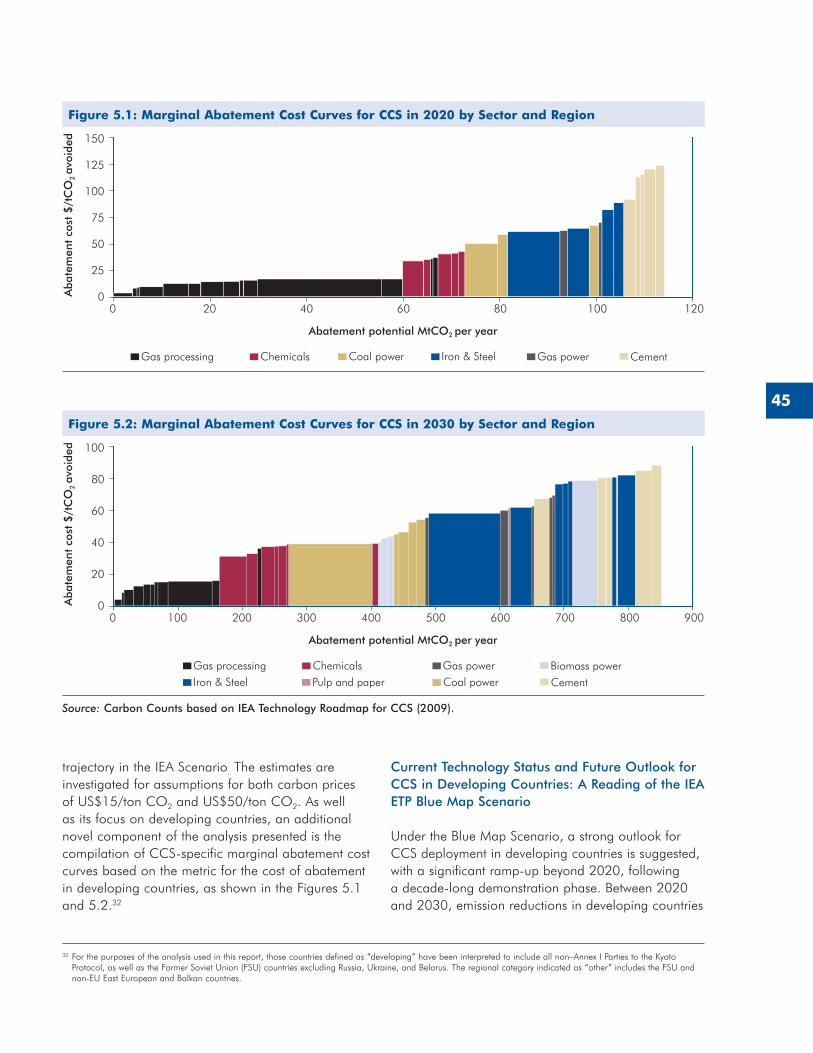
45
trajectory in the IEA Scenario. The estimates are investigated for assumptions for both carbon prices of US$15/ton CO2 and US$50/ton CO2. As well as its focus on developing countries, an additional novel component of the analysis presented is the compilation of CCS-specific marginal abatement cost curves based on the metric for the cost of abatement in developing countries, as shown in the Figures 5.1 and 5.2.32
Current Technology Status and Future Outlook for CCS in Developing Countries: A Reading of the IEA ETP Blue Map Scenario
Under the Blue Map Scenario, a strong outlook for CCS deployment in developing countries is suggested, with a significant ramp-up beyond 2020, following a decade-long demonstration phase. Between 2020 and 2030, emission reductions in developing countries
32 For the purposes of the analysis used in this report, those countries defined as “developing” have been interpreted to include all non–Annex I Parties to the Kyoto Protocol, as well as the Former Soviet Union (FSU) countries excluding Russia, Ukraine, and Belarus. The regional category indicated as “other” includes the FSU and non-EU East European and Balkan countries.
Figure 5.1: Marginal Abatement Cost Curves for CCS in 2020 by Sector and Region
150
0
50
25
75
100
125
0 120
Gas processing Gas power
20 40 60 80 100
Chemicals Iron & SteelCoal power Cement
Aba
tem
ent
cost
$/t
CO
2 a
void
ed
Abatement potential MtCO2 per year
Figure 5.2: Marginal Abatement Cost Curves for CCS in 2030 by Sector and Region
100
0
20
40
60
80
0 900
Gas processing Gas powerPulp and paper
100 200 300 400 500 600 700 800
ChemicalsIron & Steel Coal power
Biomass powerCement
Aba
tem
ent
cost
$/t
CO
2 a
void
ed
Abatement potential MtCO2 per year
Source: Carbon Counts based on IEA Technology Roadmap for CCS (2009)�
46
achieved through CCS are anticipated to increase around eightfold, rising from 114 Mton CO2e avoided from 50 projects in 2020 to 850 Mton CO2e avoided from 450 projects in 2030. This is a considerable expansion from today’s situation where the In Salah Gas CCS project in Algeria is the only large-scale CCS project operational in a developing country. However, a number of other CCS projects are at various stages of deployment in the developing world, including several CCS initiatives linked to enhanced oil recovery, led by Masdar Carbon and supported by the Abu Dhabi National Oil Company (ADNOC), and two pilot-scale projects capturing CO2 from coal-fired power facilities in China. There has also been a considerable increase in activity in other developing countries relating to CO2-EOR (for example, in the Middle East and Latin America), driven largely by efforts to increase national hydrocarbon production, led by both state energy companies and international oil majors (see Table D.2 in Appendix D for a brief overview of the status of CCS in developing countries).
The following points summarize the trajectory of CCS deployment, as described in the IEA ETP Blue Map Scenario, and the resulting implications on the deployment across sectors and regions:
2010–2020
• In the next 10–15 years, CO2 capture from power generation will represent only a minor share of CCS projects, with units capturing CO2 from industrial (iron and steel, cement, and chemicals) and upstream (natural gas processing) sources contributing a larger share of the total number of CCS projects.
• Projects in natural gas processing facilities are among those that represent early CCS opportunities because of their likely low capture costs, with the capture step integrated within the gas processing from high-CO2 concentration streams in natural gas fields. These projects will also likely have low transport and storage costs, since storage is located either in situ or in close proximity with the project (like the In Salah project). Such opportunities can be found across a range of regions (most notably in Asia) where there are significant recoverable reserves of high-CO2 natural gas with associated storage capacity. An example is the giant Natuna D-Alpha gas field located offshore in Indonesia.
• The trajectory sees on average 5 new operational projects built every year in the period up to 2020,
and reaching 50 large-scale projects that should be in operation by that time.
2020–2030
• Beyond 2020, the scenario indicates the deployment of CCS across a much wider range of sectors and project types compared to the previous decade’s focus on lower-cost “early opportunity” projects and technology demonstrations in higher-cost opportunities with pure CO2 streams. In the 2020–30 period, for example, the growing role of bio-energy to meet mitigation efforts in the transportation sector could make bio-energy combined with carbon capture and storage (BECCS) an essential technology to reduce the life-cycle emissions of bio-fuels.
• According to the scenario, China and India represent a more dominant and growing role in deployment after 2020, driven largely by the capture potential in fossil fuel–fired power generation and heavy industry. China alone is envisaged to account for almost one-third of CCS deployment in developing countries by 2030 (by share of avoided emissions), largely driven by the ramping-up of CCS projects in the coal-fired power sector and a steady number of projects around iron and steel sources. In the near term, however, other emerging countries in Asia are expected to account for a significant share of deployment, predominantly because of the presence of high-CO2 natural gas fields across the region.
• The trajectory includes around 40 projects constructed every year from 2020 to 2030.
The Funding Needs to Deploy CCS in Developing Countries and Current Level of Support
Significant funding is needed to deploy CCS in developing countries at the pace described by the IEA trajectory. All in, based on the metrics developed in this analysis and the IEA data for the deployment scenario, the total additional costs of CCS in developing countries could amount to US$15–20 billion between 2010 and 2020, and may total US$220 billion between 2010 and 2030. By 2020, this is equivalent to an estimated annual requirement of around US$4–5 billion per year, increasing tenfold to almost US$40 billion per year in 2030. These costs correspond to the annualized expenditures for building, operating, and maintaining exclusively the CCS component of a CCS
47
facility, thereby reflecting additional, or incremental, costs for operators relative to an equivalent facility without CCS. They include capital repayment of upfront investment,33 operating costs, and costs associated with CO2 transport and storage.34
In contrast to these needs, only limited support is currently available through the existing mechanisms of climate finance.35 Presently, the Financial Mechanism of the UNFCCC (managed by the Global Environment Facility, GEF), the CDM, and multi- and bilateral concessional loans, grants, and guarantees are the main channels of climate finance for mitigation, delivering potentially on the order of US$8 billion of finance per year to developing countries, depending on interpretations around the scope of climate finance (World Bank, 2010d). GEF support for CCS has been historically limited, although the GEF has recently approved a US$3 million grant for a CCS project at a bio-ethanol refinery in Brazil. CCS technology is currently only eligible under the CDM subject to the resolution of a range of technical, legal, policy, and financial conditions that are under discussion at the time of the report preparation.
Combining Climate Finance Instruments for Near-Term Support up to 2020
Mobilizing financial support for CCS in the next 10 years will be critical if successful demonstration of the technology across different world regions and sectors is to be achieved. This will help acquire the necessary technical and institutional experience and achieve the anticipated cost reductions required to move into a second phase of wider deployment beyond 2020. CCS projects are highly heterogeneous, with considerable variations in marginal abatement costs, reflecting differences in energy requirements and unitary costs of technology, capital and operating costs, and project-scale factors.36 The costs for CCS vary significantly
across regions and sectors, from as little US$7–8/ton CO2 for some early opportunities (upstream gas processing and chemicals) to more than US$120/ton CO2 in more complex applications (power and industrial sectors)—as shown in Figure 5.1 on the MAC curve for 2020. A range of support mechanisms, both market and nonmarket approaches working in tandem, may therefore be required to support different types of CCS projects throughout their lifetime.
For instance, carbon market revenues and nonmarket–based support can complement each other to cover the funding requirement of capital-intensive and complex CCS applications (such as power and industrial CCS applications, albeit that according to the deployment scenario, projects in these sectors will be in the minority in this period, with the majority in lower-cost opportunities, such as gas processing). In these capital-intensive sectors, the technology costs are greater because of the need to install capture equipment associated with higher technological risk (since the capture technology is less mature), making it more difficult to raise the necessary investment capital from equity and debt. Operators are typically less well capitalized, have limited experience in subsurface issues, and tend to be more risk-averse. Public finance will be critical to leverage equity and debt, and the carbon market will be essential in providing the revenues to cover ongoing costs associated with operation of CCS plants. Early experience in these sectors will also be critical to driving down costs—both the technology (capital) costs, through better technology integration, and financing (debt) costs, through greater experience and demonstrated performance.
The most effective support from climate finance to date is likely to take the form of up-front access to capital, whether from grants or concessional loans, which can overcome the considerable CCS investment risks faced by project developers and commercial lenders. Further,
33 Upfront investment for capture plants and associated transport and storage infrastructure could be as high as US$300 billion through 2030, of which around 8 percent (US$23 billion) would be needed over 2010–20. The transport and storage component could easily require half of this, depending on the degree of pipeline infrastructure optimization, as development of regional CCS networks and hubs using large diameter common carriage pipelines could reduce costs.
34 In addition to the upfront investment for capture plants and associated transport and storage infrastructure, the costs of deploying CCS include operational costs, such as maintenance and materials (such as amine solvents to capture CO2), the energy penalty associated with capture and compression, and the costs associated with transport and storage (such as additional compression requirements). These elements may represent a significant share, up to one-third, of annualized CCS costs with the remainder consisting of financing costs.
35 CCS demonstration is focused so far in developed countries. In a recent report from the Carbon Sequestration Leadership Forum (CSLF) and the IEA, it was highlighted that between US$26.6 and US$36.1 billion of funding to support 19–43 large-scale CCS demonstration projects has been allocated across OECD regions (IEA/CSLF 2010).
36 Abatement costs for CCS projects are expressed in U.S. dollars per ton CO2 avoided and calculated as the ratio between additional costs and avoided emissions. Additional costs correspond to the annualized expenditures of building and operating the CCS component in a project. They include capital repayment and operation (fuel and maintenance, transport and storage). Avoided emissions are defined as the level of emissions abatement achieved by CCS-equipped facilities relative to the emissions of an equivalent facility (that is, with the same output) without CCS. It reflects the “energy penalty” associated with CCS equipment. The different cost tranches presented within each sector reflect regional cost differences and/or the varying economics of different project and technology options within sectors and subsectors. For detailed explanations of the metrics used, see Box D.1 in Appendix D.
48
depending on the prevailing carbon price, these upfront needs could be met through a dedicated public fund with capitalization of approximately US$4–20 billion (for carbon prices of US$50/ton CO2 and US$15/ton CO2, respectively).
Nationally Appropriate Mitigation Actions (NAMAs), recently formalized at COP 16, could provide a framework for combining options for CCS support, bringing together domestic financing and policy support (including such measures as mandating capture or capture-ready design at new-build facilities, indirect support through carbon taxes and levies, or the use of feed-in tariffs for CCS in the power sector) with international support through climate finance.
The proposed Technology Mechanism, for example, could also play a role in supporting other aspects of deployment for pre-commercial technologies, by offering loan guarantees to buy down project financing costs or developing a system of carbon price floors or credit revenue guarantees. Other types of softer support could include activities, such as supporting the optimization of regional CCS deployment by providing additional up-front support for pipeline oversizing (for example, lending the incremental capital requirements), and undertaking financial analysis for potential project clustering.
Other alternative forms of climate finance to foster CCS development have been suggested in the literature, such as fund-based financing structures—that is, creation of an international public fund solely dedicated to CCS37 or a CCS window within a larger fund that may also finance other pre-commercial low-carbon technologies in developing countries (Almendra and others, 2011). Another option is possible bilateral partnerships between developed and developing countries that might be accounted as fast track financing under the UNFCCC and bilateral crediting systems that might include CCS (Hagemann and others 2011).
The relative contribution of market and nonmarket mechanisms is highly dependent on project types. The
analysis suggests that market mechanisms could work well to support lower-cost, early opportunities, such as in natural gas processing (subject to the timely resolution of regulatory, policy, and methodology issues, discussed below). For example, project-based approaches such as the CDM, in particular when blended with other sources and forms of dedicated public assistance, may be applicable to lower-cost, single-operator CCS projects, such as those associated with isolated high-CO2 concentration natural gas field developments. In this sector, the technology is more mature, with several hundred CO2 removal facilities in operation around the world as of today. Further, operators in this sector are typically well capitalized, they have in-house expertise suitable for project development, for example on regulatory aspects relating to subsurface issues and, in the case of international oil companies, they have direct drivers for accessing carbon assets.
These early opportunity projects in the natural gas industry can help demonstrate successful CCS implementation in developing countries and allow experience to be gained with, in particular, methodological and accounting approaches and technical subsurface issues, which tend to be the most challenging and are generic for all types of CCS applications. Further, these types of projects can support the early stage development of expanded infrastructure by establishing qualified storage sites that may be suitable for storing CO2 captured from other sources in the future.
However, there are challenges for these projects in gaining access to climate finance, since the oil and gas sector has historically struggled to access mechanisms such as the CDM, for a range of reasons, including in-house and external political factors.38 Further, any realistic expectations of the level of support for CCS projects through market-based instruments would need to account for some intrinsic limitations of performance-based crediting, including limited capacity both in leveraging projects with high upfront investment needs, and to support demonstration stage technologies, because of the institutional and political uncertainty
37 Such dedicated CCS fund might help to address the issue of limited ability of CCS to compete with other commercially deployed mitigation technologies (Almendra and others 2011).
38 Within the current portfolio of CDM projects, the sector has only around 35 projects supporting around 66 MtCO2 of annual emission reduction. This restricted access to the CDM, among other economic and political factors, results from the perception of potential perverse incentives for CDM projects in the extractive industries (additionality of reductions) and to the complexity and limited flexibility of current methodological approaches to estimate and monitor achieved emission reductions. These aspects created significant uncertainty around the prospect of generating carbon revenues from CDM projects in oil and gas sector, which in turn reduced the appetite of investors for GHG mitigation opportunities in this sector.
49
over the acceptability of the CCS-generated emission reductions. If these challenges are to pervade into the next decade—which is possible, given the potential perverse outcomes that some Parties and Observers have associated with CCS under carbon finance39—there is a strong possibility that the contribution of these funding sources to the vital near-term demonstration efforts for CCS in developed countries could be, at best, deferred and at worst, missed altogether.
Longer-term support for CCS demonstration through climate finance (beyond 2020)
Although the abatement costs within each sector are expected to have fallen by 2030 through technology demonstration, fewer low-cost “early opportunity” projects would be available, resulting in a sectoral shift in deployment towards larger-emitting, but more challenging sectors, such as coal- and gas-fired power generation facilities, iron and steel plants, and cement kilns. Consequently, per-ton CO2 deployment costs are overall expected to rise on average over this period, as shown in the MAC curve in Figure 5.2. The shift in the scale of deployment will require a corresponding step-change in the finance and investment needs.
Because CCS will be only one of several low-carbon technology options calling for significant climate finance over the coming decades, the level of ambition will need to rise from what is currently envisaged to meet the required mitigation investment needs of the future, in order to cover the average annual finance needs of US$11 billion per year over the period 2021 to 25 and US$30 billion per year from 2025 to 2030. New forms of climate finance involving cooperative combinations of domestic and international support will likely be necessary to deliver these levels of investment.
Timing is a critical factor in scenarios of CCS deployment and financing. Although the near-term financing needs associated with CCS demonstration are modest compared to the levels of climate finance potentially available, the success of this phase over the next decade or so will be critical to realizing the longer-term vision for CCS and climate change mitigation. Important lessons and experience gained over this period include technology demonstration,
improved technology integration, and cost reduction. The fast-tracking of demonstration projects in low-cost opportunities also allows targeted technical, regulatory, and institutional capacity building in developing countries. Yet, given the lead time in developing operational CCS projects and constructing cost-effective, optimized CO2 pipeline networks and storage hubs, it is essential to rapidly provide sufficient certainty concerning the shape of future policy frameworks and the associated amount, schedule, mechanisms, and modalities of climate finance, in order to avoid deferring or missing the important benefits obtained during a period of technology demonstration.
Challenges for CCS Projects in Developing Countries to Access Carbon Finance
Climate finance may become available in a variety of forms and should be combined in an effective way for supporting demonstration and deployment of CCS technologies in developing countries over the period up to 2030. The capacity of CCS to be eligible for these various forms of climate finance will rest on policy makers and investors being assured that the technology can deliver emission reductions permanently, at an affordable cost, and with a low risk of failure for both capture and storage. Critical to this will be the development of high-quality CCS projects in which the risks of technology failure have been minimized to a sufficiently low level that is comfortable for investors.
However, in practice, a range of qualitative factors will likely have a major impact on the perspectives of CCS projects to access climate finance and achieve the projected level of financing needs for CCS in developing countries. These factors are assessed in the section below.
Key Policy Issues Defining CCS Attractiveness for Climate Finance
Many legal, regulatory, and policy issues remain to be resolved at the international level, including, for example, approaches to managing permanence, project boundaries, MRV, and safety and environmental impacts. At the present time, these issues are being discussed by Parties to the Kyoto Protocol in the context
39 Such as an increase in production and consumption of fossil fuel, diverting investment away from other low-emission technologies, creating new emissions through combustion of fossil fuels obtained through EOR, enhancing CO2 generation to maximize carbon asset potential, and constraining bio-energy with CCS (BECCS). See Zakkour and others 2011, Section 5.1.7.
50
Both approaches have advantages and disadvantages, although the former approach (buyer liability) has significantly eroded demand for carbon assets from afforestation and reforestation projects under the CDM. Emerging preferences among developed country Parties—as expressed in views on the inclusion of CCS in the CDM—is to opt for the seller liability approach, although this may not receive widespread support from developing country Parties.
Secondly, and in particular for a seller liability approach, there is also a need to consider the use of a financial assurance mechanism to ensure the longer-term availability of funds for the host country to cover any costs associated with the long-term stewardship of storage sites (for example, monitoring and remediation in the event of carbon reversal). This could involve either some form of a global pooled trust fund, or private or bilateral instruments agreed between a developer and the host country. The precise shape and form of each option has yet to be fully explored and evaluated, although there is general consensus among Parties considering CCS in the CDM that some form of insurance might be needed to cover compensation because of seepage, as reflected in recent Decisions on the matter at the UNFCCC level.
Further, in the case of regulatory developments in developing countries, the precise scope and extent of requirements is partly contingent on the approach taken to manage permanence and long-term liability, with a seller liability model probably posing more onerous requirements in relation, for example, to the need to set down a structured approach to liability transfer for any related financial assurance mechanism.
Main Components of a High-Quality CCS Project Design and Operational Practice
Subject to the range of issues outlined previously being resolved, several other key components will be needed within a CCS project development plan in order to attract climate finance and generate fungible carbon assets. The establishment of rules, steps, and criteria for project design and operation is an important part of future accounting rules for any climate finance mechanism supporting CCS projects in developing countries.41 The
of modalities and procedures for CCS inclusion within the CDM. The topics under consideration within the context of the CDM will, however, be critical for the design of MRV approaches by setting important precedents for future mechanisms for climate finance that might support CCS. Three of the key issues to be resolved include the following:
• How to account for the permanence (or non-permanence) of emissions avoided through CCS, if a carbon reversal were to occur as a result of CO2 leaking from a storage site.
• Whether and what form of mechanism might be employed to provide financial assurance over long-term stewardship and the risk of carbon reversal.
• The extent to which governments will have to implement domestic regulatory regimes to cover various aspects relating to CCS project development, management, and long-term stewardship (for example, project design and operational standards, including MRV aspects). This will be strongly influenced by the requirements developed at the international level in relation to climate finance for CCS.
There exists a broad range of literature sources, describing options for tackling many of the issues raised.40
Managing Permanence and Long-Term Liability for Seepage
In the case of permanence, which has been defined as “a quantitative term to characterize whether the removed carbon dioxide stays out of the atmosphere for a long time” (Sharma 2006), the leakage of CO2 from the storage site into the surrounding environment would compromise the political and technical objectives of the technology and erode the environmental integrity of any emissions trading scheme, into which carbon assets from leaking CCS projects have been sold. It is presently unclear whether permanence issues will be managed through a buyer liability approach (for example, the use of temporary carbon assets) or seller liability approach (for example, host country takes on long-term permanence risk), which would either couple or decouple liability from the carbon assets generated.
40 This includes submissions from Parties and Observers to the UNFCCC spanning several years up to and including the most recent round in March 2011 (available at UNFCCC 2011a); the UNFCCC Synthesis Reports of previous submissions (UNFCCC (2008a) and UNFCCC (2008b)), reports from the IEAGHG in both 2007 and 2008 (IEAGHG 2007; 2008) and a recent set of recommendations for addressing the key issues for CCS in the CDM published at the end of 2010 by the World Resources Institute (WRI) (WRI 2010a).

transparent MRV approaches are essential to ensure the environmental integrity of international offsets. At the same time, the MRV approaches should be practicable and enforced at acceptable costs for project operators. For instance, taking into account the heterogeneity of subsurface conditions of CCS geological storage sites, it would be more practicable to develop a generalized series of steps and procedures that would need to be tailored on a project-by-project basis (based on the appropriate techniques, locations, and frequency of application) rather than establish the prescriptive approaches. It is also important to ensure that there is sufficient competence within the auditing entities at the national and international level, so as to enable efficient third-party verification of the CCS projects and reported CO2 emission reductions. It is also critical to maintain a degree of flexibility on any overarching rules to ensure their improvement and evolution along with the lessons learned from the demonstration of CCS activities in developing countries.
Table D.3 in Appendix D provides an overview of the main components for good practice for CCS project design and operation.
Role of International and National Regulation in Establishing Rules and Standards for CCS Projects
Concerning CCS project design standards, it is presently unclear whether centralized approaches (involving the setting of detailed rules and procedures at the UNFCCC level, for example, site selection) or decentralized approaches (involving, for example, imposition of a range of eligibility criteria that countries wishing to obtain climate finance for CCS would need to implement in national legislation) will be taken. Some developed country Parties and experts have suggested that the presence of national CCS legislation should be a prerequisite for hosting CCS projects under the CDM, a view that partly relates to their support for the seller liability preference to managing permanence. However, the view also seems to prejudge the extent of rules
effective project design and operation would need to cover robust selection and characterization procedures for geological storage sites, the carrying out of risk assessments that can effectively assess the likelihood of achieving long-term or permanent storage, methods that can establish appropriate modes of operation for storage sites, and the defining of project boundaries and the MRV requirements for CCS projects within those boundaries, as well as closure and stewardship of the site post-closure.
Projects would also need to conform to relevant domestic and international laws that could apply to CCS, such as requirements for EIAs, social impact assessments, and requirements under, for example, the London Convention and Protocol thereto, as discussed in Chapter 4 on legal and regulatory frameworks potentially applicable to CCS.
Addressing these regulatory aspects of CCS projects is necessary to minimize exposure to risks related to CCS operations, including the risk of seepage.42 A range of good-practice examples exists for all these aspects of project design.43 Bringing together this knowledge and experience into a comprehensive yet workable framework for CCS project development will likely be critical for unlocking climate finance support for high-quality CCS projects in developing countries in coming years.
The MRV approaches to be implemented in CCS projects represent an important part of the rules for accounting for CO2 stored in CCS projects. The monitoring plan should cover the entire set of components included in the project boundaries. Monitoring should also continue for a period after a storage site has been closed (post-closure monitoring can also provide a useful basis for liability transfer from operator to state, if appropriate).
The experience gained so far by CDM/JI (Joint Implementation) projects, as well as by the Green Investment Schemes (GIS),44 suggests that robust and
41 An example of a potential high-level approach is contained in Annex I and Annex II of the EU’s CCS Directive (Directive 2009/31/EC). Annex I sets out steps for site selection and risk assessment. Annex II sets out guidance on monitoring plan design, including procedures for updating the monitoring plans during the operational phase of a CO2 storage site.
42 The above-ground components of CCS projects present similar risk as those presented by other large infrastructure projects, including oil and gas field developments, power plants, gas distribution networks and other large industrial facilities. Management of occupational health and safety, civil protection, and environmental impacts related to these components should be covered under existing controls applicable in the host country. Subsurface storage, including seepage, also presents health, safety, and environmental risks.
43 This includes the 2006 IPCC Guidelines for National Greenhouse Gas Inventories (IPCC 2006), various emerging legal frameworks in OECD countries, a proposal for a new methodology for CCS within the CDM for the In Salah project in Algeria, and publications from industry sources and reputable international organizations.
44 Green Investment Scheme (GIS): A GIS is a voluntary mechanism through which proceeds from AAU transactions will contribute to contractually agreed environment- and climate-friendly projects and programs both by 2012 and beyond.
52
term certified emission reductions (tCERs, lCERs) are prohibited in several developed country ETSs today. Conversely, a seller liability approach could result in the introduction of differential approaches to regulatory aspects of CCS projects, such as approaches to managing liability across developing countries. This might lead to a situation in which some jurisdictions would impose their own standards for accepting CCS-derived carbon assets, or could result in a total prohibition on such use of assets by some emissions trading scheme operators. A further outstanding issue to be resolved is whether value-added applications, such as EOR, will be eligible for climate finance.
The key questions for fungible treatment of CCS-derived offsets, and the potential use of restrictions in Annex I carbon markets, mirror similar ongoing discussions concerning CCS inclusion within the CDM and its treatment within the UNFCCC policy framework. As a consequence, the important remaining challenges relate to the development of robust and enforceable rules and guidelines to fast-track support for CCS through market-based mechanisms of climate finance.
Impact of Baseline Methodology Selection
Although the precise impact of the baseline methodology selection has not been analyzed in detail, the baseline selection could potentially reduce the level of offsets supplied by CCS in the order of 40–60 percent of the estimates outlined in the previous section. The data used in this analysis is based on the “avoided CO2” emissions calculated on the basis of the emissions associated with the same underlying process with the same output, but absent CCS. In practice, baselines may be calculated at a regional or sector level (for example, a grid emission factor in the power sector) or according to the best available technology in the sector. This allows an assessment to be made in a conservative manner of an alternative option that would be implemented in the absence of the CDM project, but providing similar service.
Other approaches could also be considered for CCS projects. In particular, drawing parallels with the existing methodologies for waste recovery (and utilization) or associated gas flaring reduction activities in the oil and gas sector.
Further, under the potential sectoral trading, if the baselines are defined at the sectoral level without
that could emerge under international climate change frameworks for CCS. Today, uncertainty in these respects has ramifications for the design of domestic CCS legislation in terms of its scope and extent, for example, in terms of the level of detail on site selection that might need to be implemented in national legislation. Delays in decisions at the international level on this matter affect the capacity of developing countries to implement appropriate national legislation and standards for CCS.
Other Policy and Methodology Factors Affecting the Level of Support for CCS from Climate Finance
The level of benefit from climate finance will also depend on the approaches to be used to define and account for GHG emission reductions eligible for trading and crediting through the market-based mechanisms in their current and future forms. The following two main limitations would alter the level of support and the financing profile of CCS projects presented previously: (a) restricted fungibility of CCS assets (that is, their ability to be mutually recognized and tradable across different developed countries’ ETSs), including the issues related to potential linking of ETSs that might affect the eligibility of CCS assets for trading; and (b) the approaches selected for defining the baseline level of CO2 emissions that may also have tangible impacts on the net amount of CCS assets eligible for crediting.
Possible Restrictions on the Fungibility of CCS-Generated Assets
Various restrictions may apply to the CCS-related assets generated in developing countries under current and future ETSs. These restrictions may relate to the perception of the environmental integrity and acceptance of CCS-generated assets within the established regulatory and institutional framework (based on the evaluation of the robustness of project design and operation standards, MRV approaches, treatment of permanence and long-term liability, treatment of CCS projects involving EOR, and so forth).
Approaches to managing permanence and long-term liability could also have ramifications for the fungibility of CCS derived carbon assets. For example, if temporary credits are issued under a buyer liability approach model, this would likely significantly erode demand for such credits in the carbon market, as has been seen for afforestation and reforestation projects under the current CDM, and temporary and long-
53
allocation to individual entities, the incentive provided by the carbon price signal may be less direct or insufficient to alleviate the high risks of CCS projects. In fact, in this case offsets may be only awarded based on the performance of the whole sector achieving a set reduction target, which would in all likelihood deter any investment in step-change reduction technologies, such as CCS. Under potential NAMA crediting, if different layers of climate finance are envisaged, only a limited portion of emission reductions achieved by CCS activities might be eligible for carbon finance (for example, a portion of the costs met through implementation of domestic polices and measures, a portion of finance provided by concessional loans, and a remaining portion of costs provided through the sale of carbon assets). In either case, the financing profile presented previously would be altered, meaning a change in emphasis away from carbon asset generation towards the use of other types of mechanisms to raise finance. In this context, NAMAs with a potentially layered approach to climate finance offer a possible effective mechanism to channel finance to CCS.
Potential In-Country Limitations for CCS Deployment in Developing Countries
Notwithstanding the range of options for managing the environmental integrity of CCS and its acceptability under the climate finance, potential limitations could also arise in host country requirements and capacities. This section discusses some of the main in-country limitations for CCS deployment and suggests a set of capacity building activities that would help to alleviate them. In-country factors, potentially affecting CCS deployment, may include the following:
• Potential lack of awareness about CCS technologies, including their costs, prospective applications, legal aspects, and technical factors.
• Lack of legal and regulatory regimes that are able to accommodate CCS projects, in particular, the CO2 storage component.
• Lack of suitable institutions and regulatory capacities to provide oversight for project design, development, operation, closure, and longer-term aspects of site stewardship.
• Lack of host government policies and private sector strategies that may be geared towards the demonstration and deployment of CCS, including those that represent early opportunities.
Domestic Legal and Regulatory Requirements
It is currently uncertain what in-country legal requirements would be needed in order for developing countries to host CCS projects, which could attract climate finance and generate internationally acceptable CCS-derived carbon assets.45 Greater clarity is necessary in a number of areas including the following:46
• The level of technical detail that might be factored into international modalities and procedures for CCS (for example, within the CDM) with respect to the CO2 storage site selection and operation, and the degree to which a prescriptive approach will be taken in the main components of CCS project design and operational rules and standards.
• A set of technical aspects that might need to be elaborated in secondary implementing tools, such as approved methodologies and project financing guidelines, as well as the level of complexity and flexibility of these tools.
• Approaches to managing permanence and long-term liability at the national, bilateral, or multilateral level (for example, under UNFCCC mechanisms).
The way and extent to which these aspects, as well as other legal and regulatory requirements, will be handled at the international level, will determine the scope and extent of issues to be covered in national laws and regulations. The level of detailed guidance on the design of modalities and procedures issued by the Parties in Decision 7/CMP.6 suggests that, at least within the CDM framework, a significant amount of detail will be included within guidelines at the UNFCCC level. At the same time, the presence of national laws and regulations for CO2 storage sites (and potentially other aspects) is viewed by some developed countries as a precondition for developing countries to host CCS projects.
Even though significant uncertainty remains on regulatory needs, legislation pertaining specifically to
45 It is important to be mindful in this context that it is possible for developing countries to develop CCS projects within their own jurisdictions today, irrespective of activities at the international level. The issues described here relate only to those actions that might be necessary in order for countries to host projects that would be eligible to receive climate finance.
46 The full list of regulatory issues to be addressed when creating a sound regulatory framework for CCS is suggested in IEA 2010b.
54
CO2 storage, for example, could be developed within existing legal frameworks, such as oil and gas field development regulations. This will particularly be the case where CO2 injection operations take place within an existing oil or gas field lease, where laws are already define the modalities for subsurface access and use, regulations exist defining the operational practices for the field (for example, within a field development plan), and a competent regulator is in place to oversee activities.47 Flexible approaches to regulation that recognizes the distinction in different project types and allows for “fast-tracking” within well-established hydrocarbon laws could be an attractive solution to facilitate early development and demonstration of CO2 storage activities in developing countries. This is a particularly relevant issue with respect to the CCS demonstration and deployment pathway outlined previously, and the focus on gas processing projects in the near term.
Capacity-Building Needs
Capacity building and knowledge exchange will play an important role in ensuring CCS demonstration and deployment in developing countries. The number of ongoing and planned initiatives and activities in this area is growing, including regional workshops and other in-country supported activities, such as the establishment
of research centers and programs supported by multi- and bilateral institutions. Other important activities for regulatory aspects include the IEA’s International CCS Regulatory Network, where several developing country participants have been invited to attend in recent years, including participants from Botswana, Malaysia, Mexico, South Africa, and Vietnam in 2011, as well as China, India, and Brazil in 2010.48 The World Bank CCS Capacity Building Trust Fund is also planning a range of capacity-building activities in Asia (for example, China, India, and Indonesia), the Middle East (for example, Egypt and Jordan), North Africa and the Maghreb (for example, Algeria, Morocco, and Tunisia), the Balkans (for example, Kosovo), and Southern Africa (for example, Botswana and South Africa). Table D.2 in Appendix D provides a summary of CCS activities in developing countries.
Further initiatives would need to build upon the ongoing effort and ensure the avoidance of duplication of efforts in covering a broad range of institutional, technical, and management capacity building needs in developing countries. In addition to broader awareness-raising activities, suggested capacity building components that would target the development of regulatory frameworks, institutional capacities, and appropriate approaches defining the attractiveness of CCS for climate finance are summarized in Table D.4 in Appendix D.
47 This is the case now with the In Salah project in Algeria, which is overseen within the scope of the Joint Venture partners’ gas-producing lease.48 More information available at http://www.iea.org/ccs/legal/network.asp.
55
6. PROJECT FINANCE FOR POWER PLANTS WITH CARBON CAPTURE AND STORAGE IN DEVELOPING COUNTRIES
Chapter 5 of this report discusses the climate financing needs required for CCS to be deployed at on the trajectory described in the IEA Blue Map Scenario, and specific market and nonmarket mechanisms that could be used to achieve these trajectories. As a next step, this chapter narrows the focus of financing to the project level, summarizing the results of a study to investigate (a) how certain parameters affecting project cash flows can impact the LCOE, (b) possible ways to structure financing for power generation facilities equipped with CCS in the developing world using instruments available from both multilateral development banks and commercial financiers, and (c) whether a combination of such instruments could result in reductions in the overall cost of financing and consequently requiring smaller incremental increases in electricity rates.
The study examines these parameters through investigating the percentage increase in the LCOE of a coal plant with CCS with respect to a corresponding plant of the same combustion technology without CCS (the reference plant). By this construction, the definition of financial viability for this study is a power plant with CCS having an LCOE equal to that of a plant of the same technology without CCS. To understand the implications of the results in reality, consideration should be given to whether the bar for financial viability should be set higher, perhaps on a par with other low GHG–emitting technologies. The reason for this is that if there is ambition to reduce emissions, these low-carbon technologies should be competing with each other, rather than with the current source of power generation.
As mentioned earlier in the report, cost estimates for CCS technology are highly uncertain. This should be borne in mind while reviewing the results, rather than interpreting the absolute values as the key findings of the analysis. Further, given that this analysis has been performed for generic coal plants as “reference plants” and not for a specific region or project, the findings should be viewed as illustrative of general relationships between parameters and the financial viability of potential power projects with CCS. The model used for the analysis is available and can be edited as the user wishes to model the financial viability of particular
CCS projects with known specifications (World Bank 2011d).
Key Findings
They key findings of the analysis are presented in Table 6.1. Unless otherwise stated, the numeric results described in Table 6.1 are for medium coal prices (US$3/MMBtu), wet-cooled generation technologies, full capture CCS (90 percent of plant emissions) without extra revenues from enhanced hydrocarbon recovery, and they assume 50 percent financing from MDBs and 50 percent from commercial loans. Reference plants never include concessional sources as part of their financing. Of the many scenarios examined, only a subset are presented in this report, since the implications drawn from these results are consistent across variations in parameters and financing scenarios, and demonstrate the main trends observed. See Box 6.1 for an explanation of the LCOE.
Methodology
The study method involves adapting a model of LCOE (Du and Parsons 2009) for coal plants with and without CCS technology. For the purposes of investigating the effects in variations of financial instruments, reference 500 MW coal power plants, of different power generation technologies and cooling methods, are built into the model. For each reference plant, a coal plant of the same generation technology and cooling method, but with capture technology appropriate to the plant type, is also included in the model. The plants with CCS are modeled as new builds, rather than plants retrofitted with CCS. Transport and storage costs are also included. The model includes varying parameters to allow for the examination across the CO2 capture technologies. These variable parameters are CO2 capture rates, coal prices, and potential revenue streams from EOR/ECBM recovery or carbon prices. For each combination of the varied parameters described above, different financing structures are tested as scenarios, including a combination of instruments employed by MDBs and commercial lenders, as well as concessional finance, to assess their impact on lowering the LCOE for the coal plants equipped with CCS technology. For each scenario and capture technology, the analysis examines the percentage change in the LCOE from the reference plant (the plant without CCS) to the corresponding plant with CCS.
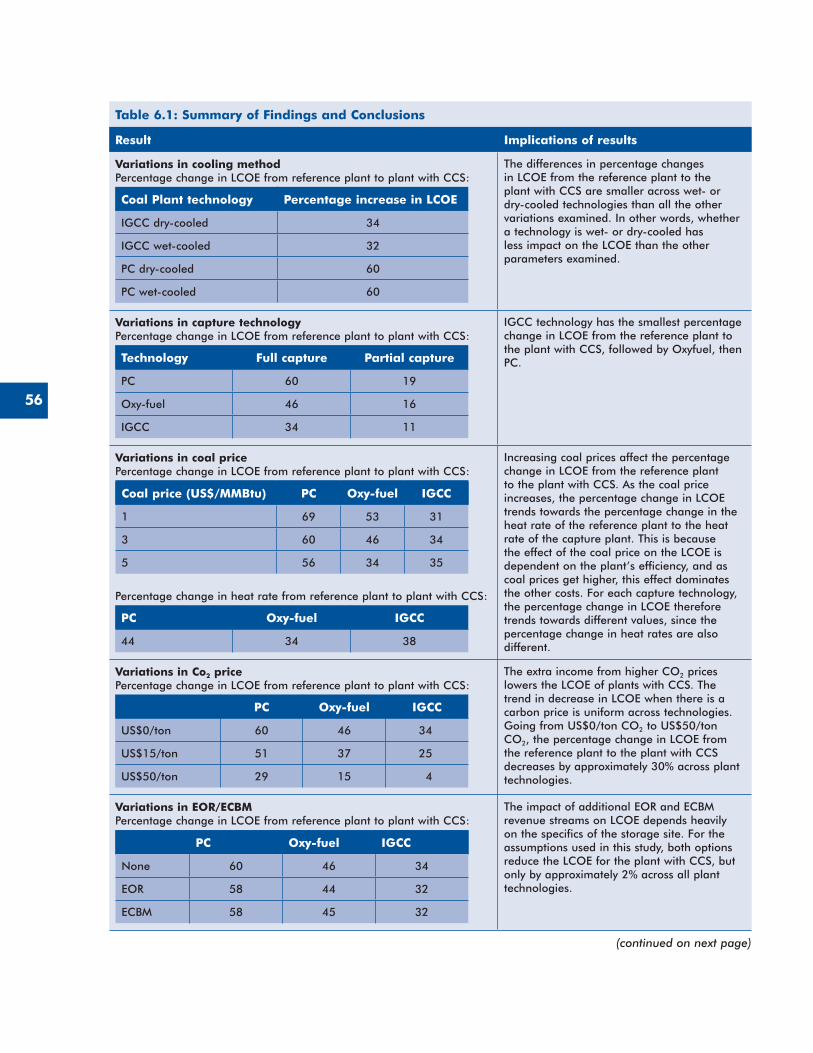
56
Table 6.1: Summary of Findings and Conclusions
Result Implications of results
Variations in cooling methodPercentage change in LCOE from reference plant to plant with CCS:
Coal Plant technology Percentage increase in LCOE
IGCC dry-cooled 34
IGCC wet-cooled 32
PC dry-cooled 60
PC wet-cooled 60
The differences in percentage changes in LCOE from the reference plant to the plant with CCS are smaller across wet- or dry-cooled technologies than all the other variations examined� In other words, whether a technology is wet- or dry-cooled has less impact on the LCOE than the other parameters examined�
Variations in capture technologyPercentage change in LCOE from reference plant to plant with CCS:
Technology Full capture Partial capture
PC 60 19
Oxy-fuel 46 16
IGCC 34 11
IGCC technology has the smallest percentage change in LCOE from the reference plant to the plant with CCS, followed by Oxyfuel, then PC�
Variations in coal pricePercentage change in LCOE from reference plant to plant with CCS:
Coal price (US$/MMBtu) PC Oxy-fuel IGCC
1 69 53 31
3 60 46 34
5 56 34 35
Percentage change in heat rate from reference plant to plant with CCS:
PC Oxy-fuel IGCC
44 34 38
Increasing coal prices affect the percentage change in LCOE from the reference plant to the plant with CCS� As the coal price increases, the percentage change in LCOE trends towards the percentage change in the heat rate of the reference plant to the heat rate of the capture plant� This is because the effect of the coal price on the LCOE is dependent on the plant’s efficiency, and as coal prices get higher, this effect dominates the other costs� For each capture technology, the percentage change in LCOE therefore trends towards different values, since the percentage change in heat rates are also different�
Variations in Co2 pricePercentage change in LCOE from reference plant to plant with CCS:
PC Oxy-fuel IGCC
US$0/ton 60 46 34
US$15/ton 51 37 25
US$50/ton 29 15 4
The extra income from higher CO2 prices lowers the LCOE of plants with CCS� The trend in decrease in LCOE when there is a carbon price is uniform across technologies� Going from US$0/ton CO2 to US$50/ton CO2, the percentage change in LCOE from the reference plant to the plant with CCS decreases by approximately 30% across plant technologies�
Variations in EOR/ECBMPercentage change in LCOE from reference plant to plant with CCS:
PC Oxy-fuel IGCC
None 60 46 34
EOR 58 44 32
ECBM 58 45 32
The impact of additional EOR and ECBM revenue streams on LCOE depends heavily on the specifics of the storage site� For the assumptions used in this study, both options reduce the LCOE for the plant with CCS, but only by approximately 2% across all plant technologies�
(continued on next page)
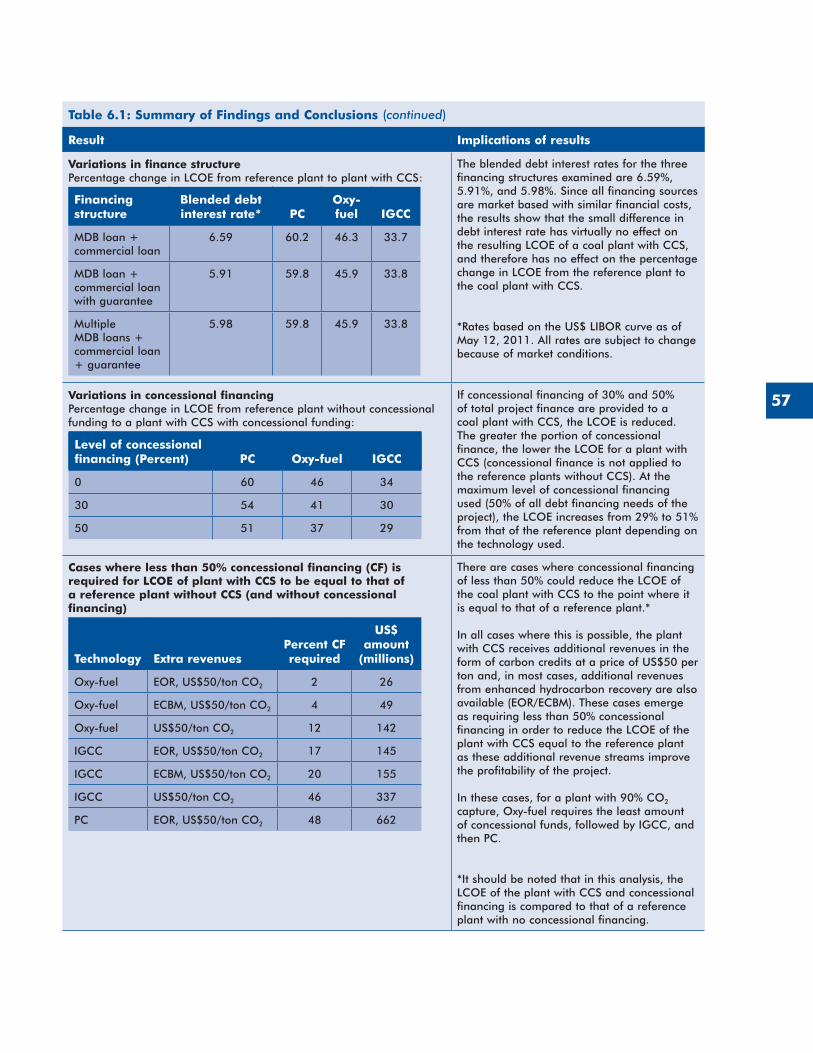
57
Table 6.1: Summary of Findings and Conclusions
Result Implications of results
Variations in finance structurePercentage change in LCOE from reference plant to plant with CCS:
Financing structure
Blended debt interest rate* PC
Oxy-fuel IGCC
MDB loan + commercial loan
6�59 60�2 46�3 33�7
MDB loan + commercial loan with guarantee
5�91 59�8 45�9 33�8
Multiple MDB loans + commercial loan + guarantee
5�98 59�8 45�9 33�8
The blended debt interest rates for the three financing structures examined are 6�59%, 5�91%, and 5�98%� Since all financing sources are market based with similar financial costs, the results show that the small difference in debt interest rate has virtually no effect on the resulting LCOE of a coal plant with CCS, and therefore has no effect on the percentage change in LCOE from the reference plant to the coal plant with CCS�
*Rates based on the US$ LIBOR curve as of May 12, 2011� All rates are subject to change because of market conditions�
Variations in concessional financingPercentage change in LCOE from reference plant without concessional funding to a plant with CCS with concessional funding:
Level of concessional financing (Percent) PC Oxy-fuel IGCC
0 60 46 34
30 54 41 30
50 51 37 29
If concessional financing of 30% and 50% of total project finance are provided to a coal plant with CCS, the LCOE is reduced� The greater the portion of concessional finance, the lower the LCOE for a plant with CCS (concessional finance is not applied to the reference plants without CCS)� At the maximum level of concessional financing used (50% of all debt financing needs of the project), the LCOE increases from 29% to 51% from that of the reference plant depending on the technology used�
Cases where less than 50% concessional financing (CF) is required for LCOE of plant with CCS to be equal to that of a reference plant without CCS (and without concessional financing)
Technology Extra revenuesPercent CF required
US$ amount
(millions)
Oxy-fuel EOR, US$50/ton CO2 2 26
Oxy-fuel ECBM, US$50/ton CO2 4 49
Oxy-fuel US$50/ton CO2 12 142
IGCC EOR, US$50/ton CO2 17 145
IGCC ECBM, US$50/ton CO2 20 155
IGCC US$50/ton CO2 46 337
PC EOR, US$50/ton CO2 48 662
There are cases where concessional financing of less than 50% could reduce the LCOE of the coal plant with CCS to the point where it is equal to that of a reference plant�*
In all cases where this is possible, the plant with CCS receives additional revenues in the form of carbon credits at a price of US$50 per ton and, in most cases, additional revenues from enhanced hydrocarbon recovery are also available (EOR/ECBM)� These cases emerge as requiring less than 50% concessional financing in order to reduce the LCOE of the plant with CCS equal to the reference plant as these additional revenue streams improve the profitability of the project�
In these cases, for a plant with 90% CO2 capture, Oxy-fuel requires the least amount of concessional funds, followed by IGCC, and then PC�
*It should be noted that in this analysis, the LCOE of the plant with CCS and concessional financing is compared to that of a reference plant with no concessional financing�
(continued)
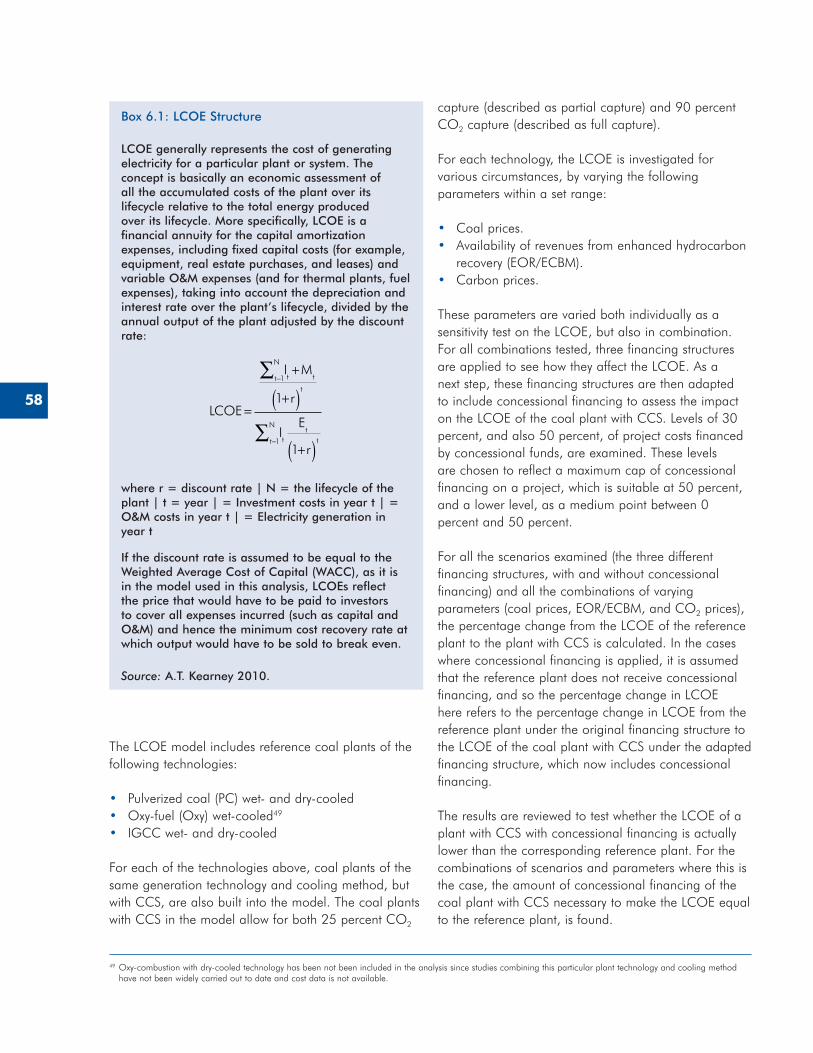
58
The LCOE model includes reference coal plants of the following technologies:
• Pulverized coal (PC) wet- and dry-cooled• Oxy-fuel (Oxy) wet-cooled49
• IGCC wet- and dry-cooled
For each of the technologies above, coal plants of the same generation technology and cooling method, but with CCS, are also built into the model. The coal plants with CCS in the model allow for both 25 percent CO2
capture (described as partial capture) and 90 percent CO2 capture (described as full capture).
For each technology, the LCOE is investigated for various circumstances, by varying the following parameters within a set range:
• Coal prices.• Availability of revenues from enhanced hydrocarbon
recovery (EOR/ECBM).• Carbon prices.
These parameters are varied both individually as a sensitivity test on the LCOE, but also in combination. For all combinations tested, three financing structures are applied to see how they affect the LCOE. As a next step, these financing structures are then adapted to include concessional financing to assess the impact on the LCOE of the coal plant with CCS. Levels of 30 percent, and also 50 percent, of project costs financed by concessional funds, are examined. These levels are chosen to reflect a maximum cap of concessional financing on a project, which is suitable at 50 percent, and a lower level, as a medium point between 0 percent and 50 percent.
For all the scenarios examined (the three different financing structures, with and without concessional financing) and all the combinations of varying parameters (coal prices, EOR/ECBM, and CO2 prices), the percentage change from the LCOE of the reference plant to the plant with CCS is calculated. In the cases where concessional financing is applied, it is assumed that the reference plant does not receive concessional financing, and so the percentage change in LCOE here refers to the percentage change in LCOE from the reference plant under the original financing structure to the LCOE of the coal plant with CCS under the adapted financing structure, which now includes concessional financing.
The results are reviewed to test whether the LCOE of a plant with CCS with concessional financing is actually lower than the corresponding reference plant. For the combinations of scenarios and parameters where this is the case, the amount of concessional financing of the coal plant with CCS necessary to make the LCOE equal to the reference plant, is found.
Box 6�1: LCOE Structure
LCOE generally represents the cost of generating electricity for a particular plant or system� The concept is basically an economic assessment of all the accumulated costs of the plant over its lifecycle relative to the total energy produced over its lifecycle� More specifically, LCOE is a financial annuity for the capital amortization expenses, including fixed capital costs (for example, equipment, real estate purchases, and leases) and variable O&M expenses (and for thermal plants, fuel expenses), taking into account the depreciation and interest rate over the plant’s lifecycle, divided by the annual output of the plant adjusted by the discount rate:
LCOE
I M
r
IE
r
t tt
N
t
tt
tt
N
=
+
+( )
+( )
−
−
∑
∑
1
1
1
1
where r = discount rate | N = the lifecycle of the plant | t = year | = Investment costs in year t | = O&M costs in year t | = Electricity generation in year t
If the discount rate is assumed to be equal to the Weighted Average Cost of Capital (WACC), as it is in the model used in this analysis, LCOEs reflect the price that would have to be paid to investors to cover all expenses incurred (such as capital and O&M) and hence the minimum cost recovery rate at which output would have to be sold to break even�
Source: A�T� Kearney 2010�
49 Oxy-combustion with dry-cooled technology has been not been included in the analysis since studies combining this particular plant technology and cooling method have not been widely carried out to date and cost data is not available.
59
Description of the Model
The model determines the LCOE by calculating the cash flows in every project year and discounting these to the base year using the weighted average cost of capital (WACC). The WACC is a way of estimating the project’s discount rate and is defined as follows:
WACC = (Equity return rate x [1- Debt fraction]) + (After tax Average Debt rate x Debt fraction)
Equity financing is capped at 35 percent of total required financing for each technology, and the expected rate of return on equity is 20 percent in all cases.
With respect to the debt rate used in this study, different combinations of the following funding sources are used: (a) two types of MDB loans, (b) commercial loans, (c) cheaper commercial loans as a result of an applied guarantee,50 and (d) concessional loans with cheaper terms compared to MDB loans (terms similar to Clean Technology Fund (CTF) loans). The model calculates the Internal Rate of Return (IRR) for each funding source based on the financial terms of each source (see Table 6.2 below for a summary of financial terms used). By combining these funding sources, a weighted average debt rate can be calculated, which in turn determines the WACC. The resulting WACCs are applied to the model to test the impact on the LCOE from different financing structures with corresponding variations in financing terms.
Assumptions
Financing Assumptions
The financial terms of the different funding sources are given in Table 6.2.
Table 6.2 also shows the three basic financial structures that are defined and used to generate results:
• Case 1 assumes that 50 percent of the required financing is at market terms (commercial), and the rest is financed by multilateral sources. This scenario assumes that several MDBs are pulled together
to provide the 50 percent required to match the commercial loan.
• Case 2 includes the impact of a Guarantee that reduces the cost of private financing sources. This results in a larger share of financing from private sources (71 percent) at lower costs, while the rest comes from MDBs at similar terms.
• Case 3 combines four loan types—traditional MDB financing (MDB1, 25 percent), plus additional MDB financing available at EBRD terms (MDB2, 25 percent) and private debt reduced in cost because of the guarantee from MDB1 (25 percent), and commercial sources with no guarantees (25 percent).
The above cases are investigated to find the resulting LCOE. The first step is to apply 0 percent of concessional financing to all three cases—Cases 1, 2, and 3. In the next steps, two levels of concessional financing are applied in turn—30 percent, and then 50 percent of project financing needs—to reduce the commercial debt portion in the financing package. For all cases, the percentage increase from the LCOE from the reference plant (without CCS, and assuming no concessional financing) to the LCOE of the coal plant with CCS is calculated. If the LCOE for the coal plant with CCS is found to be lower than the LCOE for the reference plant (that is, the percentage change is negative), the amount of concessional financing is reduced to the minimum necessary to equalize the LCOE of both plants. The dollar amount associated with this minimum concessional financing is also determined.
The remaining financial assumptions are given in Table E.1 in Appendix E.
Technology Assumptions
The model is developed to include five generic coal technologies as reference plants without CCS—PC, both wet- and dry-cooled, IGCC both wet- and dry-cooled, and Oxy-fuel wet-cooled (only the wet-cool option is examined, since there is no experience in application of dry-cooling Oxy-fuel projects as of today and cost data is not readily available). The wet- and dry-cooling options are assessed because in certain regions, such as Southern Africa, dry-cooled technologies are a preferred option because of regional water scarcity. Tables E.2, E.3, and E.4 in Appendix E give the specific
50 The guarantee used in this study assumes the characteristics of the Partial Credit Guarantee (PCG) instrument of the World Bank. The PCG covers debt service defaults on a portion of a loan or a bond, allowing public sector projects to access financing with extended maturities and/or lower spreads.
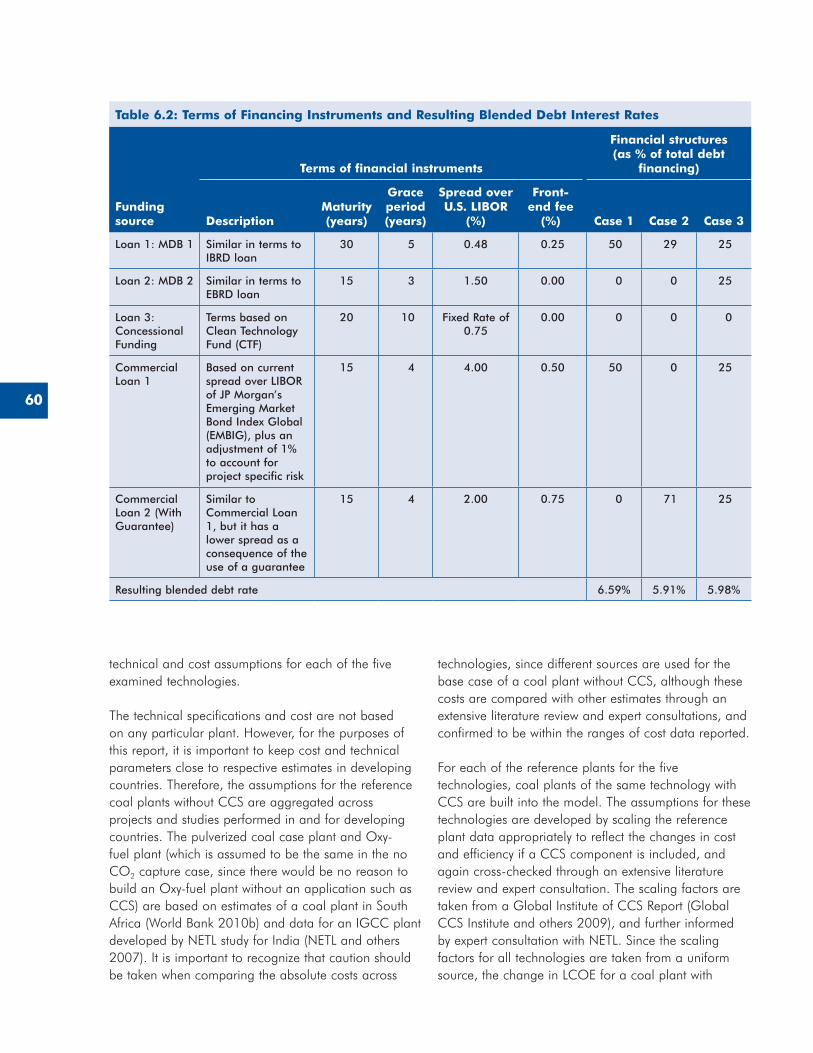
60
technical and cost assumptions for each of the five examined technologies.
The technical specifications and cost are not based on any particular plant. However, for the purposes of this report, it is important to keep cost and technical parameters close to respective estimates in developing countries. Therefore, the assumptions for the reference coal plants without CCS are aggregated across projects and studies performed in and for developing countries. The pulverized coal case plant and Oxy-fuel plant (which is assumed to be the same in the no CO2 capture case, since there would be no reason to build an Oxy-fuel plant without an application such as CCS) are based on estimates of a coal plant in South Africa (World Bank 2010b) and data for an IGCC plant developed by NETL study for India (NETL and others 2007). It is important to recognize that caution should be taken when comparing the absolute costs across
technologies, since different sources are used for the base case of a coal plant without CCS, although these costs are compared with other estimates through an extensive literature review and expert consultations, and confirmed to be within the ranges of cost data reported.
For each of the reference plants for the five technologies, coal plants of the same technology with CCS are built into the model. The assumptions for these technologies are developed by scaling the reference plant data appropriately to reflect the changes in cost and efficiency if a CCS component is included, and again cross-checked through an extensive literature review and expert consultation. The scaling factors are taken from a Global Institute of CCS Report (Global CCS Institute and others 2009), and further informed by expert consultation with NETL. Since the scaling factors for all technologies are taken from a uniform source, the change in LCOE for a coal plant with
Table 6.2: Terms of Financing Instruments and Resulting Blended Debt Interest Rates
Funding source
Terms of financial instruments
Financial structures(as % of total debt
financing)
DescriptionMaturity (years)
Grace period (years)
Spread over U.S. LIBOR
(%)
Front-end fee
(%) Case 1 Case 2 Case 3
Loan 1: MDB 1 Similar in terms to IBRD loan
30 5 0�48 0�25 50 29 25
Loan 2: MDB 2 Similar in terms to EBRD loan
15 3 1�50 0�00 0 0 25
Loan 3: Concessional Funding
Terms based on Clean Technology Fund (CTF)
20 10 Fixed Rate of 0�75
0�00 0 0 0
Commercial Loan 1
Based on current spread over LIBOR of JP Morgan’s Emerging Market Bond Index Global (EMBIG), plus an adjustment of 1% to account for project specific risk
15 4 4�00 0�50 50 0 25
Commercial Loan 2 (With Guarantee)
Similar to Commercial Loan 1, but it has a lower spread as a consequence of the use of a guarantee
15 4 2�00 0�75 0 71 25
Resulting blended debt rate 6�59% 5�91% 5�98%
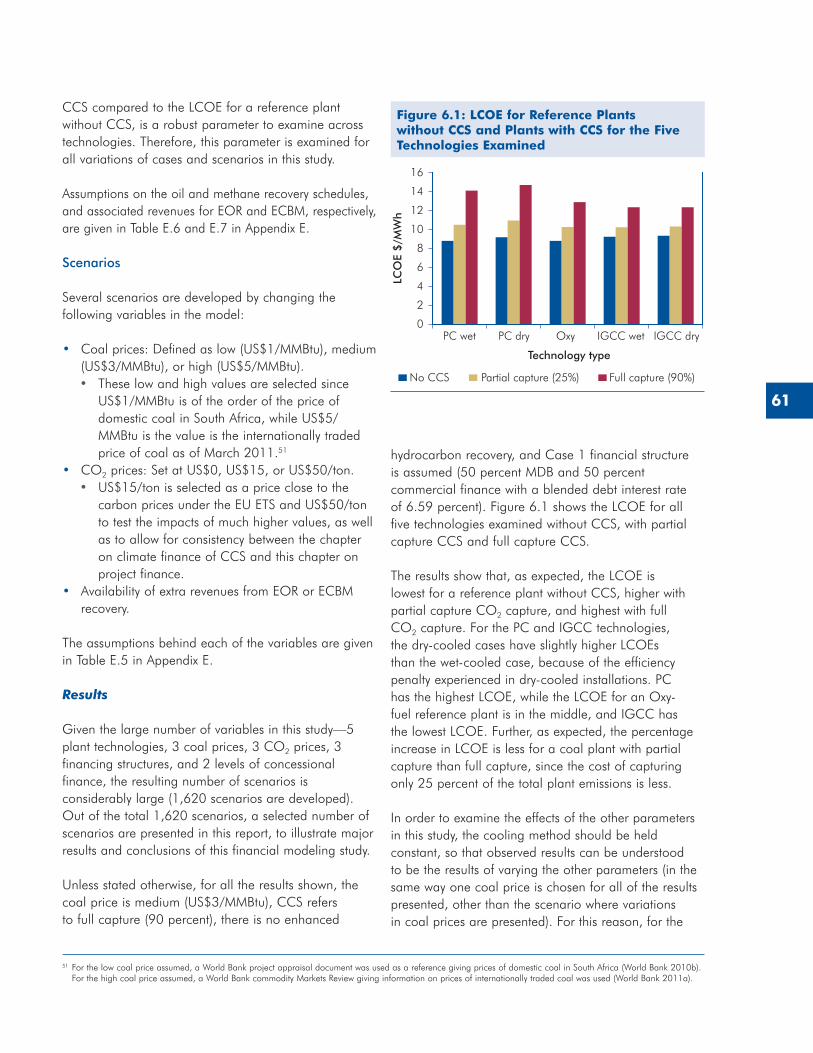
61
CCS compared to the LCOE for a reference plant without CCS, is a robust parameter to examine across technologies. Therefore, this parameter is examined for all variations of cases and scenarios in this study.
Assumptions on the oil and methane recovery schedules, and associated revenues for EOR and ECBM, respectively, are given in Table E.6 and E.7 in Appendix E.
Scenarios
Several scenarios are developed by changing the following variables in the model:
• Coal prices: Defined as low (US$1/MMBtu), medium (US$3/MMBtu), or high (US$5/MMBtu).• These low and high values are selected since
US$1/MMBtu is of the order of the price of domestic coal in South Africa, while US$5/MMBtu is the value is the internationally traded price of coal as of March 2011.51
• CO2 prices: Set at US$0, US$15, or US$50/ton.• US$15/ton is selected as a price close to the
carbon prices under the EU ETS and US$50/ton to test the impacts of much higher values, as well as to allow for consistency between the chapter on climate finance of CCS and this chapter on project finance.
• Availability of extra revenues from EOR or ECBM recovery.
The assumptions behind each of the variables are given in Table E.5 in Appendix E.
Results
Given the large number of variables in this study—5 plant technologies, 3 coal prices, 3 CO2 prices, 3 financing structures, and 2 levels of concessional finance, the resulting number of scenarios is considerably large (1,620 scenarios are developed). Out of the total 1,620 scenarios, a selected number of scenarios are presented in this report, to illustrate major results and conclusions of this financial modeling study.
Unless stated otherwise, for all the results shown, the coal price is medium (US$3/MMBtu), CCS refers to full capture (90 percent), there is no enhanced
hydrocarbon recovery, and Case 1 financial structure is assumed (50 percent MDB and 50 percent commercial finance with a blended debt interest rate of 6.59 percent). Figure 6.1 shows the LCOE for all five technologies examined without CCS, with partial capture CCS and full capture CCS.
The results show that, as expected, the LCOE is lowest for a reference plant without CCS, higher with partial capture CO2 capture, and highest with full CO2 capture. For the PC and IGCC technologies, the dry-cooled cases have slightly higher LCOEs than the wet-cooled case, because of the efficiency penalty experienced in dry-cooled installations. PC has the highest LCOE, while the LCOE for an Oxy-fuel reference plant is in the middle, and IGCC has the lowest LCOE. Further, as expected, the percentage increase in LCOE is less for a coal plant with partial capture than full capture, since the cost of capturing only 25 percent of the total plant emissions is less.
In order to examine the effects of the other parameters in this study, the cooling method should be held constant, so that observed results can be understood to be the results of varying the other parameters (in the same way one coal price is chosen for all of the results presented, other than the scenario where variations in coal prices are presented). For this reason, for the
Figure 6.1: LCOE for Reference Plants without CCS and Plants with CCS for the Five Technologies Examined
0
No CCS Full capture (90%)Partial capture (25%)
LCO
E $/M
Wh
2
4
6
8
10
12
14
16
PC wet PC dry Oxy IGCC wet IGCC dry
Technology type
51 For the low coal price assumed, a World Bank project appraisal document was used as a reference giving prices of domestic coal in South Africa (World Bank 2010b). For the high coal price assumed, a World Bank commodity Markets Review giving information on prices of internationally traded coal was used (World Bank 2011a).
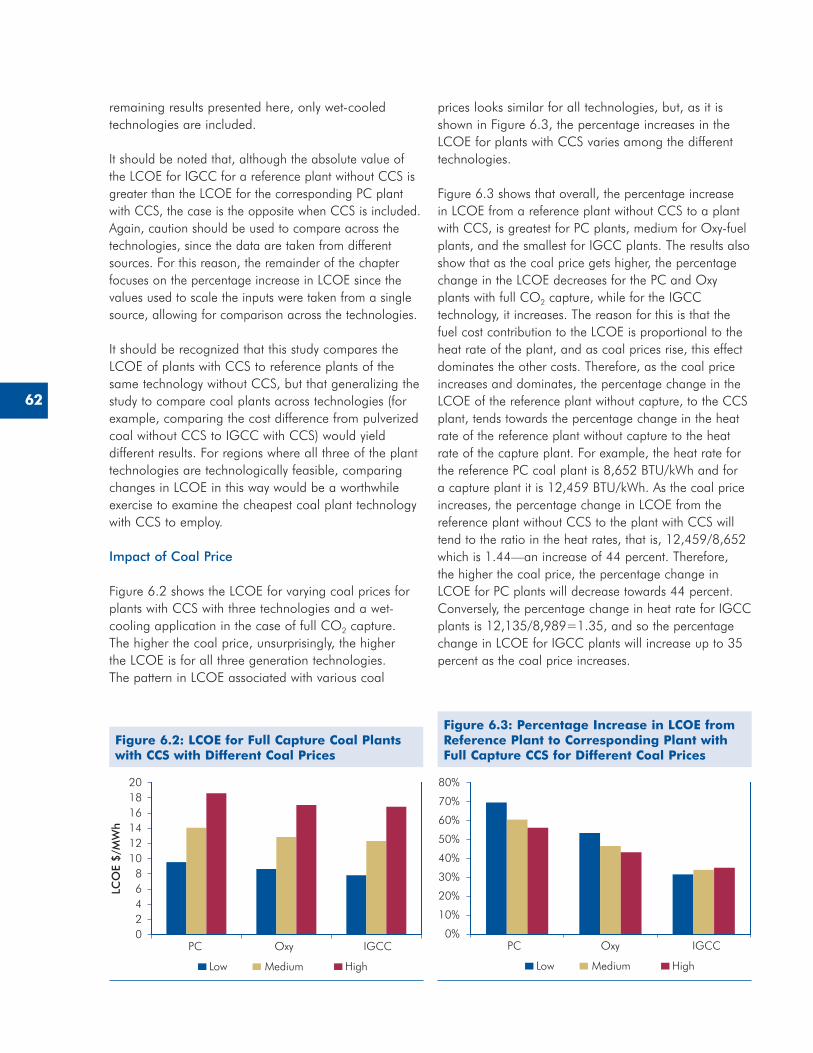
62
remaining results presented here, only wet-cooled technologies are included.
It should be noted that, although the absolute value of the LCOE for IGCC for a reference plant without CCS is greater than the LCOE for the corresponding PC plant with CCS, the case is the opposite when CCS is included. Again, caution should be used to compare across the technologies, since the data are taken from different sources. For this reason, the remainder of the chapter focuses on the percentage increase in LCOE since the values used to scale the inputs were taken from a single source, allowing for comparison across the technologies.
It should be recognized that this study compares the LCOE of plants with CCS to reference plants of the same technology without CCS, but that generalizing the study to compare coal plants across technologies (for example, comparing the cost difference from pulverized coal without CCS to IGCC with CCS) would yield different results. For regions where all three of the plant technologies are technologically feasible, comparing changes in LCOE in this way would be a worthwhile exercise to examine the cheapest coal plant technology with CCS to employ.
Impact of Coal Price
Figure 6.2 shows the LCOE for varying coal prices for plants with CCS with three technologies and a wet-cooling application in the case of full CO2 capture. The higher the coal price, unsurprisingly, the higher the LCOE is for all three generation technologies. The pattern in LCOE associated with various coal
prices looks similar for all technologies, but, as it is shown in Figure 6.3, the percentage increases in the LCOE for plants with CCS varies among the different technologies.
Figure 6.3 shows that overall, the percentage increase in LCOE from a reference plant without CCS to a plant with CCS, is greatest for PC plants, medium for Oxy-fuel plants, and the smallest for IGCC plants. The results also show that as the coal price gets higher, the percentage change in the LCOE decreases for the PC and Oxy plants with full CO2 capture, while for the IGCC technology, it increases. The reason for this is that the fuel cost contribution to the LCOE is proportional to the heat rate of the plant, and as coal prices rise, this effect dominates the other costs. Therefore, as the coal price increases and dominates, the percentage change in the LCOE of the reference plant without capture, to the CCS plant, tends towards the percentage change in the heat rate of the reference plant without capture to the heat rate of the capture plant. For example, the heat rate for the reference PC coal plant is 8,652 BTU/kWh and for a capture plant it is 12,459 BTU/kWh. As the coal price increases, the percentage change in LCOE from the reference plant without CCS to the plant with CCS will tend to the ratio in the heat rates, that is, 12,459/8,652 which is 1.44—an increase of 44 percent. Therefore, the higher the coal price, the percentage change in LCOE for PC plants will decrease towards 44 percent. Conversely, the percentage change in heat rate for IGCC plants is 12,135/8,989=1.35, and so the percentage change in LCOE for IGCC plants will increase up to 35 percent as the coal price increases.
Figure 6.2: LCOE for Full Capture Coal Plants with CCS with Different Coal Prices
0
Low HighMedium
LCO
E $
/MW
h
2468
101214161820
PC Oxy IGCC
Figure 6.3: Percentage Increase in LCOE from Reference Plant to Corresponding Plant with Full Capture CCS for Different Coal Prices
Low HighMedium
PC Oxy IGCC0%
10%
20%
30%
40%
50%
60%
70%
80%
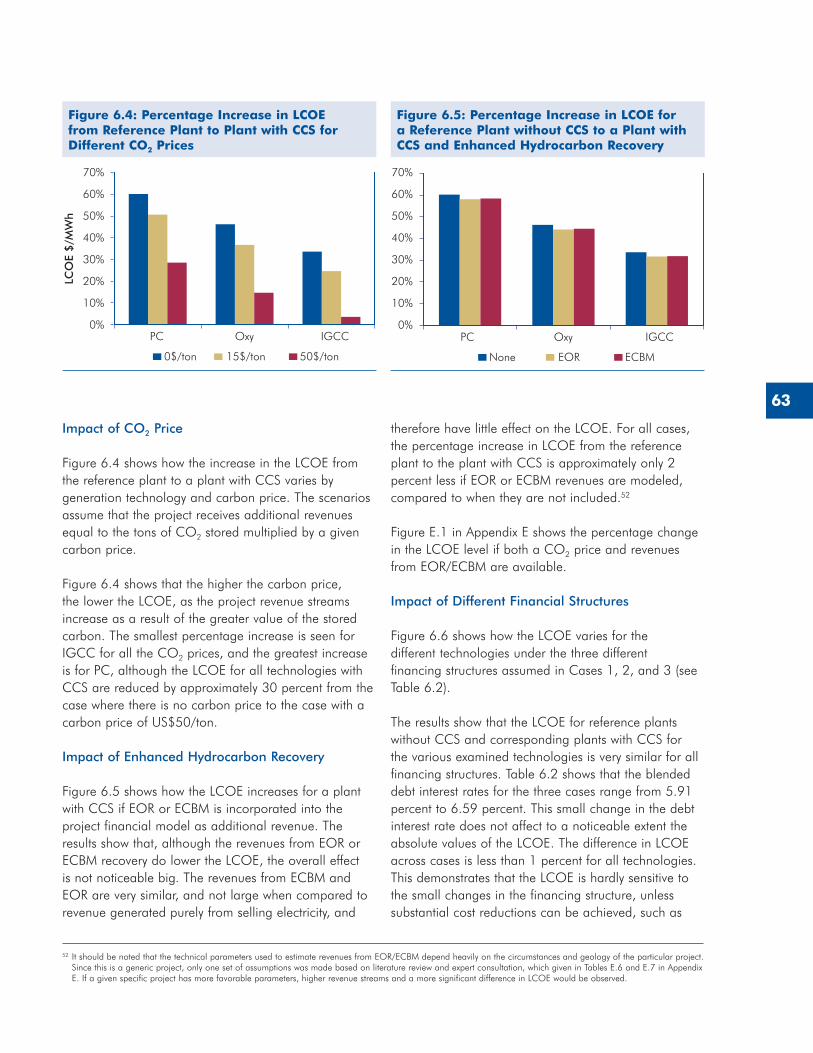
63
Impact of CO2 Price
Figure 6.4 shows how the increase in the LCOE from the reference plant to a plant with CCS varies by generation technology and carbon price. The scenarios assume that the project receives additional revenues equal to the tons of CO2 stored multiplied by a given carbon price.
Figure 6.4 shows that the higher the carbon price, the lower the LCOE, as the project revenue streams increase as a result of the greater value of the stored carbon. The smallest percentage increase is seen for IGCC for all the CO2 prices, and the greatest increase is for PC, although the LCOE for all technologies with CCS are reduced by approximately 30 percent from the case where there is no carbon price to the case with a carbon price of US$50/ton.
Impact of Enhanced Hydrocarbon Recovery
Figure 6.5 shows how the LCOE increases for a plant with CCS if EOR or ECBM is incorporated into the project financial model as additional revenue. The results show that, although the revenues from EOR or ECBM recovery do lower the LCOE, the overall effect is not noticeable big. The revenues from ECBM and EOR are very similar, and not large when compared to revenue generated purely from selling electricity, and
therefore have little effect on the LCOE. For all cases, the percentage increase in LCOE from the reference plant to the plant with CCS is approximately only 2 percent less if EOR or ECBM revenues are modeled, compared to when they are not included.52
Figure E.1 in Appendix E shows the percentage change in the LCOE level if both a CO2 price and revenues from EOR/ECBM are available.
Impact of Different Financial Structures
Figure 6.6 shows how the LCOE varies for the different technologies under the three different financing structures assumed in Cases 1, 2, and 3 (see Table 6.2).
The results show that the LCOE for reference plants without CCS and corresponding plants with CCS for the various examined technologies is very similar for all financing structures. Table 6.2 shows that the blended debt interest rates for the three cases range from 5.91 percent to 6.59 percent. This small change in the debt interest rate does not affect to a noticeable extent the absolute values of the LCOE. The difference in LCOE across cases is less than 1 percent for all technologies. This demonstrates that the LCOE is hardly sensitive to the small changes in the financing structure, unless substantial cost reductions can be achieved, such as
52 It should be noted that the technical parameters used to estimate revenues from EOR/ECBM depend heavily on the circumstances and geology of the particular project. Since this is a generic project, only one set of assumptions was made based on literature review and expert consultation, which given in Tables E.6 and E.7 in Appendix E. If a given specific project has more favorable parameters, higher revenue streams and a more significant difference in LCOE would be observed.
Figure 6.4: Percentage Increase in LCOE from Reference Plant to Plant with CCS for Different CO2 Prices
0%
10%
20%
30%
40%
50%
60%
70%
0$/ton 50$/ton15$/ton
LCO
E $/M
Wh
PC Oxy IGCC
Figure 6.5: Percentage Increase in LCOE for a Reference Plant without CCS to a Plant with CCS and Enhanced Hydrocarbon Recovery
None ECBMEOR
PC Oxy IGCC0%
10%
20%
30%
40%
50%
60%
70%
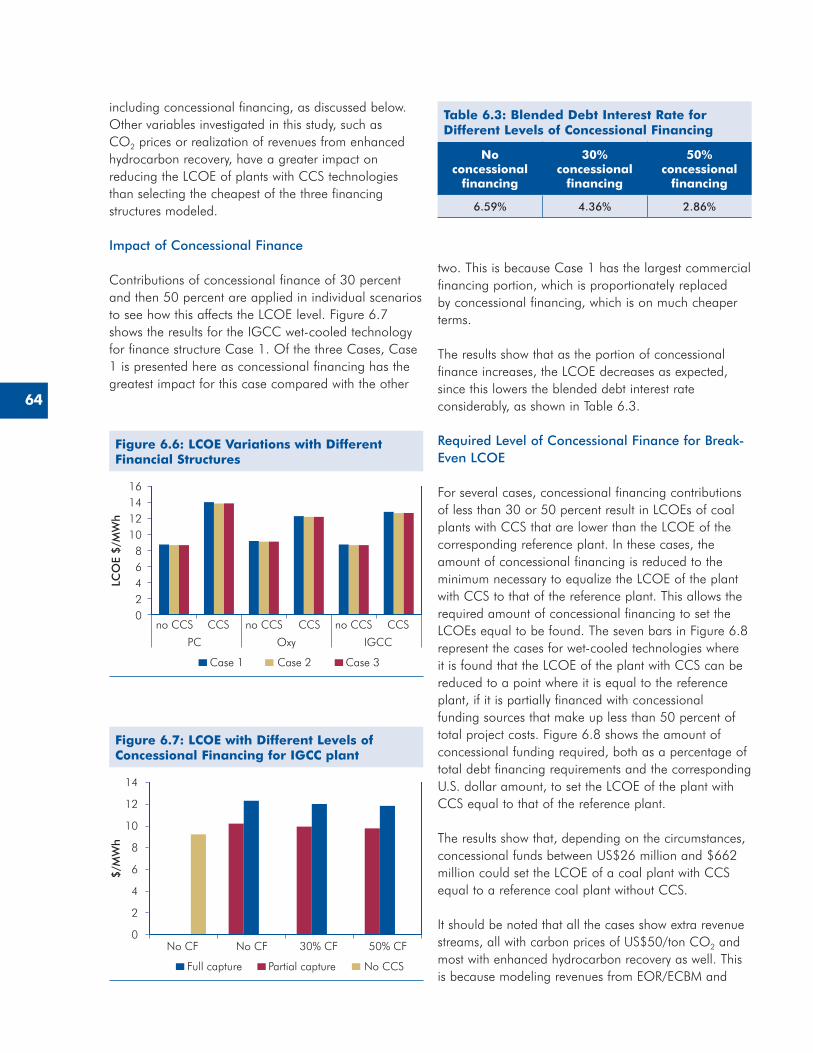
64
including concessional financing, as discussed below. Other variables investigated in this study, such as CO2 prices or realization of revenues from enhanced hydrocarbon recovery, have a greater impact on reducing the LCOE of plants with CCS technologies than selecting the cheapest of the three financing structures modeled.
Impact of Concessional Finance
Contributions of concessional finance of 30 percent and then 50 percent are applied in individual scenarios to see how this affects the LCOE level. Figure 6.7 shows the results for the IGCC wet-cooled technology for finance structure Case 1. Of the three Cases, Case 1 is presented here as concessional financing has the greatest impact for this case compared with the other
two. This is because Case 1 has the largest commercial financing portion, which is proportionately replaced by concessional financing, which is on much cheaper terms.
The results show that as the portion of concessional finance increases, the LCOE decreases as expected, since this lowers the blended debt interest rate considerably, as shown in Table 6.3.
Required Level of Concessional Finance for Break-Even LCOE
For several cases, concessional financing contributions of less than 30 or 50 percent result in LCOEs of coal plants with CCS that are lower than the LCOE of the corresponding reference plant. In these cases, the amount of concessional financing is reduced to the minimum necessary to equalize the LCOE of the plant with CCS to that of the reference plant. This allows the required amount of concessional financing to set the LCOEs equal to be found. The seven bars in Figure 6.8 represent the cases for wet-cooled technologies where it is found that the LCOE of the plant with CCS can be reduced to a point where it is equal to the reference plant, if it is partially financed with concessional funding sources that make up less than 50 percent of total project costs. Figure 6.8 shows the amount of concessional funding required, both as a percentage of total debt financing requirements and the corresponding U.S. dollar amount, to set the LCOE of the plant with CCS equal to that of the reference plant.
The results show that, depending on the circumstances, concessional funds between US$26 million and $662 million could set the LCOE of a coal plant with CCS equal to a reference coal plant without CCS.
It should be noted that all the cases show extra revenue streams, all with carbon prices of US$50/ton CO2 and most with enhanced hydrocarbon recovery as well. This is because modeling revenues from EOR/ECBM and
Figure 6.6: LCOE Variations with Different Financial Structures
Case 1 Case 3Case 2
02468
10121416
LCO
E $
/MW
h
PC Oxy IGCC
no CCS CCS no CCS CCS no CCS CCS
Figure 6.7: LCOE with Different Levels of Concessional Financing for IGCC plant
Full capture Partial capture No CCS
$/M
Wh
2
0
4
6
8
10
12
14
No CF No CF 30% CF 50% CF
Table 6.3: Blended Debt Interest Rate for Different Levels of Concessional Financing
No concessional
financing
30% concessional
financing
50% concessional
financing
6�59% 4�36% 2�86%
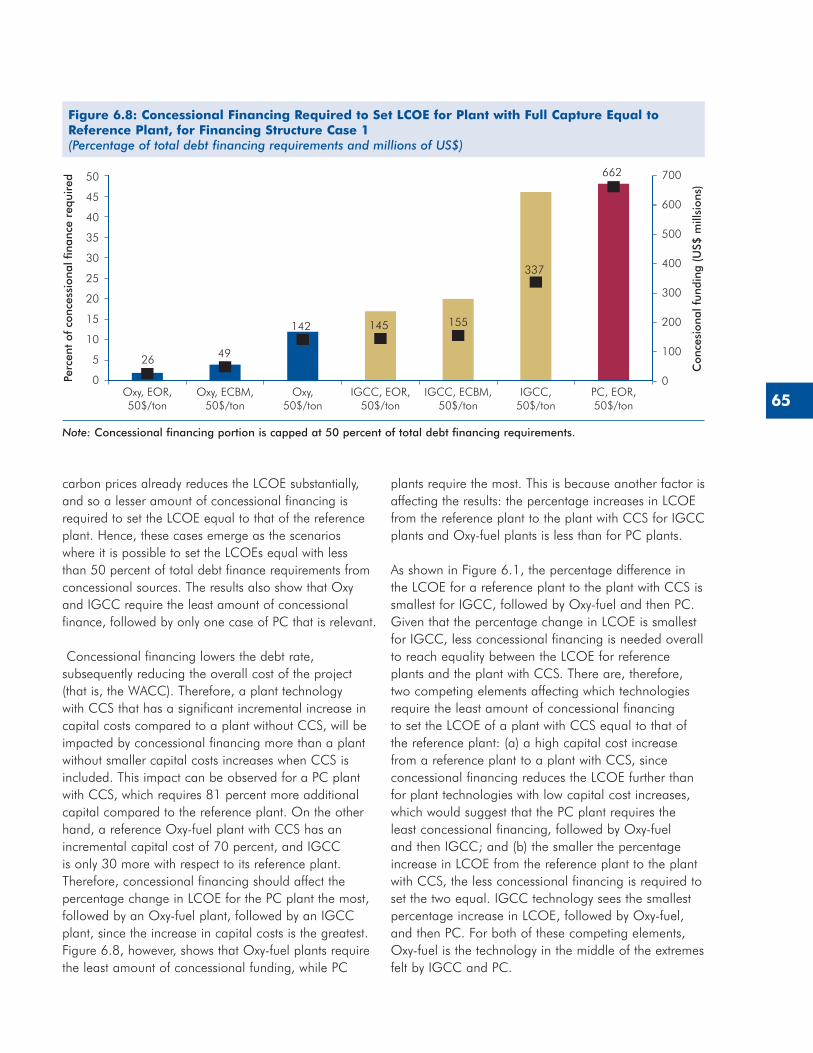
65
carbon prices already reduces the LCOE substantially, and so a lesser amount of concessional financing is required to set the LCOE equal to that of the reference plant. Hence, these cases emerge as the scenarios where it is possible to set the LCOEs equal with less than 50 percent of total debt finance requirements from concessional sources. The results also show that Oxy and IGCC require the least amount of concessional finance, followed by only one case of PC that is relevant.
Concessional financing lowers the debt rate, subsequently reducing the overall cost of the project (that is, the WACC). Therefore, a plant technology with CCS that has a significant incremental increase in capital costs compared to a plant without CCS, will be impacted by concessional financing more than a plant without smaller capital costs increases when CCS is included. This impact can be observed for a PC plant with CCS, which requires 81 percent more additional capital compared to the reference plant. On the other hand, a reference Oxy-fuel plant with CCS has an incremental capital cost of 70 percent, and IGCC is only 30 more with respect to its reference plant. Therefore, concessional financing should affect the percentage change in LCOE for the PC plant the most, followed by an Oxy-fuel plant, followed by an IGCC plant, since the increase in capital costs is the greatest. Figure 6.8, however, shows that Oxy-fuel plants require the least amount of concessional funding, while PC
plants require the most. This is because another factor is affecting the results: the percentage increases in LCOE from the reference plant to the plant with CCS for IGCC plants and Oxy-fuel plants is less than for PC plants.
As shown in Figure 6.1, the percentage difference in the LCOE for a reference plant to the plant with CCS is smallest for IGCC, followed by Oxy-fuel and then PC. Given that the percentage change in LCOE is smallest for IGCC, less concessional financing is needed overall to reach equality between the LCOE for reference plants and the plant with CCS. There are, therefore, two competing elements affecting which technologies require the least amount of concessional financing to set the LCOE of a plant with CCS equal to that of the reference plant: (a) a high capital cost increase from a reference plant to a plant with CCS, since concessional financing reduces the LCOE further than for plant technologies with low capital cost increases, which would suggest that the PC plant requires the least concessional financing, followed by Oxy-fuel and then IGCC; and (b) the smaller the percentage increase in LCOE from the reference plant to the plant with CCS, the less concessional financing is required to set the two equal. IGCC technology sees the smallest percentage increase in LCOE, followed by Oxy-fuel, and then PC. For both of these competing elements, Oxy-fuel is the technology in the middle of the extremes felt by IGCC and PC.
Figure 6.8: Concessional Financing Required to Set LCOE for Plant with Full Capture Equal to Reference Plant, for Financing Structure Case 1(Percentage of total debt financing requirements and millions of US$)
0Oxy, EOR,50$/ton
PC, EOR,50$/ton
Oxy, ECBM,50$/ton
Oxy,50$/ton
IGCC, EOR,50$/ton
IGCC, ECBM,50$/ton
IGCC,50$/ton
Perc
ent
of c
once
ssio
nal f
inan
ce r
equi
red
5
10
15
20
25
30
35
40
45
50
Con
cesi
onal
fun
ding
(U
S$ m
illsi
ons)
0
100
200
300
400
500
600
700
26 49
142 145 155
337
662
Note: Concessional financing portion is capped at 50 percent of total debt financing requirements�

66
The resulting observation is that Oxy-fuel, as the technology in the middle of these competing aspects, requires the least amount of concessional financing. Since the results in Figure 6.8 show that the IGCC cases require less concessional financing than the PC case, the smaller percentage increase in LCOE from the reference plant to the plant with CCS for IGCC of the three technologies outweighs the effect of concessional financing reducing the LCOE in high incremental capital cost technologies, such as PC.
The results also show that there are four scenarios in the Case 2 financial structure where concessional
financing between 2 percent and 31 percent would be sufficient to set the LCOE equal between the options “without” and “with” CCS. Such scenarios are observed for Oxy-fuel and IGCC technologies, and there are no instances in the Case 3 financial structure. As mentioned above, the reason for this is that Case 1, which is 50 percent MDB and 50 percent commercial funding, has the largest amount of commercial finance, which is reduced when concessional finance displaces it. Therefore, every percent of concessional finance added in Case 1 makes more of an impact than in the other two cases.

APPENDIX
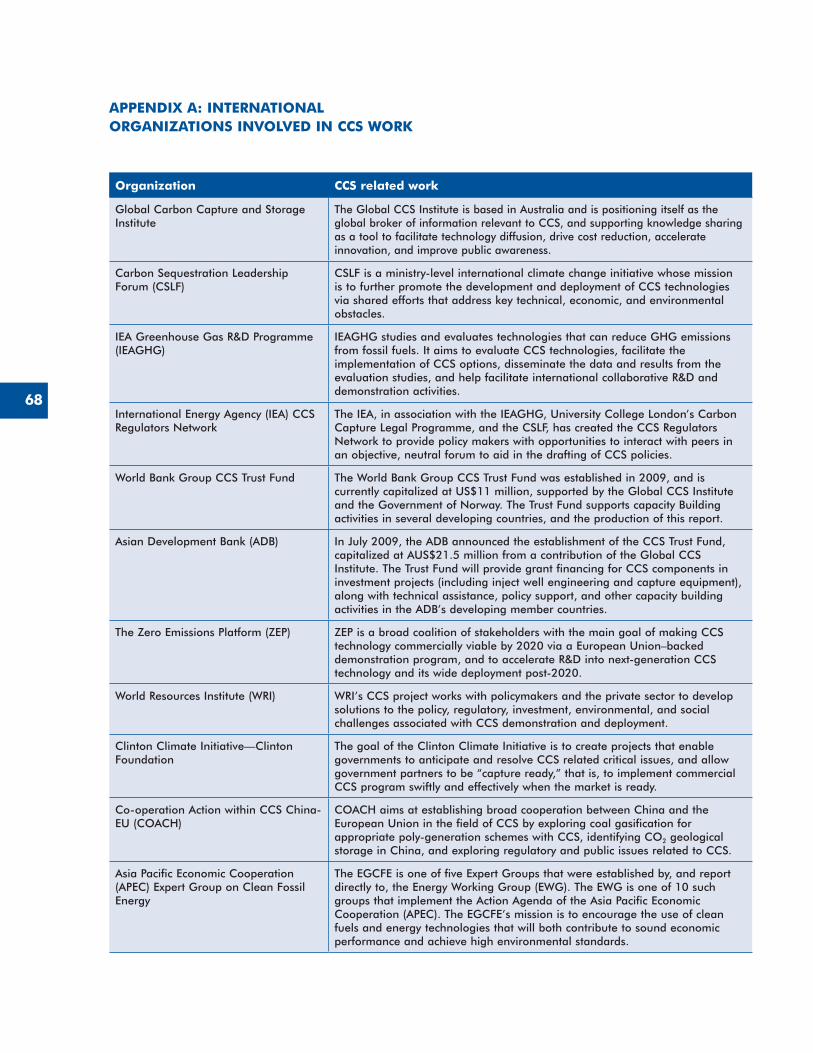
68
APPENDIX A: INTERNATIONAL ORGANIZATIONS INVOLVED IN CCS WORK
Organization CCS related work
Global Carbon Capture and Storage Institute
The Global CCS Institute is based in Australia and is positioning itself as the global broker of information relevant to CCS, and supporting knowledge sharing as a tool to facilitate technology diffusion, drive cost reduction, accelerate innovation, and improve public awareness�
Carbon Sequestration Leadership Forum (CSLF)
CSLF is a ministry-level international climate change initiative whose mission is to further promote the development and deployment of CCS technologies via shared efforts that address key technical, economic, and environmental obstacles�
IEA Greenhouse Gas R&D Programme (IEAGHG)
IEAGHG studies and evaluates technologies that can reduce GHG emissions from fossil fuels� It aims to evaluate CCS technologies, facilitate the implementation of CCS options, disseminate the data and results from the evaluation studies, and help facilitate international collaborative R&D and demonstration activities�
International Energy Agency (IEA) CCS Regulators Network
The IEA, in association with the IEAGHG, University College London’s Carbon Capture Legal Programme, and the CSLF, has created the CCS Regulators Network to provide policy makers with opportunities to interact with peers in an objective, neutral forum to aid in the drafting of CCS policies�
World Bank Group CCS Trust Fund The World Bank Group CCS Trust Fund was established in 2009, and is currently capitalized at US$11 million, supported by the Global CCS Institute and the Government of Norway� The Trust Fund supports capacity Building activities in several developing countries, and the production of this report�
Asian Development Bank (ADB) In July 2009, the ADB announced the establishment of the CCS Trust Fund, capitalized at AUS$21�5 million from a contribution of the Global CCS Institute� The Trust Fund will provide grant financing for CCS components in investment projects (including inject well engineering and capture equipment), along with technical assistance, policy support, and other capacity building activities in the ADB’s developing member countries�
The Zero Emissions Platform (ZEP) ZEP is a broad coalition of stakeholders with the main goal of making CCS technology commercially viable by 2020 via a European Union–backed demonstration program, and to accelerate R&D into next-generation CCS technology and its wide deployment post-2020�
World Resources Institute (WRI) WRI’s CCS project works with policymakers and the private sector to develop solutions to the policy, regulatory, investment, environmental, and social challenges associated with CCS demonstration and deployment�
Clinton Climate Initiative—Clinton Foundation
The goal of the Clinton Climate Initiative is to create projects that enable governments to anticipate and resolve CCS related critical issues, and allow government partners to be “capture ready,” that is, to implement commercial CCS program swiftly and effectively when the market is ready�
Co-operation Action within CCS China-EU (COACH)
COACH aims at establishing broad cooperation between China and the European Union in the field of CCS by exploring coal gasification for appropriate poly-generation schemes with CCS, identifying CO2 geological storage in China, and exploring regulatory and public issues related to CCS�
Asia Pacific Economic Cooperation (APEC) Expert Group on Clean Fossil Energy
The EGCFE is one of five Expert Groups that were established by, and report directly to, the Energy Working Group (EWG)� The EWG is one of 10 such groups that implement the Action Agenda of the Asia Pacific Economic Cooperation (APEC)� The EGCFE’s mission is to encourage the use of clean fuels and energy technologies that will both contribute to sound economic performance and achieve high environmental standards�
69
APPENDIX B: TECHNO-ECONOMIC ASSESSMENT OF CCS DEPLOYMENT IN THE POWER SECTOR IN SOUTHERN AFRICA AND THE BALKANS
The Model
Using a techno-economic optimization model is a suitable method for exploring the effects of policies on CCS deployment. Such models have been used to model the power sector for decades, since it is possible to examine how well particular technologies compete against other energy technologies that are available, allowing the cheapest alternative to be selected. For all costs occurring at later points in time, the present value is calculated by discounting them to the base year of the case study, and it is this sum of the discounted costs that is used to find the optimal solution. Unless forced by the model user, the methodology does not require any arbitrary fixing of a trajectory for a power plant with CCS or any other energy technology, and selects among potential new installations and dispatching of new and existing installations as defined by the model user, to find the economically optimal electricity portfolio.
The choice of the discount factor is an important issue, since it determines the balancing between capital costs (predominantly investment) and operating cost (predominantly fuel). Since the operational lifetime extends over a long period, discounting has more effect on the variable costs, and the higher the discount rate, the less weight is given to the variable cost as the model solves to determine the costs of each of the energy technology options. The choice of discount rate is a subjective decision that takes into account opinions on intergenerational equity and financial valuation, and is beyond the scope of this report. For the purposes of this study, a discount rate of 8 percent—as a midway between a social discount rate and rate more akin to private sector investments—is used. The same scenarios could be tested with a different discount rate and compared if so desired.
A set of individual countries is modeled for each region as separate systems, and connections between regions are set at a multiregional level to allow for trade between counties, which allows for a regional analysis.
Modeling CCS Technology
CCS is included in the model as a generic capture technology, both for coal and gas plants, rather than specifying post-combustion or pre-combustion capture. This is because the differences in costs between different capture technologies are minimal in comparison to the differences in cost between alternative energy options. Both new builds and retrofits, which are considered as having 40 percent greater in investment costs than new build CCS plants, are included in the model.
Storage Options
Potential storage sites for each of the regions were researched to give an inventory of potential CO2 reservoirs. Table B.1 shows the references used for this research.
Certain assumptions were necessary to estimate the costs of developing each storage site, since for many of them their full capacity is not defined with certainty. Since the injectivity of a well is a parameter that is lacking in most of the identified storage options—and this parameter determines the amount of wells needed for a storage project of a certain size—the total drilling costs per site can be calculated as an order of cost whereby the number of wells is defined based on an assumed injectivity. The relative storage cost expressed as US$/ton CO2 is influenced mainly by the size of the storage project (total volume stored).
Since the size of individual structures is also an unknown, an estimate was included in the inventory using a realistic size distribution of storage sites based on a statistical analysis of existing data. Subsequently, generic cost curves for each of the storage options with a price per ton as a function of the volume that can be stored were calculated for each of the storage types involving specific costs and conditions. By combining these cost curves with the (expected) size of a project (that is, the position on the cost curve), a reasonable cost per ton was deduced for each of the storage options.
Assumptions in the Model for Southern Africa
The following tables detail the assumptions used in the model to represent the Southern African region.
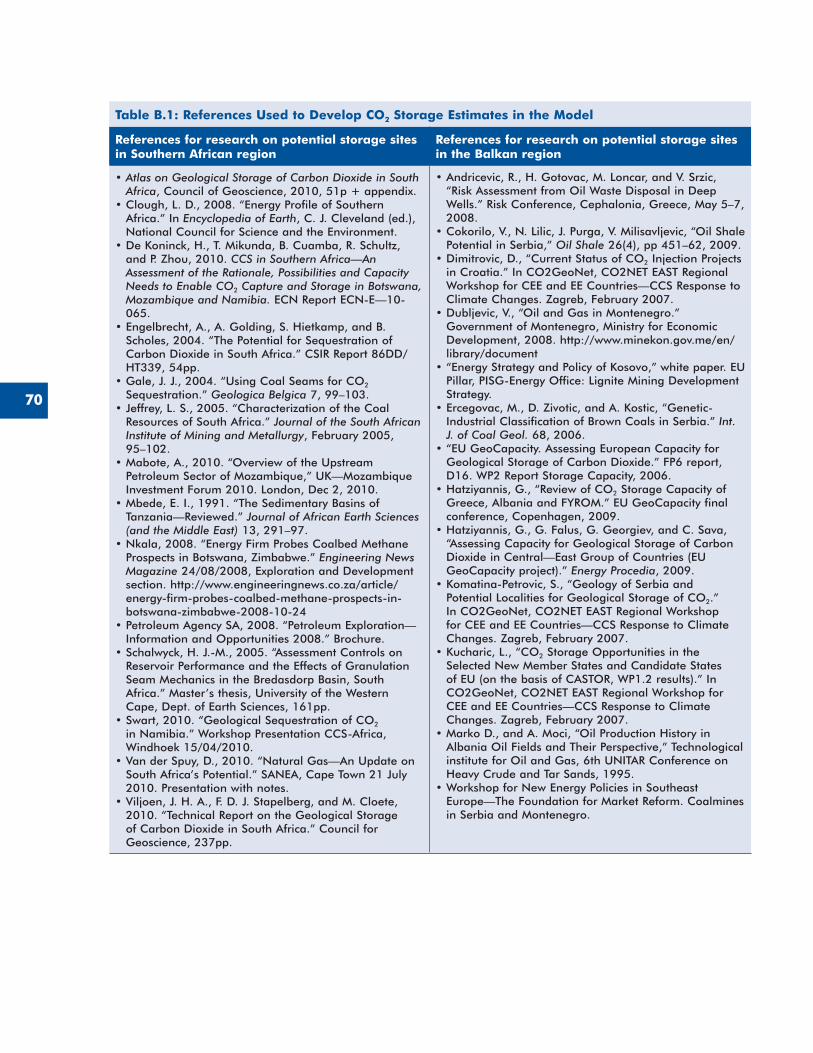
70
Table B.1: References Used to Develop CO2 Storage Estimates in the Model
References for research on potential storage sites in Southern African region
References for research on potential storage sites in the Balkan region
•Atlas on Geological Storage of Carbon Dioxide in South Africa, Council of Geoscience, 2010, 51p + appendix�
•Clough, L� D�, 2008� “Energy Profile of Southern Africa�” In Encyclopedia of Earth, C� J� Cleveland (ed�), National Council for Science and the Environment�
•De Koninck, H�, T� Mikunda, B� Cuamba, R� Schultz, and P� Zhou, 2010� CCS in Southern Africa—An Assessment of the Rationale, Possibilities and Capacity Needs to Enable CO2 Capture and Storage in Botswana, Mozambique and Namibia. ECN Report ECN-E—10-065�
•Engelbrecht, A�, A� Golding, S� Hietkamp, and B� Scholes, 2004� “The Potential for Sequestration of Carbon Dioxide in South Africa�” CSIR Report 86DD/HT339, 54pp�
•Gale, J� J�, 2004� “Using Coal Seams for CO2 Sequestration�” Geologica Belgica 7, 99–103�
•Jeffrey, L� S�, 2005� “Characterization of the Coal Resources of South Africa�” Journal of the South African Institute of Mining and Metallurgy, February 2005, 95–102�
•Mabote, A�, 2010� “Overview of the Upstream Petroleum Sector of Mozambique,” UK—Mozambique Investment Forum 2010� London, Dec 2, 2010�
•Mbede, E� I�, 1991� “The Sedimentary Basins of Tanzania—Reviewed�” Journal of African Earth Sciences (and the Middle East) 13, 291–97�
•Nkala, 2008� “Energy Firm Probes Coalbed Methane Prospects in Botswana, Zimbabwe�” Engineering News Magazine 24/08/2008, Exploration and Development section� http://www�engineeringnews�co�za/article/energy-firm-probes-coalbed-methane-prospects-in-botswana-zimbabwe-2008-10-24
•Petroleum Agency SA, 2008� “Petroleum Exploration—Information and Opportunities 2008�” Brochure�
•Schalwyck, H� J�-M�, 2005� “Assessment Controls on Reservoir Performance and the Effects of Granulation Seam Mechanics in the Bredasdorp Basin, South Africa�” Master’s thesis, University of the Western Cape, Dept� of Earth Sciences, 161pp�
•Swart, 2010� “Geological Sequestration of CO2 in Namibia�” Workshop Presentation CCS-Africa, Windhoek 15/04/2010�
•Van der Spuy, D�, 2010� “Natural Gas—An Update on South Africa’s Potential�” SANEA, Cape Town 21 July 2010� Presentation with notes�
•Viljoen, J� H� A�, F� D� J� Stapelberg, and M� Cloete, 2010� “Technical Report on the Geological Storage of Carbon Dioxide in South Africa�” Council for Geoscience, 237pp�
•Andricevic, R�, H� Gotovac, M� Loncar, and V� Srzic, “Risk Assessment from Oil Waste Disposal in Deep Wells�” Risk Conference, Cephalonia, Greece, May 5–7, 2008�
•Cokorilo, V�, N� Lilic, J� Purga, V� Milisavljevic, “Oil Shale Potential in Serbia,” Oil Shale 26(4), pp 451–62, 2009�
•Dimitrovic, D�, “Current Status of CO2 Injection Projects in Croatia�” In CO2GeoNet, CO2NET EAST Regional Workshop for CEE and EE Countries—CCS Response to Climate Changes� Zagreb, February 2007�
•Dubljevic, V�, “Oil and Gas in Montenegro�” Government of Montenegro, Ministry for Economic Development, 2008� http://www�minekon�gov�me/en/library/document
•“Energy Strategy and Policy of Kosovo,” white paper� EU Pillar, PISG-Energy Office: Lignite Mining Development Strategy�
•Ercegovac, M�, D� Zivotic, and A� Kostic, “Genetic-Industrial Classification of Brown Coals in Serbia�” Int. J. of Coal Geol. 68, 2006�
•“EU GeoCapacity� Assessing European Capacity for Geological Storage of Carbon Dioxide�” FP6 report, D16� WP2 Report Storage Capacity, 2006�
•Hatziyannis, G�, “Review of CO2 Storage Capacity of Greece, Albania and FYROM�” EU GeoCapacity final conference, Copenhagen, 2009�
•Hatziyannis, G�, G� Falus, G� Georgiev, and C� Sava, “Assessing Capacity for Geological Storage of Carbon Dioxide in Central—East Group of Countries (EU GeoCapacity project)�” Energy Procedia, 2009�
•Komatina-Petrovic, S�, “Geology of Serbia and Potential Localities for Geological Storage of CO2�” In CO2GeoNet, CO2NET EAST Regional Workshop for CEE and EE Countries—CCS Response to Climate Changes� Zagreb, February 2007�
•Kucharic, L�, “CO2 Storage Opportunities in the Selected New Member States and Candidate States of EU (on the basis of CASTOR, WP1�2 results)�” In CO2GeoNet, CO2NET EAST Regional Workshop for CEE and EE Countries—CCS Response to Climate Changes� Zagreb, February 2007�
•Marko D�, and A� Moci, “Oil Production History in Albania Oil Fields and Their Perspective,” Technological institute for Oil and Gas, 6th UNITAR Conference on Heavy Crude and Tar Sands, 1995�
•Workshop for New Energy Policies in Southeast Europe—The Foundation for Market Reform� Coalmines in Serbia and Montenegro�
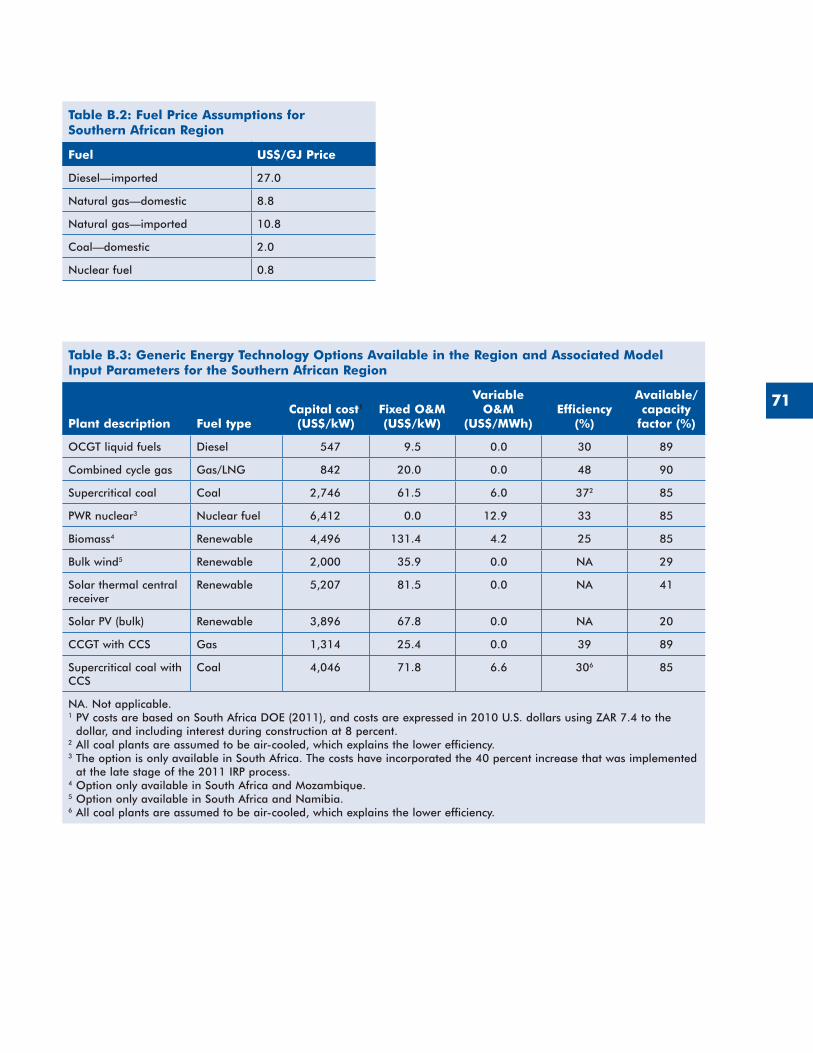
71
Table B.2: Fuel Price Assumptions for Southern African Region
Fuel US$/GJ Price
Diesel—imported 27�0
Natural gas—domestic 8�8
Natural gas—imported 10�8
Coal—domestic 2�0
Nuclear fuel 0�8
Table B.3: Generic Energy Technology Options Available in the Region and Associated Model Input Parameters for the Southern African Region
Plant description Fuel typeCapital cost1
(US$/kW)Fixed O&M (US$/kW)
Variable O&M
(US$/MWh)Efficiency
(%)
Available/capacity
factor (%)
OCGT liquid fuels Diesel 547 9�5 0�0 30 89
Combined cycle gas Gas/LNG 842 20�0 0�0 48 90
Supercritical coal Coal 2,746 61�5 6�0 372 85
PWR nuclear3 Nuclear fuel 6,412 0�0 12�9 33 85
Biomass4 Renewable 4,496 131�4 4�2 25 85
Bulk wind5 Renewable 2,000 35�9 0�0 NA 29
Solar thermal central receiver
Renewable 5,207 81�5 0�0 NA 41
Solar PV (bulk) Renewable 3,896 67�8 0�0 NA 20
CCGT with CCS Gas 1,314 25�4 0�0 39 89
Supercritical coal with CCS
Coal 4,046 71�8 6�6 306 85
NA� Not applicable�1 PV costs are based on South Africa DOE (2011), and costs are expressed in 2010 U�S� dollars using ZAR 7�4 to the
dollar, and including interest during construction at 8 percent�2 All coal plants are assumed to be air-cooled, which explains the lower efficiency�3 The option is only available in South Africa� The costs have incorporated the 40 percent increase that was implemented
at the late stage of the 2011 IRP process�4 Option only available in South Africa and Mozambique�5 Option only available in South Africa and Namibia�6 All coal plants are assumed to be air-cooled, which explains the lower efficiency�
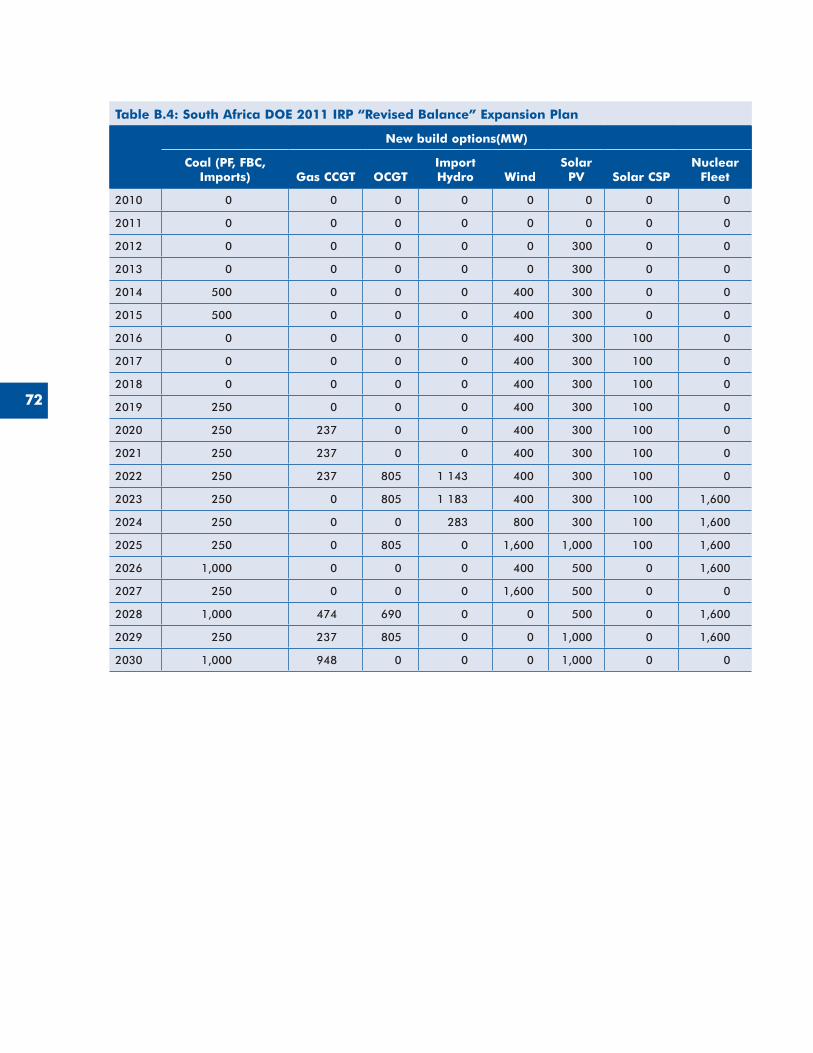
72
Table B.4: South Africa DOE 2011 IRP “Revised Balance” Expansion Plan
New build options(MW)
Coal (PF, FBC, Imports) Gas CCGT OCGT
Import Hydro Wind
Solar PV Solar CSP
Nuclear Fleet
2010 0 0 0 0 0 0 0 0
2011 0 0 0 0 0 0 0 0
2012 0 0 0 0 0 300 0 0
2013 0 0 0 0 0 300 0 0
2014 500 0 0 0 400 300 0 0
2015 500 0 0 0 400 300 0 0
2016 0 0 0 0 400 300 100 0
2017 0 0 0 0 400 300 100 0
2018 0 0 0 0 400 300 100 0
2019 250 0 0 0 400 300 100 0
2020 250 237 0 0 400 300 100 0
2021 250 237 0 0 400 300 100 0
2022 250 237 805 1 143 400 300 100 0
2023 250 0 805 1 183 400 300 100 1,600
2024 250 0 0 283 800 300 100 1,600
2025 250 0 805 0 1,600 1,000 100 1,600
2026 1,000 0 0 0 400 500 0 1,600
2027 250 0 0 0 1,600 500 0 0
2028 1,000 474 690 0 0 500 0 1,600
2029 250 237 805 0 0 1,000 0 1,600
2030 1,000 948 0 0 0 1,000 0 0
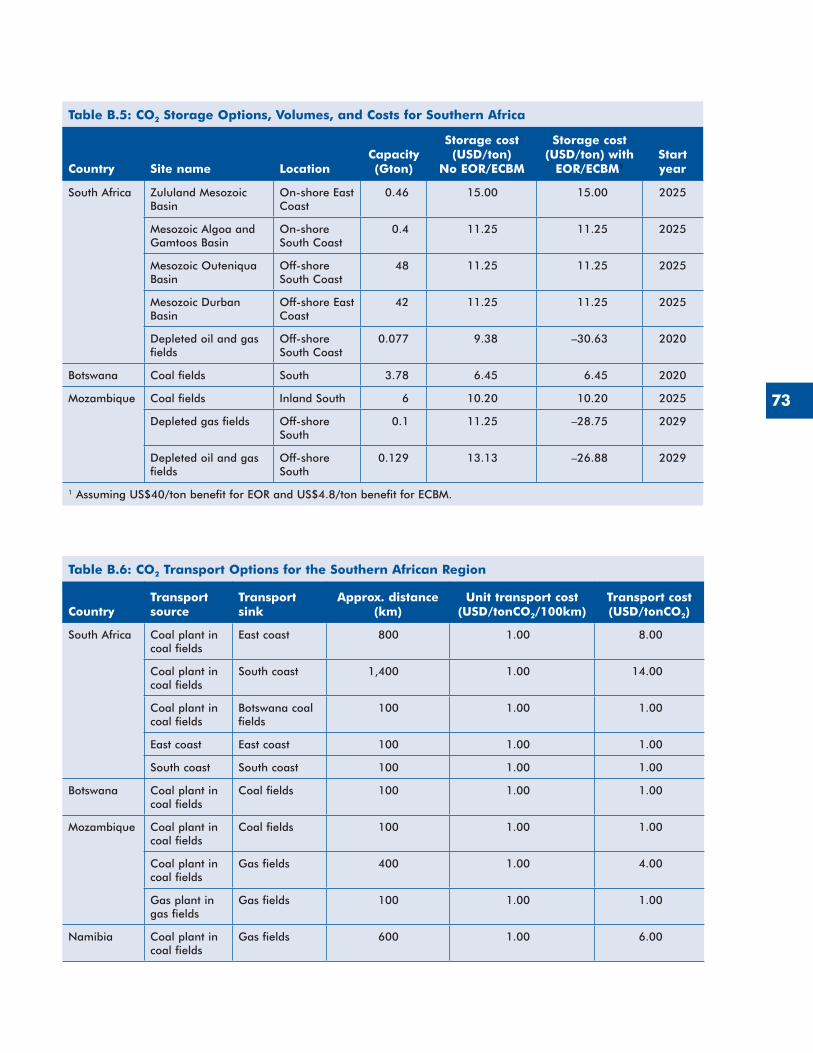
73
Table B.5: CO2 Storage Options, Volumes, and Costs for Southern Africa
Country Site name LocationCapacity (Gton)
Storage cost (USD/ton)
No EOR/ECBM
Storage cost (USD/ton) with
EOR/ECBM1Start year
South Africa Zululand Mesozoic Basin
On-shore East Coast
0�46 15�00 15�00 2025
Mesozoic Algoa and Gamtoos Basin
On-shore South Coast
0�4 11�25 11�25 2025
Mesozoic Outeniqua Basin
Off-shore South Coast
48 11�25 11�25 2025
Mesozoic Durban Basin
Off-shore East Coast
42 11�25 11�25 2025
Depleted oil and gas fields
Off-shore South Coast
0�077 9�38 –30�63 2020
Botswana Coal fields South 3�78 6�45 6�45 2020
Mozambique Coal fields Inland South 6 10�20 10�20 2025
Depleted gas fields Off-shore South
0�1 11�25 –28�75 2029
Depleted oil and gas fields
Off-shore South
0�129 13�13 –26�88 2029
1 Assuming US$40/ton benefit for EOR and US$4�8/ton benefit for ECBM�
Table B.6: CO2 Transport Options for the Southern African Region
CountryTransport source
Transport sink
Approx. distance(km)
Unit transport cost(USD/tonCO2/100km)
Transport cost(USD/tonCO2)
South Africa Coal plant in coal fields
East coast 800 1�00 8�00
Coal plant in coal fields
South coast 1,400 1�00 14�00
Coal plant in coal fields
Botswana coal fields
100 1�00 1�00
East coast East coast 100 1�00 1�00
South coast South coast 100 1�00 1�00
Botswana Coal plant in coal fields
Coal fields 100 1�00 1�00
Mozambique Coal plant in coal fields
Coal fields 100 1�00 1�00
Coal plant in coal fields
Gas fields 400 1�00 4�00
Gas plant in gas fields
Gas fields 100 1�00 1�00
Namibia Coal plant in coal fields
Gas fields 600 1�00 6�00
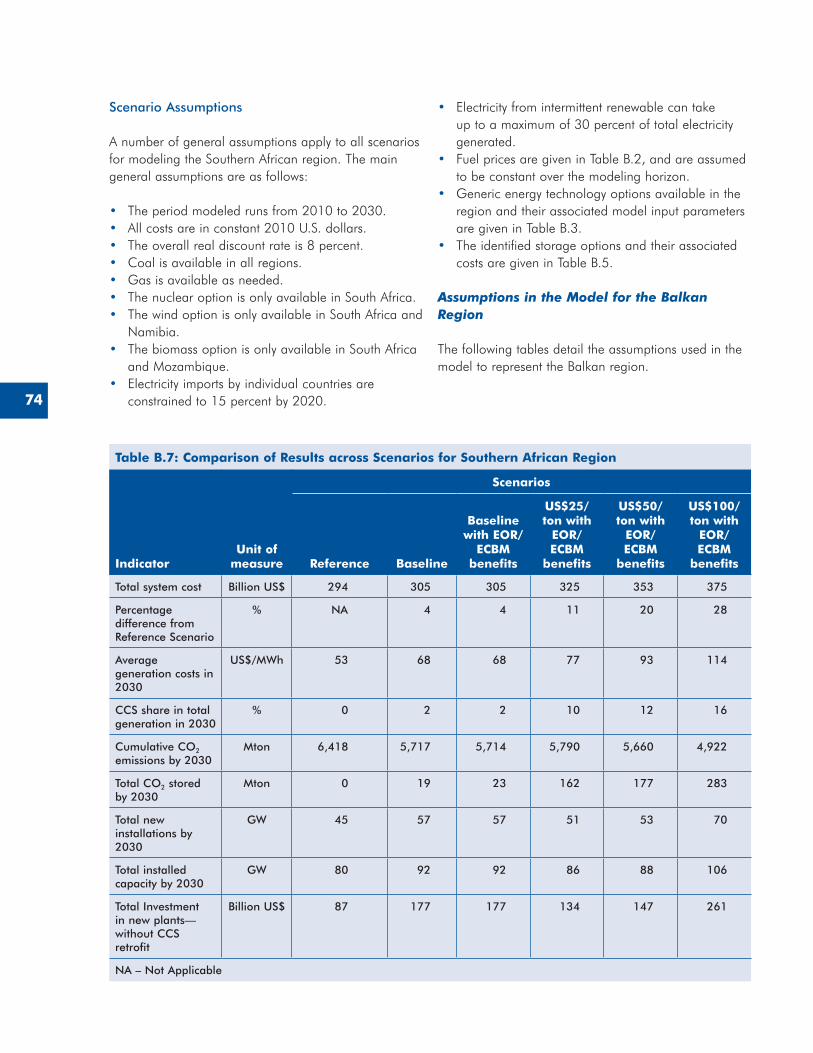
74
Scenario Assumptions
A number of general assumptions apply to all scenarios for modeling the Southern African region. The main general assumptions are as follows:
• The period modeled runs from 2010 to 2030.• All costs are in constant 2010 U.S. dollars.• The overall real discount rate is 8 percent.• Coal is available in all regions.• Gas is available as needed.• The nuclear option is only available in South Africa.• The wind option is only available in South Africa and
Namibia.• The biomass option is only available in South Africa
and Mozambique.• Electricity imports by individual countries are
constrained to 15 percent by 2020.
• Electricity from intermittent renewable can take up to a maximum of 30 percent of total electricity generated.
• Fuel prices are given in Table B.2, and are assumed to be constant over the modeling horizon.
• Generic energy technology options available in the region and their associated model input parameters are given in Table B.3.
• The identified storage options and their associated costs are given in Table B.5.
Assumptions in the Model for the Balkan Region
The following tables detail the assumptions used in the model to represent the Balkan region.
Table B.7: Comparison of Results across Scenarios for Southern African Region
IndicatorUnit of
measure
Scenarios
Reference Baseline
Baseline with EOR/
ECBM benefits
US$25/ton with
EOR/ECBM
benefits
US$50/ton with
EOR/ECBM
benefits
US$100/ton with
EOR/ECBM
benefits
Total system cost Billion US$ 294 305 305 325 353 375
Percentage difference from Reference Scenario
% NA 4 4 11 20 28
Average generation costs in 2030
US$/MWh 53 68 68 77 93 114
CCS share in total generation in 2030
% 0 2 2 10 12 16
Cumulative CO2
emissions by 2030Mton 6,418 5,717 5,714 5,790 5,660 4,922
Total CO2 stored by 2030
Mton 0 19 23 162 177 283
Total new installations by 2030
GW 45 57 57 51 53 70
Total installed capacity by 2030
GW 80 92 92 86 88 106
Total Investment in new plants—without CCS retrofit
Billion US$ 87 177 177 134 147 261
NA – Not Applicable
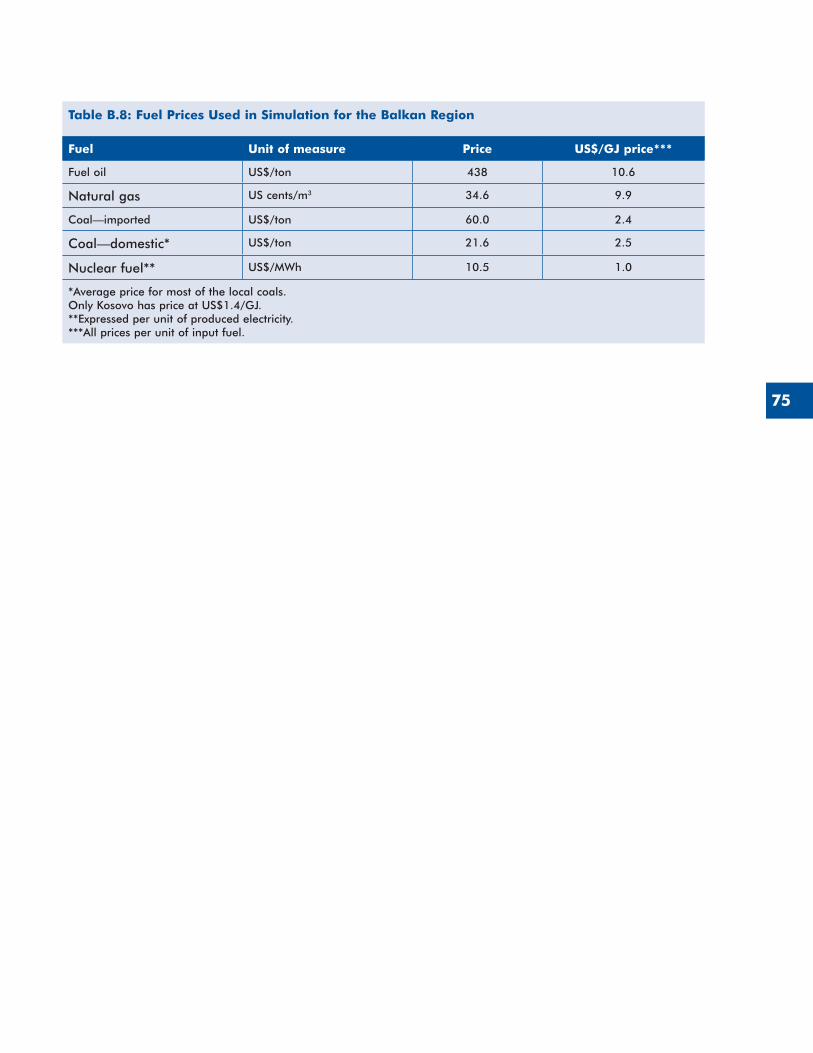
75
Table B.8: Fuel Prices Used in Simulation for the Balkan Region
Fuel Unit of measure Price US$/GJ price***
Fuel oil US$/ton 438 10�6
Natural gas US cents/m3 34�6 9�9
Coal—imported US$/ton 60�0 2�4
Coal—domestic* US$/ton 21�6 2�5
Nuclear fuel** US$/MWh 10�5 1�0
*Average price for most of the local coals�Only Kosovo has price at US$1�4/GJ�**Expressed per unit of produced electricity�***All prices per unit of input fuel�
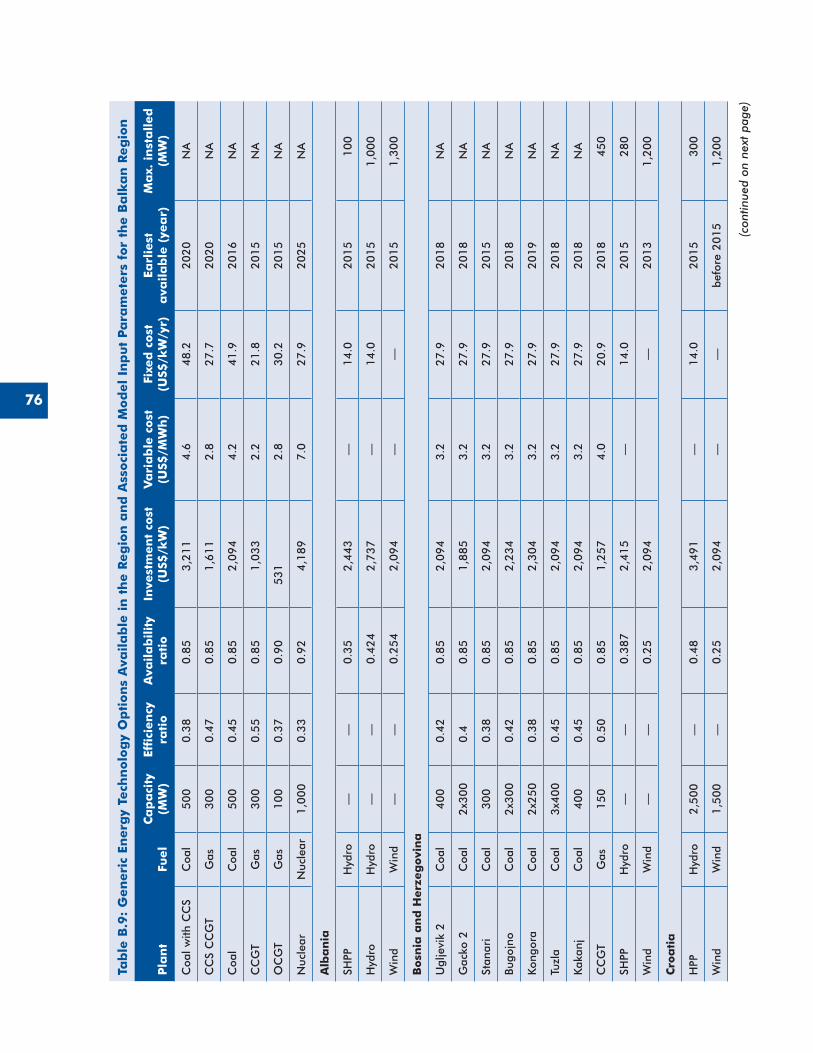
76
Tab
le B
.9:
Gen
eri
c En
erg
y Te
chn
olo
gy
Op
tion
s A
vaila
ble
in
th
e R
eg
ion
an
d A
ssoci
ate
d M
od
el
Inp
ut
Pa
ram
ete
rs f
or
the B
alk
an
Reg
ion
Pla
nt
Fuel
Ca
pa
city
(MW
)Ef
fici
en
cyra
tio
Ava
ila
bilit
yra
tio
Inve
stm
en
t co
st(U
S$/k
W)
Va
ria
ble
cost
(US$
/MW
h)
Fixe
d c
ost
(US$
/kW
/yr)
Earl
iest
a
vaila
ble
(ye
ar)
Ma
x. i
nst
alled
(M
W)
Coa
l with
CC
SC
oal
50
00
�38
0�8
53
,21
14
�648�2
2020
NA
CC
S C
CG
TG
as3
00
0�4
70
�85
1,6
11
2�8
27�7
2020
NA
Coa
lC
oal
50
00
�45
0�8
52
,09
44
�241�9
2016
NA
CC
GT
Gas
30
00
�55
0�8
51
,03
32
�221�8
2015
NA
OC
GT
Gas
10
00
�37
0�9
05
31
2�8
30�2
2015
NA
Nuc
lear
Nuc
lear
1,0
00
0�3
30
�92
4,1
89
7�0
27�9
2025
NA
Alb
an
ia
SHPP
Hyd
ro—
—0
�35
2,4
43
—14�0
2015
100
Hyd
roH
ydro
——
0�4
24
2,7
37
—14�0
2015
1,0
00
Win
dW
ind
——
0�2
54
2,0
94
——
2015
1,3
00
Bosn
ia a
nd
Herz
eg
ovi
na
Ugl
jevi
k 2
Coa
l4
00
0�4
20
�85
2,0
94
3�2
27�9
2018
NA
Gac
ko 2
Coa
l2
x30
00
�40
�85
1,8
85
3�2
27�9
2018
NA
Stan
ari
Coa
l3
00
0�3
80
�85
2,0
94
3�2
27�9
2015
NA
Bugo
jno
Coa
l2
x30
00
�42
0�8
52
,23
43
�227�9
2018
NA
Kon
gora
Coa
l2
x25
00
�38
0�8
52
,30
43
�227�9
2019
NA
Tuzl
aC
oal
3x4
00
0�4
50
�85
2,0
94
3�2
27�9
2018
NA
Kak
anj
Coa
l4
00
0�4
50
�85
2,0
94
3�2
27�9
2018
NA
CC
GT
Gas
15
00
�50
0�8
51
,25
74
�020�9
2018
450
SHPP
Hyd
ro—
—0
�38
72
,41
5—
14�0
2015
280
Win
dW
ind
——
0�2
52
,09
4—
2013
1,2
00
Cro
ati
a
HPP
Hyd
ro2
,50
0—
0�4
83
,49
1—
14�0
2015
300
Win
dW
ind
1,5
00
—0
�25
2,0
94
——
befo
re 2
015
1,2
00
(co
ntin
ued
on n
ext
page
)
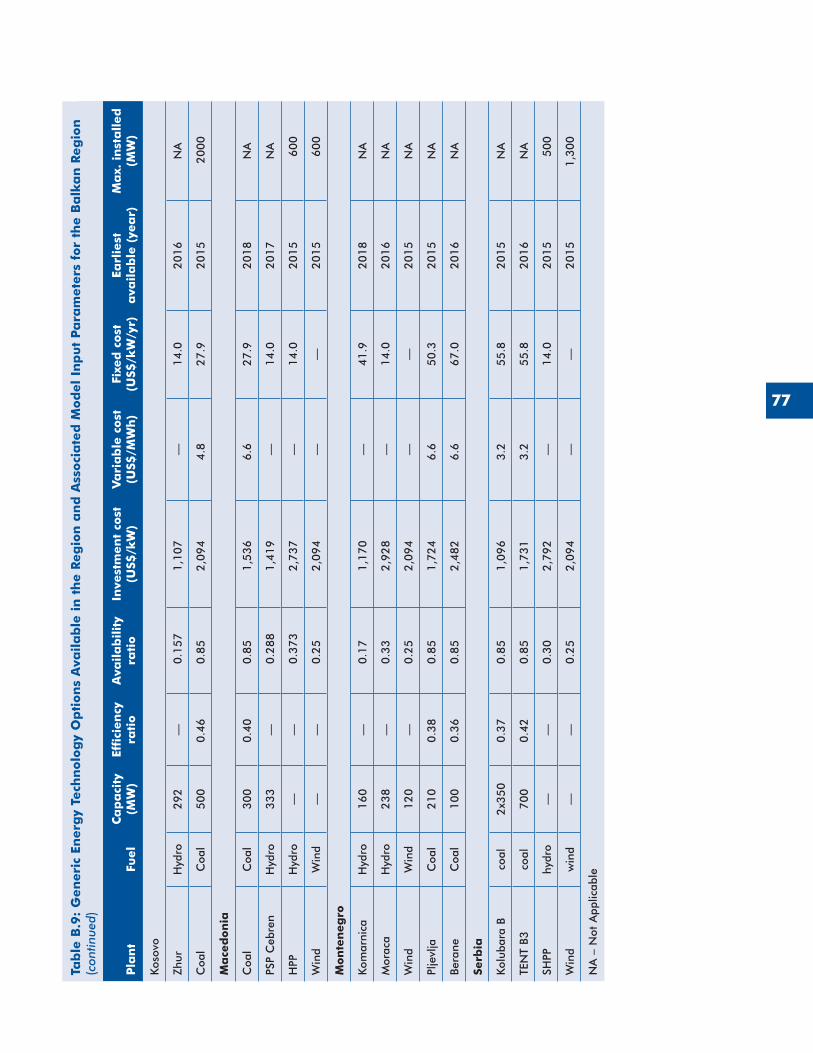
77
Tab
le B
.9:
Gen
eri
c En
erg
y Te
chn
olo
gy
Op
tion
s A
vaila
ble
in
th
e R
eg
ion
an
d A
ssoci
ate
d M
od
el
Inp
ut
Pa
ram
ete
rs f
or
the B
alk
an
Reg
ion
Pla
nt
Fuel
Ca
pa
city
(MW
)Ef
fici
en
cyra
tio
Ava
ila
bilit
yra
tio
Inve
stm
en
t co
st(U
S$/k
W)
Va
ria
ble
cost
(US$
/MW
h)
Fixe
d c
ost
(US$
/kW
/yr)
Earl
iest
a
vaila
ble
(ye
ar)
Ma
x. i
nst
alled
(M
W)
Kos
ovo
Zhur
Hyd
ro2
92
—0
�15
71
,10
7—
14�0
2016
NA
Coa
lC
oal
50
00
�46
0�8
52
,09
44
�827�9
2015
2000
Ma
ced
on
ia
Coa
lC
oal
30
00
�40
0�8
51
,53
66
�627�9
2018
NA
PSP
Ceb
ren
Hyd
ro3
33
—0
�28
81
,41
9—
14�0
2017
NA
HPP
Hyd
ro—
—0
�37
32
,73
7—
14�0
2015
600
Win
dW
ind
——
0�2
52
,09
4—
—2015
600
Mon
ten
eg
ro
Kom
arni
caH
ydro
16
0—
0�1
71
,17
0—
41�9
2018
NA
Mor
aca
Hyd
ro2
38
—0
�33
2,9
28
—14�0
2016
NA
Win
dW
ind
12
0—
0�2
52
,09
4—
—2015
NA
Plje
vlja
Coa
l2
10
0�3
80
�85
1,7
24
6�6
50�3
2015
NA
Bera
neC
oal
10
00
�36
0�8
52
,48
26
�667�0
2016
NA
Serb
ia
Kol
ubar
a B
coal
2x3
50
0�3
70
�85
1,0
96
3�2
55�8
2015
NA
TEN
T B3
coal
70
00
�42
0�8
51
,73
13
�255�8
2016
NA
SHPP
hy
dro
——
0�3
02
,79
2—
14�0
2015
500
Win
dw
ind
——
0�2
52
,09
4—
—2015
1,3
00
NA
– N
ot A
pplic
able
Tab
le B
.9:
Gen
eri
c En
erg
y Te
chn
olo
gy
Op
tion
s A
vaila
ble
in
th
e R
eg
ion
an
d A
ssoci
ate
d M
od
el
Inp
ut
Pa
ram
ete
rs f
or
the B
alk
an
Reg
ion
(con
tinue
d)
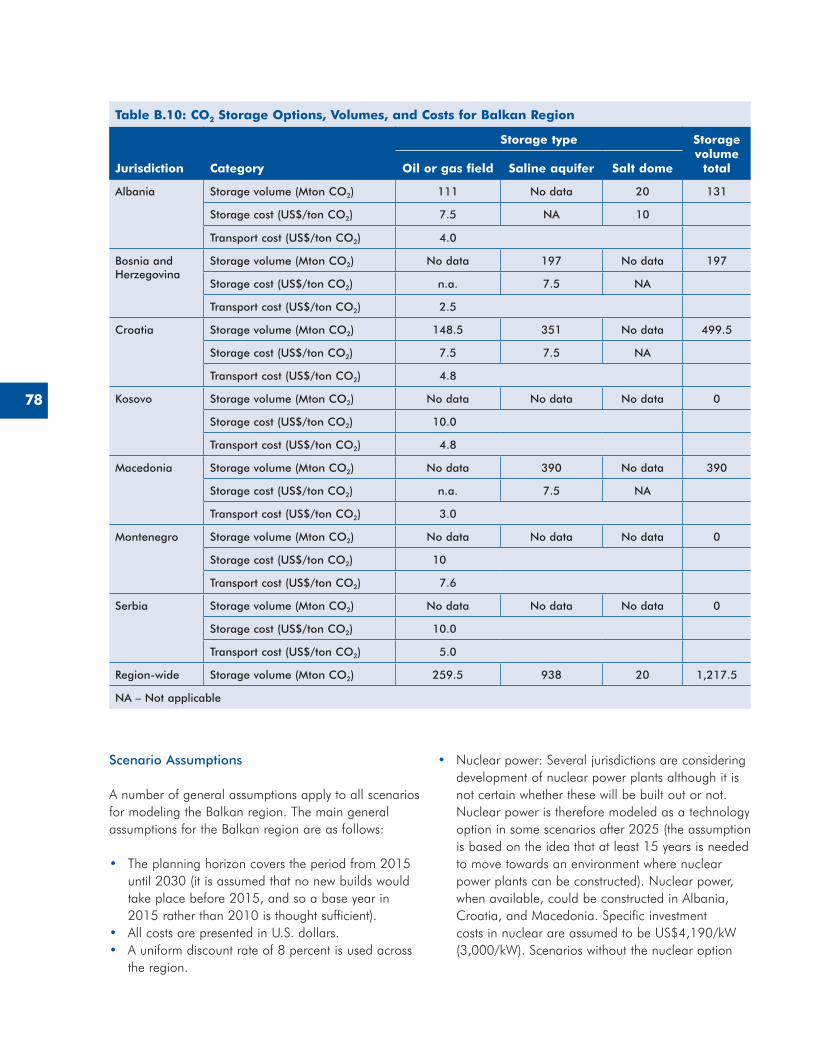
78
Scenario Assumptions
A number of general assumptions apply to all scenarios for modeling the Balkan region. The main general assumptions for the Balkan region are as follows:
• The planning horizon covers the period from 2015 until 2030 (it is assumed that no new builds would take place before 2015, and so a base year in 2015 rather than 2010 is thought sufficient).
• All costs are presented in U.S. dollars.• A uniform discount rate of 8 percent is used across
the region.
• Nuclear power: Several jurisdictions are considering development of nuclear power plants although it is not certain whether these will be built out or not. Nuclear power is therefore modeled as a technology option in some scenarios after 2025 (the assumption is based on the idea that at least 15 years is needed to move towards an environment where nuclear power plants can be constructed). Nuclear power, when available, could be constructed in Albania, Croatia, and Macedonia. Specific investment costs in nuclear are assumed to be US$4,190/kW (3,000/kW). Scenarios without the nuclear option
Table B.10: CO2 Storage Options, Volumes, and Costs for Balkan Region
Jurisdiction Category
Storage type Storage volume
totalOil or gas field Saline aquifer Salt dome
Albania Storage volume (Mton CO2) 111 No data 20 131
Storage cost (US$/ton CO2) 7�5 NA 10
Transport cost (US$/ton CO2) 4�0
Bosnia and Herzegovina
Storage volume (Mton CO2) No data 197 No data 197
Storage cost (US$/ton CO2) n�a� 7�5 NA
Transport cost (US$/ton CO2) 2�5
Croatia Storage volume (Mton CO2) 148�5 351 No data 499�5
Storage cost (US$/ton CO2) 7�5 7�5 NA
Transport cost (US$/ton CO2) 4�8
Kosovo Storage volume (Mton CO2) No data No data No data 0
Storage cost (US$/ton CO2) 10�0
Transport cost (US$/ton CO2) 4�8
Macedonia Storage volume (Mton CO2) No data 390 No data 390
Storage cost (US$/ton CO2) n�a� 7�5 NA
Transport cost (US$/ton CO2) 3�0
Montenegro Storage volume (Mton CO2) No data No data No data 0
Storage cost (US$/ton CO2) 10
Transport cost (US$/ton CO2) 7�6
Serbia Storage volume (Mton CO2) No data No data No data 0
Storage cost (US$/ton CO2) 10�0
Transport cost (US$/ton CO2) 5�0
Region-wide Storage volume (Mton CO2) 259�5 938 20 1,217�5
NA – Not applicable
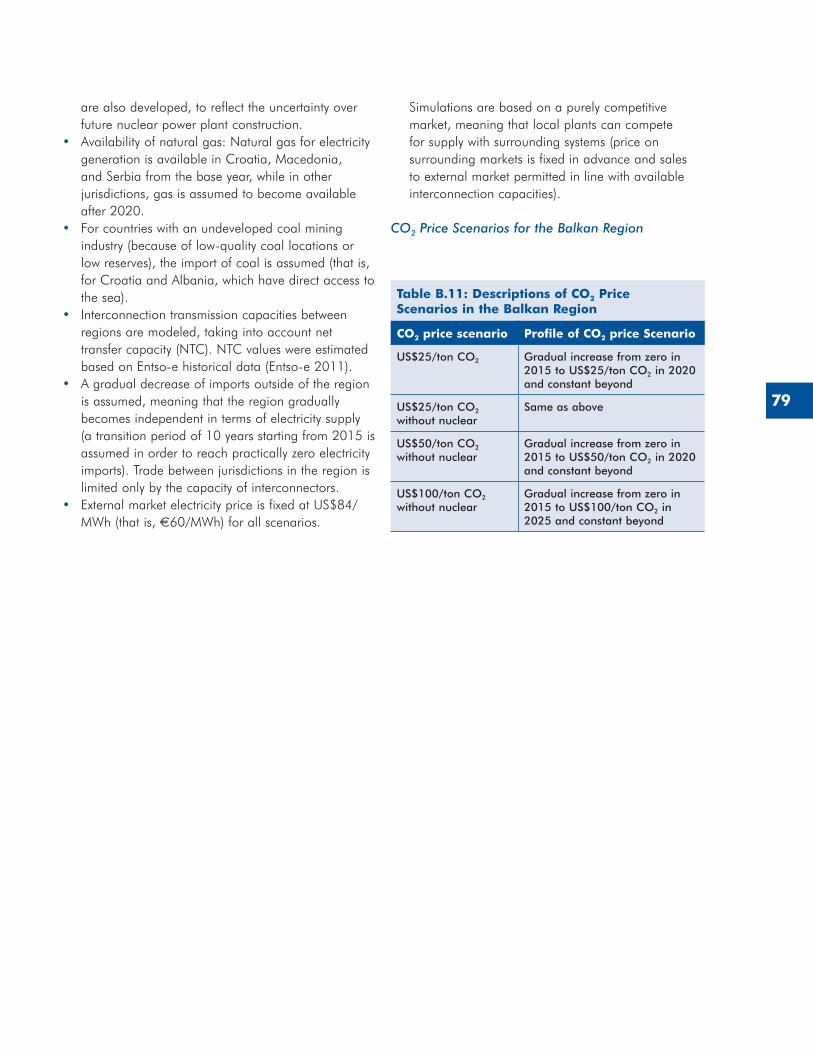
79
are also developed, to reflect the uncertainty over future nuclear power plant construction.
• Availability of natural gas: Natural gas for electricity generation is available in Croatia, Macedonia, and Serbia from the base year, while in other jurisdictions, gas is assumed to become available after 2020.
• For countries with an undeveloped coal mining industry (because of low-quality coal locations or low reserves), the import of coal is assumed (that is, for Croatia and Albania, which have direct access to the sea).
• Interconnection transmission capacities between regions are modeled, taking into account net transfer capacity (NTC). NTC values were estimated based on Entso-e historical data (Entso-e 2011).
• A gradual decrease of imports outside of the region is assumed, meaning that the region gradually becomes independent in terms of electricity supply (a transition period of 10 years starting from 2015 is assumed in order to reach practically zero electricity imports). Trade between jurisdictions in the region is limited only by the capacity of interconnectors.
• External market electricity price is fixed at US$84/MWh (that is, €60/MWh) for all scenarios.
Simulations are based on a purely competitive market, meaning that local plants can compete for supply with surrounding systems (price on surrounding markets is fixed in advance and sales to external market permitted in line with available interconnection capacities).
CO2 Price Scenarios for the Balkan Region
Table B.11: Descriptions of CO2 Price Scenarios in the Balkan Region
CO2 price scenario Profile of CO2 price Scenario
US$25/ton CO2 Gradual increase from zero in 2015 to US$25/ton CO2 in 2020 and constant beyond
US$25/ton CO2 without nuclear
Same as above
US$50/ton CO2 without nuclear
Gradual increase from zero in 2015 to US$50/ton CO2 in 2020 and constant beyond
US$100/ton CO2 without nuclear
Gradual increase from zero in 2015 to US$100/ton CO2 in 2025 and constant beyond
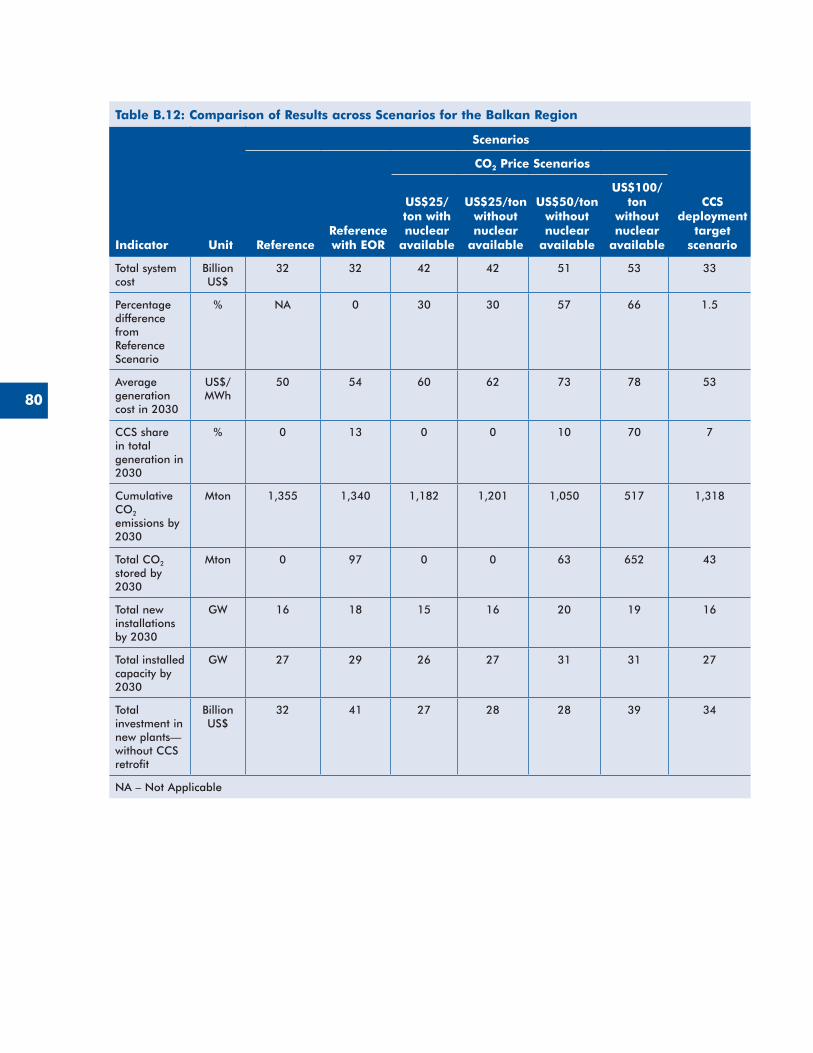
80
Table B.12: Comparison of Results across Scenarios for the Balkan Region
Indicator Unit
Scenarios
ReferenceReference with EOR
CO2 Price Scenarios
CCS deployment
target scenario
US$25/ton with nuclear
available
US$25/ton without nuclear
available
US$50/ton without nuclear
available
US$100/ton
without nuclear
available
Total system cost
Billion US$
32 32 42 42 51 53 33
Percentage difference from Reference Scenario
% NA 0 30 30 57 66 1�5
Average generation cost in 2030
US$/MWh
50 54 60 62 73 78 53
CCS share in total generation in 2030
% 0 13 0 0 10 70 7
Cumulative CO2
emissions by 2030
Mton 1,355 1,340 1,182 1,201 1,050 517 1,318
Total CO2 stored by 2030
Mton 0 97 0 0 63 652 43
Total new installations by 2030
GW 16 18 15 16 20 19 16
Total installed capacity by 2030
GW 27 29 26 27 31 31 27
Total investment in new plants—without CCS retrofit
Billion US$
32 41 27 28 28 39 34
NA – Not Applicable
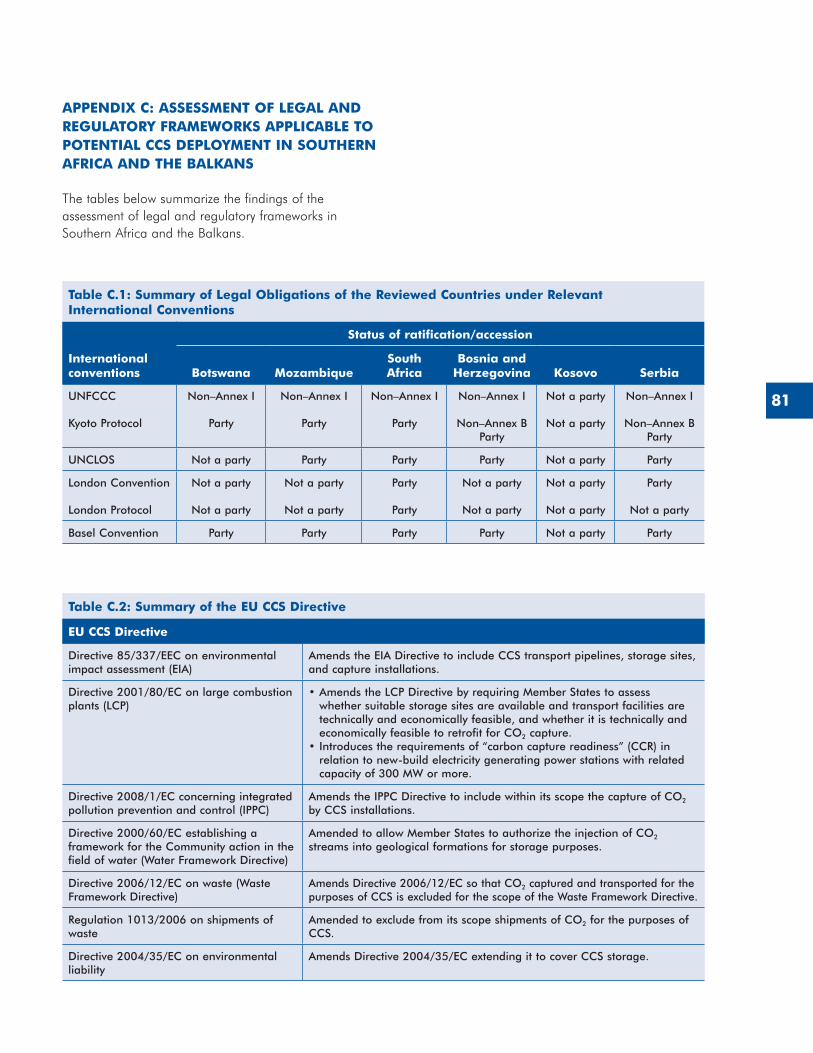
81
APPENDIX C: ASSESSMENT OF LEGAL AND REGULATORY FRAMEWORKS APPLICABLE TO POTENTIAL CCS DEPLOYMENT IN SOUTHERN AFRICA AND THE BALKANS
The tables below summarize the findings of the assessment of legal and regulatory frameworks in Southern Africa and the Balkans.
Table C.2: Summary of the EU CCS Directive
EU CCS Directive
Directive 85/337/EEC on environmental impact assessment (EIA)
Amends the EIA Directive to include CCS transport pipelines, storage sites, and capture installations�
Directive 2001/80/EC on large combustion plants (LCP)
•Amends the LCP Directive by requiring Member States to assess whether suitable storage sites are available and transport facilities are technically and economically feasible, and whether it is technically and economically feasible to retrofit for CO2 capture�
•Introduces the requirements of “carbon capture readiness” (CCR) in relation to new-build electricity generating power stations with related capacity of 300 MW or more�
Directive 2008/1/EC concerning integrated pollution prevention and control (IPPC)
Amends the IPPC Directive to include within its scope the capture of CO2 by CCS installations�
Directive 2000/60/EC establishing a framework for the Community action in the field of water (Water Framework Directive)
Amended to allow Member States to authorize the injection of CO2 streams into geological formations for storage purposes�
Directive 2006/12/EC on waste (Waste Framework Directive)
Amends Directive 2006/12/EC so that CO2 captured and transported for the purposes of CCS is excluded for the scope of the Waste Framework Directive�
Regulation 1013/2006 on shipments of waste
Amended to exclude from its scope shipments of CO2 for the purposes of CCS�
Directive 2004/35/EC on environmental liability
Amends Directive 2004/35/EC extending it to cover CCS storage�
Table C.1: Summary of Legal Obligations of the Reviewed Countries under Relevant International Conventions
International conventions
Status of ratification/accession
Botswana MozambiqueSouth Africa
Bosnia and Herzegovina Kosovo Serbia
UNFCCC
Kyoto Protocol
Non–Annex I
Party
Non–Annex I
Party
Non–Annex I
Party
Non–Annex I
Non–Annex B Party
Not a party
Not a party
Non–Annex I
Non–Annex B Party
UNCLOS Not a party Party Party Party Not a party Party
London Convention
London Protocol
Not a party
Not a party
Not a party
Not a party
Party
Party
Not a party
Not a party
Not a party
Not a party
Party
Not a party
Basel Convention Party Party Party Party Not a party Party
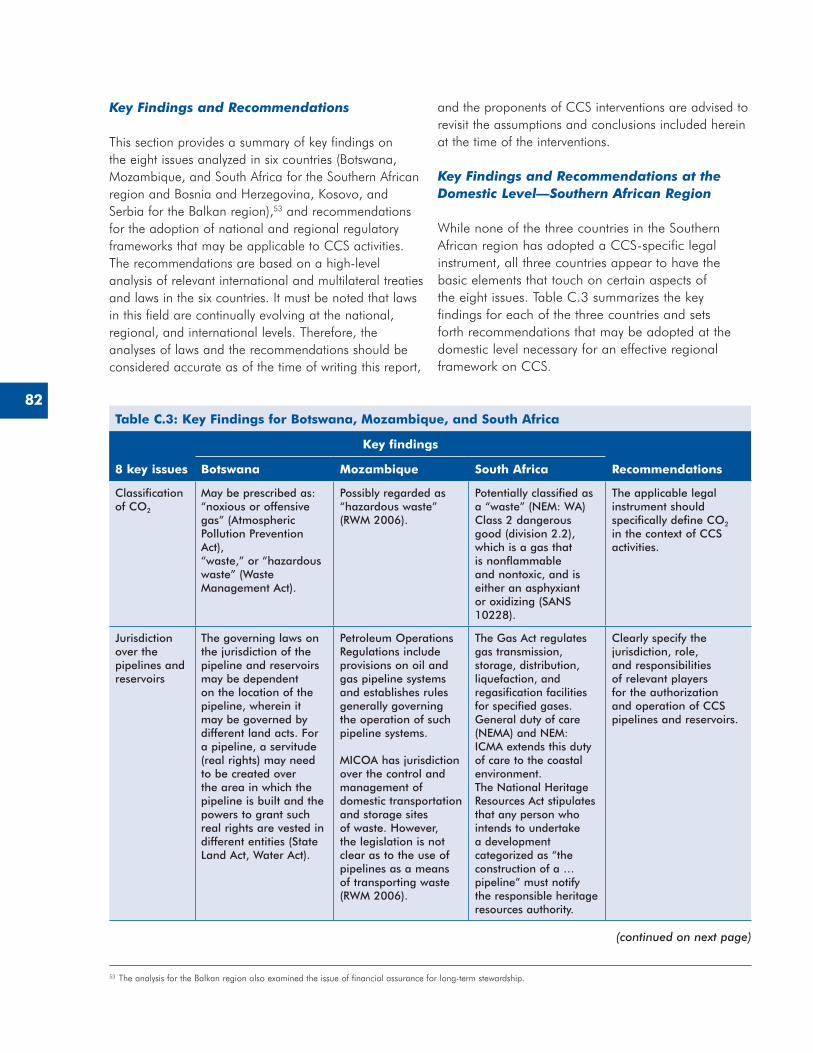
82
Key Findings and Recommendations
This section provides a summary of key findings on the eight issues analyzed in six countries (Botswana, Mozambique, and South Africa for the Southern African region and Bosnia and Herzegovina, Kosovo, and Serbia for the Balkan region),53 and recommendations for the adoption of national and regional regulatory frameworks that may be applicable to CCS activities. The recommendations are based on a high-level analysis of relevant international and multilateral treaties and laws in the six countries. It must be noted that laws in this field are continually evolving at the national, regional, and international levels. Therefore, the analyses of laws and the recommendations should be considered accurate as of the time of writing this report,
and the proponents of CCS interventions are advised to revisit the assumptions and conclusions included herein at the time of the interventions.
Key Findings and Recommendations at the Domestic Level—Southern African Region
While none of the three countries in the Southern African region has adopted a CCS-specific legal instrument, all three countries appear to have the basic elements that touch on certain aspects of the eight issues. Table C.3 summarizes the key findings for each of the three countries and sets forth recommendations that may be adopted at the domestic level necessary for an effective regional framework on CCS.
53 The analysis for the Balkan region also examined the issue of financial assurance for long-term stewardship.
Table C.3: Key Findings for Botswana, Mozambique, and South Africa
8 key issues
Key findings
RecommendationsBotswana Mozambique South Africa
Classification of CO2
May be prescribed as: “noxious or offensive gas” (Atmospheric Pollution Prevention Act),“waste,” or “hazardous waste” (Waste Management Act)�
Possibly regarded as “hazardous waste” (RWM 2006)�
Potentially classified as a “waste” (NEM: WA)Class 2 dangerous good (division 2�2), which is a gas that is nonflammable and nontoxic, and is either an asphyxiant or oxidizing (SANS 10228)�
The applicable legal instrument should specifically define CO2 in the context of CCS activities�
Jurisdiction over the pipelines and reservoirs
The governing laws on the jurisdiction of the pipeline and reservoirs may be dependent on the location of the pipeline, wherein it may be governed by different land acts� For a pipeline, a servitude (real rights) may need to be created over the area in which the pipeline is built and the powers to grant such real rights are vested in different entities (State Land Act, Water Act)�
Petroleum Operations Regulations include provisions on oil and gas pipeline systems and establishes rules generally governing the operation of such pipeline systems�
MICOA has jurisdiction over the control and management of domestic transportation and storage sites of waste� However, the legislation is not clear as to the use of pipelines as a means of transporting waste (RWM 2006)�
The Gas Act regulates gas transmission, storage, distribution, liquefaction, and regasification facilities for specified gases�General duty of care (NEMA) and NEM: ICMA extends this duty of care to the coastal environment�The National Heritage Resources Act stipulates that any person who intends to undertake a development categorized as “the construction of a … pipeline” must notify the responsible heritage resources authority�
Clearly specify the jurisdiction, role, and responsibilities of relevant players for the authorization and operation of CCS pipelines and reservoirs�
(continued on next page)
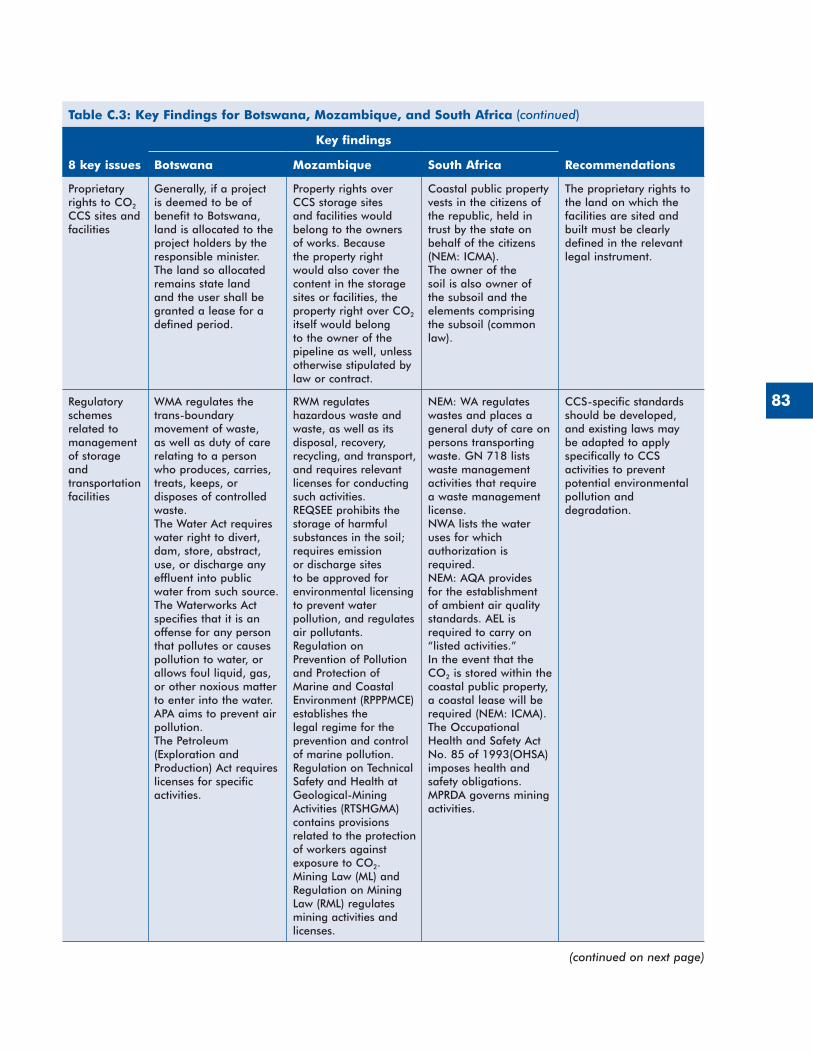
83
Table C.3: Key Findings for Botswana, Mozambique, and South Africa
8 key issues
Key findings
RecommendationsBotswana Mozambique South Africa
Proprietary rights to CO2 CCS sites and facilities
Generally, if a project is deemed to be of benefit to Botswana, land is allocated to the project holders by the responsible minister� The land so allocated remains state land and the user shall be granted a lease for a defined period�
Property rights over CCS storage sites and facilities would belong to the owners of works� Because the property right would also cover the content in the storage sites or facilities, the property right over CO2
itself would belong to the owner of the pipeline as well, unless otherwise stipulated by law or contract�
Coastal public property vests in the citizens of the republic, held in trust by the state on behalf of the citizens (NEM: ICMA)�The owner of the soil is also owner of the subsoil and the elements comprising the subsoil (common law)�
The proprietary rights to the land on which the facilities are sited and built must be clearly defined in the relevant legal instrument�
Regulatory schemes related to management of storage and transportation facilities
WMA regulates the trans-boundary movement of waste, as well as duty of care relating to a person who produces, carries, treats, keeps, or disposes of controlled waste�The Water Act requires water right to divert, dam, store, abstract, use, or discharge any effluent into public water from such source�The Waterworks Act specifies that it is an offense for any person that pollutes or causes pollution to water, or allows foul liquid, gas, or other noxious matter to enter into the water�APA aims to prevent air pollution�The Petroleum (Exploration and Production) Act requires licenses for specific activities�
RWM regulates hazardous waste and waste, as well as its disposal, recovery, recycling, and transport, and requires relevant licenses for conducting such activities�REQSEE prohibits the storage of harmful substances in the soil; requires emission or discharge sites to be approved for environmental licensing to prevent water pollution, and regulates air pollutants�Regulation on Prevention of Pollution and Protection of Marine and Coastal Environment (RPPPMCE) establishes the legal regime for the prevention and control of marine pollution�Regulation on Technical Safety and Health at Geological-Mining Activities (RTSHGMA) contains provisions related to the protection of workers against exposure to CO2�Mining Law (ML) and Regulation on Mining Law (RML) regulates mining activities and licenses�
NEM: WA regulates wastes and places a general duty of care on persons transporting waste� GN 718 lists waste management activities that require a waste management license�NWA lists the water uses for which authorization is required�NEM: AQA provides for the establishment of ambient air quality standards� AEL is required to carry on “listed activities�”In the event that the CO2 is stored within the coastal public property, a coastal lease will be required (NEM: ICMA)�The Occupational Health and Safety Act No� 85 of 1993(OHSA) imposes health and safety obligations�MPRDA governs mining activities�
CCS-specific standards should be developed, and existing laws may be adapted to apply specifically to CCS activities to prevent potential environmental pollution and degradation�
(continued on next page)
(continued)
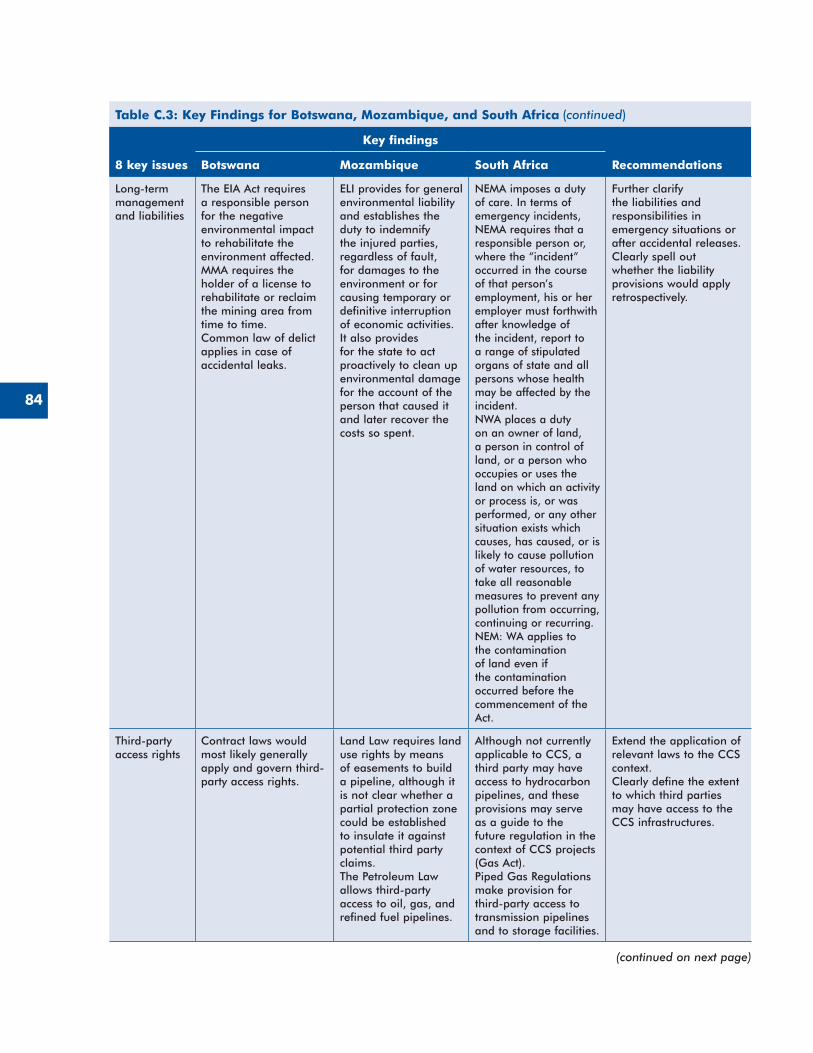
84
Table C.3: Key Findings for Botswana, Mozambique, and South Africa
8 key issues
Key findings
RecommendationsBotswana Mozambique South Africa
Long-term management and liabilities
The EIA Act requires a responsible person for the negative environmental impact to rehabilitate the environment affected�MMA requires the holder of a license to rehabilitate or reclaim the mining area from time to time�Common law of delict applies in case of accidental leaks�
ELI provides for general environmental liability and establishes the duty to indemnify the injured parties, regardless of fault, for damages to the environment or for causing temporary or definitive interruption of economic activities� It also provides for the state to act proactively to clean up environmental damage for the account of the person that caused it and later recover the costs so spent�
NEMA imposes a duty of care� In terms of emergency incidents, NEMA requires that a responsible person or, where the “incident” occurred in the course of that person’s employment, his or her employer must forthwith after knowledge of the incident, report to a range of stipulated organs of state and all persons whose health may be affected by the incident�NWA places a duty on an owner of land, a person in control of land, or a person who occupies or uses the land on which an activity or process is, or was performed, or any other situation exists which causes, has caused, or is likely to cause pollution of water resources, to take all reasonable measures to prevent any pollution from occurring, continuing or recurring�NEM: WA applies to the contamination of land even if the contamination occurred before the commencement of the Act�
Further clarify the liabilities and responsibilities in emergency situations or after accidental releases�Clearly spell out whether the liability provisions would apply retrospectively�
Third-party access rights
Contract laws would most likely generally apply and govern third-party access rights�
Land Law requires land use rights by means of easements to build a pipeline, although it is not clear whether a partial protection zone could be established to insulate it against potential third party claims�The Petroleum Law allows third-party access to oil, gas, and refined fuel pipelines�
Although not currently applicable to CCS, a third party may have access to hydrocarbon pipelines, and these provisions may serve as a guide to the future regulation in the context of CCS projects (Gas Act)�Piped Gas Regulations make provision for third-party access to transmission pipelines and to storage facilities�
Extend the application of relevant laws to the CCS context�Clearly define the extent to which third parties may have access to the CCS infrastructures�
(continued on next page)
(continued)
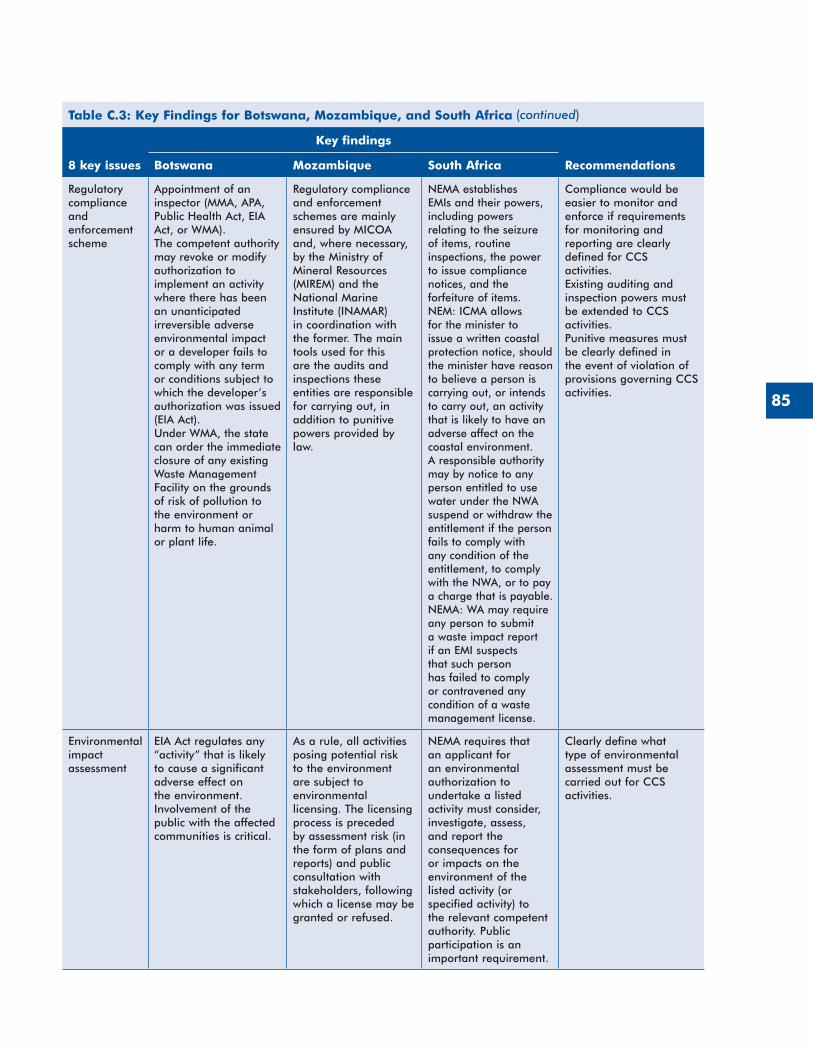
85
Table C.3: Key Findings for Botswana, Mozambique, and South Africa
8 key issues
Key findings
RecommendationsBotswana Mozambique South Africa
Regulatory compliance and enforcement scheme
Appointment of an inspector (MMA, APA, Public Health Act, EIA Act, or WMA)�The competent authority may revoke or modify authorization to implement an activity where there has been an unanticipated irreversible adverse environmental impact or a developer fails to comply with any term or conditions subject to which the developer’s authorization was issued (EIA Act)�Under WMA, the state can order the immediate closure of any existing Waste Management Facility on the grounds of risk of pollution to the environment or harm to human animal or plant life�
Regulatory compliance and enforcement schemes are mainly ensured by MICOA and, where necessary, by the Ministry of Mineral Resources (MIREM) and the National Marine Institute (INAMAR)in coordination with the former� The main tools used for this are the audits and inspections these entities are responsible for carrying out, in addition to punitive powers provided by law�
NEMA establishes EMIs and their powers, including powers relating to the seizure of items, routine inspections, the power to issue compliance notices, and the forfeiture of items�NEM: ICMA allows for the minister to issue a written coastal protection notice, should the minister have reason to believe a person is carrying out, or intends to carry out, an activity that is likely to have an adverse affect on the coastal environment�A responsible authority may by notice to any person entitled to use water under the NWA suspend or withdraw the entitlement if the person fails to comply with any condition of the entitlement, to comply with the NWA, or to pay a charge that is payable�NEMA: WA may require any person to submit a waste impact report if an EMI suspects that such person has failed to comply or contravened any condition of a waste management license�
Compliance would be easier to monitor and enforce if requirements for monitoring and reporting are clearly defined for CCS activities�Existing auditing and inspection powers must be extended to CCS activities�Punitive measures must be clearly defined in the event of violation of provisions governing CCS activities�
Environmental impact assessment
EIA Act regulates any “activity” that is likely to cause a significant adverse effect on the environment� Involvement of the public with the affected communities is critical�
As a rule, all activities posing potential risk to the environment are subject to environmental licensing� The licensing process is preceded by assessment risk (in the form of plans and reports) and public consultation with stakeholders, following which a license may be granted or refused�
NEMA requires that an applicant for an environmental authorization to undertake a listed activity must consider, investigate, assess, and report the consequences for or impacts on the environment of the listed activity (or specified activity) to the relevant competent authority� Public participation is an important requirement�
Clearly define what type of environmental assessment must be carried out for CCS activities�
(continued)
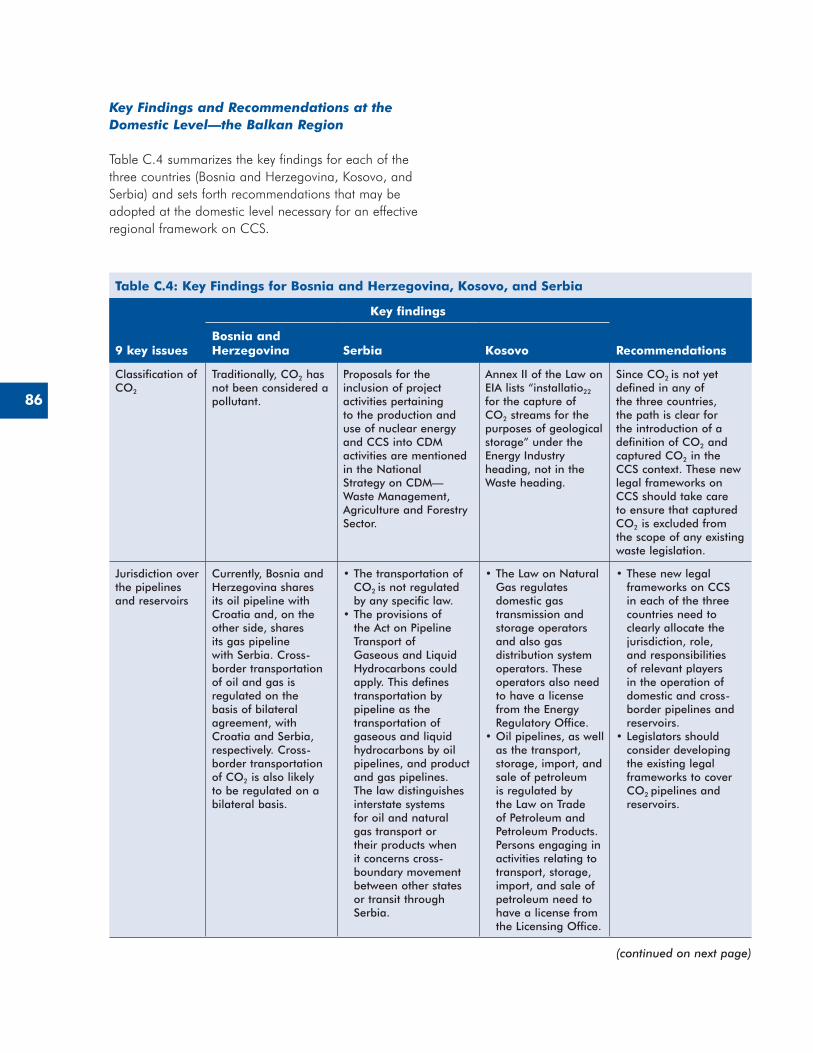
86
Key Findings and Recommendations at the Domestic Level—the Balkan Region
Table C.4 summarizes the key findings for each of the three countries (Bosnia and Herzegovina, Kosovo, and Serbia) and sets forth recommendations that may be adopted at the domestic level necessary for an effective regional framework on CCS.
Table C.4: Key Findings for Bosnia and Herzegovina, Kosovo, and Serbia
9 key issues
Key findings
RecommendationsBosnia and Herzegovina Serbia Kosovo
Classification of CO2
Traditionally, CO2 has not been considered a pollutant�
Proposals for the inclusion of project activities pertaining to the production and use of nuclear energy and CCS into CDM activities are mentioned in the National Strategy on CDM—Waste Management, Agriculture and Forestry Sector�
Annex II of the Law on EIA lists “installatio22 for the capture of CO2 streams for the purposes of geological storage” under the Energy Industry heading, not in the Waste heading�
Since CO2 is not yet defined in any of the three countries, the path is clear for the introduction of a definition of CO2 and captured CO2 in the CCS context� These new legal frameworks on CCS should take care to ensure that captured CO2 is excluded from the scope of any existing waste legislation�
Jurisdiction over the pipelines and reservoirs
Currently, Bosnia and Herzegovina shares its oil pipeline with Croatia and, on the other side, shares its gas pipeline with Serbia� Cross-border transportation of oil and gas is regulated on the basis of bilateral agreement, with Croatia and Serbia, respectively� Cross-border transportation of CO2 is also likely to be regulated on a bilateral basis�
•The transportation of CO2 is not regulated by any specific law�
•The provisions of the Act on Pipeline Transport of Gaseous and Liquid Hydrocarbons could apply� This defines transportation by pipeline as the transportation of gaseous and liquid hydrocarbons by oil pipelines, and product and gas pipelines� The law distinguishes interstate systems for oil and natural gas transport or their products when it concerns cross-boundary movement between other states or transit through Serbia�
•The Law on Natural Gas regulates domestic gas transmission and storage operators and also gas distribution system operators� These operators also need to have a license from the Energy Regulatory Office�
•Oil pipelines, as well as the transport, storage, import, and sale of petroleum is regulated by the Law on Trade of Petroleum and Petroleum Products� Persons engaging in activities relating to transport, storage, import, and sale of petroleum need to have a license from the Licensing Office�
•These new legal frameworks on CCS in each of the three countries need to clearly allocate the jurisdiction, role, and responsibilities of relevant players in the operation of domestic and cross-border pipelines and reservoirs�
•Legislators should consider developing the existing legal frameworks to cover CO2 pipelines and reservoirs�
(continued on next page)
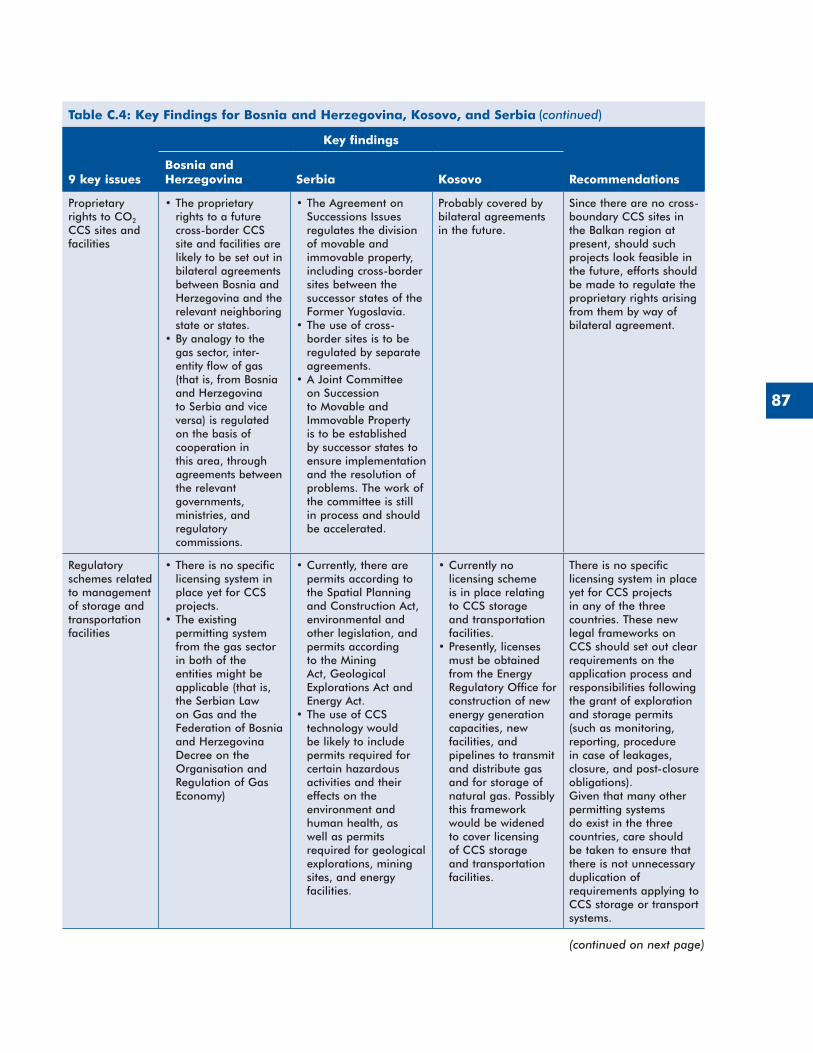
87
Table C.4: Key Findings for Bosnia and Herzegovina, Kosovo, and Serbia
9 key issues
Key findings
RecommendationsBosnia and Herzegovina Serbia Kosovo
Proprietary rights to CO2 CCS sites and facilities
•The proprietary rights to a future cross-border CCS site and facilities are likely to be set out in bilateral agreements between Bosnia and Herzegovina and the relevant neighboring state or states�
•By analogy to the gas sector, inter-entity flow of gas (that is, from Bosnia and Herzegovina to Serbia and vice versa) is regulated on the basis of cooperation in this area, through agreements between the relevant governments, ministries, and regulatory commissions�
•The Agreement on Successions Issues regulates the division of movable and immovable property, including cross-border sites between the successor states of the Former Yugoslavia�
•The use of cross-border sites is to be regulated by separate agreements�
•A Joint Committee on Succession to Movable and Immovable Property is to be established by successor states to ensure implementation and the resolution of problems� The work of the committee is still in process and should be accelerated�
Probably covered by bilateral agreements in the future�
Since there are no cross-boundary CCS sites in the Balkan region at present, should such projects look feasible in the future, efforts should be made to regulate the proprietary rights arising from them by way of bilateral agreement�
Regulatory schemes related to management of storage and transportation facilities
•There is no specific licensing system in place yet for CCS projects�
•The existing permitting system from the gas sector in both of the entities might be applicable (that is, the Serbian Law on Gas and the Federation of Bosnia and Herzegovina Decree on the Organisation and Regulation of Gas Economy)
•Currently, there are permits according to the Spatial Planning and Construction Act, environmental and other legislation, and permits according to the Mining Act, Geological Explorations Act and Energy Act�
•The use of CCS technology would be likely to include permits required for certain hazardous activities and their effects on the environment and human health, as well as permits required for geological explorations, mining sites, and energy facilities�
•Currently no licensing scheme is in place relating to CCS storage and transportation facilities�
•Presently, licenses must be obtained from the Energy Regulatory Office for construction of new energy generation capacities, new facilities, and pipelines to transmit and distribute gas and for storage of natural gas� Possibly this framework would be widened to cover licensing of CCS storage and transportation facilities�
There is no specific licensing system in place yet for CCS projects in any of the three countries� These new legal frameworks on CCS should set out clear requirements on the application process and responsibilities following the grant of exploration and storage permits (such as monitoring, reporting, procedure in case of leakages, closure, and post-closure obligations)�Given that many other permitting systems do exist in the three countries, care should be taken to ensure that there is not unnecessary duplication of requirements applying to CCS storage or transport systems�
(continued on next page)
(continued)
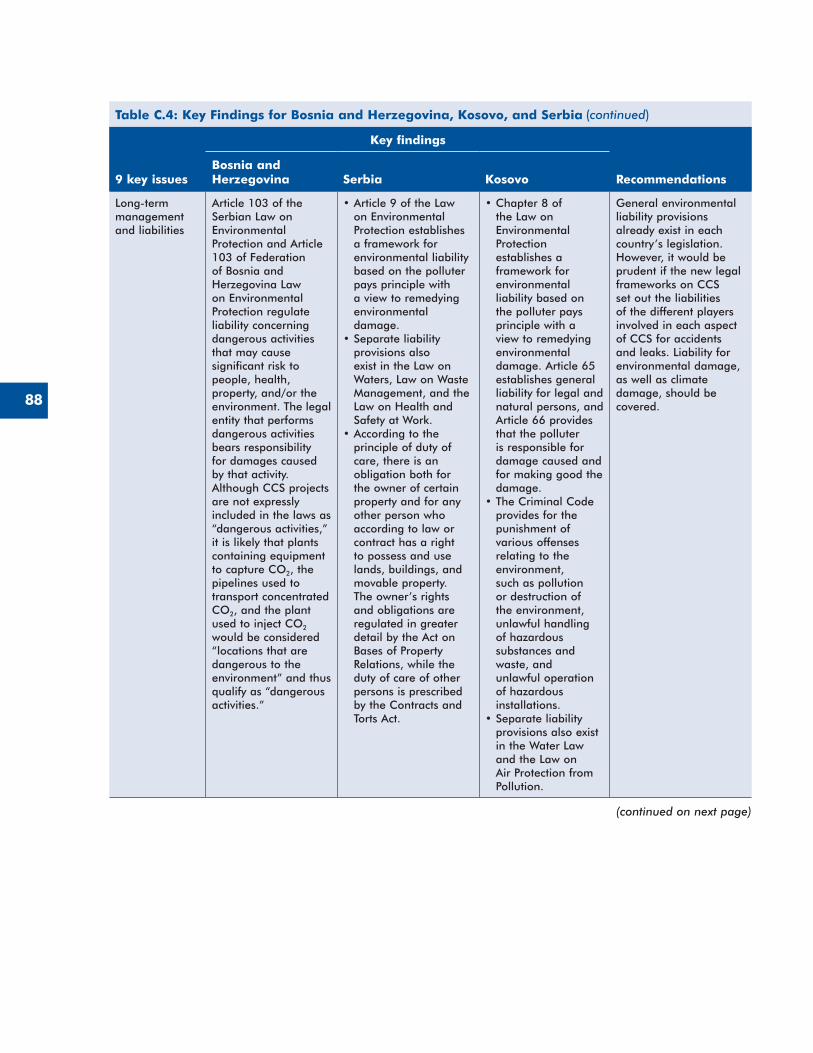
88
Table C.4: Key Findings for Bosnia and Herzegovina, Kosovo, and Serbia
9 key issues
Key findings
RecommendationsBosnia and Herzegovina Serbia Kosovo
Long-term management and liabilities
Article 103 of the Serbian Law on Environmental Protection and Article 103 of Federation of Bosnia and Herzegovina Law on Environmental Protection regulate liability concerning dangerous activities that may cause significant risk to people, health, property, and/or the environment� The legal entity that performs dangerous activities bears responsibility for damages caused by that activity� Although CCS projects are not expressly included in the laws as “dangerous activities,” it is likely that plants containing equipment to capture CO2, the pipelines used to transport concentrated CO2, and the plant used to inject CO2 would be considered “locations that are dangerous to the environment” and thus qualify as “dangerous activities�”
•Article 9 of the Law on Environmental Protection establishes a framework for environmental liability based on the polluter pays principle with a view to remedying environmental damage�
•Separate liability provisions also exist in the Law on Waters, Law on Waste Management, and the Law on Health and Safety at Work�
•According to the principle of duty of care, there is an obligation both for the owner of certain property and for any other person who according to law or contract has a right to possess and use lands, buildings, and movable property� The owner’s rights and obligations are regulated in greater detail by the Act on Bases of Property Relations, while the duty of care of other persons is prescribed by the Contracts and Torts Act�
•Chapter 8 of the Law on Environmental Protection establishes a framework for environmental liability based on the polluter pays principle with a view to remedying environmental damage� Article 65 establishes general liability for legal and natural persons, and Article 66 provides that the polluter is responsible for damage caused and for making good the damage�
•The Criminal Code provides for the punishment of various offenses relating to the environment, such as pollution or destruction of the environment, unlawful handling of hazardous substances and waste, and unlawful operation of hazardous installations�
•Separate liability provisions also exist in the Water Law and the Law on Air Protection from Pollution�
General environmental liability provisions already exist in each country’s legislation� However, it would be prudent if the new legal frameworks on CCS set out the liabilities of the different players involved in each aspect of CCS for accidents and leaks� Liability for environmental damage, as well as climate damage, should be covered�
(continued on next page)
(continued)
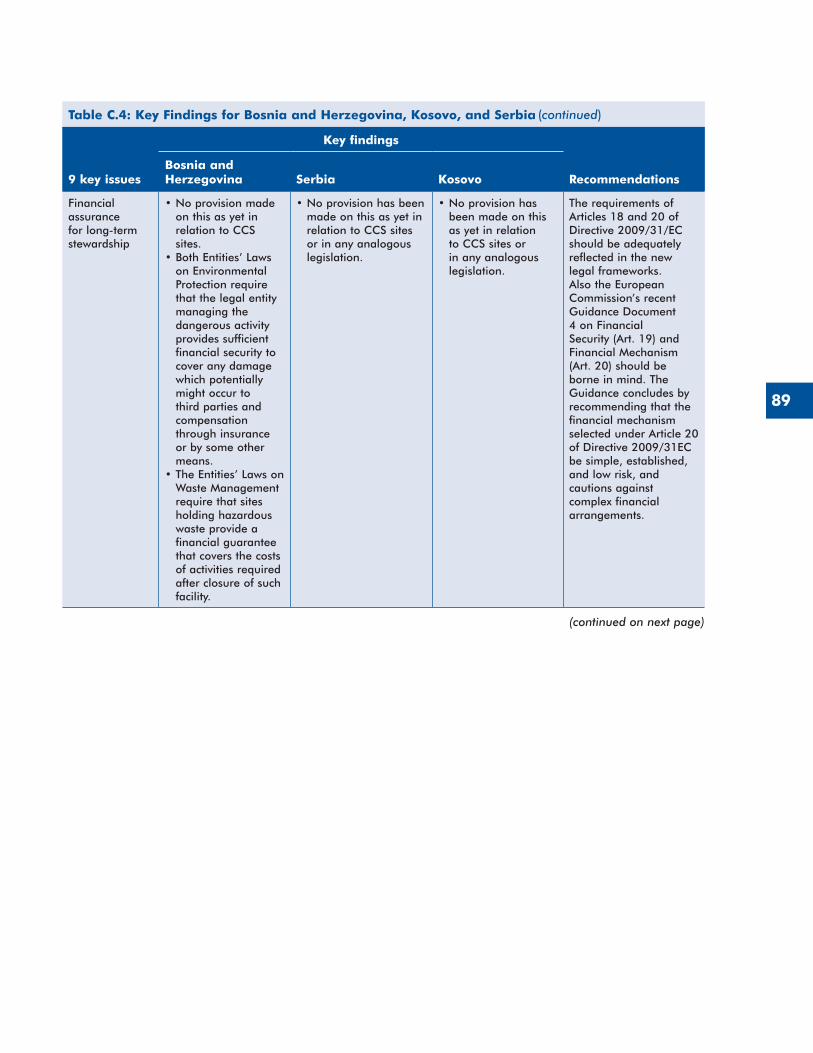
89
Table C.4: Key Findings for Bosnia and Herzegovina, Kosovo, and Serbia
9 key issues
Key findings
RecommendationsBosnia and Herzegovina Serbia Kosovo
Financial assurance for long-term stewardship
•No provision made on this as yet in relation to CCS sites�
•Both Entities’ Laws on Environmental Protection require that the legal entity managing the dangerous activity provides sufficient financial security to cover any damage which potentially might occur to third parties and compensation through insurance or by some other means�
•The Entities’ Laws on Waste Management require that sites holding hazardous waste provide a financial guarantee that covers the costs of activities required after closure of such facility�
•No provision has been made on this as yet in relation to CCS sites or in any analogous legislation�
•No provision has been made on this as yet in relation to CCS sites or in any analogous legislation�
The requirements of Articles 18 and 20 of Directive 2009/31/EC should be adequately reflected in the new legal frameworks� Also the European Commission’s recent Guidance Document 4 on Financial Security (Art� 19) and Financial Mechanism (Art� 20) should be borne in mind� The Guidance concludes by recommending that the financial mechanism selected under Article 20 of Directive 2009/31EC be simple, established, and low risk, and cautions against complex financial arrangements�
(continued on next page)
(continued)
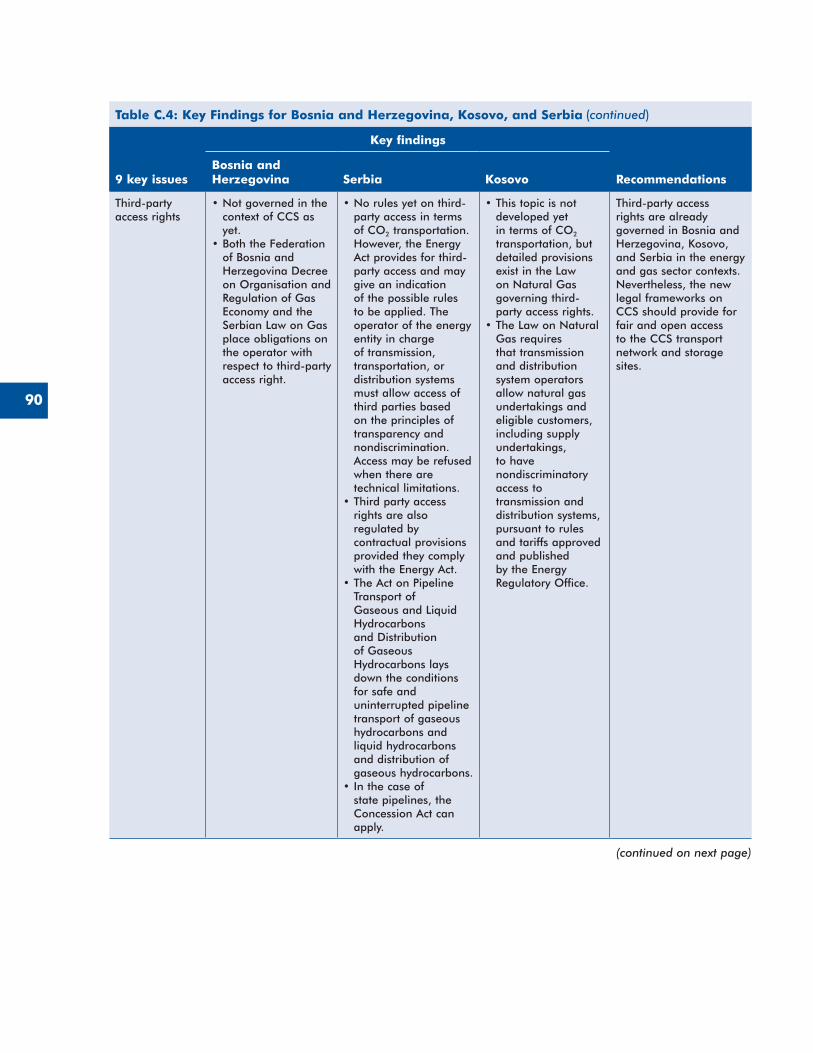
90
Table C.4: Key Findings for Bosnia and Herzegovina, Kosovo, and Serbia
9 key issues
Key findings
RecommendationsBosnia and Herzegovina Serbia Kosovo
Third-party access rights
•Not governed in the context of CCS as yet�
•Both the Federation of Bosnia and Herzegovina Decree on Organisation and Regulation of Gas Economy and the Serbian Law on Gas place obligations on the operator with respect to third-party access right�
•No rules yet on third-party access in terms of CO2 transportation� However, the Energy Act provides for third-party access and may give an indication of the possible rules to be applied� The operator of the energy entity in charge of transmission, transportation, or distribution systems must allow access of third parties based on the principles of transparency and nondiscrimination� Access may be refused when there are technical limitations�
•Third party access rights are also regulated by contractual provisions provided they comply with the Energy Act�
•The Act on Pipeline Transport of Gaseous and Liquid Hydrocarbons and Distribution of Gaseous Hydrocarbons lays down the conditions for safe and uninterrupted pipeline transport of gaseous hydrocarbons and liquid hydrocarbons and distribution of gaseous hydrocarbons�
•In the case of state pipelines, the Concession Act can apply�
•This topic is not developed yet in terms of CO2 transportation, but detailed provisions exist in the Law on Natural Gas governing third-party access rights�
•The Law on Natural Gas requires that transmission and distribution system operators allow natural gas undertakings and eligible customers, including supply undertakings, to have nondiscriminatory access to transmission and distribution systems, pursuant to rules and tariffs approved and published by the Energy Regulatory Office�
Third-party access rights are already governed in Bosnia and Herzegovina, Kosovo, and Serbia in the energy and gas sector contexts� Nevertheless, the new legal frameworks on CCS should provide for fair and open access to the CCS transport network and storage sites�
(continued on next page)
(continued)
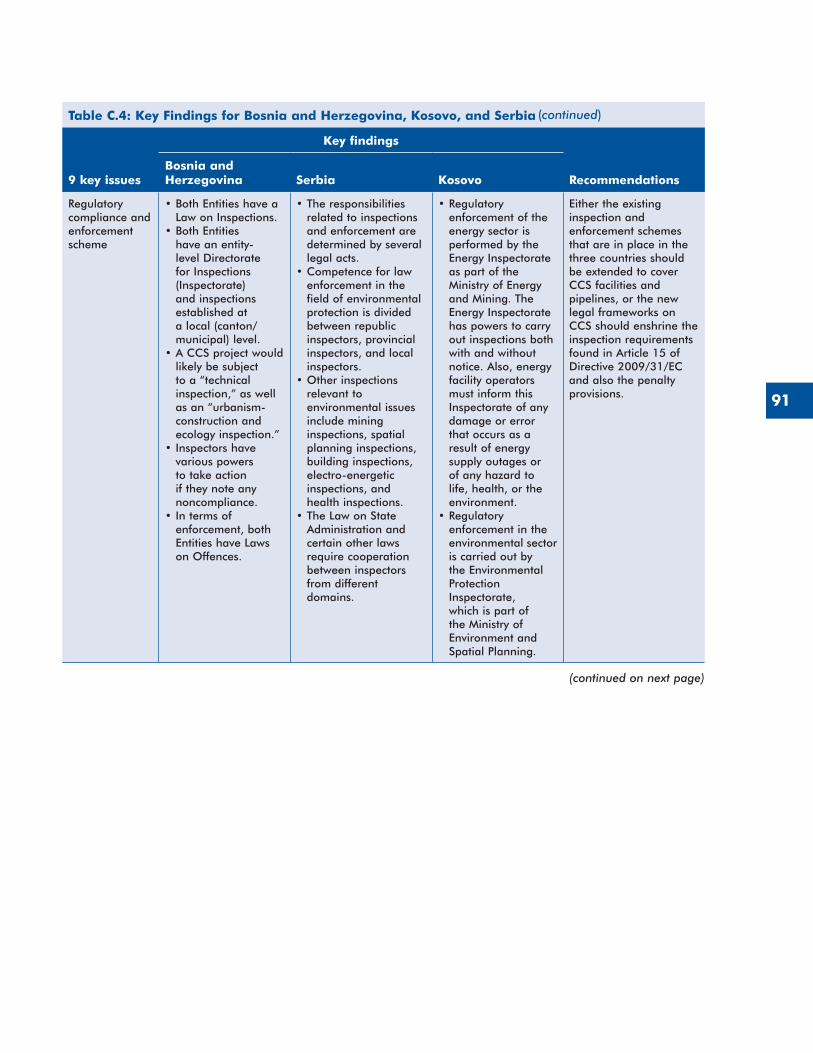
91
Table C.4: Key Findings for Bosnia and Herzegovina, Kosovo, and Serbia
9 key issues
Key findings
RecommendationsBosnia and Herzegovina Serbia Kosovo
Regulatory compliance and enforcement scheme
•Both Entities have a Law on Inspections�
•Both Entities have an entity-level Directorate for Inspections (Inspectorate) and inspections established at a local (canton/municipal) level�
•A CCS project would likely be subject to a “technical inspection,” as well as an “urbanism-construction and ecology inspection�”
•Inspectors have various powers to take action if they note any noncompliance�
•In terms of enforcement, both Entities have Laws on Offences�
•The responsibilities related to inspections and enforcement are determined by several legal acts�
•Competence for law enforcement in the field of environmental protection is divided between republic inspectors, provincial inspectors, and local inspectors�
•Other inspections relevant to environmental issues include mining inspections, spatial planning inspections, building inspections, electro-energetic inspections, and health inspections�
•The Law on State Administration and certain other laws require cooperation between inspectors from different domains�
•Regulatory enforcement of the energy sector is performed by the Energy Inspectorate as part of the Ministry of Energy and Mining� The Energy Inspectorate has powers to carry out inspections both with and without notice� Also, energy facility operators must inform this Inspectorate of any damage or error that occurs as a result of energy supply outages or of any hazard to life, health, or the environment�
•Regulatory enforcement in the environmental sector is carried out by the Environmental Protection Inspectorate, which is part of the Ministry of Environment and Spatial Planning�
Either the existing inspection and enforcement schemes that are in place in the three countries should be extended to cover CCS facilities and pipelines, or the new legal frameworks on CCS should enshrine the inspection requirements found in Article 15 of Directive 2009/31/EC and also the penalty provisions�
(continued on next page)
(continued)
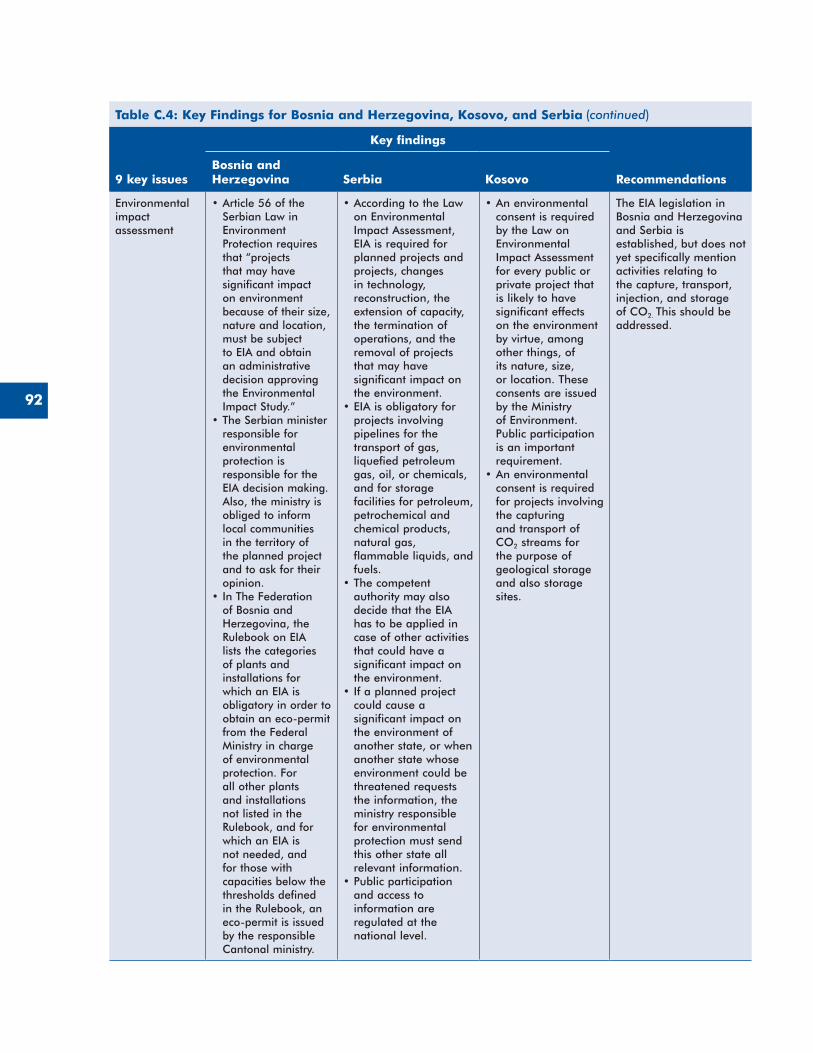
92
Table C.4: Key Findings for Bosnia and Herzegovina, Kosovo, and Serbia
9 key issues
Key findings
RecommendationsBosnia and Herzegovina Serbia Kosovo
Environmental impact assessment
•Article 56 of the Serbian Law in Environment Protection requires that “projects that may have significant impact on environment because of their size, nature and location, must be subject to EIA and obtain an administrative decision approving the Environmental Impact Study�”
•The Serbian minister responsible for environmental protection is responsible for the EIA decision making� Also, the ministry is obliged to inform local communities in the territory of the planned project and to ask for their opinion�
•In The Federation of Bosnia and Herzegovina, the Rulebook on EIA lists the categories of plants and installations for which an EIA is obligatory in order to obtain an eco-permit from the Federal Ministry in charge of environmental protection� For all other plants and installations not listed in the Rulebook, and for which an EIA is not needed, and for those with capacities below the thresholds defined in the Rulebook, an eco-permit is issued by the responsible Cantonal ministry�
•According to the Law on Environmental Impact Assessment, EIA is required for planned projects and projects, changes in technology, reconstruction, the extension of capacity, the termination of operations, and the removal of projects that may have significant impact on the environment�
•EIA is obligatory for projects involving pipelines for the transport of gas, liquefied petroleum gas, oil, or chemicals, and for storage facilities for petroleum, petrochemical and chemical products, natural gas, flammable liquids, and fuels�
•The competent authority may also decide that the EIA has to be applied in case of other activities that could have a significant impact on the environment�
•If a planned project could cause a significant impact on the environment of another state, or when another state whose environment could be threatened requests the information, the ministry responsible for environmental protection must send this other state all relevant information�
•Public participation and access to information are regulated at the national level�
•An environmental consent is required by the Law on Environmental Impact Assessment for every public or private project that is likely to have significant effects on the environment by virtue, among other things, of its nature, size, or location� These consents are issued by the Ministry of Environment� Public participation is an important requirement�
•An environmental consent is required for projects involving the capturing and transport of CO2 streams for the purpose of geological storage and also storage sites�
The EIA legislation in Bosnia and Herzegovina and Serbia is established, but does not yet specifically mention activities relating to the capture, transport, injection, and storage of CO2� This should be addressed�
(continued)
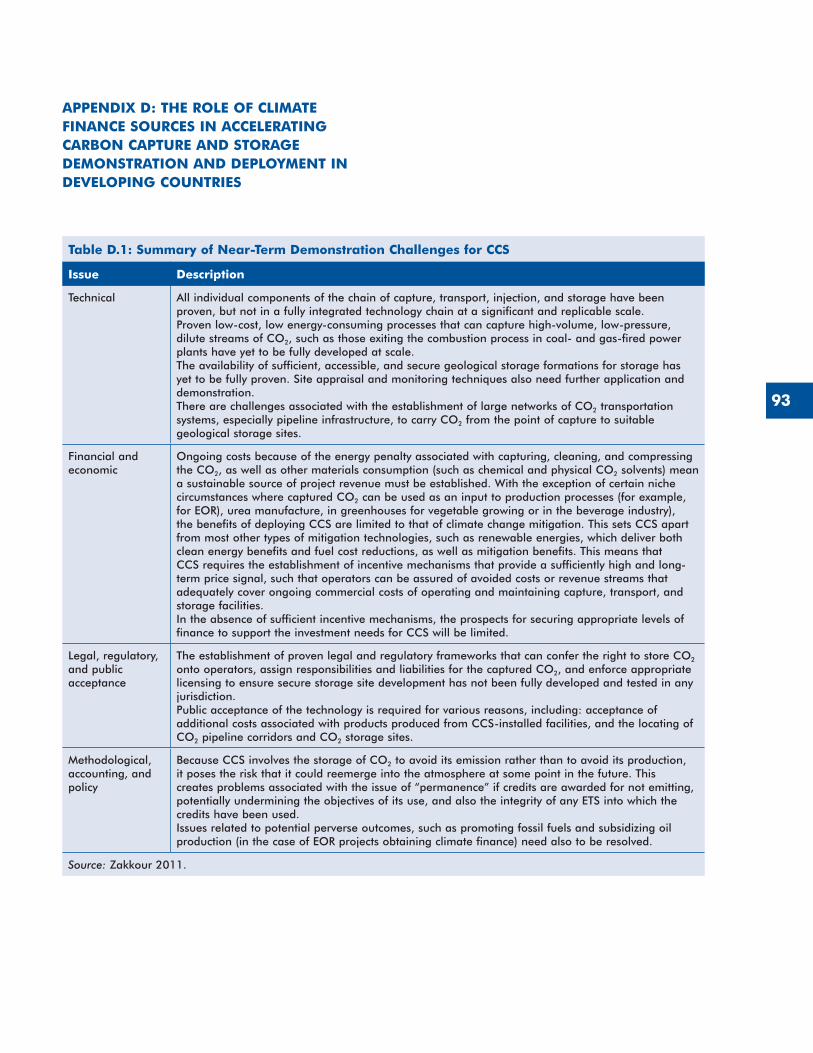
93
APPENDIX D: THE ROLE OF CLIMATE FINANCE SOURCES IN ACCELERATING CARBON CAPTURE AND STORAGE DEMONSTRATION AND DEPLOYMENT IN DEVELOPING COUNTRIES
Table D.1: Summary of Near-Term Demonstration Challenges for CCS
Issue Description
Technical All individual components of the chain of capture, transport, injection, and storage have been proven, but not in a fully integrated technology chain at a significant and replicable scale�Proven low-cost, low energy-consuming processes that can capture high-volume, low-pressure, dilute streams of CO2, such as those exiting the combustion process in coal- and gas-fired power plants have yet to be fully developed at scale�The availability of sufficient, accessible, and secure geological storage formations for storage has yet to be fully proven� Site appraisal and monitoring techniques also need further application and demonstration�There are challenges associated with the establishment of large networks of CO2 transportation systems, especially pipeline infrastructure, to carry CO2 from the point of capture to suitable geological storage sites�
Financial and economic
Ongoing costs because of the energy penalty associated with capturing, cleaning, and compressing the CO2, as well as other materials consumption (such as chemical and physical CO2 solvents) mean a sustainable source of project revenue must be established� With the exception of certain niche circumstances where captured CO2 can be used as an input to production processes (for example, for EOR), urea manufacture, in greenhouses for vegetable growing or in the beverage industry), the benefits of deploying CCS are limited to that of climate change mitigation� This sets CCS apart from most other types of mitigation technologies, such as renewable energies, which deliver both clean energy benefits and fuel cost reductions, as well as mitigation benefits� This means that CCS requires the establishment of incentive mechanisms that provide a sufficiently high and long-term price signal, such that operators can be assured of avoided costs or revenue streams that adequately cover ongoing commercial costs of operating and maintaining capture, transport, and storage facilities�In the absence of sufficient incentive mechanisms, the prospects for securing appropriate levels of finance to support the investment needs for CCS will be limited�
Legal, regulatory, and public acceptance
The establishment of proven legal and regulatory frameworks that can confer the right to store CO2 onto operators, assign responsibilities and liabilities for the captured CO2, and enforce appropriate licensing to ensure secure storage site development has not been fully developed and tested in any jurisdiction�Public acceptance of the technology is required for various reasons, including: acceptance of additional costs associated with products produced from CCS-installed facilities, and the locating of CO2 pipeline corridors and CO2 storage sites�
Methodological, accounting, and policy
Because CCS involves the storage of CO2 to avoid its emission rather than to avoid its production, it poses the risk that it could reemerge into the atmosphere at some point in the future� This creates problems associated with the issue of “permanence” if credits are awarded for not emitting, potentially undermining the objectives of its use, and also the integrity of any ETS into which the credits have been used�Issues related to potential perverse outcomes, such as promoting fossil fuels and subsidizing oil production (in the case of EOR projects obtaining climate finance) need also to be resolved�
Source: Zakkour 2011�
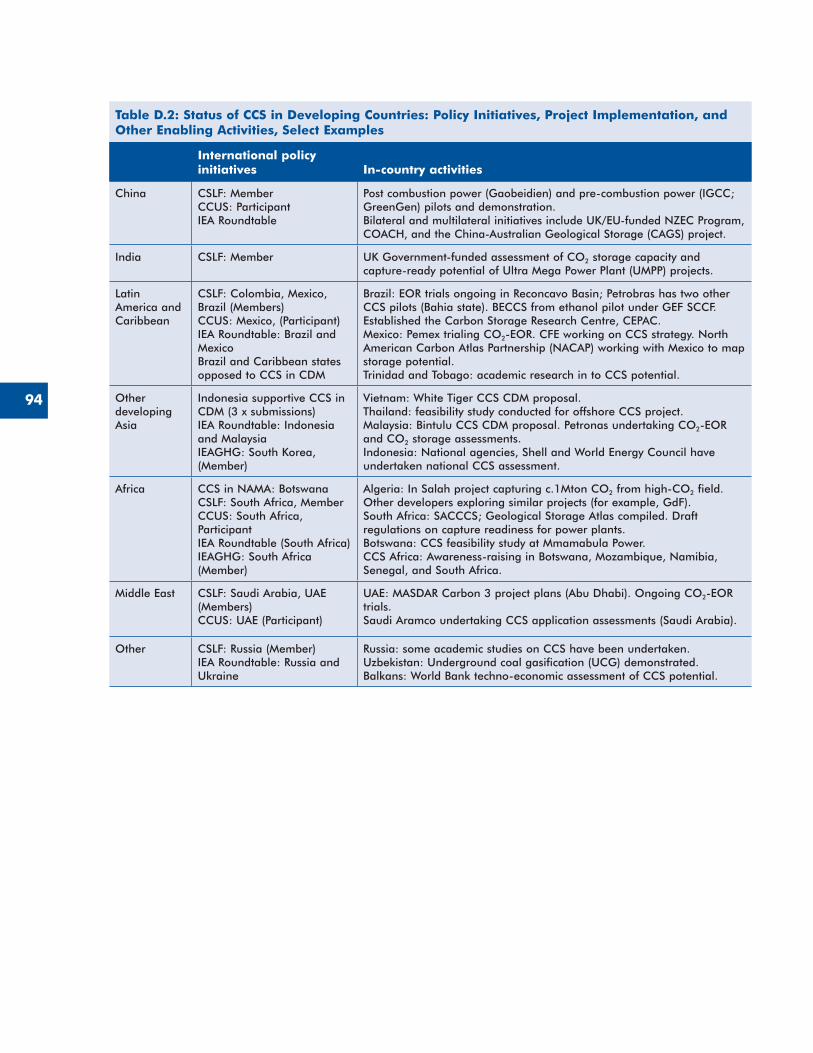
94
Table D.2: Status of CCS in Developing Countries: Policy Initiatives, Project Implementation, and Other Enabling Activities, Select Examples
International policy initiatives In-country activities
China CSLF: MemberCCUS: ParticipantIEA Roundtable
Post combustion power (Gaobeidien) and pre-combustion power (IGCC; GreenGen) pilots and demonstration�Bilateral and multilateral initiatives include UK/EU-funded NZEC Program, COACH, and the China-Australian Geological Storage (CAGS) project�
India CSLF: Member UK Government-funded assessment of CO2 storage capacity and capture-ready potential of Ultra Mega Power Plant (UMPP) projects�
Latin America and Caribbean
CSLF: Colombia, Mexico, Brazil (Members)CCUS: Mexico, (Participant)IEA Roundtable: Brazil and MexicoBrazil and Caribbean states opposed to CCS in CDM
Brazil: EOR trials ongoing in Reconcavo Basin; Petrobras has two other CCS pilots (Bahia state)� BECCS from ethanol pilot under GEF SCCF� Established the Carbon Storage Research Centre, CEPAC�Mexico: Pemex trialing CO2-EOR� CFE working on CCS strategy� North American Carbon Atlas Partnership (NACAP) working with Mexico to map storage potential�Trinidad and Tobago: academic research in to CCS potential�
Other developing Asia
Indonesia supportive CCS in CDM (3 x submissions)IEA Roundtable: Indonesia and MalaysiaIEAGHG: South Korea, (Member)
Vietnam: White Tiger CCS CDM proposal�Thailand: feasibility study conducted for offshore CCS project�Malaysia: Bintulu CCS CDM proposal� Petronas undertaking CO2-EOR and CO2 storage assessments�Indonesia: National agencies, Shell and World Energy Council have undertaken national CCS assessment�
Africa CCS in NAMA: BotswanaCSLF: South Africa, MemberCCUS: South Africa, ParticipantIEA Roundtable (South Africa)IEAGHG: South Africa (Member)
Algeria: In Salah project capturing c�1Mton CO2 from high-CO2 field� Other developers exploring similar projects (for example, GdF)�South Africa: SACCCS; Geological Storage Atlas compiled� Draft regulations on capture readiness for power plants�Botswana: CCS feasibility study at Mmamabula Power�CCS Africa: Awareness-raising in Botswana, Mozambique, Namibia, Senegal, and South Africa�
Middle East CSLF: Saudi Arabia, UAE (Members)CCUS: UAE (Participant)
UAE: MASDAR Carbon 3 project plans (Abu Dhabi)� Ongoing CO2-EOR trials�Saudi Aramco undertaking CCS application assessments (Saudi Arabia)�
Other CSLF: Russia (Member)IEA Roundtable: Russia and Ukraine
Russia: some academic studies on CCS have been undertaken�Uzbekistan: Underground coal gasification (UCG) demonstrated�Balkans: World Bank techno-economic assessment of CCS potential�
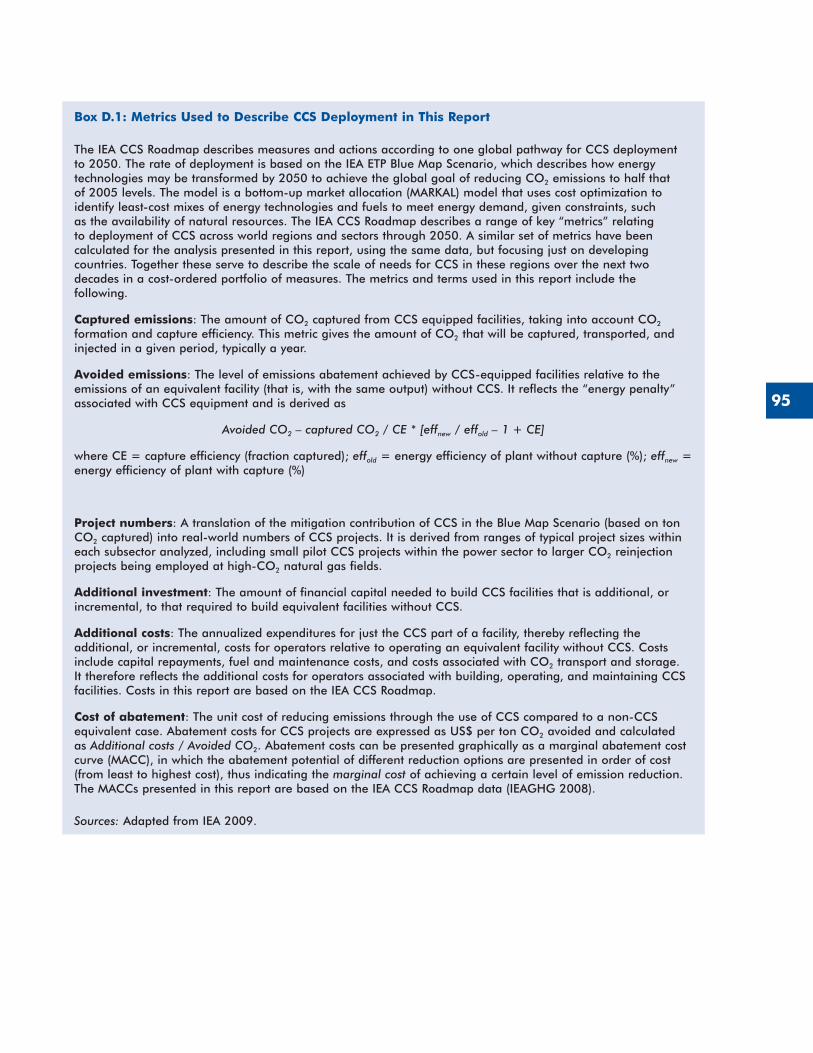
95
Box D.1: Metrics Used to Describe CCS Deployment in This Report
The IEA CCS Roadmap describes measures and actions according to one global pathway for CCS deployment to 2050� The rate of deployment is based on the IEA ETP Blue Map Scenario, which describes how energy technologies may be transformed by 2050 to achieve the global goal of reducing CO2 emissions to half that of 2005 levels� The model is a bottom-up market allocation (MARKAL) model that uses cost optimization to identify least-cost mixes of energy technologies and fuels to meet energy demand, given constraints, such as the availability of natural resources� The IEA CCS Roadmap describes a range of key “metrics” relating to deployment of CCS across world regions and sectors through 2050� A similar set of metrics have been calculated for the analysis presented in this report, using the same data, but focusing just on developing countries� Together these serve to describe the scale of needs for CCS in these regions over the next two decades in a cost-ordered portfolio of measures� The metrics and terms used in this report include the following�
Captured emissions: The amount of CO2 captured from CCS equipped facilities, taking into account CO2 formation and capture efficiency� This metric gives the amount of CO2 that will be captured, transported, and injected in a given period, typically a year�
Avoided emissions: The level of emissions abatement achieved by CCS-equipped facilities relative to the emissions of an equivalent facility (that is, with the same output) without CCS� It reflects the “energy penalty” associated with CCS equipment and is derived as
Avoided CO2 – captured CO2 / CE * [effnew / effold – 1 + CE]
where CE = capture efficiency (fraction captured); effold = energy efficiency of plant without capture (%); effnew = energy efficiency of plant with capture (%)
Project numbers: A translation of the mitigation contribution of CCS in the Blue Map Scenario (based on ton CO2 captured) into real-world numbers of CCS projects� It is derived from ranges of typical project sizes within each subsector analyzed, including small pilot CCS projects within the power sector to larger CO2 reinjection projects being employed at high-CO2 natural gas fields�
Additional investment: The amount of financial capital needed to build CCS facilities that is additional, or incremental, to that required to build equivalent facilities without CCS�
Additional costs: The annualized expenditures for just the CCS part of a facility, thereby reflecting the additional, or incremental, costs for operators relative to operating an equivalent facility without CCS� Costs include capital repayments, fuel and maintenance costs, and costs associated with CO2 transport and storage� It therefore reflects the additional costs for operators associated with building, operating, and maintaining CCS facilities� Costs in this report are based on the IEA CCS Roadmap�
Cost of abatement: The unit cost of reducing emissions through the use of CCS compared to a non-CCS equivalent case� Abatement costs for CCS projects are expressed as US$ per ton CO2 avoided and calculated as Additional costs / Avoided CO2� Abatement costs can be presented graphically as a marginal abatement cost curve (MACC), in which the abatement potential of different reduction options are presented in order of cost (from least to highest cost), thus indicating the marginal cost of achieving a certain level of emission reduction� The MACCs presented in this report are based on the IEA CCS Roadmap data (IEAGHG 2008)�
Sources: Adapted from IEA 2009�
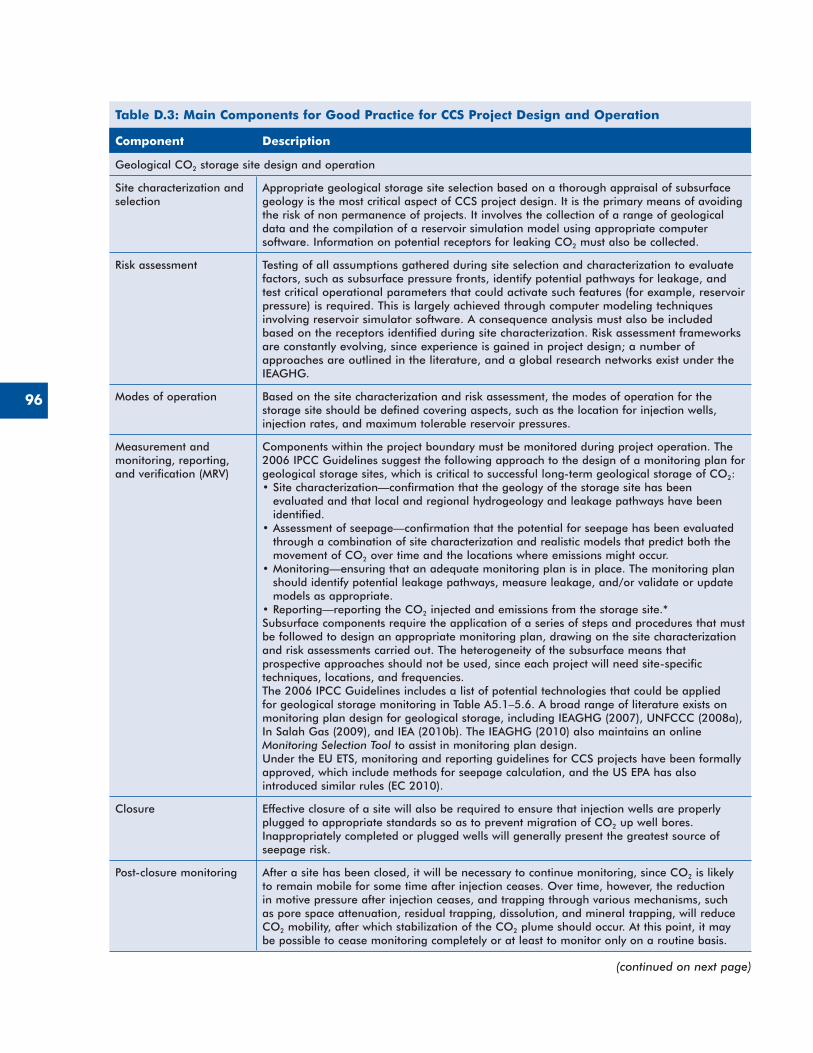
96
Table D.3: Main Components for Good Practice for CCS Project Design and Operation
Component Description
Geological CO2 storage site design and operation
Site characterization and selection
Appropriate geological storage site selection based on a thorough appraisal of subsurface geology is the most critical aspect of CCS project design� It is the primary means of avoiding the risk of non permanence of projects� It involves the collection of a range of geological data and the compilation of a reservoir simulation model using appropriate computer software� Information on potential receptors for leaking CO2 must also be collected�
Risk assessment Testing of all assumptions gathered during site selection and characterization to evaluate factors, such as subsurface pressure fronts, identify potential pathways for leakage, and test critical operational parameters that could activate such features (for example, reservoir pressure) is required� This is largely achieved through computer modeling techniques involving reservoir simulator software� A consequence analysis must also be included based on the receptors identified during site characterization� Risk assessment frameworks are constantly evolving, since experience is gained in project design; a number of approaches are outlined in the literature, and a global research networks exist under the IEAGHG�
Modes of operation Based on the site characterization and risk assessment, the modes of operation for the storage site should be defined covering aspects, such as the location for injection wells, injection rates, and maximum tolerable reservoir pressures�
Measurement and monitoring, reporting, and verification (MRV)
Components within the project boundary must be monitored during project operation� The 2006 IPCC Guidelines suggest the following approach to the design of a monitoring plan for geological storage sites, which is critical to successful long-term geological storage of CO2:•Site characterization—confirmation that the geology of the storage site has been
evaluated and that local and regional hydrogeology and leakage pathways have been identified�
•Assessment of seepage—confirmation that the potential for seepage has been evaluated through a combination of site characterization and realistic models that predict both the movement of CO2 over time and the locations where emissions might occur�
•Monitoring—ensuring that an adequate monitoring plan is in place� The monitoring plan should identify potential leakage pathways, measure leakage, and/or validate or update models as appropriate�
•Reporting—reporting the CO2 injected and emissions from the storage site�*Subsurface components require the application of a series of steps and procedures that must be followed to design an appropriate monitoring plan, drawing on the site characterization and risk assessments carried out� The heterogeneity of the subsurface means that prospective approaches should not be used, since each project will need site-specific techniques, locations, and frequencies�The 2006 IPCC Guidelines includes a list of potential technologies that could be applied for geological storage monitoring in Table A5�1–5�6� A broad range of literature exists on monitoring plan design for geological storage, including IEAGHG (2007), UNFCCC (2008a), In Salah Gas (2009), and IEA (2010b)� The IEAGHG (2010) also maintains an online Monitoring Selection Tool to assist in monitoring plan design�Under the EU ETS, monitoring and reporting guidelines for CCS projects have been formally approved, which include methods for seepage calculation, and the US EPA has also introduced similar rules (EC 2010)�
Closure Effective closure of a site will also be required to ensure that injection wells are properly plugged to appropriate standards so as to prevent migration of CO2 up well bores� Inappropriately completed or plugged wells will generally present the greatest source of seepage risk�
Post-closure monitoring After a site has been closed, it will be necessary to continue monitoring, since CO2 is likely to remain mobile for some time after injection ceases� Over time, however, the reduction in motive pressure after injection ceases, and trapping through various mechanisms, such as pore space attenuation, residual trapping, dissolution, and mineral trapping, will reduce CO2 mobility, after which stabilization of the CO2 plume should occur� At this point, it may be possible to cease monitoring completely or at least to monitor only on a routine basis�
(continued on next page)
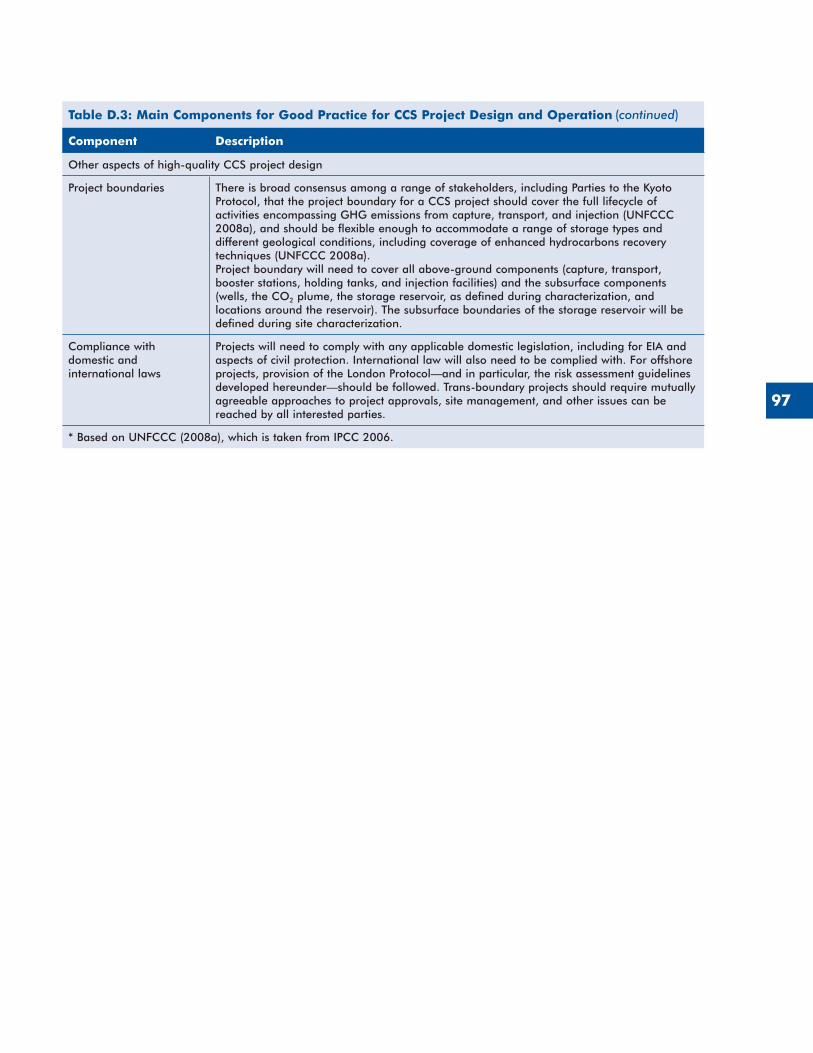
97
Table D.3: Main Components for Good Practice for CCS Project Design and Operation
Component Description
Other aspects of high-quality CCS project design
Project boundaries There is broad consensus among a range of stakeholders, including Parties to the Kyoto Protocol, that the project boundary for a CCS project should cover the full lifecycle of activities encompassing GHG emissions from capture, transport, and injection (UNFCCC 2008a), and should be flexible enough to accommodate a range of storage types and different geological conditions, including coverage of enhanced hydrocarbons recovery techniques (UNFCCC 2008a)�Project boundary will need to cover all above-ground components (capture, transport, booster stations, holding tanks, and injection facilities) and the subsurface components (wells, the CO2 plume, the storage reservoir, as defined during characterization, and locations around the reservoir)� The subsurface boundaries of the storage reservoir will be defined during site characterization�
Compliance with domestic and international laws
Projects will need to comply with any applicable domestic legislation, including for EIA and aspects of civil protection� International law will also need to be complied with� For offshore projects, provision of the London Protocol—and in particular, the risk assessment guidelines developed hereunder—should be followed� Trans-boundary projects should require mutually agreeable approaches to project approvals, site management, and other issues can be reached by all interested parties�
* Based on UNFCCC (2008a), which is taken from IPCC 2006�
(continued)
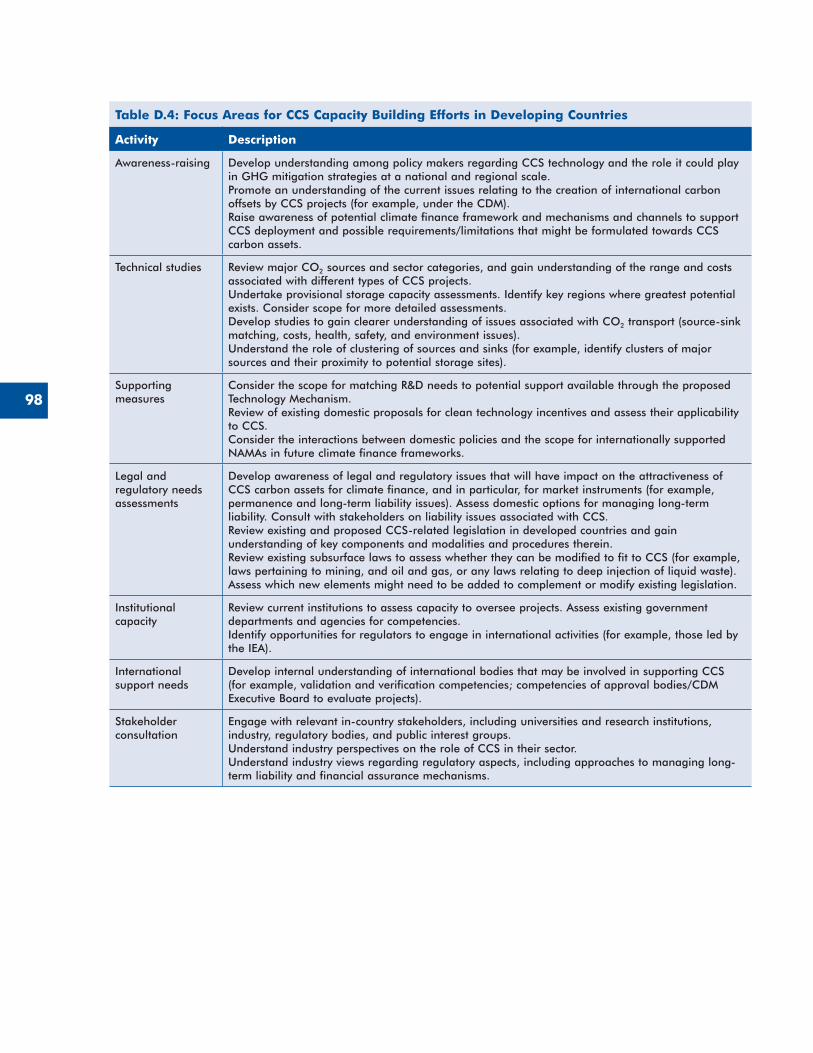
98
Table D.4: Focus Areas for CCS Capacity Building Efforts in Developing Countries
Activity Description
Awareness-raising Develop understanding among policy makers regarding CCS technology and the role it could play in GHG mitigation strategies at a national and regional scale�Promote an understanding of the current issues relating to the creation of international carbon offsets by CCS projects (for example, under the CDM)�Raise awareness of potential climate finance framework and mechanisms and channels to support CCS deployment and possible requirements/limitations that might be formulated towards CCS carbon assets�
Technical studies Review major CO2 sources and sector categories, and gain understanding of the range and costs associated with different types of CCS projects�Undertake provisional storage capacity assessments� Identify key regions where greatest potential exists� Consider scope for more detailed assessments�Develop studies to gain clearer understanding of issues associated with CO2 transport (source-sink matching, costs, health, safety, and environment issues)�Understand the role of clustering of sources and sinks (for example, identify clusters of major sources and their proximity to potential storage sites)�
Supporting measures
Consider the scope for matching R&D needs to potential support available through the proposed Technology Mechanism�Review of existing domestic proposals for clean technology incentives and assess their applicability to CCS�Consider the interactions between domestic policies and the scope for internationally supported NAMAs in future climate finance frameworks�
Legal and regulatory needs assessments
Develop awareness of legal and regulatory issues that will have impact on the attractiveness of CCS carbon assets for climate finance, and in particular, for market instruments (for example, permanence and long-term liability issues)� Assess domestic options for managing long-term liability� Consult with stakeholders on liability issues associated with CCS�Review existing and proposed CCS-related legislation in developed countries and gain understanding of key components and modalities and procedures therein�Review existing subsurface laws to assess whether they can be modified to fit to CCS (for example, laws pertaining to mining, and oil and gas, or any laws relating to deep injection of liquid waste)� Assess which new elements might need to be added to complement or modify existing legislation�
Institutional capacity
Review current institutions to assess capacity to oversee projects� Assess existing government departments and agencies for competencies�Identify opportunities for regulators to engage in international activities (for example, those led by the IEA)�
International support needs
Develop internal understanding of international bodies that may be involved in supporting CCS (for example, validation and verification competencies; competencies of approval bodies/CDM Executive Board to evaluate projects)�
Stakeholder consultation
Engage with relevant in-country stakeholders, including universities and research institutions, industry, regulatory bodies, and public interest groups�Understand industry perspectives on the role of CCS in their sector�Understand industry views regarding regulatory aspects, including approaches to managing long-term liability and financial assurance mechanisms�
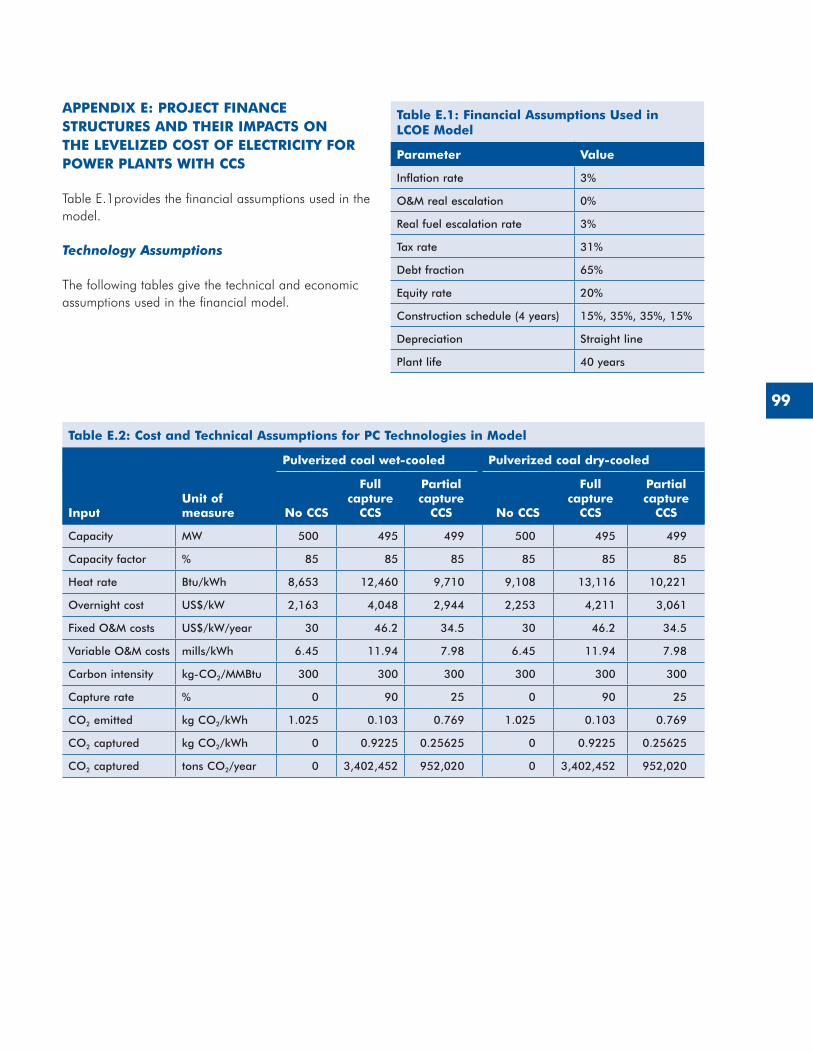
99
APPENDIX E: PROJECT FINANCE STRUCTURES AND THEIR IMPACTS ON THE LEVELIZED COST OF ELECTRICITY FOR POWER PLANTS WITH CCS
Table E.1provides the financial assumptions used in the model.
Technology Assumptions
The following tables give the technical and economic assumptions used in the financial model.
Table E.1: Financial Assumptions Used in LCOE Model
Parameter Value
Inflation rate 3%
O&M real escalation 0%
Real fuel escalation rate 3%
Tax rate 31%
Debt fraction 65%
Equity rate 20%
Construction schedule (4 years) 15%, 35%, 35%, 15%
Depreciation Straight line
Plant life 40 years
Table E.2: Cost and Technical Assumptions for PC Technologies in Model
Pulverized coal wet-cooled Pulverized coal dry-cooled
InputUnit of measure No CCS
Full capture
CCS
Partial capture
CCS No CCS
Full capture
CCS
Partial capture
CCS
Capacity MW 500 495 499 500 495 499
Capacity factor % 85 85 85 85 85 85
Heat rate Btu/kWh 8,653 12,460 9,710 9,108 13,116 10,221
Overnight cost US$/kW 2,163 4,048 2,944 2,253 4,211 3,061
Fixed O&M costs US$/kW/year 30 46�2 34�5 30 46�2 34�5
Variable O&M costs mills/kWh 6�45 11�94 7�98 6�45 11�94 7�98
Carbon intensity kg-CO2/MMBtu 300 300 300 300 300 300
Capture rate % 0 90 25 0 90 25
CO2 emitted kg CO2/kWh 1�025 0�103 0�769 1�025 0�103 0�769
CO2 captured kg CO2/kWh 0 0�9225 0�25625 0 0�9225 0�25625
CO2 captured tons CO2/year 0 3,402,452 952,020 0 3,402,452 952,020
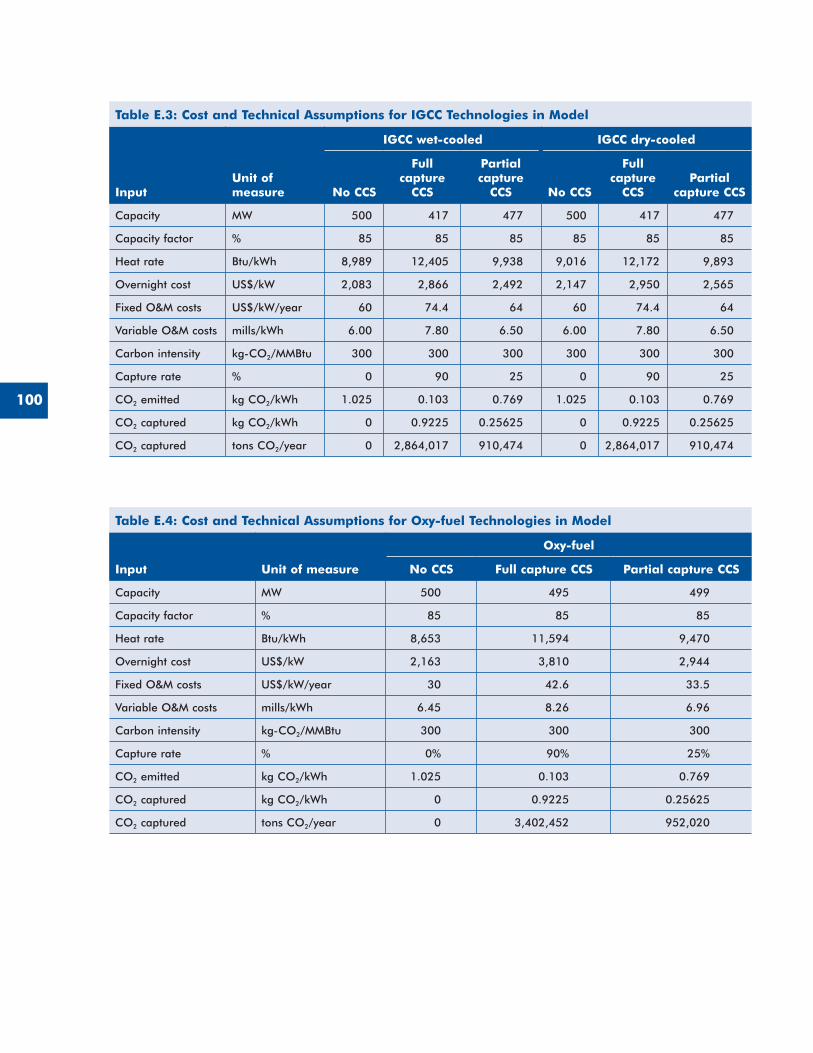
100
Table E.3: Cost and Technical Assumptions for IGCC Technologies in Model
InputUnit of measure
IGCC wet-cooled IGCC dry-cooled
No CCS
Full capture
CCS
Partial capture
CCS No CCS
Full capture
CCSPartial
capture CCS
Capacity MW 500 417 477 500 417 477
Capacity factor % 85 85 85 85 85 85
Heat rate Btu/kWh 8,989 12,405 9,938 9,016 12,172 9,893
Overnight cost US$/kW 2,083 2,866 2,492 2,147 2,950 2,565
Fixed O&M costs US$/kW/year 60 74�4 64 60 74�4 64
Variable O&M costs mills/kWh 6�00 7�80 6�50 6�00 7�80 6�50
Carbon intensity kg-CO2/MMBtu 300 300 300 300 300 300
Capture rate % 0 90 25 0 90 25
CO2 emitted kg CO2/kWh 1�025 0�103 0�769 1�025 0�103 0�769
CO2 captured kg CO2/kWh 0 0�9225 0�25625 0 0�9225 0�25625
CO2 captured tons CO2/year 0 2,864,017 910,474 0 2,864,017 910,474
Table E.4: Cost and Technical Assumptions for Oxy-fuel Technologies in Model
Input Unit of measure
Oxy-fuel
No CCS Full capture CCS Partial capture CCS
Capacity MW 500 495 499
Capacity factor % 85 85 85
Heat rate Btu/kWh 8,653 11,594 9,470
Overnight cost US$/kW 2,163 3,810 2,944
Fixed O&M costs US$/kW/year 30 42�6 33�5
Variable O&M costs mills/kWh 6�45 8�26 6�96
Carbon intensity kg-CO2/MMBtu 300 300 300
Capture rate % 0% 90% 25%
CO2 emitted kg CO2/kWh 1�025 0�103 0�769
CO2 captured kg CO2/kWh 0 0�9225 0�25625
CO2 captured tons CO2/year 0 3,402,452 952,020
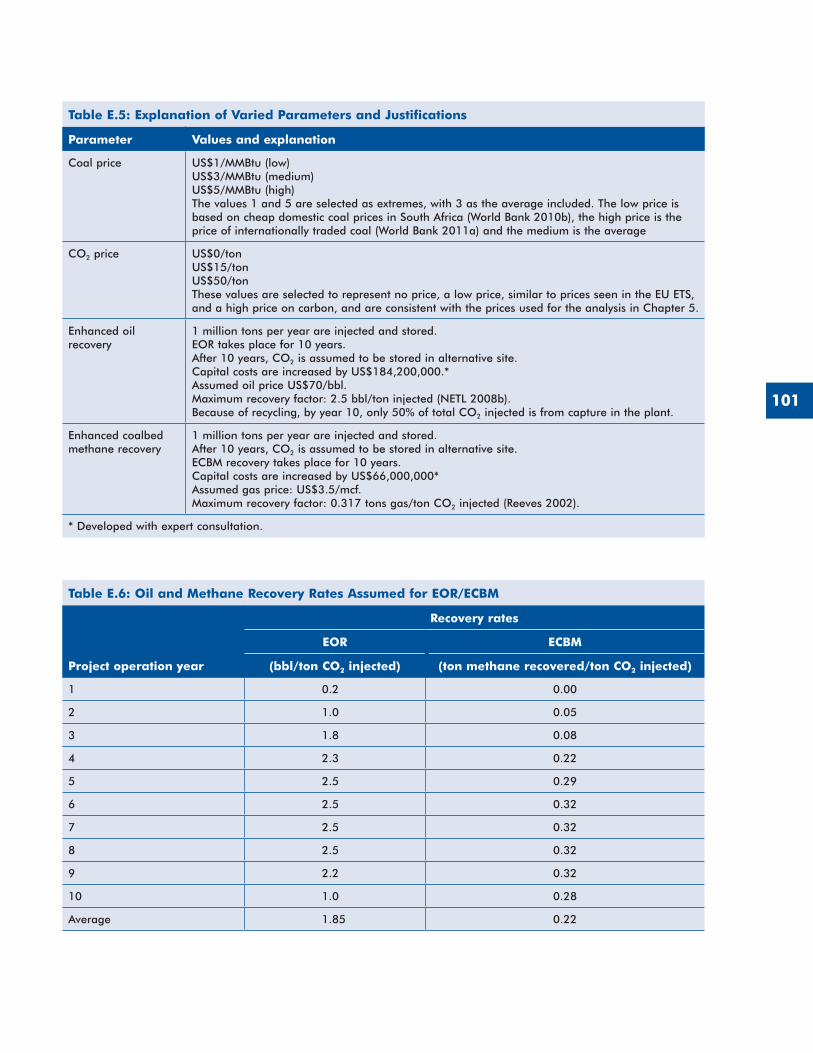
101
Table E.6: Oil and Methane Recovery Rates Assumed for EOR/ECBM
Project operation year
Recovery rates
EOR ECBM
(bbl/ton CO2 injected) (ton methane recovered/ton CO2 injected)
1 0�2 0�00
2 1�0 0�05
3 1�8 0�08
4 2�3 0�22
5 2�5 0�29
6 2�5 0�32
7 2�5 0�32
8 2�5 0�32
9 2�2 0�32
10 1�0 0�28
Average 1�85 0�22
Table E.5: Explanation of Varied Parameters and Justifications
Parameter Values and explanation
Coal price US$1/MMBtu (low)US$3/MMBtu (medium)US$5/MMBtu (high)The values 1 and 5 are selected as extremes, with 3 as the average included� The low price is based on cheap domestic coal prices in South Africa (World Bank 2010b), the high price is the price of internationally traded coal (World Bank 2011a) and the medium is the average
CO2 price US$0/tonUS$15/tonUS$50/tonThese values are selected to represent no price, a low price, similar to prices seen in the EU ETS, and a high price on carbon, and are consistent with the prices used for the analysis in Chapter 5�
Enhanced oil recovery
1 million tons per year are injected and stored�EOR takes place for 10 years�After 10 years, CO2 is assumed to be stored in alternative site�Capital costs are increased by US$184,200,000�*Assumed oil price US$70/bbl�Maximum recovery factor: 2�5 bbl/ton injected (NETL 2008b)�Because of recycling, by year 10, only 50% of total CO2 injected is from capture in the plant�
Enhanced coalbed methane recovery
1 million tons per year are injected and stored�After 10 years, CO2 is assumed to be stored in alternative site�ECBM recovery takes place for 10 years�Capital costs are increased by US$66,000,000*Assumed gas price: US$3�5/mcf�Maximum recovery factor: 0�317 tons gas/ton CO2 injected (Reeves 2002)�
* Developed with expert consultation�
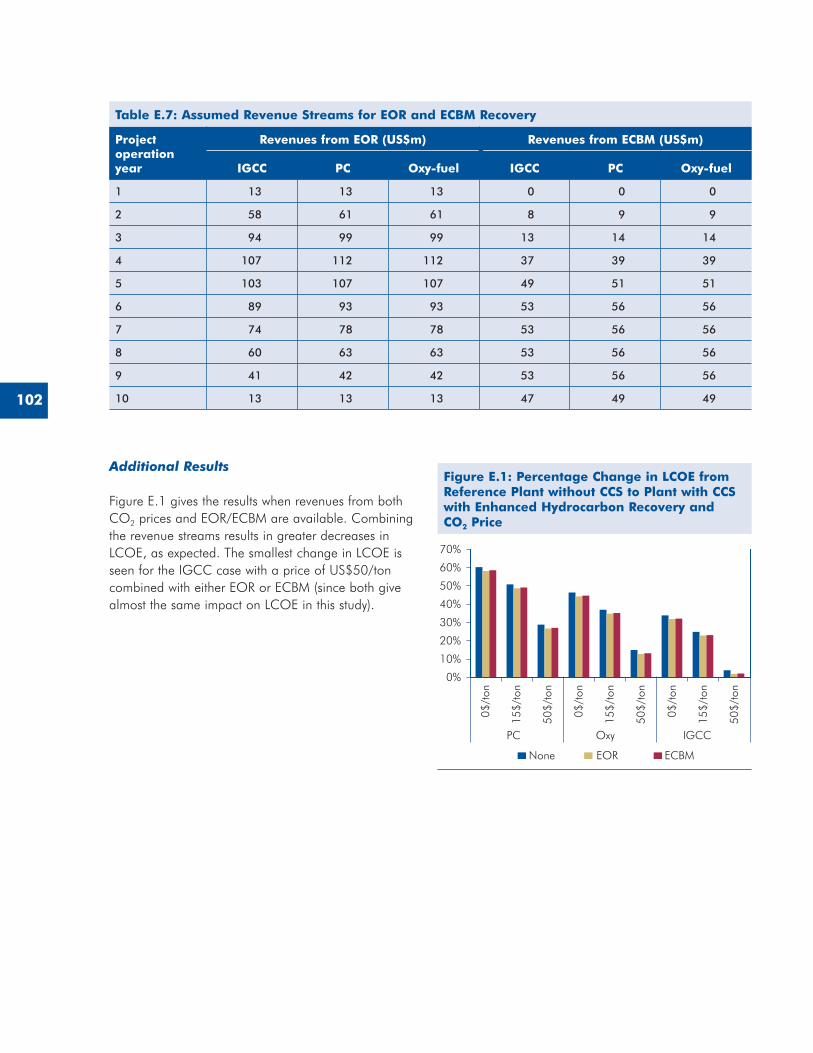
102
Additional Results
Figure E.1 gives the results when revenues from both CO2 prices and EOR/ECBM are available. Combining the revenue streams results in greater decreases in LCOE, as expected. The smallest change in LCOE is seen for the IGCC case with a price of US$50/ton combined with either EOR or ECBM (since both give almost the same impact on LCOE in this study).
Table E.7: Assumed Revenue Streams for EOR and ECBM Recovery
Project operation year
Revenues from EOR (US$m) Revenues from ECBM (US$m)
IGCC PC Oxy-fuel IGCC PC Oxy-fuel
1 13 13 13 0 0 0
2 58 61 61 8 9 9
3 94 99 99 13 14 14
4 107 112 112 37 39 39
5 103 107 107 49 51 51
6 89 93 93 53 56 56
7 74 78 78 53 56 56
8 60 63 63 53 56 56
9 41 42 42 53 56 56
10 13 13 13 47 49 49
Figure E.1: Percentage Change in LCOE from Reference Plant without CCS to Plant with CCS with Enhanced Hydrocarbon Recovery and CO2 Price
None ECBMEOR
PC Oxy IGCC
0%
10%
20%
30%
40%
50%
60%
70%
0$/t
on
15$/
ton
50$/
ton
0$/t
on
15$/
ton
50$/
ton
0$/t
on
15$/
ton
50$/
ton
103
BIBLIOGRAPHY
•The 1989 Basel Convention on the Control of Transboundary Movements of Hazardous Wastes and their Disposal (Basel Convention).
•The 1991 Bamako Convention on the Ban on the Import into Africa and the Control of Transboundary Movement and Management of Hazardous Wastes within Africa.
•A.T. Kearney. 2010. “Solar Thermal Electricity 2025: Clean Electricity on Demand: Attractive STE Cost Stabilize Energy Production.” Report commissioned by ESTELA. Dusseldorf: A. T. Kearney. http://www.estelasolar.eu/fileadmin/ESTELAdocs/documents/Cost_Roadmap/2010-06%20-%20Solar%20Thermal%20Electricity%202025%20-%20ENG.pdf
•AGF (High-Level Advisory Group on Climate Change Financing). 2010. “Work Stream 4: Contributions from International Financial Institutions: Analysis Carried out in Support of the UN High-Level Advisory Group on Climate Finance.” New York: United Nations. http://www.un.org/wcm/webdav/site/climatechange/shared/Documents/AGF_reports/Work_Stream_4_International%20Financial%20Institutions.pdf
•Almendra, F., L. West, L. Zheng, and S. Forbes. 2011. CCS Demonstration in Developing Countries: Priorities for a Financing Mechanism for Carbon Dioxide Capture and Storage. World Resources Institute Working Paper. Washington, D.C.: WRI. www.wri.org
•Andricevic, R., H. Gotovac, M. Loncar, and V. Srzic. 2008. “Risk Assessment from Oil Waste Disposal in Deep Wells.” Risk Conference, Cephalonia, Greece, May 5–7.
•Anglo Operation Ltd v Sandhurst Estates (Pty) Ltd and others. 2006. SCA 146 (RSA).
•APA (Atmospheric Pollution (Prevention) Act). Laws of Botswana, Chapter 65:03.
•Bachu, S. and L. Rothenburg. 2003. “Carbon Dioxide Sequestration in Salt Caverns: Capacity and Long-Term Fate.” In Proceedings of the Second Annual Conference on Carbon Dioxide Sequestration (CD-ROM). Alexandria, VA, 2003, 12p.
•Bakker, S. J. A., A. G. Aravanitakis, T. Bole, E. van de Brug, C. E. M. Doets, and A. Gilbert. 2007. “Carbon Credit Supply Potential beyond 2012: A Bottom-up Assessment of Mitigation Options.” ECN-C-07-090, Point Carbon, Ecofys, November.
•Bakker, S. J. A., T. Mikunda, and R. R. Tinoco. 2011. “Potential Impacts of CCS on the CDM.” CATO-2 Deliverable WP 2.3-D01 and D02. CATO 2 Program/ECN, the Netherlands.
•Bellona Foundation. 2011a. “Introduction to CCS.” Accessed June 2011, www.bellona.org/ccs/Tema/introductionToCcs
•———. 2011b. “Technology, Transport.” Accessed June 2011, http://www.bellona.org/ccs/Artikler/transport
•Brock, W. R., and L. A. Bryan. 1989. “Summary Results of CO2 EOR Field Tests, 1972–1987.” Paper SPE 18977. Presented at the SPE Joint Rocky Mountain Regional/Low Permeability Reservoirs and Exhibition, Denver, CO, March 6–8, 1989.
•Capoor, K., and P. Ambrosi. 2010. “State and Trends of the Carbon Market 2009.” Washington, D.C.: World Bank, June.
•Caravani, A., N. Bird, and L. Schalatek. 2010. “Climate Finance Fundamentals.” Heinrich Böll Stiftung North America. Brief 2, November.
•The Carbon Trust. 2011. “Carbon Capture and Storage.” http://www.carbontrust.co.uk/emerging-technologies/technology-directory/pages/carbon-capture-storage.aspx (accessed June 2011)
•CCP (CO2 Capture Project). 2009. “Financial Support Mechanisms for CO2 Capture and Storage, CO2 Capture Project.” December.
•CDM Methodological Tool: Tool to calculate the emission factor for an electricity system; see http://cdm.unfccc.int/methodologies/PAmethodologies/tools/am-tool-07-v2.pdf
•Châtel-Pélage, Fabienne, Ovidiu Marin, Nicolas Perrin, Ronald Carty, Gary R. Philo, Hamid Farzan, and Stanley J. Vecci. 2003. “A Pilot-Scale Demonstration of Oxy-combustion with Flue Gas
104
Recirculation in a Pulverized Coal-Fired Boiler.” Presentation at the 28th International Technical Conference on Coal Utilization and Fuel Systems, March 10–13, 2003, Clearwater, Florida. http://www.netl.doe.gov/technologies/coalpower/ewr/nox/pubs/42301%20B%26W%20NOx-O2%20clearwater%20paper%20A%200303.pdf
•Chen, C., and E. S. Rubin. 2009. “CO2 Control Technology Effects on IGCC Plant Performance and Cost.” Energy Policy 37:915–24.
•Chrysostomidis, I., P. D. Zakkour, M. Bohm, E. Benyon, R. De Filippo, and A. Lee. 2008. “Assessing Issues of Financing a CO2 Transportation Pipeline Network.” Physics Procedia, Proceedings of the 9th Greenhouse Gas Control Technologies Conference (GHGT-9). http://energy-resource.net/ccp/ghgt-9/2_CO2_pipelines_financing_v2.pdf
•CIF. 2009. “Clean Technology Fund—Investment Criteria for Public Sector Operations.” Washington, D.C.: World Bank, February.
•———. 2010. “Climate Investment Funds Set to Mobilize US$40 Billion for Country-Led Low Carbon Growth.” Press release, March 19, 2010. http://www.climateinvestmentfunds.org/cif/pf_2010_pressrelease_03_19
•Civil Code. 1967. Edict Nº 22 869, of 04 September 1967—as Amended by Decree-Law nº 3/2006, of 23 August, Article 1344.
•Climate Finance. 2009. “Carbon Fund Assets Reach US$16 Billion.” Press Article, Climate Finance newsletter, September 23.
•Clough, L. D. 2008. “Energy Profile of Southern Africa.” In Encyclopedia of Earth. C. J. Cleveland (ed.), National Council for Science and the Environment.
•CMIA (Carbon Markets and Investors Association). 2011. “Carbon Markets and Investors Association Submission of View to the AWG-LCA on Market and Non-Market-Based Approaches.” February 21.
•CO2GeoNet. 2007. CO2NET EAST Regional Workshop for CEE and EE Countries—CCS Response to Climate Changes. Zagreb, February 2007.
•Cokorilo, V., N.Lilic, J. Purga, V. Milisavljevic. 2009. “Oil Shale Potential in Serbia.” Oil Shale 26(4):451–62.
•The Convention on the Prevention of Marine Pollution by Dumping of Wastes and Other Matter, 1972, and 1996 Protocol thereto.
•Council of Geoscience, South Africa. 2010. “Atlas on Geological Storage of Carbon Dioxide in South Africa.” 51p + appendix.
•CSLF (Carbon Sequestration Leadership Forum). 2007. “Estimation of CO2 Storage Capacity in Geological Media—Phase 2.” Prepared by the Task Force on CO2 Storage Capacity Estimation for the Techncial Group (TG) of the Carbon Sequestration Leadership Forum. June. Available at: http://www.cslforum.org/publications/documents/PhaseIIReportStorageCapacityMeasurementTaskForce.pdf
•———. 2009. Ministerial Communiqué. London.
•Davison, J. 2007. “Performance and Costs of Power Plants with Capture and Storage of CO2.” Energy 32: 1163–76.
•de Coninck, H., J. Anderson, P. Curnow, T. Flach, O. Flagstad, H. Groenenberg, C. Norton, D. Reiner, and S. Shackley. 2006. “Acceptability of CO2 Capture and Storage, A Review of Legal, Regulatory, Economic and Social Aspects of CO2 Capture and Storage.” http://www.ccs-communications.gr/reports/acceptability%20CCS.pdf
•de Coninck, H., T. Mikunda, B. Cuamba, R. Schultz, and P. Zhou. 2010. “CCS in Southern Africa—An Assessment of the Rationale, Possibilities and Capacity Needs to Enable CO2 Capture and Storage in Botswana, Mozambique and Namibia.” ECN Report ECN-E—10-065.
•Dimitrovic, D. 2007. “Current Status of CO2 Injection Projects in Croatia.” In CO2GeoNet, CO2NET EAST Regional Workshop for CEE and EE Countries—CCS Response to Climate Changes, Zagreb, February.
•Directive 2009/31/EC of the European Parliament and of the Council of 23 April 2009 on the Geological Storage of Carbon Dioxide and Amending
105
Council Directive 85/337/EEC, European Parliament and Council Directives 2000/60/EC, 2001/80/EC, 2004/35/EC, 2006/12/EC, 2008/1/EC and Regulation (EC) No. 1013/2006. Official Journal of the European Union L 140/114, 5.6.2009. http://eur-lex.europa.eu/LexUriServ/LexUriServ.do?uri=OJ:L:2009:140:0114:0135:EN:PDF
•DNV. 2009. “CO2QUALSTORE: Guidelines for Selection and Qualification of Sites and Projects for Geological Storage of CO2.” DNV Report No. 2009-1425. http://www.dnv.com/industry/energy/rules_standards/qualstore_guideline_co2/ (accessed April 2011).
•Doctor, R., and D. Hanson. 2010. “Evaluation of CO2 Capture and Sequestration Using Oxyfuels with AMIGA Economics Modeling.” Presentation at the National Energy Technology Laboratory 2010 CO2 Capture Technology Meeting, September 13–17, 2010, Pittsburgh, Pennsylvania. http://www.netl.doe.gov/publications/proceedings/10/co2capture/presentations/wednesday/Richard%20Doctor%20-%20Argonne%20National%20Laboratory.pdf
•Dolton, G. L. 2006. “Pannonian Basin Province, Central Europe (Province 4808)—Petroleum Geology, Total Petroleum Systems, and Petroleum Resource Assessment.” USGS Bulletin 2204-B, 47p.
•DTI. 2005. Developing Monitoring, Reporting and Verification Guidelines for CO2 Capture and Storage under the EU ETS.” Report No. Coal R277, DTI/ Pub 05/583. Prepared by ERM and DNV.
•Du, Y., and J. Parsons. 2009. “Update on the Cost of Nuclear Power.” Center for Energy and Environmental Policy Research WP-09-004. Cambridge, Massachusetts: MIT. http://web.mit.edu/ceepr/www/publications/workingpapers/2009-004.pdf
•Dubljevic, V. 2008. “Oil and Gas in Montenegro.” Government of Montenegro, Ministry for Economic Development. http://www.minekon.gov.me/en/library/document
•EC. 2006. “Report of Working Group 3: Carbon Capture and Storage: The Second European Climate Change Programme (ECCP II).” Final Report. June 1.
•———. 2009a. “Communication from the Commission to the European Council and Parliament: Demonstrating CCS in Emerging Economies: Financing the EU-China Near-Zero Emissions Coal Project.” COM(2009)284 Final.
•———. 2009b. “Directive 2009/31/EC of the European Parliament and of the Council of 23 April 2009 on the Geological Storage of Carbon Dioxide and Amending Council Directive 85/337/EEC.” European Parliament and Council Directives 2000/60/EC, 2001/80/EC, 2004/35/EC, 2006/12/EC, 2008/1/EC and Regulation (EC) No 1013/2006 (EU).
•———. 2010. “Commission Decision of 8th June 2010 Amending Decision 207/589/EC as Regards the Inclusion of Monitoring and Reporting Guidelines for Greenhouse Gas Emissions from the Capture, Transport and Geological Storage of CO2. Decision 2010/345/EC.
•EC JRC. 2009. “Economic Assessment of Post-2012 Global Climate Policies.” EUR 23768 EN-2009, EC Joint Research Centre.
•EIA Act (Environmental Impact Assessment Act). Laws of Botswana. Chapter 65:07.
•Element Energy/Carbon Counts. 2010. “Developing a CCS Network for the Tees Valley.” Final Report for One North East and Nepic. http://www.ccsassociation.org.uk/docs/2011/EE%20ONE%20North%20East%20CCS%20Final%20Report%20V6.pdf
•ELI (Environmental Law of Mozambique). Article 1, Clause 23, and Article 20.
•Energy Strategy and Policy of Kosovo, white paper. 2005. EU Pillar, PISG-Energy Office, Lignite Mining Development Strategy.
•Engelbrecht, A., A. Golding, S. Hietkamp, and B. Scholes. 2004. “The Potential for Sequestration of Carbon Dioxide in South Africa.” CSIR Report 86DD/HT339, 54pp.
•EPRI (Electric Power Research Institute). 2009. “Updated Cost and Performance Estimates for Clean Coal Technologies including CO2 Capture—2009. Palo Alto, California: EPRI, 1017495
106
•Ercegovac, M., D. Zivotic, and A. Kostic. “Genetic-Industrial Classification of Brown Coals in Serbia.” Int. J. of Coal Geol. 68, 2006.
•EU (European Union). 2011. “European Union’s Submission to the UNFCCC on Market and Non-Market-Based Approaches. March 2011.
•EU GeoCapacity. 2006. “FP6 Report: Assessing European Capacity for Geological Storage of Carbon Dioxide.” D16. WP2 Report Storage Capacity.
•European Commission, Climate Action. 2011a. “The EU Climate and Energy Package.” Accessed June 2011, http://ec.europa.eu/clima/policies/package/index_en.htm
•———. 2011b. “Implementation of CCS Directive.” Accessed June 2011. http://ec.europa.eu/clima/policies/lowcarbon/ccs_implementation_en.htm
•Entso-e (European Network of Transmission System Operators for Electricity). 2011. https://www.entsoe.eu/
•Evans, R. T. 2009. “‘CO2 Applications’ Discussion and Reply.” Journal of Petroleum Technology, October, p. 81.
•Fein, Ian, Heather Matsumoto, Tyler Mcnish, and Jeslyn Miller. 2010. “Clean Development Fund: A ‘Public Option’ for Carbon Offsets.” Harvard Law and Policy Review, February.
•Finkenrath, Matthias. 2010. “Cost and Performance of Carbon Dioxide Capture from Power Generation.” Paris: OECD/IEA. www.iea.org/papers/2011/costperf_ccs_powergen.pdf
•G8 Declaration. 2008. “Environment and Climate Change.” Para. 31. Hokkaido-Toyako Summit, Japan, July 8, 2008.
•———. 2009. “Responsible Leadership for a Sustainable Future.” Para. 39. L’Aquila Summit, Italy, July 8, 2009.
•———. 2010. “Recovery and New Beginnings.” Para. 24. Muskoka Summit, Canada, July 26, 2010.
•Gale, J. J. 2004. “Using Coal Seams for CO2 Sequestration.” Geologica Belgica 7:99–103.
•Gatzen, Christoph. 2009. “Salt Caverns for Energy Storage—Who Fills Them and With What?” Presentation from Frontier Economics, London, April 3, 2009. http://www.tu-dresden.de/wwbwleeg/events/enerday/2009/Presentations/Christoph.Gatzen.pdf
•GEF (Global Environment Facility). 2009. “Midterm Review of the Resource Allocation Framework.” Evaluation Office. Evaluation Report No. 47. Washington, D.C.: GEF, May. http://www.thegef.org/gef/sites/thegef.org/files/documents/RAF_MTR-Report_0.pdf
•———. 2010. “Report of the Global Environment Facility to the Sixteenth Session of the Conference of the Parties to the Framework Convention on Climate Change.” UNFCCC Document FCCC/CP/2010//5/Add.1. July 1. http://www.thegef.org/gef/sites/thegef.org/files/documents/document/GEF_COP16_Report.pdf
•GEF Assembly. 2010. “Summary of Negotiations: Fifth Replenishment of the GEF Trust Fund.” Fourth GEF Assembly, Punta del Este, Uruguay, May 17. http://www.unccd.int/publicinfo/pressrel/docs/gefa47.pdf
•GHG IA (Greenhouse Gas Implementing Agreement). 2009. “Biomass CCS Study.” Report Number 2009-9.
•Global CCS Institute. 2009. “Strategic Analysis of the Global Status of Assessment of Carbon Capture and Storage. Report 2: Economic Assessment of Carbon Capture and Storage Technologies.” Prepared by WorleyParsons for Global CCS Institute. Canberra, Australia: GCCSI. http://www.globalccsinstitute.com/sites/default/files/Report%202-Economic%20Assessment%20of%20Carbon%20Capture%20and%20Storage%20Technologies_0.pdf
•———. 2010. “Global Status of CCS: 2010.” Canberra, Australia: GCCSI. www.globalccsinstitute.com
•———. 2011. “CCS Overview.” Canberra, Australia: GCCSI. http://www.globalccsinstitute.com/about_css/overview.html, Accessed June 2011
107
•Hadaddji, R. 2006. “The In Salah CCS Experience, Sontrach, Algeria.” Presentation to the EU-OPEC Roundtable on Carbon Dioxide Capture and Storage. September 19–21, 2006, Riyadh, Saudi Arabia.
•Haefeli, S., M. Bosi, and C. Philibert. 2003. “Carbon Dioxide Capture and Storage Issues—Accounting and Baselines under the United Nations Framework Convention on Climate Change.” IEA Information Paper, International Energy Agency, Paris, May.
•Hagemann, Markus, Sara Moltmann, Anne Palenberg, Erika de Visser, Niklas Höhne, Martina Jung, and Stefan Bakker. 2011. “Role of CCS in the International Climate Regime.” Background Paper. CATO2. http://www.co2-cato.nl/cato-2/publications/publications/background-paper-on-role-of-ccs-in-the-international-climate-regime-
•Hamilton, M., H. Herzog, J. Parsons. 2009. “Cost and US Public Policy for new Coal Power Plants with Carbon Capture and Sequestration.” Energy Procedia 1(1):4487–94.
•Hatziyannis, G. 2009. “Review of CO2 Storage Capacity of Greece, Albania and FYROM.” EU GeoCapacity Final Conference, Copenhagen, 2009.
•Hatziyannis, G., G. Falus, G. Georgiev, C. Sava. 2009. “Assessing Capacity for Geological Storage of Carbon Dioxide in Central—East Group of Countries (EU GeoCapacity Project).” Energy Procedia.
•Herzog, Howard. 2009. “Carbon Capture and Storage.” Introduction, Chapter 13, June 21. http://sequestration.mit.edu/pdf/2009_CO2_Capture_and_Storage_Ch13_book.pdf
•———. 2011. “Scaling up Carbon Dioxide Capture and Storage: From Megatons to Gigatons.” Energy Economics 33(4):597–604. http://sequestration.mit.edu/pdf/Herzog_EnergyEconomics_Dec2010.pdf
•Holtz, M. H., V. Núñez-López, and C. L. Breton. 2005. Moving Permian Basin Technology to the Gulf Coast: The Geologic Distribution of CO2 EOR Potential in Gulf Coast Reservoirs, Unconventional Reservoirs.” In P. H. Lufholm and D. Cox, eds., West Texas Geological Society Publication 05-115, Fall Symposium, October 26–27.
•ICC. 2011. “International Chamber of Commerce Submission of Views to the AWG-LCA on Market and Non-Market-Based Approaches.” February 21, 2011.
•IEA (International Energy Agency. 2006. “Energy Technology Perspectives 2006: Scenarios and Outlooks to 2050.” Paris: IEA/OECD.
•———. 2008. “Energy Technology Perspectives 2008: Scenarios and Strategies to 2050.” Paris: IEA.
•———. 2009. “Technology Roadmap: Carbon Capture and Storage.” Paris: IEA/OECD.
•———. 2010a. “Carbon Capture and Storage: Model Regulatory Framework.” Paris: IEA.
•———. 2010b. “Carbon Capture and Storage Legal and Regulatory Review.” Edition 1. Paris: IEA, October.
•———. 2010c. “Energy Technology Perspectives 2010: Scenarios and Strategies to 2050.” Paris: IEA.
•———. 2011a. “Cost and Performance of Carbon Dioxide Capture from Power Generation.” Paris: IEA.
•———. 2011b. “A Policy Strategy for Carbon Capture and Storage.” Paris: IEA.
•IEA/CSLF. 2010. “Report to the Muskoka 2010 G8 Summit. Carbon Capture and Storage: Progress and Next Steps.” Prepared with the cooperation of the Global CCS Institute.
•IEA ETSAP (Energy Technology Systems Analysis Programme). 2010. “CO2 Capture and Storage.” Technology Brief E14, October. http://www.etsap.org/E-techDS/PDF/E14_%20CCS%20draft%20oct2010_%20GS-gc_OK.pdf
•IEAGHG (IEA Greenhouse Gas R&D Programme). 2007. “ERM—Carbon Dioxide Capture and Storage in the Clean Development Mechanism.” IEA Greenhouse Gas R&D Programme, Report 2007/TR2. Cheltenham, U.K, April.
•———. 2008. “Carbon Dioxide Capture and Storage in the Clean Development Mechanism: Assessing Market Effects Inclusion.” IEA Greenhouse Gas R&D
108
Programme Technical Study 2008/13. November, Cheltenham, U.K.
•———. 2010. “Monitoring Selection Tool. Cheltenham, U.K. http://www.ieaghg.org/index.php?/20091223131/monitoring-selection-tool.html
•IMO (International Maritime Organisation). 2007. “Report of the 30th Meeting of the Scientific Group of the London Convention.” LC/SG 30/14. 25th July 2007. Annex 3. IMO.
•In Salah Gas Partners. 2009. “Proposed CDM NM: Capture, Transport and Long-Term Storage in Geological Formations of Carbon Dioxide from Natural Gas Processing Operations. http://www.insalahco2.com/images/documents/en/In_Salah_CDM_Methodology_Proposal_2010.pdf?phpMyAdmin=ON%2C4VldplOoJF5WGkrTYSJ0-OP1 (accessed April 2011).
•Indonesia CCS Study Working Group. 2009. “Understanding Carbon Capture and Storage Potential in Indonesia.” Final draft. Supported by the DG LEMIGAS, the British Embassy in Jakarta, Lingkungan Hidup, PT Shell, PT PLN, and the World Energy Council.
•Instruction on Environmental Inspection Reporting. No. 353-03-2197/2006-01.
•The International Oil Pollution Compensation Funds; IOPC Funds. 1992 Civil Liability Convention, the 1992 Fund Convention and the IOPC Supplementary Fund. Information available at http://www.iopcfund.org/.
•IPCC (Intergovernmental Panel on Climate Change). 2006. “Carbon Dioxide Transport, Injection and Geological Storage.” Chapter 5 in Guidelines for National Greenhouse Gas Inventories, Volume 2.
•———. 2007. Climate Change 2007: Mitigation. Contribution of Working Group III to the Fourth Assessment Report of the Intergovernmental Panel on Climate Change [B. Metz, O. R. Davidson, P. R. Bosch, R. Dave, and L. A. Meyer (eds.)]. Cambridge, U.K., and New York: Cambridge University Press.
•Jeffrey, L. S. 2005. “Characterization of the Coal Resources of South Africa.” Journal of the
South African Institute of Mining and Metallurgy (February):95–102.
•Komatina-Petrovic, S. 2007. “Geology of Serbia and Potential Localities for Geological Storage of CO2.” CO2NET EAST Regional Workshop for CEE and EE Countries—CCS Response to Climate Changes, Zagreb, February 2007.
•Kucharic, L. “CO2 Storage Opportunities in the Selected New Member States and Candidate States of EU (on the basis of CASTOR, WP1.2 results).” CO2NET EAST Regional Workshop for CEE and EE Countries—CCS Response to Climate Changes, Zagreb, February 2007.
•Law of Environmental Impact Assessment, Article 7(1), Kosovo.
•Law of Environmental Protection of Federation of Bosnia and Herzegovina, Official Gazette of Federation of Bosnia and Herzegovina 40/02.
•Law on Energy, Kosovo.
•Law on Energy Regulator, Kosovo.
•Law on Environmental Protection, Kosovo.
•Law on Natural Gas, Kosovo.
•Law on Protection from Non-Ionized, Ionized Radiation and Nuclear Security of Kosovo (03/L-104)
•Lecocq, Franck, and Kenneth Chomitz. 2001. Optimal Use of Carbon Sequestration in a Global Climate Change Strategy: Is There a Wooden Bridge to a Clean Energy Future? Policy Research Working Paper Series 2635. Washington, D.C.: World Bank.
•“List of Activities Which Have or May Have a Significant Detrimental Effect on the Environment, Including Health, Social Conditions, Economic Conditions, Ecological Conditions or Cultural Heritage.” 2010. GN 248, GG 33064. Ministry of Water and Environmental Affairs, South Africa, http://www.enviroleg.co.za/acts/National%20Environmental%20Management%20Air%20Quality/Regs/248-10%20List%20of%20%20Activities%20which%20may%20Effect%20the%20Environment.pdf
109
•London and SA Exploration Co v Rouliot. 1891. 8 SC 75.
•London Protocol. 1996. 1996 Protocol to the Convention on the Prevention of Marine Pollution by Dumping of Wastes and Other Matter, 1972. Annex I. Parties to the Convention on the Prevention of Marine Pollution by Dumping of Wastes and Other Matter 1972.
•Mabote, A., 2010. “Overview of the Upstream Petroleum Sector of Mozambique.” UK—Mozambique Investment Forum 2010, London, December 2, 2010.
•Marko, D., and A. Moci. 1995. “Oil Production History in Albania Oil Fields and Their Perspective. 6th UNITAR Conference on Heavy Crude and Tar Sands, Technological Institute for Oil and Gas.
•Mbede, E. I. 1991. “The Sedimentary Basins of Tanzania—Reviewed.” Journal of African Earth Sciences (and the Middle East) 13:291–97.
•McCoy, S. T. 2008. “The Economics of CO2 Transport by Pipeline and Storage in Saline Aquifers and Saline Reservoirs.” Ph.D. dissertation, Carnegie Mellon University.
•McKinsey. 2009. “Pathways to a Low-Carbon Economy. Version 2 of the Global Greenhouse Abatement Cost Curve.” McKinsey & Company.
•Melien, T. Brown-Roijen. 2009. Economics: Carbon Dioxide Capture for Storage in Deep Geological Formations—Results from the CO2 Capture Project Volume 3. Eide (ed.). Berkshire, U.K.: CPL Press.
•Metz, Bert, Ogunlade Davidson, Heleen de Coninck, Manuela Loos, and Leo Meyer (eds.). 2005. “Carbon Dioxide Capture and Storage.” IPCC Special Report. Prepared by Working Group III of the Intergovernmental Panel on Climate Change. Cambridge, U.K.: Cambridge University Press. http://www.ipcc.ch/pdf/special-reports/srccs/srccs_wholereport.pdf
•Mines and Minerals Act of Botswana. 2002. Law N.14/2002, of 26 June 2002.
•MIT. 2007. “Future of Coal, Options for a Carbon Constrained World.” Cambridge, Massachusetts: MIT. http://web.mit.edu/coal/
•MMA (Mines and Minerals Act). Laws of Botswana. Chapter 66:01.
•Narita, Daiju. 2008. The Use of CCS in Global Carbon Management: Simulation with the DICE Model. Kiel Working Paper No. 1440. Kiel, Germany: Kiel Institute for the World Economy. http://www.ifw-members.ifw-kiel.de//reference_catalog/lookupObject?uuid=c2144053084bc144b761f17b39096348
•National Treasury, South Africa. 2010. “Discussion Paper for Public Comment—Reducing Greenhouse Gas Emissions: The Carbon Tax Option.” P. 59.
•NEM: AQA (National Environmental Management: Air Quality Act. 2004. Act No. 39. Republic of South Africa, Cape Town.
•NEM: ICMA (National Environmental Management, Integrated Coastal Management Act). 2008. Act No. 24. Republic of South Africa.
•NEM: WA (National Environmental Management: Waste Management). 2008. Act No. 59. Republic of South Africa.
•NEMA (South Africa National Environmental Management Act No. 107). 1998.
•NEPP (National Environmental Protection Programme). 2010. Ministry of Environment and Spatial Planning, Belgrade, p.105
•NETL (National Energy Technology Laboratory). 2008a. “Pulverized Coal Oxycombustion Power Plants.” Final Report, August, U.S. DOE/NETL-2007/1291.
•———. 2008b. “Storing CO2 with Enhanced Oil Recovery.” U.S. DOE/NETL-402/1312/02-07-08, February 7. http://www.netl.doe.gov/energy-analyses/pubs/Storing%20CO2%20w%20EOR_FINAL.pdf
•———. 2010a. Coal-Fired Power Plants in the United States: Examination of the Costs of Retrofitting with CO2 Capture Technology, Revision 3, January 4, 2011, U.S. DOE/NETL-402/102309
110
•———. 2010b. Cost and Performance Baseline for Fossil Energy Plants Volume 1: Bituminous Coal and Natural Gas to Electricity, Revision 2, November 2010, U.S. DOE/NETL-2010/1397
•———. 2010c. Cost and Performance for Low-Rank Pulverized Coal Oxycombustion Energy Plants, Final Report, September 2010, U.S. DOE/NETL-401-093010
•———. 2010d. Life Cycle Analysis; Integrated Gasification Combined Cycle (IGCC) Power Plant, September 30 2010, U.S. DOE/NETL-403-110209
•———. 2010e. Life Cycle Analysis; Natural Gas Combined Cycle (NGCC) Power Plant, September 30 2010, U.S. DOE/NETL-403-110509
•———. 2010f. Life Cycle Analysis; Supercritical Pulverized coal (SCPC) Power Plant, September 30 2010, U.S. DOE/NETL-403-110609
•———. 2011. “Carbon Sequestration Reference Shelf.” http://www.netl.doe.gov/technologies/carbon_seq/refshelf/refshelf.html (accessed 2011)
•NETL, USAID, NTPC, and Nexant. 2007. “Feasibility Study of a Coal Based IGCC Power Plant in India, Phase C Topical Report on Feasibility of 100MWe IGCC Demonstration Plant at NTPC Dadri Station.”
•Nkala, Oscar. 2008. “Energy Firm Probes Coal-Bed Methane Prospects in Botswana, Zimbabwe.” Engineering News Magazine 24/08/2008, Exploration and Development section. http://www.engineeringnews.co.za/article/energy-firm-probes-coalbed-methane-prospects-in-botswana-zimbabwe-2008-10-24
•NWA (National Water Act 36 of South Africa). 1998.
•NZEC (China-UK Near-Zero Emissions Coal Initiative). 2009. Carbon Dioxide Capture from Coal-fired Power Plants in China, Summary Report for NZEC Work Package 3, September.
•Official Journal of the Republic of Serbia. 2004, 2009, 2010
•Official Submission of the Bolivarian Republic of Venezuela on behalf of Cuba, Bolivia, Ecuador
and Nicaragua; ALBA-PTT Member States to the UNFCCC AWG-LCA. 26 April 2010 contained in document FCCC/AWGLCA/2010/MISC.2/Add.1; and World People’s Conference on Climate Change and the Rights of Mother Earth. ALBA-TCP “Nature has no Price” Declaration of Ministerial Committee. November, 5 2010.
•The Overseas Development Institute (ODI)/Heinrich Böll Stiftung. Climate Funds Update. Information available at http://www.climatefundsupdate.org/ (accessed April 2011)
•Papua New Guinea. 2011. Submission of views to the AWG-LCA on market and non-market-based approaches. February 21, 2011.
•Parker, C., J. Brown, J. Pickering, E. Roynestad, N. Mardas, and A. W. Mitchell. 2009. The Little Climate Finance Book: A Guide to Financing Options for Forests and Climate Change. Oxford, U.K.: Global Canopy Programme.
•Petroleum Agency SA. 2008. “Petroleum Exploration—Information and Opportunities 2008.” Brochure.
•Petroleum Law, Article 17 of Mozambique, clause (b), and Article 18, paras. 1–2.
•Petroleum Operations Regulations of Botswana. 2004. Decree N. 24/2004, of 20 August, Articles 24, 39, 40, 46, 52–56.
•Philibert, C., J. Ellis, and J. Podkanski. 2007. “Carbon Capture and Storage in the CDM.” Paris: Organisation for Economic Co-operation and Development/International Energy Agency.
•Porter, G., N. Bird, N. Kaur, and Leo Peskett. 2008. “New Finance for Climate Change and the Environment.” Heinrich Böll Foundation and WWF, July.
•Project Catalyst. 2009. “Scaling up Climate Finance.” Project Catalyst, September.
•Rubin, E., Chen, C., Rao, A. 2007. “Cost and Performance of Fossil Fuel Power Plants with CO2 Capture and Storage”. Energy Policy, Vol. 35 (9), pp.4444–4454
111
•RWM (Regulation on Waste Management of Botswana). 2006. Decree N.13/2006 of June 15, Article 1, clause (m).
•SANS (South African National Standards) 10228. 2006. The Identification and Classification of Dangerous Goods for Transport. 4th edition. ISBN 0-626-17933-5.
•Schalwyck, H. J.-M. 2005. “Assessment Controls on Reservoir Performance and the Affects of Granulation Seam Mechanics in the Bredasdorp Basin, South Africa.” Master’s thesis, University of the Western Cape, Dept of Earth Sciences, 161 pages.
•Sharma, S. 2006. “2nd IEAGHG Workshop on CCS in the CDM.” Vienna, August 7, 2006. UNFCCC Secretariat.
•Siebert, C. K., A. Atteridge, R. J. T. Klein. 2010. “Bilateral Financing Institutions and Climate Change—A Mapping of 2009 Climate Financial Flows to Developing Countries.” A report for UNEP by the Stockholm Environment Institute.
•Solomon, S., B. Kristiansen, A. Stangeland, T. A. Torp, and O. Kårstad. 2007. “A Proposal of Regulatory Framework for Carbon Dioxide Storage in Geological Formations.” Prepared for International Risk Governance Council Workshop, March 15–16, 2007, Washington, D.C.
•South Africa DOE. 2011. “Integrated Resource Plan for Electricity 2010–2030.” March 25.
•STAP (Scientific and Technical Advisory Panel). 2008. “Carbon Dioxide Capture and Storage: Conclusions and Recommendations from a STAP Brainstorming Meeting.” October 17–18, 2007. Global Environment Facility—Scientific and Technical Advisory Panel report to the GEF Council, April 22–25, 2008.
•Stern, N. 2006. “Stern Review: The Economics of Climate Change.” United Kingdom HM Treasury.Swart. 2010. “Geological Sequestration of CO2 in Namibia.” Workshop Presentation CCS-Africa, Windhoek. April 15, 2010.
•Tenaska. 2011. “Innovation Clean Energy Technology, Economic Impact.” Tenaska Trailblazer Energy Center.
•Sharma. 2006. Presentation by Sudhir Sharma, UNFCCC Secretariat, 2nd IEAGHG Workshop on CCS in the CDM, Vienna, August 7, 2006.
•RCI. 2009. “CO2 Capture, Transport and Storage in Rotterdam.” Executive Summary Report, Rotterdam Climate Initiative. http://www.rotterdamclimateinitiative.nl/documents/Documenten/RCI-CCS-ExecSumm.pdf
•Reeves, S. 2002. “Advanced Resources International.” COAL-SEQ project update. Field studies of ECBM Recovery/CO2 Sequestration in Coal Seams, Greenhouse Gas Technologies-6 (GHGT-6). http://www.coal-seq.com/pdf/GHGT-6%20Paper.pdf
•Reeves, S., and A. Oudinot. 2005. “The Allison Unit CO2-ECBM Pilot—A Reservoir and Economic Analysis.” Advanced Resources International, Inc., 2005 International Coalbed Methane Symposium.
•REIAP (Regulation on the Environmental Impact Assessment Process) of Botswana, Article 10, para. 1; Articles 24; and Articles 26.
•Regulation on the Mining Law of Mozambique. 2006. Decree no. 62/2006 of December26.
•REQSEE (Regulations on Environmental Quality Standards and Effluent Emissions of Mozambique). Articles 1, 8.
•RISC. 2009. “CO2 Injection Well Cost Estimation.” Report prepared for the Carbon Storage Taskforce, http://www.google.com/url?sa=t&source=web&cd=1&ved=0CBgQFjAA&url=http%3A%2F%2Fwww.ret.gov.au%2Fresources%2FDocuments%2FPrograms%2Fcst%2FRISC%2520-%2520CO2%2520Injection%2520Well%2520Cost%2520Estimation.pdf&ei=pecpTr7qOJCstge2hrniBw&usg=AFQjCNFcXMTv48FQBfwyQ6AxWuDUvv1PuA
•Rubin, E. 2007. “Use of Experience Curves to Estimate Future Cost of Power Plants with CO2 Capture.” International Journal of Greenhouse Gas Control 1(2):188–197.
•Rubin, E., C. Chen, and A. Rao. 2007. “Cost and Performance of Fossil Fuel Power Plants with CO2 Capture and Storage.” Energy Policy 35(9):4444–54.
112
http://www.tenaskatrailblazer.com/ (accessed June 2011).
•Tot, M., D. Pesut, A. Hudges, C. Fedorski, B. Merven., A. Trikam, J. Duerinck, H. Ferket, and A. Lust. 2011. “Techno-Economic Assessment of Carbon Capture and Storage Deployment in Power Stations in the Southern African and Balkan Regions.” Report commissioned by the World Bank to a consortium comprising VITO, Energy Research Centre (ERC), University of Cape Town, and Energy Institute Hrvoje Požar (EIHP). http://go.worldbank.org/MJIX0TRAB0
•UN (United Nations). 2010. “Report of the Secretary-General’s High-Level Advisory Group on Climate Change Financing.” November 5.
•UNEP (United Nations Environment Programme). 2010. “The Emissions Gap Report: Are the Copenhagen Accord Pledges Sufficient to Limit Global Warming to 2°C or 1.5°C? A Preliminary Assessment.” UNEP, Nairobi, November 2010.
•UNEP Risoe CDM/JI Pipeline Analysis and Database, March 1, 2011.
•UNFCCC (United Nations Framework Convention on Climate Change). 2005a. “Modalities and Procedures for Afforestation and Reforestation Project Activities under the Clean Development Mechanism in the First Commitment Period of the Kyoto Protocol.” Decision 5/CMP.1.
•———. 2005b. “Modalities and Procedures for a Clean Development Mechanism.” Decision 3/CMP.1.
•———. 2005c. “Report of the 22nd Meeting of the CDM Executive Board, 25th November 2005.”
•———. 2005d. The White Tiger Oilfield Carbon Capture and Storage (CCS) Project in Vietnam. Reference NM0167. Clean Development Mechanism, UNFCCC, Bonn, Germany. https://cdm.unfccc.int/methodologies/PAmethodologies/pnm/byref/NM0167
•———. 2006. The Capture of the CO2 from the Liquefied Natural Gas (LNG) Complex and Its Geological Storage in the Aquifer Located in Malaysia. Reference NM0168. Clean Development Mechanism, UNFCCC, Bonn, Germany. https://cdm.unfccc.int/methodologies/PAmethodologies/pnm/byref/NM0168
•———. 2007. “The Bali Action Plan.” Decision 1/CP.13.
•———. 2008a. “Synthesis of Views on Issues Relevant to the Consideration of Carbon Dioxide Capture and Storage in Geological Formations as Clean Development Mechanism Project Activities.” Document FCCC/SBSTA/2008/INF.1
•———. 2008b. “Synthesis of Views on Technological, Methodological, Legal, Policy and Financial Issues Relevant to the Consideration of Carbon Dioxide Capture and Storage in Geological Formations as Project Activities under the Clean Development Mechanism.” Document FCCC/SBSTA/2008/INF.3.
•———. 2009a. “The Copenhagen Accord.” Decision 2/CP.15.
•———. 2009b. “Further Guidance Relating to the Clean Development Mechanism.” Decision 2/CMP.5.
•———. 2009c. “Implications of the Inclusion of Geological Carbon Dioxide Capture and Storage as CDM Project Activities—An Assessment.” Draft Final Report. Annex 1 to the Report of the 50th Meeting of the CDM Executive Board.
•———. 2009d. “Investment and Financial Flows to Address Climate Change: An Update.” UNFCCC Secretariat, March.
•———. 2010a. Ad Hoc Working Group on Long-Term Cooperative Action under the Convention, Negotiating text, Chapter III, para 2, Available at: http://unfccc.int/resource/docs/2010/awglca12/eng/14.pdf
•———. 2010b. “The Cancun Agreements: Land Use, Land Use Change and Forestry.” Decision 2/CMP.6.
•———. 2010c. “The Cancun Agreements: Outcome of the Ad Hoc Working Group on Further Commitments of Annex I Parties under the Kyoto Protocol at Its Fifteenth Session.” Decision 1/CMP.6.
•———. 2010d. “The Cancun Agreements: Outcome of the Ad Hoc Working Group on Long-Term Cooperative Action under the Convention.” Decision 1/CP.16.
113
•———. 2010e. Carbon dioxide capture and storage in geological formations as clean development mechanism project activities. Decision 7/CMP.6. http://unfccc.int/files/meetings/cop_16/application/pdf/cop16_cmp_ccs.pdf
•———. 2010f. “Consideration of Further Commitments of Annex I Parties under the Kyoto Protocol.” Revised proposal by the Chair. December 10, 2010. Document FCCC/KP/2010/CRP.4/Rev.4. Chapter III.
•———. 2011a. “About CDM, Carbon Dioxide Capture and Storage in Geological Formations as CDM Project Activities.” http://cdm.unfccc.int/about/ccs/index.html (accessed June 2011)
•———. 2011b. “Synthesis Report on Information on Various Approaches in Enhancing the Cost-Effectiveness of, and Promoting, Mitigation Actions.” FCCC/AWGLCA/2011/4, March 30.
•UNCLOS (United Nations Convention on the Law of the Sea). 1982. Articles 21 and 195. http://www.un.org/Depts/los/convention_agreements/texts/unclos/UNCLOS-TOC.htm.
•UN-REDD Programme. 2009. “The United Nations Collaborative Programme on Reducing Emissions from Deforestation and Forest Degradation in Developing Countries.” http://www.un-redd.org/AboutREDD/tabid/582/Default.aspx
•US EPA (U.S. Environmental Protection Agency). 2010a. “Federal Requirements under the Underground Injection Control (UIC) Program for Carbon Dioxide (CO2) Geologic Sequestration (GS) Wells.” US EPA, Final Rule, 75 Fed. Reg. 77230 (December 10). http://water.epa.gov/type/groundwater/uic/wells_sequestration.cfm
•———. 2010b. “Mandatory Reporting of Greenhouse Gases: Injection and Geologic Sequestration of Carbon Dioxide.” US EPA, Final Rule, 75 Fed. Reg. 75060 (December 1).
•The U.S. Oil Spill Liability Trust Fund. OSLTF, National Pollutions Fund Center. Information available at http://www.uscg.mil/npfc/About_NPFC/osltf.asp).
•Van der Spuy, D. 2010. “Natural Gas—An Update on South Africa’s Potential.” Presentation with notes. SANEA, Cape Town, July 21, 2010.
•van der Zwaan, Bob, and Reyer Gerlagh. 2008. “The Economics of Geological CO2 Storage and Leakage.” Working Papers 2008.10. Fondazione Eni Enrico Mattei. www.feem.it
•VCS (Verified Carbon Standard). 2011. “Agriculture, Forestry and Other Land Use (AFOLU) Requirements.” Verified Carbon Standard, v.3.0. 8 March.
•Versteeg, P., and E. Rubin. 2010. “Technical and Economic Assessment of Ammonia-Based Post-Combustion CO2 Capture.” Proc. 10th International Conference on Greenhouse Gas Control Technologies(GHGT-10), Amsterdam, Netherlands, 2010.
•Viljoen, J. H. A., F. D. J. Stapelberg, and M. Cloete. 2010. “Technical Report on the Geological Storage of Carbon Dioxide in South Africa.”
•The Waste Law of Kosovo (02/L-30)
•Water Act, Laws of Botswana. Chapter 34:01, Articles 9, 15, 17, 54.
•Wilson, E., and D. Keith. 2003. “Geologic Carbon Storage: Understanding the Rules of the Underground.” In J. Gale and Y. Kaya (eds.), Proc. of the 6th Intl. Conf. on Greenhouse Gas Control Techs (Vol. I). October 2003. Pergamon.
•WMA (Waste Management Act). Laws of Botswana. Chapter 65:06, Section 2.
•Workshop for New Energy Policies in Southeast Europe—The Foundation for Market Reform. Coalmines in Serbia and Montenegro
•World Bank. 2010a. Monitoring Climate Finance and ODA. Issues Brief #1. May 2010. Huhtala, A., Curto, S. and Ambrosi, P. The World Bank, Washington D.C.
•———. 2010b. “Project Appraisal Document on a Proposed Loan in the Amount of US$3,750 Million to Eskom Holdings Limited Guaranteed by the Republic of South Africa for an Eskom Investment Project.” March 19. Washington, D.C.
114
•———. 2010c. Ten years of Working in Carbon Finance: Insights from working with the Kyoto Mechanisms. The World Bank, Washington DC, August 2010.
•———. 2010d. World Development Report 2010: Development and Climate Change. World Bank, Washington D.C.
•———. 2011a. “Commodity Markets Review.” DECPG, March 8.
•———. 2011b. “Review of Regulatory and Institutional Frameworks on Carbon Capture and Storage in Bosnia-Herzegovina, Kosovo and Serbia.” Washington, D.C.: World Bank.
•———. 2011c. “Review of Regulatory and Institutional Frameworks on Carbon Capture and Storage in Botswana, Mozambique and South Africa.” Washington, D.C.: World Bank.
•———. 2011d. CCS Financial Blending Model, available at http://go.worldbank.org/MJIX0TRAB0.
•WorleyParsons Schlumberger and the GCCSI (Global CCS Institute). 2011. “Economic Assessment of Carbon Capture and Storage Technologies 2011 Update.” GCCSI. Australia. http://www.globalccsinstitute.com/sites/default/files/eco-assess-ccs-tech-2010-4b.pdf
•WRI (World Resources Institute). 2006. “London Protocol Adopts Amendment Allowing for Sub-Seabed Carbon Dioxide Storage.” http://pdf.wri.org/css_06_12_08_london_protocol.pdf
•———. 2010a. “Issue Brief: Carbon Dioxide Capture and Storage and the UNFCCC: Recommendations for Addressing Technical Issues.” S. Forbes and M. S. Ziegler, World Resources Institute, Washington, D.C., November.
•———. 2010b. “Summary of Developed Country Fast-Start Climate Finance Pledges.” http://pdf.wri.org/climate_finance_pledges_2010-11-24.pdf
•Zakkour, P. D., and G. Cook. 2010. “CCS Roadmap for Industry: High Purity CO2 Sources.” September.: http://www.unido.org/fileadmin/user_media/Services/Energy_and_Climate_Change/Energy_Efficiency/CCS/High%20Purity_FINAL%20DRAFT.pdf (accessed May 2011).
•———. 2011. “Accessing Carbon Finance for CCS Projects in Emerging and Developing Economies.” In I. Havercroft, R. Macrory, and R. Stewart (eds.), Carbon Capture and Storage: Emerging Legal and Regulatory Issues. Oxford, U.K.: Hart Publishing; Wildy & Sons.
•Zakkour, Paul, Greg Cook, Anthea Carter, Charlotte Streck, and Thiago Chagas. 2011. “Assessment of Climate Finance Sources to Accelerate Carbon Capture and Storage Deployment in Developing Countries.” Report commissioned by the World Bank to a consortium comprising Carbon Counts Company Ltd. and Climate Focus. http://go.worldbank.org/MJIX0TRAB0
•Zhou, J., and F. Sha. 2010. “Innovative Financial Mechanism for Cost Sharing of Green Growth between Developed and Developing Countries: Targeting at Clean Technology.” Presentation to OECD Forum on Global Trade, Chengdu, October 14–15, 2010. http://www.oecd.org/dataoecd/51/55/46190303.pdf (accessed April 2011)
•Zurich Re Carbon Capture and Sequestration (CCS) Liability Insurance, and Geological Sequestration Financial Assurance. http://www.zurich.com/main/insight/climateinitiative/climateproducts.htm


The Energy andMining Sector Board
THE WORLD BANKGROUP
The World Bank1818 H Street N.W.Washington, D.C. 20433USA
E N E R G Y A N D M I N I N G S E C T O R B O A R D D I S C U S S I O N P A P E R
P A P E R N O . 2 2
A P R I L , 2 0 1 1
Design and Performance of Policy Instruments to Promote the Development of Renewable Energy:Emerging Experience in Selected Developing Countries
Gabriela Elizondo AzuelaLuiz Augusto Barroso
The World Bank, Washington, DC
The Energy andMining Sector Board
THE WORLD BANKGROUP