Carat Pulse News 2014 in Review
15
CARAT PULSE NEWS IN REVIEW 2014
-
Upload
carat-ireland -
Category
Documents
-
view
214 -
download
0
description
Â
Transcript of Carat Pulse News 2014 in Review

CARAT PULSE NEWS
IN REVIEW2014

CONTENTS
2. HEALTH & FITNESS4. CHARITABLE DONATIONS6. SHOPPING ONLINE8. IN-HOME DECISION MAKING10. SOCIAL NETWORKING12. SHOPPER BEHAVIOUR14. PAYMENT INSTRUMENTS16. BACK TO SCHOOL18. BUDGET EXPECTATIONS20. TV VIEWING 22. CHRISTMAS SPENDING PLANS

As with last year, we found that over 9 in 10 consumers claim to take some action in terms of staying healthy. Eating fresh, unprocessed food continues to be the most popular approach to health with 6 in 10 claiming to do so. While 54% exercise more regularly to try and stay healthy. An interesting shift in healthy eating choices from January 2013 is that less consumers are choosing low fat and low sugar versions of food this year as an approach to staying healthy.
Walking continues to be the most common exercise, highest amongst adults 55+. More of our panel are now going to gym rising from 17% last year to 19% this year. Swimming, jogging and cycling are still popular exercise choices. Only 12% admit to doing no exercise, down from 17% last year.
Irish people spend over 2 and 3/4 hours per week doing exercise. Males and adults aged 35+ spend the most time exercising in a typical week.
ACTIVE LIFESTYLE
CHOOSING LOW SUGAR
CHOOSING LOW FAT
2014 33%
40%
35%
48%
2014
2013
2013
When it comes to where consumers turn to learn about exercise equipment, the advise friends and family give comes out on top, but online resources are close behind.
FRIENDS AND FAMILY LARGE DEPARTMENT STORES32% 42%
27%
24%
23%
19%
35%
28%
14%
13%
RESEARCH BUY
SPORTS EQUIPMENT PURCHASE PATTERNS
ONLINE FITNESS/SPORT SITE LARGE DISCOUNT STORES
PHYSICAL GENERAL SPORT STORE PHYSICAL GENERAL SPORT STORE
ONLINE FITNESS/SPORT SITEONLINE SPECIALIST SPORT SITE
LARGE DEPARTMENT STORE ONLINE SPECIALIST SPORT SITE
Actual purchases are more likely to take place in-store, with the large department stores and discounters being preferred.
Comfort, price and fit are the most important factors considered by consumers when buying sports gear/equipment (most evident amongst females and young adults). While these very practical motivators head the table, it is worth noting that style is ranked by 69% as very or somewhat important and colour by 61%. This would suggest that once some of the basic functioning elements are in place, how the clothes, footwear or equipment looks is important.
PURCHASE CONSIDERATIONS
IMPORTANT FACTORS WHEN RESEARCHING / BUYING SPORTING GEAR / EQUIPMENT
RETURNING TO A TOPIC WE FIRST LOOKED AT IN JANUARY 2013, WE ASKED OUR PANEL WHAT THEY ARE PLANNING TO DO TO STAY HEALTHY.
DU
RA
BIL
ITY
FIT
PRIC
E
CO
MFO
RT
100
80
60
40
20
VERY SOMEWHAT UNIMPORTANT
HEALTH & FITNESS

CHARITABLE DONATIONSWith CSR high on the list of priorities for many organisations, we sought to understand consumer attitudes towards the brands operating in this space. Brands that associate with and support charities can see increased loyalty amongst existing customers and has some impact on brand switching highlighting the impact philanthropic policies can have on the bottom line.
BRANDS SUPPORTING CHARITIES
WHAT CAUSES GET PREFERENCE?
Causes aimed at supporting children get the most support from Irish donors, with 92% of those who donate to charity saying that they donate to charities aimed at helping children. Health, social causes, animals and help third world countries also get the support of Irish donors. Irish donors also show a stronger preference for supporting Irish based charities over International ones.
PREFER SUPPORTING LOCAL CHARITIES
DONATE DEPENDING ON THE CAUSE 48%
2%
50%
PREFER INTERNATIONAL CHARITIES
42%
35%
28%
14%
13%
CONSUMERS SHOW POSITIVE ATTITUDES TO BRANDS SUPPORTING CHARITIES
I THINK THAT ALL COMPANIESSHOULD SUPPORT CHARITIES
IT MEANS A LOT TO ME WHEN ABRAND OR COMPANY I LIKE ANDBUY SUPPORTS A CHARITY
IT MAKES NO DIFFERENCE TO ME IF A BRAND SUPPORTS A CHARITY OR NOT
I WILL CHANGE TO A BRAND ONLY IF THEY SUPPORT A CHARITY THATMATTERS TO ME
I WILL CHANGE TO A BRAND ORCOMPANY IF THEY ARE SUPPORTINGANY CHARITY
I DON’T LIKE IT WHEN BRANDS ORCOMPANIES SUPPORT CHARITIES
61%
45%
39%
25%
23%
11%
THE IMPACT OF NEGATIVE NEWS ON CHARITABLE DONATIONS
THE RECENT NEWS MAKES ME TRUST CHARITIES LESS
I WILL STILL DONATE, BUT NOW LOOK A LITTLE CLOSER AT THE CREDENTIALS
I WOULD THINK TWICE BEFORE DONATING AGAIN
I AM LESS LIKELY TO DONATE MY TIME AND MONEY NOW AND WILLWAIT UNTIL SOME FORM OF CONTROL IS PUT IN PLACE
I’VE CANCELLED CHARITY SUBSCRIPTIONS BECAUSE OF THE RECENT NEWS
THE RECENT NEWS HAS HAD NO EFFECT ON ME
91%
83%
83%
66%
22%
20%
With some negative stories currently in the news about charities across the country and salary top-ups, we have focused this month’s Pulse on understanding how the Irish public are now thinking about charitable donations. Recent scandals have had a significant impact on both attitudes and behaviour.
9 OUT OF 10 CHARITY DONORS NO LONGER COMPLETELY TRUST CHARITIES.
22% OF PEOPLE HAVE CANCELLED THEIR CHARITY SUBSCRIPTIONS AND 66% ARE LESS LIKELY TO DONATE TIME AND MONEY.

SHOPPING ONLINE
While computers (desktops and laptops) are still the most commonly used devices for online shopping, the popularity of mobile devices continues to grow. Tablets have seen a significant increase in use for online shopping since we first started tracking this trend 2 years ago. 26% of people who shop online have made a purchase from a tablet compared with 16% last year, and 11% in 2012. While overall, 54% of online shoppers have used a tablet or phone to purchase online, we see that this rises to 80% for 18-34s.
WHAT ARE PEOPLE BUYING?The purchasing patterns across different products categories have broadly remained the same on the previously two years. The most notable change is that purchasing via tablet has doubled for clothing/shoes as well as holiday and event tickets.
ONLINE SHOPPING BY DEVICE BY AGE
28% OF ONLINE SHOPPERS HAVE USED THEIR SMARTPHONES TO SHOP ONLINE
AIRLINE TICKETS 69%
HOLIDAY PACKAGES 59%
EVENT TICKETS 52%
CDS/DVDS, EBOOKS 10%
CLOTHING/SHOES 10%
HOLIDAY PACKAGES 8%
MUSIC 11%
EVENT TICKETS 8%
CLOTHING/SHOES 8%
Beyond the ‘must have’ factors of trust, price and presentation which have been high on the requirements for online purchasing since 2012, a simple sales process and an easy returns policy are also very important.
Personal recommendations and reviews are by far the most important drivers for online shopping. Media channels are however performing well for influencing online shopping.
PERCEIVED BENEFITS OF SHOPPING ONLINE
MEDIA CHANNELS
70%
67%
62%
57%
57%
56%
56%
52%
50%
47%
35%
25%
TV ADS
MAGAZINE ADS
NEWSPAPER ADS
RADIO ADS
ONLINE AD
LINK IN A SEARCH ENGINE
SOCIAL NETWORK
LEAFLET RECEIVED IN THE POST
POSTER / BILLBOARD
TEXT FROM A COMPANY
QR CODE
INFLUENCERS
LAPTOP DESKTOP SMARTPHONETABLET
ONLINE SHOPPING BY DEVICE
95% 28% 26%93% 22% 16%
2013 2014
COMPUTER SMART PHONE TABLET
86% 79% 67%40% 55% 55%47% 26% 12%33% 26% 18%
18–34 35–54 55+

IN-HOME DECISION MAKING
We looked at how decisions within the categories of Internet, TV, Insurance,Banking, Car, Utilities, Decor/DIY, Meal Planning and Food choices are made. Banking decisions is the only category that is evenly weighted between the genders, with 37% of females and 38% of males claiming to be the sole decision maker and
SOLE DECISION MAKINGWhen it comes to joint decision making, men and women have significantly different perceptions of their respective involvement in decisions. This is most apparent in decisions relating to meals and foods, where men feel that they are more involved then women believe them to be.
Men claim to make the decisions at home when it comes to internet, insurance, TV, banking, utilities and car. Women, on the other hand, claim to make the call when it comes to food choices and menus as well as décor and DIY.
Children’s influence in family purchase decisions varies by product/service category. The strongest influence is seen across food categories while finance and service purchase decisions attract the least input. 2014 did, however, see an increase in children’s influence on holiday destinations as well as sporting equipment/clothing purchases. In an age of children as digital natives, it’s worth noting the increase in influence children have on TV/broadband/internet provider.
JOINT DECISION MAKING
JOINT DECISION MAKING
CHILDREN’S INFLUENCE ON PURCHASE DECISIONS
GENDER ROLES WITHIN FAMILY HOMES SKEWS ALONG TRADITIONAL LINES
INTERNET
INSURANCE
TV
BANKING
UTILITIES
CAR
FOOD CHOICES
FOOD MENUS
DÉCOR / DIY
FOOD CHOICES
FAMILY MENUS
TV
INTERNET
INSURANCE
CAR
DÉCOR / DIY
UTILITIES
BANKING
CEREALS
SNACKS AND TREATS
CHEESE AND YOGHURT
FOOD FOR MEALS
SPORTS CLOTHING AND EQUIPMENT
HOLIDAY DESTINATION
GENERAL GROCERY SHOPPING
TOOTHPASTE AND TOOTHBRUSH
COMPUTER, TABLET, PHONE
TV SERVICE PROVIDER
MALE FEMALE
GREATLYGREATLY SOMEWHATSOMEWHAT NO INFLUENCEDIFFERENCE
51%
45%
43%
38%
37%
34%
22%
15%
10%
56%
57%
48%
44%
50%
59%
62%
58%
57%
32%
26%
23%
16%
24%
15%
10%
15%
21%
13%
23%
28%
16%
37%
22%
15%
64%
55%
18%
31%
36%
65%
60%
61%
70%
72%
67%
55%
51%
55%
49%
56%
46%
55%
52%
44%
35%
29%
25%
21%
17%
16%
11%
11%
10%
9%
2%
17%
19%
28%
28%
30%
30%
38%
41%
44%
58%
CHILDREN’S INFLUENCE ON PURCHASE DECISION

SOCIAL NETWORKINGMore time is being spent on social networks than a year ago. The time spent across every site has increased, with the exceptionof LinkedIn. While niche sites such as Vine,Snapchat, Tinder and Tumblr have a smaller base of users, those who do use them tendto spend a significant amount of time on each of these sites during a typical week. While the majority of people follow
a brand’s page to take part in a competition, genuine interest in new content has doubled since last year. This shows pay off for the many brands out there investing time and resource in creating engaging social media content.
TIME SPENT ON SOCIAL NETWORKS BY DEVICE
TIME SPENT ON SOCIAL NETWORKS
65% OF PEOPLE NOW FOLLOWING BRANDS ON SOCIAL MEDIA
65% 56%2014 2013
37%
20%
13%
30%
127
12746% HAVE AN ACCOUNT
GOOGLE +
11843% HAVE AN ACCOUNT
33784% HAVE AN ACCOUNT
SNAPCHAT
17814% HAVE AN ACCOUNT
TUMBLR
1748% HAVE AN ACCOUNT
6141% HAVE AN ACCOUNT
16836% HAVE AN ACCOUNT
116
16% 60%8% 63%2% 3%
CUSTOMER SERVICE
6% 6%4% 5%
FRIENDSRECOMMENDATION
WANT TO KNOW MORE ABOUT BRAND
12% 15%
KEEP UP TO DATEW/ BRAND OFFERS
FIND PAGE CONTENT INTERESTING
THEY WERE RUNNING A COMPETITION
22% HAVE AN ACCOUNT
43% OF SOCIAL NETWORKING IN IRELAND NOW TAKES PLACE VIA SMART DEVICE
94% of Irish people have at least one social media profile, up from 91% last year and 85% in 2012. Of all activity, 30% of social networking happens on smartphones and 13% on tablets. For females and young adults, accessing social networks via smartdevice is on par with access via laptop. Mature adults are most likely to access social media via tablet, highlighting a preference for larger, easy to read screens. While the use of mainstream social networks continues to increase, there has been a decrease in posting activities across these platforms: Facebook, LinkedIn and Twitter.

SHOPPER BEHAVIOUR
We have been tracking shopper behaviour through our Pulse study for 4 years now and there is some indication that shopperbehaviour is becoming a little more stabilised. We measure behaviour across 14 different FMCG categories and while each category is slightly different, a significant change overall is the lessening impact of price promotions. While we see that switching to private label has increased slightly, buying other brands if onsale (or promotions) has decreased. Private Label purchasing is now nearly equal to buying the same brand and whilst a smallpercentage of those are buying PL for price alone, the vast majority are buying PL saying that they are happy with their choice.
In previous years we were seeing signs of shoppers spending more time in storecomparing prices, but supporting the more settled behaviour seen in the previous section, we are also seeing signs of shoppers spending less time in store compared to previous years.
Main shopper definition still varies dramatically by gender with 75% of women claiming to be the main shopper and 43% of men claiming the same. 2014, however is the first year that we have seen the male main shopper down from 46% to 43%.
On-shelf advertising and promotional displays at the end of aisles continue to be the most effective types of in-store advertising. We’ve seen the biggest decline at shelf with likelihood to notice down by 6%.
TIME IN-STORE 43% OF MEN CLAIM TO BE RESPONSIBLE FOR GROCERY SHOPPING
IN-STORE ADVERTISING EFFECTIVENESS
BEHAVIOUR SETTLING?
127
76%
74%
29%
30%
79%
75%
37%
29%
73%
71%
42%
31%LESS TIME SHOPPINGAS I JUST GET WHAT I NEED
END OF AISLE DISPLAYS
ADVERTISING AT SHELF FREE SAMPLES/TASTING IN THESHOP ADVERTISING ON THE PRODUCT POSTERS WHEN YOU ENTER THESHOP
66% 61%
53% 43%
39%
TIME IN-STOREUNCHANGED
MORE TIMESHOPPING FOR BETTER PRICES
MORE TIMECOMPARINGPRICES/SPECIALOFFERS
2012 2013 2014
2011 2012 2013 2014
47% 47% 44% 48%
32% 26% 29% 28%
20% 25%
21% 26%
BUY THE SAME BRAND
WILL BUY OTHER BRAND IF ON SALE
SWITCHED TO PL
MAIN JOINT NONE
TOP 3 IN-STORE CHANNELS LIKELY TO BE NOTICED 2014
WOMEN
MEN 43%
75% 21%
47%
4%
10%

PAYMENT INSTRUMENTS
The mounting pressure that most Irish consumers face every day with managing their finances, together with time constraints,means that how we choose to pay our bills is an important part of managing personal finance. We looked at 11 different bill paying categories from car insurance to mobile phone payments to see which financial instruments Irish consumers are using. Direct Debit is the most popular payment option used for meeting household and personal bills. On average (across the 11 categories surveyed) 41% claimed to pay their bills using Direct Debit, but this differed dramatically from sector to sector. At the top end, 63% paid their life Insurance premiums using Direct Debit, while only 26% paid for their car insurance this way.
When all online options (including direct debit, card payments and bank transfers) are considered, compared to offline methods (cheques, in branch etc.), the vast majority of bills are now paid online. See chart below.
When we asked our panel for the mainreasons why they choose to pay by DirectDebit and the main reasons why they don’t;being current on payments was the mainreason for using Direct Debit.
DIRECT DEBIT – FOR AND AGAINST
59% OF IRISH CONSUMERS DON’T PAY THEIR BILLS BY DIRECT DEBIT REASONS FOR CHOOSING DD
REASONS FOR NOT CHOOSING DD
Up to date on my bills
Lose control
It is easy
High service charges
27%
20%
42%
34%
90% 89% 81% 86% 81% 81% 89% 94% 93% 64%10% 14% 11% 16% 13% 12% 9% 7% 14% 19%
CARINSURANCE
HOMEINSURANCE
HEALTHINSURANCE
ELECTRICITY GAS MOBILE PREPAY
LIFEINSURANCE
MOBILE BILL PAY
CREDIT CARD BILL
RENT
BILLS PAID WITH ON AND OFF LINE METHODS
PAYING FOR SUMMER HOLIDAYS
HOLIDAY FINANCING
TOTAL OFFLINE TOTAL ONLINE
31% of our panel did not go on holiday due to lack of money. The vast majority of these were in the 35-54 age group. Of the 60% who did take a holiday this summer, nearly half financed this through a credit card or a loan, while 37% had saved money particularly for their holiday, with younger cohorts (18-34 year olds) more likely to do so (43%).
CREDIT CARD
17%MONEY THAT
WAS SAVED
37%
LOAN
3%
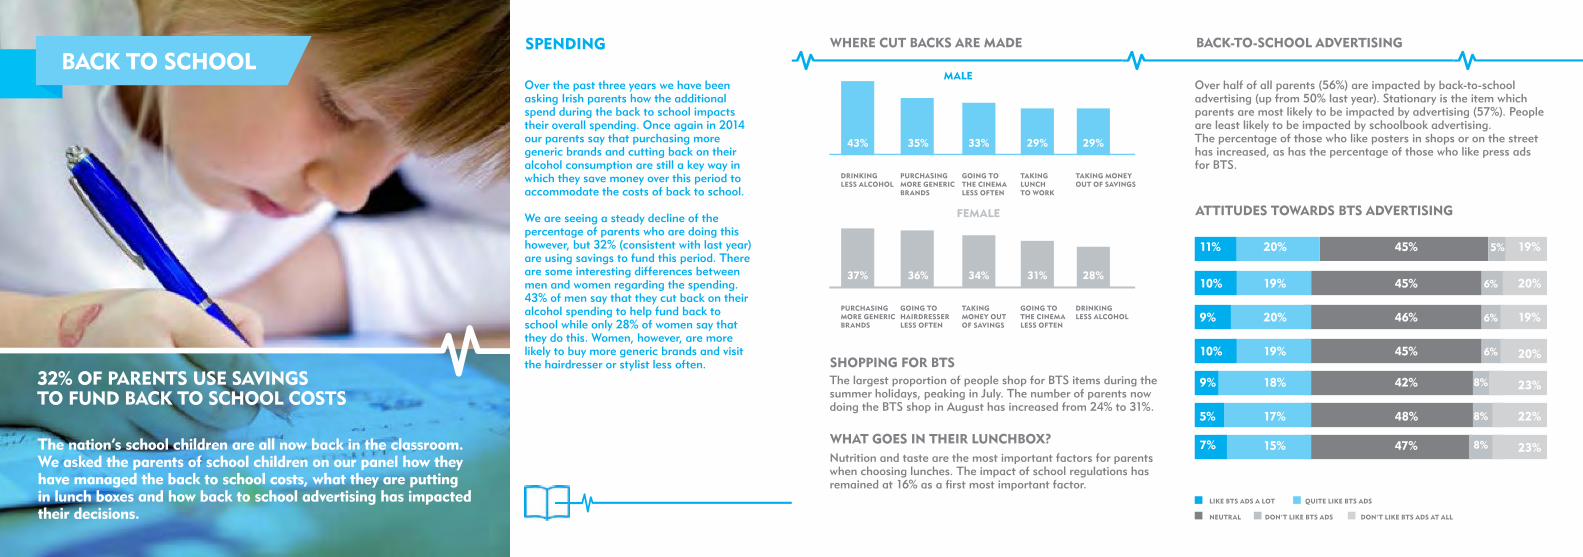
BACK TO SCHOOL
The nation’s school children are all now back in the classroom. We asked the parents of school children on our panel how they have managed the back to school costs, what they are putting in lunch boxes and how back to school advertising has impacted their decisions.
SPENDING
32% OF PARENTS USE SAVINGS TO FUND BACK TO SCHOOL COSTS
127
WHERE CUT BACKS ARE MADE BACK-TO-SCHOOL ADVERTISING
SHOPPING FOR BTS
ATTITUDES TOWARDS BTS ADVERTISING
WHAT GOES IN THEIR LUNCHBOX?
MALE Over the past three years we have been asking Irish parents how the additional spend during the back to school impacts their overall spending. Once again in 2014 our parents say that purchasing more generic brands and cutting back on their alcohol consumption are still a key way in which they save money over this period to accommodate the costs of back to school. We are seeing a steady decline of thepercentage of parents who are doing thishowever, but 32% (consistent with last year)are using savings to fund this period. There are some interesting differences between men and women regarding the spending. 43% of men say that they cut back on their alcohol spending to help fund back to school while only 28% of women say that they do this. Women, however, are more likely to buy more generic brands and visit the hairdresser or stylist less often.
FEMALE
43%
DRINKING LESS ALCOHOL
37%
PURCHASINGMORE GENERICBRANDS
35%
PURCHASINGMORE GENERICBRANDS
36%
GOING TOHAIRDRESSERLESS OFTEN
33%
GOING TO THE CINEMA LESS OFTEN
34%
TAKINGMONEY OUT OF SAVINGS
29%
TAKING LUNCHTO WORK
31%
GOING TO THE CINEMA LESS OFTEN
29%
TAKING MONEYOUT OF SAVINGS
28%
DRINKING LESS ALCOHOL
The largest proportion of people shop for BTS items during the summer holidays, peaking in July. The number of parents now doing the BTS shop in August has increased from 24% to 31%.
Over half of all parents (56%) are impacted by back-to-school advertising (up from 50% last year). Stationary is the item which parents are most likely to be impacted by advertising (57%). People are least likely to be impacted by schoolbook advertising.The percentage of those who like posters in shops or on the street has increased, as has the percentage of those who like press ads for BTS.
Nutrition and taste are the most important factors for parents when choosing lunches. The impact of school regulations hasremained at 16% as a first most important factor.
11%
10%
9%
10%
9%
5%
7%
9%
20%
19%
20%
19%
18%
17%
15%
45%
45%
46%
45%
42%
48%
47%
19%
20%
19%
20%
23%
22%
23%
5%
6%
6%
6%
8%
8%
8%
LIKE BTS ADS A LOT QUITE LIKE BTS ADS
NEUTRAL DON’T LIKE BTS ADS DON’T LIKE BTS ADS AT ALL

BUDGET EXPECTATIONS
The KBC Ireland/ESRI Consumer Sentiment Index increased in September to 92.8, returning to levels not seen since January 2007. This positive sentiment however, does not seem to be translating into the 2015 budget expectations. We spoke to our panel about what they were expecting from the 2015 Budget, both personally and for the country as a whole. 57% felt that a conservative budget was best for Ireland overall, with that number increasing to 59% of all women and also highest amongst 35-54 year olds. When asked about their expectations of the budget on their personal financial situation, only 7% expect the budget to improve their own financial situation and a huge 44% expecting the budget to leave them worse off.
NEARLY 6 IN 10 IRISH ADULTS WOULD PREFER A CONSERVATIVE BUDGET
127
EXPECTATIONS OF YOUR OWN FINANCIAL SITUATION POST BUDGET
SPENDING IF BUDGET IMPROVED NET INCOME CHANNELS
WHERE PEOPLE WILL GET THEIR BUDGET NEWS
WHERE WILL PEOPLE GO TO GET THEIR BUDGET NEWS ON TUESDAY, 14 OCTOBER?
BETTER AFTER THE BUDGET
IN DEPTHANALYSIS
NOT MUCH WILL CHANGE
TOP LEVEL NEWS
WORSE AFTER THE BUDGET
We asked our panel if the budget did indeed leave them better off how they would spend this extra money. Savings topped the chart at 24%, suggesting a real insecurity about Ireland’s future. Television, newspapers and radio, both online and offline, dominate
the channels that Irish people will go to on Tuesday to learn about the budget. The role of digital channels is equal for both top level news and in-depth analysis with nearly half of the media channels selected being online.57% 43%
The government should continue with a more conservative approach
The economy is stable enough towarrant a generous budget approach
7% 49% 44%
I WILL SAVE THE MONEY
PAYING FUTURE HOUSEHOLD BILLS PAYING OFF OVERDUE HOME BILLS HOME IMPROVEMENT A HOLIDAY
OTHER
CLOTHES FOR ME / MY FAMILY
A NEW CAR
HIGHER GROCERY SPEND
ENTERTAINMENT (EG. MOVIES)
CHRISTMAS PRESENTS
24% 17%
15% 13%
10%
6%
4%
4%
3%
3%
1%
25%
26%
18%
23%
25%
14%
10%
13%
11%
10%
23%
4%
4%
2%
3%
2%
2%
2%
1%
1%
5%
1%
0%
TV
NEWSPAPERWEBSITES
RADIO
TV STATIONWEBSITES
NATIONALNEWSPAPERS
OTHER NEWS WEBSITES
FORUMS (IE BOARDS.IE)
LOCAL / FREENEWSPAPERS
SOCIALNETWORKS
FINANCIALINSTITUTION WEBSITES(IE: KPMG)

22% 25% 29% 23% 17%
TV VIEWING
Appointment to view TV series were the topic we wanted to learn more about this year given an Autumn schedule full of ‘must watch’series like Love/Hate. TV, whether it’s watching live, recorded or oncatch-up, dominates consumption of series with 88% of Irish adults viewing in this way, skewing older with those 34-55+. Those whorecord TV (31%) are more likely to be women and in the mid age bracket. Downloading or streaming TV series online is dominated by males and those aged 18-34. Screen size matters when it comes to how people want to watch online content. Television screens are the way 63% of adults mainly watch online content. This is followed by laptops (22%), tablets (8%), desktop (5%) and phone (2%). We also asked our panel the way they would prefer to watch TV content. Almost half of people currently viewing content via a laptop, tablet, desktop or phone say this is not their preferred way of viewing. 63% of adults watch online content via a television, but 83% state this would be their preferred way of viewing.
LIVE TV DOMINATES VIEWING OF MUST-WATCH SERIES
127
WATCHING ONLINE CONTENT ON TV
27% PLAN TO WATCH FINAL LOVE / HATE EPISODE
We asked consumers who have watchedinternet content on their TVs, how they goabout doing this. Smart TVs and gamingstations are most used.
It’s one of the biggest and most successfulseries RTÉ have ever had. 27% of adults(932,000) say they will definitely watch the last episode live on TV. We know that976,000 adults watched the first episodelive, and while these numbers dropped off a little for the following episodes, it looks like the final episode will capture a similaraudience to the first episode.
16%SMART TV
6%APPLE TV
11%GAME
STATION
7%GOOGLE
CHROMECAST
Netflix has become a destination for appointment to view series, with top quality programming such as “Orange is the New Black”. Our research shows that 24% of Irish Adults (over 18 years old) have Netflix in their households. If we take it that there are 1,800,000 households and extrapolate this data into a household subscription, we can estimate that approximately 340,000 households (19%) have a Netflix account. An additional one in ten consumers say they plan on taking out a subscription in the next 12 months. 7% say they used to have a subscription, but no longer do. The percentage of those who say they have no interest in subscribing to Netflix (60%) peaks amongst those aged 55+.
HAVE A NETFLIX SUBSCRIPTION
Males Females 18-34 25-54 55+
19% OF IRISH HOUSEHOLDS HAVE A NETFLIX ACCOUNT

CHRISTMAS SPENDING PLANS
Irish adults are going online in pursuit of Christmas presents with 82% planning to do some of their shopping online this Christmas,up from 73% year on year. Young adults are most likely to shop online for Christmas presents. However, the vast majority (73%) of festive shopping is still likely to take place in actual stores.
82% TO SHOP ONLINE THIS CHRISTMAS
127
ONLINE SPENDING
There is an increase across all pricecategories since 2013. 2013 saw a rise in the percentage of people purchasing low price items (items less than €10) online from 48% to 52%. This has dropped back down this year to 43%. The average maximum spent has grown from €128 to €159. With a less profitable than expected Autumn due to mild weather, this will come as good news to ecommerce sites.
On average, males buy more expensiveChristmas gifts online than their femalecounterparts. Of all age cohorts, those age 18- 34 have spent the most money on average on their most expensive Christmas gift purchased online.
CHANNELS DRIVING TO eCOMMERCE SITES
Online searches (for products and retailers) as well as word of mouth are the most effective channels for driving traffic to retailers’ sites. Of the advertising channels, TV ads featuring a website, followed by email campaigns and social ads appear to be most effective.
€21 €159 €186 €141 €171 €164 €131€21€23 €19 €19€23
AVERAGE MINIMUM SPEND ONLINE
REASONS FOR SHOPPING ONLINE
AVERAGE MAXIMUM SPEND ONLINE
ALL Males Females 18-34 35-54 55+ ALL Males Females 18-34 35-54 55+
THINGS ARE CHEAPER ONLINE
I CAN SHOP AT ANY TIME
IT SAVES ME TIME
EASIER TO FIND WHAT I WANT
I CAN ONLY GET THE ITEM / RANGE ONLINE
ABLE TO READ REVIES / RECOMMENDATIONS
WIDE RANGE OF PAYMENT OPTIONS
EASY RETURN POLICY
26%
16%
15%
13%
12%
2%
2%
1%
REASONS FOR SHOPPING ONLINE“Being cheaper online” and “convenience” continue to be the main driving forces behindonline purchases over in-store shopping. Lowerprices is the main reason people choose toshop online – 26% of adults shop online forthis reason peaking amongst males and 35-54.‘Anytime shopping’ is the second mostimportant factor for people when shoppingonline, most evident amongst females and55+. Saving time is third on the list and ismore apparent for females and young adults.

Carat is the world’s leading independent media planning & buying specialist and the market-leader in digital and non-traditional media solutions.
Owned by global media group Dentsu Aegis Network, the Carat network is more than 6,500 people in 140 countries worldwide, with a team of just over 50 based in Dublin.
Carat defined the sector when we were established as the world’s first media independent in 1968. We are now Europe’s largest media network, a position we have held for more than 15 years. Today, advances in digital technology and changing consumer behaviour have created an era of unprecedented complexity and opportunity for clients. Media is now an ecosystem that includes bought, owned and earned communications.
In this new era, Carat is redefining the role of a media agency. Our people understand how media can drive business value better than anyone else. We move beyond the provision of media savings and exploit the new era of media to deliver greater business value to our clients.
CARAT.REDEFINING MEDIA.

FOR MORE INFORMATIONGET IN TOUCH
Dael Wood16a The Crescent | Monkstown | DublinT: +353 1 2712164E: [email protected] | carat.ie