CapitalLink International Shipping & Offshore Forum
26
World‐Class Shipping, Leading‐Edge Expertise Danaos Corporation | March 2015
-
Upload
danaoscorp -
Category
Investor Relations
-
view
358 -
download
1
Transcript of CapitalLink International Shipping & Offshore Forum

World‐Class Shipping, Leading‐Edge ExpertiseDanaos Corporation | March 2015

DisclosuresThis presentation contains certain statements that may be deemed to be “forward‐looking statements” within the meaning of the Securities Exchange Act of 1934. All statements, other than statements of historical facts, that address activities, events or developments that the Company expects, projects, believes or anticipates will or may occur in the future, including, without limitation, the outlook for fleet utilization and shipping rates, general industry conditions including bidding activity, future operating results of the Company’s vessels, future operating revenues and cash flows, capital expenditures, asset sales, expansion and growth opportunities, bank borrowings, financing activities and other such matters, are forward‐looking statements. Although the Company believes that its expectations stated in this presentation are based on reasonable assumptions, actual results may differ from those projected in the forward‐looking statements. Important factors that could cause actual results to differ materially from those discussed in the forward‐looking statements include the strength of world economies, general market conditions, including charter rates and vessel values, the ability of counterparties to perform under existing charters, changes in operating expenses, ability to obtain financing and comply with covenants in financing arrangements, actions taken by regulatory authorities, potential liability from litigation and international political conditions. Danaos Corporation is listed in the New York Stock Exchange under the ticker symbol “DAC”. Before you invest, you should also read the documents Danaos Corporation has filed with the SEC for more complete information about the company. You may get these documents for free by visiting EDGAR on the SEC Website at www.sec.gov or via www.danaos.com
Readers of this presentation should review our Annual Report on Form 20‐F filed with the SEC on March 10, 2015, including the section entitled “Key Information – Risk Factors”, and our other filings with the SEC for a discussion of factors and circumstances that could affect our future financial results and our ability to realize the expectations stated herein.
EBITDA and Adjusted EBITDA may be included in our presentations. Adjusted EBITDA represents net income plus interest and finance costs, depreciation, amortization and income taxes, if any, plus stock‐based compensation expense and other non‐cash or one‐off items. EBITDA and Adjusted EBITDA are presented because they are used by certain investors to measure a company’s financial performance. EBITDA and Adjusted EBITDA are “non‐GAAP financial measure” and should not be considered a substitute for net income, cash flow from operating activities and other operations or cash flow statement data prepared in accordance with accounting principles generally accepted in the United States or as a measure of profitability or liquidity.
In certain instances data derived from Marsoft reports is utilized in this presentation. Marsoft collects market data from a number of sources and exercises its judgment in preparing its estimates and analysis. Marsoft’s estimates may not match information from other sources. Actual future developments may deviate from the scenarios shown here. Marsoft is in no way liable for direct, indirect, consequential, or general damages arising from the use or misuse of the information and analysis presented here.
Business Overview
1
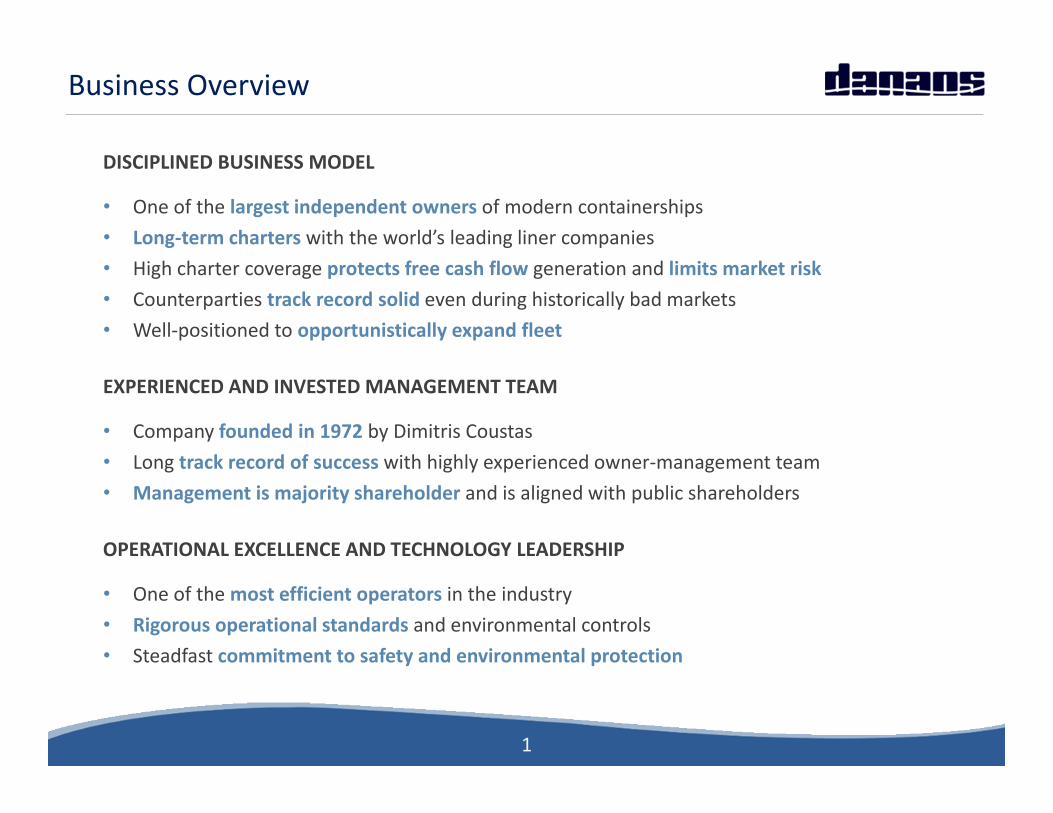
DISCIPLINED BUSINESS MODEL
• One of the largest independent owners of modern containerships• Long‐term charters with the world’s leading liner companies• High charter coverage protects free cash flow generation and limits market risk• Counterparties track record solid even during historically bad markets• Well‐positioned to opportunistically expand fleet
EXPERIENCED AND INVESTED MANAGEMENT TEAM
• Company founded in 1972 by Dimitris Coustas• Long track record of success with highly experienced owner‐management team• Management is majority shareholder and is aligned with public shareholders
OPERATIONAL EXCELLENCE AND TECHNOLOGY LEADERSHIP
• One of the most efficient operators in the industry• Rigorous operational standards and environmental controls• Steadfast commitment to safety and environmental protection

Recent Operational and Financial Highlights
2
FLEET MANAGEMENT
• Newbuilding program successfully completed in 2012
• Nine older vessels sold in 2013 and five in 2014
• Tactical purchases of newer vessels: four 2,500‐3,500 TEU geared vessels in 2013 and two 6,400 TEU vessels in 2014
• Average fleet age of 6.4 years (TEU‐weighted)
FINANCIAL HIGHLIGHTS
• Contracted revenue of $3.7 billion through long‐term time charters with diverse portfolio of charters
• Significant free cash flow per share through 2018
• Expiration of interest rate swaps benefits net income and free cash flow
• Rapidly deleveraging through aggressive debt payments
• De‐risked capital structure with no refinancing risk through 2018

Fleet Profile
3
7 X 8,500 TEU
2 X 9,600 TEU
3 X 10,100 TEU
5 X 13,100 TEU
56 Container Vessels ranging from 2,200 TEU to 13,100 TEU
K50K
100K150K200K250K300K350K400K
2005 2006 2007 2008 2009 2010 2011 2012 2013 2014
CAPA
CITY (T
EUS)
Capacity Additions
12 X 4,300 TEU
1 X 4,650 TEU
2 X 6,400 TEU
7 X 6,500 TEU
2 X 2,500 TEU
6 X 3,400 TEU
8 X 2,200 TEU
1 X 2,600 TEU
Fleet Capacity by Year

Young Fleet with Long‐term Charters
4
8.5
7.36.6 6.4 6.4
2010 2011 2012 2013 2014
Fleet age in years (weighted by TEU)
25%Reduction in Fleet Age Over the last 5 years
8.09.7 9.8 9.7
8.98.0
2010 2011 2012 2013 2014
Charter Length in years (weighted by aggregate contracted charter hire)
Average length of current charters in years

Leading Position with 56 Vessel Fleet
5
0
200,000
400,000
600,000
800,000
Seaspan
Costam
are
Shoe
iKise
n
ZodiacM'time
Danaos Corp.
Techno
mar
Syne
rgyM
arine
PeterDoh
le
C‐PO
ffen
Blue
Star H
olding
Rickmers
Nordd
eutsche
NSBN'elbe
Eastern Pacific Shp
g
Schu
lteGrp
N.S. Lem
os
HansaT'hand
NSCSchiff.
Fred
riksen Group
MPC
Capita
l
CAPACITY (T
EUMILLIONS)
Current Capacity Capacity on Order
A market leader among the large charter owners
KG market retraction benefits independent charter owners like Danaos
Independent Owners KGS

Diverse Charters with Strong Counterparties
6
28% 27% 18%8%11%
5%
$3.7 billion contracted revenue from long‐term fixed rate diversified charters
FY2014 Revenues per Charterer
3%
Other

Experienced Senior Management and Board
7
Management
Dr. John Coustas Chairman & Chief Executive Officer – Director
Iraklis Prokopakis Senior Vice President & Chief Operating Officer ‐ Director
Evangelos Chatzis Chief Financial Officer
Dimitris Vastarouchas Deputy Chief Operating Officer
Non‐Executive Board Members
Myles Itkin Chairman of the Audit Committee ‐ Chairman of the Nominating and Governance Committee ‐ Director
Miklós Konkoly‐Thege Chairman of the Compensation Committee – Director
Robert Mundell Director
William Repko Director
George Economou Director

Industry Overview

8
Demand / Supply Fundamentals
Source: Alphaliner
12.4%
5.8%
(8.5%)
14.2%
8.4%
4.8%
3.8% 5.
4%
5.2% 5.5%
13.8%
13.2%
5.5%
9.1%
7.9%
6.0%
5.8% 6.3% 7.
9%
5.2%
2007 2008 2009 2010 2011 2012 2013 2014 2015F 2016F
ANNUA
L GRO
WTH
Global Throughput Growth Global Capacity Growth

9
Healthy Orderbook
0%
10%
20%
30%
40%
50%
60%
70%
0.00
0.20
0.40
0.60
0.80
1.00
1.20
1.40
1.60
1.80
J‐00 J‐03 J‐06 J‐09 J‐10 J‐11 O‐11 J‐12 D‐12 M‐13 J‐13 S‐13 D‐13 A‐14 J‐14 O‐14 J‐15
Orderbo
ok‐to‐Fleet R
atio
Fleet &
Orderbo
ok(TEU
Millions)
Fleet Orderbook Orderbook‐to‐Fleet Ratio
Source: Clarkson Research Services

Financial Overview
10
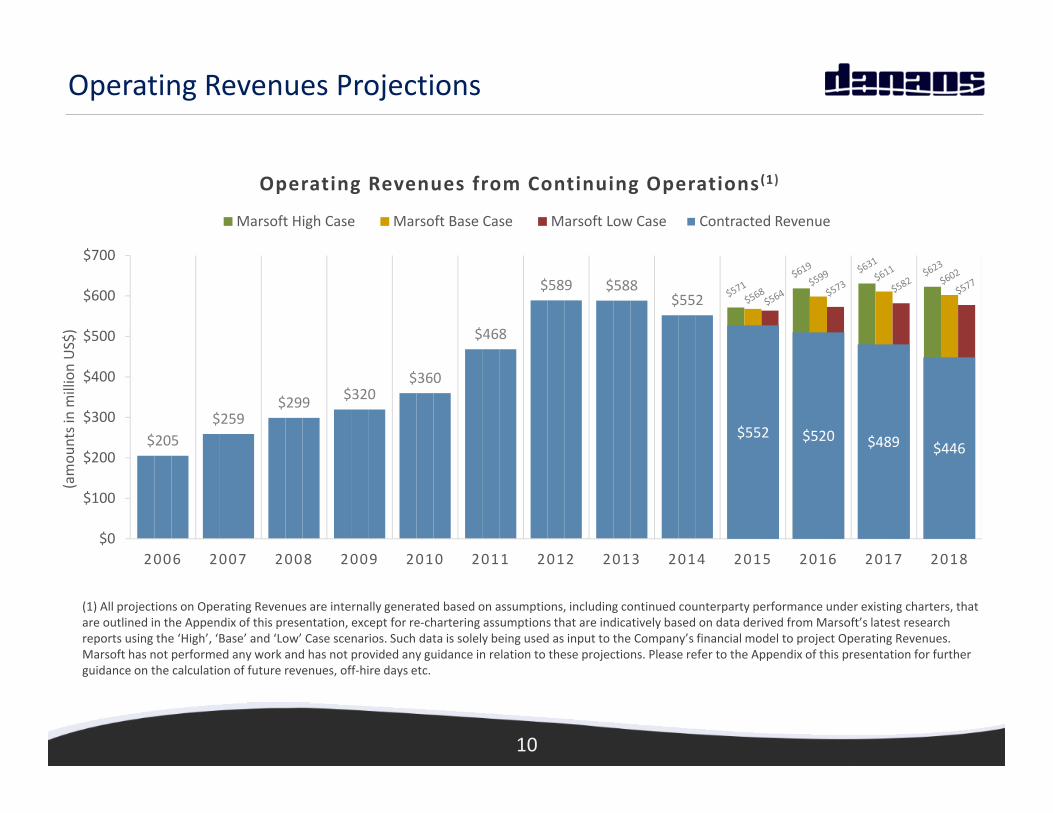
$205$259
$299 $320$360
$468
$589 $588$552
$0
$100
$200
$300
$400
$500
$600
$700
2006 2007 2008 2009 2010 2011 2012 2013 2014 2015 2016 2017 2018
Operating Revenues from Continuing Operations(1)
Marsoft High Case Marsoft Base Case Marsoft Low Case
$552 $520 $489 $446
(1) All projections on Operating Revenues are internally generated based on assumptions, including continued counterparty performance under existing charters, that are outlined in the Appendix of this presentation, except for re‐chartering assumptions that are indicatively based on data derived from Marsoft’s latest research reports using the ‘High’, ‘Base’ and ‘Low’ Case scenarios. Such data is solely being used as input to the Company’s financial model to project Operating Revenues. Marsoft has not performed any work and has not provided any guidance in relation to these projections. Please refer to the Appendix of this presentation for further guidance on the calculation of future revenues, off‐hire days etc.
(amou
nts in million US$)
Contracted Revenue
Operating Revenues Projections
11
Operating Revenue Sensitivity Analysis
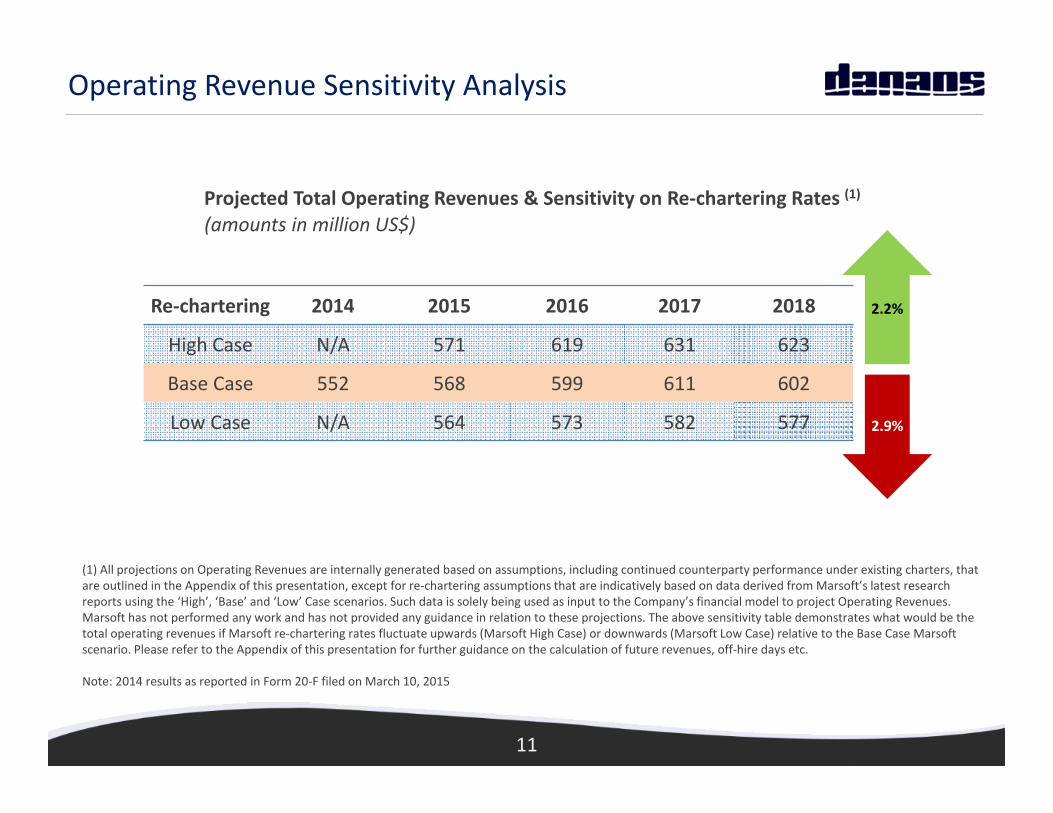
2.2%
2.9%
Re‐chartering 2014 2015 2016 2017 2018
High Case N/A 571 619 631 623
Base Case 552 568 599 611 602
Low Case N/A 564 573 582 577
Projected Total Operating Revenues & Sensitivity on Re‐chartering Rates (1)
(1) All projections on Operating Revenues are internally generated based on assumptions, including continued counterparty performance under existing charters, that are outlined in the Appendix of this presentation, except for re‐chartering assumptions that are indicatively based on data derived from Marsoft’s latest research reports using the ‘High’, ‘Base’ and ‘Low’ Case scenarios. Such data is solely being used as input to the Company’s financial model to project Operating Revenues. Marsoft has not performed any work and has not provided any guidance in relation to these projections. The above sensitivity table demonstrates what would be the total operating revenues if Marsoft re‐chartering rates fluctuate upwards (Marsoft High Case) or downwards (Marsoft Low Case) relative to the Base Case Marsoft scenario. Please refer to the Appendix of this presentation for further guidance on the calculation of future revenues, off‐hire days etc.
Note: 2014 results as reported in Form 20‐F filed on March 10, 2015
(amounts in million US$)

12
EBITDA Projections
$140$174 $189 $204
$244
$319
$432 $434$404
$0
$50
$100
$150
$200
$250
$300
$350
$400
$450
$500
2006 2007 2008 2009 2010 2011 2012 2013 2014 2015 2016 2017 2018
Adjusted EBITDA from Continuing Operations (1)
Marsoft High Case Marsoft Base Case Marsoft Low Case
(amou
nts in million US$)
(1) Adjusted EBITDA is defined as Earnings before interest, taxes, depreciation, amortization, other non‐cash and one‐off items. Please refer to the Appendix of this presentation for further guidance on the underlying assumptions used to derive Adjusted EBITDA, and a reconciliation to Net Cash provided by Operating Activities. All projections of Adjusted EBITDA are internally generated based on assumptions, including continued counterparty performance under existing charters, that are outlined in the Appendix of this presentation, except for re‐chartering assumptions that are indicatively based on data derived from Marsoft’s latest research reports using the ‘High’, ‘Base’ and ‘Low’ Case scenarios. Such data is solely being used as input to the Company’s financial model to project Adjusted EBITDA. Marsoft has not performed any work and has not provided any guidance in relation to these projections. Please refer to the Appendix of this presentation for further guidance on the calculation of future revenues, off‐hire days, operating expenses etc.
$405 $395 $372 $343
Contracted Revenue
13
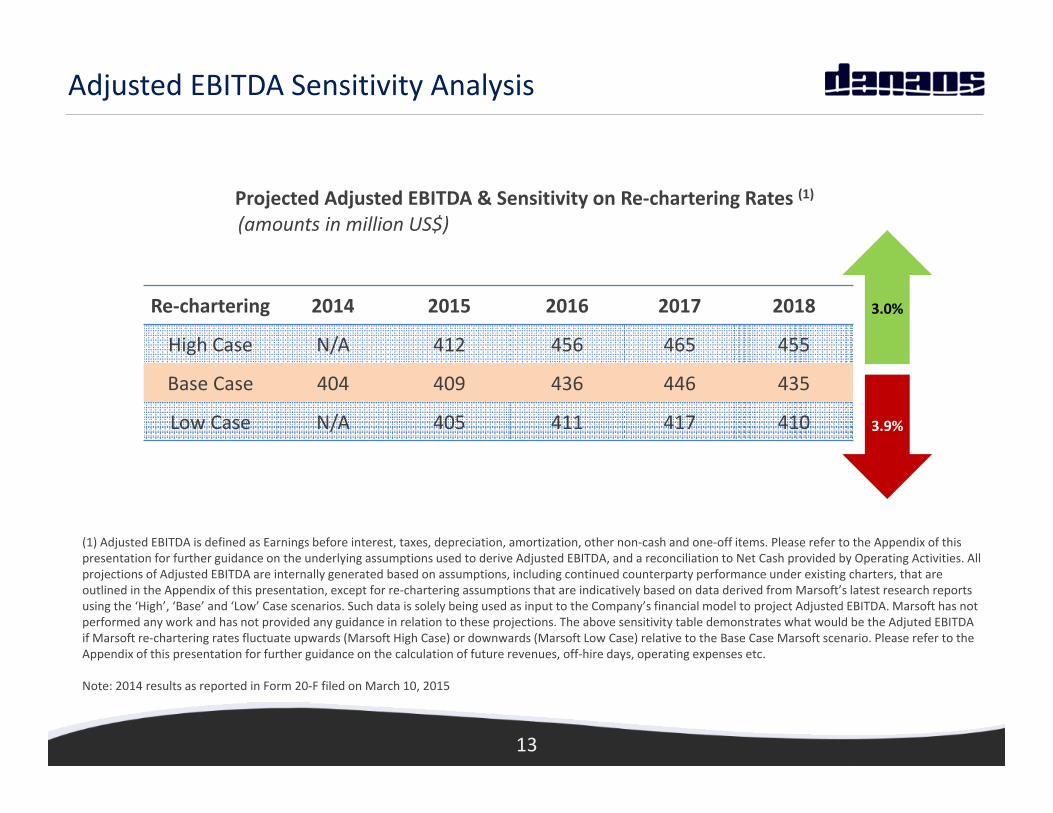
Adjusted EBITDA Sensitivity Analysis
3.0%
3.9%
Re‐chartering 2014 2015 2016 2017 2018
High Case N/A 412 456 465 455
Base Case 404 409 436 446 435
Low Case N/A 405 411 417 410
Projected Adjusted EBITDA & Sensitivity on Re‐chartering Rates (1)
(1) Adjusted EBITDA is defined as Earnings before interest, taxes, depreciation, amortization, other non‐cash and one‐off items. Please refer to the Appendix of this presentation for further guidance on the underlying assumptions used to derive Adjusted EBITDA, and a reconciliation to Net Cash provided by Operating Activities. All projections of Adjusted EBITDA are internally generated based on assumptions, including continued counterparty performance under existing charters, that are outlined in the Appendix of this presentation, except for re‐chartering assumptions that are indicatively based on data derived from Marsoft’s latest research reports using the ‘High’, ‘Base’ and ‘Low’ Case scenarios. Such data is solely being used as input to the Company’s financial model to project Adjusted EBITDA. Marsoft has not performed any work and has not provided any guidance in relation to these projections. The above sensitivity table demonstrates what would be the Adjuted EBITDA if Marsoft re‐chartering rates fluctuate upwards (Marsoft High Case) or downwards (Marsoft Low Case) relative to the Base Case Marsoft scenario. Please refer to the Appendix of this presentation for further guidance on the calculation of future revenues, off‐hire days, operating expenses etc.
Note: 2014 results as reported in Form 20‐F filed on March 10, 2015
(amounts in million US$)

14
Significant Free Cash Flow per Share
(1) Defined as Net Cash generated for the period before Net Vessel Acquisitions / Disposals, Payments for Drydockings, Debt Drawdowns and Debt Amortization. Based on current share count of 109.8 million shares. All projections of Free Cash Flow are internally generated based on assumptions, including continued counterparty performance under existing charters, that are outlined in the Appendix of this presentation, except for re‐chartering assumptions that are indicatively based on data derived from Marsoft’s latest research reports using the ‘High’, ‘Base’ and ‘Low’ Case scenarios. Such data is solely being used as input to the Company’s financial model to project Free Cash Flow. Marsoft has not performed any work and has not provided any guidance in relation to these projections. Please refer to the Appendix of this presentation for further guidance on the calculation of future revenues, off‐hire days, operating expenses etc.
$2.5
$3.3 $3.4$3.2
$1.8
$2.5
$3.1 $3.2$3.0
$2.4
$2.9 $2.9$2.7
2014 2015 2016 2017 2018
Free Cash Flow per Share (1)
Marsoft High Case Marsoft Base Case Marsoft Low Case

15
0.00%
0.50%
1.00%
1.50%
2.00%
2.50%
$0
$50
$100
$150
$200
$250
2014 2015 2016 2017 2018
Libo
r Rate
Net Finance Costs (amounts in million US$) Under Base CaseMarsoft Scenario
Net Interest Expense Swaps Expense Libor Curve as at February 17, 2015
$198
$124
$83 $84 $76
Expiring Swaps Benefit Net Income and Free Cash Flow
16
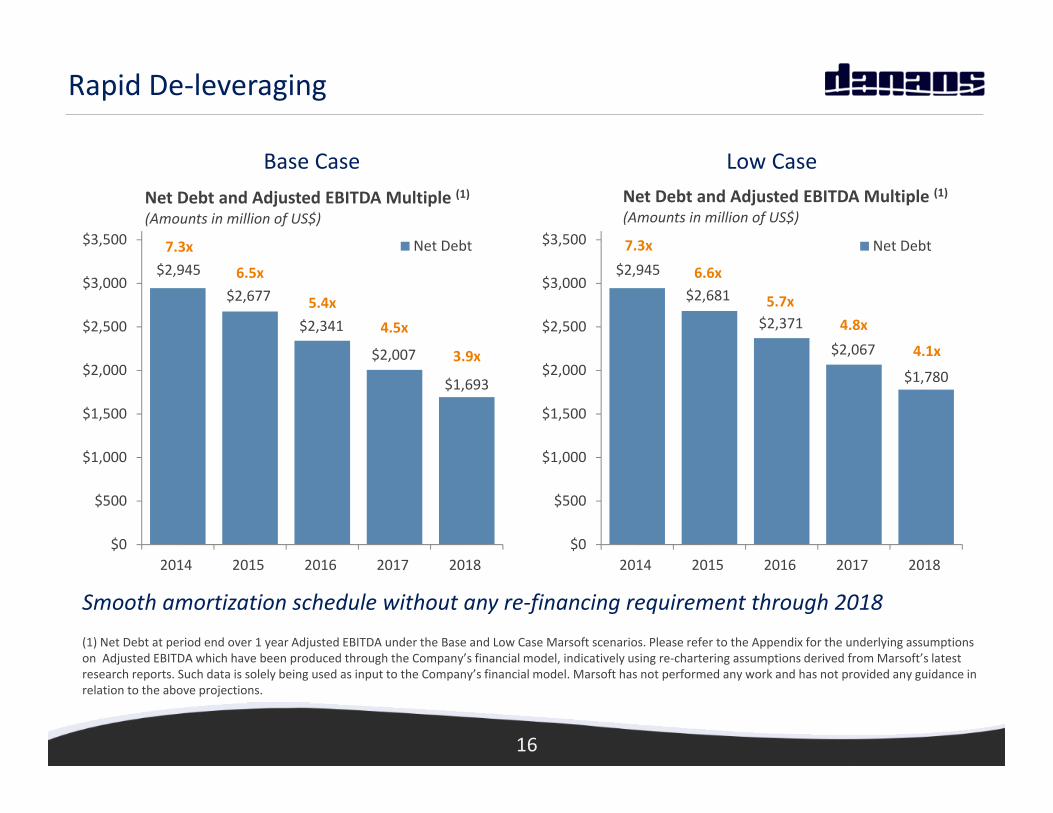
Rapid De‐leveraging
(1) Net Debt at period end over 1 year Adjusted EBITDA under the Base and Low Case Marsoft scenarios. Please refer to the Appendix for the underlying assumptions on Adjusted EBITDA which have been produced through the Company’s financial model, indicatively using re‐chartering assumptions derived from Marsoft’s latest research reports. Such data is solely being used as input to the Company’s financial model. Marsoft has not performed any work and has not provided any guidance in relation to the above projections.
7.3x
6.5x
5.4x4.5x
3.9x
$2,945
$2,677
$2,341
$2,007
$1,693
$0
$500
$1,000
$1,500
$2,000
$2,500
$3,000
$3,500
2014 2015 2016 2017 2018
Net Debt and Adjusted EBITDA Multiple (1)(Amounts in million of US$)
Net Debt 7.3x
6.6x
5.7x4.8x
4.1x
$2,945
$2,681
$2,371
$2,067
$1,780
$0
$500
$1,000
$1,500
$2,000
$2,500
$3,000
$3,500
2014 2015 2016 2017 2018
Net Debt and Adjusted EBITDA Multiple (1)(Amounts in million of US$)
Net Debt
Base Case Low Case
Smooth amortization schedule without any re‐financing requirement through 2018
17
Our Future is Bright
• Our new capital structure allows us to profitably and prudently expand the company
• Long‐term fixed rate charters provide cash flow visibility
• Excellent long‐term customer relationships tested during the last crisis
• We are well positioned to participate in the next growth cycle and be an industry consolidator
• Management retains significant shareholding interest in Danaos
• Proven track record of excellent vessel management with approximately 99% utilization of vessels under charter arrangements
Investor RelationsEVANGELOS CHATZISChief Financial Officer Danaos CorporationAthens, GreeceTel: +30 210 419 6404E‐Mail: [email protected]
Company ContactsIRAKLIS PROKOPAKISSenior VP & Chief Operating OfficerDanaos CorporationAthens, GreeceTel: +30 210 419 6400E‐Mail: [email protected]
NICOLAS BORNOZISPresidentCapital Link, Inc.New York, USATel: +1‐212‐661‐7566E‐Mail: [email protected]
World‐Class Shipping, Leading‐Edge Expertise

Appendix

18
Underlying Assumptions
Operating Revenues• Contracted periods run until earliest dates charters can expire, no options exercised• Assumes full performance by all counterparties to existing charters, which depends on such charterers’ ability
to meet their obligations under these charters• Nine of our older vessels sold in 2013 and five in the six months ended June 30, 2014 • Four secondhand geared vessels acquired in 2013 and two 6,400 TEU 12 year‐old vessels delivered in November
2014• Two vessels up for re‐chartering in the 2nd Quarter of 2015, two vessels up for re‐chartering in the 3rd Quarter
of 2015, three vessels up for re‐chartering in the 4th Quarter of 2015 and two vessels up for re‐chartering in the 1st Quarter of 2016
• All re‐charterings are based on Marsoft low/base/high case scenarios. All operating assumptions related to projections on Operating Revenues, Adjusted EBITDA and Free Cash Flow are based on internally generated projections, except for re‐chartering assumptions that are indicatively based on data derived from Marsoft’slatest research reports using the ‘High’, ‘Base’ and ‘Low’ Case scenarios. Such data is solely being used as input to the Company’s financial model to project Operating Revenues, Adjusted EBITDA and Free Cash Flow. Marsofthas not performed any work and has not provided any guidance in relation to the above mentioned financial metrics
• Operating off‐hire of 1.1 days per annum per vessel• Dry‐dock off‐hire of 15 days every 5 years for all vessels until their 15th year of age and thereafter 15 days every
2.5 years. Assumed cost of $1 mil. for each dry‐docking• All vessels are assumed to be scrapped when 30 yrs old, at $300/ton
Operating Expenses• Operating expenses as per company’s 2015 budget thereafter escalated at 2.5% per annum.

Reconciliation of Net Cash from Operating
Activities to Adjusted EBITDA (amounts in million US$) 2014 2015 2016 2017 2018
Net Cash provided by Operating Activities $192 $264 $310 $304 $287
Add back:
Net movement in current and non‐current assets & liabilities 7 12 10 11 32
Net Finance Costs (incl. interest expense and swaps) 198 124 84 85 79
Payments for dry‐docking / special survey 7 5 7 17 12
Adjusted EBITDA $404 $405 $411 $417 $410
Reconciliation of Net Cash from Operating
Activities to Adjusted EBITDA (amounts in million US$) 2014 2015 2016 2017 2018
Net Cash provided by Operating Activities $192 $268 $336 $334 $314
Add back:
Net movement in current and non‐current assets & liabilities 7 12 10 11 33
Net Finance Costs (incl. interest expense and swaps) 198 124 83 84 76
Payments for dry‐docking / special survey 7 5 7 17 12
Adjusted EBITDA $404 $409 $436 $446 $435
19
Underlying Assumptions
Adjusted EBITDA (1)• Non‐GAAP measure, defined herein as Earnings before Interest, Depreciation, Amortization, non‐cash and one‐
off items• Reconciliation of Net Cash Provided by Operating Activities to Adjusted EBITDA under Base and Low Case
Scenarios:
(1) Under Marsoft Base and Low Case Scenarios. All projections of Adjusted EBITDA are internally generated based on certain assumptions, including continued counterparty performance under existing charters , except for re‐chartering assumptions that are indicatively based on data derived from Marsoft’s latest research reports. Such data is solely being used as input to the Company’s financial model to project Adjusted EBITDA. Marsoft has not performed any work and has not provided any guidance in relation to the above projections.
Under Base CaseMarsoft Scenario
Under Low CaseMarsoft Scenario

20
Underlying Assumptions
• Calculation of interest and swap cash flows are based on the following forward US$ interest rate Libor curve as at February 17, 2015.
• Interest rate hedging uses current hedging arrangements through interest rate swaps as disclosed in the 2014 Annual report on form 20‐F, filed with the SEC on March 10, 2015.
• 2014 per share data has been calculated on the basis of 109.7 mil. shares while forecast for 2015‐2018 has been calculated on the basis of 109.8 mil shares*
Note: We have 15 mil. warrants outstanding with an exercise price of $7.00 per share expiring in January 2019, which are exercisable solely on a cashless basis. As a result, the number of shares of common stock issuable upon exercise will be reduced. For instance, in the event 100 warrants were exercised at an exercise price of $7.00 per share at a time when our common stock was $10.00 per share, 30 shares would be issuable rather than 100 shares.
0.43%0.27% 0.23%
0.49%
1.30%
1.95%2.24%
0.00%
0.50%
1.00%
1.50%
2.00%
2.50%
2012 2013 2014 2015 2016 2017 2018
LIBOR CURVE ASSUMPTION