CAPITAL STRUCTURE AND FINANCIAL PERFORMANCE OF …
82
CAPITAL STRUCTURE AND FINANCIAL PERFORMANCE OF SMALL AND MEDIUM ENTERPRISES IN EMBU COUNTY, KENYA JOSEPH KINYUA RURI D53/OL/EMB/26718/2014 A RESEARCH PROJECT SUBMITTED TO THE SCHOOL OF BUSINESS IN PARTIAL FULFILMENT OF THE REQUIREMENTS FOR THE AWARD OF DEGREE OF MASTER OF BUSINESS ADMINISTRATION (FINANCE) OF KENYATTA UNIVERSITY. JUNE, 2017
Transcript of CAPITAL STRUCTURE AND FINANCIAL PERFORMANCE OF …
CAPITAL STRUCTURE AND FINANCIAL PERFORMANCE OF SMALL
AND MEDIUM ENTERPRISES IN EMBU COUNTY, KENYA
JOSEPH KINYUA RURI
D53/OL/EMB/26718/2014
A RESEARCH PROJECT SUBMITTED TO THE SCHOOL OF BUSINESS IN
PARTIAL FULFILMENT OF THE REQUIREMENTS FOR THE AWARD OF
DEGREE OF MASTER OF BUSINESS ADMINISTRATION (FINANCE) OF
KENYATTA UNIVERSITY.
JUNE, 2017
ii
DECLARATION
I hereby declare that this is my original work and has not been presented for an
academic award in this or any other University.
Name: Joseph Kinyua Ruri
D53/OL/EMB/26718/2014
Signature: ……………….…………….. Date………………………….
APPROVAL
This work has been submitted for examination with my approval as University
Supervisor.
Signature………………………...……... Date…………………
Dr. Job Omagwa
Department of Accounting and Finance,
School of Business,
Kenyatta University.
DEPARTMENT OF ACCOUNTING & FINANCE

iii
DEDICATION
Special dedication to my two daughters (Makena and Wendo) for their inspiration,
patience and encouragement

iv
ACKNOWLEDGEMENTS
This research project has not been an easy task, first and foremost is to acknowledge
the almighty God for being with me from the beginning to the end and also giving me
strength and ability that enabled me accomplish. To my supervisor, Dr. Job Omagwa I
convey sincere gratitude for the constructive suggestions and professional guidance
through this project. My colleagues at place of work, can’t forget your support and
encouragement. Lastly to my two daughters you have indeed given me special support
and being part of me through this uphill task. To those not mentioned by name, accept
my sincere appreciation and gratitude.
v
TABLE OF CONTENTS
DECLARATION ............................................................................................................ ii
DEDICATION ...............................................................................................................iii
ACKNOWLEDGEMENTS .......................................................................................... iv
ABSTRACT ................................................................................................................... ix
LIST OF TABLES .......................................................................................................... x
LIST OF FIGURES ....................................................................................................... xi
ABBREVIATIONS AND ACRONYMS .................................................................... xii
OPERATIONAL DEFINITION OF TERMS ..........................................................xiii
CHAPTER ONE ............................................................................................................. 1
INTRODUCTION .......................................................................................................... 1
1.1 Background of the Study ............................................................................................ 1
1.1.1 Capital Structure ...................................................................................................... 2
1.1.2 Financial Performance ............................................................................................. 4
1.1.3 Capital Structure and Financial Performance .......................................................... 6
1.1.4 SMEs in Embu County, Kenya ............................................................................... 6
1.2 Statement of the Problem ........................................................................................... 7
1.3 Research Objective ..................................................................................................... 8
1.3.1 Specific Objectives .................................................................................................. 8
1.4 Research Hypotheses .................................................................................................. 9
1.5 Scope of the Study ...................................................................................................... 9
1.6 Significance of the Study............................................................................................ 9
1.7 Limitations of the Study ........................................................................................... 10
1.8 Organization of the Study ......................................................................................... 10
CHAPTER TWO .......................................................................................................... 11
LITERATURE REVIEW ............................................................................................ 11
2.1 Introduction .............................................................................................................. 11
vi
2.2 Theoretical Review ................................................................................................... 11
2.2.1 Pecking Order Theory ........................................................................................... 11
2.2.2 Trade-Off Theory .................................................................................................. 12
2.2.3 Agency Theory ...................................................................................................... 14
2.3 Determinants of Financial Performance in SMEs .................................................... 15
2.3.1 Leverage ................................................................................................................ 15
2.3.2 Liquidity ................................................................................................................ 16
2.3.3 Cash Flow .............................................................................................................. 16
2.4 Empirical Review ..................................................................................................... 17
2.5 Summary of Literature Review ................................................................................ 21
2.6 Conceptual Framework ............................................................................................ 21
CHAPTER THREE...................................................................................................... 24
RESEARCH METHODOLOGY ................................................................................ 24
3.1 Introduction .............................................................................................................. 24
3.2 Research Design ....................................................................................................... 24
3.3 Target population...................................................................................................... 25
3.4 Sampling Design ...................................................................................................... 25
3.5 Data Collection Instrument....................................................................................... 26
3.6 Data Collection Procedure ........................................................................................ 27
3.7 Validity and Reliability ............................................................................................ 27
3.7.1 Validity .................................................................................................................. 27
3.7.2 Reliability .............................................................................................................. 28
3.8 Data Analysis and Presentation ................................................................................ 28
3.9 Ethical Considerations .............................................................................................. 29
CHAPTER FOUR ........................................................................................................ 30
DATA ANALYSIS AND PRESENTATION ............................................................. 30
4.1 Introduction .............................................................................................................. 30
vii
4.2 Response Rate .......................................................................................................... 30
4.3 Validity and Reliability Test Results. ....................................................................... 31
4.4 General Information ................................................................................................. 31
4.4.1 Year of Establishment ........................................................................................... 31
4.4.2 Gender of the Respondents .................................................................................... 32
4.4.3 Financial Advisory Services .................................................................................. 32
4.4.4 Liquidity Position .................................................................................................. 33
4.4.5 Financial Skills ...................................................................................................... 34
4.4.6 Profit Maximization............................................................................................... 34
4.4.7 Source of Equity Capital ....................................................................................... 35
4.5 Descriptive Analysis ................................................................................................. 35
4.5.1 Equity Capital ........................................................................................................ 36
4.5.2 Debt Capital ........................................................................................................... 37
4.5.3 Retained Earnings .................................................................................................. 39
4.5.4 Initial Business Capital .......................................................................................... 40
4.6 Preliminary Diagnostic Tests. .................................................................................. 41
4.6.1 Multicollinearity test ............................................................................................. 41
4.6.1.1 Equity Capital ..................................................................................................... 41
4.6.1.2 Retained earnings ............................................................................................... 42
4.6.1.3 Debt Capital ........................................................................................................ 42
4.6.2 Heteroscedastic Test .............................................................................................. 43
4.6.3 Normality test ........................................................................................................ 43
4.7 Regression Analysis ................................................................................................. 46
4.7.1 Model Summary .................................................................................................... 46
4.7.2 Analysis of Variance ............................................................................................. 47
4.7.3 Coefficients Table ................................................................................................. 47
4.8 Discussions and Key Findings.................................................................................. 49
viii
CHAPTER FIVE .......................................................................................................... 51
SUMMARY, CONCLUSION AND RECOMMENDATIONS ................................ 51
5.1 Introduction .............................................................................................................. 51
5.2 Summary................................................................................................................... 51
5.3 Conclusion ................................................................................................................ 53
5.4 Recommendations .................................................................................................... 54
5.5 Limitations of the Study ........................................................................................... 55
5.6 Contribution to knowledge ....................................................................................... 55
5.7 Areas for Further Research ....................................................................................... 56
REFERENCES ............................................................................................................. 57
APPENDICES............................................................................................................... 62
APPENDIX A: Letter of Introduction ............................................................................ 62
APPENDIX B: Questionnaire ........................................................................................ 63
ix
ABSTRACT
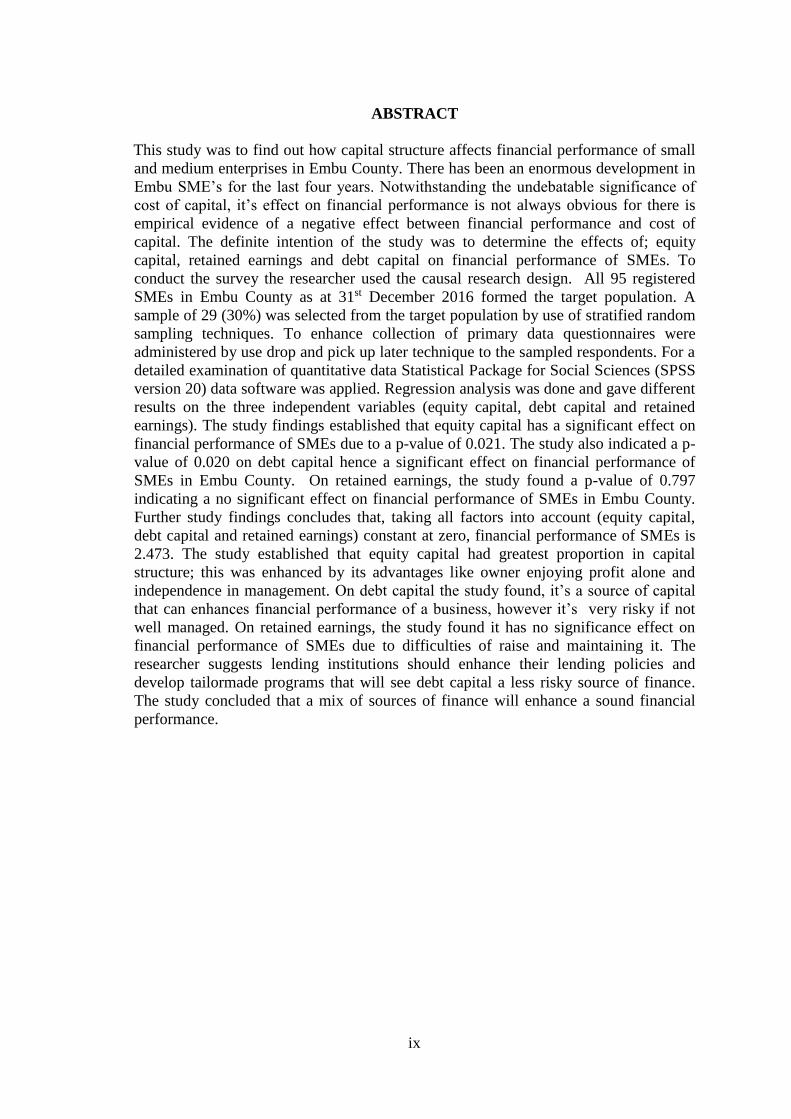
This study was to find out how capital structure affects financial performance of small
and medium enterprises in Embu County. There has been an enormous development in
Embu SME’s for the last four years. Notwithstanding the undebatable significance of
cost of capital, it’s effect on financial performance is not always obvious for there is
empirical evidence of a negative effect between financial performance and cost of
capital. The definite intention of the study was to determine the effects of; equity
capital, retained earnings and debt capital on financial performance of SMEs. To
conduct the survey the researcher used the causal research design. All 95 registered
SMEs in Embu County as at 31st December 2016 formed the target population. A
sample of 29 (30%) was selected from the target population by use of stratified random
sampling techniques. To enhance collection of primary data questionnaires were
administered by use drop and pick up later technique to the sampled respondents. For a
detailed examination of quantitative data Statistical Package for Social Sciences (SPSS
version 20) data software was applied. Regression analysis was done and gave different
results on the three independent variables (equity capital, debt capital and retained
earnings). The study findings established that equity capital has a significant effect on
financial performance of SMEs due to a p-value of 0.021. The study also indicated a p-
value of 0.020 on debt capital hence a significant effect on financial performance of
SMEs in Embu County. On retained earnings, the study found a p-value of 0.797
indicating a no significant effect on financial performance of SMEs in Embu County.
Further study findings concludes that, taking all factors into account (equity capital,
debt capital and retained earnings) constant at zero, financial performance of SMEs is
2.473. The study established that equity capital had greatest proportion in capital
structure; this was enhanced by its advantages like owner enjoying profit alone and
independence in management. On debt capital the study found, it’s a source of capital
that can enhances financial performance of a business, however it’s very risky if not
well managed. On retained earnings, the study found it has no significance effect on
financial performance of SMEs due to difficulties of raise and maintaining it. The
researcher suggests lending institutions should enhance their lending policies and
develop tailormade programs that will see debt capital a less risky source of finance.
The study concluded that a mix of sources of finance will enhance a sound financial
performance.
x
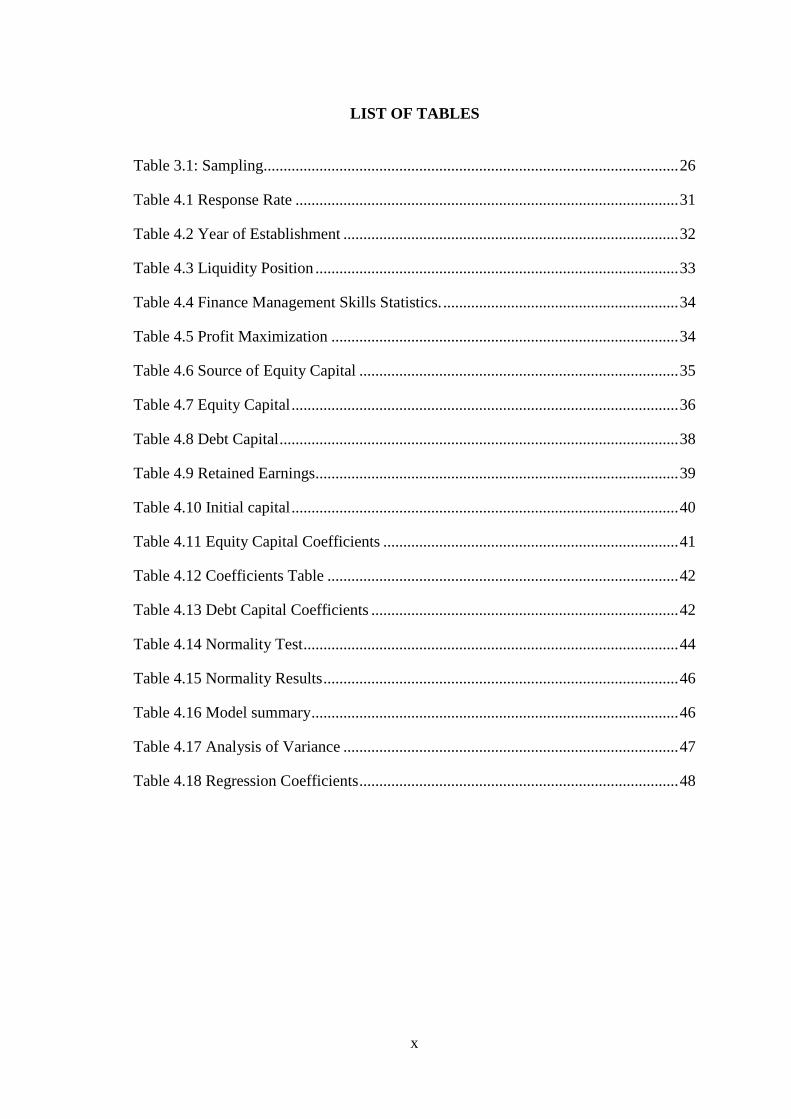
LIST OF TABLES
Table 3.1: Sampling........................................................................................................ 26
Table 4.1 Response Rate ................................................................................................ 31
Table 4.2 Year of Establishment .................................................................................... 32
Table 4.3 Liquidity Position ........................................................................................... 33
Table 4.4 Finance Management Skills Statistics. ........................................................... 34
Table 4.5 Profit Maximization ....................................................................................... 34
Table 4.6 Source of Equity Capital ................................................................................ 35
Table 4.7 Equity Capital ................................................................................................. 36
Table 4.8 Debt Capital .................................................................................................... 38
Table 4.9 Retained Earnings........................................................................................... 39
Table 4.10 Initial capital ................................................................................................. 40
Table 4.11 Equity Capital Coefficients .......................................................................... 41
Table 4.12 Coefficients Table ........................................................................................ 42
Table 4.13 Debt Capital Coefficients ............................................................................. 42
Table 4.14 Normality Test .............................................................................................. 44
Table 4.15 Normality Results ......................................................................................... 46
Table 4.16 Model summary ............................................................................................ 46
Table 4.17 Analysis of Variance .................................................................................... 47
Table 4.18 Regression Coefficients ................................................................................ 48

xi
LIST OF FIGURES
Figure 2.1: Conceptual framework ................................................................................. 22
Figure 4.2 Financial Advice ........................................................................................... 33
Figure 4.6.2.1 Homoscedasticity .................................................................................... 43

xii
ABBREVIATIONS AND ACRONYMS
EBIT: Earnings before interest and tax
PBIT: Profit before interest and tax
EPS: Earning per share
IFC: International Finance Corporation
IO: Institutional Investors
PIO: Public initial offer
ROA: Return on Asset
SMES: Small and Medium Enterprises
KIE: Kenya Industrial Estate
xiii
OPERATIONAL DEFINITION OF TERMS
Borrowed Capital: is the money that does not belong to the owner of the
business? The owner borrows to boost the operations of
the business and repays later as per terms and conditions.
Capital Structure: Refers to the composition of capital employed. As
regards this study, it is the mixture of ordinary shares,
retained earnings and debt capital.
Informal Sector: Sectors which do not fall formalities when running their
operations like complete double entry in bookkeeping eg.
Clothing in industry, fruits and cereal sellers, stationery
shops mobile phone industries
Micro Finance Institutions: These are a small financial institution that offers financial
services to low income.
Profile: This refers to a summary of the main characteristics or
features of an entity. In this study, it refers to the socio-
economic characteristics of SMEs.
Small and Medium Scale Enterprises: In this paper, SMEs shall represent the small
owned businesses that are in dire need of finance but do
not attract the financial institution due to lack of
collaterals
Financial performance is an absolute way of measuring how effectively the
management is utilizing the limited resources to generate
revenue for the business. How SME’s are able to invest
the available finance and returns and growth of their
business. Measured by profitability levels in different
time periods.
1
CHAPTER ONE
INTRODUCTION
1.1 Background of the Study
One of the most difficult subject to understand in corporate finance literature is the
capital structure. (Barine 2012). Capital structure is the composite of borrowed fund
and owners’ fund that adds up to total capital employed of the business organization.
The ratio of external source (borrowed) to internal source is a cautious decision for
corporate managers. Capital structure decisions are of importance when considering the
factors that affects performance of a firm. This therefore calls for a lot of care and
attention when making decisions on capital structure. Referring to the balance sheet of
a firm, a comprehensive status of the firm as regards all types of assets and liabilities
are reflected (Velnampy and Niresh, 2012). The term capital structure of an enterprise
is actually a mixture of ordinary share, prefered shares and long-term debts. A number
of considerations requires to put in place as far as the optimum capital structure is
concerned. With the combination of various sources of capital, firms may find it
difficult to realize the goal of utilizing their funds economically. Therefore, it is
progressively relied that a firm need organize its capital structure for an optimum use of
funds and to be in a position that enhance dealing with upcoming situation (Pandy
2009)
According to Pandy (2009) financial performance measures of an institution includes
profitability and liquidity among other that provides useful parameters for measuring
the previous performance of the firm as well as the present status of the business. How
well a business utilizes its assets in its operations to generate profit signifies its
performance that is measured subjectively. Brigham and Gapenski (1996) supported
the theory of Modigliani and Miller model. On the other hand, the presence of
bankruptcy costs goes hand in hand with the firms debt. According to the conclusion an
explicit association amid capital structure and financial performance of institution was
suggested (Brigham and Gapenski 1996). The inspiration for aiming the SME’s comes
from the fact that, they are force behind thriving in a number economy in today’s
world. They create many jobs both self-employed and formally employed hence
2
contributing tremendously to economies which Kenya is not an exception and more so
Embu County.
SMEs in Embu plays a very major part in the county’s economic growth varying from
job creation, providing livelihood to the residents and enhances county development by
paying trading license fees. Any individual that wants to start a SMEs type of business
in Embu County must register with County Trade and License Office. Must also abide
with policies and by-laws set by the county government. This uplifts their goodwill and
makes it easy when accessing external finance from lending institutions. The SMEs in
Embu County are in retail business providing products and services directly to the final
consumer. SMEs must also abid to government regulations where they must maintain
proper books of account, pay taxes and file returns to K.R.A. Those with salaried
employees must observe the statutory deductions before paying their employees
monthly salary. Business environment nowadays is very competitive, no single SMEs
is exercising monopoly and therefore, a lot efforts must be put in place to enhance
competitive advantage (Porter and Kramer, 2002).
1.1.1 Capital Structure
According to Friend (2008), capital structure is a composition of equity and debt capital
in a proportion that enhances sound operations of a firm. Capital structure is hence
composed of long standing obligations, short-term obligations like bank notes, ordinary
and preferred share capital that build up the overall capital of a firm that finances its
activities and spearheads growth. In the business balance sheet, the capital structure
mostly is placed on the credit side. Capital structure, to a great extent, is composed of
the firm's debt and equity (Peavler 2016). Management and owners keeps on making
decisions on proportions of debt versus equity as they try get answers to the following
questions; so as to get higher returns, should they go for more debts? To reduce risk of
high gearing, should the firm use more equity finance?
Seminar work of 2008 by Modigliani and Miller stated that, capital structure is believed
to be a factor that influence firms performance in contrast to the position in place.
Some of the assumptions that Modigliani and Miller (2008) contends on are the
existence of a perfect capital market and expectations that are homogeneous; taxes and
3
cost of transacting not existing, by considering this therefore there would be no
relevance of capital structure to the firm’s value. Hamada (2009) and Stiglitz (2004)
has backed this opinion. Consequently, studies by Jensen and Meckling (2006) have
disputed the finds made by Modigliani and Miller. Theories on capital structure suggest
that, for a rise in value of a firm by way of constraining mangers to work more to the
good of shareholders there must be a fall in agency cost outside equity by high leverage
or low equity/ asset ratio (Berger & Bonaccorsi di Patti, 2006). The two major types of
liabilities are equity and debt and the holders represent the two classes of firm’s
investors. Different levels of risk, gains, and influence have an relationship for each of
the two types of liabilities. Though debt owners have no influence over the firm’s
operation, they earn fixed rate of interest. This is per terms and conditions of the
investment contract. Last category of claimants and who carries nearly all of the risks
are the ordinary shareholders despite that, they have greater influence over firm’s
decisions (Amit and Schoemaker, 2003).
Among the many decisions accomplished by financial managers the one rated as most
significant is on capital structure (Damodaram, 2010). The composition of capital
employed can affect the firm’s value and optimality of financing cost. The management
core objective is to maximize equity owner’s wealth, cutting cost the minimum and
acting within the legal frames governing the establishment of the firm. To ensure
minimum cost of capital is maintainable, the determining factor will be an optimum
capital structure. Current and prospective investors tend to gather and analyze firms’
information to understand the operations. Agency costs, according to agency theory can
be reduced by ownership and optimal capital structure (Jensen & Meckling, 2006).
With material data one should expect to see a connection amid ownership structure and
capital structure
In this area, empirical studies establish varied outcomes. Crutchley and Jensen (2006),
Grier and Zychowicz (2004), Chaganti and Damanpour (2001) and Bathala et al.
(2004) noticed unmatching association relating leverage and institutional ownership. In
contrast, Chen and Steiner (2009), Berger et al. (2007) and Leland and Pyle (2007)
confirms that leverage and organizational ownership have a positive relationship. Also,
Ning and Tong (2004) asserts that future financial difficulties may be experienced by
4
firms with high gearing ratios. Consequently, firms with low gearing ratios will attract
institutional investors.
Ratios on capital structure are applied in measuring the leverage: a fraction of total debt
to total assets (LEV). To determine the ownership structure of a firm, two variables are
used, the natural logarithm of the total shares belonging to Institutional Investors (IO)
is first considered, then proportions of institutional proprietorship on subscribed shares
is the second, (Tong and Ning, 2004). These indicators thus form an definite (size)
measure and a percentage measure, in that order. Use of permanent -cost resources or
finances with an aim to boost earnings to the investors results to leverage. Normally, a
rise in leverage causes a rise in return and risk, while a fall in leverage causes a fall in
risk and return.
Extent of leverage in the capital structure of the firm, equity and long-term debt mix
sustained by the firm can considerably influence its worth by having an effect on risk
and return (Gitman,2005). Different from some causes of risk, those introduced through
use of the leverage can be fully controlled over by the management. At the time of
making capital structure decisions, the financial manager need to know how to
determine and assess leverage due to how it affect the firm’s value. Referring to the
income statement of a firm, the main categories of leverage which are three can are
fairly explained. Operating leverage is about the association concerning profits before
interest and taxes (PBIT) and sale revenue. Monetary leverage is about the association
involving the firm’s PBIT and return to ordinary shares (earnings per share. EPS).
Absolute leverage is about the firm’s EPS and sales revenue relationship (Amit &
Schoemaker, 2003).
1.1.2 Financial Performance
As an abstract measure, financial performance is how current assets of a firm can be
utilized optimumly in the course of normal business activities and raise income for the
business (Baxter, 2007). Financial performance is a sign of the financial stability for a
given period of time for a firm, and can be used to compare firms in the same line of
operations or to compare industries or sectors in total to enable a business plan on how
they can improve the conditions at stake with an aim to achieve the business objectives
(Berger, Oliver & Pua, 2007). Financial performance can be determined by a number of
5
ways, though all should be considered as one. Items in the income statement like
turnover, inventory levels cost of sales, operating income and expense as well as
cashflows from operating activities can be used. Additionally, the analyst or investor
may wish to find more from financial statements and seek out margin growth rates or a
decline in debt (Brush, Bromiley & Hendrickx, 2000).
Financial and non-financial indicators can be used by a firm to determine its
performance. On issues pertaining employees turnover, waiting and delivery time,
referral rates on customers and their satisfaction are termed as non-financial measures
while sales revenue and earnings before tax are financial measures (Marr, 2008).
Acknowledging some problems that may arise by using one measure or the other,
entrepreneurs of today have embraced the idea of using both of them. Combining non-
financial and financial measures assist in determining the next course of action.
Over the years the performance of Kenyan SMEs has been diminishing. Most of the
SMEs that contributed 40% employment in Kenya were closed down due to inability to
operate of small enterprise (GOK, 2009). Financial performance of SMEs over the
years has been questionable since some have been auctioned and others merged or
acquired. From 2001 to 2002, the SMEs performance declined by 56% (Kenya
Economic Survey, 2003). Industrial economists also have given a report that small
industries have high liquidity risks despite they also enjoy higher growing rate than big
industries (OECD, 1997). Due to poor management of short term loan, trade credit and
long-term loans, SMEs have continuously experienced some difficulties in improving
their financial performance. The cause could be failure by SMEs not using appropriate
debts in their normal operations and if this is not dealt with, it might cause financial
distress and business failure. (Pindalo, 2006). However, the much availability of debt
facilities and the strict procedure of raising the limited available equity finance has
caused many SMEs to turn to debt as a source of finance (Githaiga 2015). This fact is
theoretically and practically acceptable from the debt providers' perspective owing to
the perceived high risk of moral hazard problems among small and medium enterprises.
Debt is an important factor for the free flow of cash in the operation of the SMEs.
6
1.1.3 Capital Structure and Financial Performance
The effect of capital structure on the firm financial performance and total worth is an
issue of concern to financial researchers as the conclusive study of (Modigliani &
Miller, 1958) refuted any influence in value of a firm by capital structure under
competitive market setting. This suggestion tries to say that, the mode of financing real
assets does not measure the value of the firm but the real assets themselves are the
measure. According to Eldomiaty and Azim (2008) financial performance and capital
structure do have a positive relationship. The argument is further supported by Hadlock
and James (2002). But, Fama and French (2008) went contrary noting a relationship
that is negative. Zeitun & Tian, (2007) believed a strong relation between capital
structure and financial performance exists.
According to Jensen and Meckling (2006) there can be a conflict of shareholders and
managers caused by high leverage arising from choosing debt, equity or both as
investment. Verifiable expectations of these kinds of replicas is a rise in leverage would
reduce ownership costs of agency plus debt owners hence enhancing performance of
business and to the same extent holding all other constant (Maina, 2014). On the other
hand, conflict between equity holders and bond holders can cause a arise in bankruptcy
costs or financial distress as a result of increase in debt that is influenced by relatively
high limit of leverage. Therefore to differentiate empirically the two causes of agency
costs is an uphill task.
1.1.4 SMEs in Embu County, Kenya
The uncertainty in job market in Embu County has called for public policies that tend
to award SMEs in the commercial sector conducive term and conditions to raise
finance. Lack of adequate information and other risk in lending business has made
SMEs experience a lot of constraints in raising the much-needed finance in enhancing
their business operations. Inevitably, their capital structure is seriously affected by this
(Pettit and Singer,2005). Raising the required finance is a major hinderance that is
encountered by SMEs in the commercial sector allover. From start-up, expansion and
growth stages of development, SMEs have difficulties in accessing enough finance due
to high cost of raising finance and lack of collateral that financial institution demand
(Beyene,2002). Leasing in Kenya has helped the SMEs to bridge the current financing
7
gap by providing industrial and commercial equipment’s as it focusses on the ability
by lessee’s to generate cashflow from trading operations that can repay the lease rentals
rather than on the statement of financial position or credit track records (International
Finance Corporation(IFC), 2007; Kisaame, 2007). The requirement will include a lease
structure that composes of duration the lease contract, running costs, renewals and
incentives.
1.2 Statement of the Problem
Establishing the optimum capital structure in financial management is an important
assignment (Pandey 2009). Decisions on capital structure are made while taking into
account factors that includes financial performance, liquidity and control. Debt, equity
and financial performance relationship is investigated and efforts are made to have the
knowledge of how they interrelate. Capital structure is associated with the capacity of
the business being to meet the requisites of investors (Boodhoo, 2009). The prior one
decade or so has attested substantial transformations in capital structures of businesses
(Gomez, 2005). SMEs in the commercial sector are vital to nearly all economies in the
world, particularly to those in evolving countries those that their main challenges are
employment and income distribution (Omore et al, 2012). Concurring with Elimuti and
Kathawala (2009), SMEs promote to the output and creation of “decent” jobs; looking
at the dynamic front, they act as start-up for the larger firms of the future, are the
following (and critical) step up for expanding micro enterprises, they provide
absolutely and often significantly to total savings and investment, and they play part in
the development of appropriate technology.
In Africa, there are a small number of researches done on how the capital structure and
SMEs performance relate to one another. Though Abor (2005) Studied on the
relationship between capital structure and profitability of quoted companies in Nigeria,
Kamau (2013) looked at the impact of capital structure on financial performance of
errand service SMEs within Nairobi County. Boateng (2004) studied on the
determining factor on capital structure in international joint ventures. Nevertheless, not
a single study focused on how the capital structure and SMEs performance and more so
8
on commercial sector irrespective of how they are influenced by financial challenges
plus macro-economic factors.
Unlike in big firms where debt-equity ratio has been investigated by a good number of
researchers, a few have shown interest on small firms. The financial strategies of big
registered companies regularly vary from smaller firms for the reason that, they raise
finance through long-term borrowing or issuing equity shares through stock exchange
market (Githaiga, 2015). The livelihood of Embu County community is based on
agriculture and business oriented activities. Among the major crop that has hit the
market is Miraa and a big number of people are in small and medium sized business.
According to the K.I.E. Embu branch, most of the SMEs in Embu County have been
running their businesses with a lot of difficulties due lack of knowledge on how capital
structure can influence financial performance positively and enhance their growth.
Most have stagnated and others closed. Quite a good number of these businesses have
been raising finance through equity capital, Debt capital and retained earnings. Based
on the available information it is obvious that results from the study of the effect of
capital structure on financial performance not yet done conclusively and needs further
practical work study. No study known to the researcher has been done per se to find out
the relationship between SMEs capital structure and financial performance. The study
was therefore motivated by this gap in finance knowledge and sought to answer the
question. Is there impact of SMEs capital structure decisions on financial performance
in Embu County?
1.3 Research Objective
The principal objective of the study was to find out capital structure affects financial
performance of SMEs in Embu County, Kenya.
1.3.1 Specific Objectives
The specific objectives of the study were:
(i). To establish the effect of equity capital on financial performance of SMEs in
Embu County, Kenya.
(ii). To establish the effect of debt capital on financial performance of SMEs in
Embu County, Kenya.
9
(iii). To determine the effect of retained earnings on financial performance of SMEs
in Embu County, Kenya.
1.4 Research Hypotheses
This research sought to test the following null hypotheses:
H01. Equity capital does not have a significant effect on financial performance of
SMEs in Embu County, Kenya
H02. Debt capital does not have a significant effect on financial performance of SMEs
in Embu County, Kenya.
H03. Retained earnings do not have a significant effect on financial performance of
SMEs in Embu County, Kenya.
1.5 Scope of the Study
The research was conducted in Embu County. For first hand data collection, the
respondents were given questionnaires to fill. The purpose of the survey was to
establish how capital structure components (equity capital, debt capital and retained
earnings) affect financial performance of SMEs in Embu County. The researcher
preferred to carry out the study in Embu County due to its competitive advantages in
business activities and the notable tremendous growth. The target was SMEs that have
been in operation since 2012, having gone through a five years business cycles (2012-
2016).
1.6 Significance of the Study
The relationship between capital structure and financial performance is greatly
recognized in the financial literature. So as to determine the problems, a study focusing
on factors that affect the relationship between capital structure and financial structure
was of paramount importance. Today the business environment that SMEs operate in is
quite hostile and competitive. Therefore, of great importance, are the research findings
available when choosing the optimum capital structure that will enhance a sound
financial performance of SMEs. To managers and owners the study will be of benefit
as they carry out financial analysis to determine how far the firm has achieved its core
objective. It will also promote valuable knowledge to the area of micro-enterprise
policy in general.
10
Study findings on the effect of capital structure on financial performance will equip the
managers and owners with relevant knowledge. Also it can further enhance efficient
financial policies that will see the firm possess competitive advantage. The research
study will aid the SME’s in identifying the factors that influence their financing choices
so as to achieve a capital structure that is optimum and can meet needs of diverse
stakeholders. Lastly, these study findings will significantly contribute towards the
aspect of SMEs financing, capital structure and financial performance.
1.7 Limitations of the Study
The research project faced several constraints which are worth noting. The scholar
encountered a challenge on reaching the proprietors due to their busy schedule and
geographical locations. However the researcher requested for an appointments that
were granted and collected the necessary data. Others not willing give correct
information due confidentiality and some of these data were on annual basis, an
assumption that the amounts were evenly distributed throughout the year which in
reality is not possible. The researcher assured the respondents of confidentiality the
data on figures the average figure was used.
1.8 Organization of the Study
Following chapter one that introduces the study, there are other four chapters structured
in this respects. Chapter two introduces the literature review, theoretical review,
determinants of financial performance, empirical review, summary of literature review
and conceptual framework. Chapter three contains research methodology, research
design, target population, sampling design, data collection instruments, procedures and
analysis as well as ethical considerations. Chapter four presents data analysis,
presentation and interpretation. Lastly Chapter five gives the summary, conclusion and
recommendation of the study.
11
CHAPTER TWO
LITERATURE REVIEW
2.1 Introduction
Discussions on the theoretical review, empirical review, conceptualization and the
research gaps are found in this chapter. First are the capital structure theoretical review
and study theories. The chapter also looks into the effects of capital structure on
financial performance and analyses that have been obtain from the two concepts. The
chapter further reviews empirical evidence on impacts of capital structure on financial
performance with the conceptual gaps and an abstract of the literature review.
2.2 Theoretical Review
Among the theories that explain on how capital structure decisions are determined, the
three superior theories are pecking-order, trade-off, and agency theories. But a number
of study have recommended trade-of and pecking-order theories for privately owned
firms that don’t subscribe for external financing. Therefore, the researcher focused on
finding out among the two trade-off and pecking-order theories which explains better
the capital structure of commercial SMEs.
2.2.1 Pecking Order Theory
Myers and Majluf (1984) recommended the pecking order theory. According to the
theory, firms develop an order ranking when it comes to capital required to finance
business operations. Due to lack of adequate information and a good link between
future investors and firms, the preference will be as follows; debt better than equity,
retained profit preferred to debt, and short term loan superior than long-term loans..
Myers and Majluf (1984) maintained that to resolve information asymmetry firms
wouldn’t require to issue new securities but instead use retained profit to support
investment opportunities. This shows by raising ordinary share capital will be costly as
outsiders and insiders on asymmetric information increase. To prevent selling
understated securities, firms with considerable information asymmetry should go for
debt. Issue of new common stock is one of the capital structure scenarios that can cause
decline in stock price.
12
The pecking-order theory depends on the idea of asymmetric information involving
outsiders (investors) and insiders (managers), this helps managers in selecting the best
source of finance. This theory argues that, sources with the minimum levels of
asymmetric information attracts firms requiring funding since the borrowing expenses
increases with this metric. Myers (1984) claims that, retained earnings are better than
debt and debt is better than equity when selection is done unfavorably. The adverse
selection model influenced the ranking, according to Myers and Majluf’s (1984). On
the other hand, a variety of sources including taxes and agency conflicts have stemmed
the ranking.
Pecking Order Theory suggests that, bigger size lets a firm to accumulate retained
earnings, and so smaller amount of debt is necessary. Consequently, Pecking Order
Theory forecasts an adverse correlation between size and debt (López-Gracia, Sogorb-
Mira 2008). According to Myers (1984), bigger firm size lowers the problems of
information asymmetry among the managers/owners and creditors, allowing firms to
get debt on more good terms. The correlation between size and debt can either be
positive or negative, Pecking Order Theory suggests. For the intention of this study,
theory on Pecking Order is of paramount importance as is intended for the assessment
of financing performance of the SMEs along the life cycle. According to Pecking Order
assumption, older firms have a superior ability to retain and accumulate earnings, and
so the demand to go for external financing to solve their financing needs will be less
than in the situation of younger SMEs. The possibility of old SMEs reserving profits
over time is significant, so the older SMEs lessen the alternative to borrowing.
2.2.2 Trade-Off Theory
This theory came from the research done by Kraus and Litzenberger (1973), who
properly initiated the tax benefit related to borrowed finance and financial distress costs
into a state preference model. This theory suggested that, balancing of cost and benefits
are the main factors in deciding the amount of borrowed fund and owners’ equity to
use. The offsetting of benefits against costs of debt in capital structure is well addressed
by trade-off theory. It deliberates on the numerous corporate finance options that a
corporation encounters. According to the theory debts and equity capital are normally
13
the two sources of finance to a firm. Agency and distress costs in capital structure are
the two concepts that are mainly dealt with by Trade-off theory. (Penman, 2001).
Capital structure Trade-off theory is of significance in explaining that firms total capital
composes of part equity and debt forms the other part. According to the theory, debt
finance has an advantage of tax on interest though there is floatation cost, also non-
bankruptcy and bankruptcy costs that forms financial distress costs. (e.g. labor
turnover, unfavorable credit terms from suppliers, conflict between shareholders and
creditors etc).The minimal gain of additional long-term fund drops as it rises, whereas
the minimal cost rises, thus a firm enhancing its total worth focuses on this
counterbalancing at the time of deciding how much to raise from each source
(Makanga, 2015). Focusing on the trade-off theory the optimal capital mix would occur
where there is a counterbalance between tax benefit and marginal costs related to
bankruptcy. Consequently, debt would be more preferred to equity by firms up to a
point where cost of bankruptcy starts to be significant.
According to Brigham & Ehrhardt (2005) trade-off theory suggests that the unlevered
firm value together with the cost of side effects arising from tax shield and cost from
financial distress. The possibility of bankruptcy is low and immaterial to a firm that has
not been financed by debt or low debt financing. Baxter (2007) maintained that, a
massive usage of long-term fund raises the likelihoods of firm experiencing liquidity
problems and hence ask for an additional premium to cover the risks. A further
recommendation to the firms was that, they should not use long-term fund to a level
that the debt costs exceed the tax shield benefit. The tax shield benefit may be reduced
by an increase in anticipated cost of bankruptcy due to rise in long-term financing.
This theory is valuable for this analysis because firms assess borrowing costs alongside
the advantages of long-term financing. Costs of bankruptcy and paid interest makes the
borrowing cost. Advantages of long-term financing are the allowance of interest paid
from tax and the management self-control out the terms and conditions of the
financing.
14
2.2.3 Agency Theory
Jensen and Meckling (1976) developed the theory. The focal point is on the behavioral
association among the owners (principals) and those others (agents) who are contracted
by the owners to execute duties on behalf of the principal. The theory of agency
focusses on the perception that shareholders’ interests are not among the priorities of
the managers. Jensen and Meckling (1976) further go into detail on this concept by
recognizing two foremost conflicts between parties to a company, firstly, shareholders
disagrees with owners, and secondly, owners differ with the creditors. In the first case,
managers are enticed to pursue the profits of the firms they oversee to their own
individual gain at the disadvantage of the shareholders. In the latter case, debt imparts
shareholders with the enticement to invest sub-optimally.
Managers may perhaps avoid extreme level of leverage if they sense that, it puts their
jobs and income at stake. Alternatively, shareholders, can spread company certain
risks, prefer riskier projects. Neilson, (2004) submits that management might
recommend a projects whose net present value is positive and the gain mainly go to
bondholders. According to Smith and Warner (2009) dilution of claim and asset
substitution can cause more agency conflicts amongst shareholders and bondholders.
Corporate and financing policy choices can pose incentive to a number of claimants
that will lessen value-reducing behavior and henceforth lower agency costs.
Comba (2013) asserts that by increasing reliance in debt financing can help firms in
lowering their agency costs. The demand for financing through owners’ equity reduces
together with related agency costs. Nevertheless, a corporation's capability to
progressively depend on long-term funding is restrained owing to debts high agency
costs ensuing from the likelihood of the firm dwindling into financial distress.
Additionally, to financial distress costs, present shareholders can be diluted by the extra
debt holders claim and consequently demand higher returns that are replicated in the
firm's cost of capital that is high. This theory is imperative for this survey because, the
choice of dividends, leverage and management ownership can alleviate costs of agency
resulting from firm's contract relationship. The managers of SMEs can raise their stake
of ownership in the firm and bring into line their interests with those of shareholders,
ensuing in a coming together of interests among shareholders and managers. Even by
15
enhancing the firm equity share, the diversification of individual portfolio is lowered
by the management.
2.3 Determinants of Financial Performance in SMEs
The financial formation of an organization and its capability to settle its obligations on
time is influenced by cash flow Leverage and liquidity. For each of the three types of
measures link to a distinct element of this attribute of firms operation. The organization
financial structure is explained by leverage measures that incorporates debt to total
assets, times interest earned and debt to equity (subrahmaniyam 2009). The interval
measure, current ratio and quick ratio which are all measures of liquidity can be used
assess the ability of organization to convert assets into cash. Lastly, measures of
cashflow explains the organization cash in total that is generated and where it comes
from comparatively to the cash demands of the organization measured through
cashflow to assets and equity (Dobbins and Barnard, 2010).
2.3.1 Leverage
The financial formation of the firm is measured by use of leverage ratios. The extent to
which the current assets are financed by borrowed fund as compared to owners fund is
the financial leverage (Penman, 2001). Regular honor of loan repayment plus interest is
what entails the debts agreements. Ordinary shareholders instead, have no obligatory
call to be paid returns either periodically or at the time of termination of the firm
business. As a result, holders of debt get an inflexible return whereas ordinary
shareholders get the remaining once all interested parties are satisfied (Berger &
Udell,2008).
Consequently, if the profits earned by the firm exceed cost of debt, the extent of that
surplus profits over cost of debt finance turns out to be enjoyed by the ordinary
shareholders. A firm that is not able to make profits that is more than cost of debt
finance, the ordinary shareholders earn no return but debt holders continue to earn their
fixed rate of return. (Robert, 2006). Owners have high chance of losses and gains when
there is high debt equity ratio. This connection is usually known to be a trade-off of
gains and losses to firm owners. When the leverage of a firm is high , the higher the
chance of bankruptcy in bad seasons, and on the other hand, during good times the
16
chances of high profits to be enjoyed by equity capital providers is high (Sandberg et
al, 2012).
2.3.2 Liquidity
Means the firm’s being in a position to pay the required amount of borrowed fund when
time to pay is due. In principle, the assets of a company are said to be liquid if they can
be converted into cash within a relatively short period without loss in value (Brealey, et
al., 2001). Whether the business is gaining more capital to ensure smooth running of its
activities without endangering its liquidity position is the significance performance
issue. In view of that, liquidity measures denote one side of an element of entire
organizational performance, though inadequate indicators that can signify a complete
concept. Together, absolute and percentage terms can be used to measure liquidity
(Subrahmaniyam 2009). Working capital which is an excess of current asset over
current liability is a good measure of organization liquidity. The period of time that a
firm can do its trading transactions by utilizing assets that are liquid and not effecting
some more sales can also be used as an interval to measure liquidity. Acid test ratio,
current ratio and working capital changes are some of the percentage liquidity measures
(Githaiga & Kabiru, 2014).
Terms and conditions of debts contract together with other debts requirements are not
shown by computation from financial statements which therefore indicate a crucial
weakness on measures of liquidity (Campel 2009). Normally, cost of debt is higher
than what investment on short-term can earn, a good business practice will be to use all
cash that is in excess in reducing interest-earning current liabilities given that current
arrangement on borrowing can be replaced within shortest time possible (Koeter,
2008). Real liquidity can be underreported by firms financial statements due to inability
to report liquidity in excess arising from organization current arrangement on
borrowing that enhance access to capital.
2.3.3 Cash Flow
Apart from meeting current obligations, cashflows can also be used to measure the
ability of the firm to pay contributors of capital some return. Finally, the financial
advantage or worth, that is attained from a firm is influenced by the cash payment
17
obtained by resource providers. Copeland, et al.(2000); West and Jones (2009)
maintains that, the cashflow that is anticipated and the cash payout timing by investors
are the usual business valuation approaches. Cashflow is the current determining factor
of the firm’s value. For this reason, the cashflow accessible by investors can therefore
be measured as part of firm’s performance. However, the changes of application and
sources of cash due to investment opportunities and rates of growth year after year puts
the researcher on need to understand when cashflows is to be measured.
Brealey (2001) theorized measures of cash flow to include cash flow as a percentage on
return on equity, percentage on return on assets, net cash flow from operations and the
growth rate of operating cash flows. Every measures here deals with the cash available
to the organization that enables it to acquire the fund required for the financing and
investment activities.
2.4 Empirical Review
Bhaduri (2002) researched on European poultry states to find out how capital structure
is influenced by business risk and found that business risk is among the key factor that
has influence on firms capital structure. From the study he established that debt is
about honoring payments done on regular basis, firm with high debt equity ratio may
have difficulties in meeting financial obligations to their creditors leading to related
costs like expensive financing, opportunity costs etc. As a result, firms that have
volatile incomes tend to be lowly geared. The relationship between business risk and
capital structure is therefore negative. Businesses with low risk attracts institutional
investors since firms whose their return is highly volatile has high chance of defaulting
and becoming bankrupt. This therefore, results to a relationship that is negative
between firm’s institutional ownership and business risk.
Myers and Majluf (2004) studied the effect of asymmetric information on firm’s when
choosing the best finance source. A descriptive study was conducted in Canada with a
sample of 342 agribusiness organizations. According to the study availability of
information that is asymmetric would make a prefer internal finance over other sources
of funds, but after utilizing all the internal fund it would turn to borrowing, issuing new
equity as a source of finance may be the last alternative, profitable firms usually have
more retained earnings.
18
Donaldson, (2001) sampled 235 consultancy firms in Canada to study how past
profitability and leverage influence one another. According to the study there could be
a negative relationship between past profitability and financial leverage. Conclusion
from the study was that, firms that are profitable will be preferred by investors. The
fact is that, firms that are profitable tend to have lower risk of bankruptcy and may fail
to meet its financial obligation due to absence or minimal financial challenges. A
relationship between institutional ownership and profitability is therefore expected to
be positive.
Hovakimian et al. (2004) involved 312 firms to investigated the impact of growth
potential of dairy firms to investors in UK, applying exploratory research design he
established that, more capital gains resulting from high growth dairy firms brought to
institutional investors than lower growth ones, agency problems are likely to be more
harsh for growing firms, this is due to availability of various future investment that they
can choose. Therefore, there exists a negative relationship between long-term leverage
and growth rate. Furthermore, organizations future performance may be provided as a
possible indicator to show firms that have high growth prospects. Thus institutional
investors would go for high-growth firms instead lower ones. The conclusion was that,
established stockholders, as major contributors to KRA would avoid double tax by
investing in stock that generate capital gain so as to defer payment of tax. Hence, the
established investors would consider opportunities of a firm’s growth as a positive
signal.
Rajan and Zingales (2005) carried a research on G-7 nations to establish how the size
of a firm influences the formation of capital employed, sample of 21 small and 21 big
businesses were considered and used to assess the two groups findings and established
a wider diversification in large firms and hence less likelihood of default. Rajan and
Zingales (2005) supports the projections of balancing costs and benefits theory (trade-
off) which recommends, big firms need more borrowing due to their enhanced
diversification that reduces their bankruptcy rate and experience minimal bankruptcy
costs. Likewise, big firms also have lesser agency costs of debt, for instance,
comparatively lesser monitoring costs for the reason that there is less volatility in cash
19
flow and easy access to capital markets. From the results the conclusion was that
between the firm size and leverage the relationship is positive.
Miller and Rock (2005), John and Williams (2005) evaluated roles played by corporate
status when enlisting in the equity market by service industries where explorative was
applied with 231 questionnaires and a 45% response rate. The findings from the study
were, a firm with a good corporate reputation arising from paying constant rate of
dividends experience less asymmetric information when getting into equity market.
Therefore, if dividend payments signifies stable financial status and hence higher
borrowing capacity, most probably there will be a correlation that is positive between
leverage and divided payment. Furthermore, capital markets will monitor firms that
have a reputation arising from paying a stream of dividends. Institutional ownership
can perform as an another method for doing an evaluation hence minimizing the
requisite for external monitoring practice like capital markets. The investigation
established that there exists a relationship amid institutional ownership and dividend
payments that is positive. Nevertheless, the presence of institutional ownership
alleviates the requisite for dividends as an indicator of good performance.
A study carried by Myers and Rajan (2008) in German banking sector aimed at finding
out how liquidity is influenced by agency cost. It discovered that when borrowing
exceeds creditors threshold there exists a negative relationship. As a result, liquidity
and borrowed fund relationship is expected to be negative. Equally, to the established
investors, the impact of convertible assets is unclear indicator. A liquidity ratio that is
high is thought to have negative sign since it shows firm encountering difficulties as
regards opportunities for its long-term investment decisions. Thus for institutional
investors, a high liquidity ratio may be considered to be a negative signal. Since the
firm is able to meet its financial obligation when they fall due and hence lower default
risks, a high liquidity ratio can therefore be considered to be a positive signal.
Therefore, for established investors high-level of liquidity is expected to be a positive
indicator.
Ebaid (2009) examined how the choice of components of capital structure influences
the firms performance in Egypt. Gross profit margin, Return on asset and equity were
used evaluate performance. Capital structure was assessed by comparing current
20
liabilities assets asset, long-term fund against asset, and debts to assets ratio.
Relationship between performance and leverage was established by use of Multiple
regression analysis . It revealed an insignificant effect of capital structure on the firms
performance. A research done in Kenyan pharmaceutical industries to find out how the
capital structure influenced the performance, Adekunle (2009) compared debt against
equity as an alternative to capital formation whereas ROE and ROA were used to
assess the performance of firms. Ordinary Least Squares method of approximation was
applied in the study. A study on how measures of financial performance are influenced
by debt equity ratio revealed a significant negative effect. On the other hand, the study
didn’t take into account other financing decisions in the evaluation, even the
intervening impact of the internally available cash flow.
During the period between 2004 and 2008, Kaumbuthu (2011) tried to establish the
relationship of industrial return on equity to capital structure and related sectors in the
Nairobi stock market. Performance focused on return on equity while composition of
capital took the place of debt equity ratio. By using the regression analysis to establish
the influence of debt equity to return on equity ratio, a negative relationship was found.
Investigation focused on only one sector of the companies quoted in Nairobi Securities
Exchange and gave consideration to only one aspect of financing decisions. Therefore,
these study findings cannot be generalized to include some other more sectors. To
establish the effects of firms decisions on financing to financial performance, non-
financial firms quoted in the Nairobi stock market were all included by the current
thesis.
On the impact of capital structure to financial performance of quoted companies in the
Tehran Security markets was further carried out by Saeedi and Mahmoodi (2011) . The
study revealed a positive correlation between performance market measures and capital
structure while between return on asset and capital structure the relationship is positive
but on return on equity and capital structure no notable relationship. According to
Mahmoodi and Saeedi (2011) findings, different measures of performance may be
affected by financial leverage.
21
2.5 Summary of Literature Review
The chapter has looked at the theoretical review and empirical review. The researcher
in theoretical review, looked at the theories which acts as the study foundation. The
emphasis was paid to the pecking-order, cost/benefit set-off (trade-off) and agency
theories by the study since they appropriately give explanation of the capital structure
and ownership as determinants for firm performance. Among the contributions from
the theories, the major contribution is that, cost of external equity is lowered by low
equity/asset ratio or high gearing and by making managers work further towards
shareholders’ interest raises the value of the firm. For that reason capital structure is
believed to have an influence on a firm performance. The empirical review focus on
factors of capital structure; SMEs performance and capital structure. The preceding
literature review on financing SMEs admits that, in particular, maturity of debts and
capital structure in general, up to date, no tool to deal with them has been put in place:
unique features of SMEs are not contained by models that are theoretical; what is
provided empirically is only past explanation instead of finding out how to establish an
optimum capital structure. Provided we can establish from the existing literature,
realistically there is no a provided way that can assist SMEs in optimizing there capital
structure.
2.6 Conceptual Framework
A conceptual framework according this study refers to an established extensive plan
and assumption/rules gotten from an appropriate discipline enquiring how to structure a
successive presentation (Bundi, 2002). As a tool applied in research, it’s expected to
aid the researcher build a perception and familiarity with the condition being
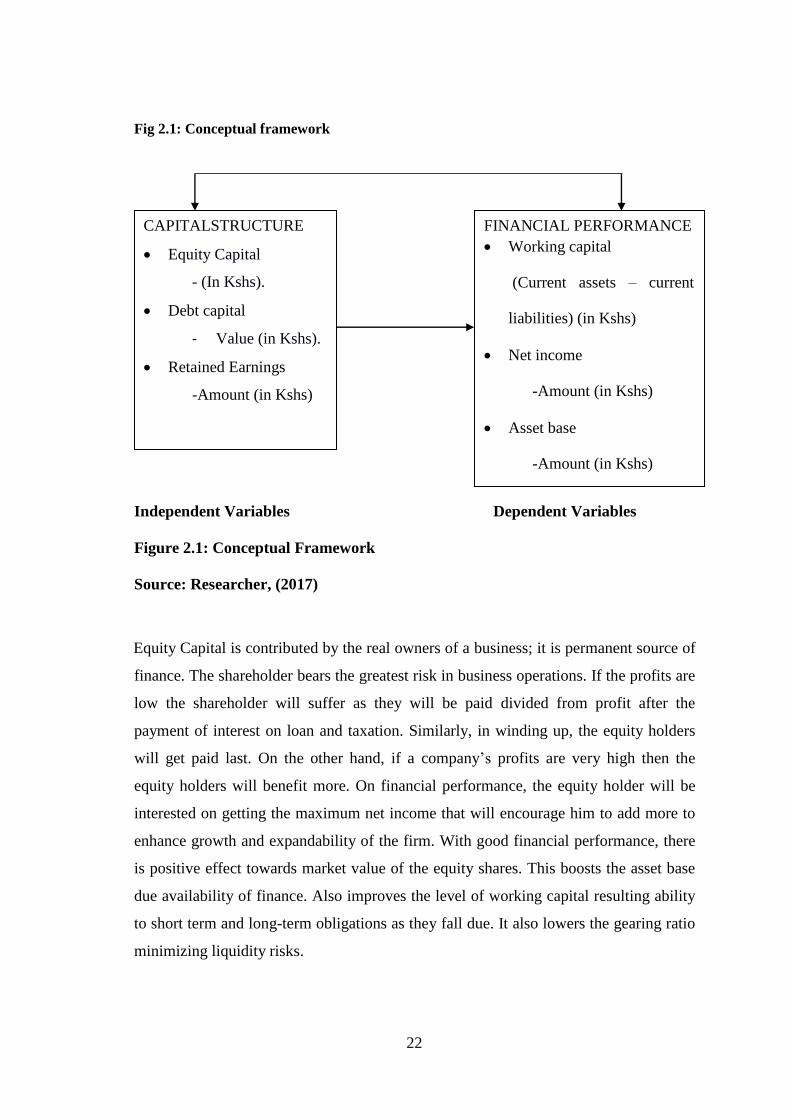
scrutinized and reveal it. Figure 2.1 of the conceptual framework shows the relationship
between dependent variable (financial performance of SMEs) and independent
variables (equity capital, retained earnings, term loans/borrowings and cost of
production).
22
Fig 2.1: Conceptual framework
Independent Variables Dependent Variables
Figure 2.1: Conceptual Framework
Source: Researcher, (2017)
Equity Capital is contributed by the real owners of a business; it is permanent source of
finance. The shareholder bears the greatest risk in business operations. If the profits are
low the shareholder will suffer as they will be paid divided from profit after the
payment of interest on loan and taxation. Similarly, in winding up, the equity holders
will get paid last. On the other hand, if a company’s profits are very high then the
equity holders will benefit more. On financial performance, the equity holder will be
interested on getting the maximum net income that will encourage him to add more to
enhance growth and expandability of the firm. With good financial performance, there
is positive effect towards market value of the equity shares. This boosts the asset base
due availability of finance. Also improves the level of working capital resulting ability
to short term and long-term obligations as they fall due. It also lowers the gearing ratio
minimizing liquidity risks.
CAPITALSTRUCTURE
Equity Capital
- (In Kshs).
Debt capital
- Value (in Kshs).
Retained Earnings
-Amount (in Kshs)
FINANCIAL PERFORMANCE
Working capital
(Current assets – current
liabilities) (in Kshs)
Net income
-Amount (in Kshs)
Asset base
-Amount (in Kshs)
23
Debt capital is the borrowed fund from a financial lending institution. Companies
borrow and normally repay with an interest in future. The lenders of debts capital do
not become owners of the firm but instead receive contractual fixed amount of money
that include principle and interest at a fixed rate, are just creditors and suppliers of debt
finance though at times they can appoint a representative in board of directors to look
at their welfare. When it comes to repayment of returns to financiers, debt is ranked
above equity capital. This means debt interest must be paid in full first before equity
owners get dividends. A highly geared company may have problems in paying
dividends especially if business operations are unfavorable. Debt capital improves
financial performance especially when equity capital is not enough to purchase fixed
assets of the firm. Definitely this improves financial performance. Retained earnings,
the undistributed part of profits which belong to the ordinary shareholders not paid out
to them in the period they are earned. It forms the most important source of fund for
expansion because it is the cheapest and painless method of raising additional capital.
The retained earnings can be used to expand the business improve its asset base and
improve the liquidity, this will facilitate the act of performing financial activities.
24
CHAPTER THREE
RESEARCH METHODOLOGY
3.1 Introduction
The study has been completed by following a number of phases and stages which are
outlined in this chapter. The plan comprised of data assembling, measurement and
evaluation. At this stage, most decisions about how research was executed and how
respondents were approached, as well as when, where and how the research was
completed is well emphasized. As a result, in this section the research identified the
procedures and techniques that were used in the collection, processing and analysis of
data. In particular, the following subsections were included; research design, target
population, sampling design, data collection instruments, data collection procedures
and finally data analysis.
3.2 Research Design
The study adopted the causal research design. According to Cooper and Schindler
(2006), a causal study is meant to determine the impact of one variable(s) on the
other variable(s) which describes relationship. Causal research is by and large designed
clearly with specified objective to find out relationships and causal relations amongst
distinct variables. The design was recognized as a suitable tool to carry this study since
it entails assembling, confirmation, and synthesis of confirmation to verify facts that
support or disprove a belief. According to cheng (2014), design entails use of data from
secondary sources. was obtained from sources such as Financial statements, archives,
official records and reports were the main source of Secondary data. The past
documentations can be of valuable importance background that is needed so as to
comprehend more fully and explain the research problem. Throughout the study, there
was no possibility of researcher-subject interaction that could influence the findings
and hence the design was very useful. So as to study different research problems or to
replicate a previous study, historical sources could also be used over and over (Cooper
& Schindler, 2006).
25
3.3 Target population
Is the whole group of elements or objects which researchers wants to study and make
general conclusions. The target population usually has varying characteristics and it is
also known as the theoretical population. According to Ngechu (2004), a target
population is a distinct or determined group of objects, people, services, elements,
events, things or households that are under study. Agreeing to the definition therefore a
target population of interest should be homogeneous. Target population studies are an
enhanced representation since all members have equal chance to be counted in the final
sample that is obtained according to Bryman (2006). Kothari (2004) explains target
population as the sum total of constituents about which conclusions are to be made.
Therefore, the group that is made of all probable interpretations of a traits of concern is
the population under study, while a collected works of observations representing only a
unit of that population is a sample (Denscombe, 2008). The study targeted SMEs in
Embu County, Kenya. The SMEs targeted are those in retail business selling products
and services directly to individual consumers for their own use with a goal of earning a
profit.
3.4 Sampling Design
Sampling refers to a procedure of selecting some members to be studied as they
represent the large group from which they are selected (Oguia, 2005). Stratified random
sampling method was used to single out SME’s for the survey whereas purposive
sampling was used to select respondents who were to fill the questionnaires. It made it
possible for all the enterprises in all the categories to stand equal chances of being
incorporated in the sample (Singleton et al., 1988). Stratified random sampling entails
subdividing the population into mutually exclusive parts called strata, based on the
categories of one or a combination of relevant variables. From each stratum a simple
random sample is then drawn and these sub samples are put together to form a
complete stratified sample (Singleton et al., 1988).
A sample of 29 SMEs from the target population of 95 SMEs in Embu County was
selected for the investigation, depending on the size of each stratum. This represented
30% of the total population. Mugenda and Mugenda (2003) advocates for a sample size
of between 10% and 30% this is considered appropriate and representative of the total
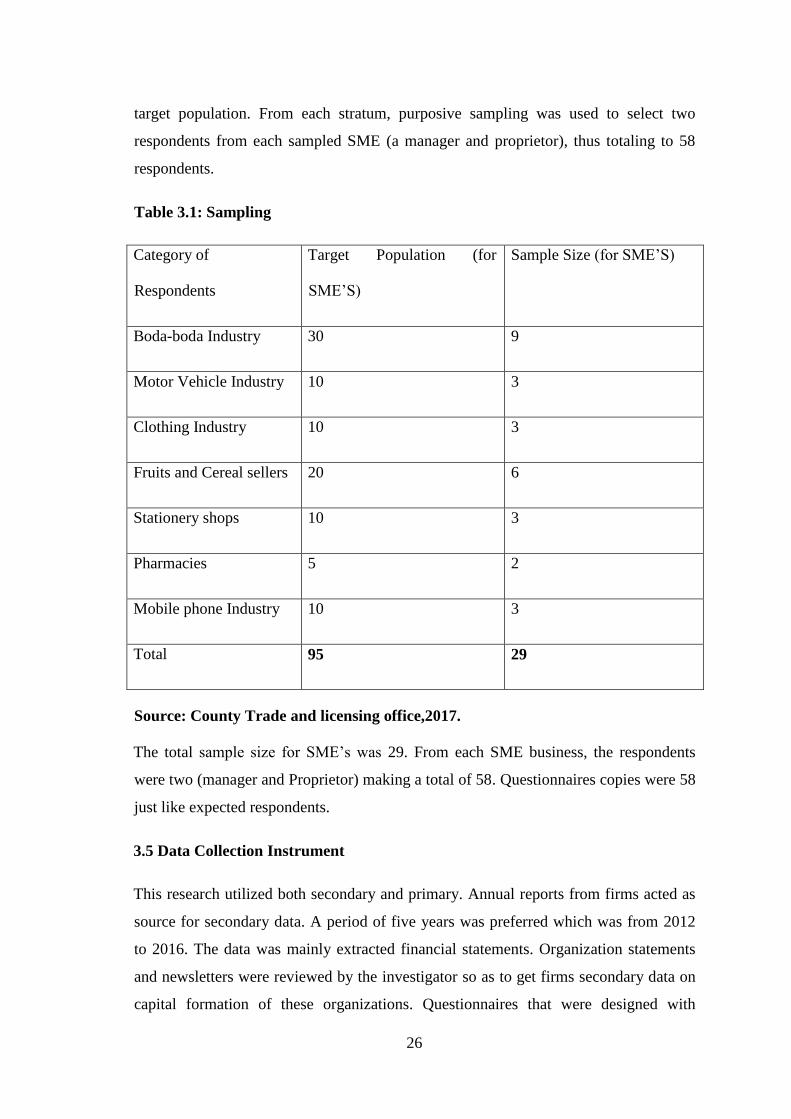
26
target population. From each stratum, purposive sampling was used to select two
respondents from each sampled SME (a manager and proprietor), thus totaling to 58
respondents.
Table 3.1: Sampling
Source: County Trade and licensing office,2017.
The total sample size for SME’s was 29. From each SME business, the respondents
were two (manager and Proprietor) making a total of 58. Questionnaires copies were 58
just like expected respondents.
3.5 Data Collection Instrument
This research utilized both secondary and primary. Annual reports from firms acted as
source for secondary data. A period of five years was preferred which was from 2012
to 2016. The data was mainly extracted financial statements. Organization statements
and newsletters were reviewed by the investigator so as to get firms secondary data on
capital formation of these organizations. Questionnaires that were designed with
Category of
Respondents
Target Population (for
SME’S)
Sample Size (for SME’S)
Boda-boda Industry 30 9
Motor Vehicle Industry 10 3
Clothing Industry 10 3
Fruits and Cereal sellers 20 6
Stationery shops 10 3
Pharmacies 5 2
Mobile phone Industry 10 3
Total 95 29
27
unstructured and structured questions enabled the collection of primary data. According
to Cooper & Schindler (2006) a questionnaire outlines the problem and specific
objectives of the study.
3.6 Data Collection Procedure
The researcher administered the questionnaires personally to all respondents. A
questionnaire is research tool comprising of a number of questions and other prompts
meant to gather information from respondents. Requires less effort and time from the
questioner unlike telephone surveys or verbal and often have standardized answers that
make it easy for the researcher to compile data (Zhenyu Du 2012). The questionnaires
were administered by delivering and collecting afterward to the selected respondents.
According to Cooper and Schindler (2006) the use of the Drop-Off/Pick-Up (DOPU)
technique lead to a significant high response rates. Furthermore, the DO/PU as method
reduces effectively possible non-response arising from bias through increased response
rate. The researcher prepared an introduction letter that stated the study purpose and
sent to the manager/proprietor. Moreover, the purpose of the study was further
explained to the individual respondents through telephone calls and also requesting for
financial statements. High level of confidentiality was also guaranteed. This enhanced
integrity in collected data.
3.7 Validity and Reliability
This section explores validity and reliability tests conducted on the research
instruments.
3.7.1 Validity
Research instruments are supposed to measure accurately and specifically what they are
intended to measure. Mugenda (2003) describes validity as the accurateness and
relevance of inferences, which are founded on the research outcomes. It’s the point at
which outcomes gotten from the evaluation of the data truly signify the observable fact
under study. The researcher relied on external validity. The content validity was
determined by giving the questionnaires to the experts who vetted the items. To achieve
this, the questionnaires was given to three lecturers from the department of Accounting
and Finance knowledgeable in the area to vet on the items used in the questionnaire.
28
The researcher also made corrections according to the supervisor’s guidelines and
ensured that the questions were in accordance to the study objectives.
3.7.2 Reliability
Reliability is the extent to which a research instrument can give similar results after
carrying out a given trial again and again. The point at which the results are free from
unintentional incidents of the research (kirk and Miller 1986). A reliability coefficient
of 0.6 and above is up to standard. A Cronbach Alpha of less than 0.6 signifies that, the
questionnaire reliability is too low hence need to amend the data collection instrument.
To ascertain the magnitude to which the research tool is reliable in evaluating the
factors under study, a tests on reliability was conducted to assesses on security and
liquidity availability.
3.8 Data Analysis and Presentation
This is a process used to make sense of the data. SPSS version 20 software of data
analysis, was applied to examine the quantifiable data. Further, an analyzes of
quantitative data was done through use inferential and descriptive statistics. Descriptive
analysis (means and Standard deviations), correlation analysis as well as Multiple
Regression Analysis methods of data analyzes were used. Figures and Tables were
used in presentation of Quantitative data. The study also used qualitative data attained
from questions that were open ended. The presentation of data was then done in a prose
form.
Y = B0 + B1X1+B2X2 + B3X3 +
Where y = Financial Performance
Bo = Intercept
X1 = Equity Capital
X2 = Debt Capital
X3 = Retained Earnings
B1-B3 = Regression Coefficients
= Error Term

29
3.9 Ethical Considerations
Ethics are standards for conduct that differentiate between acceptable and unacceptable
behavior (Resnik, 2015) Ethics has got to do with the respect to the dignity and
integrity of the respondents with respect to the information gathered. The researcher
ensured there was a high ethical standard by maintaining the integrity and dignity of the
respondents. This was done by ensuring that all the questionnaires do not have items
that may cause anxiety and discomfort among the respondents. The researcher also
conducted himself well by ensuring that he had courtesy to his respondents. There was
no room for deception and the researcher revealed the full intention of the research to
the respondent.
30
CHAPTER FOUR
DATA ANALYSIS AND PRESENTATION
4.1 Introduction
This chapter presents the data analysis, presentations and interpretations of the findings
on relationship between capital structure and financial performance of SMEs with
reference to Embu County. Collected data is tabulated using tables and pie charts and
then analyzed using descriptive statistics, ANOVA, Pearson’s correlation coefficients
and multiple linear regression analysis. The chapter captures study findings, analysis
and results from data that has been collected by use of questionnaires. 58
questionnaires were issued to the sampled respondents, 42(72.4%) were fully filled and
collected. Statistical Package for Social Sciences (SPSS) version 20 was used to
analyze data. Descriptive statistics (means, standard deviation, variances, kurtosis and
skewness) presented data in a manageable form so as to describe features of the
collected data in the study. Also some tests that included multicollinearity,
heteroscedastic and normality were carried to test the correlation between the
independent variables (equity capital, debt capital and retained earnings) that showed
there was no interdependence on the variable. On the predictor model, multiple
regression analysis was carried out between dependent and independent variables. The
model was found to of good fit. The chapter provides answers to the research questions
and provides a basis for confirmation of relationships and conclusions.
4.2 Response Rate
The researcher dropped 58 questionnaires to the sampled respondents but only picked
42 questionnaires, which were fully responded to giving an approximately 72%. 42
respondents (72%) was deemed satisfactory for the study and for generalization of the
findings. Conversely, 16 respondents (28%) did not return their questionnaires. The
high response is attributable to collaboration and enthusiasm by the respondents to take
part in the study and adequate groundwork by the researcher.
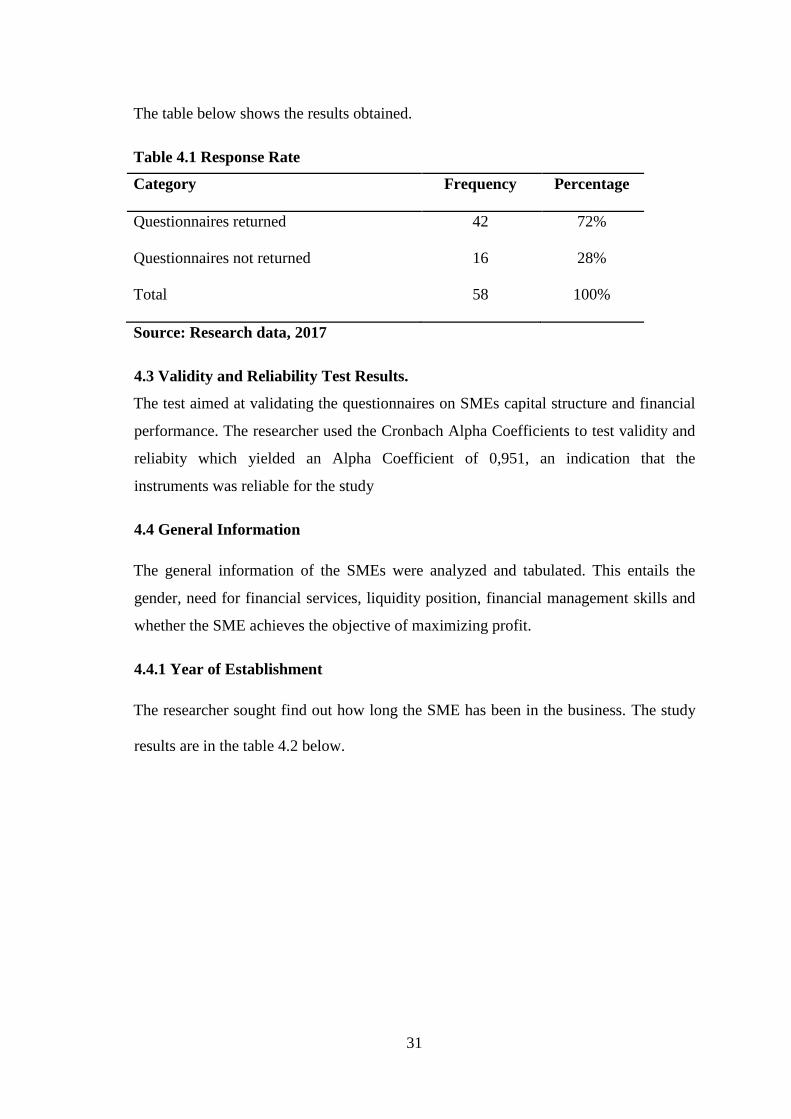
31
The table below shows the results obtained.
Table 4.1 Response Rate
Category Frequency Percentage
Questionnaires returned 42 72%
Questionnaires not returned 16 28%
Total 58 100%
Source: Research data, 2017
4.3 Validity and Reliability Test Results.
The test aimed at validating the questionnaires on SMEs capital structure and financial
performance. The researcher used the Cronbach Alpha Coefficients to test validity and
reliabity which yielded an Alpha Coefficient of 0,951, an indication that the
instruments was reliable for the study
4.4 General Information
The general information of the SMEs were analyzed and tabulated. This entails the
gender, need for financial services, liquidity position, financial management skills and
whether the SME achieves the objective of maximizing profit.
4.4.1 Year of Establishment
The researcher sought find out how long the SME has been in the business. The study
results are in the table 4.2 below.
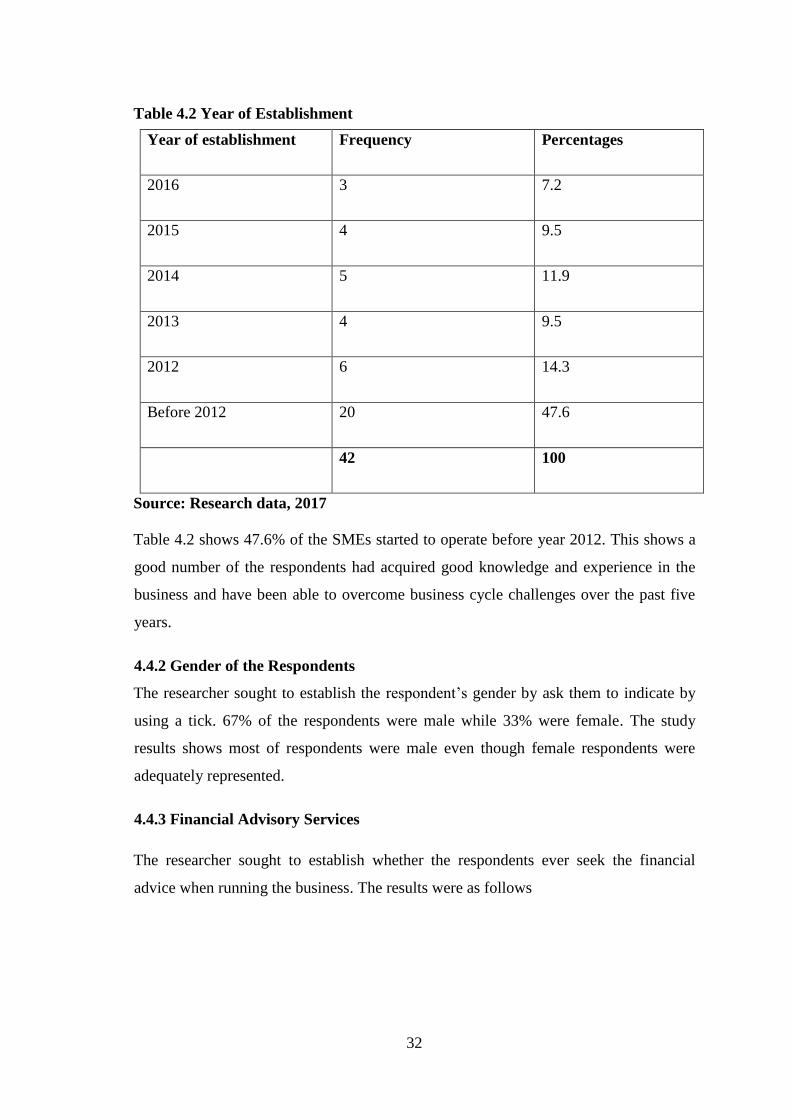
32
Table 4.2 Year of Establishment
Year of establishment Frequency Percentages
2016 3 7.2
2015 4 9.5
2014 5 11.9
2013 4 9.5
2012 6 14.3
Before 2012 20 47.6
42 100
Source: Research data, 2017
Table 4.2 shows 47.6% of the SMEs started to operate before year 2012. This shows a
good number of the respondents had acquired good knowledge and experience in the
business and have been able to overcome business cycle challenges over the past five
years.
4.4.2 Gender of the Respondents
The researcher sought to establish the respondent’s gender by ask them to indicate by
using a tick. 67% of the respondents were male while 33% were female. The study
results shows most of respondents were male even though female respondents were
adequately represented.
4.4.3 Financial Advisory Services
The researcher sought to establish whether the respondents ever seek the financial
advice when running the business. The results were as follows
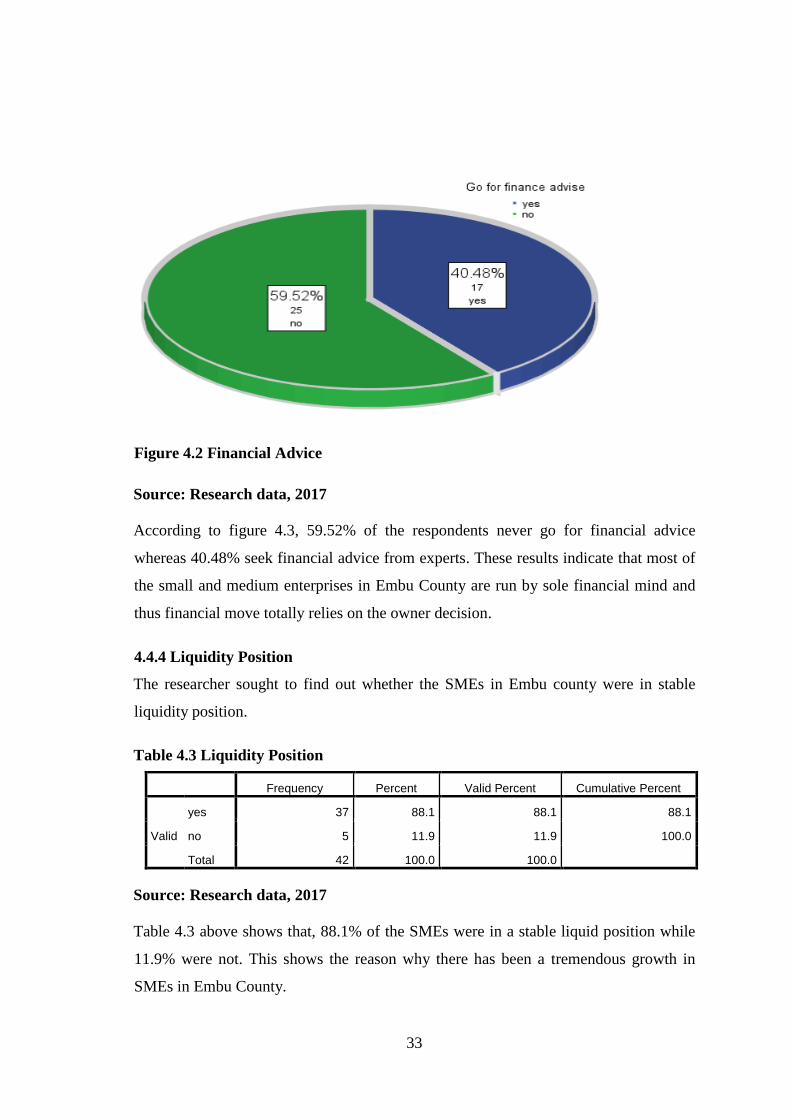
33
Figure 4.2 Financial Advice
Source: Research data, 2017
According to figure 4.3, 59.52% of the respondents never go for financial advice
whereas 40.48% seek financial advice from experts. These results indicate that most of
the small and medium enterprises in Embu County are run by sole financial mind and
thus financial move totally relies on the owner decision.
4.4.4 Liquidity Position
The researcher sought to find out whether the SMEs in Embu county were in stable
liquidity position.
Table 4.3 Liquidity Position
Frequency Percent Valid Percent Cumulative Percent
Valid
yes 37 88.1 88.1 88.1
no 5 11.9 11.9 100.0
Total 42 100.0 100.0
Source: Research data, 2017
Table 4.3 above shows that, 88.1% of the SMEs were in a stable liquid position while
11.9% were not. This shows the reason why there has been a tremendous growth in
SMEs in Embu County.
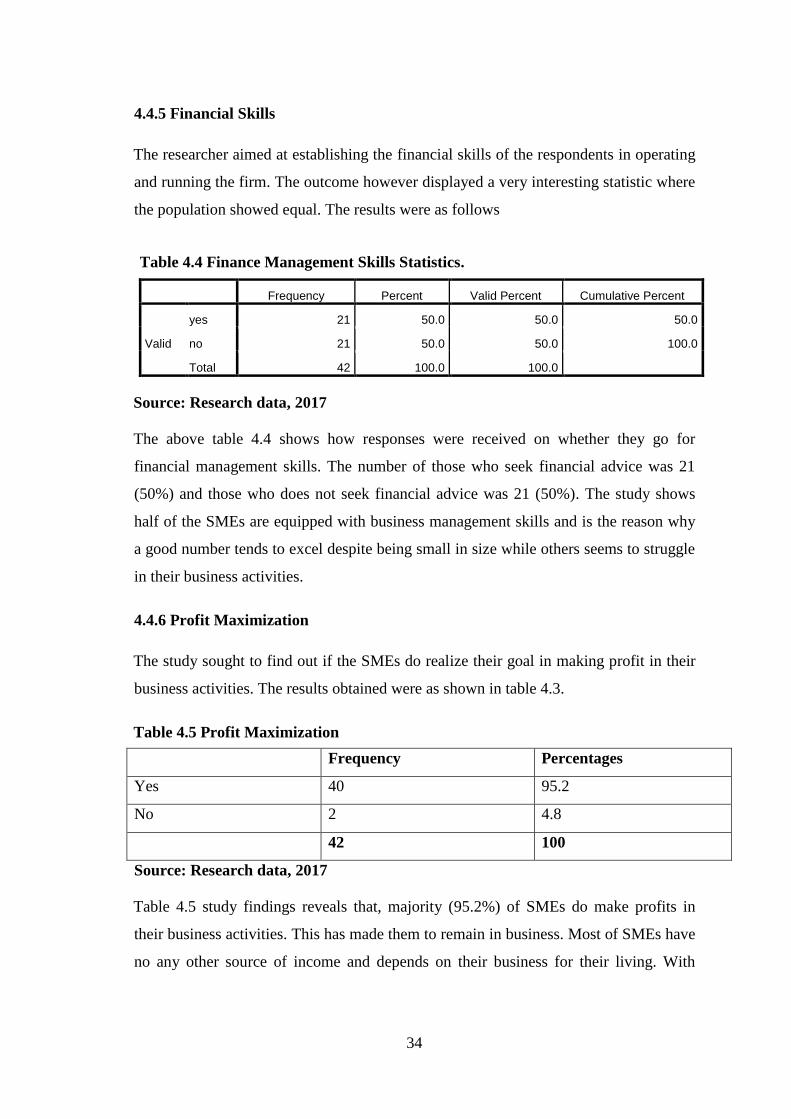
34
4.4.5 Financial Skills
The researcher aimed at establishing the financial skills of the respondents in operating
and running the firm. The outcome however displayed a very interesting statistic where
the population showed equal. The results were as follows
Table 4.4 Finance Management Skills Statistics.
Frequency Percent Valid Percent Cumulative Percent
Valid
yes 21 50.0 50.0 50.0
no 21 50.0 50.0 100.0
Total 42 100.0 100.0
Source: Research data, 2017
The above table 4.4 shows how responses were received on whether they go for
financial management skills. The number of those who seek financial advice was 21
(50%) and those who does not seek financial advice was 21 (50%). The study shows
half of the SMEs are equipped with business management skills and is the reason why
a good number tends to excel despite being small in size while others seems to struggle
in their business activities.
4.4.6 Profit Maximization
The study sought to find out if the SMEs do realize their goal in making profit in their
business activities. The results obtained were as shown in table 4.3.
Table 4.5 Profit Maximization
Frequency Percentages
Yes 40 95.2
No 2 4.8
42 100
Source: Research data, 2017
Table 4.5 study findings reveals that, majority (95.2%) of SMEs do make profits in
their business activities. This has made them to remain in business. Most of SMEs have
no any other source of income and depends on their business for their living. With
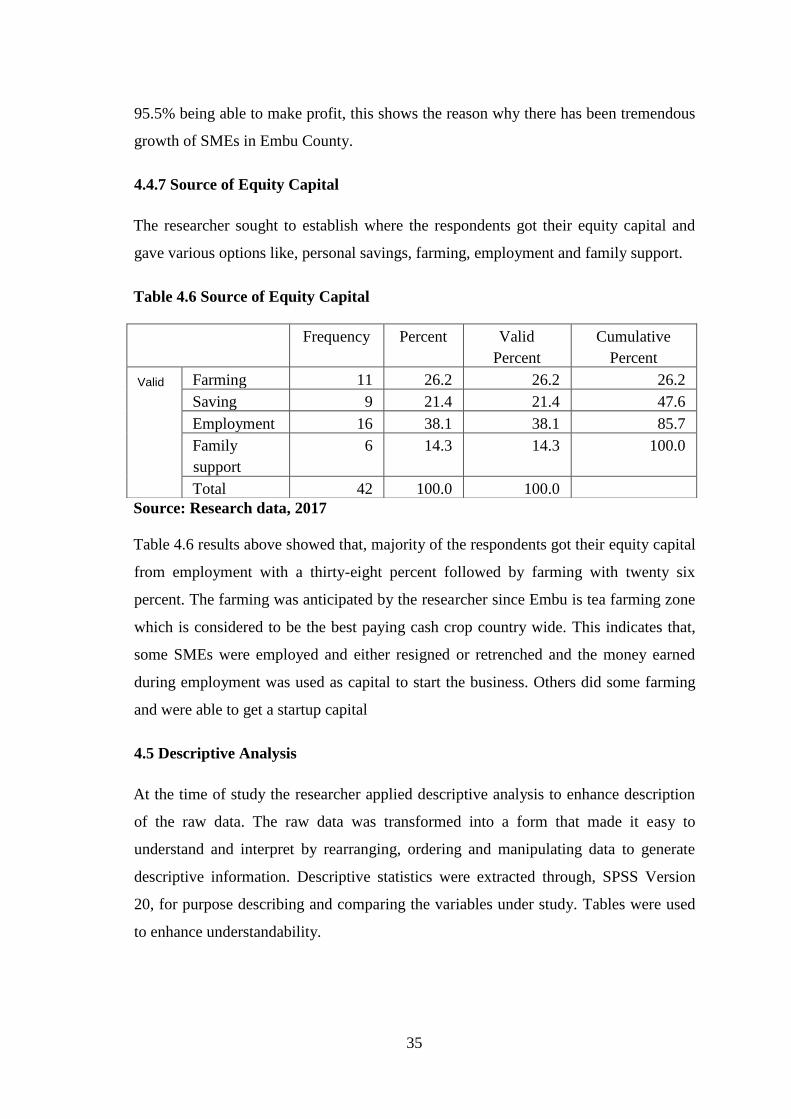
35
95.5% being able to make profit, this shows the reason why there has been tremendous
growth of SMEs in Embu County.
4.4.7 Source of Equity Capital
The researcher sought to establish where the respondents got their equity capital and
gave various options like, personal savings, farming, employment and family support.
Table 4.6 Source of Equity Capital
Source: Research data, 2017
Table 4.6 results above showed that, majority of the respondents got their equity capital
from employment with a thirty-eight percent followed by farming with twenty six
percent. The farming was anticipated by the researcher since Embu is tea farming zone
which is considered to be the best paying cash crop country wide. This indicates that,
some SMEs were employed and either resigned or retrenched and the money earned
during employment was used as capital to start the business. Others did some farming
and were able to get a startup capital
4.5 Descriptive Analysis
At the time of study the researcher applied descriptive analysis to enhance description
of the raw data. The raw data was transformed into a form that made it easy to
understand and interpret by rearranging, ordering and manipulating data to generate
descriptive information. Descriptive statistics were extracted through, SPSS Version
20, for purpose describing and comparing the variables under study. Tables were used
to enhance understandability.
Frequency Percent Valid
Percent
Cumulative
Percent
Valid Farming 11 26.2 26.2 26.2
Saving 9 21.4 21.4 47.6
Employment 16 38.1 38.1 85.7
Family
support
6 14.3 14.3 100.0
Total 42 100.0 100.0
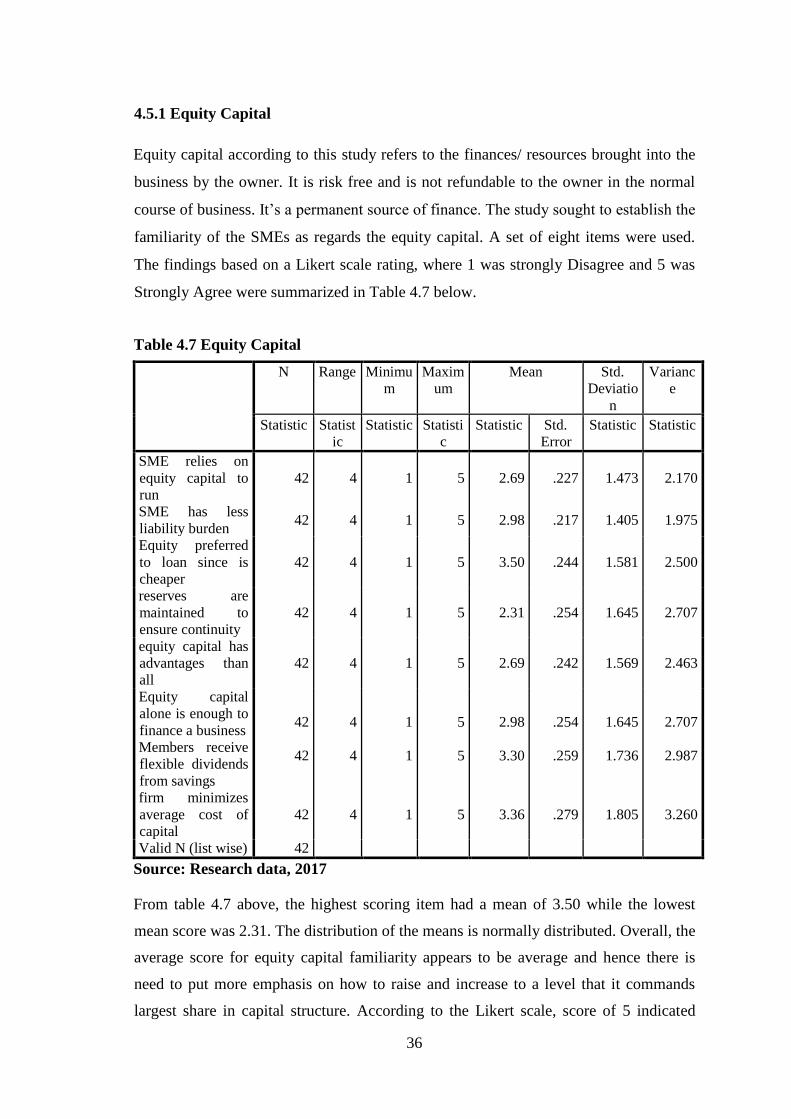
36
4.5.1 Equity Capital
Equity capital according to this study refers to the finances/ resources brought into the
business by the owner. It is risk free and is not refundable to the owner in the normal
course of business. It’s a permanent source of finance. The study sought to establish the
familiarity of the SMEs as regards the equity capital. A set of eight items were used.
The findings based on a Likert scale rating, where 1 was strongly Disagree and 5 was
Strongly Agree were summarized in Table 4.7 below.
Table 4.7 Equity Capital
N Range Minimu
m
Maxim
um
Mean Std.
Deviatio
n
Varianc
e
Statistic Statist
ic
Statistic Statisti
c
Statistic Std.
Error
Statistic Statistic
SME relies on
equity capital to
run
42 4 1 5 2.69 .227 1.473 2.170
SME has less
liability burden 42 4 1 5 2.98 .217 1.405 1.975
Equity preferred
to loan since is
cheaper
42 4 1 5 3.50 .244 1.581 2.500
reserves are
maintained to
ensure continuity
42 4 1 5 2.31 .254 1.645 2.707
equity capital has
advantages than
all
42 4 1 5 2.69 .242 1.569 2.463
Equity capital
alone is enough to
finance a business
Members receive
flexible dividends
from savings
42
42
4
4
1
1
5
5
2.98
3.30
.254
.259
1.645
1.736
2.707
2.987
firm minimizes
average cost of
capital
42 4 1 5 3.36 .279 1.805 3.260
Valid N (list wise) 42
Source: Research data, 2017
From table 4.7 above, the highest scoring item had a mean of 3.50 while the lowest
mean score was 2.31. The distribution of the means is normally distributed. Overall, the
average score for equity capital familiarity appears to be average and hence there is
need to put more emphasis on how to raise and increase to a level that it commands
largest share in capital structure. According to the Likert scale, score of 5 indicated
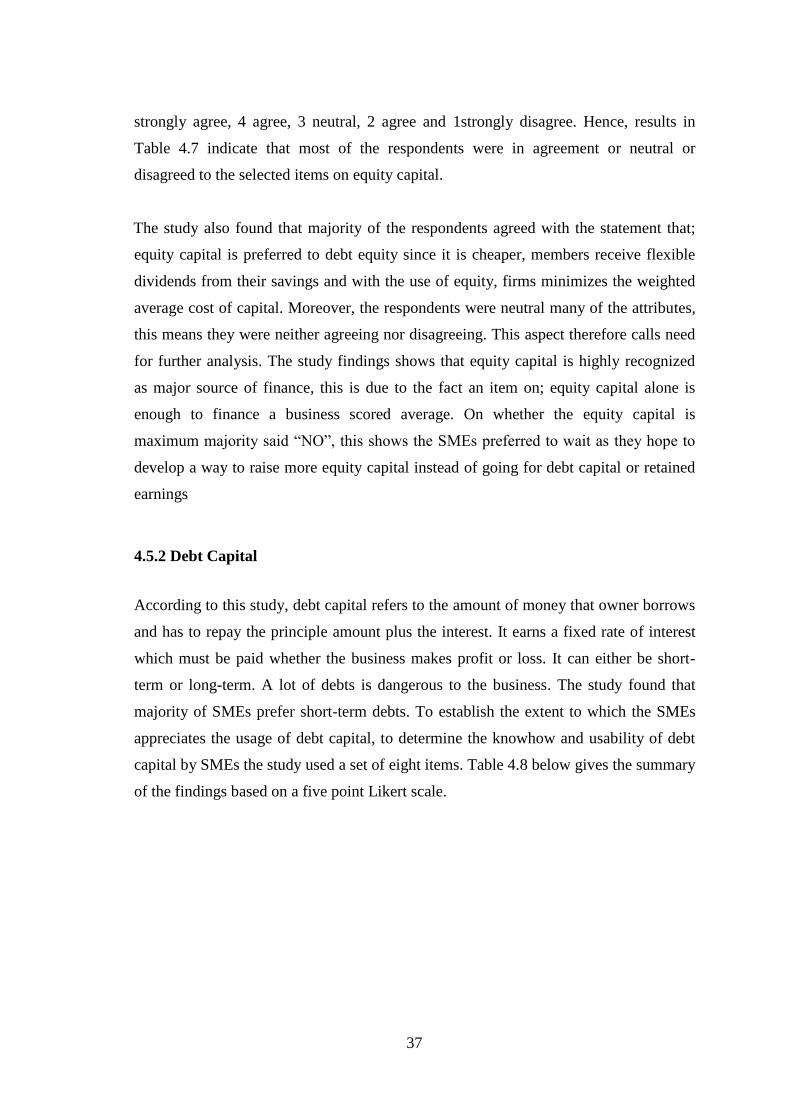
37
strongly agree, 4 agree, 3 neutral, 2 agree and 1strongly disagree. Hence, results in
Table 4.7 indicate that most of the respondents were in agreement or neutral or
disagreed to the selected items on equity capital.
The study also found that majority of the respondents agreed with the statement that;
equity capital is preferred to debt equity since it is cheaper, members receive flexible
dividends from their savings and with the use of equity, firms minimizes the weighted
average cost of capital. Moreover, the respondents were neutral many of the attributes,
this means they were neither agreeing nor disagreeing. This aspect therefore calls need
for further analysis. The study findings shows that equity capital is highly recognized
as major source of finance, this is due to the fact an item on; equity capital alone is
enough to finance a business scored average. On whether the equity capital is
maximum majority said “NO”, this shows the SMEs preferred to wait as they hope to
develop a way to raise more equity capital instead of going for debt capital or retained
earnings
4.5.2 Debt Capital
According to this study, debt capital refers to the amount of money that owner borrows
and has to repay the principle amount plus the interest. It earns a fixed rate of interest
which must be paid whether the business makes profit or loss. It can either be short-
term or long-term. A lot of debts is dangerous to the business. The study found that
majority of SMEs prefer short-term debts. To establish the extent to which the SMEs
appreciates the usage of debt capital, to determine the knowhow and usability of debt
capital by SMEs the study used a set of eight items. Table 4.8 below gives the summary
of the findings based on a five point Likert scale.
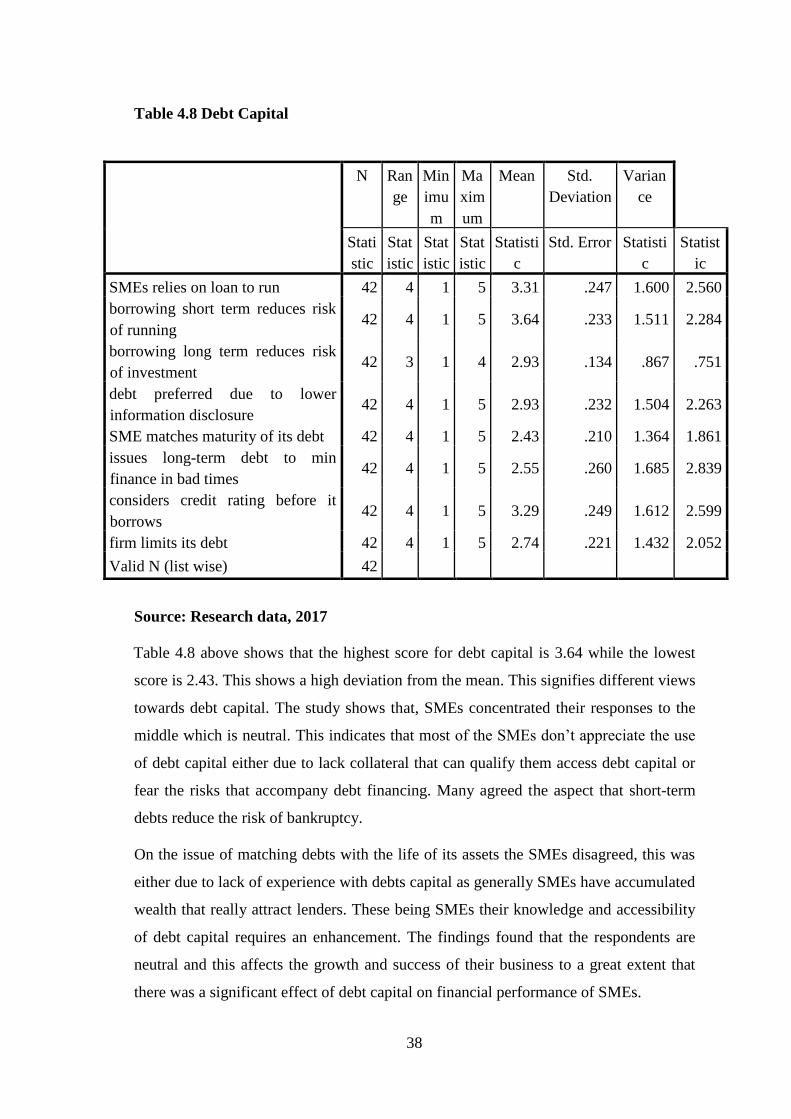
38
Table 4.8 Debt Capital
Source: Research data, 2017
Table 4.8 above shows that the highest score for debt capital is 3.64 while the lowest
score is 2.43. This shows a high deviation from the mean. This signifies different views
towards debt capital. The study shows that, SMEs concentrated their responses to the
middle which is neutral. This indicates that most of the SMEs don’t appreciate the use
of debt capital either due to lack collateral that can qualify them access debt capital or
fear the risks that accompany debt financing. Many agreed the aspect that short-term
debts reduce the risk of bankruptcy.
On the issue of matching debts with the life of its assets the SMEs disagreed, this was
either due to lack of experience with debts capital as generally SMEs have accumulated
wealth that really attract lenders. These being SMEs their knowledge and accessibility
of debt capital requires an enhancement. The findings found that the respondents are
neutral and this affects the growth and success of their business to a great extent that
there was a significant effect of debt capital on financial performance of SMEs.
N Ran
ge
Min
imu
m
Ma
xim
um
Mean Std.
Deviation
Varian
ce
Stati
stic
Stat
istic
Stat
istic
Stat
istic
Statisti
c
Std. Error Statisti
c
Statist
ic
SMEs relies on loan to run 42 4 1 5 3.31 .247 1.600 2.560
borrowing short term reduces risk
of running 42 4 1 5 3.64 .233 1.511 2.284
borrowing long term reduces risk
of investment 42 3 1 4 2.93 .134 .867 .751
debt preferred due to lower
information disclosure 42 4 1 5 2.93 .232 1.504 2.263
SME matches maturity of its debt 42 4 1 5 2.43 .210 1.364 1.861
issues long-term debt to min
finance in bad times 42 4 1 5 2.55 .260 1.685 2.839
considers credit rating before it
borrows 42 4 1 5 3.29 .249 1.612 2.599
firm limits its debt 42 4 1 5 2.74 .221 1.432 2.052
Valid N (list wise) 42
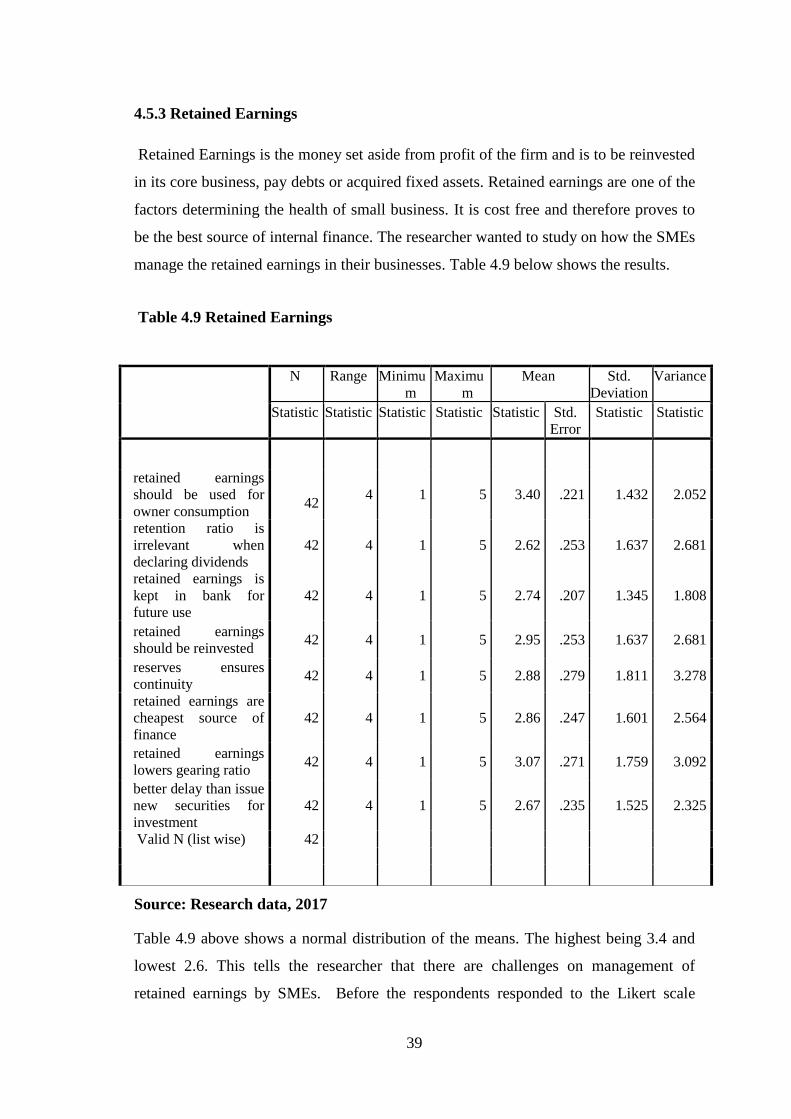
39
4.5.3 Retained Earnings
Retained Earnings is the money set aside from profit of the firm and is to be reinvested
in its core business, pay debts or acquired fixed assets. Retained earnings are one of the
factors determining the health of small business. It is cost free and therefore proves to
be the best source of internal finance. The researcher wanted to study on how the SMEs
manage the retained earnings in their businesses. Table 4.9 below shows the results.
Table 4.9 Retained Earnings
Source: Research data, 2017
Table 4.9 above shows a normal distribution of the means. The highest being 3.4 and
lowest 2.6. This tells the researcher that there are challenges on management of
retained earnings by SMEs. Before the respondents responded to the Likert scale
N Range Minimu
m
Maximu
m
Mean Std.
Deviation
Variance
Statistic Statistic Statistic Statistic Statistic Std.
Error
Statistic Statistic
retained earnings
should be used for
owner consumption
42 4 1 5 3.40 .221 1.432 2.052
retention ratio is
irrelevant when
declaring dividends
42 4 1 5 2.62 .253 1.637 2.681
retained earnings is
kept in bank for
future use
42 4 1 5 2.74 .207 1.345 1.808
retained earnings
should be reinvested 42 4 1 5 2.95 .253 1.637 2.681
reserves ensures
continuity 42 4 1 5 2.88 .279 1.811 3.278
retained earnings are
cheapest source of
finance
42 4 1 5 2.86 .247 1.601 2.564
retained earnings
lowers gearing ratio 42 4 1 5 3.07 .271 1.759 3.092
better delay than issue
new securities for
investment
42 4 1 5 2.67 .235 1.525 2.325
Valid N (list wise) 42
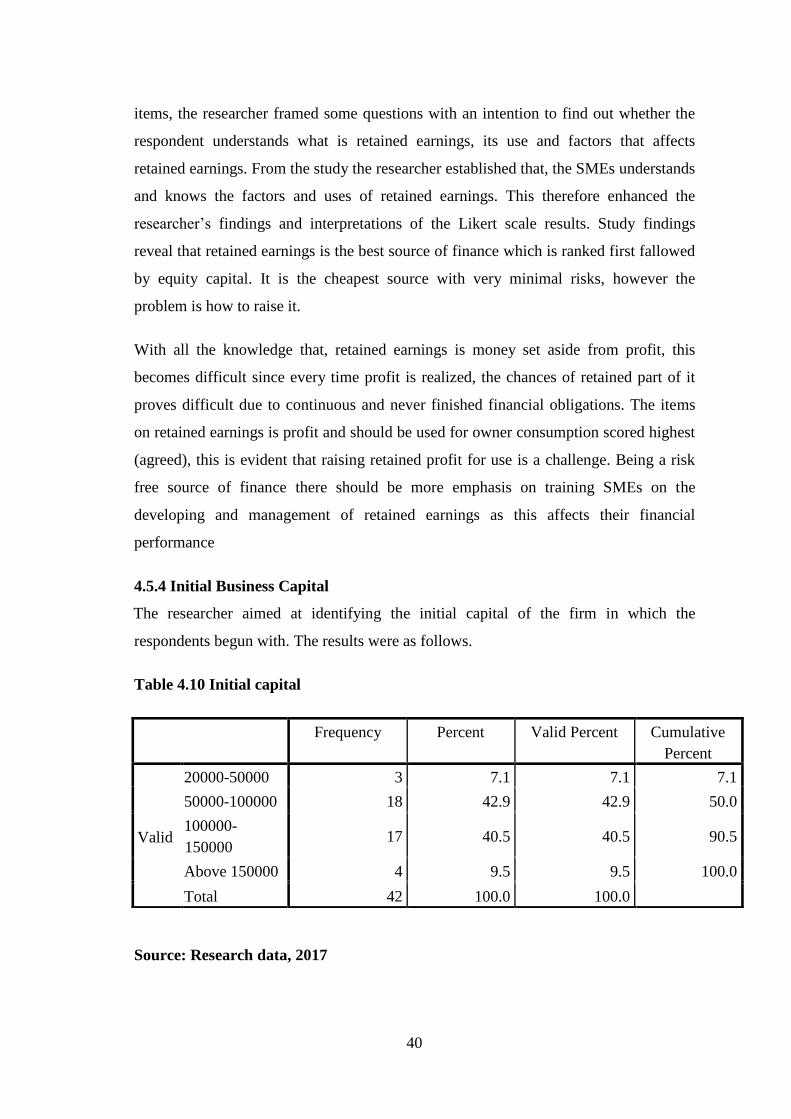
40
items, the researcher framed some questions with an intention to find out whether the
respondent understands what is retained earnings, its use and factors that affects
retained earnings. From the study the researcher established that, the SMEs understands
and knows the factors and uses of retained earnings. This therefore enhanced the
researcher’s findings and interpretations of the Likert scale results. Study findings
reveal that retained earnings is the best source of finance which is ranked first fallowed
by equity capital. It is the cheapest source with very minimal risks, however the
problem is how to raise it.
With all the knowledge that, retained earnings is money set aside from profit, this
becomes difficult since every time profit is realized, the chances of retained part of it
proves difficult due to continuous and never finished financial obligations. The items
on retained earnings is profit and should be used for owner consumption scored highest
(agreed), this is evident that raising retained profit for use is a challenge. Being a risk
free source of finance there should be more emphasis on training SMEs on the
developing and management of retained earnings as this affects their financial
performance
4.5.4 Initial Business Capital
The researcher aimed at identifying the initial capital of the firm in which the
respondents begun with. The results were as follows.
Table 4.10 Initial capital
Source: Research data, 2017
Frequency Percent Valid Percent Cumulative
Percent
Valid
20000-50000 3 7.1 7.1 7.1
50000-100000 18 42.9 42.9 50.0
100000-
150000 17 40.5 40.5 90.5
Above 150000 4 9.5 9.5 100.0
Total 42 100.0 100.0
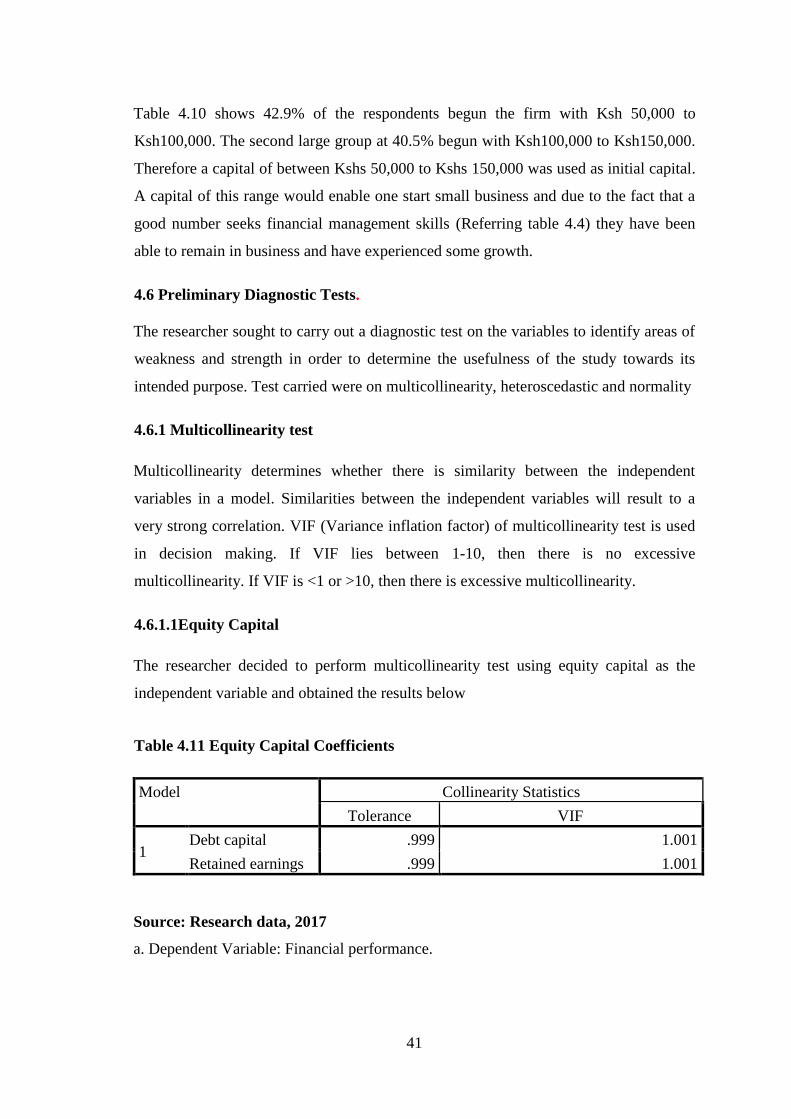
41
Table 4.10 shows 42.9% of the respondents begun the firm with Ksh 50,000 to
Ksh100,000. The second large group at 40.5% begun with Ksh100,000 to Ksh150,000.
Therefore a capital of between Kshs 50,000 to Kshs 150,000 was used as initial capital.
A capital of this range would enable one start small business and due to the fact that a
good number seeks financial management skills (Referring table 4.4) they have been
able to remain in business and have experienced some growth.
4.6 Preliminary Diagnostic Tests.
The researcher sought to carry out a diagnostic test on the variables to identify areas of
weakness and strength in order to determine the usefulness of the study towards its
intended purpose. Test carried were on multicollinearity, heteroscedastic and normality
4.6.1 Multicollinearity test
Multicollinearity determines whether there is similarity between the independent
variables in a model. Similarities between the independent variables will result to a
very strong correlation. VIF (Variance inflation factor) of multicollinearity test is used
in decision making. If VIF lies between 1-10, then there is no excessive
multicollinearity. If VIF is <1 or >10, then there is excessive multicollinearity.
4.6.1.1Equity Capital
The researcher decided to perform multicollinearity test using equity capital as the
independent variable and obtained the results below
Table 4.11 Equity Capital Coefficients
Model Collinearity Statistics
Tolerance VIF
1 Debt capital .999 1.001
Retained earnings .999 1.001
Source: Research data, 2017
a. Dependent Variable: Financial performance.
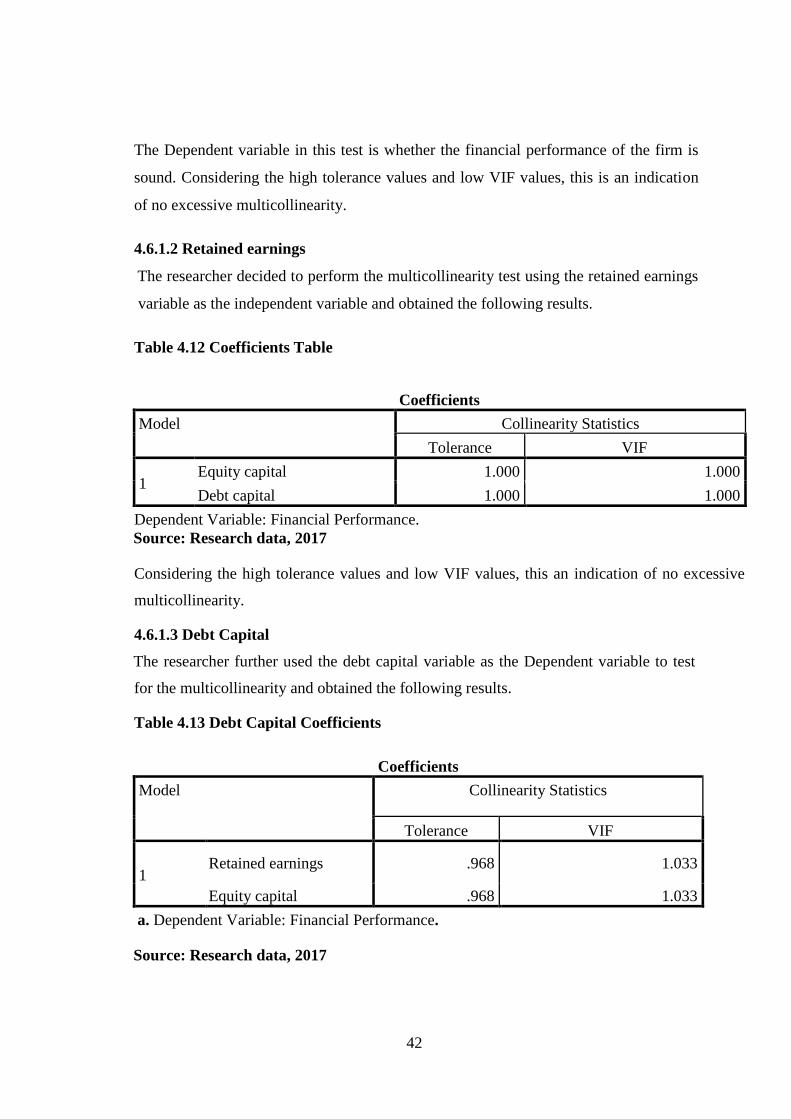
42
The Dependent variable in this test is whether the financial performance of the firm is
sound. Considering the high tolerance values and low VIF values, this is an indication
of no excessive multicollinearity.
4.6.1.2 Retained earnings
The researcher decided to perform the multicollinearity test using the retained earnings
variable as the independent variable and obtained the following results.
Table 4.12 Coefficients Table
Coefficients
Model Collinearity Statistics
Tolerance VIF
1 Equity capital 1.000 1.000
Debt capital 1.000 1.000
Dependent Variable: Financial Performance.
Source: Research data, 2017
Considering the high tolerance values and low VIF values, this an indication of no excessive
multicollinearity.
4.6.1.3 Debt Capital
The researcher further used the debt capital variable as the Dependent variable to test
for the multicollinearity and obtained the following results.
Table 4.13 Debt Capital Coefficients
Coefficients
Model Collinearity Statistics
Tolerance VIF
1 Retained earnings .968 1.033
Equity capital .968 1.033
a. Dependent Variable: Financial Performance.
Source: Research data, 2017
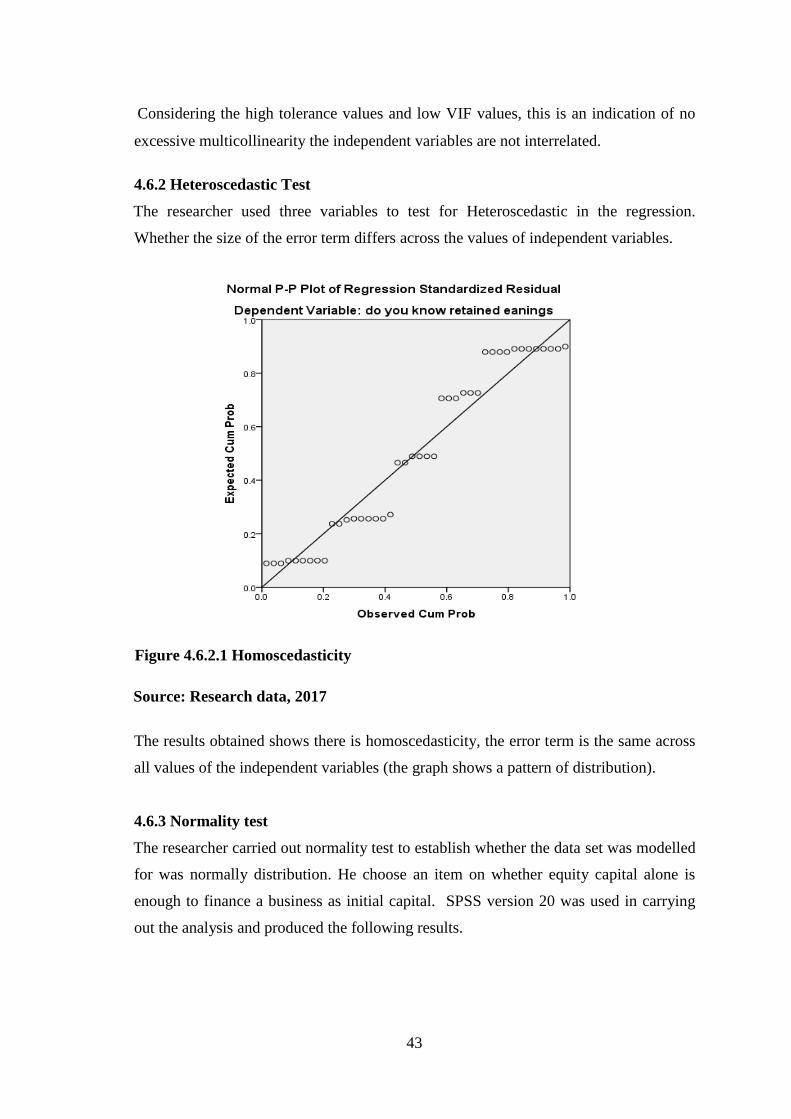
43
Considering the high tolerance values and low VIF values, this is an indication of no
excessive multicollinearity the independent variables are not interrelated.
4.6.2 Heteroscedastic Test
The researcher used three variables to test for Heteroscedastic in the regression.
Whether the size of the error term differs across the values of independent variables.
Figure 4.6.2.1 Homoscedasticity
Source: Research data, 2017
The results obtained shows there is homoscedasticity, the error term is the same across
all values of the independent variables (the graph shows a pattern of distribution).
4.6.3 Normality test
The researcher carried out normality test to establish whether the data set was modelled
for was normally distribution. He choose an item on whether equity capital alone is
enough to finance a business as initial capital. SPSS version 20 was used in carrying
out the analysis and produced the following results.
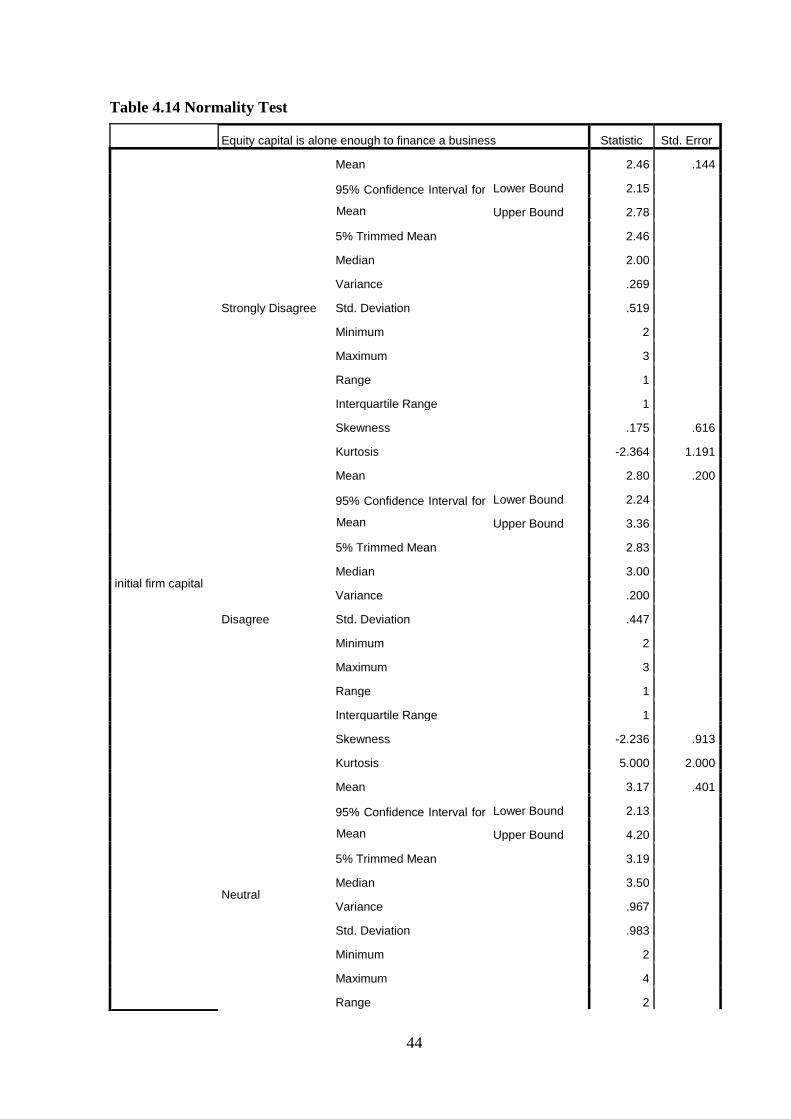
44
Table 4.14 Normality Test
Equity capital is alone enough to finance a business Statistic Std. Error
initial firm capital
Strongly Disagree
Mean 2.46 .144
95% Confidence Interval for
Mean
Lower Bound 2.15
Upper Bound 2.78
5% Trimmed Mean 2.46
Median 2.00
Variance .269
Std. Deviation .519
Minimum 2
Maximum 3
Range 1
Interquartile Range 1
Skewness .175 .616
Kurtosis -2.364 1.191
Disagree
Mean 2.80 .200
95% Confidence Interval for
Mean
Lower Bound 2.24
Upper Bound 3.36
5% Trimmed Mean 2.83
Median 3.00
Variance .200
Std. Deviation .447
Minimum 2
Maximum 3
Range 1
Interquartile Range 1
Skewness -2.236 .913
Kurtosis 5.000 2.000
Neutral
Mean 3.17 .401
95% Confidence Interval for
Mean
Lower Bound 2.13
Upper Bound 4.20
5% Trimmed Mean 3.19
Median 3.50
Variance .967
Std. Deviation .983
Minimum 2
Maximum 4
Range 2
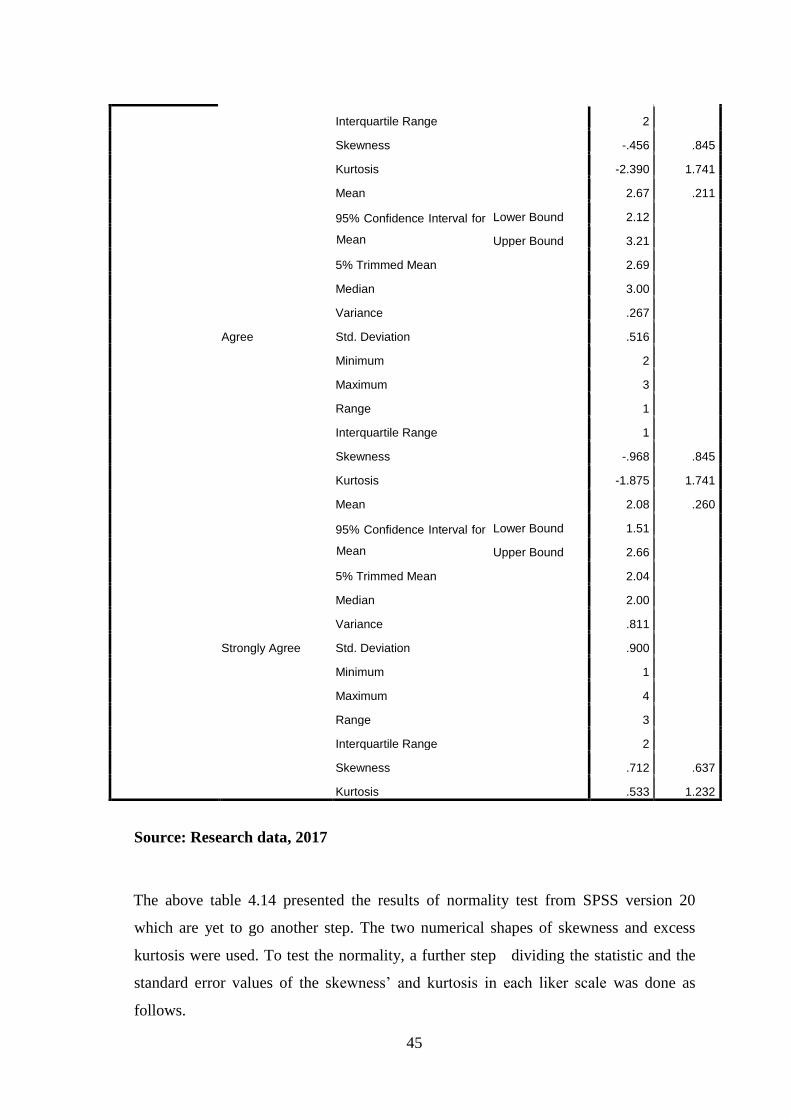
45
Source: Research data, 2017
The above table 4.14 presented the results of normality test from SPSS version 20
which are yet to go another step. The two numerical shapes of skewness and excess
kurtosis were used. To test the normality, a further step dividing the statistic and the
standard error values of the skewness’ and kurtosis in each liker scale was done as
follows.
Interquartile Range 2
Skewness -.456 .845
Kurtosis -2.390 1.741
Agree
Mean 2.67 .211
95% Confidence Interval for
Mean
Lower Bound 2.12
Upper Bound 3.21
5% Trimmed Mean 2.69
Median 3.00
Variance .267
Std. Deviation .516
Minimum 2
Maximum 3
Range 1
Interquartile Range 1
Skewness -.968 .845
Kurtosis -1.875 1.741
Strongly Agree
Mean 2.08 .260
95% Confidence Interval for
Mean
Lower Bound 1.51
Upper Bound 2.66
5% Trimmed Mean 2.04
Median 2.00
Variance .811
Std. Deviation .900
Minimum 1
Maximum 4
Range 3
Interquartile Range 2
Skewness .712 .637
Kurtosis .533 1.232
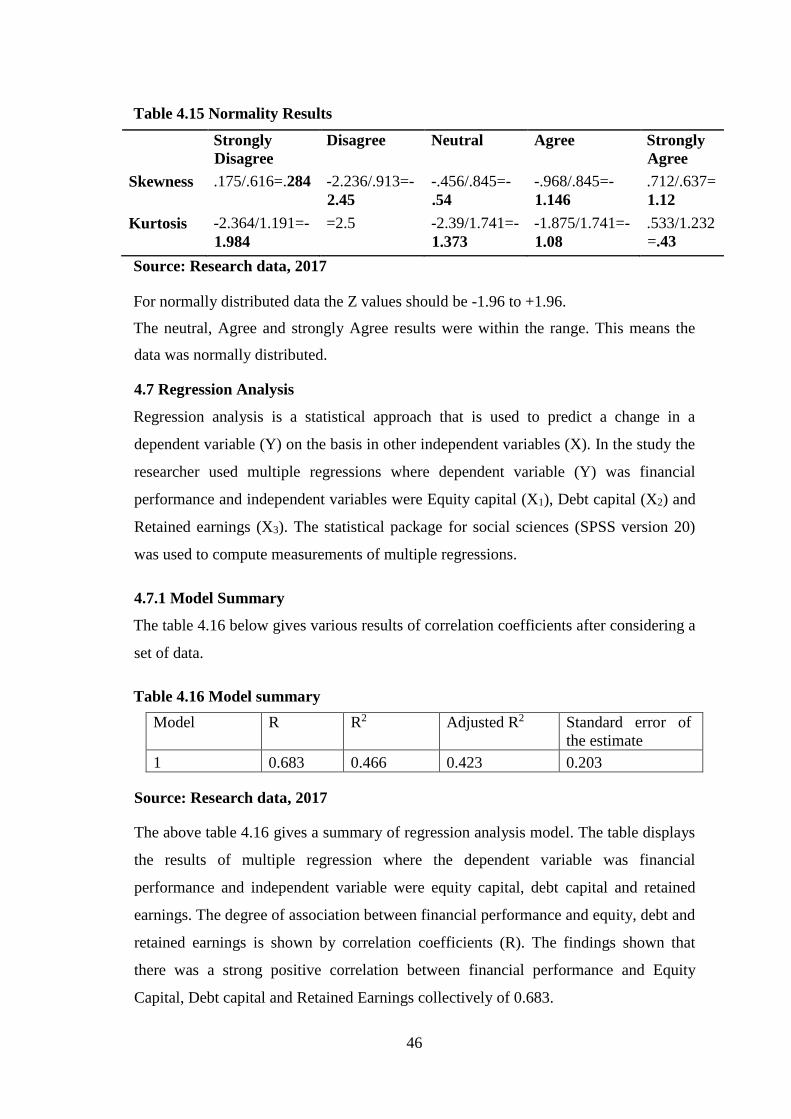
46
Table 4.15 Normality Results
Strongly
Disagree
Disagree Neutral Agree Strongly
Agree
Skewness .175/.616=.284 -2.236/.913=-
2.45
-.456/.845=-
.54
-.968/.845=-
1.146
.712/.637=
1.12
Kurtosis -2.364/1.191=-
1.984
=2.5 -2.39/1.741=-
1.373
-1.875/1.741=-
1.08
.533/1.232
=.43
Source: Research data, 2017
For normally distributed data the Z values should be -1.96 to +1.96.
The neutral, Agree and strongly Agree results were within the range. This means the
data was normally distributed.
4.7 Regression Analysis
Regression analysis is a statistical approach that is used to predict a change in a
dependent variable (Y) on the basis in other independent variables (X). In the study the
researcher used multiple regressions where dependent variable (Y) was financial
performance and independent variables were Equity capital (X1), Debt capital (X2) and
Retained earnings (X3). The statistical package for social sciences (SPSS version 20)
was used to compute measurements of multiple regressions.
4.7.1 Model Summary
The table 4.16 below gives various results of correlation coefficients after considering a
set of data.
Table 4.16 Model summary
Model R R2 Adjusted R2 Standard error of
the estimate
1 0.683 0.466 0.423 0.203
Source: Research data, 2017
The above table 4.16 gives a summary of regression analysis model. The table displays
the results of multiple regression where the dependent variable was financial
performance and independent variable were equity capital, debt capital and retained
earnings. The degree of association between financial performance and equity, debt and
retained earnings is shown by correlation coefficients (R). The findings shown that
there was a strong positive correlation between financial performance and Equity
Capital, Debt capital and Retained Earnings collectively of 0.683.
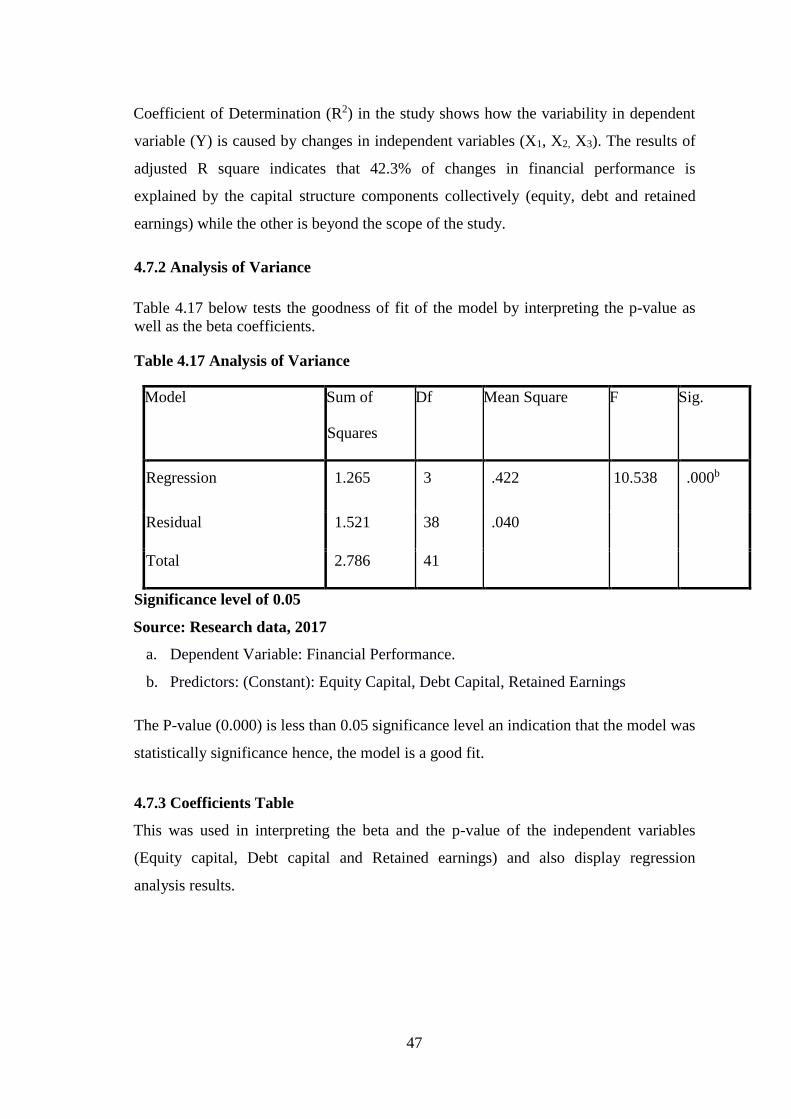
47
Coefficient of Determination (R2) in the study shows how the variability in dependent
variable (Y) is caused by changes in independent variables (X1, X2, X3). The results of
adjusted R square indicates that 42.3% of changes in financial performance is
explained by the capital structure components collectively (equity, debt and retained
earnings) while the other is beyond the scope of the study.
4.7.2 Analysis of Variance
Table 4.17 below tests the goodness of fit of the model by interpreting the p-value as
well as the beta coefficients.
Table 4.17 Analysis of Variance
b. Predictors: (Constant): Equity Capital, Debt Capital, Retained Earnings
The P-value (0.000) is less than 0.05 significance level an indication that the model was
statistically significance hence, the model is a good fit.
4.7.3 Coefficients Table
This was used in interpreting the beta and the p-value of the independent variables
(Equity capital, Debt capital and Retained earnings) and also display regression
analysis results.
Model Sum of
Squares
Df Mean Square F Sig.
1
Regression 1.265 3 .422 10.538 .000b
Residual 1.521 38 .040
Total 2.786 41
Significance level of 0.05
Source: Research data, 2017
a. Dependent Variable: Financial Performance.
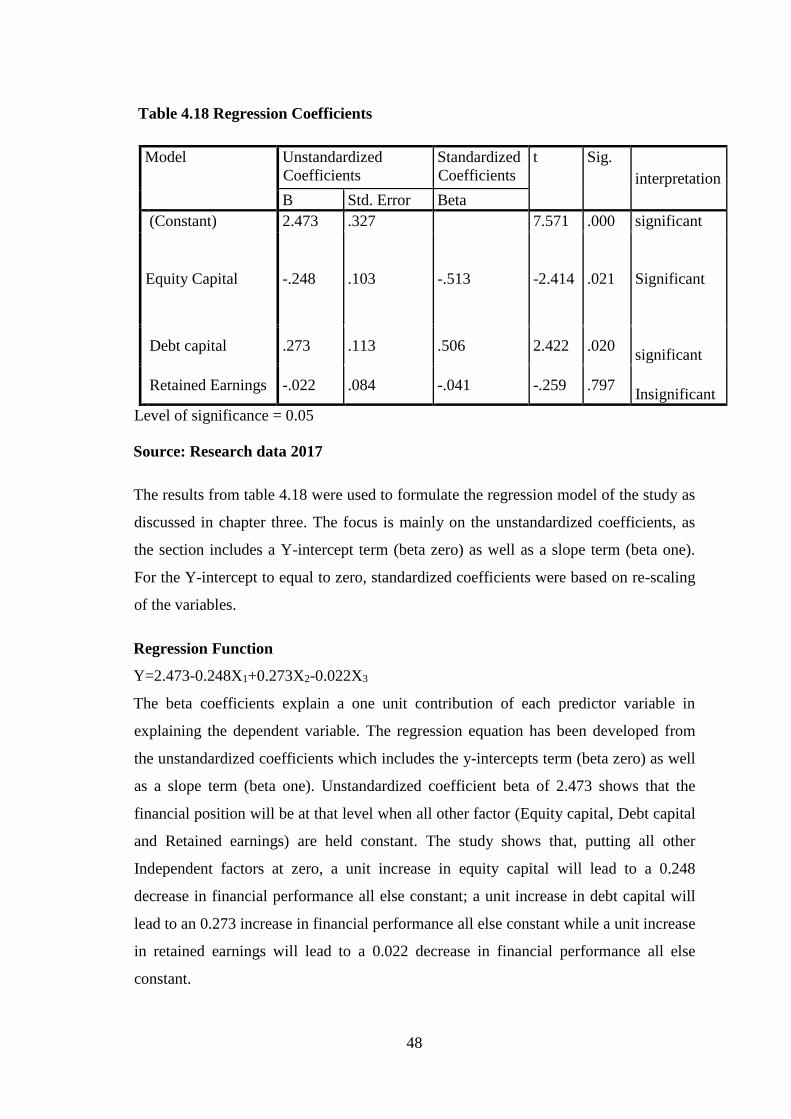
48
Table 4.18 Regression Coefficients
Model Unstandardized
Coefficients
Standardized
Coefficients
t Sig.
interpretation
B Std. Error Beta
1
(Constant) 2.473 .327 7.571 .000 significant
Equity Capital -.248 .103 -.513 -2.414 .021
Significant
Debt capital .273 .113 .506 2.422 .020
significant
Retained Earnings -.022 .084 -.041 -.259 .797
Insignificant
Level of significance = 0.05
Source: Research data 2017
The results from table 4.18 were used to formulate the regression model of the study as
discussed in chapter three. The focus is mainly on the unstandardized coefficients, as
the section includes a Y-intercept term (beta zero) as well as a slope term (beta one).
For the Y-intercept to equal to zero, standardized coefficients were based on re-scaling
of the variables.
Regression Function
Y=2.473-0.248X1+0.273X2-0.022X3
The beta coefficients explain a one unit contribution of each predictor variable in
explaining the dependent variable. The regression equation has been developed from
the unstandardized coefficients which includes the y-intercepts term (beta zero) as well
as a slope term (beta one). Unstandardized coefficient beta of 2.473 shows that the
financial position will be at that level when all other factor (Equity capital, Debt capital
and Retained earnings) are held constant. The study shows that, putting all other
Independent factors at zero, a unit increase in equity capital will lead to a 0.248
decrease in financial performance all else constant; a unit increase in debt capital will
lead to an 0.273 increase in financial performance all else constant while a unit increase
in retained earnings will lead to a 0.022 decrease in financial performance all else
constant.
49
The statistical significance of individual capital structure components on financial
performance can be explained by the p-values. Out of the three independent variables,
two have a p-value that is less than 0.05. Equity capital has 0.021, hence the study
rejects the null hypothesis that equity capital does not have a significant effect on
financial performance. A p-value, (0.020). The study finds that debt capital has a
significant effect on financial performance. Hence, a null hypothesis that debt capital
does not have a significant effect on financial performance is hereby rejected. The p-
value of SME relying on retained earnings to run the business was 0.797, this is greater
than 0.05. Hence, the null hypothesis that a retained earnings does not have a
significant effect on financial performance is hereby accepted.
4.8 Discussions and Key Findings
The causal research design was applied as it involved collection, verification and
synthesis of evidence that establishes facts that defended or refuted a hypothesis. The
findings indicated a strong positive relationship of 0.683 between variables. Also
revealed 45.4% capital structure of SMEs can be explained by independent variables.
The researcher used stratified sampling technique to reach at 28 SMEs. The study
found that a retained earnings was the cheapest source of finance. The study
recommended that an entrepreneur should go for a capital mix that will give an
optimum capital structure. No business small or large can operate with only one type of
capital. Also more training to SMEs is needed to ensure proper utilization of available
finance.
The study findings indicated a strong positive correlation (R=0.683) which is above the
average 0.5. There was also a variation of 46.6% on financial performance of SMEs in
Embu County due to changes in equity capital, debt capital and retained earnings. The
findings of the study indicated that, most of the SMEs (42.86%) stated their business
with a capital of around Kshs. 50,000 to Kshs 100,000. About 59.52% go for financial
advice; this has made SMEs in Embu County experience tremendous growth in recent
years. The general statistics showed there was skewed distribution of the data used. On
the preferred capital, equity capital proofed to be preferred by many respondents (about
61.9%) as compared to debt capital, however many SMEs cannot afford enough equity
capital and relies on debt capital. Githaiga (2015) states that, the abundance of loan
50
facilities plus the demanding approval requirements of the scantly available equity fund
have led many of the SMEs to resort to debt.
On the source of equity capital, majority got their equity capital from employment.
Retained Earnings has proved to be the best source of capital. Myers and Majlufs
(1984) argue that adverse selection implies that retained earnings are better than debt
and debt is better than equity. The similarity independent variables were tested negative
since all the three VIF were between 1 and 10. The pattern in the distribution graph
indicated the error term was the same across all values of the independent variable. The
sets of data were normally distributed and had a relationship. The analysis of variance
had p-value of less than 0.05 indicating a model that was of good fit.
51
CHAPTER FIVE
SUMMARY, CONCLUSION AND RECOMMENDATIONS
5.1 Introduction
The chapter targets to capture the results from the study which signifies how the capital
structure affects the financial performance of SME’s. It will present a summary of the
findings, give conclusions and suggest recommendations according to the research
objectives. To be able to raise an optimum capital structure that comprises equity
capital, debt capital and retained earnings the study will give recommendations on how
to choose the best source and the ratio that gives the optimum capital structure. It will
also give limitations encountered during the study and suggestions for further research.
5.2 Summary
The goal of the study was to find the effects of capital on financial performance of
SMEs in Embu County. To enhance the achievement of objectives the researcher
sampled registered SMEs in Embu County as at 31st December 2016. Primary data was
used in this study. Was collected by use of questionnaires that contained open and
closed ended questions. The respondents were required to fill both qualitative and
quantitative data. For data analysis, the researcher applied Statistical package for Social
Sciences (SPSS version 20) data analysis software to analyze quantitative data together
with descriptive and thereafter presented it in tables and figures.
The study sought to investigate the effects of capital structure on financial performance
of small and medium enterprises in Embu County. The independent variables were
Equity capital, Debt capital and Retained earnings while financial performance was the
dependent variable. The study tested three null hypotheses that included; Equity capital
does not have significant effect, Debt capital does not have significant effect and
Retained earnings does not have significant effect on financial performance of SMEs in
Embu County, Kenya. According to the study findings, equity capital and debt capital
have significant effect while retained earnings doesn’t have significant effect on
financial performance of SMEs. This depends on how much each source represents in
52
the capital structure. Each SME will have its own composition of the capital structure
that ensures minimum weighted average of cost of capital.
The study was to establish the effect of equity capital on financial performance of
SMEs in Embu County. Equity capital is what the owner contributes to the business; it
is permanent source of finance. Quite a number of SMEs appreciated the fact that
equity capital is the best source of finance especially when one is starting the business.
This is due to its low risk unlike debt capital that a business can suffer a lot in case of
unforeseen eventuality that may lead closure. The study findings were clear that, no
SME can raise enough equity capital hence there is need for other sources of finance.
Many small businesses raises there equity capital from personal savings and family
support. The findings also revealed that equity holders are entitled to divided that keeps
on varying depending on the business performance. The null hypothesis is therefore not
true since the study have shown equity capital has a significant effect on financial
performance of SMEs in Embu County.
The study findings reveal was a significant effect on financial performance from debt
capital. The researcher found that SMEs are aware of what is debt finance, is the
money borrowed and repayable with an interest. Majority prefers a short-term loan
which according to them has low risk and also lack collateral. There is need to have a
good relationship with financial institutions (banks) which must be maintained by
adhering to the terms and conditions. The study found that equity capital is limited to
sources but debt capital will depend an assessment and judgment from the lending
institution. Even though debt capital can be available anytime, the study found that one
cannot borrow any amount since this can lead to liquidity problems due high gearing.
This therefore supports the alternative hypothesis that debt capital has a significant
effect on financial performance of SMEs in Embu County.
The study was to determine whether retained earnings have significant effect on
financial performance of SMEs. For better results the researcher sought to find out
whether the SMEs has information about its uses and factors that may affect retained
earnings of a firm. According to the findings retained earnings is the money set aside
from the profit. It may be affected by factors like dividends paid, net profit for the year,
age of the organization and future plans of the firm. The researcher found that SMEs
recommended some uses of retained earnings that includes paying debts, purchasing
53
fixed assets, expanding the business and supporting core business activities like
research. On the side of raising finance retained earnings proved to be the cheapest
source. However, many firms find difficulties in raising retained earnings due to non-
controllable factors like economic, political, climatic etc that makes it hard for a firm to
breakeven hence small profit margin or none at all. The study therefore accepts the null
hypothesis and finds that, retained earnings does not have a significant effect on
financial performance of SMEs in Embu County.
5.3 Conclusion
According to the study capital structure is an important factor on the financial
performance of small and medium enterprise in Embu County. The study has indicated
that a good number of respondents understands the concepts of equity capital and
prefers it as a source of finance as it is not redeemable and it is permanent source of
finance. The owner controls the business and enjoys profits whenever it’s high and
bears the risk alone. It does not entail any charge. This therefore shows equity capital
forms higher proportion of capital structure hence has a significant effect on financial
performance of SMEs.
Debt capital has a negative effect on the performance of SMEs due to its fixed interest
that must be paid where the firm makes profit or not. The study concludes that, firms
with good asset base attracts lending financial institutions hence boosting their
performance as they are able to face challenges that are in business cycles. However,
the study refutes high rate of borrowing as this can have negative effect to the financial
performance of a firm especially when gearing ratio exceeds limit. It’s quite important
for every firm irrespective of the size acquire fixed assets so as to boost their financial
position and build the borrowing capacity. The study therefore shows that, debt capital
has a significant effect on financial performance.
From the study retaining earnings was well appreciated irrespective of not having a
significant effect on financial performance due to challenges of raising it. It stands a
chance of being the best source of finance for expansion because it is the cheapest and
painless method of raising additional capital. It is money set aside from profit, therefore
for any business to raise retained earnings it must make profit and have a good
retention policy. Many businesses have therefore preferred equity and debt capital in
54
financing their operations. It can be used to expand the business, acquire fixed assets,
and repay loans and implementation of future plans all geared towards improving
financial performance of the firm. The researcher concludes that retained earnings have
insignificant effect on financial performance of SMEs.
5.4 Recommendations
Having established the effect of capital structure on financial performance of SMEs in
Embu County, the researcher would wish to give recommendations to various
stakeholders which includes management, lending institutions, government and
researchers. Management of SMEs should ensure that the capital structure of the firm is
always at optimum. The firm cannot only survive on equity capital due to its low risk,
also cannot wholly depend on debts due to high risk, more so retained earnings is only
realized after making profit. They should develop an investment policy that will enable
them maintain an optimum capital structure. I further recommend them to seek
financial advisory services and carry out a continuous survey of their firm’s liquidity
position and an audit to their books of account.
On lending institutions, they will understand why despite the high number of SMEs in
Embu County not all are able to qualify for debt capital. They are limited by lack of
collateral. The lending institution should develop structured ways of financing SMEs so
as to boost their financial performance which may improve their lending business.
Lending institution need to develop products like asset financing that are tailor made to
the SMEs. Also they should organize informative forums and seminars that will
enhance their interactions with SMEs. Most of the SMEs have psychological fear
against the financial institutions like banks and beliefs that, those are for big
businesses. So its high time the lending institutions make effort to breach the gap
between them and SMEs.
The Government benefits indirectly from the operations of SMEs, have great impact
towards the economy, when they thrive it’s to the benefit of the government. They pay
tax and provides employment to many people, these are some the factors that facilitate
economic growth. The government should create a conducive environment for the
SMEs. The government through its organs like chamber of commerce should formulate
policies that will see SMEs do their business and grow to large business. SMEs need
55
things like proper security, good infrastructure and business friendly policies that can
enhance the growth of their business.
The study focused on capital structure and its effects on financial performance. To the
researchers I would recommend them to research on how cost of capital affects capital
structure of the firm the firm. They will establish on how one would arrive at optimum
capital employed after mixing all the available sources of capital. This might help one
understand the relationship between cost capital and financial performance of a firm.
Also they can use the study findings in supporting their findings and citing so as to
enhance their study findings. This can be of great importance since the study is among
the latest and has captured most of current research findings on capital structure and
financial performance
5.5 Limitations of the Study
The study encountered a few limitations which were worth noting. On financial
performance the figures required were only on annual basis. Analysis was therefore
done on annual figures creating assumptions that they were evenly distributed
throughout the year. Some SMEs could hide some data for fear of information reaching
the competitor and therefore gave estimates which may have affected study findings.
The aim was to have two respondents per SME business to fill the questionnaire with a
position of a manager and a proprietor which was a challenge as these are small
businesses, however the researcher found a good number of SMEs that met the
expectation. In addition there was a challenge of tracing the proprietors due to their
busy schedule and not always at the premises. Due to respondents busy schedule the
time given for them to fill the questionnaires was not enough, this made the researcher
adjust his program to allow for an extension of one week. Others were not willing to
give the information due to its sensitivity. Accessibility of SMEs was a challenge
considering their fairly remote locations and the size of Embu County. Time was also a
constraining factor considering that the researcher was not working in Embu County.
5.6 Contribution to knowledge
The study findings indicated that equity capital, debt capital and retained earnings have
significant effects on financial performance of SMEs. The findings will help SMEs and
other businesses on determining the optimum capital structure of their firms. The study
56
findings will also enhance the knowhow of the business communities on how they can
improve their financial performance. The study findings can work for both small and
large business since an optimal capital structure is a major factor towards a healthy
financial performance. These findings can also be of great relevance to financial
institution, they need to know that even SMEs can contribute towards their financial
objective (profit maximization). The governments need to put more focus to the SMEs,
this is supported by the fact that SMEs contributes significantly to the economy by
paying taxes and creating jobs. The researchers need also to utilize the study in
comparing the results of their study on capital structure and financial performance as
well as support their findings on founded similarity as they carry out their own.
5.7 Areas for Further Research
The study having established that capital structure has a significant effect on financial
performance, the researcher recommends a further study on establishing a ratio that can
be recommended on components of capital structure. Study findings revealed equity
capital as the most preferred source of capital, the researcher recommends a further
research on debt capital and retained that could improve their preference to the same
level as that of equity capital. The study only considered SMEs in Embu County the
findings indicated a great effect of capital structure on financial performance. The
researcher therefore recommends a similar study in other counties to be done in order
to generalize the findings. Contrary to the researcher’s expectation that SMEs do not
have skills of managing business, quite a number have undertaken business courses in
various institutions and forums. A similar study on large businesses in Kenya may also
be of significance so as to have a bigger picture on capital structure and financial
performance. Finally a research should be carried out where a large sample is used in
this case to see if the model summary could be affected and see its reliability in
prediction of performance of SMEs in Kenya.
57
REFERENCES
Abor, J. (2005). The Effect of Capital Structure on Profitability: An Empirical analysis
of Listed Firms in Ghana. Journal of Risk Finance, 6(4): 38-47.
Adekunle, P. (2009), Determinants of capital structure: empirical evidence from the
Czech Republic, Czech Journal of Economics and Finance, 54, (7): 2-21.
Amit, P and Shoemaker, E. (2003), Managerial entrenchment and capital structure
decisions, Journal of Finance, 52, (1): 11-38.
Bas, T., Muradoglu G., & Phylaktis, K. (2009). Determinants of Capital Structure in
Emerging Markets. Cass Business School.
Baxter, N. (2007). Leverage, risk of ruin and the cost of capital. The Journal of
Finance, 22. (3): 395-403.
Berger and di Patti. (2002). Capital Structure and Firm Performance: A New Approach
to Testing Agency Theory and an Application to the Banking Industry. Feds
Paper.
Berger, A.N., Bonaccorsi di Patti, E. (2006), Capital structure and firm performance: a
new approach to testing agency theory and an application to the banking
industry, Journal of Banking& Finance, 30 (4): 65-102.
Berger, T.J., Oliver, B.R. and Pua, S.L.H. (2007), On the relation between ownership
structure and capital structure, Accounting and Finance, 42, (6): 1-26.
Bhaduri, S. (2002), Determinants of corporate borrowing: some evidence from the
Indian corporate structure, Journal of Economic and Finance, 26,(8): 2-15.
Brealey, R. A., Myers, S. C., & Marcus, A. J. (2001). Fundamentals of Corporate
Finance (3rd edition.). New York: McGraw-Hill.
Brigham, E. F. and Ehrhardt ,M. C. (2004. Financial Management: Theory and
Practice,11thEdition, South-Western College Publishers, New York.
Brush, C., Bromiley, P., & Hendrickx, M. (2000). The free cash flow hypothesis for
sales growth and firm performance. Strategic Management Journal, 21, (4):
455-472.
58
Chaganti, R. and Damanpour, F. (2001), Institutional ownership, capital structure and
firm , Strategic Management Journal, 12, (4): 79-93.
Chen, C. and Steiner, T. (2009). Managerial ownership and agency conflicts: a
nonlinear simultaneus equation analysis of managerial ownership, risk taking,
debt policy, and dividend policy, Journal of Financial Review,34, (1)19-36.
Cheng, J.J. (2004). Determinants of capital structure of Chinese-listed companies,
Journal of Business Research, 57(13): 41-51.
Cooper, D. R., Schindler, P. S., & Sun, J. (2006). Business research methods.
Copeland, T., Koller, T., & Murrin, J. (2000). Valuation: Measuring and Managing the
Value of Companies (Third ed.). New York: John Wiley & Sons, Inc.
Crutchley, C., and R. S. Hansen (2009). A Test of the Agency Theory of Managerial
Ownership, Corporate Leverage, and Corporate Dividends. Financial
management journal, 23 (6):36 46.
Crutchley, C.E. and Jensen, M.R.H. (2006), Changes in corporate debt policy:
information assymmetry and agency factors, journal of Managerial Finance,
22, (7): 1-16.
Denscombe, M. (2008). Communities of practice a research paradigm for the mixed
methods approach. Journal of mixed methods research, 2(3), 270-283.
Ebaid, E. I. (2009). The impact of capital-structure choice on firm performance:
empirical evidence from Egypt. The Journal of Risk Finance, 10(5): 477-487.
Elimuti, L. and Kathawala, R. (2009). Dividend Policy and the earned/contributed
capital mix: a test of the life-cycle theory. Journal of Financial Economics,
81(9): 227-254.
Farma,E. & French, K.(2002).Testing Trade off and Pecking Predictions about
Dividends and Debt, Review of financial studies, 15(7): 1-33.
Friend, I. and J. Hasbrouck, (2008), Determinants of Capital Structure, in Research in
Finance Greenwhich, CT. Jai Press, Inc.
Gomez, L.J. (2005). Principles of Managerial Finance. (7thEdition). New York: Harper
Collins College Publishers.
59
Grier, A. and Zychowicz, S. (2004). The Debt-Equity Choice. The Journal of Financial
and Quantitative Analysis, 36, (1): 1-24.
Hadlock, C. and James, C. (2002). Do banks provide financial slack? Journal of
Finance, 57, (9):34-20.
Hanh, B. L. T. (2009). Impact of financial variables on the production efficiency of
Pangasius Firms inan Giang province, Vietnam.
Harris, A. Android, H. (2010).Determinants of target capital structure: The case of dual
debt and equity issues', Journal of Financial Economics, 71,(3): 517-40.
Harris, M. and Raviv, A (2000). Capital structure and the informational role of debt.
Journal of Finance 45, (1): 321-349.
Jensen MC, Meckling W (2006). Theory of the firm: managerial behavior, agency
costs, and Capital structure. Journal of Finance and Economics, 3, (1): 305-360.
Jensen, M. C (2006). Agency costs of free cash flow and corporate finance and
takeovers. Jounal of Economics Review, 7 (6): 323-339.
John, K. and Williams, J. (2005), Dividends, dilution, and taxes: a signaling
equilibrium The Journal of Finance, 40, (10): 53-70.
Kaumbuthu, A.J. (2011) The relationship between capital structure and financial
performance: a study of firms listed under industrial and allied sector at the
NSE,(MBA Dissertation, university of Nairobi ,2011). Retrieved from
http://erepository.uonbi.ac.ke.
Kothari, C. (2008). Pretesting in questionnaire design: The impact of respondent
characteristics on error detection. Journal of the Market Research Society, 36
(10): 295–314.
Leland, H.E. and Pyle, D.H. (2007), Informational asymmetries, financial structure,
and financial intermediation . The journal of Finance, 32(3): 71-87.
Maina G. K (2014) The Effects of Capital Structure on Financial Performance of Small
and Medium Enterprises in Diary Sector, Kiambu County
Miller, M.H. and Kevin, R. (2005), Dividend policy under asymmetric information,
The Journal of finance, 40(10):31-51.
60
Modigliani, F. & Miller, M.H. (2003). The cost of capital, corporation finance and the
theory of Investment. American Economic Review, 48 (2): 61-97.
Modigliani, F. and Miller, M. (2008), The cost of capital, corporate finance and the
theory of Investment, of America Economic Review, 48, (2): 61-97.
Mugenda, M., O. and Mugenda, G., A (2003) »Research Methods: Quantitative And
Qualitative Approaches. Laba graphics services.
Myers, S.C. and Majluf, N.S., (2004). Corporate financing and investment decisions
when firms have information that investors do not have‟, Journal of Financial
Economics, 13(7):187 221.
OECD (1976), SMEs: Employment, Innovation and Growth- The Washington
Workshop Paris
Ogebe, P. O., Ogebe, J. O., & Alewi, K. (2013). Capital Structure and Firms‟
Performance in Nigeria. Available at SSRN 2266916.
Pandy, I M.(2009). Financial Management, New Delhi; Vikas Publishing House
Penman, S. H. (2001). Financial Statement Analysis and Security Valuation. New
York: McGraw-Hill.
Pettit, R. and Singer, R. (2005). Small business finance: a research agenda, Financial
Management, 7 (6): 47-60.
Pindalo, J. L. Rodrigues C. de La Torre (2006). “How Does Financial Distress Affect
Small Firm’ Financial Structure ?” Small Business Economic, 26, 377-391.
Rajan, R.G. and Zingales, L. (2005), What do we know about capital structure? Some
evidence from international data, Journal of Finance, 50(14): 21-60.
Stiglitz, J. (2002), On irrelevance of corporate financial policy, American Economic
Review, 64 (6): 851-66.
Stiglitz, R (2004). Managerial discretion and optimal financing policies. Journal of
Finance and Economics, 20(12): 3- 27.
Titman, S. (2004), The determinants of capital structure choice, Journal of Finance,
43(2): 119.

61
Tong, S. and Ning, Y. (2004), Does capital structure affect institutional investor
choices? TheJournal of Investing, 28(4): 53-66.

62
APPENDICES
APPENDIX A: LETTER OF INTRODUCTION
My name is Joseph Kinyua Ruri. I am undertaking a master’s degree course in Business
Administration (Finance Option) at Kenyatta University. I am currently undertaking a
research study on the EFFECTS OF CAPITAL STRUCTURE ON FINANCIAL
PERFORMANCE OF SMALL AND MEDIUM ENTERPRISES IN EMBU
COUNTY, KENYA. The purpose of this letter is to request you to provide the
necessary information that is required to enable me achieve the objectives of this study.
Kindly note that all your responses will be treated with utmost CONFIDENTIALITY.
It is important that you give honest views. Please read the items CAREFULLY and
UNDERSTAND and answer ALL the questions in both sections.
Thank you for your anticipated responses.
Yours faithfully,
JOSEPH KINYUA RURI
D53/OL/EMB/26718/2014
MOBILE: 0721-474 372
Email: [email protected]

63
APPENDIX B: QUESTIONNAIRE
QUESTIONNAIRE No: .................... Date..../...../2017
(Information provided will be highly confidential)
SECTION A: GENERAL INFOMATION
1. Which year was the business established? (tick)
2016
2015
2014
2013
2012
Before 2012
2. Please indicate your gender MALE [ ] FEMALE [ ]
3. Do you go for services of financial adviser? YES [ ] NO [ ]
If yes, which services………………………………………………………….
4. Is the liquidity position of the business at risk? YES [ ] NO [ ]
Please explain your answer above …………………………………………..
……………………………………………………………………………….
5. Have you acquired any financial management skills? YES [ ] NO [ ]
Please explain your answer above ……………………………………………
………………………………………………………………………………….
6. The core objective of an entrepreneur is maximizing profit. Does the business
achieve this objective? YES [ ] NO [ ]
Please briefly explain your answer above ………………………………………
……………………………………………………………………………………
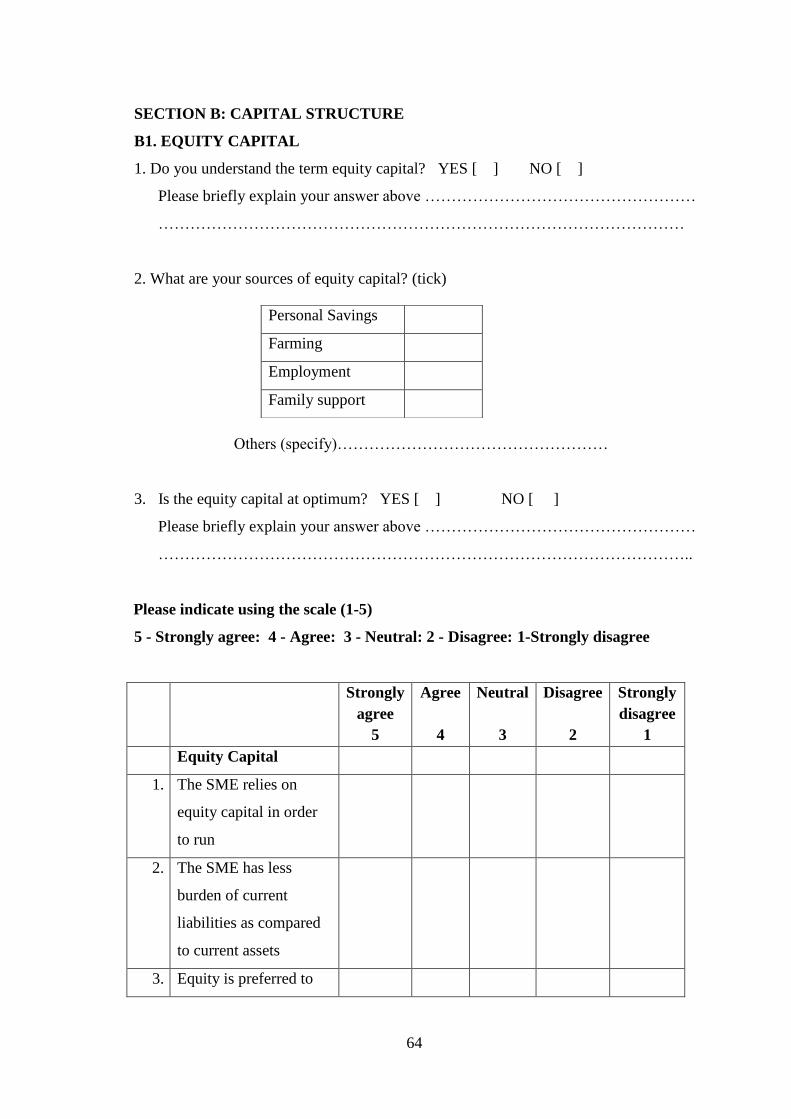
64
SECTION B: CAPITAL STRUCTURE
B1. EQUITY CAPITAL
1. Do you understand the term equity capital? YES [ ] NO [ ]
Please briefly explain your answer above ……………………………………………
………………………………………………………………………………………
2. What are your sources of equity capital? (tick)
Others (specify)……………………………………………
3. Is the equity capital at optimum? YES [ ] NO [ ]
Please briefly explain your answer above ……………………………………………
………………………………………………………………………………………..
Please indicate using the scale (1-5)
5 - Strongly agree: 4 - Agree: 3 - Neutral: 2 - Disagree: 1-Strongly disagree
Strongly
agree
5
Agree
4
Neutral
3
Disagree
2
Strongly
disagree
1
Equity Capital
1. The SME relies on
equity capital in order
to run
2. The SME has less
burden of current
liabilities as compared
to current assets
3. Equity is preferred to
Personal Savings
Farming
Employment
Family support
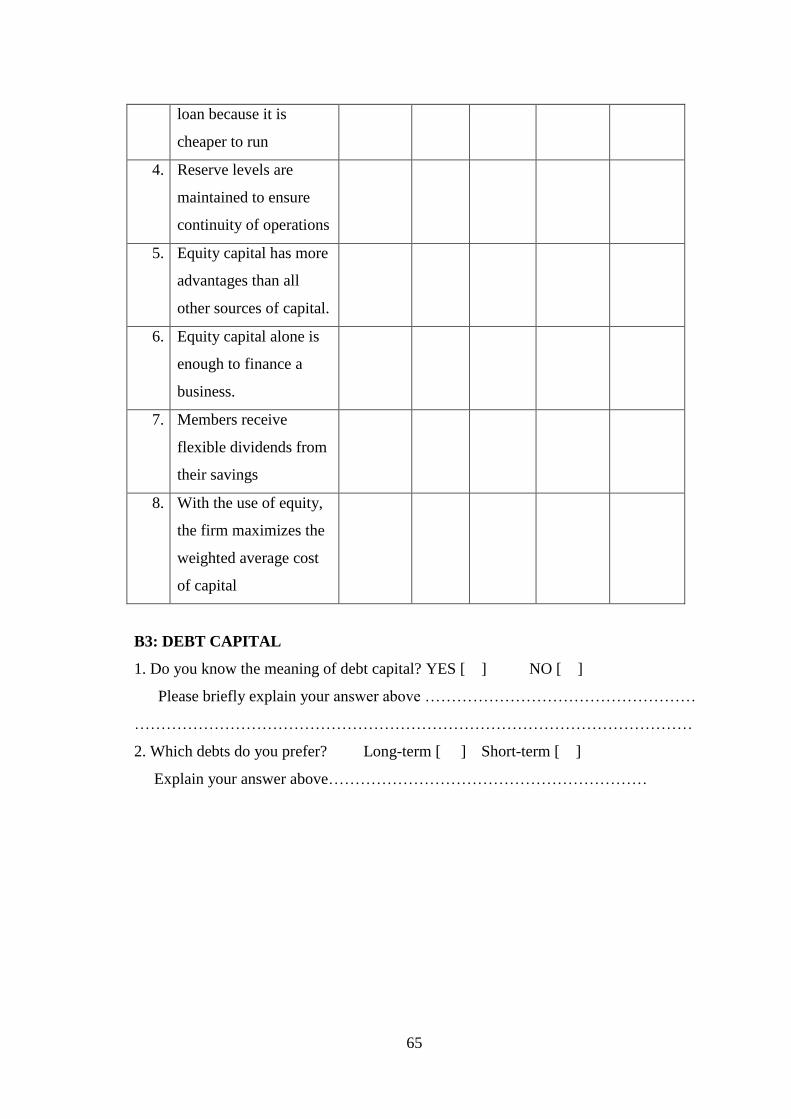
65
loan because it is
cheaper to run
4. Reserve levels are
maintained to ensure
continuity of operations
5. Equity capital has more
advantages than all
other sources of capital.
6. Equity capital alone is
enough to finance a
business.
7. Members receive
flexible dividends from
their savings
8. With the use of equity,
the firm maximizes the
weighted average cost
of capital
B3: DEBT CAPITAL
1. Do you know the meaning of debt capital? YES [ ] NO [ ]
Please briefly explain your answer above ……………………………………………
……………………………………………………………………………………………
2. Which debts do you prefer? Long-term [ ] Short-term [ ]
Explain your answer above……………………………………………………

66
Please indicate using the scale (1-5)
5 - Strongly agree: 4 - Agree: 3 - Neutral: 2 - Disagree: 1-Strongly disagree
Strongly
agree
5
Agree
4
Neutral
3
Disagree
2
Strongly
disagree
1
1. The SME relies on loan
in order to run the
business
2. Borrowing short term
reduces risk of
investment projects
3. The SMS prefers debt
due to close relationship
with bank(s)
4. Debt preferred to equity
due to lower information
disclosure
5. The SME matches the
maturity of its debt with
the life of its assets
6. The SME issues long-
term debt to minimize
the risk of having to
finance in bad times
7. The firm considers its
credit rating before it
borrows
8. The firm limits its debt
so that its customers/
suppliers are not worried
about its financial
stability
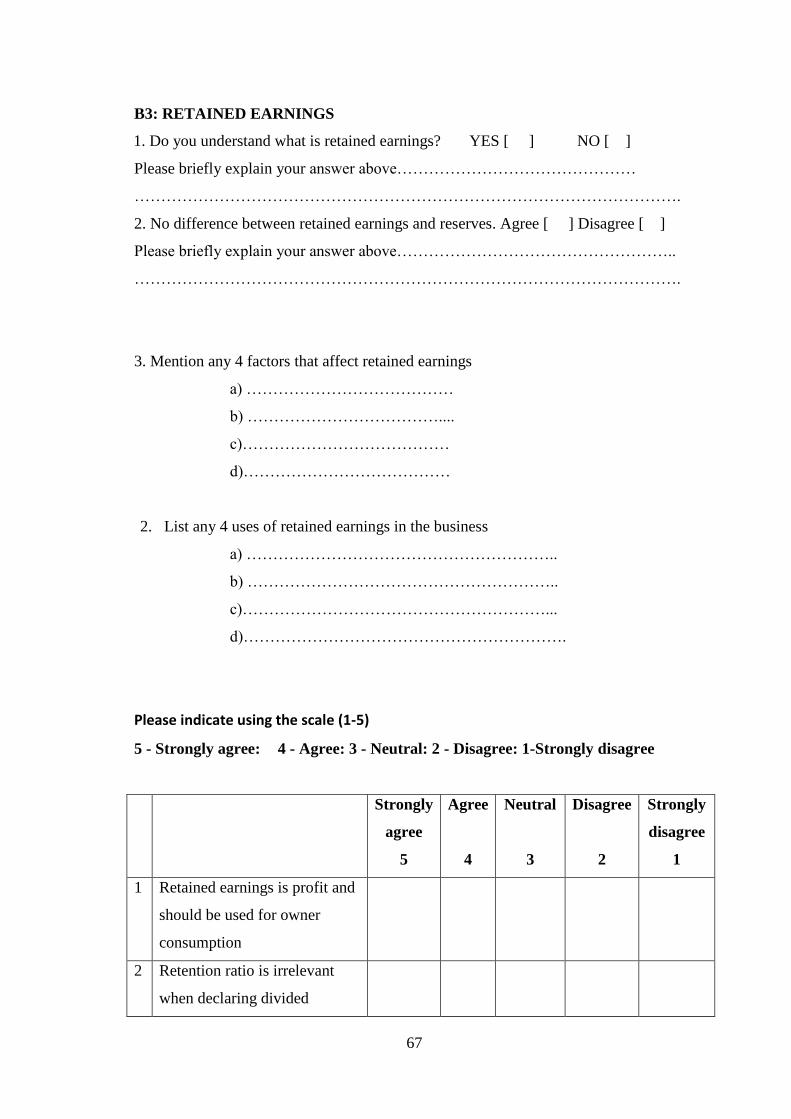
67
B3: RETAINED EARNINGS
1. Do you understand what is retained earnings? YES [ ] NO [ ]
Please briefly explain your answer above………………………………………
………………………………………………………………………………………….
2. No difference between retained earnings and reserves. Agree [ ] Disagree [ ]
Please briefly explain your answer above……………………………………………..
………………………………………………………………………………………….
3. Mention any 4 factors that affect retained earnings
a) …………………………………
b) ………………………………....
c)…………………………………
d)…………………………………
2. List any 4 uses of retained earnings in the business
a) …………………………………………………..
b) …………………………………………………..
c)…………………………………………………...
d)…………………………………………………….
Please indicate using the scale (1-5)
5 - Strongly agree: 4 - Agree: 3 - Neutral: 2 - Disagree: 1-Strongly disagree
Strongly
agree
5
Agree
4
Neutral
3
Disagree
2
Strongly
disagree
1
1 Retained earnings is profit and
should be used for owner
consumption
2 Retention ratio is irrelevant
when declaring divided
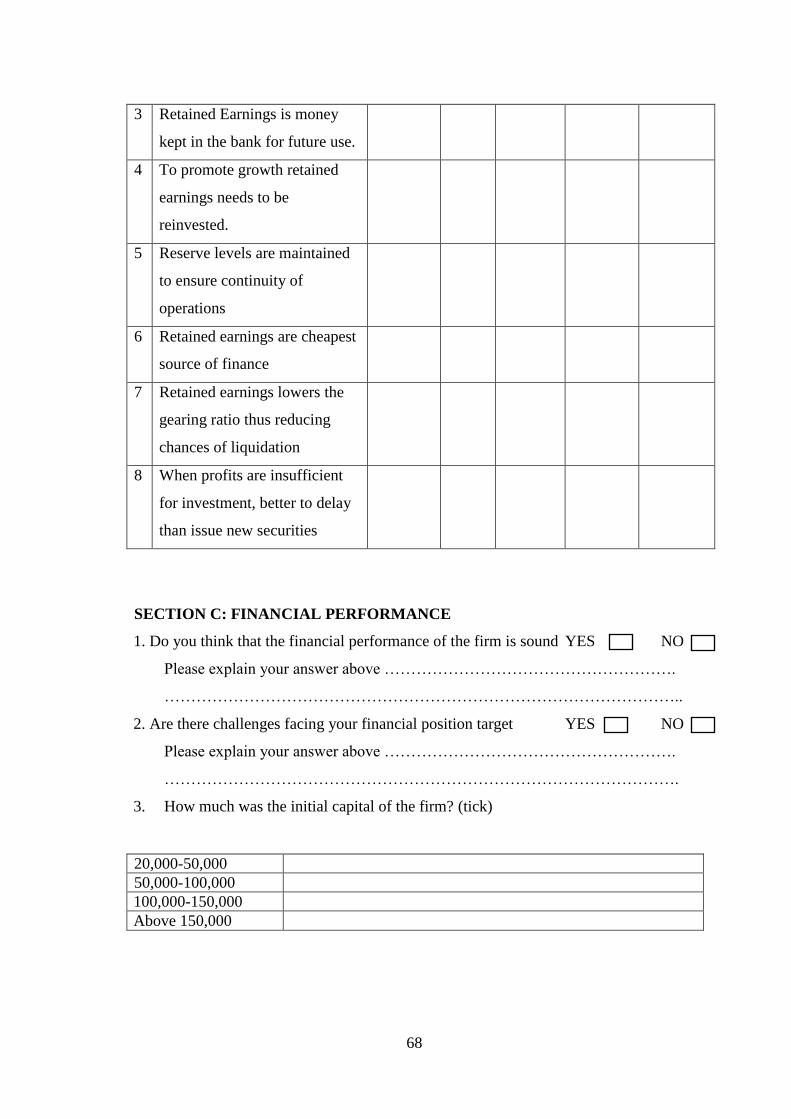
68
3 Retained Earnings is money
kept in the bank for future use.
4 To promote growth retained
earnings needs to be
reinvested.
5 Reserve levels are maintained
to ensure continuity of
operations
6 Retained earnings are cheapest
source of finance
7 Retained earnings lowers the
gearing ratio thus reducing
chances of liquidation
8 When profits are insufficient
for investment, better to delay
than issue new securities
SECTION C: FINANCIAL PERFORMANCE
1. Do you think that the financial performance of the firm is sound YES NO
Please explain your answer above ……………………………………………….
……………………………………………………………………………………..
2. Are there challenges facing your financial position target YES NO
Please explain your answer above ……………………………………………….
…………………………………………………………………………………….
3. How much was the initial capital of the firm? (tick)
20,000-50,000
50,000-100,000
100,000-150,000
Above 150,000

69
1. Kindly provide the financial data for each of the financial on yearly basis as
captured in the table below.
Financial years 2012 2013 2014 2015 2016
Current
assets(kshs)
Current
liabilities (kshs)
Net income
(Assets –
liabilities)
Asset base
(kshs)
THANK YOU