CAPITAL PUNISHMENT IN TEXAS AND … Price_Byrd.pdfCAPITAL PUNISHMENT IN TEXAS AND CALIFORNIA: A...
22
© Applied Psychology in Criminal Justice, 2008, 4(2) CAPITAL PUNISHMENT IN TEXAS AND CALIFORNIA: A COMPARISON J. Keith Price, Ph.D. Gary R. Byrd, Ph.D. West Texas A&M University This study compares two versions of the use of capital punishment. Texas rigor- ously implements the death penalty. California reluctantly executes capital pun- ishment. The study examines similarities and differences in the two approaches. Execution rates, death penalties imposed by juries, implementation of death, the cost of capital punishment, murder rates, and the reciprocal effects of execu- tion rates and murder rates were viewed in light of posed research questions. The study revealed that Texas was significantly higher in the rate of executions, jury imposed death sentences, and the implementation of capital punishment than California. The cost of capital punishment was also substantially higher in Texas than in California. Despite the differences in the practice of capital punishment, the murder rates of Texas and California were remarkably similar. There was a strong correspondence in year-to-year changes and no significant difference in the rates of the two states. An examination of execution rates and murder rates over time via a cross-lagged panel analysis, unfortunately, produced no clear findings. However, this study did illustrate the value of the Heilbrun (2006) challenge to examine states that rigorously versus reluctantly implement their death-penalty sentences. INTRODUCTION Capital punishment continues to attract strong opinions from most observers, and rightly so. State-sponsored homicide should be monitored in a democracy. Retentionists or supporters of capital punishment cite the positive effects of the death penalty and argue that it makes us safer. Abolitionists decry the use of capital punish- ment as ineffective and state that its use has little or no effect on our Correspondence concerning this article should be addressed to J. Keith Price, Ph.D., or Gary R. Byrd, Ph.D., Department of Psychology, Sociology, and Social Work, West Texas A&M University, WTAMU Box 60876, Canyon, Texas 79016-0001; Phone: 806-651-2418 (JKP office), 806-651-2589, (GRB office); Email: [email protected] or [email protected]
Transcript of CAPITAL PUNISHMENT IN TEXAS AND … Price_Byrd.pdfCAPITAL PUNISHMENT IN TEXAS AND CALIFORNIA: A...
© Applied Psychology in Criminal Justice, 2008, 4(2)
CAPITAL PUNISHMENT IN TEXAS AND CALIFORNIA: A COMPARISON
J. Keith Price, Ph.D. Gary R. Byrd, Ph.D.
West Texas A&M University
This study compares two versions of the use of capital punishment. Texas rigor-ously implements the death penalty. California reluctantly executes capital pun-ishment. The study examines similarities and differences in the two approaches. Execution rates, death penalties imposed by juries, implementation of death, the cost of capital punishment, murder rates, and the reciprocal effects of execu-tion rates and murder rates were viewed in light of posed research questions. The study revealed that Texas was signifi cantly higher in the rate of executions, jury imposed death sentences, and the implementation of capital punishment than California. The cost of capital punishment was also substantially higher in Texas than in California. Despite the differences in the practice of capital punishment, the murder rates of Texas and California were remarkably similar. There was a strong correspondence in year-to-year changes and no signifi cant difference in the rates of the two states. An examination of execution rates and murder rates over time via a cross-lagged panel analysis, unfortunately, produced no clear fi ndings. However, this study did illustrate the value of the Heilbrun (2006) challenge to examine states that rigorously versus reluctantly implement their death-penalty sentences.
INTRODUCTION
Capital punishment continues to attract strong opinions from most observers, and rightly so. State-sponsored homicide should be monitored in a democracy. Retentionists or supporters of capital punishment cite the positive effects of the death penalty and argue that it makes us safer. Abolitionists decry the use of capital punish-ment as ineffective and state that its use has little or no effect on our
Correspondence concerning this article should be addressed to J. Keith Price, Ph.D., or Gary R. Byrd, Ph.D., Department of Psychology, Sociology, and Social Work, West Texas A&M University, WTAMU Box 60876, Canyon, Texas 79016-0001; Phone: 806-651-2418 (JKP offi ce), 806-651-2589, (GRB offi ce); Email: [email protected] or [email protected]
PRICE AND BYRD 207
© Applied Psychology in Criminal Justice, 2008, 4(2)
safety and it harms our morality. One can easily become confused in the capital punishment debate. How does “the machinery of death” affect our society (Mandery, 2005)?
The death penalty clearly provides retribution. The offend-er, who steals the life of the victim, will in turn forfeit his life to the vengeance of the state. At the same time, capital punishment provides specifi c deterrence. An executed capital offender will not commit another crime or make us unsafe again. Other issues related to capital punishment are not so easily discerned. Does an execution reduce murder rates, making us safer? Does the use of the capital punishment screen us from future dangerous acts of other murder-ers? Is capital punishment cost effective and is it the best use of limited criminal justice funds? All of these questions remain open to discussion, usually shaped by the strong emotions that characterize the debate (Clarke & Witt, 2007).
This research continues the examination of capital punish-ment. The focus of this study is the states of Texas and California. Heilbrun (2006) contemplated the value of an examination of states that rigorously versus reluctantly implement their death-penalty sentences; but would Texas and California fulfi ll this examination? Both jurisdictions utilize capital punishment in their criminal justice systems, but perhaps, in a different way. The investigation looks at a number of variables surrounding the death penalty in these two states. Comparing and contrasting fi ndings in these states will help us incrementally, instead of defi nitively, answer a number of ques-tions related to the use of capital punishment.
Paternoster, Brame, & Bacon (2008) have recently reviewed the long history of capital punishment in the United States (traced back to 1608) as they examined a multitude of issues surrounding the death penalty. Despite the fact that court rulings create morato-riums from time to time, they also maintained that the death penalty shows no signs of disappearing for any enduring amount of time for the majority of states, in spite of the fact it continues to create controversy and ambivalence. Paternoster, Brame, & Bacon (2008), as well as Mandery (2005) and Bohm (2007), vividly illustrate the
208 CAPITAL PUNISHMENT IN TEXAS AND CALIFORNIA
© Applied Psychology in Criminal Justice, 2008, 4(2)
constant interplay between public opinion, court cases, and state statutes on the death penalty.
Conventional wisdom has produced a number of axioms about the role of capital punishment for a society. Examples would include such proposed relationships as: capital punishment deters others from committing homicides; it reduces subsequent threats to society; and it is cost effective. Investigators who have attempted to examine these proposed relationships empirically have faced a number of obstacles. Unfortunately, capital punishment does not lend itself to scientifi c experimentation and generalized causal in-ferences. A social scientist could not ethically make the death pen-alty the punishment for capital murders that occur on Monday, Wednesday, and Friday while having capital murders that occur on the other days of the week receive a life sentence in order to estab-lish what consequences result (Clark & Whitt, 2007). The research challenges have produced death penalty studies that rely on complex multivariate statistical methods that are non-experimental in nature. Because these methods have limits in establishing causal inferences and because the audiences for such studies often have strongly-held beliefs, either for or against the use of capital punishment, the stud-ies frequently produce more debate than resolution. The present study does not attempt to resolve the role of capital punishment, but attempts to continue to examine the issues surrounding capital punishment in hopes that, with enough carefully-conducted studies across time, a pattern will emerge that is more discernable for all.
Studies of Historical Context In one of the fi rst studies of capital punishment, Sutherland
(1925) concluded that there is no evidence of a signifi cant relation between the murder rate and the practice of using the death penalty. He went on to say that there may be a signifi cant relationship, but it cannot be demonstrated. He concluded that the scientifi c examina-tion of capital punishment was not worth the effort due to the small number of persons executed each year.
One of the most infl uential early death penalty scholars was Thorsten Sellin. After numerous comparisons, Sellin (1959; 1967) concluded that there was no relation between capital punishment
PRICE AND BYRD 209
© Applied Psychology in Criminal Justice, 2008, 4(2)
and murder rates. Bedau (1967), another death penalty scholar of the era, also came to the same conclusion.
The lack of positive fi ndings, however, did not end the death penalty debate (Clark & Whitt, 2007). And so, the National Academy of Science commissioned an investigation, headed by Blumstein, Cohen, and Nagin, to examine the death penalty. The Academy’s fi ndings (1978) reported that the death penalty had no effect on de-terrence or incapacitation.
Another national study was performed on former death-sentence capital offenders by Marquart and Sorenson (1989) and found that death-sentenced capital murderers were no more danger-ous than any other group of offenders. In addition, a comprehensive review of deterrence studies was completed by Bailey and Peterson in 1997. These scholars concluded that there was no compelling evi-dence to support the notion that the death penalty affected murder rates.
Not all research has found an absence of connection between the death penalty and violent crime. Utilizing new methodology of econometric models, Erhlich (1975) found that executions produced a deterrent effect that saved lives. Numerous scholars challenged this fi nding, and his research still engenders lively debate. Shepherd (2005) later used a similar approach to examine capital punishment across the United States. Her fi ndings provided support for deter-rence in some jurisdictions while fi nding evidence of brutalization (violence begets violence) in others. She concluded that a state had to execute nine prisoners a year to produce a reduction in murders; otherwise an increase in murders occurred.
Current Status The scientifi c examination of capital punishment has pro-
duced more questions than answers. As a result of this dilemma, continued research on capital punishment is clearly warranted.
In this regard, Heilbrun (2006) raised a salient issue. Any serious investigation of the death penalty “should involve not only comparison between retentionist and abolitionist states but should
210 CAPITAL PUNISHMENT IN TEXAS AND CALIFORNIA
© Applied Psychology in Criminal Justice, 2008, 4(2)
also take a multi-tier approach to evaluating capital punishment in this country among states having the death-penalty. States with death-penalty statutes that are rigorously implemented should be compared to states with death-penalty statutes that are reluctantly invoked . . . .” (p. 9).
The similarities and differences between states that have rig-orously versus reluctantly implemented their death-penalty statutes may be valuable to studying the issues –– such as, deterrence and cost –– surrounding capital punishment. Two states that both have death-penalty statutes but seem to vary substantially in their imple-mentation of those statutes are Texas and California.
Why Compare Texas with California?Both California (1st) and Texas (3rd) possess very large death
rows in the United States. Each jurisdiction sentences numerous of-fenders to death each year. However, the states vary dramatically in their execution of the death penalty (Death Penalty Information Center, 2008). According to their state statutes, the two states were seriously committed to capital punishment and the assessment of the death penalty. An examination of recent records, however, sug-gested a very different commitment to the execution of the death penalty (Vandiver, 2005).
The states have comparable demographics. In 2000, Texas had a population of 20,851,820 while California had a population of 33,871,648. Males comprised 49.6% of the population in Texas and 49.8% of the population in California. The minority popula-tions of the states are similar. Texas’s population is 11.5% African American and 32.0% Hispanic. California’s population is 6.7% African American and 32.4% Hispanic. The average household size is 2.74 in Texas and 2.87 in California. Educational achievements are also similar. The Texas population includes 75.7% with a high school diploma and 23.2% with a bachelor’s degree. California’s population includes 76.8% with a high school diploma and 26.6% with a bachelor’s degree. The individual poverty level in Texas in-cludes 15.4% of individuals and 14.2% of individuals in California (U.S. Census Bureau, 2000).
PRICE AND BYRD 211
© Applied Psychology in Criminal Justice, 2008, 4(2)
Both states also have large criminal justice systems to deal with the problems of crime, including capital murder (Pollock, 2006). At the end of 2000, Texas housed 157,997 inmates while California housed 163,001. Ninety-four percent of inmates in Texas were male, while 93% were male in California. In Texas 50% of inmates were incarcerated for violent crimes while the percentage was 44% in California (Vandiver, 2005). Both states utilize “three-strikes-you’re-out” and mandatory sentencing schemes that have created a huge criminal justice system (Pollock, 2006).
The states of Texas and California are signifi cant representa-tives of the death penalty states. Texas and California possess some of the largest death rows in the United States (Vandiver, 2005). In both states, the cost of maintaining the machinery of death is ex-tremely expensive (Dieter, 2005). However, the use of executions in both states appears to be dramatically different. California juries assess numerous death sentences. However, the state rarely executes these sentences. Texas juries also issue numerous death sentences. The state then executes more offenders than any other jurisdiction (Vandiver, 2005).
What Research Has Been Conducted that Examines Capital Punishment Focusing on Texas or California?
Texas Studies Sorenson, Wrinkle, Brewer, and Marquart (1999) examined
the issue of capital punishment in Texas. The study used the number of executions as the independent variable; whereas murder rates and felony murder rates served as the dependent variable. The study found that the murder rate was not related to the number of execu-tions. The study also found that the felony murder rate was not re-lated to the number of executions.
Cloninger & Marchesini (2001) used a portfolio analysis in a quasi-controlled group experiment. They developed an econometric/mathematical model of homicides when executions were typical for the state. They then examined homicide rates by taking advantage of a moratorium period for Texas executions and comparing with a period of double the number of normal executions. According to
212 CAPITAL PUNISHMENT IN TEXAS AND CALIFORNIA
© Applied Psychology in Criminal Justice, 2008, 4(2)
their model, there were greater than predicted number of homicides in the moratorium period and fewer than predicted in the high pe-riod. Their interpretation was that the fi ndings were consistent with the deterrence effect of capital punishment.
Since, as Bryce (1998) reports, Harris County (Houston) ac-counts for one-third of the offenders on Texas death row, Stolzenberg and D’Allesio (2004) examined the impact of executions on murder rates in Houston, Texas. Despite the fact that local news cover ar-rests, trials, convictions, and executions pertaining to local homi-cide cases, the study produced no credible evidence to support that executions decreased the murder rate in Houston, Texas.
California StudiesBailey (1979) studied the death penalty for murder in
California for the period of 1910–1962. The study used multiple measures of the certainty of the impending death penalty to take place. It also included two different measures of rates for homicide with several socio-demographic variables taken into account. The study looked for both linear and non-linear relationships between executions and homicides but found no evidence that the certainty of execution provided an effective deterrent to committing murders.
After a twenty-fi ve year moratorium, California received a great deal of state and national news when the state reintroduced the death penalty in 1992. Cochran & Chamlin (2000) took advan-tage of a naturally-occurring event to assess the impact of the much-publicized execution on the incidence of homicides using weekly time-series data. Based upon their approach, they found a signifi cant decline in the level of nonstrangers’ felony-murders; but a signifi -cant increase in the degree of argument-based murders of strangers in the period following the execution.
Examination That Focused on both Texas and CaliforniaSorenson and Pilgrim (2006) discuss capital punishment in
Texas in their recent book. The seasoned researchers report that urban homicide rates have decreased faster than rural homicide rates. The authors also looked at Texas (high execution rates), New York (no executions since 1963), and California (low execution rates). Their
PRICE AND BYRD 213
© Applied Psychology in Criminal Justice, 2008, 4(2)
examination found that New York had the highest drop in homicide rates. Their review also concluded that the decrease in homicide rates was not related to the number of executions. They speculated that a number of factors may be causing the drop in homicide rates, including an increase in the number of people imprisoned.
Purpose of This InvestigationAny new generation of criminal justice investigators quickly
realizes that the issues surrounding capital punishment are compli-cated and diffi cult to effectively study. With different methodolo-gies utilized across decades of study, they also quickly realize that getting a decisive answer to the part played by the death penalty is also diffi cult. This could discourage their participation in engag-ing in further investigations. The authors of this study think just the opposite needs to occur. How can we actually encourage research-ers to continuing work in order to make progress in establishing a better understanding of the function of capital punishment in the United States? As stated earlier, because the research methodolo-gies have limits in establishing causal inferences and because the audience for such studies often have strongly-held beliefs (either for or against) the use of capital punishment, the previous studies frequently produce more debate than resolution. The present study does not attempt to decisively establish the role of capital punish-ment in the American criminal justice system, but attempts to con-tinue to examine the issues surrounding capital punishment in hopes that, with enough carefully-conducted studies across time, a pattern will emerge that is more discernable for all.
Also in this regard, the present investigators think that, by making the scope of relevant research more defi ned, the results will be less controversial and ambivalent. In turn, such studies will also foster more investigators to participate in a continuing examina-tion of capital punishment. Many smaller-scaled projects may yield more valuable contributions to the larger, and in many ways more controversial, picture emerging in time.
Therefore, with this reasoning in mind, this study attempts to examine a variety of similarities and differences that may ex-ist in two states that have rigorously (Texas) versus reluctantly
214 CAPITAL PUNISHMENT IN TEXAS AND CALIFORNIA
© Applied Psychology in Criminal Justice, 2008, 4(2)
(California) implemented their death-penalty statutes. By looking for both similarities and differences, data may begin portraying a pattern that could answer some important inductive questions sur-rounding capital punishment. What coincides with the differences in implementation in regard to estimated execution costs and statewide murder rates? Are there similarities in the murder rates changing across years in the two states? Are the differences in execution rates and murder rates statistically reliable? Is there any indication that data from the two states are consistent with a possible reciprocal relationship between execution rate and murder rate?
METHOD
Data Acquisition and MeasuresWe collected the primary data for this study from four sourc-
es. From the U.S. Department of Justice (Sourcebook of Criminal Justice Statistics Online, 2006), the collected measures for 1992 – 2005 were the number of executions, prisoners under sentence of death, number of murders 1992 - 2003, and the murder rate (per 100,000) for states of Texas and California 1992 – 2003. From the Federal Bureau of Investigation’s Crime in the United States, we ob-tained the number of murders and the murder rate (per 100,000) for the states of Texas and California for 2004 – 2005. We obtained the number of new death sentences from the Death Penalty Information Center (2008). For costs per execution, we used Liebman’s (2000) estimates for the two states.
For the appropriate measures, we converted the primary data into rates. Converting the state crime statistics into a rate per 100,000 (Gertsman, 2003) allowed for a more consistent examina-tion of data across the two states. Because the data consisted of only fourteen years, and California had years in which there were zeros, the rates for executions and implementation of death sentences were transformed using a version of a reciprocal transformation (Howell, 2007) in order for the data to meet the assumptions of the analyses. In order for the results to be more straightforward to interpret, the means and standard deviations will be reported in terms of the origi-nal data for these two measures.
PRICE AND BYRD 215
© Applied Psychology in Criminal Justice, 2008, 4(2)
Similarities and DifferencesThe intent of this study was to examine both the similarities
as well as the differences among a cluster of variables that surround capital punishment in two states that may employ the death sen-tence in different ways. Using quantitative data, the analyses were to highlight the similarities and the differences, not to test specifi c hypotheses. Therefore, to highlight similarities, correlation coeffi -cients were used descriptively. We wanted to address the question –– despite the fact that the two states may be different in implement-ing the death penalty, did the states have corresponding rates across a contemporary period of the fourteen years? As a result and when appropriate, we used correlation coeffi cients to index the annual fl uctuations in these measures.
We examined differences in the two states by compar-ing rates and other measures with one-way ANOVAs. One-way ANOVAs were employed instead of standard t-tests in order to be able to report the magnitude of effect (eta-squared values) in each analysis conveniently.
Crossed-lagged Panel ModelTo examine for a possible temporal precedence, or even a
reciprocal relationship, between execution rate and murder rates in these two states, we utilized a crossed-lagged panel model (Shadish, Cook, & Campbell, 2002; Finkel, 1995) that logically is based on the assumption that cause produces change in effect, and not the oth-er way around. Despite the fact that correlative data cannot establish cause and effect, the cross-lagged panel model allows suggestive examination of temporal precedence as a requirement for cause and effect. Larger cross-lagged correlations are consistent with a dem-onstration of temporal precedence.
RESULTS
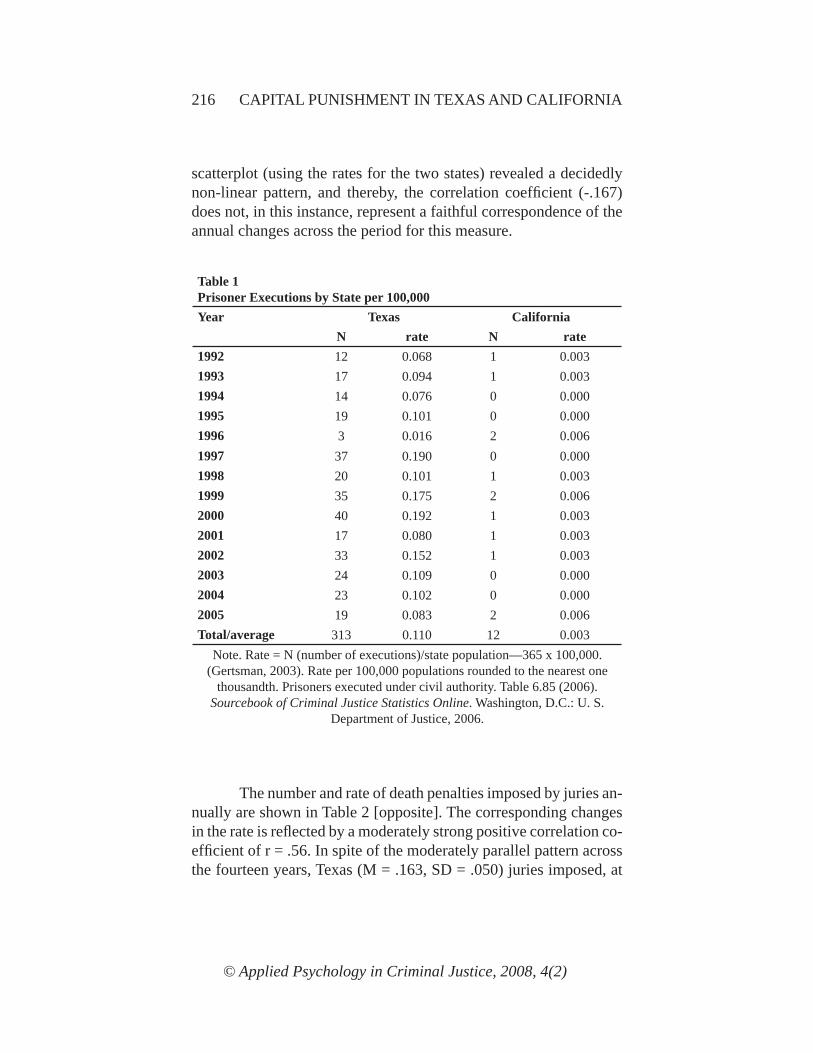
The number and rate of executions are shown in Table 1 [page 216]. Texas (M=.110, SD=.050) had a signifi cantly higher, F(1, 26) = 308.99, p< .001, partial eta2 = .92, execution rate than California (M=.003, SD=.002) across the years 1992–2005. Unfortunately, the
216 CAPITAL PUNISHMENT IN TEXAS AND CALIFORNIA
© Applied Psychology in Criminal Justice, 2008, 4(2)
scatterplot (using the rates for the two states) revealed a decidedly non-linear pattern, and thereby, the correlation coeffi cient (-.167) does not, in this instance, represent a faithful correspondence of the annual changes across the period for this measure.
Table 1Prisoner Executions by State per 100,000Year Texas California
N rate N rate1992 12 0.068 1 0.0031993 17 0.094 1 0.0031994 14 0.076 0 0.0001995 19 0.101 0 0.0001996 3 0.016 2 0.0061997 37 0.190 0 0.0001998 20 0.101 1 0.0031999 35 0.175 2 0.0062000 40 0.192 1 0.0032001 17 0.080 1 0.0032002 33 0.152 1 0.0032003 24 0.109 0 0.0002004 23 0.102 0 0.0002005 19 0.083 2 0.006Total/average 313 0.110 12 0.003
Note. Rate = N (number of executions)/state population—365 x 100,000. (Gertsman, 2003). Rate per 100,000 populations rounded to the nearest one
thousandth. Prisoners executed under civil authority. Table 6.85 (2006). Sourcebook of Criminal Justice Statistics Online. Washington, D.C.: U. S.
Department of Justice, 2006.
The number and rate of death penalties imposed by juries an-nually are shown in Table 2 [opposite]. The corresponding changes in the rate is refl ected by a moderately strong positive correlation co-effi cient of r = .56. In spite of the moderately parallel pattern across the fourteen years, Texas (M = .163, SD = .050) juries imposed, at
PRICE AND BYRD 217
© Applied Psychology in Criminal Justice, 2008, 4(2)
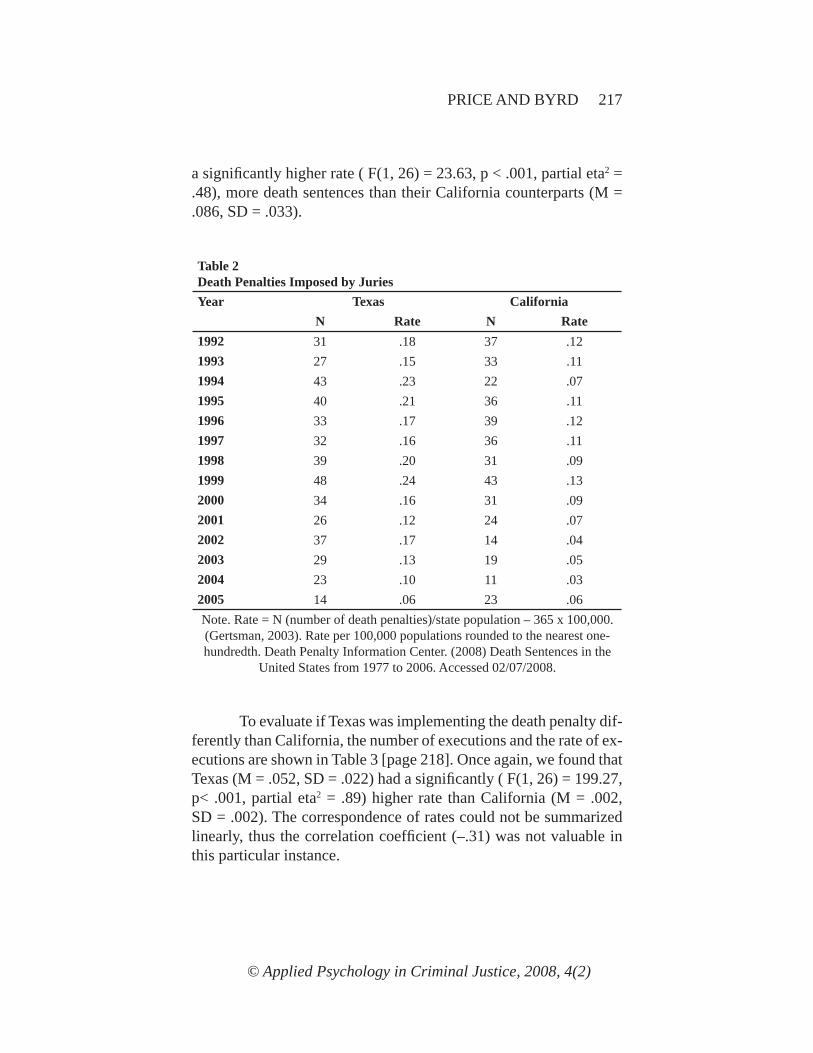
a signifi cantly higher rate ( F(1, 26) = 23.63, p < .001, partial eta2 = .48), more death sentences than their California counterparts (M = .086, SD = .033).
Table 2Death Penalties Imposed by JuriesYear Texas California
N Rate N Rate1992 31 .18 37 .121993 27 .15 33 .111994 43 .23 22 .071995 40 .21 36 .111996 33 .17 39 .121997 32 .16 36 .111998 39 .20 31 .091999 48 .24 43 .132000 34 .16 31 .092001 26 .12 24 .072002 37 .17 14 .042003 29 .13 19 .052004 23 .10 11 .032005 14 .06 23 .06Note. Rate = N (number of death penalties)/state population – 365 x 100,000. (Gertsman, 2003). Rate per 100,000 populations rounded to the nearest one-hundredth. Death Penalty Information Center. (2008) Death Sentences in the
United States from 1977 to 2006. Accessed 02/07/2008.
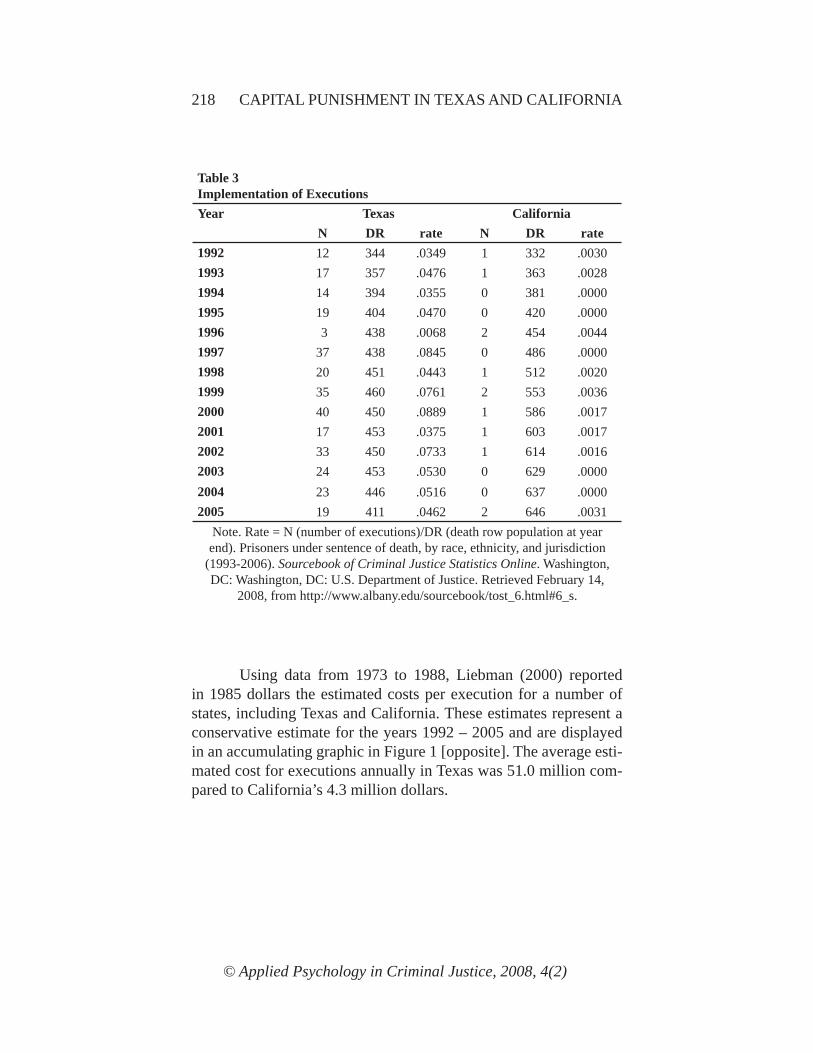
To evaluate if Texas was implementing the death penalty dif-ferently than California, the number of executions and the rate of ex-ecutions are shown in Table 3 [page 218]. Once again, we found that Texas (M = .052, SD = .022) had a signifi cantly ( F(1, 26) = 199.27, p< .001, partial eta2 = .89) higher rate than California (M = .002, SD = .002). The correspondence of rates could not be summarized linearly, thus the correlation coeffi cient (–.31) was not valuable in this particular instance.
218 CAPITAL PUNISHMENT IN TEXAS AND CALIFORNIA
© Applied Psychology in Criminal Justice, 2008, 4(2)
Table 3Implementation of ExecutionsYear Texas California
N DR rate N DR rate1992 12 344 .0349 1 332 .00301993 17 357 .0476 1 363 .00281994 14 394 .0355 0 381 .00001995 19 404 .0470 0 420 .00001996 3 438 .0068 2 454 .00441997 37 438 .0845 0 486 .00001998 20 451 .0443 1 512 .00201999 35 460 .0761 2 553 .00362000 40 450 .0889 1 586 .00172001 17 453 .0375 1 603 .00172002 33 450 .0733 1 614 .00162003 24 453 .0530 0 629 .00002004 23 446 .0516 0 637 .00002005 19 411 .0462 2 646 .0031
Note. Rate = N (number of executions)/DR (death row population at year end). Prisoners under sentence of death, by race, ethnicity, and jurisdiction
(1993-2006). Sourcebook of Criminal Justice Statistics Online. Washington, DC: Washington, DC: U.S. Department of Justice. Retrieved February 14,
2008, from http://www.albany.edu/sourcebook/tost_6.html#6_s.
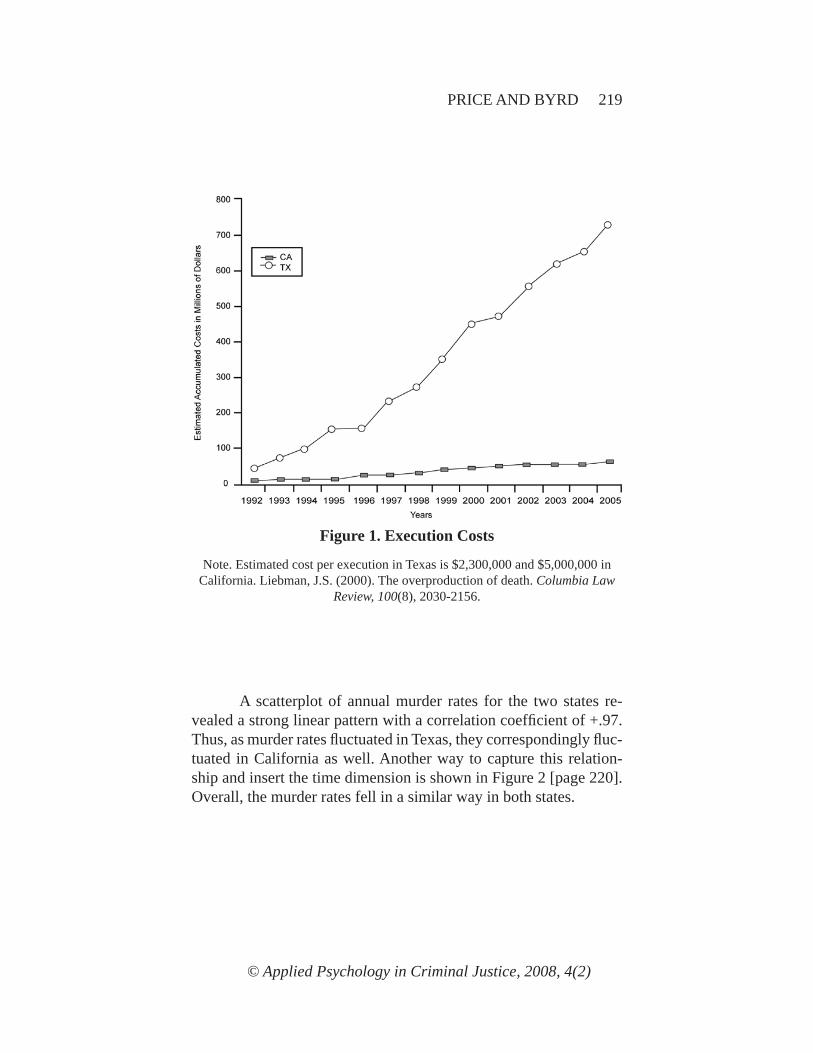
Using data from 1973 to 1988, Liebman (2000) reported in 1985 dollars the estimated costs per execution for a number of states, including Texas and California. These estimates represent a conservative estimate for the years 1992 – 2005 and are displayed in an accumulating graphic in Figure 1 [opposite]. The average esti-mated cost for executions annually in Texas was 51.0 million com-pared to California’s 4.3 million dollars.
PRICE AND BYRD 219
© Applied Psychology in Criminal Justice, 2008, 4(2)
Figure 1. Execution Costs
Note. Estimated cost per execution in Texas is $2,300,000 and $5,000,000 in California. Liebman, J.S. (2000). The overproduction of death. Columbia Law
Review, 100(8), 2030-2156.
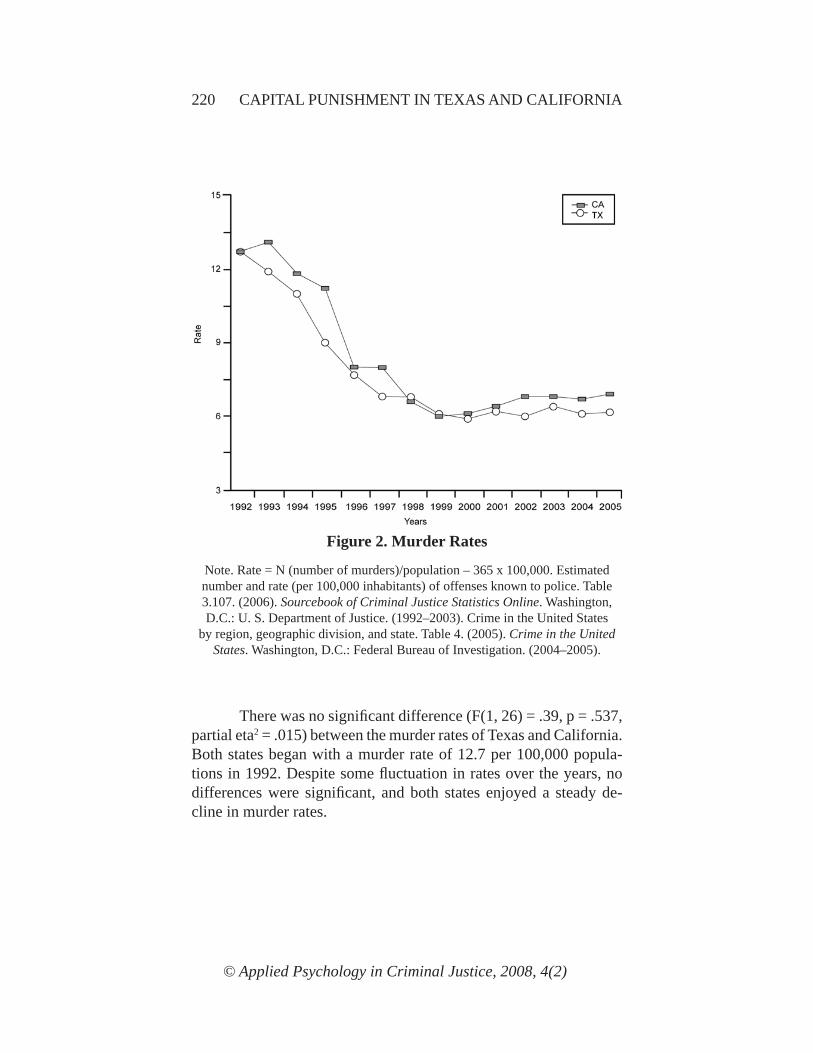
A scatterplot of annual murder rates for the two states re-vealed a strong linear pattern with a correlation coeffi cient of +.97. Thus, as murder rates fl uctuated in Texas, they correspondingly fl uc-tuated in California as well. Another way to capture this relation-ship and insert the time dimension is shown in Figure 2 [page 220]. Overall, the murder rates fell in a similar way in both states.
220 CAPITAL PUNISHMENT IN TEXAS AND CALIFORNIA
© Applied Psychology in Criminal Justice, 2008, 4(2)
There was no signifi cant difference (F(1, 26) = .39, p = .537, partial eta2 = .015) between the murder rates of Texas and California. Both states began with a murder rate of 12.7 per 100,000 popula-tions in 1992. Despite some fl uctuation in rates over the years, no differences were signifi cant, and both states enjoyed a steady de-cline in murder rates.
Figure 2. Murder Rates
Note. Rate = N (number of murders)/population – 365 x 100,000. Estimated number and rate (per 100,000 inhabitants) of offenses known to police. Table 3.107. (2006). Sourcebook of Criminal Justice Statistics Online. Washington, D.C.: U. S. Department of Justice. (1992–2003). Crime in the United States
by region, geographic division, and state. Table 4. (2005). Crime in the United States. Washington, D.C.: Federal Bureau of Investigation. (2004–2005).
PRICE AND BYRD 221
© Applied Psychology in Criminal Justice, 2008, 4(2)
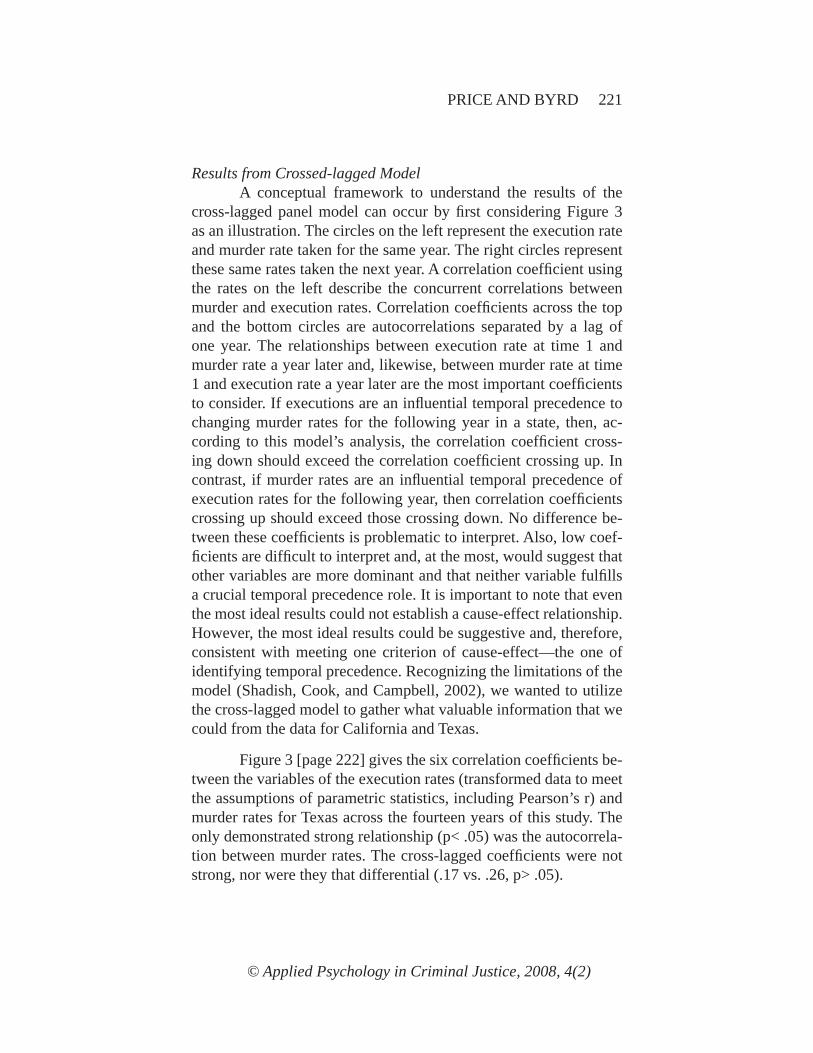
Results from Crossed-lagged ModelA conceptual framework to understand the results of the
cross-lagged panel model can occur by fi rst considering Figure 3 as an illustration. The circles on the left represent the execution rate and murder rate taken for the same year. The right circles represent these same rates taken the next year. A correlation coeffi cient using the rates on the left describe the concurrent correlations between murder and execution rates. Correlation coeffi cients across the top and the bottom circles are autocorrelations separated by a lag of one year. The relationships between execution rate at time 1 and murder rate a year later and, likewise, between murder rate at time 1 and execution rate a year later are the most important coeffi cients to consider. If executions are an infl uential temporal precedence to changing murder rates for the following year in a state, then, ac-cording to this model’s analysis, the correlation coeffi cient cross-ing down should exceed the correlation coeffi cient crossing up. In contrast, if murder rates are an infl uential temporal precedence of execution rates for the following year, then correlation coeffi cients crossing up should exceed those crossing down. No difference be-tween these coeffi cients is problematic to interpret. Also, low coef-fi cients are diffi cult to interpret and, at the most, would suggest that other variables are more dominant and that neither variable fulfi lls a crucial temporal precedence role. It is important to note that even the most ideal results could not establish a cause-effect relationship. However, the most ideal results could be suggestive and, therefore, consistent with meeting one criterion of cause-effect—the one of identifying temporal precedence. Recognizing the limitations of the model (Shadish, Cook, and Campbell, 2002), we wanted to utilize the cross-lagged model to gather what valuable information that we could from the data for California and Texas.
Figure 3 [page 222] gives the six correlation coeffi cients be-tween the variables of the execution rates (transformed data to meet the assumptions of parametric statistics, including Pearson’s r) and murder rates for Texas across the fourteen years of this study. The only demonstrated strong relationship (p< .05) was the autocorrela-tion between murder rates. The cross-lagged coeffi cients were not strong, nor were they that differential (.17 vs. .26, p> .05).
222 CAPITAL PUNISHMENT IN TEXAS AND CALIFORNIA
© Applied Psychology in Criminal Justice, 2008, 4(2)
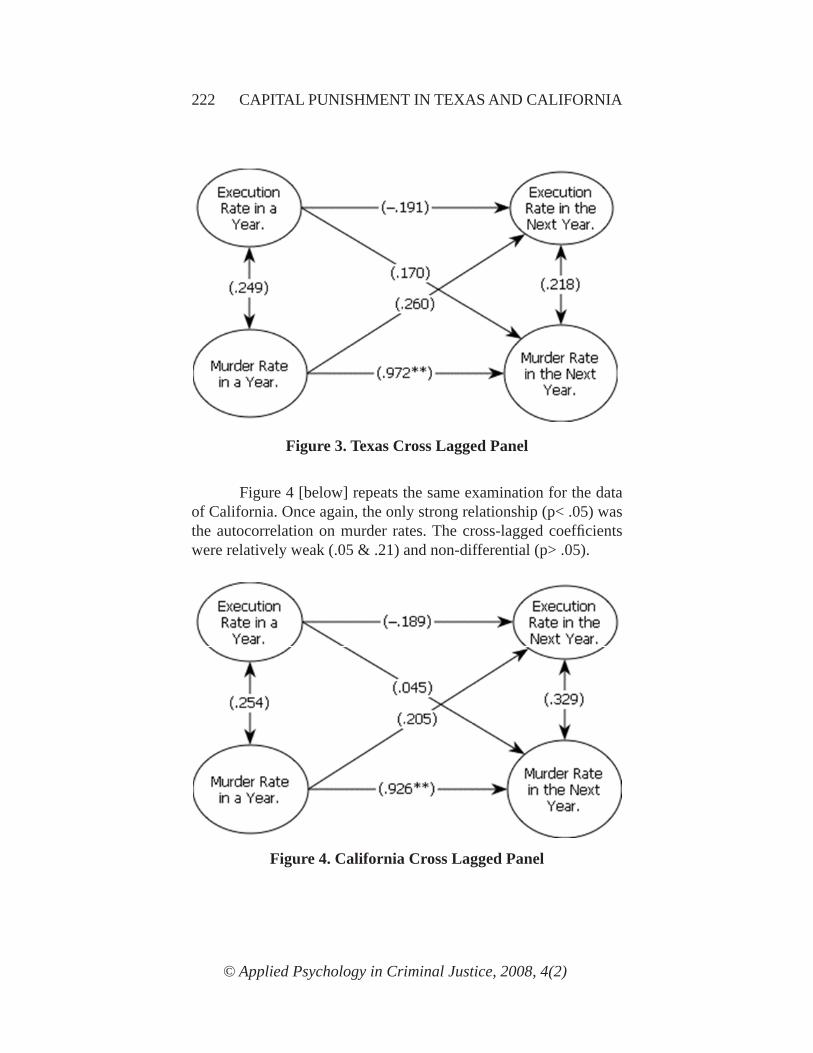
Figure 4 [below] repeats the same examination for the data of California. Once again, the only strong relationship (p< .05) was the autocorrelation on murder rates. The cross-lagged coeffi cients were relatively weak (.05 & .21) and non-differential (p> .05).
Figure 4. California Cross Lagged Panel
Figure 3. Texas Cross Lagged Panel
PRICE AND BYRD 223
© Applied Psychology in Criminal Justice, 2008, 4(2)
DISCUSSION
This study found that both states have provisions for capital punishment; however, Texas implements the death sentence more often. We have also found that the juries in both states are giving death sentences to convicted murderers, but the Texas juries are uti-lizing the death sentence at a higher rate. We found that there were substantial differences in estimated costs involved with maintaining the capital punishment systems; yet, there was not a signifi cant dif-ference in the murder rates of the two states.
This study’s fi ndings are consistent with early research be-tween capital punishment and murder rates (Sellin, 1959; 1967; Bedau, 1967; and National Academy of Science, 1978). Moreover, the fi ndings seem to be inconsistent with the contentions coming out of the econometric models of Erhlich (1975) and Shepard (2005). According to Shepherd’s nationwide study, a state had to execute nine prisoners a year to produce a reduction in murders; otherwise an increase in murders occurred. In this examination, Texas had more than nine executions per year in all but one year. California had fewer than nine in all fourteen years. Nevertheless, the two states did not have statistically reliable differences in murder rates.
As shown by data across the fourteen years, the murder rates appear to be decreasing in a parallel fashion, and this pattern fi ts with national trends in the same direction (Mandery, 2005). Sorenson and Pilgrim (2006) also allude to this broad trend, and they conclude that the reduction in murder rates is perhaps related to increased numbers of people incarcerated, not the number of executions taking place.
ShortcomingsThe primary shortcoming of this study was the failure to
demonstrate a useful fi nding related to the cross-lagged panel model. The execution rates of Texas and California did not have a stronger associative relationship with the following year’s murder rate than the reversed cross-lagged relationship. If the cross-lagged coeffi -cients were differentially stronger in one direction than another, then it would have suggested that additional data and analyses might be valuable in clarifying the demonstrated relationship. Although by no
224 CAPITAL PUNISHMENT IN TEXAS AND CALIFORNIA
© Applied Psychology in Criminal Justice, 2008, 4(2)
means a powerful technique of establishing if the rate of executions brings about a lowered murder rate, or the other way around, the results of the cross-lagged panel analysis was disappointing because they could have indicated a direction for further study. If we inter-pret these results in light of conclusions by Sorenson and Pilgrim (2006), the murder rates of states are infl uenced by many factors, none of which have a large effect.
This study has attempted to heed the call from Heilbrun (2006) to examine the similarities and differences between states that have rigorously versus reluctantly implemented their death-pen-alty statutes. The present study also attempted to promote through example that smaller, more focused studies on aspects of capital punishment may, in time, produce a clearer, more discernable pat-tern. Because the effect of capital punishment has to be studied non-experimentally, and because the audience of such studies often pos-sesses strongly-held beliefs, a defi nitive study to answer once and for all the role of capital punishment is probably not possible. The present study attempted to encourage more researchers to conduct smaller, more focused studies designed to create a convergence of fi ndings.
PRICE AND BYRD 225
© Applied Psychology in Criminal Justice, 2008, 4(2)
REFERENCES
Bailey, W. (1979). The deterrent effect of the death penalty for murder in California. Southern California Law Review, 52, 743-764.
Bailey, W., & Peterson, R. (1997). Murder, capital punishment and deterrence: A review of the literature. In H. Bedau (Ed.), The death penalty in America current controversies (pp. 135-161). New York, NY: Oxford University Press.
Bedau, H. (Ed.). (1967). The death penalty in America (Rev. ed.). New York, NY: Doubleday.
Bohm, R. M. (2007). Deathquest III. Newark, NJ: Matthew Bender & Company.Bryce, R. (1998). Why Texas is execution capital? Christian Science Monitor,
91(13), 3.Clark, A. W., & Whitt, L. (2007). The bitter fruit of American justice international
and domestic resistance to the death penalty. Lebanon, NH: University Press of New England.
Cloninger, D. O., & Marchesini, R. (2001). Executions and deterrence: A quasi-controlled group experiment. Applied Economics, 33(5), 569-576.
Cochran, J., & Chamlin, M. (2000). Deterrence and brutalization: The dual effects of executions. Justice Quarterly, 17(4), 685-706.
Death Penalty Information Center. (2008). Death sentences in the United States from 1977 to 2006. Washington, DC. Retrieved February 7, 2008, from http://www.deathpenaltyinfo.org/article.php?scid=9&did=847.
Dieter, R. C. (2005). What politicians don’t say about the high costs of the death penalty. In E. Mandery (Ed.)., Capital punishment a balanced examina-tion. Sudbury, MA: Jones and Bartlett Publishers, 116-120.
Ehrlich, I. (1975). The deterrent effect of capital punishment: A question of life or death. American Economic Review, 65, 397-417.
Finkel, S. E. (1995). Causal analysis with panel data. Thousand Oaks, CA: Sage Publications, Inc.
Gertsman, B. (2003). Epidemiology kept simple: An introduction to traditional and modern epidemiology (2nd ed.). New York, NY: Wiley-Liss.
Heilbrun, A., Jr., (2006). The death penalty beyond the smoke and mirrors. Lanham, MD: University Press of America.
Howell, D. C. (2007). Statistical methods for psychology (6th ed.). Belmont, CA: Thomson Higher Education.
Liebman, J. S. (2000). The overproduction of death. Columbia Law Review, 100(8), 2030-2156.
Mandery, E. (2005). Capital punishment a balanced examination. Sudbury, MA: Jones and Bartlett Publishers.
Marquart, J., & Sorenson, J. (1989). A national study of the Furman-commuted inmates: assessing the threat to society from capital offenders. Loyola of Los Angeles Law Review, 23, 5-24.
226 CAPITAL PUNISHMENT IN TEXAS AND CALIFORNIA
© Applied Psychology in Criminal Justice, 2008, 4(2)
National Academy of Science. (1978). Deterrence and incapacitation: Estimating the effects of criminal sanctions on crime rates. In A. Blumstein, J. Cohen, & D. Nagin (Eds.), Report of the panel of deterrence and inca-pacitation. Washington, DC: National Academy of Science.
Paternoster, R., Brame, R., & Bacon, S. (2008). The death penalty America’s ex-perience with capital punishment. New York, NY: Oxford University Press.
Pollock, J. M. (2006). Prisons today and tomorrow (2nd ed.). Sudbury, MA: Jones and Bartlett Publishers.
Prisoners under sentence of death, by race, ethnicity, and jurisdiction. (1993-2006). Sourcebook of Criminal Justice Statistics Online. Washington, DC: U.S. Department of Justice. Retrieved February 14, 2008, from http://www.albany.edu/sourcebook/tost_6.html” \l “6_s.
Sellin, T. (1959). The death penalty. Philadelphia, PA: American Law Institute.Sellin, T. (1967). Capital punishment. New York, NY: Harper and Row.Shadish, W. R., Cook, T. D., & Campbell, D. T. (2002). Experimental and qua-
si-experimental designs for generalized causal inference. Boston, Ma: Houghton Miffl in.
Shepherd, J. M. (2005). Deterrence versus brutalization: Capital punishments dif-fering impacts among states. Michigan Law Review, 104, 203-255.
Sorenson, J., & Pilgrim, R. L. (2006). Capital punishment in Texas during the modern era. Austin, TX: University of Texas.
Sorenson, J., Wrinkle, R., Brewer, V., & Marquart, J. (1999). Capital punishment and deterrence: Examining the effect of executions on murder in Texas. Crime & Delinquency 45(4), 481-493.
Stolzenberg, L., & D’Allesio, S. J. (2004). Capital punishment, execution pub-licity and murder in Houston, Texas. Journal of Criminal Law and Criminology, 94(2), 351-379.
Sutherland, E. (1925). Murder and the death penalty. Journal of the American Institute of Criminal Law and Criminology 51, 522-529.
Table 3.107. (2006). Estimated number and rate of offenses known to po-lice. Sourcebook of criminal justice statistics. Washington, DC: U.S. Department of Justice.
Table 4. (2005). Crime in the United States by region, geographic division, and state. Crime in the United States 2005. Washington, DC: Federal Bureau of Investigation.
Table 6.85. (2006). Prisoners executed under civil authority. Sourcebook of crimi-nal justice statistics. Washington, DC: U.S. Department of Justice.
U.S. Census Bureau. (2000). American fact fi nder. Fact sheet-California. Fact sheet-Texas. Retrieved January 3, 2008, from http://factfi nder.census.gov/servlet/ACSSAFFFacts.
Vandiver, D. M. (2005). California, Texas, and Florida: The big three in correc-tions. In R. Muraskin (Ed.), Key correctional issues. Upper Saddle, NJ: Prentice Hall.
PRICE AND BYRD 227
© Applied Psychology in Criminal Justice, 2008, 4(2)
Received: August 2007Accepted: September 2008
Suggested Citation:
Price, K. J., & Byrd, G. R. (2008). Capital punishment in Texas and California: A comparison [Electronic Version]. Applied Psychology in Criminal Justice, 4(2), 206-227.