CAPITAL MARKETS - Government of Pakistan Market.pdf · CAPITAL MARKETS Introduction A...
21
101 Chapter 07 CAPITAL MARKETS Introduction A well-developed capital market is essential for promoting economic growth as it facilitates the efficient allocation of savings to the most productive uses. A modern and efficient capital market is the backbone of an economy. It plays a crucial role in mobilizing domestic and foreign resources, and channeling them to promote investment activities both for the short and the long-term periods. The capital market channelizes money from those who do not have an immediate productive use for it to those who do. In other words, serving the role of an intermediary it directs capital to most productive uses. It also helps a large number of investors to reduce their financial risk through diversifying their portfolios by spreading the factor of risks. The capital market cushions the investor against economic and financial risks. It has been observed that countries with well-developed capital markets enjoy robust economic growth for over a longer period of time. Pakistan’s capital and stock markets have witnessed impressive growth over the last several years on account of market-friendly and investment-friendly policies pursued by the government. The KSE-100 index (Pakistan’s benchmarked stock market) has increased from 1521 points in June 2000 to 12370 points in April 2007 – a rise of over 10,800 points or an increase of 713 percent. Similarly aggregate market capitalization has increased from Rs 392 billion ($ 7.6 billion) in June 2000 to Rs 3604 billion ($ 59.4 billion) in April 2007, showing a rise of over Rs 3200 billion ($ 53 billion) or an increase of 819 percent. The listed capital at KSE has increased from Rs 236.4 billion in 2000 to Rs 535.5 billion in March 2007. Turnover of shares at KSE has increased from 48 billion in fiscal year 1999-2000 to 105 billion shares during fiscal year 2005-06. Similarly daily turnover of shares at KSE has increased from 202 million shares in fiscal year 2000-01 to about 320 million in fiscal year 2005-06. Portfolio investment has increased from a negative $ 140 million in fiscal year 2000-01 to $ 1819 million during July-April 2006-07. There are several factors that contributed to the bullish sentiment in stock markets during the last seven years (2000-07). These factors include: speedy privatization process, attracting foreign investors in prestigious organizations, like PTCL and National Refinery etc., early resolution of the IPP issue, allowing foreign investors to repatriate their funds without any restriction; reduction in the interest rates by the banks; recovery of outstanding/over due loans; rescheduling of foreign debts and prepayment of the expensive foreign loans; continuous improvement in economic fundamentals such as strong economic growth, sound monetary and fiscal policies with fiscal deficit under control; higher revenue collection, lower inflation, rising export earnings and stable exchange rate; declining debt burden and higher industrial growth. To revamp the structure of the capital market, various laws and rules were introduced mainly for the protection of small investors, and bringing efficiency in trade through automation and curbing insider trading, besides strengthening the structure of the Security Exchange Commission of Pakistan (SECP). As a result of these important developments capital and stock markets in Pakistan grew by leaps and bounds during the last seven years and emerged as one of the best performing markets in emerging economies. Developments in Fiscal Year 2006-07 Pakistan’s stock market is benchmarked through the Karachi Stock Exchange 100-index (KSE-100). This index stood at 9989 points at the end of the fiscal year 2005-06. The KSE-100 index rose by 24 percent since then to 12370 points until April 2007.
-
Upload
nguyendieu -
Category
Documents
-
view
215 -
download
1
Transcript of CAPITAL MARKETS - Government of Pakistan Market.pdf · CAPITAL MARKETS Introduction A...

101
Chapter 07
CAPITAL MARKETS
Introduction
A well-developed capital market is essential for promoting economic growth as it facilitates the efficient allocation of savings to the most productive uses. A modern and efficient capital market is the backbone of an economy. It plays a crucial role in mobilizing domestic and foreign resources, and channeling them to promote investment activities both for the short and the long-term periods. The capital market channelizes money from those who do not have an immediate productive use for it to those who do. In other words, serving the role of an intermediary it directs capital to most productive uses. It also helps a large number of investors to reduce their financial risk through diversifying their portfolios by spreading the factor of risks. The capital market cushions the investor against economic and financial risks. It has been observed that countries with well-developed capital markets enjoy robust economic growth for over a longer period of time.
Pakistan’s capital and stock markets have witnessed impressive growth over the last several years on account of market-friendly and investment-friendly policies pursued by the government. The KSE-100 index (Pakistan’s benchmarked stock market) has increased from 1521 points in June 2000 to 12370 points in April 2007 – a rise of over 10,800 points or an increase of 713 percent. Similarly aggregate market capitalization has increased from Rs 392 billion ($ 7.6 billion) in June 2000 to Rs 3604 billion ($ 59.4 billion) in April 2007, showing a rise of over Rs 3200 billion ($ 53 billion) or an increase of 819 percent. The listed capital at KSE has increased from Rs 236.4 billion in 2000 to Rs 535.5 billion in March 2007. Turnover of shares at KSE has increased from 48 billion in fiscal year 1999-2000 to 105 billion shares during fiscal year 2005-06. Similarly daily turnover of shares at KSE has
increased from 202 million shares in fiscal year 2000-01 to about 320 million in fiscal year 2005-06. Portfolio investment has increased from a negative $ 140 million in fiscal year 2000-01 to $ 1819 million during July-April 2006-07.
There are several factors that contributed to the bullish sentiment in stock markets during the last seven years (2000-07). These factors include: speedy privatization process, attracting foreign investors in prestigious organizations, like PTCL and National Refinery etc., early resolution of the IPP issue, allowing foreign investors to repatriate their funds without any restriction; reduction in the interest rates by the banks; recovery of outstanding/over due loans; rescheduling of foreign debts and prepayment of the expensive foreign loans; continuous improvement in economic fundamentals such as strong economic growth, sound monetary and fiscal policies with fiscal deficit under control; higher revenue collection, lower inflation, rising export earnings and stable exchange rate; declining debt burden and higher industrial growth. To revamp the structure of the capital market, various laws and rules were introduced mainly for the protection of small investors, and bringing efficiency in trade through automation and curbing insider trading, besides strengthening the structure of the Security Exchange Commission of Pakistan (SECP). As a result of these important developments capital and stock markets in Pakistan grew by leaps and bounds during the last seven years and emerged as one of the best performing markets in emerging economies.
Developments in Fiscal Year 2006-07
Pakistan’s stock market is benchmarked through the Karachi Stock Exchange 100-index (KSE-100). This index stood at 9989 points at the end of the fiscal year 2005-06. The KSE-100 index rose by 24 percent since then to 12370 points until April 2007.

Economic Survey 2006-07
102
During the same period total market capitalization increased by 28.6 percent rising from Rs 2801 billion ($ 46.5 billion) to Rs 3604 billion ($ 59.4 billion). The index reached all time high of 12961 points on 31st May 2007. Aggregate market capitalization also increased by 35.0 percent from Rs 2801 billion in June 2006 to Rs 3781 billion ($ 62.3 billion) as of 31st May 2007. This increase has been driven by a number of factors including: (i) continuous improvement in the country’s economic fundamentals, (ii) government’s commitment to maintain its economic reform and pro-market policies, (iii) stability in exchange rate as a result of strong build up in foreign exchange reserves, (iv) regionally cheap valuation driving foreign interest in Pakistan’s stock market, (v) large-scale merger and acquisition in the banking, telecom and other sectors of the economy (vi) improving Pakistan’s geo-political relationship with neighbours as well as globally, resulting in decline in political risk premium of the country, (vii) successful GDR offerings of the OGDC and MCB Bank, amounting US dollars 888 million and (viii) increase in Pakistan’s coverage by large international brokerage firms and investment banks.
The outgoing fiscal year has witnessed concerted foreign investor’s interest in Pakistan’s stock market as a result of large-scale coverage of market by foreign brokerage houses. Brokerage houses providing research coverage on Pakistan are include: Merrill Lynch, JPMorgan, Credit Suisse, Citigroup, UBS. Lynch was the first to start active covering of Pakistan. The JPMorgan has expanded its operation in Pakistan during the outgoing fiscal year to expand into stock brokerage. The interest of foreign investors can also be gauged from the fact that JPMorgan is only catering to foreign clients as an initial way of doing business. JPMorgan’s expansion has piqued foreign investors interest as well. Other investment banks such as Credit Suisse have also announced their intention of entering the Pakistan market, while others are looking to forge relationships with local brokerage houses. Several foreign banks have also organized road shows across the globe to introduce Pakistan to the community of foreign investors, interested in fast growing emerging markets.
Foreign portfolio investment in Pakistan’s stock market during the first ten months of the current fiscal year amounted to $ 1.82 billion, which is the highest ever inflow of portfolio investment in Pakistan’s history, as against $ 1.011 billion in the corresponding period of last year, thereby registering an increase of 80 percent. The growth in portfolio investment has been contributed to by issuance of GDR of Oil and Gas Development Corporation (OGDC) and MCB Bank. These GDRs are listed at the London Stock Exchange and are receiving strong investors’ interest.
The outgoing fiscal year has also witnessed large-scale merger and acquisition, which provided support to stock market valuation. Several key takeovers have taken place in Pakistan’s corporate sector during the outgoing fiscal year. These include: (i) acquisition of Union Bank Ltd. by Standard Chartered Bank, (ii) acquisition of Prime Commercial Bank Ltd. by ABN AMRO, (iii) acquisition of PICIC Bank by Tamasek of Singapore, (iv) acquisition of Crescent Commercial Bank by SAMBA, (v) acquisition of PakTel by China Mobile, (vi) acquisition of further stake in Lakson Tobacco by Philip Morris. This M&A activity, which has taken place at very attractive valuations has provided support to valuation in the stock market as well. Peer group companies’ stock prices have also reacted as a result of these acquisitions.
Pakistan’s privatization programme has also accounted for support to sector and corporate valuations as well. Even though no large privatization has taken place in the fiscal year 2006-07, the government has still managed capital market transactions for OGDC. The GDR issuance of United Bank Ltd. (UBL) is also in the pipeline and is expected to be completed before the end of the current fiscal year. Several strategic sales are also in the pipeline, which continue to provide boost to investor sentiment in the stock market. Privatization of Pakistan State Oil, NIT, Pakistan Petroleum Ltd. etc. are all at advanced stages.
The monthly trends of the leading stock market indicators are given in Table 7.1 and Fig: 7.1 (a) and 7.1 (b).

Capital Markets
103
Table-7.1 : Leading Stock Market Indicators on KSE (KSE-100 Index: November 1991=1000) 2005-06 2006-07 (July-April)
Months KSE Index (end month)
Market Capitalization
(Rs billion) (end month)
Turnover of Shares (billion)
KSE Index (end month)
Market Capitalization
(Rs billion) (end month)
Turnover of Share
(billion)
July 7179.0 2013.7 3.1 10497.6 2905.1 4.4 August 7796.9 2132.5 5.0 10064.1 2786.9 4.0 September 8225.6 2329.7 7.9 10512.5 2874.7 3.0 October 8247.3 2340.8 6.5 11327.7 3074.3 3.2 November 9025.9 2551.2 7.5 10618.8 2919.7 3.8 December 9556.6 2709.5 7.4 10040.5 2738.4 2.6 January 10524.2 2990.3 8.5 11272.3 3043.3 3.3 February 11456.3 3221.2 10.3 11180.0 3052.0 5.6 March 11485.9 3218.5 8.1 11271.6 3065.8 3.6 April 11342.2 3160.1 6.0 12369.7 3603.0 5.7 May 9800.7 2743.4 5.1 12961.3 3781.2 6.4 June 9989.4 2801.0 4.0
Source: Karachi Stock Exchange
Fig 7.1. (b) Market Capitalization in KSE
180020002200240026002800300032003400360038004000
Jul(05-06)
Aug
Sept
Oct
Nov
Dec
Jan
Feb
Mar
Apr
May
June
Jul(06-07
Aug
Sep
Oct
Nov
Dec
Jan
Feb
Mar
Apr
May
Rs.
Bill
ion
Market Capitalization
Fig-7.1(a): Trends in KSE Index
1,000
3,000
5,000
7,000
9,000
11,000
13,000
15,000
May-
02
Nov-
02
May-
03
Nov-
03
May-
04
Nov-
04
May-
05
Nov-
05
May-
06
Nov-
06
May-
07
Basi
s Pt
s.

Economic Survey 2006-07
104
Leading Stock Market Trends
During July-May 11, fiscal year 2006-07 the 16 leading stock markets of the world witnessed high growth ranging from 9.6 percent (Japan) to 150 percent (China). Karachi stock market showed good performance as its index (KSE-100 index) increased by a modest 23.5 percent in terms of US
dollars compared to 53.6 percent in the same period last year. Leading world stock markets, which recorded growths of more than 45 percent during current fiscal year are: China (150%), Philippine (75.3%), Indonesia (63.4%), Malaysia (59.8%), Singapore (49.1%) and India (45.9%). Table 7.2 and Figure 7.2 give the details.
Table-7.2 : Performance of Global Stock Markets during July-May 11, 2006-07
Index (in local currency terms) Country 11, May 2007 30-June 2006
% Change in USD
Pakistan 12368 9989 23.5 India 13796 10609 45.9 Indonesia 2022 1310 63.4 Taiwan 8032 6704 17.3 South Korea 1604 1295 26.9 Hong Kong 20468 16268 25.0 Malaysia 1351 915 59.8 Japan 17554 15505 9.6 Singapore 3447 2435 49.1 Sri Lanka 2675 2114 18.6 China 4022 1672 149.9 Philippines 3365 2179 75.3 Australia 6297 5034 42.3 US 1491 1270 17.4 UK 6525 5833 22.5 New Zealand 4226 3586 45.0
Source: Invisor Securities
Fig-7.2: Performance of Global Markets During June-May 11, 2006-07
0102030405060708090
100110120130140150160
Paki
stan
Indi
a
Indo
nesi
a
Taiw
an
Sout
h K
orea
Hon
g K
ong
Mal
aysi
a
Japa
n
Sing
apor
e
Sri L
anka
Chi
na
Phili
ppin
es
Aus
tral
ia US
UK
New
Zea
land
% C
hang
e in
US
$

Capital Markets
105
Reforms Introduced by the SECP
Prudent management and reforms by the SECP also promoted efficient stock markets in Pakistan. The SECP proactively undertook market reform initiatives, and implemented sustainable risk management measures. The Commission’s various initiatives and reform programmes contributed towards a high level of integrity and transparency in terms of price discovery and trade settlement. These regulatory reforms have provided impetus for the development of a buoyant and broad-based capital market in the country. As a step towards boosting the investor’s confidence, the capital gain tax exemption has been extended till June 2008 and stamp duty on transfer of shares has been deferred for further two years.
During the year under review, the SECP explored the implementation of a new risk management structure based on international best practices to improve the prevalent risk management framework at the exchanges. A new risk management structure (RMS) was introduced in December 2006. New RMS that included, among others, a new netting regime; a margining system based on value at risk (VAR) and capital adequacy. The VAR is a state of the art risk management system practiced internationally that takes into account risk associated with each share based on historical data. Other systems being introduced by the SECP on risk management are: Valuation of Securities eligible to be held as security; Mark-to-Market Loss Collection and Profit Distribution; Position Limits linked with the free float of the scrip. These are expected to minimize the possibility of any market abuse.
To increase market transparency and improve its surveillance capacity, the Unique (Client) Identification Number (UIN) System was launched at pre trade level in August 2006 at all three stock exchanges. The UNI system has significantly enhanced the risk management at client levels and improved the surveillance and monitoring capacity of the Commission and the stock exchanges. Continuous Funding System (CFS) scrips has been introduced which inter-alia takes into account impact cost and free float of the scrip.
Moreover, work is in progress on; (1) Introduction of CFS Mk II, (2) Margin Financing; (3) New Derivatives Product Development; (4) Demutualization; (5) New Futures Trading Act; (6) New Securities Act; (7) Voluntary Pension System (VPS); and (8) Regulatory Framework for Private Equity Funds. Details are given in Annexture-1.
Sectoral Performance
Extraordinary performance in the stock markets during the first 9-10 months of the current fiscal year was driven by some major sectors of the economy including banks and other financial institutions, transport and communication, engineering, fuel & energy and auto & allied. During the period from July 2006 to March 2007 the listed capital on KSE increased from Rs 496 billion to Rs 536 billion, reflecting an increase of 8.1 percent. The market capitalization increased from Rs 2801 billion ($ 46.5 billion) to Rs 3066 billion ($ 50.5 billion) in the same period reflecting an increase of 9.5 percent in the value of shares. The average daily turnover of shares was 209 million. The KSE 100 Index increased from 9989 points in June 2006 to 12370 points as on April 30, 2007, reflecting an increase of 24 percent. Performances of some of the major trading groups are discussed below:
Banks & Other Financial Institutions: In December 2006, a total of 162 companies were listed with the KSE. There are 4 sub groups in this group namely: banks & investment companies, modarabas, leasing companies, and insurance. During the current fiscal year, this group remained the fastest growing sector. Its share index and market capitalization increased by record 22.3 percent and 87.7 percent, respectively. Pakistan has made considerable progress in the development of financial markets within a short period of time. The sector now has vibrant institutional markets for money, foreign exchange and short-term government debt. However, the long-term domestic debt market is still under developed and corporate debt issues account for less than 1 % of GDP. Given the importance of long-term debt markets to support investment, particularly in infrastructure projects, to increase domestic savings, and improve the risk profile of commercial banks, Pakistan needs to foster development of long-term institutional savings

Economic Survey 2006-07
106
industry (mutual funds, etc.), implement capital market reforms aiming to encourage investment rather than speculation, and improve risk management in the financial sector to ensure financial sector stability.
Fuel & Energy: A total of 28 companies were listed with the KSE. It is one of the most dominant group in the stock market. However, during July-April 2006-07 its share index grew by only 0.1 percent and its market capitalization increased by 1.5 percent or by Rs 17 billion compared to a rise of Rs 374.5 billion in the same period last year. Fuel and energy sector continued to be one of the major market players in the current year along with transport and communication, banking and finance. The energy sector has been identified as an engine of growth along with 3 other sectors, (agriculture, small and medium enterprises and information technology) by the government. Companies like OGDC, PSO, SNGC, SSGC, Hub Power, and Pakistan Oil Fields along with banks and other financial institutions led the current year’s upsurge in the stock market. Total foreign investment in oil and gas explorations and power sector amounted to $ 521 million during July-March 2006-07.
Transport & Communication: At the end of 2006, there were 14 companies in this group listed with the KSE. Its share index and market capitalization have increased by 7.9 percent and 16.9 percent respectively during July-April 2006-07. The telecommunications was one of the rapidly growing sectors, which invited $1026 million foreign investment during the first nine months of the current fiscal year.
Cotton and Other Textiles: In this group there are three sub-groups: (a) textile spinning, (b) textile weaving & composite, and (c) other textiles. There were 212 companies listed with the KSE under this group in December 2006. The share index of cotton and other textiles declined by 17.4 percent during July-April 2006-07 as compared to a decline of 2.8 percent in the same period last year. Its market capitalization however increased by 4.7 percent during the period under review.
Chemicals & Pharmaceuticals: A total of 35 companies were listed with the KSE under this group at the end of December 2006. During July-
April 2006-07 its share index has increased by 5.9 percent as compared to an increase of 36.9 percent in the comparable period of last year. Its market capitalization increased by Rs 19.5 billion during July-April 2006-07 and stood at Rs 241.4 billion on April 30, 2007.
Auto and Allied: A total of 25 companies were listed with the KSE under this group at the end of December 2006. Its share index increased by 13.3 percent, while its market capitalization increased by 30.4 percent during the first ten months of the current fiscal year.
Sugar and Allied: A total of 37 companies of sugar and allied were listed with the KSE. During July-April 2006-07 share index of sugar and allied declined by 6.8 percent as compared to a rise of 49.3 percent in the comparable period last year. Its market capitalization also declined by 1.4 percent during the period under review.
Cement: At the end of 2006, there were 21 cement companies listed with the KSE. During the current fiscal year the performance of cement sector remained lackluster. Share index of cement declined by 4.1 percent during July-April 2006-07 compared to an impressive rise of 113.4 percent in the same period last year. Its market capitalization also declined by 2.4 percent in the current fiscal year. Detailed performance of the Karachi stock market can be seen in Tables 7.3 to 7.6.
During the calendar year 2005, total profit before taxation of the 12 trading groups amounted to Rs 326.3 billion, which increased to Rs 376.7 billion in 2006 recording a growth of 15.4 percent. All the trading groups and companies except cotton and textile showed unprecedented growth during the first ten months of the outgoing fiscal year.
In December 2006, a total of 651 companies were listed on the Karachi Stock Exchange, including 212 companies in cotton and other textile, 162 in banks and financial institutions and 85 in miscellaneous group. As per the annual report of the KSE 2006, a total of 66 companies were de-listed between 2002-06, 24 companies in 2002, 8 companies in 2003, 18 companies in 2004, 14 companies in 2005 and 2 companies in 2006. During the same period a total of 79 companies were also merged including 16 companies in 2002,

Capital Markets
107
8 companies in 2003, 39 companies in 2004, 4 companies in 2005 and 12 companies in 2006. In the calendar year 2006, the number of dividend paying companies was 294 compared to 300
companies in 2005. In 2006, 407 companies were making profit and 150 companies were shown as loss making. The numbers were 431 and 138 respectively in 2005. The total before taxation
Table-7.3 : Sectoral Performance on Karachi Stock Exchange (Percent) General Index Market Capitalization
July-April (Growth%) July-April (Growth %) AMC
(Rs billion)* Sector 2005-06 2006-07 2005-06 2006-07 2006* 2007*
1. Cotton and other Textiles -2.8 -17.4 4.9 4.7 107.9 103.3 2. Chemicals & Pharmaceuticals 36.9 5.9 47.2 8.8 251.2 241.4 3. Engineering 41.1 16.3 33.5 32.6 12.5 15.0 4. Auto & Allied 71.2 13.3 78.1 30.4 71.7 92.0 5. Cables and Electrical Goods 64.0 -2.7 108.9 7.2 18.9 20.0 6. Sugar & Allied 49.3 -6.8 50.9 -1.4 19.3 17.1 7. Paper & Board 18.2 2.7 32.4 10.3 22.0 24.0 8. Cement 113.4 -4.1 121.0 -2.4 151.1 129.9 9. Fuel & Energy 12.1 0.1 42.0 1.5 1265.4 1098.2 10. Transport & Communication 11.1 7.9 -5.1 16.9 270.8 244.9 11. Banks other Financial Institutions 57.9 22.3 174.1 87.7 811.2 1341.8 12. Miscellaneous 19.3 -7.5 42.3 44.2 158.0 241.3 13. Overall/Total 36.8 8.5 57.0 29.0 3160.1 3568.9 14. KSE Share Index 52.2 23.8 0 0 0 0 * End April 2006 and 2007 Source: State Bank of Pakistan Table-7.4 : Companies Listed on KSE and their Before Tax Profits
No. of Companies
Profit Before Taxation
(Rs billion)
Dividend Paying
Companies
Profit Making Companies
Loss making Companies S. # Name of Sector
2005 2006 2005 2006 2005 2006 2005 2006 2005 2006 1. Cotton & other Textile 213 212 10.5 9.3 59 60 122 114 55 59 2. Chemical &
Pharmaceutical 35 35 28.3 27.3 24 22 28 26 6 07 3. Engineering 13 13 1.5 1.6 5 09 10 10 0 0 4. Auto & Allied 25 25 11.6 17.2 15 16 20 20 2 02 5, Cables & Electric
Goods 09 09 1.9 2.3 5 04 5 06 2 01
6. Sugar & Allied 37 37 2.5 1.6 20 17 24 25 12 11 7. Paper & Board 12 10 2.4 7.2 8 05 9 08 2 01 8. Cement 21 21 10.4 17.1 9 12 16 16 5 05 9. Fuel & Energy 28 28 110.6 133.0 16 16 20 19 7 08 10. Transport &
Communication 17 14 40.2 21.5 6 05 11 08 4 03 11. Bank & Financial
Institutions 164 162 92.8 122.5 99 91 120 111 19 28 12. Miscellaneous 87 85 13.6 15.9 34 37 46 44 24 25 Total 661 651 326.3 376.7 300 294 431 407 138 150
Source: Karachi Stock Exchange profit of the 12 trading groups, listed with the KSE, amounted to Rs 326.3 billion in 2005, which increased to a record of Rs 376.7 billion in 2006, showing a growth of 15.4 percent. In the year 2006, all the 12 trading groups were shown as profit
making ranging from Rs 1.6 billion (engineering) to Rs 133.0 billion, (fuel & energy). Fuel & energy, banks and other financial institutions and transport & communication groups were the most important players in the stock market, earning

Economic Survey 2006-07
108
highest ever profits. Fuel and energy earned a pre-taxation profit of Rs 133.0 billion in 2006 as compared to Rs 110.6 billion it earned in 2005. Banks and other financial institutions with a pre-taxation profit of Rs 122.5 billion was the second biggest profit-earning group in 2006 as compared to Rs 92.8 billion it earned in 2005. The group-wise number of companies and their performance is given in Table 7.4.
Performance of Selected Blue Chips
Some big blue chip companies including; OGDC, PTCL, NBP and Hub Power etc primarily influenced the KSE. During the first three quarters of the current fiscal year, the combined turnover of shares of ten big companies (OGDC, PTCL, Bank of Punjab, D.G. Khan cement, Fauji Fertilizer Bin Qasim, Pakistan Petroleum, National Bank of
Pakistan, Muslim Commercial Bank, Lucky Cement and Hub Power Company) was 13.3 billion, which constituted 39.7 percent of the total turnover at the KSE. These ten companies earned a profit after taxation of Rs 122.6 billion in the current fiscal year up to March 2007. Out of Rs 122.6 billion profit after tax, the share of PTCL and OGDC was Rs 66.8 billion representing 54.5 percent of the ten big companies. In the first nine months of 2006-07, PTCL’s after taxation profit was Rs 20.8 billion. Earning per share (EPS) of the ten big companies ranged from 2.39 in the case of Hub Power Company to 20.9 in respect of National Bank of Pakistan. This indicates that the business environment in the current fiscal year has improved appreciably for the blue chip companies. (Details in Table 7.5).
Table-7.5 ; Price Earning Ratio July 2006 – March 2007 Company No.of Shares
(In billion) Profit After Tax
(Rs billion) EPS Rate P/E Ratio
P.T.C.L. 3.8 20.8 5.51 47.40 8.61 Oil & Gas Development 4.3 46.0 10.69 108.80 11.12 National Bank of Pakistan 0.8 17.0 20.88 229.75 10.99 D.G. Khan Cement 0.3 2.4 9.54 86.50 9.07 Fauji Fertilizer Bin Qasim 0.9 2.4 2.62 31.85 12.17 Bank of Punjab 0.4 3.8 9.89 86.90 8.78 MCB Bank Ltd. 0.6 12.1 20.63 270.65 13.12 Pakistan State Oil 0.7 13.4 19.54 245.35 12.56 Pakistan Oil Fields 0.3 1.9 7.35 79.30 10.79 Hub Power Company 1.2 2.8 2.39 28.95 12.10 Total/Average 13.3 122.6 10.90 121.55 -
Source: Karachi Stock Exchange Table-7.6 : Profile of Karachi Stock Exchange 2003-04 2004-05 2005-06 2006-07
(July-March) a) Number of Listed Companies b) New Companies Listed c) Fund Mobilized
(Rs Billion) d) Listed Capital
(Rs Billion) e) Turnover of Shares
( In Billion) f) Average daily Turnover of Share (in
million) g) Aggregate Market Capitalisation (Rs
Billion)
668 16
70.7
374.1
97.0
386.7
1357.5
659 15
54.0
439.0
88.3
351.9
2013.2
658 14
41.4
496.0
104.7
319.6
2801.0
655 11
22.3
535.5
33.5
208.8
3065.8 Source: Karachi Stock Exchange.

Capital Markets
109
Performance of LSE & ISE
The leading market indicators witnessed mixed trends in Lahore and Islamabad Stock Exchanges. The turnover of shares on the Lahore Stock Exchange (LSE) during July-March 2006-07 was 5.6 billion compared to 11.9 billion shares in the same period last year. Total paid up capital with the LSE increased from Rs 469.5 billion in June 2006 to Rs
491.4 billion in March 2007. The LSE index, which was 4379.3 points in June 2006, declined to 4249.3 points in March 2007. The market capitalization of the LSE has increased from Rs 2693.3 billion in June 2006 to Rs 2948.2 billion in March 2007. Seven new companies were listed with the LSE during July-March 2006-07, as compared to 15 companies in the fiscal year 2005-06. A profile of LSE is given in Table-7.7.
Table-7.7 : Profile of Lahore Stock Exchange 2003-04 2004-05 2005-06 2006-07
(July-March) a) Number of Listed companies b) New Companies Listed c) Fund Mobilized
(Rs Billion) d) Listed Capital
(Rs Billion) e) Turnover of Share
(In Billion) f) Average daily shares (in mln) g) LSE Index h) Market Capitalization (Rs bln)
534 19 3.1
361.5
19.9
80.9
2828.3* 1406.2
524 13
42.1
402.9
17.5
69.5 3762.3 1995.2
518 15
24.5
469.5
15.1
61.3 4379.3 2693.3
519 7
7.0
491.4
5.6
31.0 4249.3 2948.2
Source: Lahore Stock Exchange * The LSE launched the new LSE-25 index in December 2002. The Islamabad Stock Exchange also witnessed mixed trend during the first nine months of 2006-07. The ISE 10 index started at 2,522.6 points and ended at 2,568.8 points depicting an increase of 1.8 percent only. The highest level of index was 2,999.87 as on January 25, 2007 as compared to the lowest level of 2,428.38 as on 10 July 2006. The
average daily trade volume in the Islamabad stock exchange during this period was 0.23 million shares, which was substantially lower as compared to the preceding period. ISE index however, increased to 2738.3 points on 30th April 2007. A profile of the ISE is given in Table 7.8.
Table-7.8 : Profile of Islamabad Stock Exchange 2003-04 2004-05 2005-06 2006-07
(July-March) a) Number of Listed Companies b) New Companies Listed c) Fund Mobilized
(Rs billion) d) Listed Capital
(Rs billion) e) Turnover of Share
(In Billion) f) Average Daily Turnover of Share
(in million) g) ISE 10 Index h) Market Capitalization (Rs.bln)
248 6
14.5
287.5
1.5
6.0 1587.8 1082.9
236 6
23.2
337.3
0.7
2.6 2432.6 1558.4
240 6 -
374.5
0.4 -
2522.6 2101.6
240 6
12.0
389.7
0.04
4.6 2568.8 2247.6
Source: Islamabad Stock Exchange

Economic Survey 2006-07
110
The total funds mobilized during July-March fiscal year 2006-07 in the three stock exchanges (KSE, LSE & ISE) amounted to Rs 41.3 billion, as compared to Rs 96.6 billion in the last fiscal year. The total turnover of shares in the three stock exchanges during the first three-quarters of the current fiscal year was 39.1 billion, compared to 76.4 billion shares in the same period last year.
Mutual Funds
Pakistan’s Mutual Funds sector is still at the nascent stage and has yet to achieve mainstream status. The regulators along with the institutions need to promote international best practices and corporate governance, spread consumer awareness and maintain investors confidence. Pakistan’s mutual fund industry is witnessing exceptional growth owing to upturn in the country’s economy. Initially, the market was dominated by public entities like ICP, NIT, but with the emergence of private sector assets managers, the mutual fund sector is heading in the right direction. Currently mutual funds accounts for only 2.4 percent of the country’s GDP compared to 6.0 percent for India and 69.0 percent for the USA. Mutual fund accounts for 16.5 percent of Pakistan’s national savings. This sector holds great potential for future. The industry has witness phenomenal growth during the last 4-5 years. Its total assets have increased from Rs 25 billion in June 2002 to about Rs 215 billion in March 2007, showing an increase of 760 percent. The industry has gained popularity due to its improved and disciplined behavior, government support, development of specialized innovative products and investment-friendly environment. In March 2007, there were 67 mutual funds as against 46 in June 2006, which included 43 open end and 24 close end funds. Besides, 19 more were in the pipeline. At present there are 34 Assets Management Companies registered and licensed by the SECP. New and innovative products are being designed and offered in the market for both corporate and individual investors. The new products so far offered also include shariah complaint products, sector-specific products etc. The new products to be offered in the near future include pension funds, real estate funds, infrastructure funds etc., which are being developed to suit investor’s risk and return profile and their cash flow needs.
Since 2000 onwards, the SECP has been working to bring about qualitative changes in the practices and policies concerning establishment, operations and management of mutual funds. As a result of the proactive approach adopted by the Commission, the mutual industry has attracted attention of professionals, entrepreneurs and investors alike. This enabling environment has led to phenomenal increase in the number of mutual funds. The industry is on the path of steady progress and competing with banks in attracting savings, besides supporting and underpinning the stock market activities. The mutual funds sector is set to attract growing pubic attention owing to better investment prospects and effective role in brining about betterment in the national economy.
The sector is now focusing on specialized financial products aimed at niche markets with a view to cater to the requirement of all types of investors. The performance of the mutual funds industry has generally kept pace with the performance of the stock market. The effective monitoring of operations of mutual funds and other non-banking finance companies (NBFCs) by SECP has improved the confidence of investors in Pakistan to a great extent. The permission granted by SBP to local mutual funds to invest 30 percent of their assets abroad with a cap of US $ 15 million has enhanced the image of mutual funds among the investors. During 2006 before taxation profit of 23 close end mutual fund was Rs 8.28 billion compared to Rs 7.55 billion during 2005.
Although asset managers are working on innovative financial products, there is a real need to create general awareness about mutual funds in the retail segment of investors. Mutual funds are set to give tough competition to NSS and Bank Deposits in the near future, provided the asset managers and the financial planners work collectively in establishing enlightenment among the masses, the market, which is still largely untapped.
Non-Banking Finance Companies
During the first nine months of 2006-07, leasing companies sanctioned an amount of Rs 16.44 billion of which they disbursed Rs 16.24 billion. While Rs 18.28 billion was disbursed from sanctioned amount of Rs 18.55 billion in the

Capital Markets
111
corresponding period of 2005-06. The decreasing trend in financial activities of leasing companies is primarily due to the rise in interest rates and stiff competition from the commercial banks that have access to relatively low cost funds.
Sanction and disbursements of investment banks, were recorded at Rs 4.73 billion and Rs 4.14 billion respectively during the first nine months of the current fiscal year compared to Rs 8.00 billion sanctioned and Rs 7.26 billion disbursed during the same period last fiscal year. The reason of relatively smaller sanction and disbursement in the current fiscal year is primarily attributed to the conversion of two investment banks into the commercial banks (Atlas Investment Bank Limited into Atlas Commercial Bank and Jehangir Siddiqui Investment Bank into JS Bank) while Crescent Standard Investment Bank Ltd. has limited operations and is under an Administrator appointed by the SECP.
Discount houses sanctioned and disbursed Rs 0.70 billion during the period under review - an increase from the sanction and disbursement of Rs 0.51 billion and Rs 0.50 billion respectively during the first nine months of 2005-06. Housing finance companies sanctioned and disbursed an amount of Rs 0.01 billion and Rs 0.04 billion respectively during the period compared to Rs 0.43 billion and Rs 0.28 billion, respectively during the corresponding period of last year. The modarabas sanctioned Rs 6.96 billion and disbursed Rs 6.70 billion during the first nine months of the current fiscal year compared to their sanction and disbursement of Rs 7.13 billion and Rs 6.94 billion respectively during the same period last year.
National Savings Schemes (NSS)
The Central Directorate of National Savings (CDNS) is an attached department of the Finance Division and perform deposit bank functions by selling government securities through a network of 368 savings centers, spread all over the country. There are about 3.6 million investors in National Saving Schemes (NSS). Presently, Defence Saving Certificates, Regular Income Certificates, Special Savings Certificates/Accounts, Bahbood Saving Certificates, Savings Account, Pensioners’ Benefit Account and Prize Bonds are in operation. Some of the popular schemes are discussed below:
Defence Savings Certificates: Defence Savings Certificates were introduced by the Government of Pakistan in the year 1966 and are available in denominations ranging from Rs 500 to Rs 1,000,000. These certificates are issued for 10 years but encashable any time after one month. The certificates purchased on or after 05-06-2006 earn compound profit @ 10.00 percent per annum on maturity. The profits earned on deposits (exceeding Rs 150,000/-) is subject to a withholding tax @ 10 percent. Zakat is collected only once at the time of actual encashment. These certificates are transferable from person to person and from one place to other on the request of the purchaser. These certificates are available at National Savings Centres, Pakistan Post Offices, Scheduled Banks and the State Bank of Pakistan. The certificates are also available at the counters of HBL & UBL in UAE.
Special Savings Certificates (Registered): Special Saving Certificates (Registered) were introduced in February 1990. These Certificates are available in the denominations ranging from Rs 500/- to Rs 1,000,000. This scheme has a maturity period of three years. The profit is paid biannually. The certificates purchased on or after 05-06-2006 earn profit @ 9.00 percent per annum for first five six monthly profits and the last profit @ 10.00 percent per annum. There is no maximum limit of investment in this scheme. The profit on deposits is subject to deduction of withholding tax @ 10 percent at sources if the deposit made on or after 01-07-02 exceed Rs 150,000/-. The investment made in this scheme from abroad in foreign exchange and the profit earned thereon is repatriable in foreign exchange abroad. These certificates are sold at the counters of National Savings Centers, Scheduled banks, State Bank of Pakistan & Pakistan Post Offices. The certificates are also available at the counters of Habib Bank Ltd & United Bank Ltd in UAE.
Bahbood Saving Certificates: The scheme with 10 year’s maturity has exclusively been launched for the widows and senior citizens over the age of 60 years. This scheme offers profit payment facility on monthly basis. Presently on an investment of Rs 100,000/- the investor gets monthly profit of Rs 960/- @ 11.52 percent per annum. The profit earned though this scheme is exempted from compulsory deduction of Zakat and withholding

Economic Survey 2006-07
112
tax. Premature encashment before completion of one, two, three and four years entails service charges @ 1.0 percent, 0.75 percent, 0.50 percent and 0.25 percent, respectively. These certificates are available at the National Savings Centers only.
Pensioners’ Benefit Account: This new savings scheme has exclusively been launched for retired employees of federal government, provincial government armed forces and autonomous bodies. This scheme offers profit payment on monthly basis. Presently on an investment of Rs 100,000/- the investor gets monthly profit of Rs 960/- @ 11.52 percent per annum. The profit earned through this scheme is exempted from compulsory deduction of Zakat and withholding tax. Premature encashment before completion of one,
two, three and four years entail service charges @ 1.0 percent, 0.75 percent, 0.50 percent, and 0.25 percent, respectively. These certificates are available at the National Savings Centers only.
During the fiscal year 2005-06, net deposits with National Saving Schemes increased by Rs 8.8 billion as compared to a net decline of Rs 39.4 billion in 2004-05. In 2005-06 huge retirements were made in the case of Special Saving Certificates (Rs 57.7 billion), Regular Income Certificates (Rs 15.6 billion) and Defence Savings Certificates (Rs 7.6 billion). Net accruals on the other hand increased in respect of Bahbood Saving Certificates (Rs 59.6 billion), Pensioners Benefit Accounts (Rs 16.4 billion) and National Prize Bonds (Rs 3.3 billion).
Table-7.9 : Net Accruals by National Saving Schemes (Rs Billion)
July-March 2003-04 2004-05 2005-06 2005-06 2006-07
1. Defence Saving Certificates
2. Special Saving
Certificates (Registered) 3. Saving Accounts 4. Special Saving
Accounts
5. Regular Income Certificates 6. Pensioner’s Benefit Accounts 7. Bahbood Savings Certificates
8. National Prize Bonds 9. Postal Life Insurance
Grand Total
3.2
-13.2
-0.7
2.9
-49.1
13.2
22.7
22.8
8.7
10.6
-8.7
-83.3
-2.9
-1.9
-40.7
17.7
60.7
9.4
10.3
-39.4
-7.6
-57.7
0.2
-0.7
-15.6
16.4
59.6
3.3
10.8
8.8
-5.2
-45.3
-5.6
-0.9
-11.4
14.0
50.1
3.3
7.9
7.0
-4.5
3.7
1.8
3.2
-12.4
9.4
38.8
4.6 -
44.6
Source: Directorate of National Savings. Net accruals with the NSS increased by Rs 44.6 billion during July-March 2006-07 as compared to an increase of Rs 7.0 billion in the same period last year (Table-7.9). Net accruals of Special Saving Certificates increased by Rs 3.7 billion during July-March 2006-07 as against a huge decline of Rs 45.3 billion in the same period last year. Net accruals of
Saving Accounts and Special Saving Accounts also showed increase of Rs 1.8 billion and Rs 3.2 billion respectively as against their decline of Rs 5.6 billion and Rs 0.9 billion respectively, in the same period last year. Bahbood Saving Certificates and Pensioners Benefit Accounts continued to show positive growth as net accruals of these two

Capital Markets
113
popular saving schemes accumulated by Rs 48.2 billion during the first nine months of the current fiscal year. Higher investment with the NSS resulted partly due to institutional participations,
which was allowed since 1st October 2006 and partly due to higher rates of returns on various savings schemes compared to the previous years.
Table-7.10 : Nominal and Real Deposit Rates on Savings Schemes During 2003-2007
2003-04 2004-05 2005-06 2006-07 Scheme (Maturity) Nominal
Rate(p.a.) Real Rate
Nominal Rate (p.a.)
Real Rate
Nominal Rate(p.a.)
Real Rate
Nominal Rate (p.a.)
Real Rate
1. Defence Saving Certificates(10 Years)
2. Special Savings
Certificate, Registered (3 Years)
3. Regular Income Certificates (5 Years)
4. Mahana Amdani Accounts (7 Years)
5. Saving Accounts
(Running Accounts) 6. Pensioners’ Benefit
Accounts (10 Years) 7. Bahbood Saving
Certificates (10 years) 8. Prize Bonds (Running
Account)
Weighted Average
7.96
7.27
6.96
10.41
4.00
10.08
10.08
5.0
7.2
3.36
2.67
2.36
5.81
-0.6
5.48
5.48
0.4
2.6
8.15
6.95
6.84
10.41
4.00
10.08
10.08
5.00
7.29
-1.15
-2.35
-2.46
1.11
-5.3
0.78
0.78
-4.30
-2.01
9.46
8.60
8.88
10.41
5.00
11.04
11.04
5.00
8.69
1.56
0.70
0.98
2.51
-2.90
3.14
3.14
-2.90
0.79
10.03
9.34
9.24
10.41
6.00
11.52
11.52
6.50
9.66
2.03
1.34
1.24
2.41
-2.0
3.52
3.52
-1.50
1.66
Source: Directorate of National Savings, Finance Division Average inflation was 4.6% during 2003-04; 9.3% during 2004-05; 7.9% during 2005-06 and 8.0% during July-March 2006-07.. Keeping in view the increasing trend of interest rates in the financial market, the Government of Pakistan has raised the nominal rates of returns on most of the saving schemes during the current fiscal year. In the case of Defence Saving Certificates the rate has been increased from 9.46 percent last year to 10.03 percent this year. Nominal rate on special saving certificates has been increased from 8.60 percent to 9.17 percent this year, nominal rate on saving accounts from 5.0 percent to 6.0 percent and nominal rates on Bahbood Saving Certificates and Pensioners Benefit Accounts from 11.04 percent to 11.52 percent. As a result of these increase, real deposit rates became positive for all the schemes except
saving accounts and Prize Bonds (Table-7.10). During 2005-06 and 2006-07 weighted average real deposit rate remained positive indicating that investors in the NSS are getting modest returns on their investment.
Two newly launched schemes namely Pensioners’ Benefit Accounts and Bahbood Saving Certificates remained very popular with their combined net accruals of Rs 48.19 billion during July-March 2006-07 as compared to their net accrual of Rs 64.1 billion in the same period last year. The Pensioners’ Benefit Account has been launched exclusively for retired government/semi government employees, whereas, the Bahbood

Economic Survey 2006-07
114
Savings Certificates have been launched for widows and senior citizens (above the age of 60 years). Moreover, keeping in view the hardship faced by pensioners, senior citizens and widows; the federal government has allowed exemption of withholding tax deduction on both the schemes with effect from 1st July 2004. In order to provide small savers, an access to the stock market, the government plans to give maximum administrative and operational autonomy to the CDNS enabling it to launch mutual funds on more professional lines. The accounts of the Directorate
are being computerized and National Savings Centres are being shifted to better and specious places. The aforesaid measures will help to further improve the customer services.
National Savings has launched its software development project, the project of uplifting and upgrading the facilities at the offices of the National Savings, data entry project, and the establishment of main IT center and installation of hardware at pilot sites. All of the aforesaid profits are in full swing.

Capital Markets
115
Annexure-1
Various capital market reform initiatives introduced by the SECP during the outgoing fiscal year are as follows:
Risk Management
During the year under review, the SECP explored the implementation of a new risk management structure, based on international best practices, to improve the prevalent risk management framework at the exchanges. A new Risk Management Structure (RMS) was introduced in December 2006, after a detailed review of the existing framework. The salient features of the New RMS that included, among others, a new netting regime; a margining system based on value at risk (VAR) and capital adequacy.
Value at Risk (VAR) based Margining System: To reduce systemic risk at the stock exchanges the new marketing system has been based at Value at risk (VAR) principle i.e. the maximum amount of money that can be lost on given scrip over a given period of time with a given level of confidence. VAR provides an accurate statistical estimate of the maximum probable loss on a portfolio when markets are behaving normally. VAR is a state of the art risk management system practiced internationally and takes into account risk associated with each share based on historical data.
Netting: To recognize the true exposure of the market, the netting regime has been overhauled. Netting of exposure margin has been disallowed across markets, across clients and across settlement periods. The previous prevalent practice of netting increased the exchange risk and would hide actual magnitude of exposures. Presently, client level netting has been implemented in the ready market with effect from March 5, 2007, and the same would be implemented in the futures market from May 2007.
Valuation of Securities eligible to be held as security: In order to effectively categorize the collateral, all securities are now classified on the basis of liquidity and volatility. Further, to ensure minimization of trading risk, haircut can now be applied accompanied with impact cost analysis. Eligible securities, acceptable by the exchanges
against deposit as exposure, are presently being evaluated on the basis of the new Haircut Regime. Previously, only the turnover and EPS of the scrip were considered for ranking of eligible securities against deposit.
Mark-to-Market Loss Collection and profit Distribution: A new mark-to-market regime has been introduced at the stock exchanges. Mark to market loss in any scrip is the amount payable by a member, on account of his clients and his proprietary unsettled net position for a given day, to the clearing house due to difference between volume weighted average price of the unsettled position and the “closing price” of the scrip at day end.
Position Limits: Market wide, member wide and client-wide position limits have been introduced in the market to avoid concentration of positions and to restrain investors from being over leveraged. These limits have been linked with the free float of the scrip and are expected to minimize the possibility of any market abuse.
Special Margins: In order to curb volatility and to mitigate systemic risk in the market, special margins have been introduced that shall be payable on daily basis only if the weighted average transaction cost of a scrip in the CFS or Future Deliverable Markets with respect to a member, is different from 26 weeks moving average price of that scrip in the Ready Market.
Other Reforms
The following measures have been successfully introduced at the stock exchanges to strengthen integrity and transparency in terms of price discovery and trade settlement:
Unique Identification Number (UIN): In pursuance of the Commission’s objective to increase market transparency and improve its surveillance capacity, the Unique (Client) Identification Number (UIN) System was launched at pre trade level on 1 August 2006 at all three stock exchanges after implementing the requisite software and hardware changes by the stock exchanges and NCCPL. The UIN System

Economic Survey 2006-07
116
establishes a traceable link between the executed trade and the investors at the stock exchange. UNI system has significantly enhanced the risk management at client levels and improved the surveillance and monitoring capacity of the SECP and the stock exchanges.
Free Float Index: In order to introduce a free float index that is representative of the market, the KSE-30 Sensitive Index was implemented with effect from September 1, 2006. The need for a market representative free float index was long felt as the capitalization weighted KSE 100 Index strongly tilted to a few scrips. Free float is based on the proportion of shares readily available for trading to the total shares issued and excludes the locked in shares. The criterion for the selection of scrips on KSE-30 index was revised on 15 February 2007 in line with international best practices to include the impact cost as a measure to gauge the liquidity of scrip.
Changes in Existing Continuous Funding System (CFS): SECP enhanced the CFS Limit to Rs 55 billion for the Karachi Stock Exchange and Rs 10 billion and Rs 5 billion for the Lahore and Islamabad Stock Exchange respectively w.e.f. November 6, 2006, considering the demand in the market and ban on in-house badla. Further, a revised eligibility criterion for CFS scrips has been introduced which inter-alia takes into account impact cost and free float of the scrip.
Work in Progress:
Introduction of CFS Mk II: In order to facilitate transparent and efficient financing for the market, the SECP has proposed authorization of direct leverage finance in the form of CFS Mk II by eligible brokers, banks and non-banking financial institutions. Further, to provide a level playing field for the Lahore and Islamabad stock markets the centralized CFS Mk II will be developed at the National Clearing Company of Pakistan Limited.
Margin Financing: parallel with other modes of leverage financing SECP is continuing its efforts to promote Margin Financing. Margin accounts allow investors to buy shares with a relatively small amount of cash or margin up front by using the assets currently held in their accounts as collateral. Margin financing will effectively lead to
monitoring of risk at three levels. At first, the exchanges will monitor the risk at broker level and secondly the broker will carry out due diligence of his customers. Thirdly, banks and DFIs providing margin financing will monitor the risk of providing margin financing to brokers and or investors directly.
New Derivatives product Development: SECP is working towards the introduction of new derivatives products such as Cash-settled Futures, Index Futures and Options; in line with international west practices in order to provide much needed avenues of leverage financing to the market.
Demutualization: SECP is pursuing the process of demutualization and integration and is keeping a close liaison with the stock exchanges and other stakeholders to drive the process. In this regard, on January 28th, 2006, SECP and the Karachi Stock Exchange (KSE) signed a Memorandum of Understanding (MMMOU) on critical issues, which inter-alia covers matters relating to the issuance and transfer of trading rihts, the moratorium period, Code of Governance, issuance of shares, transfer of assets, shareholding structure and composition of Board of Directors.
Moreover, in order to facilitate the process of corporatization and demutualization, a new section 32E was inserted in the Securities and Exchange Ordinance, 1969 through the Finance Act 2006, which provided that all the Stock Exchanges shall stand corporatized and demutualized upto December 31, 2007.
New Futures Trading Act: A draft Futures Trading Act has been prepared which provides a comprehensive and independent legal framework for the regulation of futures contracts. All the stakeholders were consulted before finalization of the proposed law, which has been submitted to the Government for further process.
New Securities Act: The Commission, in order to remove various deficiencies in the existing Securities and Exchange Ordinance, 1969 had initiated work to formulate a Draft Securities Act, 2005, which will ensure that the standards and practices followed in Pakistani markets conform to the best in the world.

Capital Markets
117
Voluntary Pension System (VPS): The Federal Government took the initiative of development of the private pensions in Pakistan by allowing rebates for investments in approved pension schemes in year 2001 and vested the responsibility of development of necessary framework and regulation of private pensions in the Securities and Exchange Commission of Pakistan. The SECP has proposed the draft legislation for the Private Pension Schemes, by issue of the Voluntary Pension System Rules, 2005.
Under the new Voluntary pension System, the money contributed by the participants would be managed by professional fund managers. An important two-tier structure has been designed under which fund management and the custody of the funds has been separated. A trustee would be appointed for each pension fund to keep in its custody all the property of the pension fund. The new pension system is based on individual pension accounts. Employees as well as employers can make tax-free contributions into the pension funds and such contributions would be invested as
per the investment and asset allocation Guidelines issued by the SECP. Investment Income of the pension fund would also be tax-free. Only the final benefits or premature withdrawals are taxable.
So far, for (4) Assets Management Companies have been registered with the SECP as Pension Fund Managers, which are engaged in designing their pension fund schemes. Their applications or seeking authorization to launch the proposed schemes are under consideration of the Commission.
Regulatory Framework for private Equity Funds: Private Equity is the equity investment in an asset in which the equity is not freely tradable in the s tock market. A private equity fund raises contributions from smaller investors to create a capital pool. Private equity can play a vital role by providing growth capital to the corporate sector particularly the SMEs. Draft of the Private Equity Rules has been prepared by the Commission and is being finalized in the light of the recommendations received from the market participants.
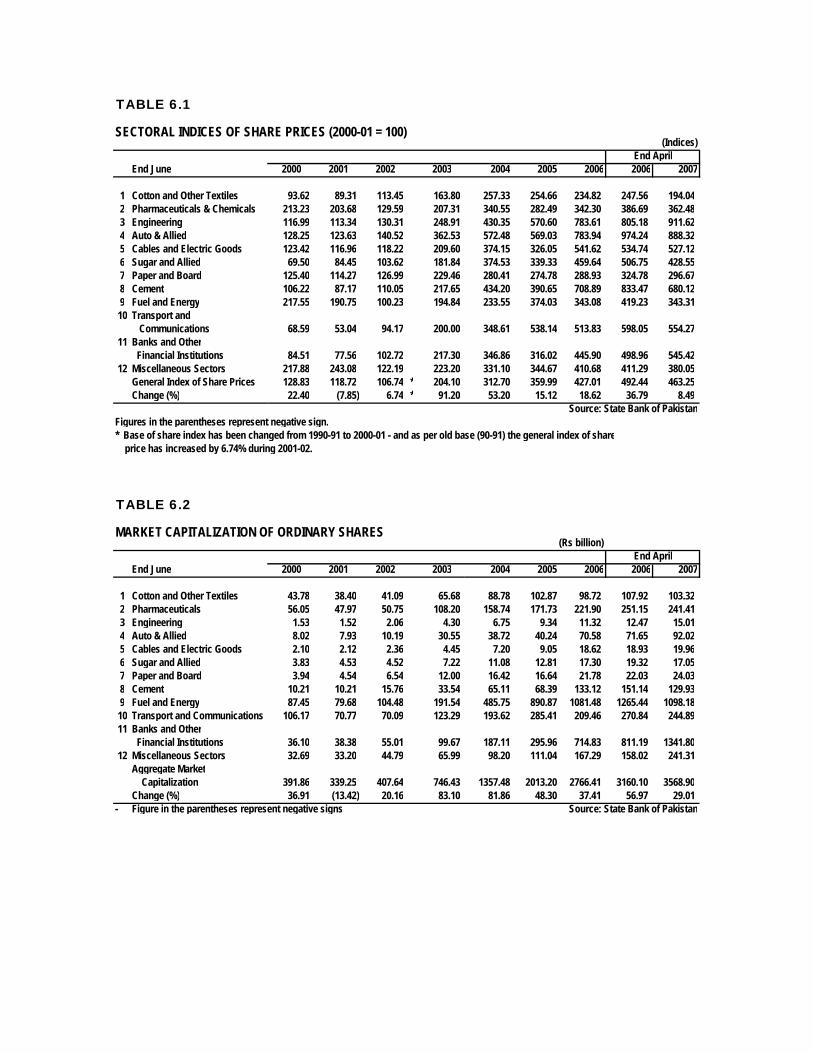
TABLE 6.1
(Indices)
End June 2000 2001 2002 2003 2004 2005 2006 2006 2007
1 Cotton and Other Textiles 93.62 89.31 113.45 163.80 257.33 254.66 234.82 247.56 194.04 2 Pharmaceuticals & Chemicals 213.23 203.68 129.59 207.31 340.55 282.49 342.30 386.69 362.48 3 Engineering 116.99 113.34 130.31 248.91 430.35 570.60 783.61 805.18 911.62 4 Auto & Allied 128.25 123.63 140.52 362.53 572.48 569.03 783.94 974.24 888.32 5 Cables and Electric Goods 123.42 116.96 118.22 209.60 374.15 326.05 541.62 534.74 527.12 6 Sugar and Allied 69.50 84.45 103.62 181.84 374.53 339.33 459.64 506.75 428.55 7 Paper and Board 125.40 114.27 126.99 229.46 280.41 274.78 288.93 324.78 296.67 8 Cement 106.22 87.17 110.05 217.65 434.20 390.65 708.89 833.47 680.12 9 Fuel and Energy 217.55 190.75 100.23 194.84 233.55 374.03 343.08 419.23 343.31 10 Transport and
Communications 68.59 53.04 94.17 200.00 348.61 538.14 513.83 598.05 554.27 11 Banks and Other
Financial Institutions 84.51 77.56 102.72 217.30 346.86 316.02 445.90 498.96 545.42 12 Miscellaneous Sectors 217.88 243.08 122.19 223.20 331.10 344.67 410.68 411.29 380.05
General Index of Share Prices 128.83 118.72 106.74 * 204.10 312.70 359.99 427.01 492.44 463.25Change (%) 22.40 (7.85) 6.74 * 91.20 53.20 15.12 18.62 36.79 8.49
Source: State Bank of PakistanFigures in the parentheses represent negative sign.* Base of share index has been changed from 1990-91 to 2000-01 - and as per old base (90-91) the general index of share price has increased by 6.74% during 2001-02.
TABLE 6.2
(Rs billion)
End June 2000 2001 2002 2003 2004 2005 2006 2006 2007
1 Cotton and Other Textiles 43.78 38.40 41.09 65.68 88.78 102.87 98.72 107.92 103.32 2 Pharmaceuticals 56.05 47.97 50.75 108.20 158.74 171.73 221.90 251.15 241.41 3 Engineering 1.53 1.52 2.06 4.30 6.75 9.34 11.32 12.47 15.01 4 Auto & Allied 8.02 7.93 10.19 30.55 38.72 40.24 70.58 71.65 92.02 5 Cables and Electric Goods 2.10 2.12 2.36 4.45 7.20 9.05 18.62 18.93 19.96 6 Sugar and Allied 3.83 4.53 4.52 7.22 11.08 12.81 17.30 19.32 17.05 7 Paper and Board 3.94 4.54 6.54 12.00 16.42 16.64 21.78 22.03 24.03 8 Cement 10.21 10.21 15.76 33.54 65.11 68.39 133.12 151.14 129.93 9 Fuel and Energy 87.45 79.68 104.48 191.54 485.75 890.87 1081.48 1265.44 1098.18 10 Transport and Communications 106.17 70.77 70.09 123.29 193.62 285.41 209.46 270.84 244.89 11 Banks and Other
Financial Institutions 36.10 38.38 55.01 99.67 187.11 295.96 714.83 811.19 1341.80 12 Miscellaneous Sectors 32.69 33.20 44.79 65.99 98.20 111.04 167.29 158.02 241.31
Aggregate Market Capitalization 391.86 339.25 407.64 746.43 1357.48 2013.20 2766.41 3160.10 3568.90Change (%) 36.91 (13.42) 20.16 83.10 81.86 48.30 37.41 56.97 29.01
- Figure in the parentheses represent negative signs Source: State Bank of Pakistan
End April
End April
SECTORAL INDICES OF SHARE PRICES (2000-01 = 100)
MARKET CAPITALIZATION OF ORDINARY SHARES
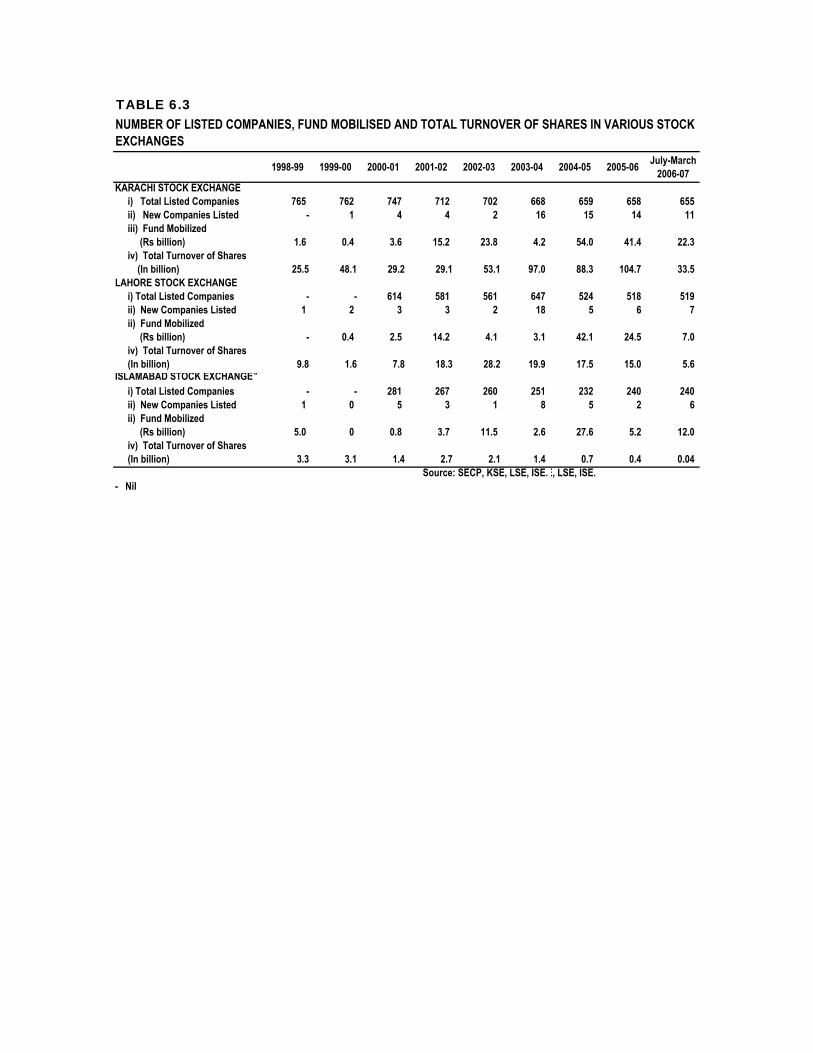
TABLE 6.3
1998-99 1999-00 2000-01 2001-02 2002-03 2003-04 2004-05 2005-06 July-March2006-07
KARACHI STOCK EXCHANGEi) Total Listed Companies 765 762 747 712 702 668 659 658 655ii) New Companies Listed - 1 4 4 2 16 15 14 11iii) Fund Mobilized (Rs billion) 1.6 0.4 3.6 15.2 23.8 4.2 54.0 41.4 22.3iv) Total Turnover of Shares (In billion) 25.5 48.1 29.2 29.1 53.1 97.0 88.3 104.7 33.5
LAHORE STOCK EXCHANGEi) Total Listed Companies - - 614 581 561 647 524 518 519ii) New Companies Listed 1 2 3 3 2 18 5 6 7ii) Fund Mobilized (Rs billion) - 0.4 2.5 14.2 4.1 3.1 42.1 24.5 7.0iv) Total Turnover of Shares(In billion) 9.8 1.6 7.8 18.3 28.2 19.9 17.5 15.0 5.6
ISLAMABAD STOCK EXCHANGEa
i) Total Listed Companies - - 281 267 260 251 232 240 240ii) New Companies Listed 1 0 5 3 1 8 5 2 6ii) Fund Mobilized (Rs billion) 5.0 0 0.8 3.7 11.5 2.6 27.6 5.2 12.0 iv) Total Turnover of Shares(In billion) 3.3 3.1 1.4 2.7 2.1 1.4 0.7 0.4 0.04
Source: SECP, KSE, LSE, ISE.E, LSE, ISE.- Nil
NUMBER OF LISTED COMPANIES, FUND MOBILISED AND TOTAL TURNOVER OF SHARES IN VARIOUS STOCK EXCHANGES

TABLE 6.4
(Rs. Million)
Name of Scheme 1998-99 1999-00 2000-01 2001-02 2002-03 2003-04 2004-05 2005-06 2005-06 2006-07
1 Defence Savings Certificates 38,349.8 41,212.3 16,580.3 22,037.3 21,990.5 3,238.3 (8,759.1) (7,551.0) (5,200.1) (4,528.1)2 National Deposit Scheme (52.4) (17.2) (21.5) (6.3) (5.7) (6.8) (1.3) (2.5) (2.3) (0.6)3 Khaas Deposit Scheme (20.5) (52.9) (51.1) (12.1) (13.5) (23.4) (5.4) (2.8) (14.1) (4.4)4 Premium Savings Scheme - - - - - - - - - -5 Special Savings Certificates (R) 24,956.7 19,395.8 9,431.1 36,443.2 84,899.1 (13,199.3) (83,311.9) (57,737.1) (45,275.5) (3,738.3)6 Special Savings Certificates (B) (883.0) (507.3) 196.3 (203.3) (11.1) (2.6) (4.6) (0.6) (0.3) (0.02)7 Regular Income Certificates 59,099.4 26,111.6 8,643.2 11,046.3 (14,923.9) (49,090.5) (40,663.0) (15,563.9) (11,439.9) (12,435.7)8 Pensioners' Benefit Account - - - - 10,170.0 13,209.3 17,737.2 16,382.9 13,997.4 9,403.59 Savings Accounts 2,296.6 (196.7) (2,105.0) (329.8) 1,638.1 (729.6) (2,891.4) (202.7) (5,562.1) (1,795.3)10 Special Savings Accounts 5,879.9 5,450.9 3,626.5 4,266.9 5,135.0 2,894.1 (19,048.0) (709.6) (911.6) (3,191.8)11 Bahbood Saving Certificates - - - - - 22,691.0 60,654.6 59,636.6 50,121.9 38,793.712 Mahana Amdani Accounts 16.5 13.8 52.8 92.8 129.5 120.9 85.9 45.7 12.5 51.313 Prize Bonds 10,125.7 (32.3) 10,390.6 11,588.0 26,840.1 22,841.9 9,357.0 3,325.8 3,315.6 4,620.414 Postal Life Insurance 2,548.1 4,131.0 4,377.4 6,448.3 7,367.7 8,668.7 10,335.2 10,804.5 7,944.4 -
Grand Total 142,241.2 95,508.9 51,120.5 91,371.3 143,215.8 10,612.0 (39,371.6) 8,830.7 7,014.1 44,625.5Figures in Parenthesis represent negative signs Source : Directorate of NSS
Table 6.5
(Rs. Billion)
Name of Institutions 2001-02 2002-03 2003-04 2004-05 2005-06 2006-07Jul-Mar
1. DFIs 2.9 8.7 13.1 24.7 10.6* -2. Special Banks 11.3 25.2 38.8 47.0 23.1* -3. Islamic Banks 2.5 11.1 17.9 43.4 24.4* -4. Khushadi Bank 0.2 1.6 1.3 2.3 2.92 2.345. Micro Credit Bank 0.0 0.1 0.3 0.5 0.94 1.886. Leasing Companies 15.9 16.0 18.6 16.5 29.1 16.27. Investment Banks 4.4 7.6 7.5 7.4 10.4 4.18. Modarabas 4.8 6.1 6.5 7.3 9.6 6.59. Housing Finance 0.1 0.8 2.4 0.3 0.4 0.110. Discount Houses 0.1 0.2 2.7 2.6 1.3 0.7* July-December 2005-06 Source: SBP & SECP.
NATIONAL SAVING SCHEMES (NET INVESTMENT)
LOANS DISBURSED BY DFIs AND OTHER FINANCIAL INSTITUTIONS
July-March

TABLE 6.6
S.No. Schemes Markup/Profit Rate Maturity Period Tax Status
1. Foreign Exchange Bearer Certificate (FEBC)a. If Certificate of Rs 1000 encashed before 1 year investor will get Rs 1000 (face value)b. If Certificate of Rs 1000 encashed after 1 year investor will get Rs 1145c. If Certificate of Rs 1000 encashed after 2 year investor will get Rs 1310d. If Certificate of Rs 1000 encashed after 3 year investor will get Rs 1520e. If Certificate of Rs 1000 encashed after 4 year investor will get Rs 1740f. If Certificate of Rs 1000 encashed after 5 year investor will get Rs 1990g. If Certificate of Rs 1000 encashed after 6 year investor will get Rs 2310
2. Foreign Currency Bearer Certificate Scheme has already been discontinued w.e.f. February 1999. Only(FCBC), 5 years repayment is made
3. Special US$ Bondsa) 3 year maturity LIBOR+1.00%b) 5 year maturity LIBOR+1.50%c) 7 year maturity LIBOR+2.00%
4. Pakistan Investment BondsTenor Rate of Profit3-Year Maturity 9.10% p.a5-Year Maturity 9.30% p.a10-Year Maturity 9.60% p.a15-Year Maturity 9.0% p.a20-Year Maturity 10.0% p.a
5. Unfunded DebtDefence Saving Certificates 10.00% p.a (m) 10 Years Taxable for deposits exceeding Rs.150,000
made on or after 01-07-2002National Deposits Schemes 13.00% p.a. 7 Years Taxable and discontinuedSpecial Saving Certificates (R) 9.34% p.a. 3 Years Taxable for deposits exceeding Rs.150,000
made on or after 01-07-2002
Special Saving Certificates (B) 12.36% p.a.(m) 3 Years Taxable and discontinuedRegular Income Certificates 9.24% p.a 5 Years TaxableKhas Deposit Scheme 13.42% p.a. 3 Years Taxable and discontinuedMahana Amdani Accounts 10.41% p.a.(m) 7 Years Taxable on installment exceeding Rs.1000.Saving Accounts 6.00% p.a. Running Account Taxable for deposits exceeding Rs.150,000Bahbood Savings Certificate 11.52% p.a. made on or after 01-07-2002Pensioners' Benefit Account 11.52% p.a. 10 Years Taxable for deposits exceeding Rs 150,000Prize Bonds 6.50% p.a.
p.a.Per annum Source: SBP and Directorate of National SavingsB BearerR Registeredm on maturity
These coupon rates will effective from May 19, 2006 for PIBs of 3.5 Χ 10 years maturity while PIBS of 15 and 20 years maturity launched on Jan 20,2004 the respective coupon rates will effective since then
MARK UP RATE/PROFIT RATE ON DEBT INSTRUMENTS CURRENTLY AVAILABLE IN THE MARKET
Sale under this scheme has already been discontinued, from December 1999 however, on outstanding balance till maturity, rate will be applicable
The rates are effective form Sept. 1999. If bonds are encashed before one year no profit will be paid. Profit is payable @ LIBOR + 2 on bonds investment for 3 or 7 years.