Capital Market Segment - National Stock Exchange of … Market Segment ... 196,512 365,063 80,874...
22
Capital Market Segment 4
Transcript of Capital Market Segment - National Stock Exchange of … Market Segment ... 196,512 365,063 80,874...

Capital Market Segment 4

36

37
4
Cont
d...
Capital Market SegmentTa
ble
4-1:
Bus
ines
s G
row
th o
f CM
Seg
men
t
Mon
th &
Ye
arN
o. o
f Tr
ad-
ing
Day
s
No.
of
Trad
esTr
aded
Q
uant
ity
Tra
ding
Val
ueAv
erag
e D
aily
Tr
adin
g Va
lue
Turn
-ov
er
Rati
o
Dem
at
Trad
ed
Qua
ntit
y
Dem
at T
radi
ng V
alue
Mar
ket
Capi
talis
atio
n
(lakh
)(la
kh)
(` c
r.)(U
S $
mn.
)(`
cr.)
(U
S $
mn.
)(%
)(la
kh)
(` c
r.)
(US
$ m
n.)
(` c
r.)
(US
$ m
n.)
1994
-95
(Nov
.-M
ar.)
102
31,
391
1,80
557
417
60.
50--
----
363
,350
11
5,60
6
1995
-96
246
6639
,912
67,2
8719
,589
276
8016
.76
----
-- 4
01,4
59
116,
873
1996
-97
250
264
135,
561
294,
503
82,0
801,
176
328
70.2
3--
----
419
,367
11
6,88
0
1997
-98
244
381
135,
685
370,
193
93,6
491,
520
384
76.8
8--
----
481
,503
12
1,80
7
1998
-99
251
546
165,
327
414,
474
97,6
831,
651
389
84.3
88,
542
23,8
185,
613
491
,175
11
5,76
0
1999
-00
254
984
242,
704
839,
052
192,
353
3,30
375
782
.23
153,
772
711,
706
163,
159
1,02
0,42
6 23
3,93
3
2000
-01
251
1,6
76
329,
536
1,33
9,51
028
7,20
25,
337
1,14
420
3.62
307,
222
1,26
4,33
727
1,08
465
7,84
714
1,04
8
2001
-02
247
1,75
327
8,40
851
3,16
710
5,15
72,
078
426
80.5
827
7,71
751
2,86
610
5,09
563
6,86
113
0,50
4
2002
-03
251
2,39
836
4,06
661
7,98
913
0,10
32,
462
518
115.
0536
4,04
961
7,98
413
0,10
253
7133
113,
081
2003
-04
254
3,78
071
3,30
01,
099,
534
253,
407
4,32
999
898
.09
713,
300
1,09
9,53
425
3,40
71,
120,
976
258,
349
2004
-05
253
4,51
079
7,68
51,
140,
072
260,
588
4,50
61,
030
71.9
079
7,68
51,
140,
072
260,
588
1,58
5,58
5 36
2,41
9
2005
-06
251
6,0
88
844
,486
1,
569,
558
351,
840
6,25
3 1,
402
55.7
9 8
44,4
86
1,56
9,55
8 35
1,84
02,
813,
201
630,
621
2006
-07
249
7,8
46
855
,456
1,
945,
287
446,
269
7,8
12
1,79
257
.77
855
,456
1,
945,
287
446,
269
3,36
7,35
0 77
2,50
5
2007
-08
251
11,7
27
1,49
8,46
9 3,
551,
038
888,
426
4,1
48
3,54
0 73
.09
1,49
8,46
9 3,
551,
038
888,
426
4,85
8,12
2 1,
215,
442
2008
-09
243
13,6
51
1,42
6,35
5 2,
752,
023
540,
142
11,3
25
2,22
3 95
.02
1,42
6,35
5 2,
752,
023
540,
142
2,89
6,19
4 5
68,4
39
Apr-
09 1
7 1
,271
1
83,1
56
266
,697
5
9,08
2 1
5,68
8 3,
475
-- 1
83,1
56
266
,697
5
9,08
2 3
,375
,025
7
47,6
79
May
-09
20
1,4
83
229
,028
3
82,5
61
84,
750
19,
128
4,23
7 --
229
,028
3
82,5
61
84,
750
4,5
64,5
72
1,0
11,2
03
Jun-
09 2
2 1
,800
2
74,8
51
482
,414
1
06,8
71
21,
928
4,85
8 --
274
,851
4
82,4
14
106
,871
4
,432
,596
9
81,9
66
Jul-
09 2
3 1
,709
2
19,3
56
426
,143
9
4,40
5 1
8,52
8 4,
105
-- 2
19,3
56
426
,143
9
4,40
5 4
,816
,459
1
,067
,005
Aug-
09 2
1 1
,475
1
94,4
27
364
,969
8
0,85
3 1
7,37
9 3,
850
-- 1
94,4
27
364
,969
8
0,85
3 4
,975
,800
1
,102
,304
38
Mon
th &
Ye
arN
o. o
f Tr
ad-
ing
Day
s
No.
of
Trad
esTr
aded
Q
uant
ity
Tra
ding
Val
ueAv
erag
e D
aily
Tr
adin
g Va
lue
Turn
-ov
er
Rati
o
Dem
at
Trad
ed
Qua
ntit
y
Dem
at T
radi
ng V
alue
Mar
ket
Capi
talis
atio
n
(lakh
)(la
kh)
(` c
r.)(U
S $
mn.
)(`
cr.)
(U
S $
mn.
)(%
)(la
kh)
(` c
r.)
(US
$ m
n.)
(` c
r.)
(US
$ m
n.)
Sep-
09 2
0 1
,387
1
96,5
12
365
,063
8
0,87
4 1
8,25
3 4,
044
-- 1
96,5
12
365
,063
8
0,87
4 5
,353
,880
1
,186
,061
Oct
-09
20
1,3
47
168
,479
3
62,9
69
80,
410
18,
148
4,02
0 --
168
,479
3
62,9
69
80,
410
5,0
24,8
30
1,1
13,1
66
Nov
-09
20
1,3
17
157
,401
3
24,4
77
71,
882
16,
224
3,59
4 --
157
,401
3
24,4
77
71,
882
5,4
30,0
88
1,2
02,9
44
Dec
-09
21
1,2
56
150
,384
2
92,9
00
64,
887
13,
948
3,09
0 --
150
,384
2
92,9
00
64,
887
5,6
99,6
37
1,2
62,6
58
Jan-
10 1
9 1
,403
1
80,4
24
338
,443
7
4,97
6 1
7,81
3 3,
946
-- 1
80,4
24
338
,443
7
4,97
6 5
,782
,965
1
,281
,118
Feb-
10 2
0 1
,133
1
23,5
41
245
,143
5
4,30
7 1
2,25
7 2,
715
-- 1
23,5
41
245
,143
5
4,30
7 5
,755
,305
1
,274
,990
Mar
-10
21
1,2
35
137
,971
2
86,2
46
63,
413
13,
631
3,02
0 --
137
,971
2
86,2
46
63,
413
6,0
09,1
73
1,3
31,2
30
2009
-20
10 2
44
16,8
16
2,21
5,53
0 4,
138,
023
916,
709
16,9
59
3,75
7 6
8.86
2,2
15,5
30
4,13
8,02
3 91
6,70
9 6,
009,
173
1,33
1,23
0
Apr-
1020
1,2
05
144
,060
2
76,5
66
61,
941
13,
828
3,09
7 --
144
,060
2
76,5
66
61,
941
6,1
17,8
58
1,3
70,1
81
May
-10
22 1
,249
1
39,8
12
284
,625
6
3,74
6 1
2,93
7 2,
898
-- 1
39,8
12
284
,625
6
3,74
6 5
,932
,578
1
,328
,685
Jun-
1022
1,2
48
143
,616
2
86,1
09
64,
078
13,
005
2,91
3 --
143
,616
2
86,1
09
64,
078
6,2
29,1
36
1,3
95,1
03
Jul-
1022
1,2
19
139
,417
2
78,5
51
62,
385
12,
661
2,83
6 --
139
,417
2
78,5
51
62,
385
6,3
40,1
20
1,4
19,9
60
Aug-
1022
1,3
61
152
,467
3
11,9
94
69,
875
14,
182
3,17
6 --
152
,467
3
11,9
94
69,
875
6,3
93,4
18
1,4
31,8
96
Sep-
1021
1,3
69
173
,285
3
29,8
69
73,
879
15,
708
3,51
8 --
173
,285
3
29,8
69
73,
879
6,9
58,5
34
1,5
58,4
62
Oct
-10
21 1
,447
1
93,2
48
360
,472
8
0,73
3 1
7,16
5 3,
844
-- 1
93,2
48
360
,472
8
0,73
3 7
,055
,094
1
,580
,088
Nov
-10
21 1
,413
1
88,2
17
363
,993
8
1,52
1 1
7,33
3 3,
882
-- 1
88,2
17
363
,993
8
1,52
1 6
,894
,912
1
,544
,213
Dec
-10
22 1
,307
1
51,1
08
295
,685
6
6,22
3 1
3,44
0 3,
010
-- 1
51,1
08
295
,685
6
6,22
3 7
,139
,310
1
,598
,950
Jan-
1120
1,1
84
130
,217
2
67,3
32
59,
873
13,
367
2,99
4 --
130
,217
2
67,3
32
59,
873
6,4
41,4
91
1,4
42,6
63
Feb-
1120
1,2
78
141
,168
2
66,5
04
59,
687
13,
325
2,98
4 --
141
,168
2
66,5
04
59,
687
6,1
95,9
67
1,3
87,6
75
Mar
-11
22 1
,227
1
27,9
00
255
,712
5
7,27
0 1
1,62
3 2,
603
-- 1
27,9
00
255
,712
5
7,27
0 6
,702
,616
1
,501
,146
2010
-11
255
15,5
07
1,82
4,51
5 3,
577,
410
801,
212
14,0
29
3,14
2 5
3.37
1,8
24,5
15
3,57
7,41
0 80
1,21
2 6,
702,
616
1,50
1,14
6
Cont
d...

39
Table 4-2: Frequency Distribution of Companies traded during 2010-11
Trading Frequency (Range of Days)
2009-10 2010-11
No. of Companies Traded
Percentage of Total
No. of Companies Traded
Percentage of Total
Above 100 1,301 92.9 1,444 93.7
91-100 15 1.1 7 0.5
81-90 3 0.2 5 0.3
71-80 9 0.6 7 0.5
61-70 2 0.1 11 0.7
51-60 23 1.6 5 0.3
41-50 6 0.4 6 0.4
31-40 6 0.4 8 0.5
21-30 9 0.6 8 0.5
11-20 14 1.0 11 0.7
1-10 13 0.9 29 1.9
Total 1,401 100.0 1,541 100.0
Table 4-3: Trading Frequency of Companies in Cash Segment during 2010-11
Month/ Year Companies Available for Trading*
No. of companies Traded Percent of Traded to Available for Trading
Apr-10 1,367 1,346 98.5
May-10 1,374 1,349 98.2
Jun-10 1,388 1,364 98.3
Jul-10 1,392 1,373 98.6
Aug-10 1,408 1,389 98.7
Sep-10 1,412 1,395 98.8
Oct-10 1,435 1,415 98.6
Nov-10 1,440 1,419 98.5
Dec-10 1,456 1,432 98.4
Jan-11 1,462 1,440 98.5
Feb-11 1,470 1,444 98.2
Mar-11 1,484 1,450 97.7
*At the end of the period Includes listed/permitted to trade companies but excludes suspended companies.
40
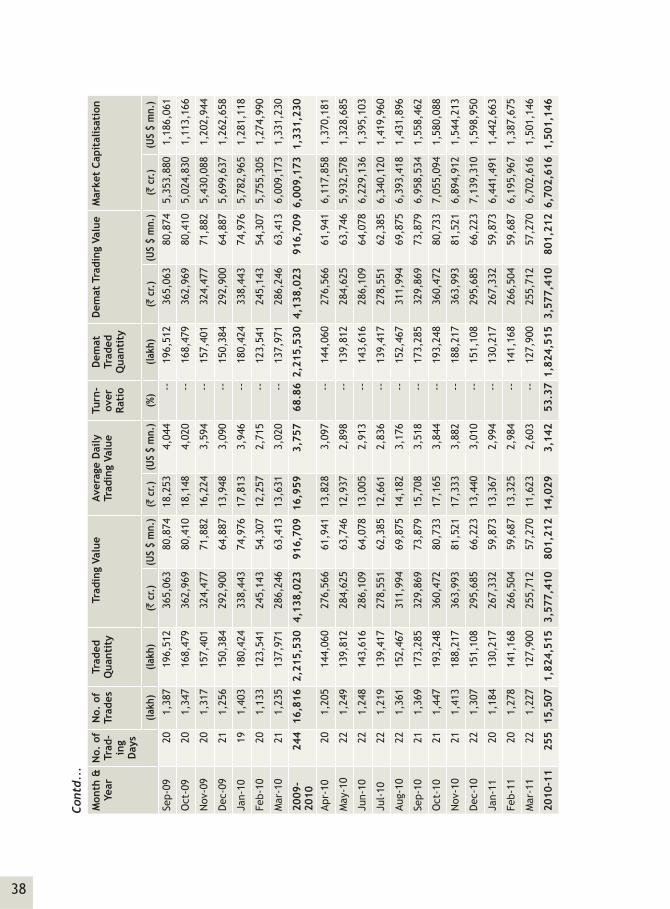
Table 4-4: Advances/Declines in Cash Segment of NSE (No. of Securities)
Month/Date NSEAdvances Declines Advance / Decline Ratio
Apr-10 1,119 245 4.6
May-10 379 987 0.4
Jun-10 696 674 1.0
Jul-10 1,129 258 4.4
Aug-10 802 593 1.4
Sep-10 937 478 2.0
Oct-10 846 574 1.5
Nov-10 483 962 0.5
Dec-10 143 1,304 0.1
Jan-11 347 1,115 0.3
Feb-11 96 1,371 0.1
Mar-11 547 927 0.6Note: Advance/Decline is calculated based on the average price methodology.Stocks which have been traded in both months have been considered
Table 4-5: Citywise Turnover of NSE in the CM Segment (In %)
City 2005-06 2006-07 2007-08 2008-09 2009-10 2010-11
Ahmedabad 3.00 2.90 3.38 5.27 6.96 6.20
Bangalore 1.65 1.33 0.8 0.62 0.64 0.57
Baroda 0.77 0.89 0.8 0.7 0.58 0.52
Bhubaneshwar 0.02 0.02 0.01 0.00 0.00 0.00
Chennai 2.77 2.18 1.9 1.97 1.67 1.56
Cochin 0.61 0.54 0.51 0.76 1.44 1.70
Coimbatore 0.44 0.25 0.2 0.33 0.32 0.26
Delhi 13.37 13.54 14.67 14.97 14.88 10.80
Guwahati 0.02 0.03 0.02 0.01 0.01 0.01
Hyderabad 1.91 1.21 1.26 1.73 1.84 1.58
Indore 0.83 0.78 0.65 0.49 0.58 0.59
Jaipur 1.15 0.88 0.74 0.56 0.53 0.46
Kanpur 0.21 0.17 0.1 0.07 0.07 0.15
Kolkata/Howrah 11.39 10.59 10.96 9.24 8.26 7.50
Ludhiana 0.32 0.22 0.2 0.17 0.15 0.13
Mangalore 0.06 0.06 0.04 0.03 0.02 0.00
Mumbai / Thane 52.43 57.06 57.66 55.85 54.52 58.60
Patna 0.08 0.06 0.29 0.03 0.03 0.03
Pune 0.56 0.41 0.04 0.22 0.21 0.25
Rajkot 0.31 0.36 0.75 1.28 1.37 1.56
Others 8.10 6.54 5.01 5.70 5.91 7.54
Total 100 100 100 100 100 100

41
Table 4-6: Internet Trading Value in the CM segment in comparison with total trading volumes at NSE
Year Enabled Members*
Registered Clients*
Internet Trading Volume
Internet Trading Volume
% of total trading volume
(` cr.) (US $ mn.)
2006-07 242 2,279,098 337,524 77,432 17.352007-08 305 4,405,134 668,399 167,225 18.822008-09 349 5,627,789 692,789 135,974 25.172009-10 363 5,143,705 921,380 204,116 11.132010-11 387 5,640,513 765,271 171,393 10.70
* At the end of the financial year Trading volumes are calculated as buy side + sell side turnoverData is based on statistics of Internet based trading uploaded by trading members.
Table 4-7: Asset Management Companies whose schemes of Mutual Funds are Listed on NSE as of March 2011
No. Name of Asset Management Company
1 Benchmark Asset Management Company Private Limited2 Birla Sun Life Asset Management Company Limited3 Deutsche Asset Management (India) Private Limited4 Fortis Investment Management (India) Private Limited5 Franklin Templeton Asset Management (India) Pvt. Ltd.6 HDFC Asset Management Company Limited7 IDFC Asset Management Company Private Limited8 Kotak Mahindra Asset Management Company Limited9 Principal Pnb Asset Management Co. Pvt. Ltd.
10 Quantum Asset Management Co. Private Ltd.11 Reliance Capital Asset Management Limited12 Religare Asset Management Co. Pvt. Ltd.13 SBI Funds Management Private Limited14 Taurus Asset Management Company Limited15 UTI Asset Management Co. Ltd.16 Sundaram BNP Paribas Asset Management Company Limited 17 ICICI Prudential Asset Management Company Limited18 JM Financial Asset Management Company Limited19 Bharti AXA Investment Managers Private Limited20 L&T Investment Management Limited21 DSP BlackRock Investment Managers Private Limited22 Canara Robeco Asset Management Company Limited23 FIL Fund Management Private Limited24 Motilal Oswal Asset Management Company Limited25 Axis Asset Management Company Limited26 JP Morgan Asset Management India Private Limited27 IDBI Asset Management Limited28 AIG Global Asset Management Company India Private Limited
Contd...

42
No. Name of Asset Management Company
29 Baroda Pioneer Asset Management Company Limited 30 HSBC Asset Management Company India Private Limited 31 Pramerica Asset Managers Private Limited 32 Sahara Asset Management Company Private Limited
Table 4-8: NSE CM transaction charges*
Total Traded Value in a month Transaction Charges
(` per lakh of Traded Value)
Up to First ` 1250 cores ` 3.25 each side
More than ` 1250 crores up to ` 2500 crores (on incremental volume)
` 3.20 each side
More than ` 2500 crores up to ` 5000 crores (on incremental volume)
` 3.15 each side
More than ` 5000 crores up to ` 10000 crores (on incremental volume)
` 3.10 each side
More than ` 10000 crores up to ` 15000 crores(on incremental volume)
` 3.05 each side
Exceeding ` 15000 crores (on incremental volume)
` 3.00 each side
* w.e.f. October 2009. This is not applicable for money market instruments, Gold ETF & Hangseng BeES.
Table 4-9: Securities Transaction Tax (STT) in CM Segment of NSE*
Sr.No Taxable securities transaction Rate (%) Payable by
1 Purchase of an equity share in a company or a unit of an equity oriented fund, where –(a) the transaction of such purchase is entered into in a
recognised stock exchange; and(b) the contract for the purchase of such share or unit is
settled by the actual delivery or transfer of such share or unit.
0.125 Purchaser.
2 Sale of an equity share in a company or a unit of an equity oriented fund, where –(a) the transaction of such sale is entered into in a
recognised stock exchange; and(b) the contract for the sale of such share or unit is
settled by the actual delivery or transfer of such share or unit.
0.125 Seller.
3 Sale of an equity share in a company or a unit of an equity oriented fund, where –(a) the transaction of such sale is entered into in a
recognised stock exchange; and(b) the contract for the sale of such share or unit is settled
otherwise than by the actual delivery or transfer of such share or unit.
0.025 Seller.
* w.e.f. June 1, 2006
Contd...

43
Table 4-10: Percentage Share of Top ‘N’ Securities/Member in Turnover
Year No. of Securities/Brokers
5 10 25 50 100
Securities
1994-95 (Nov.-Mar.) 48.77 55.92 68.98 81.14 91.07
1995-96 82.98 86.60 90.89 93.54 95.87
1996-97 84.55 91.96 95.70 97.03 98.19
1997-98 72.98 85.17 92.41 95.76 97.90
1998-99 52.56 67.11 84.71 92.03 95.98
1999-00 39.56 59.22 82.31 88.69 93.66
2000-01 52.15 72.90 88.93 94.57 97.46
2001-02 44.43 62.92 82.24 91.56 95.91
2002-03 40.58 55.41 77.8 89.16 95.38
2003-04 31.04 44.87 64.32 79.44 91.03
2004-05 25.88 41.65 57.98 72.40 84.26
2005-06 22.15 31.35 46.39 59.22 73.12
2006-07 16.97 25.25 43.46 61.94 77.22
2007-08 16.29 26.78 45.46 61.47 77.29
2008-09 20.48 32.58 56.36 74.66 87.69
2009-10 15.43 26.15 46.80 64.24 78.20
2010-11 15.25 23.03 38.73 53.58 68.93
Members
1994-95 (Nov.-Mar.) 18.19 26.60 44.37 61.71 81.12
1995-96 10.65 16.56 28.61 41.93 58.59
1996-97 5.94 10.08 19.67 30.57 45.95
1997-98 6.29 10.59 18.81 29.21 44.24
1998-99 7.73 11.96 20.77 31.66 47.02
1999-00 7.86 12.99 22.78 34.41 49.96
2000-01 7.78 12.76 23.00 33.86 48.79
2001-02 7.14 12.29 23.63 36.32 53.40
2002-03 10.26 16.41 29.07 42.49 59.15
2003-04 11.58 17.36 30.34 44.05 61.37
2004-05 13.52 20.20 34.97 49.01 65.09
2005-06 14.62 22.57 38.17 52.57 38.45
2006-07 14.72 24.27 42.61 56.71 71.22
2007-08 14.57 25.71 44.70 60.11 73.90
2008-09 13.56 23.62 43.55 61.21 75.42
2009-10 14.63 23.48 41.00 57.01 72.71
2010-11 14.35 23.83 42.85 58.61 73.04

44
Table 4-11: ‘50’ Most Active Securities during 2010-11 in Terms of Trading Value
Rank Name of Security Trading Value % Share
in Total Trading Value
Market Capitalisation as on March 31,2011
% Share in Total Market Capital-isation
(` cr.) (US $ mn.) (` cr.) (US $ mn.)
1 STATE BANK OF INDIA 41,331 9,271.16 1.16 40,039.30 8,981 0.60
2 RELIANCE INDUSTRIES LTD. 40,067 8,987.66 1.12 20,444.23 4,586 0.31
3 ICICI BANK LTD. 38,790 8,701.30 1.08 231,715.39 51,977 3.46
4 TATA STEEL LIMITED 37,636 8,442.35 1.05 10,732.13 2,407 0.16
5 TATA MOTORS LIMITED 36,530 8,194.25 1.02 218,862.03 49,094 3.27
6 INFOSYS TECHNOLOGIES LTD. 33,921 7,609.13 0.95 18,450.66 4,139 0.28
7 LARSEN & TOUBRO LTD. 33,866 7,596.66 0.95 100,970.84 22,649 1.51
8 AXIS BANK LIMITED 32,438 7,276.32 0.91 249,221.43 55,904 3.72
9 HDFC LTD. 32,423 7,272.90 0.91 58,390.43 13,098 0.87
10 UNITECH LTD. 31,057 6,966.62 0.87 42,997.30 9,645 0.64
11 DLF LIMITED 30,597 6,863.30 0.86 14,324.08 3,213 0.21
12 BHARTI AIRTEL LIMITED 30,434 6,826.87 0.85 7,337.27 1,646 0.11
13 HDFC BANK LTD. 30,176 6,768.90 0.84 19,733.30 4,426 0.29
14 SESA GOA LTD. 28,229 6,332.32 0.79 140,612.09 31,542 2.10
15 HINDALCO INDUSTRIES LTD. 27,953 6,270.28 0.78 2,681.71 602 0.04
16 JSW STEEL LIMITED 26,754 6,001.33 0.75 3,881.02 871 0.06
17 TATA CONSULTANCY SERV LTD. 25,799 5,787.17 0.72 22,586.25 5,066 0.34
18 LIC HOUSING FINANCE LTD. 25,460 5,711.12 0.71 22,219.25 4,984 0.33
19 COAL INDIA LTD. 24,953 5,597.28 0.70 65,146.58 14,613 0.97
20 RELIANCE INFRASTRUCTU LTD. 24,544 5,505.64 0.69 31,739.33 7,120 0.47
21 BHEL 22,615 5,072.99 0.63 7,927.05 1,778 0.12
22 OIL AND NATURAL GAS CORP. 21,451 4,811.86 0.60 66,735.16 14,970 1.00
23 STERLITE INDS (IND) LTD. 19,164 4,298.89 0.54 4,997.86 1,121 0.07
24 MAHINDRA & MAHINDRA LTD. 18,792 6966.62 0.87 42997.30 9,645 0.64
25 RELIANCE CAPITAL LTD. 18,329 6863.30 0.86 14324.08 3,213 0.21
26 HOUSING DEV & INFRA LTD. 18,021 6826.87 0.85 7337.27 1,646 0.11
27 JAIPRAKASH ASSOCIATES LTD. 17,729 6768.90 0.84 19733.30 4,426 0.29
28 ITC LTD. 17,269 6332.32 0.79 140612.09 31,542 2.10
29 ABAN OFFSHORE LTD. 17,179 6270.28 0.78 2681.71 602 0.04
30 IFCI LTD. 17,142 6001.33 0.75 3881.02 871 0.06
31 INFRA. DEV. FIN. CO. LTD. 17,139 5787.17 0.72 22586.25 5,066 0.34
32 RELIANCE COMMUNICATIONS LTD. 16,950 5711.12 0.71 22219.25 4,984 0.33
33 JINDAL STEEL & POWER LTD. 16,799 5597.28 0.70 65146.58 14,613 0.97
34 HERO HONDA MOTORS LTD. 16,388 5505.64 0.69 31739.33 7,120 0.47
35 SUZLON ENERGY LIMITED 16,335 5072.99 0.63 7927.05 1,778 0.12
36 CAIRN INDIA LIMITED 16,228 4811.86 0.60 66735.16 14,970 1.00
37 INDIABULLS REAL EST. LTD. 19164 4298.89 0.54 4997.86 1,121 0.07
Contd...

45
Rank Name of Security Trading Value % Share
in Total Trading Value
Market Capitalisation as on March 31,2011
% Share in Total Market Capital-isation
(` cr.) (US $ mn.) (` cr.) (US $ mn.)
38 ORCHID CHEM & PHARMA LTD. 18,792 4,215.33 0.53 2,118.19 475 0.03
39 HINDUSTAN PETROLEUM CORP LTD. 18,329 4,111.53 0.51 12,073.75 2,708 0.18
40 BHARAT PETROLEUM CORP LTD. 18,021 4,042.43 0.50 22,120.95 4,962 0.33
41 BAJAJ AUTO LIMITED 17,729 3,976.94 0.50 42,341.63 9,498 0.63
42 MARUTI SUZUKI INDIA LTD. 17,269 3,873.77 0.48 36,464.78 8,180 0.54
43 EDUCOMP SOLUTIONS LTD. 17,179 3,853.59 0.48 4,007.13 899 0.06
44 TITAN INDUSTRIES LTD. 17,142 3,845.18 0.48 16,919.06 3,795 0.25
45 YES BANK LIMITED 17,139 3,844.48 0.48 10,746.54 2,411 0.16
46 SHREE RENUKA SUGARS LTD. 16,950 3,802.20 0.47 4,671.87 1,048 0.07
47 SATYAM COMPUTER SERVICES 16,799 3,768.27 0.47 7,729.60 1,734 0.12
48 STEEL AUTHORITY OF INDIA 16,388 3,676.15 0.46 70,051.59 15,714 1.05
49 GAIL (INDIA) LTD. 16,335 3,664.14 0.46 58,857.35 13,203 0.88
50 IDBI BANK LIMITED 16,228 3,640.17 0.45 14,024.46 3,146 0.21
Total 1,917,543 430,135.37 53.60 3,252,820 729,659 48.53
Table 4-12: Top ‘50’ Companies by Market Capitalisation as on March 31, 2011
Rank Name of Security Market Capitalisation % Share in Total Market
Capitali-sation
Trading Volume During 2010-11
% Share
in Total Trading Volume
(` cr.) (US $ mn.)
(` cr.) (US $ mn.)
1 RELIANCE INDUSTRIES LTD. 345,122.59 77,416 5.15 122,877.73 27,563 3.43
2 OIL AND NATURAL GAS CORP. 249,221.43 55,904 3.72 32,437.82 7,276 0.91
3 TATA CONSULTANCY SERV LTD. 231,715.39 51,977 3.46 38,725.02 8,687 1.08
4 COAL INDIA LTD. 218,862.03 49,094 3.27 36,529.98 8,194 1.02
5 INFOSYS TECHNOLOGIES LTD. 186,092.66 41,744 2.78 73,216.75 16,424 2.05
6 STATE BANK OF INDIA 175,596.27 39,389 2.62 131,616.70 29,524 3.68
7 NTPC LTD. 159,219.92 35,716 2.38 11,913.71 2,672 0.33
8 ITC LTD. 140,612.09 31,542 2.10 28,229.49 6,332 0.79
9 BHARTI AIRTEL LIMITED 135,723.73 30,445 2.02 43,888.50 9,845 1.23
10 ICICI BANK LTD. 128,520.68 28,829 1.92 101,769.77 22,829 2.84
11 WIPRO LTD. 117,832.15 26,432 1.76 16,049.13 3,600 0.45
12 NMDC LTD. 112,796.17 25,302 1.68 3,619.03 812 0.10
13 HDFC BANK LTD. 109,021.69 24,455 1.63 42,904.61 9,624 1.20
14 HDFC LTD. 102,750.82 23,049 1.53 48,585.02 10,898 1.36
15 BHEL 100,970.84 22,649 1.51 33,865.92 7,597 0.95
16 LARSEN & TOUBRO LTD. 100,576.28 22,561 1.50 58,363.22 13,092 1.63
Contd...
Contd...

46
Rank Name of Security Market Capitalisation % Share in Total Market
Capitali-sation
Trading Volume During 2010-11
% Share
in Total Trading Volume
(` cr.) (US $ mn.)
(` cr.) (US $ mn.)
17 MMTC LIMITED 93,215.00 20,910 1.39 1,152.64 259 0.03
18 INDIAN OIL CORP LTD. 80,814.40 18,128 1.21 10,959.11 2,458 0.31
19 ADANI ENTERPRISES LIMITED 77,014.22 17,276 1.15 12,807.43 2,873 0.36
20 STEEL AUTHORITY OF INDIA 70,051.59 15,714 1.05 16,388.29 3,676 0.46
21 TATA MOTORS LIMITED 67,070.07 15,045 1.00 93,796.69 21,040 2.62
22 CAIRN INDIA LIMITED 66,735.16 14,970 1.00 21,451.28 4,812 0.60
23 JINDAL STEEL & POWER LTD. 65,146.58 14,613 0.97 24,952.68 5,597 0.70
24 HINDUSTAN UNILEVER LTD. 62,368.51 13,990 0.93 14,848.24 3,331 0.42
25 TATA STEEL LIMITED 59,697.98 13,391 0.89 95,333.49 21,385 2.66
26 GAIL (INDIA) LTD. 58,857.35 13,203 0.88 16,334.73 3,664 0.46
27 STERLITE INDS (IND) LTD. 58,390.43 13,098 0.87 32,422.59 7,273 0.91
28 HINDUSTAN ZINC LIMITED 58,224.90 13,061 0.87 4,345.09 975 0.12
29 AXIS BANK LIMITED 57,570.27 12,914 0.86 50,873.29 11,412 1.42
30 POWER GRID CORP. LTD. 47,176.90 10,583 0.70 13,129.92 2,945 0.37
31 SUN PHARMACEUTICALS IND. 45,824.50 10,279 0.68 9,583.07 2,150 0.27
32 DLF LIMITED 45,587.63 10,226 0.68 44,499.81 9,982 1.24
33 MAHINDRA & MAHINDRA LTD. 42,997.30 9,645 0.64 31,057.19 6,967 0.87
34 BAJAJ AUTO LIMITED 42,341.63 9,498 0.63 17,705.20 3,972 0.49
35 HINDALCO INDUSTRIES LTD. 40,039.30 8,981 0.60 41,330.84 9,271 1.16
36 PUNJAB NATIONAL BANK 38,236.73 8,577 0.57 8,826.25 1,980 0.25
37 RELIANCE POWER LTD. 36,578.28 8,205 0.55 12,933.15 2,901 0.36
38 MARUTI SUZUKI INDIA LTD. 36,464.78 8,180 0.54 16,794.64 3,767 0.47
39 NESTLE INDIA LIMITED 35,640.55 7,995 0.53 2,455.07 551 0.07
40 BANK OF BARODA 35,146.25 7,884 0.52 9,180.49 2,059 0.26
41 KOTAK MAHINDRA BANK LTD. 33,718.16 7,564 0.50 15,241.80 3,419 0.43
42 HCL TECHNOLOGIES LTD. 32,730.65 7,342 0.49 10,188.19 2,285 0.28
43 HERO HONDA MOTORS LTD. 31,739.33 7,120 0.47 24,544.14 5,506 0.69
44 TATA POWER CO LTD. 31,684.08 7,107 0.47 9,875.05 2,215 0.28
45 OIL INDIA LTD. 31,553.63 7,078 0.47 3,633.42 815 0.10
46 NHPC LTD. 31,120.88 6,981 0.46 4,829.27 1,083 0.13
47 ULTRATECH CEMENT LIMITED 31,007.14 6,955 0.46 5,246.32 1,177 0.15
48 SIEMENS LTD. 29,705.50 6,663 0.44 8,296.59 1,861 0.23
49 POWER FIN CORP LTD. 28,688.43 6,435 0.43 3,803.94 853 0.11
50 CANARA BANK 27,742.88 6,223 0.41 13,850.65 3,107 0.39
Total 4,245,516 952,336 63.34 1,527,262.95 342,589 42.69
Contd...
47
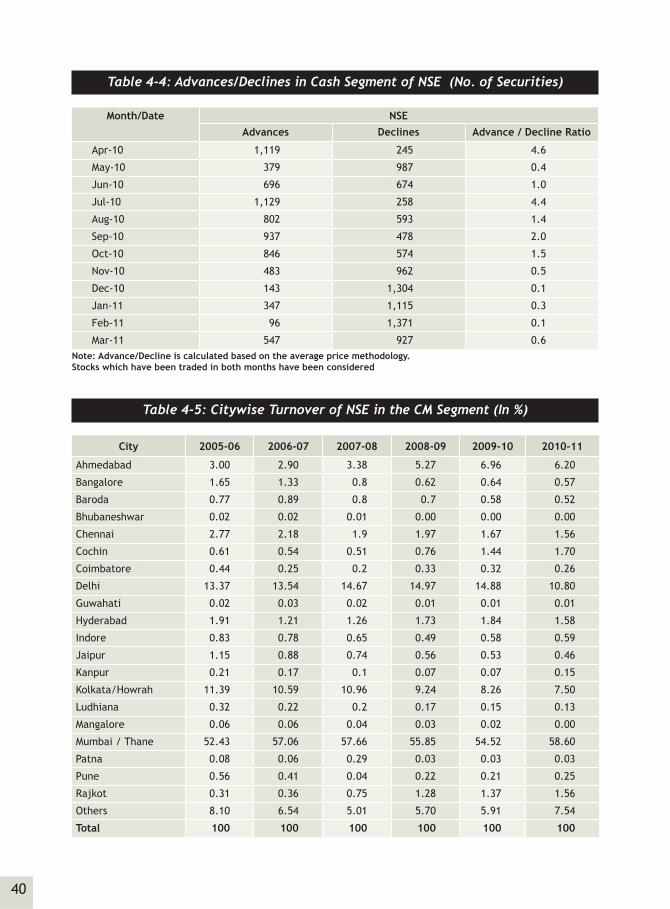
Table 4-13: NSE’s 10 Most Active Trading days during the year 2010-2011
Sr No. Date Highest Single Day Trading Value
(` cr.) (US $ mn.)
1 4-Nov-2010 29,851.40 6,696.14
2 28-Oct-2010 24,832.06 5,570.22
3 25-Nov-2010 24,742.13 5,550.05
4 26-Nov-2010 22,743.62 5,101.75
5 6-Oct-2010 20,541.57 4,607.80
6 30-Nov-2010 20,249.95 4,542.38
7 7-Oct-2010 20,082.60 4,504.85
8 30-Sep-2010 20,014.26 4,489.52
9 18-Nov-2010 19,688.64 4,416.47
10 13-Oct-2010 19,537.94 4,382.67
Table 4-14: Individual Securities Single day Trading Records-2010-11
Rank Symbol Name of Company Date Traded Value
(` cr.) (US $ mn.)
1 COALINDIA COAL INDIA LTD. 4-Nov-10 15,700.40 3,521.85
2 MOIL MOIL LIMITED 15-Dec-10 3,354.22 752.40
3 LICHSGFIN LIC HOUSING FINANCE LTD. 25-Nov-10 3,085.95 692.23
4 RELIANCE RELIANCE INDUSTRIES LTD. 22-Feb-11 2,023.68 453.94
5 INFOSYSTCH INFOSYS TECHNOLOGIES LTD. 13-Apr-10 1,964.46 440.66
6 SBIN STATE BANK OF INDIA 12-Aug-10 1,743.20 391.03
7 COALINDIA COAL INDIA LTD. 19-Nov-10 1,736.72 389.57
8 RELIANCE RELIANCE INDUSTRIES LTD. 7-May-10 1,700.73 381.50
9 TATAMOTORS TATA MOTORS LIMITED 11-Aug-10 1,646.86 369.42
10 POWERGRID POWER GRID CORP. LTD. 25-Nov-10 1,604.33 359.88

48
Table 4-15: Composition of S&P CNX Nifty Index as on March 31, 2011
Sl. No.
Symbol Issued Capital (` cr.)
Free Float Market
Capitalisa-tion
(` cr.)
Weight-age
(Per-cent)
Beta R2 Daily Volatili-ty (Per-cent)
Monthly Return (Per-cent)
Impact Cost (Per-cent)
1 ACC 18.8 10,449 0.60 0.60 0.41 1.01 10.85 0.06
2 AMBUJACEM 306.0 12,122 0.69 0.90 0.47 2.39 25.07 0.08
3 AXISBANK 410.1 36,070 2.05 1.32 0.74 2.09 15.21 0.06
4 BAJAJ-AUTO 289.4 19,790 1.13 0.68 0.45 1.59 15.29 0.06
5 BHEL 489.5 32,592 1.86 0.82 0.63 2.00 3.08 0.05
6 BPCL 361.5 7,906 0.45 0.63 0.32 2.26 10.55 0.07
7 BHARTIARTL 1,898.8 43,164 2.46 0.75 0.41 1.77 7.88 0.07
8 CAIRN 1,901.6 15,240 0.87 0.80 0.53 1.20 3.46 0.05
9 CIPLA 160.6 16,322 0.93 0.47 0.34 1.74 7.34 0.07
10 DLF 339.5 9,741 0.55 1.50 0.71 2.32 26.76 0.07
11 DRREDDY 84.6 20,622 1.17 0.51 0.37 1.76 6.02 0.08
12 GAIL 1,268.5 20,842 1.19 0.59 0.44 1.77 8.78 0.06
13 GRASIM 91.7 15,603 0.89 0.49 0.28 0.88 8.95 0.06
14 HCLTECH 137.0 11,518 0.66 0.95 0.57 1.89 8.02 0.08
15 HDFCBANK 464.7 83,513 4.76 1.00 0.72 1.48 14.31 0.05
16 HEROHONDA 39.9 15,168 0.86 0.50 0.26 1.37 8.48 0.05
17 HINDALCO 191.4 26,876 1.53 1.57 0.72 2.08 3.87 0.06
18 HINDUNILVR 217.2 29,925 1.70 0.53 0.41 1.24 1.81 0.05
19 HDFC 293.1 91,043 5.19 1.13 0.70 1.84 11.44 0.07
20 ITC 772.2 96,580 5.50 0.74 0.54 1.21 7.75 0.06
21 ICICIBANK 1,151.4 128,521 7.32 1.50 0.80 1.91 14.97 0.06
22 INFOSYSTCH 287.1 156,245 8.90 0.79 0.63 1.77 8.15 0.05
23 IDFC 1,460.9 16,430 0.94 1.35 0.69 2.06 6.47 0.07
24 JPASSOCIAT 425.3 10,663 0.61 1.68 0.70 2.60 20.21 0.07
25 JINDALSTEL 93.4 27,085 1.54 1.07 0.69 1.24 6.01 0.07
26 KOTAKBANK 368.2 16,173 0.92 1.15 0.66 1.41 13.04 0.08
27 LT 121.8 88,264 5.03 1.10 0.71 2.00 8.11 0.06
28 M&M 307.0 33,210 1.89 1.14 0.62 2.40 13.74 0.06
29 MARUTI 144.5 16,697 0.95 0.78 0.50 2.57 4.47 0.06
30 NTPC 8,245.5 24,680 1.41 0.66 0.56 1.95 13.69 0.07
31 ONGC 4,277.7 39,296 2.24 0.66 0.45 1.52 7.75 0.07
32 POWERGRID 4,629.7 14,426 0.82 0.47 0.42 0.61 2.98 0.05
33 PNB 315.3 16,136 0.92 0.85 0.61 1.32 14.19 0.08
34 RANBAXY 210.6 6,791 0.39 0.87 0.54 2.11 2.52 0.06
35 RELCAPITAL 245.6 6,569 0.37 1.30 0.60 2.53 22.65 0.07
36 RCOM 1,032.0 7,140 0.41 1.21 0.47 3.04 25.54 0.08
37 RELIANCE 3,289.7 177,723 10.12 1.01 0.71 1.42 8.80 0.06
38 RELINFRA 267.4 9,645 0.55 1.25 0.50 2.24 13.14 0.07
Contd...

49
Sl. No.
Symbol Issued Capital (` cr.)
Free Float Market
Capitalisa-tion
(` cr.)
Weight-age
(Per-cent)
Beta R2 Daily Volatili-ty (Per-cent)
Monthly Return (Per-cent)
Impact Cost (Per-cent)
39 RPOWER 2,805.1 7,161 0.41 1.05 0.51 2.39 18.17 0.08
40 SESAGOA 86.0 11,088 0.63 1.29 0.56 2.02 11.54 0.06
41 SIEMENS 67.4 13,314 0.76 0.54 0.35 0.36 3.98 0.04
42 SBIN 635.0 71,287 4.06 1.15 0.67 1.76 5.13 0.04
43 SAIL 4,130.4 9,934 0.57 1.20 0.65 1.74 11.18 0.06
44 STER 336.2 24,688 1.41 1.50 0.68 1.74 5.88 0.07
45 SUNPHARMA 103.6 16,627 0.95 0.57 0.39 2.06 4.49 0.07
46 TCS 195.7 60,122 3.42 0.86 0.56 1.71 6.63 0.06
47 TATAMOTORS 537.3 43,641 2.49 1.47 0.68 2.15 15.29 0.06
48 TATAPOWER 237.3 21,606 1.23 0.62 0.52 1.64 16.08 0.07
49 TATASTEEL 959.4 40,914 2.33 1.32 0.72 1.77 2.49 0.04
50 WIPRO 490.8 24,303 1.38 0.80 0.54 1.34 9.58 0.07* Beta & R2 are calculated for the period 01-Apr-2010 to 31-Mar-2011* Beta measures the degree to which any portfolio of stocks is affected as compared to the effect on the market as a
whole.* The coefficient of determination (R2) measures the strength of relationship between two variables the return on a security
versus that of the market.* Volatility is the Std. deviation of the daily returns for the period 01-Mar-2011 to 31-Mar-2011* Last day of trading was 31-Mar-2011* Impact Cost for S&P CNX Nifty is for a portfolio of ` 50 Lakhs * Impact Cost for S&P CNX Nifty is the weightage average impact cost
Table 4-16: Composition of CNX Nifty Junior Index as on March 31, 2011
Sl. No.
Symbol Issued Capital (` cr.)
Free Float Market
Capitalisa-tion
(` cr.)
Weight-age
(Percent)
Beta R2 Daily Volatili-ty (Per-cent)
Monthly Return (Per-cent)
Impact Cost (Per-cent)
1 ADANIENT 115.5 16,700 5.28 0.98 0.50 1.53 9.07 0.092 ABIRLANUVO 113.5 4,525 1.43 0.96 0.59 1.14 5.21 0.113 ANDHRABANK 485.0 3,540 1.12 1.10 0.60 1.88 11.02 0.084 ASHOKLEY 133.0 3,707 1.17 1.27 0.60 3.25 21.60 0.105 ASIANPAINT 95.9 11,548 3.65 0.50 0.38 1.41 5.21 0.096 BANKBARODA 364.3 16,235 5.13 0.84 0.57 1.26 10.81 0.097 BANKINDIA 525.2 8,870 2.80 1.25 0.63 1.94 8.14 0.088 BEL 80.0 3,251 1.03 0.46 0.38 1.06 1.44 0.119 BHARATFORG 46.6 4,685 1.48 1.13 0.67 2.68 13.44 0.1110 BIOCON 100.0 2,418 0.76 1.02 0.58 1.75 10.86 0.0911 CANBK 443.0 8,955 2.83 1.21 0.62 1.79 1.97 0.0612 COLPAL 13.6 5,425 1.71 0.46 0.36 0.97 -0.88 0.1013 CONCOR 130.0 5,758 1.82 0.55 0.38 2.15 7.94 0.1514 CROMPGREAV 128.3 10,336 3.27 0.82 0.48 1.52 11.46 0.1015 CUMMINSIND 39.6 6,771 2.14 0.53 0.37 1.40 7.27 0.10
Contd...
Contd...

50
Sl. No.
Symbol Issued Capital (` cr.)
Free Float Market
Capitalisa-tion
(` cr.)
Weight-age
(Percent)
Beta R2 Daily Volatili-ty (Per-cent)
Monthly Return (Per-cent)
Impact Cost (Per-cent)
16 EXIDEIND 85.0 6,585 2.08 0.66 0.36 2.05 4.90 0.0917 FEDERALBNK 171.2 7,166 2.26 1.10 0.60 1.93 20.03 0.1118 GMRINFRA 389.2 4,614 1.46 1.34 0.63 1.51 -1.34 0.1119 GLAXO 84.7 8,620 2.72 0.40 0.33 1.44 -6.59 0.0920 GLENMARK 27.0 3,962 1.25 0.76 0.38 3.61 12.89 0.1021 HINDPETRO 338.6 5,903 1.86 0.67 0.34 1.90 11.32 0.0722 HDIL 415.0 4,267 1.35 1.91 0.72 2.63 12.08 0.0723 IDBI 984.5 4,889 1.54 1.44 0.75 1.86 8.12 0.0624 IFCI 737.8 3,555 1.12 1.59 0.70 2.33 5.20 0.0725 IBREALEST 80.4 3,847 1.22 1.92 0.74 2.47 19.59 0.0926 INDHOTEL 75.9 4,237 1.34 0.97 0.57 1.51 7.07 0.1127 IOB 544.8 3,037 0.96 1.31 0.66 1.59 7.92 0.0928 INDUSINDBK 465.7 9,137 2.89 1.12 0.52 2.19 20.28 0.0829 JSWSTEEL 223.1 9,712 3.07 1.73 0.73 2.65 5.29 0.0630 LICHSGFIN 94.9 6,811 2.15 1.58 0.63 2.49 20.23 0.0631 LUPIN 89.2 9,850 3.11 0.80 0.51 1.85 9.30 0.0832 MPHASIS 209.9 3,041 0.96 0.57 0.25 2.80 -3.77 0.0833 MUNDRAPORT 400.7 6,161 1.95 1.02 0.53 1.52 -0.98 0.1134 OFSS 41.9 3,261 1.03 0.51 0.41 1.09 -3.00 0.1335 PATNI 26.3 2,314 0.73 0.39 0.21 0.50 6.24 0.0436 PFC 1,147.8 2,932 0.93 1.08 0.60 2.36 0.71 0.0837 PUNJLLOYD 66.4 1,349 0.43 1.61 0.66 2.36 7.84 0.0938 RECLTD 987.5 8,318 2.63 1.28 0.60 2.78 7.66 0.0939 SRTRANSFIN 226.2 10,570 3.34 0.68 0.35 2.14 6.73 0.0940 SYNDIBANK 522.0 2,147 0.68 1.37 0.68 1.38 7.30 0.0741 TATACHEM 254.8 5,988 1.89 0.95 0.55 1.52 6.38 0.0942 TECHM 125.9 2,320 0.73 1.10 0.56 2.90 4.79 0.0843 TITAN 44.4 7,882 2.49 1.03 0.56 1.89 14.53 0.0644 TORNTPOWER 472.4 4,243 1.34 0.56 0.34 2.26 8.93 0.1945 ULTRACEMCO 274.0 11,053 3.49 0.57 0.38 1.37 21.56 0.1146 UNIONBANK 505.1 7,817 2.47 1.14 0.66 1.59 10.59 0.0947 UNIPHOS 92.4 5,069 1.60 1.22 0.57 2.29 9.85 0.0948 MCDOWELL-N 130.8 8,858 2.80 1.25 0.61 1.44 -7.43 0.1049 YESBANK 347.1 7,371 2.33 1.42 0.69 2.39 20.94 0.0750 ZEEL 97.8 6,916 2.19 0.80 0.46 1.38 4.08 0.09
* Beta & R2 are calculated for the period 01-Apr-2010 to 31-Mar-2011* Beta measures the degree to which any portfolio of stocks is affected as compared to the effect on the market as a
whole.* The coefficient of determination (R2) measures the strength of relationship between two variables the return on a security
versus that of the market.* Volatility is the Std. deviation of the daily returns for the period 01-Mar-2011 to 31-Mar-2011* Last day of trading was 31-Mar-2011* Impact Cost for CNX Nifty Junior is for a portfolio of ` 25 Lakhs * Impact Cost for CNX Nifty Junior is the weightage average impact cost
Contd...
51
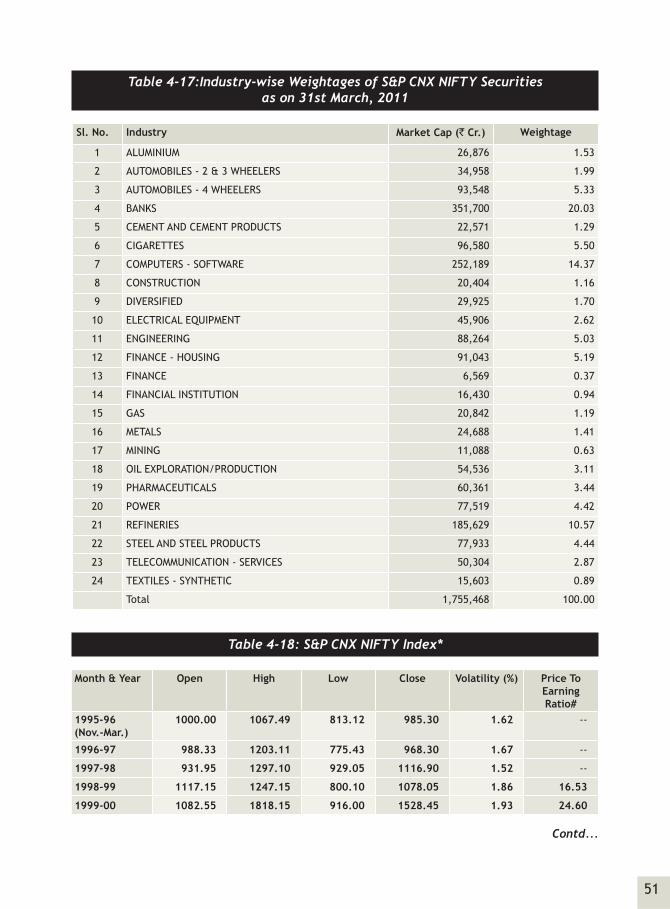
Table 4-17:Industry-wise Weightages of S&P CNX NIFTY Securities as on 31st March, 2011
Sl. No. Industry Market Cap (` Cr.) Weightage
1 ALUMINIUM 26,876 1.53
2 AUTOMOBILES - 2 & 3 WHEELERS 34,958 1.99
3 AUTOMOBILES - 4 WHEELERS 93,548 5.33
4 BANKS 351,700 20.03
5 CEMENT AND CEMENT PRODUCTS 22,571 1.29
6 CIGARETTES 96,580 5.50
7 COMPUTERS - SOFTWARE 252,189 14.37
8 CONSTRUCTION 20,404 1.16
9 DIVERSIFIED 29,925 1.70
10 ELECTRICAL EQUIPMENT 45,906 2.62
11 ENGINEERING 88,264 5.03
12 FINANCE - HOUSING 91,043 5.19
13 FINANCE 6,569 0.37
14 FINANCIAL INSTITUTION 16,430 0.94
15 GAS 20,842 1.19
16 METALS 24,688 1.41
17 MINING 11,088 0.63
18 OIL EXPLORATION/PRODUCTION 54,536 3.11
19 PHARMACEUTICALS 60,361 3.44
20 POWER 77,519 4.42
21 REFINERIES 185,629 10.57
22 STEEL AND STEEL PRODUCTS 77,933 4.44
23 TELECOMMUNICATION - SERVICES 50,304 2.87
24 TEXTILES - SYNTHETIC 15,603 0.89
Total 1,755,468 100.00
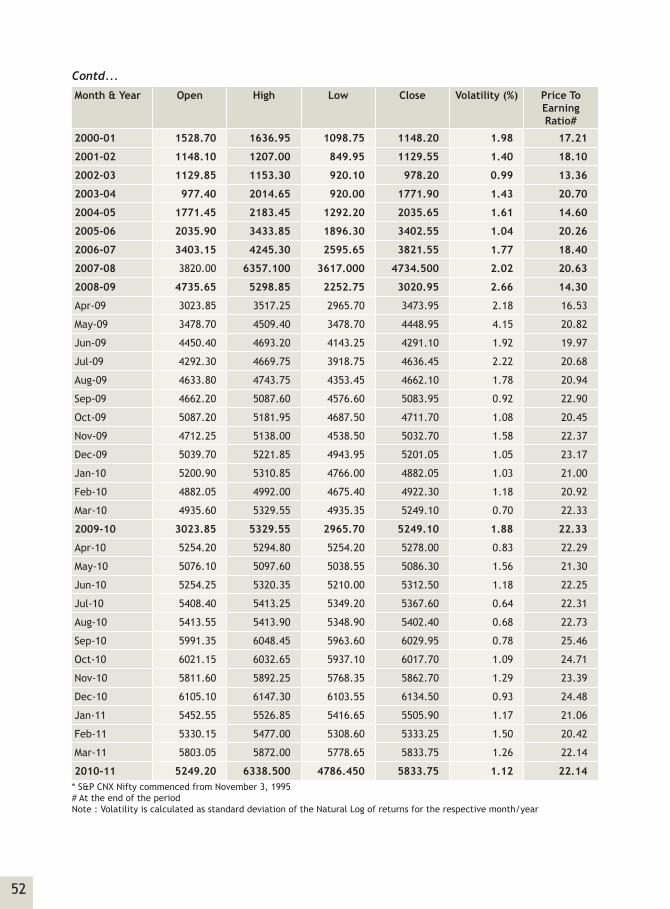
Table 4-18: S&P CNX NIFTY Index*
Month & Year Open High Low Close Volatility (%) Price To Earning Ratio#
1995-96 (Nov.-Mar.)
1000.00 1067.49 813.12 985.30 1.62 --
1996-97 988.33 1203.11 775.43 968.30 1.67 --
1997-98 931.95 1297.10 929.05 1116.90 1.52 --
1998-99 1117.15 1247.15 800.10 1078.05 1.86 16.53
1999-00 1082.55 1818.15 916.00 1528.45 1.93 24.60
Contd...
52
Month & Year Open High Low Close Volatility (%) Price To Earning Ratio#
2000-01 1528.70 1636.95 1098.75 1148.20 1.98 17.21
2001-02 1148.10 1207.00 849.95 1129.55 1.40 18.10
2002-03 1129.85 1153.30 920.10 978.20 0.99 13.36
2003-04 977.40 2014.65 920.00 1771.90 1.43 20.70
2004-05 1771.45 2183.45 1292.20 2035.65 1.61 14.60
2005-06 2035.90 3433.85 1896.30 3402.55 1.04 20.26
2006-07 3403.15 4245.30 2595.65 3821.55 1.77 18.40
2007-08 3820.00 6357.100 3617.000 4734.500 2.02 20.63
2008-09 4735.65 5298.85 2252.75 3020.95 2.66 14.30
Apr-09 3023.85 3517.25 2965.70 3473.95 2.18 16.53
May-09 3478.70 4509.40 3478.70 4448.95 4.15 20.82
Jun-09 4450.40 4693.20 4143.25 4291.10 1.92 19.97
Jul-09 4292.30 4669.75 3918.75 4636.45 2.22 20.68
Aug-09 4633.80 4743.75 4353.45 4662.10 1.78 20.94
Sep-09 4662.20 5087.60 4576.60 5083.95 0.92 22.90
Oct-09 5087.20 5181.95 4687.50 4711.70 1.08 20.45
Nov-09 4712.25 5138.00 4538.50 5032.70 1.58 22.37
Dec-09 5039.70 5221.85 4943.95 5201.05 1.05 23.17
Jan-10 5200.90 5310.85 4766.00 4882.05 1.03 21.00
Feb-10 4882.05 4992.00 4675.40 4922.30 1.18 20.92
Mar-10 4935.60 5329.55 4935.35 5249.10 0.70 22.33
2009-10 3023.85 5329.55 2965.70 5249.10 1.88 22.33
Apr-10 5254.20 5294.80 5254.20 5278.00 0.83 22.29
May-10 5076.10 5097.60 5038.55 5086.30 1.56 21.30
Jun-10 5254.25 5320.35 5210.00 5312.50 1.18 22.25
Jul-10 5408.40 5413.25 5349.20 5367.60 0.64 22.31
Aug-10 5413.55 5413.90 5348.90 5402.40 0.68 22.73
Sep-10 5991.35 6048.45 5963.60 6029.95 0.78 25.46
Oct-10 6021.15 6032.65 5937.10 6017.70 1.09 24.71
Nov-10 5811.60 5892.25 5768.35 5862.70 1.29 23.39
Dec-10 6105.10 6147.30 6103.55 6134.50 0.93 24.48
Jan-11 5452.55 5526.85 5416.65 5505.90 1.17 21.06
Feb-11 5330.15 5477.00 5308.60 5333.25 1.50 20.42
Mar-11 5803.05 5872.00 5778.65 5833.75 1.26 22.14
2010-11 5249.20 6338.500 4786.450 5833.75 1.12 22.14* S&P CNX Nifty commenced from November 3, 1995# At the end of the periodNote : Volatility is calculated as standard deviation of the Natural Log of returns for the respective month/year
Contd...

53
Table 4-19: CNX NIFTY Junior Index*
Month & Year Open High Low Close Volatility (%)
Price To Earning Ratio#
1996-97 (Nov.-Mar.)
1000.00 1208.87 907.02 1032.95 1.76 --
1997-98 1028.30 1395.25 1016.65 1339.40 1.44 --
1998-99 1339.75 2079.10 1177.20 2069.20 2.14 18.92
1999-2000 2099.75 5365.90 1631.90 3695.75 2.46 33.47
2000-01 3720.45 3771.80 1570.20 1601.80 2.75 9.69
2001-02 1601.40 1676.25 1038.75 1566.95 1.60 6.80
2002-03 1568.40 1690.35 1231.95 1259.55 1.23 11.68
2003-04 1260.75 3702.60 1259.75 3392.05 1.57 11.93
2004-05 3398.00 4705.25 2493.70 4275.15 1.83 13.82
2005-06 4275.35 6437.40 3998.80 6412.10 0.95 20.25
2006-07 6415.25 7566.65 4463.75 6878.05 2.05 18.48
2007-08 6675.85 13209.35 6559.55 7975.75 2.41 16.69
2008-09 7982.75 9541.00 3587.60 4336.45 2.80 8.69
Apr-09 4343.20 5466.40 4297.45 5281.80 2.55 10.46
May-09 5380.05 7544.45 5380.05 7474.30 3.51 15.02
Jun-09 7581.80 8169.25 7326.80 7794.70 2.52 15.36
Jul-09 7791.90 8537.45 6931.70 8473.65 2.51 14.95
Aug-09 8475.45 8697.40 7971.60 8542.40 1.86 15.00
Sep-09 8580.40 9373.50 8360.50 9360.65 1.02 16.48
Oct-09 9380.35 10094.90 9044.70 9162.40 1.44 14.21
Nov-09 9144.65 10096.50 8865.50 9933.20 1.61 15.57
Dec-09 9952.80 10456.75 9952.80 10382.70 0.96 16.28
Jan-10 10372.40 10896.50 9646.60 9985.70 1.37 14.71
Feb-10 9954.45 10287.25 9712.25 10099.95 1.20 14.75
Mar-10 10137.45 10822.40 10137.45 10773.75 0.77 15.76
2009-10 4343.20 10896.50 4297.45 10773.75 1.97 15.76
Apr-10 10950.80 11103.15 10950.80 11082.10 0.75 15.52
May-10 10673.35 10833.10 10611.70 10821.75 1.58 16.59
Jun-10 11194.75 11318.60 11156.65 11304.45 0.93 17.24
Jul-10 11594.55 11662.20 11549.90 11564.25 0.40 18.20
Aug-10 11818.95 11828.10 11674.55 11797.60 0.68 18.26
Sep-10 12711.50 12714.50 12564.85 12585.30 0.79 19.96
Oct-10 13039.95 13103.65 12880.15 13030.00 0.93 19.88
Contd...
54
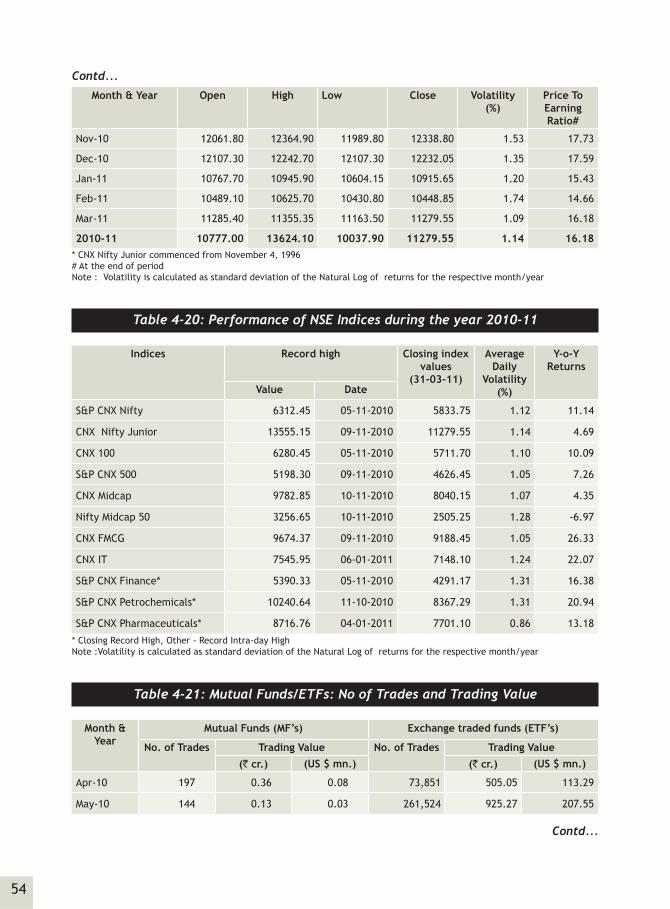
Month & Year Open High Low Close Volatility (%)
Price To Earning Ratio#
Nov-10 12061.80 12364.90 11989.80 12338.80 1.53 17.73
Dec-10 12107.30 12242.70 12107.30 12232.05 1.35 17.59
Jan-11 10767.70 10945.90 10604.15 10915.65 1.20 15.43
Feb-11 10489.10 10625.70 10430.80 10448.85 1.74 14.66
Mar-11 11285.40 11355.35 11163.50 11279.55 1.09 16.18
2010-11 10777.00 13624.10 10037.90 11279.55 1.14 16.18* CNX Nifty Junior commenced from November 4, 1996# At the end of periodNote : Volatility is calculated as standard deviation of the Natural Log of returns for the respective month/year
Table 4-20: Performance of NSE Indices during the year 2010-11
Indices Record high Closing index values
(31-03-11)
Average Daily
Volatility (%)
Y-o-Y Returns
Value Date
S&P CNX Nifty 6312.45 05-11-2010 5833.75 1.12 11.14
CNX Nifty Junior 13555.15 09-11-2010 11279.55 1.14 4.69
CNX 100 6280.45 05-11-2010 5711.70 1.10 10.09
S&P CNX 500 5198.30 09-11-2010 4626.45 1.05 7.26
CNX Midcap 9782.85 10-11-2010 8040.15 1.07 4.35
Nifty Midcap 50 3256.65 10-11-2010 2505.25 1.28 -6.97
CNX FMCG 9674.37 09-11-2010 9188.45 1.05 26.33
CNX IT 7545.95 06-01-2011 7148.10 1.24 22.07
S&P CNX Finance* 5390.33 05-11-2010 4291.17 1.31 16.38
S&P CNX Petrochemicals* 10240.64 11-10-2010 8367.29 1.31 20.94
S&P CNX Pharmaceuticals* 8716.76 04-01-2011 7701.10 0.86 13.18
* Closing Record High, Other - Record Intra-day HighNote :Volatility is calculated as standard deviation of the Natural Log of returns for the respective month/year
Table 4-21: Mutual Funds/ETFs: No of Trades and Trading Value
Month & Year
Mutual Funds (MF’s) Exchange traded funds (ETF’s)
No. of Trades Trading Value No. of Trades Trading Value(` cr.) (US $ mn.) (` cr.) (US $ mn.)
Apr-10 197 0.36 0.08 73,851 505.05 113.29
May-10 144 0.13 0.03 261,524 925.27 207.55
Contd...
Contd...

55
Month & Year
Mutual Funds (MF’s) Exchange traded funds (ETF’s)
No. of Trades Trading Value No. of Trades Trading Value(` cr.) (US $ mn.) (` cr.) (US $ mn.)
Jun-10 393 0.98 0.22 122,463 618.61 138.76
Jul-10 326 1.46 0.33 133,850 726.18 162.89
Aug-10 145 1.93 0.43 125,105 677.20 151.91
Sep-10 175 0.27 0.06 151,634 917.55 205.82
Oct-10 162 0.23 0.05 161,603 981.80 220.23
Nov-10 128 2.16 0.48 204,355 862.53 193.48
Dec-10 175 1.22 0.27 148,716 726.05 162.86
Jan-11 162 0.20 0.04 175,482 816.98 183.26
Feb-11 97 0.11 0.02 166,904 720.05 161.52
Mar-11 137 50.41 11.31 184,228 868.25 194.76
2010-11 2,241 59.44 13.33 1,909,715 9,345.52 2,096.35
Contd...
56
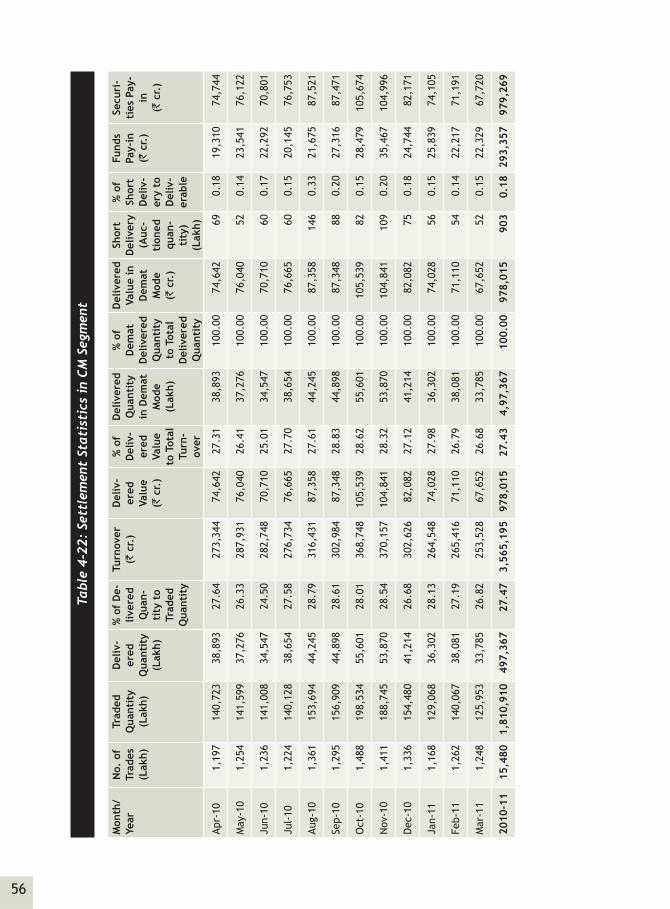
Tabl
e 4-
22:
Sett
lem
ent
Stat
isti
cs i
n CM
Seg
men
t
Mon
th/
Year
No.
of
Trad
es
(Lak
h)
Trad
ed
Qua
ntit
y (L
akh)
Del
iv-
ered
Q
uant
ity
(Lak
h)
% o
f D
e-liv
ered
Q
uan-
tity
to
Trad
ed
Qua
ntit
y
Turn
over
(`
cr.
)D
eliv
-er
ed
Valu
e(`
cr.
)
% o
f D
eliv
-er
ed
Valu
e to
Tot
al
Turn
-ov
er
Del
iver
ed
Qua
ntit
y in
Dem
at
Mod
e (L
akh)
% o
f D
emat
D
eliv
ered
Q
uant
ity
to T
otal
D
eliv
ered
Q
uant
ity
Del
iver
ed
Valu
e in
D
emat
M
ode
(` c
r.)
Shor
t D
eliv
ery
(Auc
-ti
oned
qu
an-
tity
) (L
akh)
% o
f Sh
ort
Del
iv-
ery
to
Del
iv-
erab
le
Fund
s Pa
y-in
(`
cr.
)
Secu
ri-
ties
Pay
-in
(`
cr.
)
Apr-
10 1
,197
1
40,7
23
38,
893
27.
64
273
,344
7
4,64
2 2
7.31
3
8,89
3 10
0.00
74,
642
69
0.18
19,
310
74,
744
May
-10
1,2
54
141
,599
3
7,27
6 2
6.33
2
87,9
31
76,
040
26.
41
37,
276
100.
00 7
6,04
0 5
2 0.
14 2
3,54
1 7
6,12
2
Jun-
10 1
,236
1
41,0
08
34,
547
24.
50
282
,748
7
0,71
0 2
5.01
3
4,54
7 10
0.00
70,
710
60
0.17
22,
292
70,
801
Jul-
10 1
,224
1
40,1
28
38,
654
27.
58
276
,734
7
6,66
5 2
7.70
3
8,65
4 10
0.00
76,
665
60
0.15
20,
145
76,
753
Aug-
10 1
,361
1
53,6
94
44,
245
28.
79
316
,431
8
7,35
8 2
7.61
4
4,24
5 10
0.00
87,
358
146
0.
33 2
1,67
5 8
7,52
1
Sep-
10 1
,295
1
56,9
09
44,
898
28.
61
302
,984
8
7,34
8 2
8.83
4
4,89
8 10
0.00
87,
348
88
0.20
27,
316
87,
471
Oct
-10
1,4
88
198
,534
5
5,60
1 2
8.01
3
68,7
48
105
,539
2
8.62
5
5,60
1 10
0.00
105
,539
8
2 0.
15 2
8,47
9 1
05,6
74
Nov
-10
1,4
11
188
,745
5
3,87
0 2
8.54
3
70,1
57
104
,841
2
8.32
5
3,87
0 10
0.00
104
,841
1
09
0.20
35,
467
104
,996
Dec
-10
1,3
36
154
,480
4
1,21
4 2
6.68
3
02,6
26
82,
082
27.
12
41,
214
100.
00 8
2,08
2 7
5 0.
18 2
4,74
4 8
2,17
1
Jan-
11 1
,168
1
29,0
68
36,
302
28.
13
264
,548
7
4,02
8 2
7.98
3
6,30
2 10
0.00
74,
028
56
0.15
25,
839
74,
105
Feb-
11 1
,262
1
40,0
67
38,
081
27.
19
265
,416
7
1,11
0 2
6.79
3
8,08
1 10
0.00
71,
110
54
0.14
22,
217
71,
191
Mar
-11
1,2
48
125
,953
3
3,78
5 2
6.82
2
53,5
28
67,
652
26.
68
33,
785
100.
00 6
7,65
2 5
2 0.
15 2
2,32
9 6
7,72
0
2010
-11
15,
480
1,8
10,9
10
497
,367
2
7.47
3
,565
,195
97
8,01
5 2
7.43
4,
97,3
6710
0.00
978
,015
9
03
0.18
293,
357
979
,269