
Capital Link Shipping Weekly Markets...
29
Monday, March 11, 2013 (Week 11) IN THE NEWS → Latest Company News → Select Dividend Paying Shipping Stocks UPCOMING EVENT CAPITAL MARKETS DATA → Currencies, Commodities & Indices → Shipping Equities - Weekly Review → Weekly Trading Statistics, by Knight Capital SHIPPING MARKETS → Weekly Market Report - by Cleartrade Exchange → Dry Bulk Market - Week Highlights, by Intermodal Shipbrokers → Weekly Tanker Market Opinion, by Poten & Partners → Dry Bulk Market - Week Highlights, by Intermodal Shipbrokers → Container Market - Weekly Highlights, by Braemar Seascope → Tanker Market - Weekly Highlights, by Charles R. Weber Company → S&P Secondhand, Newbuilding & Demolition Markets, by Golden Destiny TERMS OF USE & DISCLAIMER CONTENT CONTRIBUTORS Capital Link Shipping Weekly Markets Report
Transcript of Capital Link Shipping Weekly Markets...

Monday, March 11, 2013 (Week 11)
IN THE NEWS→ Latest Company News→ Select Dividend Paying Shipping Stocks
UPCOMING EVENT
CAPITAL MARKETS DATA→ Currencies, Commodities & Indices→ Shipping Equities - Weekly Review→ Weekly Trading Statistics, by Knight Capital
SHIPPING MARKETS→ Weekly Market Report - by Cleartrade Exchange → Dry Bulk Market - Week Highlights, by Intermodal Shipbrokers → Weekly Tanker Market Opinion, by Poten & Partners→ Dry Bulk Market - Week Highlights, by Intermodal Shipbrokers→ Container Market - Weekly Highlights, by Braemar Seascope→ Tanker Market - Weekly Highlights, by Charles R. Weber Company→ S&P Secondhand, Newbuilding & Demolition Markets, by Golden Destiny
TERMS OF USE & DISCLAIMER
CONTENT CONTRIBUTORS
Capital Link Shipping Weekly Markets Report

* Morning and afternoon sessions are free of charge for qualified attendees only. There will be a $170 fee to attend the lunch session.
Registration is FREE* and by invitation only.
REGISTER NOW VIEW AGENDA ADD TO OUTLOOK VIEW VENUE
Global Economy & World Trade - Container Sector - LNG Sector - Tanker Sector - Ship Recycling in Today’s Market Conditions - Off Shore Drilling - Banking & Shipping - Capital Markets Are Open to Shipping - Private Equity - Restructuring - Analyst Panel
PANEL TOPICS
UPCOMING EVENT - FREE REGISTRATION *
The 7th Annual Invest in International Shipping Forum will take place in New York City to the diverse body of shipping professionals from around the globe. An investor-focused event held every year in New York, the most influential C-level executives—belonging to U.S. and foreign listed shipping companies—will come together to discuss and examine the macroeconomic issues that are shaping and transforming international shipping today. The forum provides a comprehensive review and outlook on the various shipping markets, made more relevant by the annual release of companies’ performance results. Attending investors, who undoubtedly may wish to evaluate how companies continue to finance their vessels and projects, will be able to assess both the current and future financial status of the international shipping markets.
IN COOPERATION WITH
FORUM OVERVIEW
Invest in International Shipping ForumCAPITAL LINK FORUMThursday, March 21, 2013The Metropolitan Club, One East 60th St., New York City
th Annual7
New York - 230 Park Avenue, Suite 1536, New York, NY, 10169 Tel.: +1 212 661 7566 Fax: +1 212 661 7526London - Longcroft House,2-8 Victoria Avenue, London, EC2M 4NS, U.K Tel. +44(0) 203 206 1320 Fax. +44(0) 203 206 1321Athens - 40, Agiou Konstantinou Str, Suite A 5, 151-24 Athens, Greece Tel. +30 210 6109 800 Fax +30 210 6109 801
Capital Link - New York - London - Athenswww.capitallink.comwww.capitallinkforum.com
www.CapitalLinkShipping.comA web based resource that provides information on the major shipping and stock market
Investor Relations & Financial Advisory
indices, as well as on all shipping stocks. It also features an earnings and conference call calendar, industry reports from major industry participants and interviews with CEOs, analysts and other market participants.
www.CapitalLinkWebinars.comSector Forums & Webinars: Regularly, we organize panel discussions among CEOs, analysts, bankers and shipping industry participants on the developments in the various shipping sectors (containers, dry bulk, tankers) and on other topics of interest (such as Raising Equity in Shipping Today, Scrapping, etc).
Capital Link Investor Shipping ForumsIn New York, Athens and London bringing together investors, bankers, financial advisors, listed companies CEOs, analysts, and shipping industry participants.
www.MaritimeIndices.comCapital Link Maritime Indices: Capital Link developed and maintains a series of stock market maritime indices which track the performance of U.S. listed shipping stocks (CL maritime Index, CL Dry Bulk Index, CL Tanker Index, CL Container Index, CL LNG/LPG Index, CL Mixed Fleet Index, CL Shipping MLP Index – Bloomberg page: CPLI. The Indices are also distributed through the Reuters Newswires and are available on Factset.
Capital Link Shipping Weekly Markets ReportWeekly distribution to an extensive audience in the US & European shipping, financial and investment communities with updates on the shipping markets, the stock market and listed company news.
Operating more like a boutique investment bank rather than a traditional Investor Relations firm, our objective is to assist our clients enhance long term shareholder value and achieve proper valuation through their positioning in the investment community. We assist them to determine their objectives, establish the proper investor outreach strategies, generate a recurring information flow, identify the proper investor and analyst target groups and gather investor and analyst feedback and related market intelligence information while keeping track of their peer group. Also, to enhance their profile in the financial and trade media.
Capital Link is a New York-based Advisory, Investor Relations and Financial Communications firm. Capitalizing on our in-depth knowledge of the shipping industry and capital markets, Capital Link has made a strategic commitment to the shipping industry becoming the largest provider of Investor Relations and Financial Communications services to international shipping companies listed on the US and European Exchanges. Capital Link's headquarters are in New York with a presence in London and Athens.
In our effort to enhance the information flow to the investment community and contribute to improving investor knowledge of shipping, Capital Link has undertaken a series of initiatives beyond the traditional scope of its investor relations activity, such as:
...Linking Shipping and Investors Across the GlobeCapital Link Shipping

Monday, March 11, 2013 (Week 11)Capital Link Shipping Weekly Markets Report
Page 3
IN THE NEWS
Latest Company NewsMonday, March 4, 2013
Diana Containerships Inc. Announces Direct Continuation of Time Charter Agreement for m/v Sagitta With A.P. Moller-Maersk A/SDiana Containerships Inc. announced that it has extended the present time charter contract with A.P. Moeller-Maersk A/S, for its Panamax container vessel, the m/v Sagitta. The gross charter rate is US$7,250 per day, minus a 1.25% commission paid to third parties, for a period of minimum seven (7) months to maximum eleven (11) months. This charter is a direct continuation of the present agreement and will commence on March 15, 2013.
Tuesday, March 5, 2013
Diana Shipping Inc. Announces Time Charter Contract for M/V Sideris GS With CargillDiana Shipping Inc. announced that it has entered into a time charter contract with Cargill International S.A., Geneva, through a separate wholly-owned subsidiary, for one of its Capesize dry bulk carriers, the m/v Sideris GS. The gross charter rate is US$13,500 per day, minus a 5% commission paid to third parties, for a period of minimum twenty-one (21) months to maximum twenty-seven (27) months. The charter is expected to commence in the middle of March 2013.
Seaspan Reports Financial Results for the Quarter and Year Ended December 31, 2012Seaspan Corporation announced its financial results for the quarter and year ended December 31, 2012. Revenue increased by 8.8% and 16.8%, respectively, for the quarter and year ended December 31, 2012 over the prior year’’s comparable periods. Vessel utilization was 98.5% and 98.9%, for the quarter and year ended December 31, 2012, respectively, compared to 99.5% and 99.3% for the quarter and year ended December 31, 2011, respectively. On February 7, 2013, itCompany also declared a quarterly dividend of $0.25 per Class A common share.
Wednesday, March 6, 2013
Scorpio Tankers Inc. Announces Time Charter-In Agreement for a Product TankerScorpio Tankers Inc. announced that it has agreed to time charter-in a product tanker. The terms of the contract is summarized as follows: A 2013 built MR product tanker will be time chartered-in for two years at $14,121 per day and is expected to be delivered by the end of April 2013. The agreement includes an option for the Company to extend the charter for an additional year at $15,504 per day. Upon delivery, the vessel will be time chartered-out for up to 80 days at $22,850 per day.
Ocean Rig UDW Inc. Reports Financial and Operating Results for the Fourth Quarter 2012Ocean Rig UDW Inc. announced its unaudited financial and operating results for the fourth quarter ended December 31, 2012. The Company reported Adjusted EBITDA of $75.4 million and $354.4 million for the fourth quarter and year ended 2012, respectively. Revenues from drilling contracts amounted $229.8 million for the three-month period ended December 31, 2012.
DryShips Inc. Reports Financial and Operating Results for the Fourth Quarter 2012DryShips Inc. announced its unaudited financial and operating results for the fourth quarter ended December 31, 2012. The Company reported Adjusted EBITDA of $109.5 million and $500.5 million for the fourth quarter and year ended 2012 respectively. For the three-month period ended December 31, 2012, net voyage revenues for the drybulk carrier amounted to $34.9 million. For the tanker segment, net voyage revenues amounted to $6.5 million as compared to $3.6 million for the same period in 2011.
Thursday, March 7, 2013
Scorpio Tankers Inc. Announces Agreement to Construct Two LR2 NewbuildingsScorpio Tankers Inc announced that it has reached an agreement with Hyundai Samho Heavy Industries Co., Ltd. to construct two 114,000 dwt LR2 Product Tankers for $49.75 million. These vessels are expected to be delivered to the Company in the third quarter of 2014. This order is a continuation of the Company’s existing newbuilding program for fuel-efficient vessels. These newbuildings come with fixed-price options for the construction of additional LR2 vessels.
Monday, March 11, 2013
Global Ship Lease Reports Results for the Fourth Quarter of 2012Global Ship Lease, Inc., announced its unaudited results for the three months and year ended December 31, 2012. It reported revenue of $36.2 million for the fourth quarter 2012 and $153.2 million for the full year. Net income was $8.1 million for the fourth quarter 2012, after a $4.7 million non-cash interest rate derivative mark-to-market gain; net income for full year 2012 was $31.9 million, after a $9.7 million non-cash mark-to-market gain.
Diana Shipping Inc. Announces Time Charter Contract for M/V Semirio With CargillDiana Shipping Inc. announced that it has entered into a time charter contract with Cargill International S.A., Geneva, through a separate wholly-owned subsidiary, for one of its Capesize dry bulk carriers, the m/v Semirio. The gross charter rate is US$14,000 per day, minus a 4.75% commission paid to third parties, for a period of minimum twenty-two (22) months to maximum twenty-seven (27) months. The charter is expected to commence on March 21, 2013.
Euroseas Ltd. to Present at the 7th Annual Capital Link Invest in International Shipping ForumEuroseas Ltd., announced that Mr. Aristides Pittas, the Chairman and CEO of Euroseas, will be presenting at the 7th Annual Capital Link Invest in International Shipping Forum in New York City on Thursday, March 21, 2013.
Star Bulk Carriers to Present at the 7th Annual Capital Link Invest in International Shipping ForumStar Bulk Carriers Corp. announced that the company’s management team will be presenting at the 7th Annual Capital Link Invest in International Shipping Forum in New York City on Thursday, March 21, 2013.

Monday, March 11, 2013 (Week 11)Capital Link Shipping Weekly Markets Report
Page 4
IN THE NEWS
Select Dividend Paying Shipping Stocks
Get your message across to
36,000 weekly recipients around the globeJoin a select group of shipping & financial industry’s advertisers by promoting your brand with
Capital Link’s Shipping Weekly Markets Report.
For additional advertising information and a media kit, please contact/email:
Nicolas Bornozis at +1 212 661-7566, [email protected]
March 11, 2013 – Week 11
Select Dividend Paying Shipping Stocks Stock Prices as of March 8, 2013
Company Name Ticker Quarterly Dividend
Annualized Dividend
Last Closing Price (Mar. 8, 2013)
Annualized Dividend Yield
Containers Costamare Inc CMRE $0.27 * $1.08 $16.35 6.61% Dry Bulk Navios Maritime Holdings Inc NM $0.06 $0.24 $4.25 5.65% Navios Maritime Partners NMM $0.4425** $1.77 $14.05 12.60% Safe Bulkers Inc SB $0.05 $0.20 $4.63 4.32% Tankers Capital Product Partners Lp CPLP $0.2325 $0.93 $7.76 11.98% Navios Maritime Acquisition Corp NNA $0.05 $0.20 $3.37 5.93% Tsakos Energy Navigation Ltd TNP $0.05 $0.20 $4.12 4.85% Mixed Fleet Euroseas Ltd ESEA $0.015 $0.06 $1.02 5.88%
*Board approved an eight percent (8%) dividend increase, beginning with the third quarter 2011 dividend, raising the quarterly dividend from $0.25 to $0.27 per common share.
** Board approved a 0.57% dividend increase, beginning with the second quarter 2012 dividend, raising the quarterly dividend from $0.44 to $0.4425 per unit.
Monday, March 11, 2013 (Week 11)Capital Link Shipping Weekly Markets Report
Page 5
CAPITAL MARKETS DATA
Currencies, Commodities & Indices
March 11, 2013 – Week 11
Currencies, Commodities & Indices
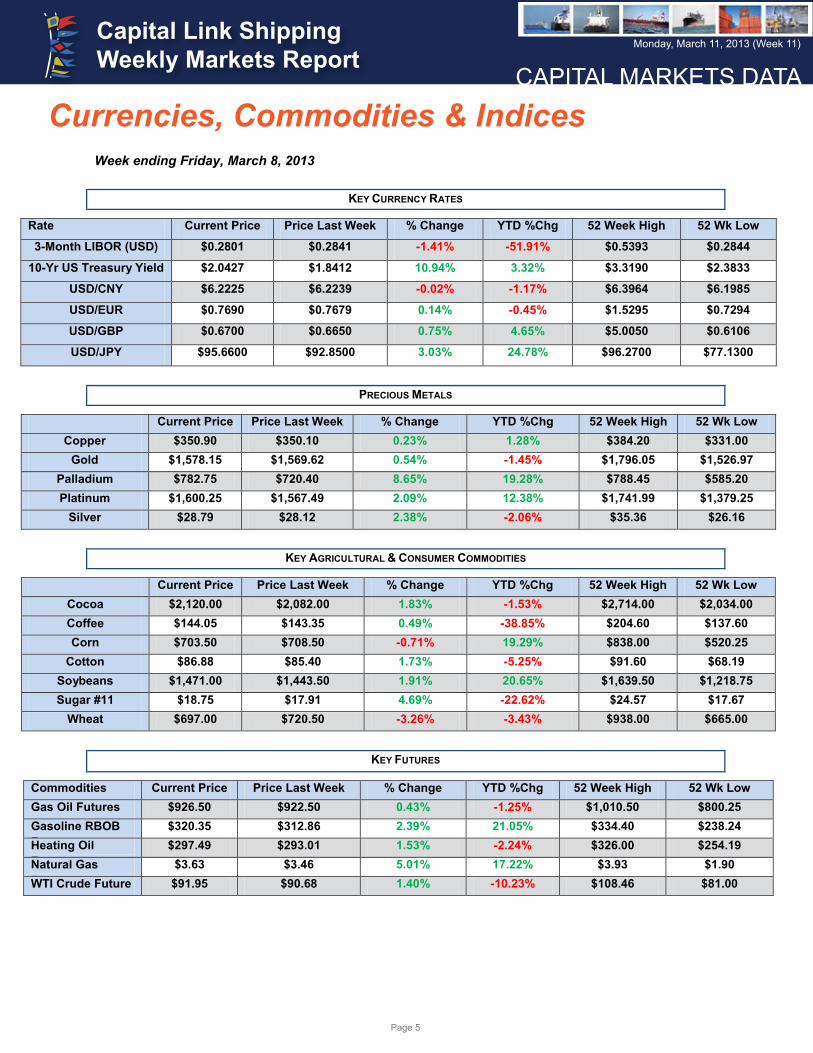
Week ending Friday, March 8, 2013 KEY CURRENCY RATES
Rate Current Price Price Last Week % Change YTD %Chg 52 Week High 52 Wk Low
3-Month LIBOR (USD) $0.2801 $0.2841 -1.41% -51.91% $0.5393 $0.2844
10-Yr US Treasury Yield $2.0427 $1.8412 10.94% 3.32% $3.3190 $2.3833
USD/CNY $6.2225 $6.2239 -0.02% -1.17% $6.3964 $6.1985
USD/EUR $0.7690 $0.7679 0.14% -0.45% $1.5295 $0.7294
USD/GBP $0.6700 $0.6650 0.75% 4.65% $5.0050 $0.6106
USD/JPY $95.6600 $92.8500 3.03% 24.78% $96.2700 $77.1300
PRECIOUS METALS
Current Price Price Last Week % Change YTD %Chg 52 Week High 52 Wk Low Copper $350.90 $350.10 0.23% 1.28% $384.20 $331.00
Gold $1,578.15 $1,569.62 0.54% -1.45% $1,796.05 $1,526.97 Palladium $782.75 $720.40 8.65% 19.28% $788.45 $585.20 Platinum $1,600.25 $1,567.49 2.09% 12.38% $1,741.99 $1,379.25
Silver $28.79 $28.12 2.38% -2.06% $35.36 $26.16
KEY AGRICULTURAL & CONSUMER COMMODITIES
Current Price Price Last Week % Change YTD %Chg 52 Week High 52 Wk Low Cocoa $2,120.00 $2,082.00 1.83% -1.53% $2,714.00 $2,034.00 Coffee $144.05 $143.35 0.49% -38.85% $204.60 $137.60 Corn $703.50 $708.50 -0.71% 19.29% $838.00 $520.25
Cotton $86.88 $85.40 1.73% -5.25% $91.60 $68.19 Soybeans $1,471.00 $1,443.50 1.91% 20.65% $1,639.50 $1,218.75 Sugar #11 $18.75 $17.91 4.69% -22.62% $24.57 $17.67
Wheat $697.00 $720.50 -3.26% -3.43% $938.00 $665.00
KEY FUTURES
Commodities Current Price Price Last Week % Change YTD %Chg 52 Week High 52 Wk Low Gas Oil Futures $926.50 $922.50 0.43% -1.25% $1,010.50 $800.25 Gasoline RBOB Future
$320.35 $312.86 2.39% 21.05% $334.40 $238.24 Heating Oil Future
$297.49 $293.01 1.53% -2.24% $326.00 $254.19 Natural Gas Future
$3.63 $3.46 5.01% 17.22% $3.93 $1.90 WTI Crude Future $91.95 $90.68 1.40% -10.23% $108.46 $81.00
Monday, March 11, 2013 (Week 11)Capital Link Shipping Weekly Markets Report
Page 6
CAPITAL MARKETS DATA
Currencies, Commodities & Indices
March 11, 2013 – Week 11
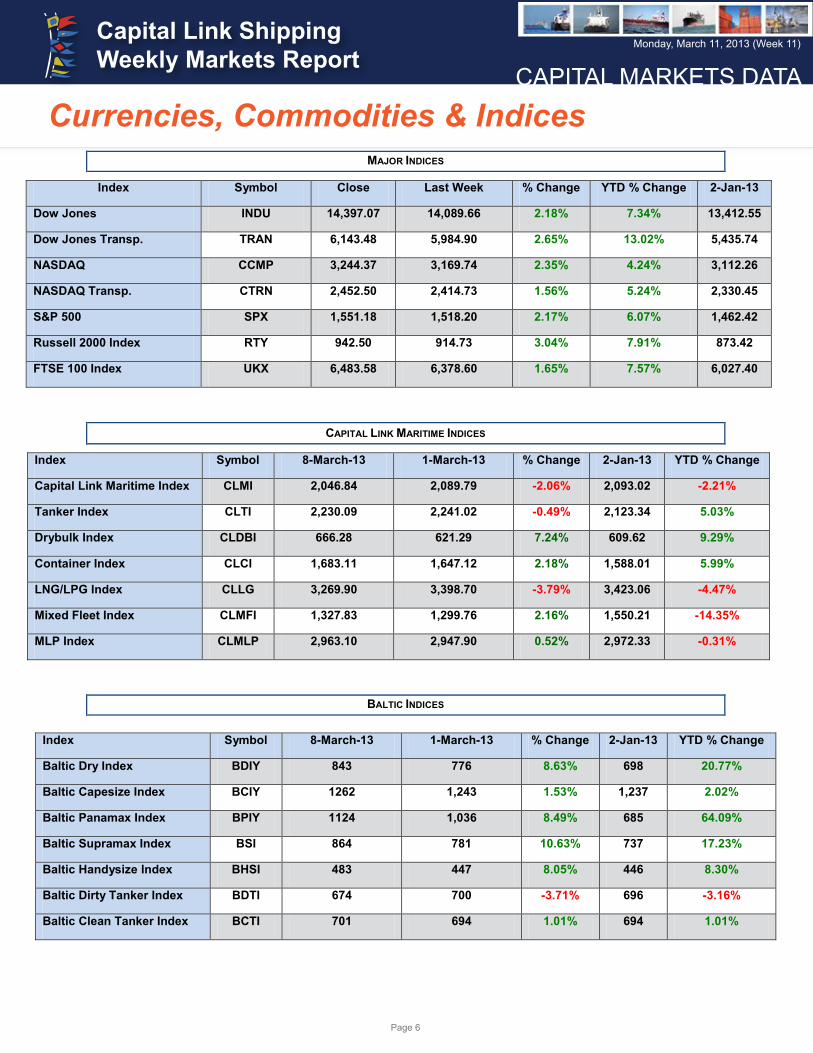
MAJOR INDICES
Index Symbol Close Last Week % Change YTD % Change 2-Jan-13
Dow Jones INDU 14,397.07 14,089.66 2.18% 7.34% 13,412.55
Dow Jones Transp. TRAN 6,143.48 5,984.90 2.65% 13.02% 5,435.74
NASDAQ CCMP 3,244.37 3,169.74 2.35% 4.24% 3,112.26
NASDAQ Transp. CTRN 2,452.50 2,414.73 1.56% 5.24% 2,330.45
S&P 500 SPX 1,551.18 1,518.20 2.17% 6.07% 1,462.42
Russell 2000 Index RTY 942.50 914.73 3.04% 7.91%
873.42
FTSE 100 Index UKX 6,483.58 6,378.60 1.65% 7.57%
6,027.40
CAPITAL LINK MARITIME INDICES
Index Symbol 8-March-13 1-March-13 % Change 2-Jan-13 YTD % Change
Capital Link Maritime Index CLMI 2,046.84 2,089.79 -2.06% 2,093.02 -2.21%
Tanker Index CLTI 2,230.09 2,241.02 -0.49% 2,123.34 5.03%
Drybulk Index CLDBI 666.28 621.29 7.24% 609.62 9.29%
Container Index CLCI 1,683.11 1,647.12 2.18% 1,588.01 5.99%
LNG/LPG Index CLLG 3,269.90 3,398.70 -3.79% 3,423.06 -4.47%
Mixed Fleet Index CLMFI 1,327.83 1,299.76 2.16% 1,550.21 -14.35%
MLP Index CLMLP 2,963.10 2,947.90 0.52% 2,972.33 -0.31%
BALTIC INDICES
Index Symbol 8-March-13 1-March-13 % Change 2-Jan-13 YTD % Change
Baltic Dry Index BDIY 843 776 8.63% 698 20.77%
Baltic Capesize Index BCIY 1262 1,243 1.53% 1,237 2.02%
Baltic Panamax Index BPIY 1124 1,036 8.49% 685 64.09%
Baltic Supramax Index BSI 864 781 10.63% 737 17.23%
Baltic Handysize Index BHSI 483 447 8.05% 446 8.30%
Baltic Dirty Tanker Index BDTI 674 700 -3.71% 696 -3.16%
Baltic Clean Tanker Index BCTI 701 694 1.01% 694 1.01%
CAPITAL MARKETS DATA

Monday, March 11, 2013 (Week 11)Capital Link Shipping Weekly Markets Report
Page 7
CAPITAL MARKETS DATA
Shipping Equities: The Week in Review
March 11, 2013 – Week 11
Shipping Equities: The Week in Review SHIPPING EQUITIES UNDERPERFORM THE BROADER MARKET DRY BULK THE BEST PERFORMER During last week, shipping equities underperformed the broader market, with the Capital Link Maritime Index (CLMI), a composite index of all US listed shipping stocks sliding 2.00%, compared to the S&P 500 increasing 2.17%, and the Dow Jones Industrial Average (DJII) advancing 2.18%. Dry bulk stocks were the best performers during last week, with Capital Link Dry Bulk Index soaring 7.24%, followed by Capital Link Container Index gaining 2.18%. LNG/LPG equities were the worst in last week, with Capital Link LNG/LPG Index slipping 3.79%. The three biggest winners of shipping stocks were FreeSeas, Inc (FREE), Paragon Shipping (PRGN), and Excel Maritime Carriers Ltd. (EXM), up 80.41%, 26.39%, and 25.00%, respectively. During last week, Dry Bulk shipping stocks underperformed the physical market, with Baltic Dry Index (BDI) rising 8.63%, compared to the Capital Link Dry Bulk Index gaining 7.24%. Year-to-date, the BDI has gained 20.77%, compared to the Capital Link Dry Bulk Index up 9.29%. Product tanker market improved during last week with Baltic Product Tanker Index (BCTI) rising 1.01%, while Baltic Dirty Tanker Index (BDTI) went down 3.71%. Capital Link Tanker Index went down slightly by 0.49%. Year-to-date, the BDTI lost 3.16% and the BCTI improved 1.01%, while Capital Link Tanker Index went up 5.03%. The Trading Statistics supplied by Knight Capital provide details of the trading performance of each shipping stock and analyze the market’s trading momentum and trends for the week and year-to-date. The objective of the Capital Link Maritime Indices is to enable investors, as well as all shipping market participants, to better track the performance of listed shipping stocks individually, by sector or as an industry. Performance can be compared to other individual shipping stocks, to their sector, to the broader market, as well as to the physical underlying shipping markets or other commodities. The Indices currently focus only on companies listed on US Exchanges providing a homogeneous universe. They are calculated daily and are based on the market capitalization weighting of the stocks in each index. In terms of historical data, the indices go back to January 1, 2005, thereby providing investors with significant historical performance. There are seven indices in total; the Capital Link Maritime Index comprised of all 45 listed shipping stocks, and six Sector Indices, the CL Dry Bulk Index, the CL Tanker Index, the CL Container Index, the CL LNG / LPG Index, the CL Mixed Fleet Index and the CL Maritime MLP Index. The Index values are updated daily after the market close and can be accessed at www.CapitalLinkShipping.com or at or www.MaritimeIndices.com. They can also be found through the Bloomberg page “CPLI” and Reuters.

Monday, March 11, 2013 (Week 11)Capital Link Shipping Weekly Markets Report
Page 8
CAPITAL MARKETS DATA
Shipping Equities: The Week in Review
March 11, 2013 – Week 11
MARITIME INDEX DAILY COMPARISON CHARTS (52 -WEEK )
*SOURCE: BLOOMBERG
0.700.750.800.850.900.951.001.051.101.15
Capital Link Maritime Index S&P 500 Russell 2000
0.350.500.650.800.951.101.251.401.55
Capital Link Drybulk Index Baltic Dry Index
0.50
0.70
0.90
1.10
1.30
1.50
1.70
1.90
Capital Link Tanker Index Baltic Clean Tanker Index Baltic Dirty Tanker Index
Fried Frank is one of the world’s most active corporate law firms with a presence in principal financial centers across the US, Europe and Asia.
Growing with our clients’ businesses, we regularly represent companies in each stage of development. Our approach is to understand the essential commercial elements of our clients’ objectives and in turn, deploy tailored attorney teams with the experience and expertise to achieve their goals. The Firm’s breadth across practices and offices allow us to align the right resources to address our clients’ business opportunities and challenges both effectively and efficiently.
360 DEGrEES OF ShippinG
New York | Washington DC | London | Paris | Frankfurt | Hong Kong | Shanghai | friedfrank.com

Monday, March 11, 2013 (Week 11)Capital Link Shipping Weekly Markets Report
Page 10
CAPITAL MARKETS DATA
Weekly Trading Statistics
March 11, 2013 – Week 11
Custom Statistics Prepared Weekly for Capital Link Shipping BROAD MARKET Percent Change of Major Indexes for the Week Ending Friday, March 8, 2013 Name Symbol Close Net Gain Percent Gain Russell 2000 Index RUT 942.54 27.81 3.04% Nasdaq Composite Index COMPX 3244.37 74.63 2.35% Russell 3000 Index RUA 924.41 20.96 2.32% Russell 1000 Index RUI 861.59 19.05 2.26% S&P 500 Index SPX 1551.18 32.98 2.17% Nasdaq-100 Index NDX 2804.11 56.36 2.05% Nasdaq Transportation Index TRANX 2452.5 37.77 1.56%
SHIPPING INDUSTRY DATA (50 Companies) Moving Averages 81.40% closed > 10D Moving Average. 60.47% closed > 50D Moving Average. 67.44% closed > 100D Moving Average. 51.16% closed > 200D Moving Average.
Top Upside Momentum (Issues with the greatest 100 day upside momentum*)
Top Downside Momentum (Issues with the greatest 100 day downward momentum*)
Symbol Close Weekly % Change
50-Day % Change
FREE 1.75 80.41% 118.75% GASS 11.48 5.81% 40.00% PRGN 3.64 26.39% 58.26% NNA 3.37 12.71% 58.22% EXM 0.65 25.00% 35.42% EGLE 2.4 20.60% 49.07% DAC 3.58 3.47% 39.30% TEU 5.92 7.44% 44.74% BALT 3.93 4.24% 25.56% NM 4.25 12.43% 27.63%
*Momentum: (100D % change) + 1.5*(50D % change) + 2.0*(10D % change) for each stock then sort group in descending order and report the top 10.
Symbol Close Weekly % Change
50-Day % Change
TRMD 1.64 -7.34% -52.74% TOPS 0.76 -15.56% -25.49% FRO 2.23 4.69% -32.83% GNK 2.83 10.12% -23.10% SBLK 6.05 5.22% 0.00% DHT 4.35 1.16% 6.88% GLBS 1.94 7.18% 20.50% TNK 2.76 5.75% -4.17% NAT 9.1 2.25% 9.24% TNP 4.12 11.05% 12.57%
*Momentum: (100D % change) + 1.5*(50D % change) + 2.0*(10D % change) for each stock - sort names that have a negative value in ascending order - report the top 10.
Top Consecutive Higher Closes Top Consecutive Lower Closes
Symbol Close Up Streak NM 4.25 6 ANW 6.95 5 SBLK 6.05 5 VLCCF 6.95 4 TNK 2.76 4 SFL 16.79 4 SB 4.63 4 GASS 11.48 4 FRO 2.23 3 NMM 14.05 2
Symbol Close Down Streak SHIP 1.55 -2 SSW 19.95 -2 TRMD 1.64 -3 GLNG 35.3 -5

Monday, March 11, 2013 (Week 11)Capital Link Shipping Weekly Markets Report
Page 11
CAPITAL MARKETS DATA
Weekly Trading Statistics
March 11, 2013 – Week 11
Top Largest Weekly Trading Gains Top Largest Weekly Trading Losses
Symbol Close One Week Ago
Friday Close
Net Change
% Change
FREE 0.97 1.75 0.78 80.41% PRGN 2.88 3.64 0.76 26.39% EXM 0.52 0.65 0.13 25.00% EGLE 1.99 2.4 0.41 20.60% SB 3.93 4.63 0.70 17.81% NNA 2.99 3.37 0.38 12.71% NM 3.78 4.25 0.47 12.43% ANW 6.25 6.95 0.70 11.20% TNP 3.71 4.12 0.41 11.05% GNK 2.57 2.83 0.26 10.12%
Symbol Close One Week Ago
Friday Close
Net Change % Change
MATX 35.46 25.24 -10.22 -28.82% TOPS 0.9 0.76 -0.14 -15.56% DCIX 6.42 5.56 -0.86 -13.40% NEWL 0.7 0.61 -0.09 -12.86% GLNG 38.64 35.3 -3.34 -8.64% SHIP 1.69 1.55 -0.14 -8.28% TRMD 1.77 1.64 -0.13 -7.34% TK 35.41 34.62 -0.79 -2.23% CPLP 7.88 7.76 -0.12 -1.52% TGP 39.11 38.67 -0.44 -1.13%
Top Largest Monthly Trading Gains (A month has been
standardized to 20 trading days) Top Largest Monthly Trading*Losses (A month has been
standardized to 20 trading days)
Symbol Prior Close
Friday Close
Net Change % Change
EGLE 1.8 2.4 0.60 33.33% GASS 8.68 11.48 2.80 32.26% EXM 0.51 0.65 0.14 27.45% BALT 3.14 3.93 0.79 25.16% SB 3.71 4.63 0.92 24.80% NNA 2.81 3.37 0.56 19.93% VLCCF 6.11 6.95 0.84 13.75% NM 3.8 4.25 0.45 11.84% STNG 7.79 8.53 0.74 9.50% ANW 6.4 6.95 0.55 8.59%
Symbol Prior Close
Friday Close Net Change % Change
NEWL 1.2 0.61 -0.59 -49.17% FRO 3.29 2.23 -1.06 -32.22% SHIP 2.15 1.55 -0.60 -27.91% MATX 34.93 25.24 -9.69 -27.74% TRMD 2.2 1.64 -0.56 -25.45% TOPS 0.94 0.76 -0.18 -19.15% FREE 2.1 1.75 -0.35 -16.67% GNK 3.31 2.83 -0.48 -14.50% GLNG 40.75 35.3 -5.45 -13.37% DRYS 2.19 1.96 -0.23 -10.50%
Stocks Nearest to 52-Week Highs Stocks Nearest To 52-Week Lows
Symbol 52W High % Away DSX 9.24 -1.95% TOO 29.27 -2.09% CMRE 16.71 -2.15% GASS 11.78 -2.55% NNA 3.46 -2.60% STNG 8.81 -3.18% GLOG 13.33 -4.42% SSW 20.95 -4.77% TK 36.69 -5.64% NMM 14.97 -6.15%
Symbol 52W Low % Away TRMD 1.64 0.00% SBLK 5.71 5.95% MATX 23.29 8.39% TOPS 0.70 8.57% GLNG 30.37 16.24% NAT 7.80 16.63% TNK 2.35 17.42% TGP 32.93 17.43% TOO 24.11 18.87% DCIX 4.65 19.56%
Monday, March 11, 2013 (Week 11)Capital Link Shipping Weekly Markets Report
Page 12
CAPITAL MARKETS DATA
Weekly Trading Statistics
March 11, 2013 – Week 11
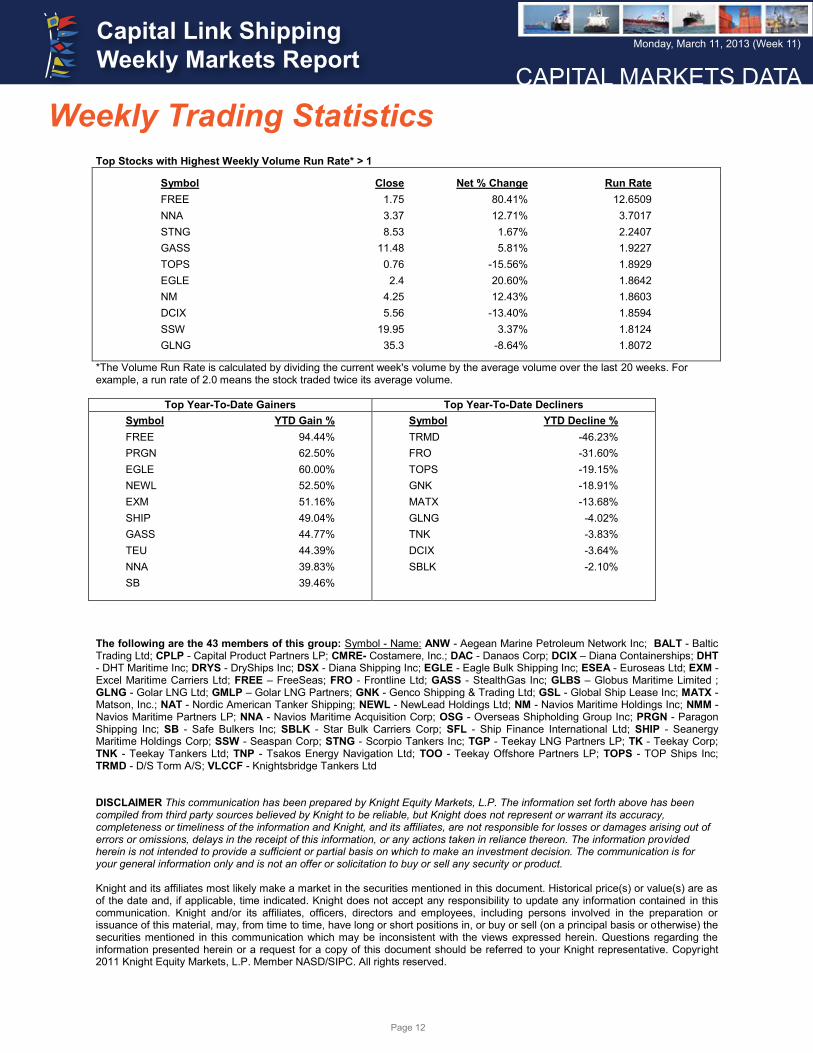
Top Stocks with Highest Weekly Volume Run Rate* > 1
Symbol Close Net % Change Run Rate FREE 1.75 80.41% 12.6509 NNA 3.37 12.71% 3.7017 STNG 8.53 1.67% 2.2407 GASS 11.48 5.81% 1.9227 TOPS 0.76 -15.56% 1.8929 EGLE 2.4 20.60% 1.8642 NM 4.25 12.43% 1.8603 DCIX 5.56 -13.40% 1.8594 SSW 19.95 3.37% 1.8124 GLNG 35.3 -8.64% 1.8072
*The Volume Run Rate is calculated by dividing the current week's volume by the average volume over the last 20 weeks. For example, a run rate of 2.0 means the stock traded twice its average volume.
Top Year-To-Date Gainers Top Year-To-Date Decliners Symbol YTD Gain % FREE 94.44% PRGN 62.50% EGLE 60.00% NEWL 52.50% EXM 51.16% SHIP 49.04% GASS 44.77% TEU 44.39% NNA 39.83% SB 39.46%
Symbol YTD Decline % TRMD -46.23% FRO -31.60% TOPS -19.15% GNK -18.91% MATX -13.68% GLNG -4.02% TNK -3.83% DCIX -3.64% SBLK -2.10%
The following are the 43 members of this group: Symbol - Name: ANW - Aegean Marine Petroleum Network Inc; BALT - Baltic Trading Ltd; CPLP - Capital Product Partners LP; CMRE- Costamere, Inc.; DAC - Danaos Corp; DCIX – Diana Containerships; DHT - DHT Maritime Inc; DRYS - DryShips Inc; DSX - Diana Shipping Inc; EGLE - Eagle Bulk Shipping Inc; ESEA - Euroseas Ltd; EXM - Excel Maritime Carriers Ltd; FREE – FreeSeas; FRO - Frontline Ltd; GASS - StealthGas Inc; GLBS – Globus Maritime Limited ; GLNG - Golar LNG Ltd; GMLP – Golar LNG Partners; GNK - Genco Shipping & Trading Ltd; GSL - Global Ship Lease Inc; MATX - Matson, Inc.; NAT - Nordic American Tanker Shipping; NEWL - NewLead Holdings Ltd; NM - Navios Maritime Holdings Inc; NMM - Navios Maritime Partners LP; NNA - Navios Maritime Acquisition Corp; OSG - Overseas Shipholding Group Inc; PRGN - Paragon Shipping Inc; SB - Safe Bulkers Inc; SBLK - Star Bulk Carriers Corp; SFL - Ship Finance International Ltd; SHIP - Seanergy Maritime Holdings Corp; SSW - Seaspan Corp; STNG - Scorpio Tankers Inc; TGP - Teekay LNG Partners LP; TK - Teekay Corp; TNK - Teekay Tankers Ltd; TNP - Tsakos Energy Navigation Ltd; TOO - Teekay Offshore Partners LP; TOPS - TOP Ships Inc; TRMD - D/S Torm A/S; VLCCF - Knightsbridge Tankers Ltd DISCLAIMER This communication has been prepared by Knight Equity Markets, L.P. The information set forth above has been compiled from third party sources believed by Knight to be reliable, but Knight does not represent or warrant its accuracy, completeness or timeliness of the information and Knight, and its affiliates, are not responsible for losses or damages arising out of errors or omissions, delays in the receipt of this information, or any actions taken in reliance thereon. The information provided herein is not intended to provide a sufficient or partial basis on which to make an investment decision. The communication is for your general information only and is not an offer or solicitation to buy or sell any security or product. Knight and its affiliates most likely make a market in the securities mentioned in this document. Historical price(s) or value(s) are as of the date and, if applicable, time indicated. Knight does not accept any responsibility to update any information contained in this communication. Knight and/or its affiliates, officers, directors and employees, including persons involved in the preparation or issuance of this material, may, from time to time, have long or short positions in, or buy or sell (on a principal basis or otherwise) the securities mentioned in this communication which may be inconsistent with the views expressed herein. Questions regarding the information presented herein or a request for a copy of this document should be referred to your Knight representative. Copyright 2011 Knight Equity Markets, L.P. Member NASD/SIPC. All rights reserved.

© September 2010 Knight Capital Group, Inc. All rights reserved.Knight Equity Markets, L.P. and Knight Capital Markets LLC are o�-exchange liquidity providers and members of FINRA and SIPC. To learn about Knight Capital Group, Inc. (NYSE Euronext: KCG) go to knight.com.
Knight Corporate Access is an unbiased service for issuers to
connect with institutional investors. Through a combination of
strategic investor introductions, thought leadership initiatives
and market insight, Knight can help strengthen and diversify a
company’s investor base.
Knight is the leading source of o�-exchange liquidity in U.S.
equities and has a greater share volume than any U.S. exchange.
For additional information,please contact:
Sandy Reddin
phone 212-455-9255email [email protected]
Monday, March 11, 2013 (Week 11)Capital Link Shipping Weekly Markets Report
Page 14
SHIPPING MARKETS
Weekly Market Report
March 11, 2013 – Week 11
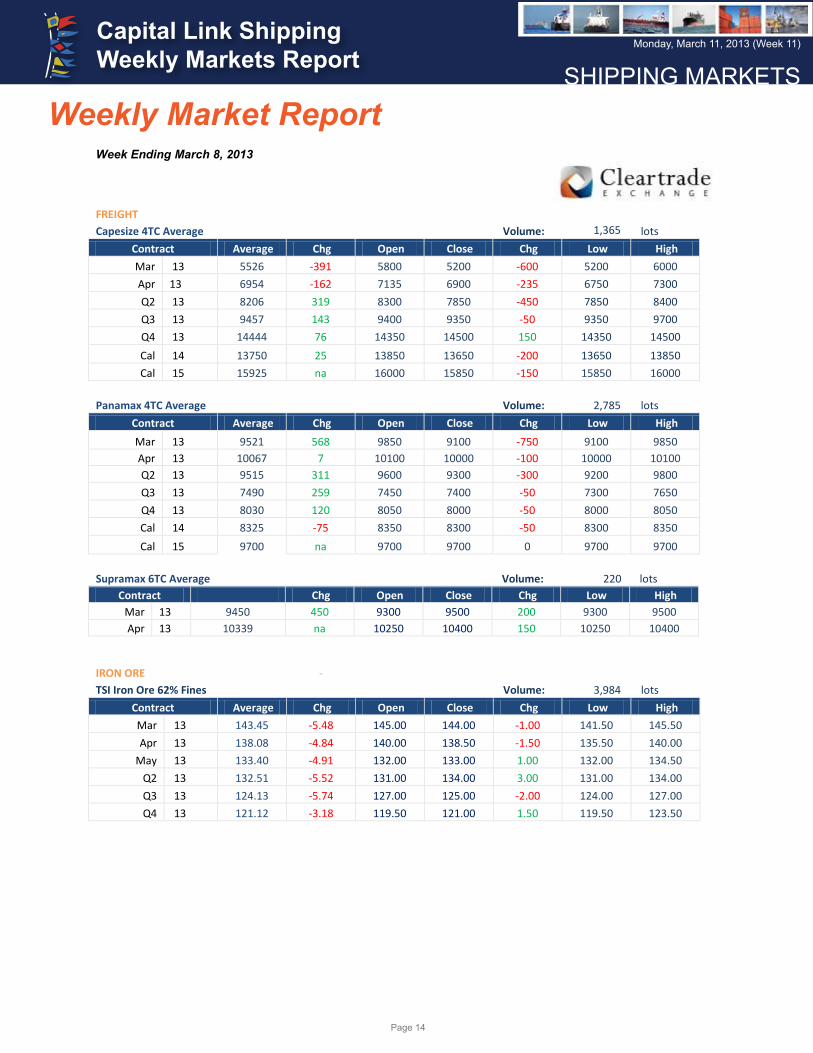
Weekly Market Report Week Ending March 8, 2013
FREIGHT Capesize 4TC Average BCI TC Volume: 1,365 lots
Contract Average Chg Open Close Chg Low High Mar 13 5526 -391 5800 5200 -600 5200 6000 Apr 13 6954 -162 7135 6900 -235 6750 7300 Q2 13 8206 319 8300 7850 -450 7850 8400 Q3 13 9457 143 9400 9350 -50 9350 9700 Q4 13 14444 76 14350 14500 150 14350 14500 Cal 14 13750 25 13850 13650 -200 13650 13850 Cal 15 15925 na 16000 15850 -150 15850 16000
Panamax 4TC Average BPI TC Volume: 2,785 lots
Contract Average Chg Open Close Chg Low High Mar 13 9521 568 9850 9100 -750 9100 9850 Apr 13 10067 7 10100 10000 -100 10000 10100 Q2 13 9515 311 9600 9300 -300 9200 9800 Q3 13 7490 259 7450 7400 -50 7300 7650 Q4 13 8030 120 8050 8000 -50 8000 8050 Cal 14 8325 -75 8350 8300 -50 8300 8350 Cal 15 9700 na 9700 9700 0 9700 9700
Supramax 6TC Average BSI TC Volume: 220 lots
Contract Chg Open Close Chg Low High Mar 13 9450 450 9300 9500 200 9300 9500 Apr 13 10339 na 10250 10400 150 10250 10400
IRON ORE -
TSI Iron Ore 62% Fines TSIO 62
Volume: 3,984 lots Contract Average Chg Open Close Chg Low High Mar 13 143.45 -5.48 145.00 144.00 -1.00 141.50 145.50 Apr 13 138.08 -4.84 140.00 138.50 -1.50 135.50 140.00
May 13 133.40 -4.91 132.00 133.00 1.00 132.00 134.50 Q2 13 132.51 -5.52 131.00 134.00 3.00 131.00 134.00 Q3 13 124.13 -5.74 127.00 125.00 -2.00 124.00 127.00 Q4 13 121.12 -3.18 119.50 121.00 1.50 119.50 123.50

Monday, March 11, 2013 (Week 11)Capital Link Shipping Weekly Markets Report
Page 15
SHIPPING MARKETS
Weekly Market Report
March 11, 2013 – Week 11
FERTILIZER Urea Nola Urea G N Volume: 24 lots
Contract Average Chg Open Close Chg Low High Mar 13 407.00 0.89 407.00 407.00 0.00 407.00 407.00
Apr 13 403.50 -3.25 402.00 405.00 3.00 401.00 406.00 Urea Yuzhnyy Urea P Y Volume: 70 lots
Contract Average Chg Open Close Chg Low High
Apr 13 383.92 na 388.00
380.50 -8 332.00 388.00
BUNKER FUEL Singapore 380cst S38 Volume: 26,350 lots
Contract Average Chg Open Close Chg Low High Apr 13 625.17 -4.54 622.00 626.75 4.75 622.00 626.75
May 13 620.42 -16.08 621.00 620.00 -1.00 620.00 621.00 Commentary Freight Cape - The week started with optimism as Capesize and Panamax saw support as increased demand from China for coal imports
helped bolster demand. The curve was generally well supported till post index Thursday whereby prices started drifting down and traded in a tight range in the last day of the week.
Pana - Prices slipped across the curve at the start of the week with oversupply of tonnage kicking around in the East. Prices was
generally traded in a tight range with the week ending a touch stronger on Panamax. Post index market was very quiet with more bids coming in towards the end pushing the market up on Friday.
Iron Ore
The iron ore market opened strongly for the week, however volumes are lower than what was seen last week as traders attempted to gauge the next directional move. The market was relatively quiet towards the end of the week with little physical news, but we see more buyers as sentiment began to shift slightly.
Fertilizer
Prices in the International Urea market continue to hold stable as participants gauge physical market direction and upcoming end user demand. We also saw some volume done on DAP Tampa contracts with highest done at 480, closing at 470 ending the week. Yuzhnyy Urea has been rather quiet this week, as participants are on a cautionary tone, awaiting signs from end user markets.
Bunker Fuel
Despite a growing appetite for fuel oil, power consumption in Japan’s power sector is expected to decline this year which caused projected demand to dip 2 to 3% from last year. Japan is expected to restart more nuclear power plants and reduce the use of oil to generate electricity. Cash differentials for 380 cst fuel oil continued to plunge over the past week as there is lower demand from Chinese teapot refiners and utility providers after weeks of stock piling ahead of the Lunar New Year.
Legend Average Weighted average price of the contract period for the week Change (1) Difference between the current week Average and the previous week Average Open Opening price of the week Close Closing price of the week Change (2) Different between the weekly Open and Close Price Low Lowest price of the week High Highest price of the week

Monday, March 11, 2013 (Week 11)Capital Link Shipping Weekly Markets Report
Page 16
SHIPPING MARKETS
Dry Bulk Market - Weekly HighlightsContributed by
IntermodalIntermodal Shipbrokers Co.17th km Ethniki Odos Athens-Lamia &3 Agrambelis Street,145 64 N. Kifisia,Athens - Greece
Phone: +30 210 6293300Website: www.intermodal.gr
The Dry Bulk market has gained for a third week in a row reaching now close to the 850 level. The BCI finally reversed its course and closed in the green, after a bleak month where rates had lost more than 100%. This positive movement had a very small impact on rates and has in no way brought any sentiment change, as all market players are currently very skeptic about the course of the sector during 2013. Strong rates for yet another week witnessed for Panamaxes, with charterers in both basins increasing their bids substantially and boosting the BPI to levels last witnessed back in July. The smaller size segments have also had rates firming across the board, with Supramaxes enjoying rather large increases especially for Pacific round voyages.
Baltic Indices / Dry Bulk Spot Rates
Week 10
08/03/2013
Week 9
01/03/2013Point
Diff
Avg Index
$/day
±%
Avg Index
2013 2012
Index $/day Index $/day
BDI 843 776 67 765 921
BCI 1,262 $4,405 1,243 $4,236 19 4.0% 1,399 1,571
BPI 1,124 $8,994 1,036 $8,281 88 8.6% 801 965
BSI 864 $9,038 781 $8,170 83 10.6% 724 906
BHSI 483 $7,193 447 $6,670 36 7.8% 444 518
As we mentioned last week, the strong prices witnessed for wheat last year are expected to soften in 2013, as production coming out of Europe is expected to be stronger. Market sources are now anticipating that the US will not export as much as it was originally expected, partly because of Europe’s output, as well as because those previous high prices had discouraged wheat importing nations from going after US production. The end of last week gave an end to the Colombian strikes. The coal trade facilitated by Capesizes in the area has been seriously impeded, pushing down massively rates offered in the area. It will be interesting to watch how quickly the recovery will take place, as the bad sentiment might further delay rates from reaching healthier levels in the medium term.
020406080100120140160
500600700800900
1,0001,1001,2001,3001,4001,500
no. Fixtures
Inde
x
Baltic Dry
p The Baltic Dry Index closed on Friday the 8th of March at 843 points with a weekly gain of 67 points or 8.6% over previous week’s closing. (Last Friday’s the 1st of March closing value was recorded at 776 points).
0
5
10
15
20
1,000
1,500
2,000
2,500
3,000
no. Fixtures
Inde
x
Capesize
CAPESIZE MARKET - p The Baltic Cape Index closed on Friday the 8th of March at 1,262 points with a weekly gain of 19 points. For this week we monitor a 1.5% change on a week-on-week comparison, as Last Friday’s the 1st of March closing value was 1,243 points). It is worth noting that the annual average of 2011 for the Cape Index is currently calculated at 1,399 points, while the average for the year 2010 was 1,571 points.

Monday, March 11, 2013 (Week 11)Capital Link Shipping Weekly Markets Report
Page 17
SHIPPING MARKETS
Dry Bulk Market - Weekly HighlightsWeek No. of
FixturesHighest Fixture
Lowest Fixture
this week 8 $13,500 $4,300last week 4 $22,750 $4,250
Week Period Charter Trip Charterthis week $10,333 $8,150last week $9,800 $11,500
For Week 10 we have recorded a total of 8 timecharter fixtures in the Capesize sector, 3 for period charter averaging $10,333 per day, while 5 trip charters were reported this week with a daily average of $8,150 per day.
This week’s fixture that received the lowest daily hire was the M/V ‘’FRONTIER NEIGE’’, 181000 dwt, built 2011, dely aps Newport News 21/30 Mar , redely Rotterdam, $4300, EdF, for a trip, 330000 bb 50$ improved from last week, and the fixture with the highest daily hire was the M/V ‘’SIDERIS G.S.’’, 174186 dwt, built 2006, dely CJK 10/20 Mar, redely worldwide, $13500, Cargill, for a 21/27 months trading -9250$ reduced from last week.
The BCI is showing a 1.5% gain on a weekly comparison, a -15.0% decrease on a 1 month basis, a -43.7% decrease on a 3 month basis, a 7.7% gain on a 6 month basis and a -12.9% decrease on a 12 month basis.
01020304050607080
250
750
1,250
1,750
2,250
no. Fixtures
Inde
x
Panamax
PANAMAX MARKET - p The Baltic Panamax Index closed on Friday the 8th of March at 1,124 points having gained 88 points on a weekly comparison. It is worth noting that last Friday’s the 1st of March saw the Panamax index close at 1,036 points. The week-on-week change for the Panamax index is calculated to be 8.5%, while the yearly average for the Baltic Panamax Index for this running year is calculated at 801 points while the average for 2010 was 965 points.
Week No. of Fixtures Highest Fixture
Lowest Fixture
this week
42 $16,500 $7,500
last week
39 $18,000 $7,500
Week Period Charter Trip Charterthis week $9,788 $10,233last week $9,792 $11,036
For Week 10 we have recorded a total of 42 timecharter fixtures in the Panamax sector, 12 for period charter averaging $9,788 per day, while 30 trip charters were reported this week with a daily average of $10,233 per day.
The daily earnings differential for the Panamaxes, that we calculate from all this week’s reported fixtures, i.e. the difference between the lowest and highest reported fixture for this week was reduced, and this week’s fixture that received the lowest daily hire was the M/V ‘’ROSCO BANYAN’’, 74979 dwt, built 2010, dely Zhoushan 7/10 Mar , redely Nanjing, $7500, Torm, for a trip via Indonesia 0$ improved from last week, and the fixture with the highest daily hire was the M/V ‘’TIAN ZHU FENG’’, 74201 dwt, built 2000, dely Santos 11/16 Mar , redely Singapore-Japan, $16500, Chart Not Rep, for a trip, 650000 bb -1500$ reduced from last week.
The BPI is showing a 8.5% gain on a weekly comparison, a 71.1% gain on a 1 month basis, a 13.1% gain on a 3 month basis, a 52.9% gain on a 6 month basis and a 13.5% gain on a 12 month basis.
05101520253035404550
500
1,000
1,500
2,000
2,500
no Fixtures
Inde
x
Supramax
SUPRAMAX & HANDYMAX MARKET - p The Baltic Supramax Index closed on Friday the 8th of March at 864 points up with a weekly gain of 83 points or 10.6%. The Baltic Supramax index on a weekly comparison is with an upward trend as last Friday’s the 1st of March closing value was 781 points. The annual average of the BSI is recorded at 724 points while the average for 2010 was 906 points.

Monday, March 11, 2013 (Week 11)Capital Link Shipping Weekly Markets Report
Page 18
SHIPPING MARKETS
Dry Bulk Market - Weekly HighlightsWeek No. of Fixtures Highest
FixtureLowest Fixture
this week
13 $23,000 $7,100
last week
26 $20,000 $5,000
Week Period Charter Trip Charterthis week $0 $13,727last week $9,250 $11,269
For Week 10 we have recorded a total of 13 timecharter fixtures in the Supramax & Handymax sector, with a daily average of $13,727 per day.
The minimum vs maximum daily rate differential as analyzed from our fixtures database was overall improved and from the reported fixtures we see that this week’s fixture that received the lowest daily hire was the M/V ‘’SHI ZI SHAN’’, 57000 dwt, built 2011, dely Ningbo spot , redely Singapore-Japan, $7100, Chart Not Rep, for a trip via Australia 1350$ improved from last week, and the fixture with the highest daily hire was the M/V ‘’JOSCO JINZHOU’’, 58685 dwt, built 2012, dely USGulf spot , redely Singapore-Japan intention pet coke, $23000, Norden, for a trip 3000$ improved from last week.
The BSI is showing a 10.6% gain on a weekly comparison, a 28.2% gain on a 1 month basis, a 13.7% gain on a 3 month basis, a 0.8% gain on a 6 month basis and a -10.3% decrease on a 12 month basis.
0
2
4
6
8
10
12
250
500
750
1,000
no. Fixtures
Inde
x
Handysize
HANDYSIZE MARKET - p The Baltic Handysize Index closed on Friday the 8th of March with an upward trend at 483 points with a weekly gain of 36 points and a percentage change of 8.1%. It is noted that last Friday’s the 1st of March closing value was 447 points and the average for 2011 is calculated at 444 points while the average for 2010 was 518 points.
Week No. of Fixtures Highest Fixture
Lowest Fixture
this week
3 $15,000 $9,000
last week
0 $0 $0
Week Period Charter Trip Charterthis week $9,000 $13,500last week $0 $0
For Week 10 we have recorded a total of 3 timecharter fixtures in the Handysize sector, 1 for period charter averaging $9,000 per day, while 8 trip charters were reported this week with a daily average of $13,500 per day.
The minimum vs maximum daily rate differential as analyzed from our fixtures database was overall improved and this week’s fixture that received the lowest daily hire was the M/V ‘’DARYA JAMUNA’’, 36845 dwt, built 2012, dely CJK 9 March, redely worldwide, $9000, Ultrabulk, for a about 3/max 5 months trading 1850$ improved from last week and the fixture with the highest daily hire was the M/V ‘’GRACE C’’, 36000 dwt, built 2013, dely Dar-es-Salaam spot , redely Singapore-Japan, $12000, Chart Not Rep, for a trip via South-east Africa 750$ improved from last week.
The BHI is showing a 8.1% change on a weekly comparison, a 12.1% gain on a 1 month basis, a 8.3% gain on a 3 month basis, a 5.2% gain on a 6 month basis and a -5.8% decrease on a 12 month basis.

Monday, March 11, 2013 (Week 11)Capital Link Shipping Weekly Markets Report
Page 19
SHIPPING MARKETS
Weekly Tanker Market OpinionContributed by
Poten & Partners, Inc.805 Third AvenueNew York, NY 10022
Phone: (212) 230-2000Website: www.poten.com
Opportunity for Recovery of Venezuelan Oil Production?Hugo Chavez’s death earlier this week was notable from several perspectives, not the least of which is from that of global crude oil production. His time in office, beginning in 1999, saw the implementation of a series of provocative policies. Viewing Venezuela’s main geopolitical leverage to be its status as one of the world’s larger oil exporters, several of these policies were aimed at centralizing control of Venezuela’s crude oil. Unfortunately, the execution of this ambition – and the associated lack of foreign investment – resulted in increasingly inefficient production as the country largely fell behind from technological and institutional knowledge standpoints.
Crude oil production did in fact fall substantially after Chavez entered office. Despite an increasingly positive assessment of the country’s proven reserves, significant production growth has failed to materialize as total production volume remains about 17% below its pre-Chavez level.
0
50
100
150
200
250
300
350
0.0
0.5
1.0
1.5
2.0
2.5
3.0
3.5
1995 1997 1999 2001 2003 2005 2007 2009 2011 2013
Prov
en R
eser
ves
(bn
bbl)
Prod
uctio
n (m
mbp
d)
Venezuelan Crude Oil Production and ReservesAnnual Data
Proven Reserves Production
Source: Oil and Gas Journal
While most analysts’ assessments of the situation conclude that production should be largely unaffected in the near term, Venezuela has the option to liberalize policies towards foreign investment. Such a move could bring production efficiency more in line with levels seen elsewhere.
Though partially constrained by OPEC production quotas, an obvious question arises from the notion of increased Venezuelan crude oil output: to where would this additional volume be exported? North America and Asia have been the two most common destinations in the recent past for non-Latin American exports.
0.0
0.5
1.0
1.5
2.0
2.5
2004 2005 2006 2007 2008 2009 2010 2011
Expo
rts (
mm
bpd)
Venezuelan Crude Oil ExportsAnnual Data, by Destination
Europe North America Asia/Pacific Latin America Other
Source: OPEC
However, Venezuelan exports to the United States have steadily declined as heavier grade oil sands production continues to ramp up in Canada. Asia, with an increasing number of refineries that are able to process heavier grades of crude oil, has captured a greater share of Venezuelan exports. Other countries in Latin America, bolstered by post-financial crisis macroeconomic growth and a desire by President Chavez to curry favor in the region, have likewise shown greater demand for Venezuelan crude.
Monday, March 11, 2013 (Week 11)Capital Link Shipping Weekly Markets Report
Page 20
SHIPPING MARKETS
Weekly Tanker Market Opinion
0
50
100
150
200
250
300
Jan-10 Jul-10 Jan-11 Jul-11 Jan-12 Jul-12 Jan-13
Impo
rts (
mm
bbl
s)
US Crude Oil Imports, ex-VenezuelaMonthly Data
Source: Poten
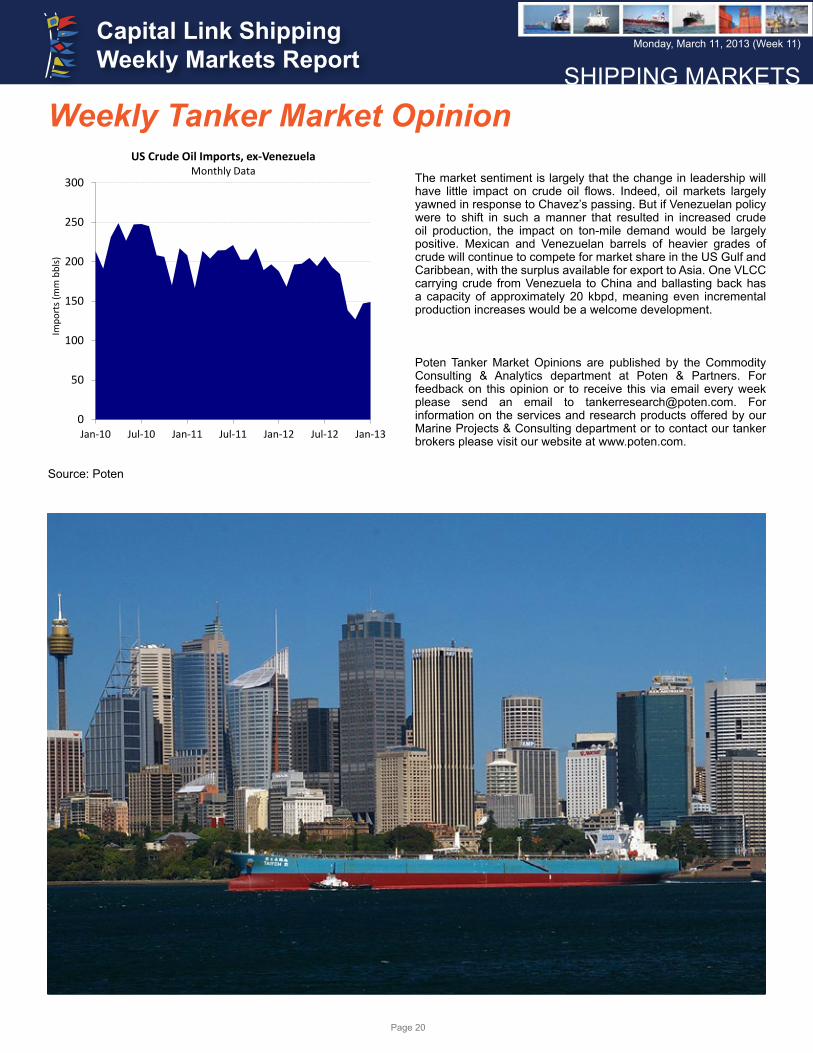
The market sentiment is largely that the change in leadership will have little impact on crude oil flows. Indeed, oil markets largely yawned in response to Chavez’s passing. But if Venezuelan policy were to shift in such a manner that resulted in increased crude oil production, the impact on ton-mile demand would be largely positive. Mexican and Venezuelan barrels of heavier grades of crude will continue to compete for market share in the US Gulf and Caribbean, with the surplus available for export to Asia. One VLCC carrying crude from Venezuela to China and ballasting back has a capacity of approximately 20 kbpd, meaning even incremental production increases would be a welcome development.
Poten Tanker Market Opinions are published by the Commodity Consulting & Analytics department at Poten & Partners. For feedback on this opinion or to receive this via email every week please send an email to [email protected]. For information on the services and research products offered by our Marine Projects & Consulting department or to contact our tanker brokers please visit our website at www.poten.com.

Monday, March 11, 2013 (Week 11)Capital Link Shipping Weekly Markets Report
Page 21
SHIPPING MARKETS
Weekly Freight Rate & Asset TrendsContributed by
IntermodalIntermodal Shipbrokers Co.17th km Ethniki Odos Athens-Lamia &3 Agrambelis Street,145 64 N. Kifisia,Athens - Greece
Phone: +30 210 6293300Website: www.intermodal.gr
Dry Bulk Market – Weekly Highlights
www.intermodal.gr Intermodal Shipbrokers - Capital Link – Weekly Dry Bulker Report 6
Tanker Spot Rates
Vessel Routes Week 10 Week 9
$/day ±%
2013 2012 WS
points $/day WS points $/day $/day $/day
VLC
C 265k AG-JAPAN 32 3,615 32 3,234 11.8% 1,685 21,835
280k AG-USG 19 -13,966 19 -15,434 9.5% -2,294 1,604
260k WAF-USG 40 20,559 35 11,718 75.4% 4,609 31,457
Suez
max
130k MED-MED 70 23,950 70 23,708 1.0% 3,550 22,121
130k WAF-USAC 58 10,239 58 10,249 -0.1% 1,753 13,373
130k AG-CHINA 60 13,937 63 15,965 -12.7% 3,379 22,181
Afr
amax
80k AG-EAST 80 10,296 80 10,249 0.5% 2,039 14,182
80k MED-MED 85 16,522 80 13,527 22.1% 2,674 13,700
80k UKC-UKC 90 19,246 88 17,023 13.1% 3,003 18,517
70k CARIBS-USG 118 23,727 118 23,573 0.7% 2,398 12,325
Cle
an
75k AG-JAPAN 93 13,768 88 11,022 24.9 % 1,908 11,258
55k AG-JAPAN 120 16,811 120 16,607 1.2% 2,363 10,867
37K UKC-USAC 150 16,201 150 16,125 0.5% 3,742 9,251
30K MED-MED 160 23,606 163 24,281 -2.8% 5,129 19,062
Dirt
y
55K UKC-USG 110 16,368 110 16,163 1.3% 3,045 16,571
55K MED-USG 105 12,720 100 10,590 20.1% 2,246 14,735
50k CARIBS-USAC 120 16,326 138 22,354 -27.0% 2,781 13,028
Tanker Time Charter Rates
$/day Week
10 Week
9 ±% Diff 2013 2012
VLCC 300k 1yr TC 19,200 19,750 -2.8% -550 20,475 22,375
300k 3yr TC 25,200 26,250 -4.0% -1050 26,250 27,195
Suezmax 150k 1yr TC 16,200 16,750 -3.3% -550 16,925 17,606
150k 3yr TC 18,200 19,250 -5.5% -1050 20,700 21,152
Aframax 110k 1yr TC 13,200 13,500 -2.2% -300 13,900 13,889
110k 3yr TC 15,200 15,750 -3.5% -550 15,650 16,070
Panamax 75k 1yr TC 14,700 15,000 -2.0% -300 14,500 13,245
75k 3yr TC 15,200 15,500 -1.9% -300 15,125 14,368
MR 52k 1yr TC 14,200 14,250 -0.4% -50 14,150 13,764
52k 3yr TC 14,950 15,000 -0.3% -50 14,750 14,589
Handysize 36k 1yr TC 13,200 13,250 -0.4% -50 13,075 12,567
36k 3yr TC 13,700 13,750 -0.4% -50 13,675 13,378
Dry Bulk Market – Weekly Highlights
www.intermodal.gr Intermodal Shipbrokers - Capital Link – Weekly Dry Bulker Report 7
Dry Bulker Time Charter Rates
$/day Week
10 Week
9 ±% Diff 2013 2012
Cap
esiz
e 170K 6mnt TC 10,825 10,500 3.1% 325 11,738 13,549
170K 1yr TC 11,950 11,750 1.7% 200 12,113 13,885
170K 3yr TC 13,700 13,750 -0.4% -50 13,700 15,282
Pana
max
76K 6mnt TC 11,575 11,250 2.9% 325 9,783 11,003
76K 1yr TC 9,825 9,750 0.8% 75 8,675 9,906
76K 3yr TC 9,700 9,750 -0.5% -50 9,125 10,888
Supr
amax
55K 6mnt TC 10,950 10,750 1.9% 200 9,700 11,176
55K 1yr TC 9,950 9,750 2.1% 200 9,200 10,330
55K 3yr TC 9,950 10,000 -0.5% -50 9,800 11,195
Han
dym
ax
45k 6mnt TC 8,950 8,750 2.3% 200 7,950 9,375
45k 1yr TC 8,450 8,250 2.4% 200 7,900 8,849
45k 3yr TC 8,950 9,000 -0.6% -50 8,800 9,575
Han
dysi
ze
30K 6mnt TC 7,450 7,000 6.4% 450 6,900 8,255
30K 1yr TC 7,450 7,250 2.8% 200 7,325 8,424
30K 3yr TC 8,700 8,750 -0.6% -50 8,700 9,450
Dry Bulk Market – Weekly Highlights
www.intermodal.gr Intermodal Shipbrokers - Capital Link – Weekly Dry Bulker Report 8
Secondhand Indicative Market Values ($ Million) - Tankers
Vessel 5yrs old Mar-13 Feb-13 ±% 2013 2012 2011
VLCC 300KT DH 56.5 57.0 -0.9% 57.2 62.9 77.6
Suezmax 150KT DH 40.0 40.0 0.0% 40.3 44.9 54.4
Aframax 110KT DH 27.3 27.5 -0.9% 27.7 31.2 39.1
Panamax 75KT DH 25.0 25.0 0.0% 25.3 26.7 35.2
MR 52KT DH 25.0 25.0 0.0% 24.7 24.6 28.4
Secondhand Indicative Market Values ($ Million) - Bulk Carriers
Vessel 5yrs old Mar-13 Feb-13 ±% 2013 2012 2011
Capesize 180k 34.0 33.8 0.7% 33.7 34.6 43.5
Panamax 76K 18.5 18.5 0.0% 18.6 22.7 31.3
Supramax 56k 18.5 18.5 0.0% 19.3 23.0 28.1
Handysize 30K 17.0 17.0 0.0% 16.9 18.2 23.5
New Building Indicative Market Prices (million$)
Vessel Week
10 Week
9 ±% 2013 2012 2011
Bul
kers
Capesize 180k 46.0 45.5 1.1% 45 47 53 Panamax 77k 25.3 25.3 0.0% 25 27 33 Supramax 58k 24.3 24.3 0.0% 24 26 30 Handysize 35k 21.0 21.0 0.0% 21 22 25
Tank
ers
VLCC 300k 90.5 91.0 -0.5% 90 96 102 Suezmax 160k 55.5 55.5 0.0% 55 59 64 Aframax 115k 46.5 46.5 0.0% 46 51 54 LR1 75k 40.0 40.0 0.0% 40 43 45 MR 52k 33.0 33.0 0.0% 33 35 36
Gas
LNG 150K 185.0 185.0 0.0% 181 186 187 LGC LPG 80k 69.5 69.5 0.0% 69 72 73 MGC LPG 52k 61.5 61.5 0.0% 61 63 64 SGC LPG 23k 40.5 40.5 0.0% 40 44 46
Monday, March 11, 2013 (Week 11)Capital Link Shipping Weekly Markets Report
Page 22
SHIPPING MARKETS
Contributed by
Braemar Seascope35 Cosway StreetLondon NW1 5BTUnited Kingdom
Phone: +44 (0) 20 7535 2650Website: www.braemarseascope.com
Container Market - Weekly Highlights
Braemar Seascope Containers - London - Singapore - Shanghai S&P email: [email protected] Chartering email: [email protected]
London: Nick Hubbard, Graham Booth, Ben Jeans, Ranulf Swallow, Lily Gao, Peyton Broer, Bill Price and James Klonaris Singapore: James Buck, Roy Edkins, Ming Xiang Ling and Tanja Friese Shanghai: Axel Huang
Research: Jonathan Roach Post Fixture: Reka Choy www.braemarseascope.com
Every effort as been made to ensure the information contained within this report is accurate, Braemar Seascope cannot accept responsibility for error, omission or consequence therefrom
Braemar Seascope Containers The Monday Morning Container Briefing 11th March 2013
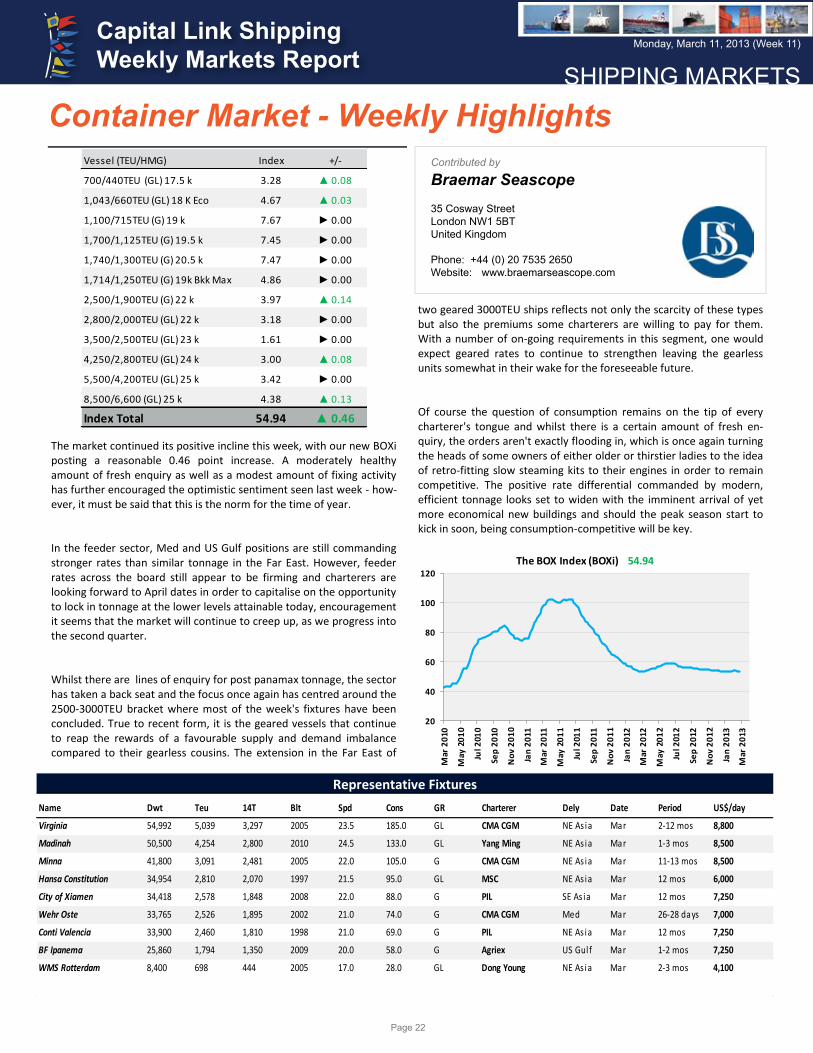
The market continued its positive incline this week, with our new BOXi posting a reasonable 0.46 point increase. A moderately healthy amount of fresh enquiry as well as a modest amount of fixing activity has further encouraged the optimistic sentiment seen last week - how-ever, it must be said that this is the norm for the time of year. In the feeder sector, Med and US Gulf positions are still commanding stronger rates than similar tonnage in the Far East. However, feeder rates across the board still appear to be firming and charterers are looking forward to April dates in order to capitalise on the opportunity to lock in tonnage at the lower levels attainable today, encouragement it seems that the market will continue to creep up, as we progress into the second quarter. Whilst there are lines of enquiry for post panamax tonnage, the sector has taken a back seat and the focus once again has centred around the 2500-3000TEU bracket where most of the week's fixtures have been concluded. True to recent form, it is the geared vessels that continue to reap the rewards of a favourable supply and demand imbalance compared to their gearless cousins. The extension in the Far East of
two geared 3000TEU ships reflects not only the scarcity of these types but also the premiums some charterers are willing to pay for them. With a number of on-going requirements in this segment, one would expect geared rates to continue to strengthen leaving the gearless units somewhat in their wake for the foreseeable future. Of course the question of consumption remains on the tip of every charterer's tongue and whilst there is a certain amount of fresh en-quiry, the orders aren't exactly flooding in, which is once again turning the heads of some owners of either older or thirstier ladies to the idea of retro-fitting slow steaming kits to their engines in order to remain competitive. The positive rate differential commanded by modern, efficient tonnage looks set to widen with the imminent arrival of yet more economical new buildings and should the peak season start to kick in soon, being consumption-competitive will be key.
Chartering
Representative Fixtures
Vessel (TEU/HMG) Index +/-
700/440TEU (GL) 17.5 k 3.28 ▲ 0.08
1,043/660TEU (GL) 18 K Eco 4.67 ▲ 0.03
1,100/715TEU (G) 19 k 7.67 ► 0.00
1,700/1,125TEU (G) 19.5 k 7.45 ► 0.00
1,740/1,300TEU (G) 20.5 k 7.47 ► 0.00
1,714/1,250TEU (G) 19k Bkk Max 4.86 ► 0.00
2,500/1,900TEU (G) 22 k 3.97 ▲ 0.14
2,800/2,000TEU (GL) 22 k 3.18 ► 0.00
3,500/2,500TEU (GL) 23 k 1.61 ► 0.00
4,250/2,800TEU (GL) 24 k 3.00 ▲ 0.08
5,500/4,200TEU (GL) 25 k 3.42 ► 0.00
8,500/6,600 (GL) 25 k 4.38 ▲ 0.13
Index Total 54.94 ▲ 0.46
20
40
60
80
100
120
Mar
201
0
May
201
0
Jul 2
010
Sep
2010
Nov
201
0
Jan
2011
Mar
201
1
May
201
1
Jul 2
011
Sep
2011
Nov
201
1
Jan
2012
Mar
201
2
May
201
2
Jul 2
012
Sep
2012
Nov
201
2
Jan
2013
Mar
201
3
The BOX Index (BOXi) 54.94
Name Dwt Teu 14T Blt Spd Cons GR Charterer Dely Date Period US$/day
Virginia 54,992 5,039 3,297 2005 23.5 185.0 GL CMA CGM NE As ia Mar 2-12 mos 8,800
Madinah 50,500 4,254 2,800 2010 24.5 133.0 GL Yang Ming NE As ia Mar 1-3 mos 8,500
Minna 41,800 3,091 2,481 2005 22.0 105.0 G CMA CGM NE As ia Mar 11-13 mos 8,500
Hansa Constitution 34,954 2,810 2,070 1997 21.5 95.0 GL MSC NE As ia Mar 12 mos 6,000
City of Xiamen 34,418 2,578 1,848 2008 22.0 88.0 G PIL SE As ia Mar 12 mos 7,250
Wehr Oste 33,765 2,526 1,895 2002 21.0 74.0 G CMA CGM Med Mar 26-28 days 7,000
Conti Valencia 33,900 2,460 1,810 1998 21.0 69.0 G PIL NE As ia Mar 12 mos 7,250
BF Ipanema 25,860 1,794 1,350 2009 20.0 58.0 G Agriex US Gulf Mar 1-2 mos 7,250
WMS Rotterdam 8,400 698 444 2005 17.0 28.0 GL Dong Young NE As ia Mar 2-3 mos 4,100
Braemar Seascope Containers - London - Singapore - Shanghai S&P email: [email protected] Chartering email: [email protected]
London: Nick Hubbard, Graham Booth, Ben Jeans, Ranulf Swallow, Lily Gao, Peyton Broer, Bill Price and James Klonaris Singapore: James Buck, Roy Edkins, Ming Xiang Ling and Tanja Friese Shanghai: Axel Huang
Research: Jonathan Roach Post Fixture: Reka Choy www.braemarseascope.com
Every effort as been made to ensure the information contained within this report is accurate, Braemar Seascope cannot accept responsibility for error, omission or consequence therefrom
Braemar Seascope Containers The Monday Morning Container Briefing 11th March 2013
The market continued its positive incline this week, with our new BOXi posting a reasonable 0.46 point increase. A moderately healthy amount of fresh enquiry as well as a modest amount of fixing activity has further encouraged the optimistic sentiment seen last week - how-ever, it must be said that this is the norm for the time of year. In the feeder sector, Med and US Gulf positions are still commanding stronger rates than similar tonnage in the Far East. However, feeder rates across the board still appear to be firming and charterers are looking forward to April dates in order to capitalise on the opportunity to lock in tonnage at the lower levels attainable today, encouragement it seems that the market will continue to creep up, as we progress into the second quarter. Whilst there are lines of enquiry for post panamax tonnage, the sector has taken a back seat and the focus once again has centred around the 2500-3000TEU bracket where most of the week's fixtures have been concluded. True to recent form, it is the geared vessels that continue to reap the rewards of a favourable supply and demand imbalance compared to their gearless cousins. The extension in the Far East of
two geared 3000TEU ships reflects not only the scarcity of these types but also the premiums some charterers are willing to pay for them. With a number of on-going requirements in this segment, one would expect geared rates to continue to strengthen leaving the gearless units somewhat in their wake for the foreseeable future. Of course the question of consumption remains on the tip of every charterer's tongue and whilst there is a certain amount of fresh en-quiry, the orders aren't exactly flooding in, which is once again turning the heads of some owners of either older or thirstier ladies to the idea of retro-fitting slow steaming kits to their engines in order to remain competitive. The positive rate differential commanded by modern, efficient tonnage looks set to widen with the imminent arrival of yet more economical new buildings and should the peak season start to kick in soon, being consumption-competitive will be key.
Chartering
Representative Fixtures
Vessel (TEU/HMG) Index +/-
700/440TEU (GL) 17.5 k 3.28 ▲ 0.08
1,043/660TEU (GL) 18 K Eco 4.67 ▲ 0.03
1,100/715TEU (G) 19 k 7.67 ► 0.00
1,700/1,125TEU (G) 19.5 k 7.45 ► 0.00
1,740/1,300TEU (G) 20.5 k 7.47 ► 0.00
1,714/1,250TEU (G) 19k Bkk Max 4.86 ► 0.00
2,500/1,900TEU (G) 22 k 3.97 ▲ 0.14
2,800/2,000TEU (GL) 22 k 3.18 ► 0.00
3,500/2,500TEU (GL) 23 k 1.61 ► 0.00
4,250/2,800TEU (GL) 24 k 3.00 ▲ 0.08
5,500/4,200TEU (GL) 25 k 3.42 ► 0.00
8,500/6,600 (GL) 25 k 4.38 ▲ 0.13
Index Total 54.94 ▲ 0.46
20
40
60
80
100
120
Mar
201
0
May
201
0
Jul 2
010
Sep
2010
Nov
201
0
Jan
2011
Mar
201
1
May
201
1
Jul 2
011
Sep
2011
Nov
201
1
Jan
2012
Mar
201
2
May
201
2
Jul 2
012
Sep
2012
Nov
201
2
Jan
2013
Mar
201
3
The BOX Index (BOXi) 54.94
Name Dwt Teu 14T Blt Spd Cons GR Charterer Dely Date Period US$/day
Virginia 54,992 5,039 3,297 2005 23.5 185.0 GL CMA CGM NE As ia Mar 2-12 mos 8,800
Madinah 50,500 4,254 2,800 2010 24.5 133.0 GL Yang Ming NE As ia Mar 1-3 mos 8,500
Minna 41,800 3,091 2,481 2005 22.0 105.0 G CMA CGM NE As ia Mar 11-13 mos 8,500
Hansa Constitution 34,954 2,810 2,070 1997 21.5 95.0 GL MSC NE As ia Mar 12 mos 6,000
City of Xiamen 34,418 2,578 1,848 2008 22.0 88.0 G PIL SE As ia Mar 12 mos 7,250
Wehr Oste 33,765 2,526 1,895 2002 21.0 74.0 G CMA CGM Med Mar 26-28 days 7,000
Conti Valencia 33,900 2,460 1,810 1998 21.0 69.0 G PIL NE As ia Mar 12 mos 7,250
BF Ipanema 25,860 1,794 1,350 2009 20.0 58.0 G Agriex US Gulf Mar 1-2 mos 7,250
WMS Rotterdam 8,400 698 444 2005 17.0 28.0 GL Dong Young NE As ia Mar 2-3 mos 4,100

Monday, March 11, 2013 (Week 11)Capital Link Shipping Weekly Markets Report
Page 23
SHIPPING MARKETS
Tanker Market - Weekly HighlightsContributed by
Charles R. Weber Company, Inc.Charles R. Weber Company, Inc.Greenwich Office Park One,Greenwich CT 06831
Phone: 203 629-2300Website: www.crweber.com
AG-USG VLCC speeds decliningSlow steaming became a normal feature in the VLCC sector following the onset of recessed earnings four years ago. Initially limited to slower ballast speeds, slower ballast speeds quickly followed and have gradually declined since.
On the AG-USG route, through most of 2012, 13.0 knots was normally the laden speed specified in charterparties. More recently, 12.0 knots has become the standard assumption in assessing rates on the route, while a multi-tiered market has emerged whereby a premium to the assessed rate for faster speeds and a discount for slower speeds is become commonplace.
For instance, today’s assessed rate on the AG-USG route is ws18 ( for voyages via the Cape of Good Hope). However, for voyages fixed basis a laden speed of 11.5 knots a 0.5 worldscale point discount is generally applied, while a 0.5 point premium has applied to charters fixed basis 12 knots.
While many have touted the bunker price savings slow steaming offers, we note that most AG-USG voyages are the first leg of a triangulated trading track. The limited ballast time inherent to such trading tracks offers owners little ability to steam down to the lowest reasonable speed at which their units can ballast. Moreover, onward CBS-SPORE voyages have largely continued to be fixed on the basis of a 12.0 knots speed – making the true impact of negotiating slower laden speeds on the initial AG-USG route somewhat limited.
We have compared earnings on triangulated westbound trades basis indicative consumptions on a 0-5 year old VLCC at varying AG-USG speeds while maintaining a consistent speed of 12.0 knots on the CBS-SPORE laden voyage and 10.0 knots on all ballast voyages as follows:
AG-USG Speed: 11.5 Kts 12.0 Kts 12.5 Kts 13.0 KtsAG-USG Rate: ws 17.50 ws 18.00 ws 18.50 ws 19.00
CBS-SPORE Rate: 3,850,000$ 3,850,000$ 3,850,000$ 3,850,000$ Bunker Price ($/MT): 630$ 630$ 630$ 630$
Gross Freight: 6,336,750$ 6,407,800$ 6,478,850$ 6,549,900$ Total Bunker Cost: 4,491,604$ 4,568,539$ 4,639,713$ 4,715,869$
Bunkers as % of Freight: 70.9% 71.3% 71.6% 72.0%Effective TCE: $15,930/day $16,134/day $16,376/day $16,560/day
Total AG/AG Duration (Days): 115.8 114.0 112.3 110.8
Whereas the effective TCE realized in the above scenarios increases with each additional 0.5 knot added (on the basis of additional gross freight), we note that the likely case for owners’ preference for slower speeds relates more closely to the number of days units remain off of Middle East position lists. Given high levels of overcapacity in the Middle East market presently, such a move is certainly understandable, while even the small corresponding savings in bunker prices can be important in a recessed market. We also note that with a greater likely number of waiting days upon completing final ballasts to the Arabian Gulf ultimately offsetting the modestly stronger TCEs achievable by fixing on faster AG-USG speeds, owners are likely to continue to seek slower speeds. Simultaneously, save for date sensitivity in their cargo trades, charterers are likely to continue to favor the lower costs associated with fixing at slower speeds.
Spot Market WSTCE
(R/V)WS TCE (R/V)
VLCC 1-Mar 8-MarAG>USG 280 kMT 18.0 $(14,200) 18.0 $(13,800)AG>SPORE 270 kMT 33.5 $7,900 33.0 $7,000AG>JPN 265 kMT 33.5 $9,500 33.0 $6,200WAFR>USG 260 kMT 35.0 $9,500 35.0 $9,900WAFR>CHINA 260 kMT 33.5 $6,900 35.0 $9,600
SUEZMAXWAFR>USAC 130 kMT 58.0 $12,900 57.5 $12,700B.SEA>MED 135 kMT 72.5 $19,100 70.0 $16,900CBS>USG 130 kMT 75.0 $22,600 85.0 $30,700AFRAMAXN.SEA>UKC 80 kMT 87.5 $16,100 90.0 $18,200AG>SPORE 70 kMT 82.5 $12,900 72.5 $8,000BALT>UKC 100kMT 77.5 $24,700 77.5 $24,800CBS>USG 70 kMT 117.5 $22,700 117.5 $22,900MED>MED 80 kMT 85.0 $14,800 85.0 $15,000PANAMAXCBS>USG 50 kMT 137.5 $23,000 115.0 $12,000CONT>TA 55 kMT 110.0 $14,500 110.0 $14,700ECU>USWC 50 kMT 152.5 $26,000 152.5 $24,900CPPCONT>TA 37 kMT 150.0 $15,700 152.5 $16,400CBS>USAC 38 kMT 120.0 $10,300 120.0 $10,400USG>TA 38 kMT 70.0 $(1,400) 70.0 $(1,300)AG>JPN 35 kMT 127.5 $9,800 129.0 $10,000SPOR>JPN 30 kMT 133.0 $8,300 135.5 $8,800AG>JPN 75 kMT 87.0 $15,100 90.0 $16,500AG>JPN 55 kMT 118.5 $17,800 119.0 $18,000

Monday, March 11, 2013 (Week 11)Capital Link Shipping Weekly Markets Report
Page 24
SHIPPING MARKETS
Tanker Market - Weekly Highlights
Time Charter Market
$/day (theoretical)1 Year 3 Years
VLCC $19,250 $23,000 Suezmax $16,250 $20,250 Aframax $13,500 $15,250 Panamax $13,500 $14,500 MR $13,750 $14,750
THE TANKER MARKETS
VLCCChartering activity in the VLCC market remained strong this week, with total fixtures rising to an 8 week high. Inventory building ahead of an eventual progression from refinery maintenance in the US led the rise, with total VLCC fixtures to points in the US reaching the highest level since mid-November – while it is worth noting that total Suezmax cargoes bound for the US reached the highest level since January 2012. While the stronger levels of activity on the long-haul VLCC routes servicing US-bound cargoes (plus one bound for the Canadian East Coast) may contribute to a modestly improved supply/demand position and rate environment during 2Q13, there was a negligible immediate impact on rates given the high levels of overcapacity.
Middle EastRates in the Middle East market fluctuated this week with the start of the week bringing some softening from last week’s levels. Ultimately, rates pared earlier losses towards the end of the week on strong levels of activity. Rates on the AG-FEAST routes ultimately posted a 1 point gain, w/w, to an average of ws33.1. The small uptick, combined with lower bunker prices, saw corresponding TCEs gain ~$2,400/day, w/w, to an average of ~$7,700/day. Rates to the USG eased slightly from last week’s assessed rates, falling 0.2 point, w/w, to an observed average of ws17.8. The modest decline of AG-USG rates, combined with a softer ex-CBS market offset declining bunker prices and saw triangulated westbound trade earnings ease ~$1,300/day, w/w, to an average of ~$13,900/day. To date, 85 March cargoes have been covered, leaving a further 33-35 remaining. Against this, 50 units are projected to be available through end-month dates. The resultant number of carryover units will likely continue to weigh on the market, making further rate gains difficult – though an extension of the level of activity observed this week will likely limit rate downside. Thus, failing a surprisingly longer March program, rates should remain stagnant around present levels.
Atlantic BasinThe pace of fresh activity in the Atlantic basin eased this week, with just 9 fresh fixtures reported. Ex-West Africa rates posted a small uptick in correlation to the slight gains observed in the Middle East market. Rates on the WAFR-FEAST route gained 0.5 point, w/w, to an average of ws35.5. TCEs on the route averaged ~$10,600/day. The Caribbean basin was softer on reduced activity with the CBS-SPORE route shedding $150k, w/w, to an average of $3.85m lump sum. Little change is expected during the week ahead.
SuezmaxThe West Africa market saw the highest weekly fixture count since late December, but with Black Sea fixtures moderating and overall availabilities remaining in excess of demand, prevailing sentiment remained negative. Rates on the WAFR-USAC route eased 1.5 points to close at ws57.5 while the BSEA-MED route shed 2.5 points to conclude at ws70.
The Caribbean Suezmax market remained strong as availabilities were generally tighter due to weather and other delays while strong Aframax rates held up interest in the larger tankers. The CBS-USG route ultimately gained 10 points to conclude at ws85.
AframaxDespite moderating levels of fresh activity in the Caribbean Aframax market, rates remained strong throughout the week as overall availability was constrained by recent delay issues around the USG area. The CBS-USG route traded unchanged at the ws117.5 level. Though a more flexible position list is expected to materialize in the near term, as laycans progress towards April dates activity is expected to rise on the back of a progression by USG-area refineries from seasonal maintenance periods. Thus, while rates are expected to moderate from present levels, near term downside is likely to be limited. PanamaxThe Caribbean Panamax market saw rates correct strongly from last week’s levels on the back of slowing activity and a lengthening list of available units. The CBS-USG route lost 22.5 points, concluding at ws115. With the Caribbean Panamax market now yielding TCEs about $2,700/day below those achievable in the European markets, further downside in the Caribbean is likely to be limited given the more stable rate environment in Europe and the prospects (argued or actual) for units to ballast from the Caribbean.
CPPThe USG MR market was unchanged throughout the week with the USG-TA route holding at the ws70 level as relatively strong fixture activity levels countered a generally ample list of available units. Despite a stable demand outlook, sentiment appears to be building on the fact that some private fixtures appeared to have materialized this week, with the uncertainty surrounding this keeping owners relatively bullish. The CBS-USAC route was also unchanged at the ws120 level.
The Continent market saw steady activity, as cargoes bound for West Africa and elsewhere countered less certain trans-Atlantic arbitrage opportunities. The CONT-TA route ultimately posted a 2.5 points gain to conclude at ws152.5. Sustained activity during the week ahead should see rates hold around present levels with some potential for further modest gains.

Monday, March 11, 2013 (Week 11)Capital Link Shipping Weekly Markets Report
Page 25
SHIPPING MARKETS
S&P Secondhand, Newbuilding & Demolition MarketsContributed by
Golden Destiny S.A. Golden Destiny S.A.57 Akti Miaouli, Piraeus, 18536,Greece
Phone: +30 210 4295000Website: www.goldendestiny.gr
Key: (*) Incl. Crude Oil, Clean & Dirty Products, Chemical, Asphalt & Veg. Oil,
(**) incl. LPG, LNG, (***) incl. Multi-purpose and Tweendeckers,
(*****) incl. Bulk-Ore, Ore-Oil and Bulk-Oil carriers,
(*****) incl. Ro-Ro Cargo, Ro-Ro Passenger,
(******) incl. Oil & Drilling Rigs, Tugs, Livestock, Trawlers, Cable/Exploration/Navy/Support Vessels,
The first week of March ended with significant high volume of newbuilding contracts in the bulk carrier segment, mainly for large sized vessel categories, capesize, kamsarmax and panamax, which comes against the struggling picture of freight rates and oversupply issues till the end of 2014.
In the secondhand market, the high pace of investments persists with bulk carriers grasping the lion share of S&P activity. February ended with 11% higher volume of secondhand purchases from previous month and 14% lower volume of newbuilding contracts from the high levels of January. However, the newbuilding business during January-February 2013 recorded 42% increase in the number of vessels ordered from corresponding period in 2012. In the bulk carrier segment, newbuilding activity posted 19% monthly increase in new orders and 71% increase in the tanker segment from a boost of ordering activity for medium range tankers. In the container market, the appetite for post panamax vessels pushed the volume of new order above 20 compared with only 2 fresh contracts, in small vessel categories, during January-February 2012.
Although the newbuilding business showed an upward trend during the first two months of the year, the scrapping activity recorded a lower volume of vessel disposals than last year. During January-February 2013, 166 vessels reported to have been headed to the scrap yard of a total deadweight 7,156,339 tons, which is 25% lower than the levels of a similar period in 2012 in terms of number of vessels and 32% lower in terms of total deadweight scrapped. In the bulk carrier segment, scrapping activity posted 28% lower volume of vessel disposals in the first two months of the year from 2012, while in the tanker segment, the yearly decrease is even sharper of about 53%.
During the first week of March, 50 transactions reported worldwide in the secondhand and demolition market, up by 22% week-on-week with 64% increase in secondhand purchases and 26% lower scrapping volumes. At similar week in 2012, the total S&P activity was standing 35% lower than the current levels, when 37 transactions had been reported and secondhand ship purchasing was 53% lower than the volume of newbuilding orders. This week the secondhand purchasing activity is 10% lower than the newbuilding activity due to strong volume of contracts for bulk carrier newbuildings.
SECONDHAND MARKET
The bulk carrier and tanker segment is on the spotlight with asset prices holding a persistent downward incline. According to Baltic Sale & Purchase Assessment, the purchasing prices for 5yrds old vessels in the bulk carrier segment have shown about 14% annual decrease from March 2012 in the capesize segment and 24% - 22% fall in the panamax and supramax segment respectively. In the tanker segment, the value for a 5yrs old very large crude carrier is now down by 8.4% year-on-year, in the aframax segment, down by 18% year-on-year and 13% down for medium range product vessels.
Overall, 36 vessels reported to have changed hands this week at a total invested capital in the region of US$ 324.65 mil , 10 S&P deals reported at an undisclosed sale price. Tankers and Bulk carriers held the lion share of this week’s S&P activity, by holding 50% of the total number of vessels reported sold. Comparable with previous year, this week’s S&P activity is 80% higher than last year, when 20 vessels induced buyers’ interest at a total invested capital of about $210,5mil with 7 S&P deals in the bulk carrier segment, 11 in the tanker, and 2 in the container. In terms of invested capital, the bulk carrier and tanker segment appear as the most overweight segments with bulk carriers attracting about 36% of the total amount of money invested with an invested capital of about $115.3mil tons and tankers 39% share with an invested capital of about $125,1mil.

Monday, March 11, 2013 (Week 11)Capital Link Shipping Weekly Markets Report
Page 26
SHIPPING MARKETS
S&P Secondhand, Newbuilding & Demolition MarketsNEWBUILDING MARKET
Key:/ * The total invested capital does not include deals reported with undisclosed contract price
** Deals reported as private and confidential (not revealed contract price)
In the newbuilding market, the first days of March ended with firm emerged newbuilding bulk carrier business in Japanese yards in all vessel sizes and strong ordering interest for capesize vessels. Oshima Shipbuilding reported to have won an order for ultramax and panamax bulk carriers, while Tsuneishi Cebu in Philippines gained orders in the kamasarmax, supramax and handymax size. In addition, new established Japanese shipyard, Japan Marine United, is said to have sealed capesize orders from Greek players.
Overall, the week closed with 40 fresh orders reported worldwide at a total deadweight of 2,649,536 tons, posting 167% week-on-week increase from previous week with significant higher volume of contracts in the bulk carrier segment, up by 1600% week-on-week with a total of 23 new contracts. In the offshore segment, the newbuilding business was very quite loosing their first ranking position from bulk carriers. This week’s total newbuilding business is almost at similar levels from similar week’s closing in 2012, when 43 fresh orders had been reported, 17 for bulkers, 2 for tankers, 7 for gas tankers, 6 for containers, 3 passenger/cruise and 8 special projects. In terms of invested capital, the total amount of money invested is estimated in the region of about more than $1,13bn, 13 newbuilding contracts reported at an undisclosed contract price. A hefty amount of money was invested in the bulk carrier segment, due to high volume of contracts in the capesize segment, by holding of more than 36% of the total amount of money invested in new contracts.
In the bulk carrier segment, Oshima Shipbuilding won an order for two ultramax vessels of 60,000dwt from Taiwanese owner, Taiwan Navigation Co, and two panamax vessels of 75,000dwt from Nordic Bulk Carriers A/S of Denmark. In addition, Tsuneishi Cebu in Philippines will construct three kamsarmax vessels of 81,656dwt for Kawasaki Kisen and another three similar units for Mitsui OSK lines, while it will construct for NYK Line, one handymax 45,000dwt vessel and three 58,000dwt vessels.
In the capesize segment, OceanBulk Maritime is said to have placed an order for two 180,000dwt vessels and Carras Hellas also another two similar vessels at Japan Marine United. The newbuilding cost has not revealed but it is estimated in the region of $46mil. In addition, Norwegian Frontline 2012 is said to have inked a letter of intent with Jiangsu New Yangzijiang for the
construction of up to six 180,000dwt vessels, 4 with option 2 units, but price and delivery dates have not been disclosed. Furthermore, Japanese shipbuilder Mitsubish HI won an order from China Steel Express of Taiwan for two 200,000dwt capesize bulkers to be built at its Nagasaki yard. The delivery of these vessels is scheduled for second half 2014 and first half 2015, while the newbuilding cost is estimated in the region of $52,5per vessel.
In the kamsarmax segment, Oceanbulk of Greece also confirmed ordering two kamsarmax vessels at Japan Marine United for delivery in 2014.
In the tanker segment, Croatia’s shipyard 3 Maj has signed a letter of intent with the Swedish shipping company Wisby Tankers to build six tankers for the transport of crude and oil products, according to the local business news portal SEEBiz.
In the aframax segment, Scorpio Tankers sealed a contract for the construction of two 114,000dwt eco product tankers at Hyundai Samho HI of South Korea for delivery in the third quarter of 2014 at a newbuilding cost of $49,75mil each. The contract includes fixed price option for the construction of two additional LR2 vessels.
In the gas tanker segment, China Shanghai Waigaoqiao Shipyard won an order for the construction of two LPG carriers from Norwegian owner, IM Skaugen, for delivery June and December 2015 at a newbuilding cost of about $46mil each. The contract includes an option of two more vessels and they will be the first LPG carriers to be built by SWS yard. The vessels will have gas capacity of 17,000cum and will be powered by LNG and carry ethylene. In addition, Brave Maritime is said to have signed a contract for the construction of two 7,200cbm pressurized LPG vessels at Japan’s Kyokuyo Shipyard for delivery in the first half of 2014 at a newbuilding cost of $22mil each.
In the Ro-Ro segment, Croatian shipowner Jadrolinija has awarded the construction of its four 616 passenger, 145-vehicle ro-ros to local shipbuilder Uljanik Shipyard with delivery in 2014 at a newbuilding cost of $42mil each.
In the offshore segment, Seadrill has exercised its options on another pair of high specification jack-up drilling rigs at Chinese shipyard Dalian Shipbuilding Industry Offshore with delivery in 3Q15 and 4Q15 at a total cost of about $230m. The two latest jack-ups will be based on the F&G JU2000E design and have a water-depth capacity 400 feet with a 30,000 feet drilling depth. Fredrik Halvorsen, chief executive officer of Seadrill Management Ltd, said: “The two jack-up newbuilds are ordered in-line with our customers preference for high specification jack-up drilling rigs and a strengthening jack-up drilling market. “We continue to see solid demand for this asset class with both day rates and contract duration increasing. These two new orders will increase Seadrill’s jack-up fleet to 28 units and strengthen our position as the largest operator of modern high specification drilling units.”
DEMOLITION MARKET
In the demolition market, the downward revision of scrap price persists in the Indian subcontinent region with India still dominating after the announcement of its budget with no surprises. In Bangladesh, the activity is not fierce with a series of violent actions last week bringing demolition business to almost virtual standstill. In Pakistan, the announcement for a 5% increase in taxes on
Monday, March 11, 2013 (Week 11)Capital Link Shipping Weekly Markets Report
Page 27
SHIPPING MARKETS
incoming vessel put a halt on the scrapping appetite, while Chinese shiprecyclers are still one breath behind in its levels offered against its Indian rivals. Benchmark prices now in India are $400/ldt for dry/general, which is $15/ldt more than last week, and $425/ldt for wet cargo, while in China, $375/ldt for dry/general and $400/ldt for wet cargo. This week, China reported to have paid $391/ldt for a bulker M/V “PACIFIC BANGHU” with 5,307ldt built 1982.
The week ended with 14 vessels reported to have been headed to the scrap yards of total deadweight 765,200tons. In terms of the reported number of transactions, the demolition activity has been marked with 26% decline from previous week, showing 75% increase in the bulk carrier segment, but 33%, 75% and 100% decline in the number of vessel disposals in the tanker, liner and container segment respectively. In terms of deadweight sent for scrap, there has been 11% increase with 2 capesize bulkers reported for scrap, 1 aframax tanker and one combined carrier.
At a similar week in 2012, demolition activity was up by 21.4% from the current levels, in terms of the reported number of transactions, 17 vessels had been reported for scrap of total deadweight 660,376 tons with bulk carriers grasping 30% of the total number of vessels sent for disposal. India and Bangladesh had been offering $450-$460/ldt for dry and $480-$490/ldt for wet cargo.
GREEK PRESENCE
The first week of March ended with strong presence of Greek owners in the newbuilding market. OceanBulk Maritime is said to have placed an order for two 180,000dwt vessels and Carras Hellas also another two similar vessels at Japan Marine United. In the kamsarmax segment, Oceanbulk of Greece also confirmed ordering two kamsarmax vessels at Japan Marine United for delivery in 2014. In the tanker segment, European Navigation is said to be planning the ordering of a series medium range tankers at STX Offshore & Shibuilding, with no concrete details. In the gas LPG segment, Brave Maritime is said to have signed a contract for the construction of two 7,200cbm pressurized LPG vessels at Japan’s Kyokuyo Shipyard for delivery in the first half of 2014 at a newbuilding cost of $22mil each.
In the secondhand market, Greek owners appeared to have bought one panamax dry bulker built 2005 and one handymax built 2001 for about $27,8mil, in the gas tanker segment, one small LPG with 5,018cum gas capacity built 2006 for about $15mil and in the container segment, two feedermax vessels of about 971TEU built 1998 and 1997 for about $5,5mil.
NEWBUILDING MARKET – ORDERS
BULK CARRIERS –200,000 DWT 2 units ordered by China Steel Express (TWN) at Mitsubish Heavy Industries for its Nagasaki yard (JPN). Price is estimated in the region usd $52,5 mil each. Dely 2h 2014 and 1h 2015 180,000 DWT 2 units ordered by Oceanbulk (GR) at Japan Marine United (JPN). Price is estimated in the region usd $46 mil. Dely 2015 180,000 DWT 2 units ordered by Carras Hellas (GR) at Japan Marine United (JPN). Price is estimated in the region usd $46 mil. Dely 2015 95,000 DWT SELF UNLOADER 1 unit ordered by Oldendorff Carriers (GER) at Jiangsu Eastern
(PRC). Price undisclosed. Dely 6/2015 (Option exercised. Two now ordered) 81,656 DWT 3 units ordered by Kawasaki Kisen (JPN) at Tsuneishi Cebu (PHIL). Price undisclosed. Dely 06/2014, 09/2014, 12/2014 81,656 DWT 3 units ordered by Mitsui OSK (JPN) at Tsuneishi Cebu (PHIL). Price undisclosed. Dely 02/2014, 04/2014, 05/2014 80,000 DWT 2 units ordered Oceanbulk (GR) at Japan Marine United (JPN). Price undisclosed. Dely 2014 (There may be also an option for two more vessels) 75,000 DWT 2 units ordered by Nordic Bulk Carriers A/S (DEN) at Oshima (JPN). Price usd $ 32,5 mil each. Dely 6/2015, 9/2015 (Ice class 1A. Northern Sea route between Russia and China) 60,000 DWT 2 units ordered by Taiwan Navigation Co (TWN) at Oshima (JPN). Price usd $ 27,3 mil each. Dely 9/2015, 12/2015 58,000 DWT 3 units ordered by NYK Line (JPN) at Tsuneishi Cebu (PHIL). Price undisclosed. Dely 2014 (TESS 58) 45,000 DWT 1 unit ordered by NYK Line (JPN) at Tsuneishi Cebu (PHIL). Price undisclosed. Dely 8/2014 (TESS 45)
TANKERS – 114,000 DWT 2 units ordered by Scorpio Tankers (ITL) at Hyundai Samho Heavy Industries (SKR). Price usd $49,75mil each. Dely 3q 2014 (Fuel efficient vessels eco product tankers. The contract includes fixed price option for the construction of two additional LR2 vessels)
GAS TANKERS – 17,000 DWT LNG/ETHYLENE/LPG 2 units ordered by Skaugen IM (NOR) at Shanghai Waigaoqiao (PRC). Price usd $ 46 mil each. Dely 6/2015, 12/2015 (17,000 cum. Option for 2 more. Vessels will be powered by LNG and carry ethylene. First gas carriers to be built by SWS) ABT 7,000 DWT LPG 2 units ordered by Brave Maritime (GR) at Kyokuyo Shipyard (JPN). Price usd $ 22 mil each. Dely first half of 2014 (7,200 cum. including option for more units)
LINERS –3,300 DWT 2 units ordered by Egil Ulvan Rederei AS (NOR) at Fiskerstrand (NOR). Price usd $ 39 mil each. Dely 2014
CONTAINERS –13,000 DWT 1 unit ordered by Dong Young Shipping (SKR) at Hyundai Mipo (SKR). Price usd $ 17.5 mil. Dely 6/2014 (1000 TEU)
RO/RO – RO-RO 4 units ordered by Jadrolinija (CRT) at Ulijanik Shipyard (CRT). Price usd $ 42 mil each. Dely 2014 (616/145 passenger/vehicle capacity)
SPECIAL PROJECTS – JACK-UP DRILLING RIG 2 units ordered by Seadrill (NOR) at Dalian Shipbuilding Industry (PRC). Price total usd $ 230 mil. Dely 3q 2015 and 4q 2015 (Exercised option from a previous pair ordered. The two latest jack-ups will be based on the F&G JU2000E design and have a water-depth capacity 400 feet with a 30,000 feet drilling depth) PLATFORM SUPPLY 2 units ordered by Vroon (NTH) at Ulstein (NOR). Price undisclosed. Dely 1q 2015 ( Option for two more vessels. PX121 design. The Norwegian shipbuilding and maritime design group said the ships will be built at China’s Cosco Guangdong yard, while the shipowner and yard are new customers to Ulstein)
Key: GR: Greece, PRC: China, NOR: Norway, JPN: Japan,DEN: Denmark, CAN: Canada, SWD: Sweden, GER: Germany, TRK: Turkey, NIG: Nigeria, SKR: South Korea, SPORE: Singapore, CYP: Cyprus, Dely: Delivery
S&P Secondhand, Newbuilding & Demolition Markets
Monday, March 11, 2013 (Week 11)Capital Link Shipping Weekly Markets Report
Page 28
Terms of Use & Disclaimer
Content Contributors
This Newsletter is published by Capital Link Media, a division of Capital Link, a New York based Investor Relations and Financial Communications Firm with strategic focus in shipping. Capital Link may work for several shipping companies listed in this Newsletter. This Newsletter may include facts, views, opinions and recommendations of individuals and organizations deemed to be of interest. Neither Capital Link and its affiliates nor the information providers or companies presented guarantee the accuracy, completeness or timeliness of, or otherwise endorse these views, opinions or recommendations, nor do they give investment, financial, legal, accounting, tax advice or any advice of any kind whatsoever, or advocate the purchase or sale of any security or investment. Any user of this Newsletter cannot and should not rely in any way partially or totally upon the information provided herein as the basis for any investment, financial, legal, tax or accounting decision. Any errors or omissions in the write up, translation,
Capital Link Shipping Weekly Markets ReportPublished by Capital Link Media, a division of Capital Link, Inc.
230 Park Avenue - Suite 1536New York, N.Y. 10169 - USA
Phone +1-212-661-7566Fax +1-212-661-7526
E-mail: [email protected] - www.CapitalLinkShipping.com
presentation, transposition or transmission of this information shall not and cannot be made the basis for any claim whatsoever against any officer or employee of Capital Link and its affiliates or any of its content providers. The user of this Newsletter agrees not to imitate, copy, or alter the template and method of presentation and its contents, reproduce, retransmit, disseminate, sell, distribute, publish, broadcast, circulate or commercially exploit the information in any manner without the express consent of Capital Link and its affiliates and content providers; nor to use the information in any illegal manner or for any unlawful purpose. The Newsletter, or parts of it, is not intended for dissemination of information or utilization in jurisdictions where it is inappropriate to access and use the information herein. When in such jurisdictions, it is the responsibility of the users to satisfy themselves that it is permissible for them to access and receive this information and comply with the local regulations.


