CAPITAL FIRST HOME FINANCE LIMITED BALANCE ... from assignment Income from assignment of loans and...
22
- - CAPITAL FIRST HOME FINANCE LIMITED BALANCE SHEET AS AT MARCH 31, 2017 Amounts in Rupees Particulars Note No. As at March 31, 2017 As at March 31, 2016 EQUITY AND LIABILITIES Shareholders' Funds Share Capital 3 663,045,150 663,045,150 Reserves and Surplus 4 251,549,782 187,165,316 914,594,932 850,210,466 Non-current Liabilities Deferred Tax Liability (Net) 5 3,295,831 - Long term borrowings 6 3,744,500,000 2,735,000,000 Other Long term liabilities 7 70,971,472 39,400,062 Long term provisions 8 54,545,786 18,553,664 3,873,313,089 2,792,953,726 Current Liabilities Short term borrowings 9 933,176,248 572,987,603 Trade payables 10 52,398,022 32,287,993 Other current liabilities 11 1,288,852,544 703,136,093 Short term provisions 12 7,249,690 1,120,913 2,281,676,504 1,309,532,602 TOTAL 7,069,584,525 4,952,696,794 ASSETS Non - Current Assets Deferred Tax Asset 5 - 2,442,299 Long term loans and advances 13 6,001,514,709 3,878,879,562 Other non current assets 14 92,007,660 34,064,269 6,093,522,369 3,915,386,130 Current Assets Cash and Bank Balances 15 727,598,618 770,802,225 Short term loans and advances 16 175,786,993 215,440,285 Other current assets 17 72,676,545 51,068,154 976,062,156 1,037,310,664 TOTAL 7,069,584,525 4,952,696,794 Summary of significant accounting policies 2.1 The accompanying notes are an integral part of the Financial Statements As per our report of even date For S.R. BATLIBOI & CO. LLP ICAI Firm Registration No. 301003E/E300005 CAPITAL FIRST HOME FINANCE LIMITED Chartered Accountants per Shrawan Jalan V. Vaidyanathan Apul Nayyar Partner Director Director Membership No. 102102 DIN No. 00082596 DIN No. 01738973 Deepak Kundalia Bhavik Gala Chief Financial Officer Company Secretary Place: Mumbai Place: Mumbai Date : May 09, 2017 Date : May 09, 2017 For and on behalf of the Board of Directors of
Transcript of CAPITAL FIRST HOME FINANCE LIMITED BALANCE ... from assignment Income from assignment of loans and...

- - CAPITAL FIRST HOME FINANCE LIMITED
BALANCE SHEET AS AT MARCH 31, 2017
Amounts in Rupees
Particulars Note No. As at
March 31, 2017
As at
March 31, 2016
EQUITY AND LIABILITIES
Shareholders' Funds
Share Capital 3 663,045,150 663,045,150 Reserves and Surplus 4 251,549,782 187,165,316
914,594,932 850,210,466
Non-current Liabilities
Deferred Tax Liability (Net) 5 3,295,831 - Long term borrowings 6 3,744,500,000 2,735,000,000 Other Long term liabilities 7 70,971,472 39,400,062 Long term provisions 8 54,545,786 18,553,664
3,873,313,089 2,792,953,726
Current Liabilities
Short term borrowings 9 933,176,248 572,987,603 Trade payables 10 52,398,022 32,287,993 Other current liabilities 11 1,288,852,544 703,136,093 Short term provisions 12 7,249,690 1,120,913
2,281,676,504 1,309,532,602
TOTAL 7,069,584,525 4,952,696,794
ASSETS
Non - Current Assets
Deferred Tax Asset 5 - 2,442,299 Long term loans and advances 13 6,001,514,709 3,878,879,562 Other non current assets 14 92,007,660 34,064,269
6,093,522,369 3,915,386,130
Current Assets
Cash and Bank Balances 15 727,598,618 770,802,225 Short term loans and advances 16 175,786,993 215,440,285 Other current assets 17 72,676,545 51,068,154
976,062,156 1,037,310,664
TOTAL 7,069,584,525 4,952,696,794
Summary of significant accounting policies 2.1The accompanying notes are an integral part of the Financial Statements
As per our report of even date
For S.R. BATLIBOI & CO. LLP
ICAI Firm Registration No. 301003E/E300005 CAPITAL FIRST HOME FINANCE LIMITED
Chartered Accountants
per Shrawan Jalan V. Vaidyanathan Apul Nayyar
Partner Director Director
Membership No. 102102 DIN No. 00082596 DIN No. 01738973
Deepak Kundalia Bhavik Gala
Chief Financial Officer Company Secretary
Place: Mumbai Place: MumbaiDate : May 09, 2017 Date : May 09, 2017
For and on behalf of the Board of Directors of

CAPITAL FIRST HOME FINANCE LIMITED
STATEMENT OF PROFIT AND LOSS FOR THE YEAR ENDED MARCH 31, 2017
Amounts in Rupees
Particulars Note No. For the year ended
March 31, 2017
For the year ended
March 31, 2016
Revenue from Operations 18 708,309,080 361,129,524 Other Income 19 3,836,944 40,764,560
Total Revenue 712,146,024 401,894,084
Expenses
Employee benefits expense 20 46,900,318 8,586,438
Finance costs 21 404,812,898 253,396,391 Other expenses 22 163,325,524 46,543,933
Total Expenses 615,038,740 308,526,762
Profit before tax 97,107,284 93,367,322
Tax expense:
- Current tax (includes tax for earlier years Rs. 4,127,557) 26,132,443 36,768,000 - Deferred tax (includes Deferred tax for earlier years Rs. 4,127,557) 5,738,130 (5,854,364) - Tax for earlier years 852,245 34,094
32,722,818 30,947,730
Profit for the year 64,384,466 62,419,592
3
Earnings per equity share: 23 - Basic 0.97 1.17 - Diluted 0.97 1.17
Summary of significant accounting policies 2.1
The accompanying notes are an integral part of the Financial Statements
As per our report of even date
For and on behalf of the Board of Directors of For S.R. BATLIBOI & CO. LLP CAPITAL FIRST HOME FINANCE LIMITED
ICAI Firm Registration No. 301003E/E300005Chartered Accountants
per Shrawan Jalan V. Vaidyanathan Apul Nayyar
Partner Director DirectorMembership No. 102102 DIN No. 00082596 DIN No. 01738973
Deepak Kundalia Bhavik Gala
Chief Financial Officer Company Secretary
Place: Mumbai Place: MumbaiDate : May 09, 2017 Date : May 09, 2017

CAPITAL FIRST HOME FINANCE LIMITED
CASH FLOW STATEMENT FOR THE YEAR ENDED MARCH 31, 2017Amounts in Rupees
ParticularsFor the year ended
March 31, 2017
For the year ended
March 31, 2016
Cash flow from Operating Activities
Profit before tax 97,107,284 93,367,322
Adjustments for:Provision for doubtful loans and advances 29,679,177 1,721,815 Provision for standard assets 8,356,817 6,826,722 Bad loans and trade receivables written off (net of recovery) 82,521,444 8,771,251 Excess provision written back - (1,166,678) Profit on sale of Investments (3,515,891) (39,446,878)
Operating profit before Working Capital changes 214,148,831 70,073,554
Adjustment for changes in working capital:Increase in Trade Payables 20,110,029 22,713,656 Increase in Long term Liabilities 31,571,411 3,341,598 Increase in Short term Liabilities 48,966,451 26,197,484 Decrease in Short term Loans & Advances 39,653,293 (143,472,305) Increase in Long term Loans & Advances (2,192,549,197) (1,652,701,689) Increase in Short term other assets (21,608,390) (25,346,275) Increase in Long term other assets (57,943,392) (9,674,013)
Cash used in Operations (1,917,650,964) (1,708,867,990)
Less: Direct taxes paid (35,507,179) (46,234,537)
Net Cash used in Operating Activities (1,953,158,143) (1,755,102,527)
Cash flow from Investing Activities
Proceeds from sale of current investments 4,399,215,891 2,794,490,566 Purchase of current investments (4,395,700,000) (2,467,400,000)Net assets acquired on merger of subsidiary - 375,499,618
Net cash generated from Investing Activities 3,515,891 702,590,184
Cash flow from Financing Activities
Proceeds from Long term borrowings 2,315,000,000 1,400,558,083 Proceeds from Short term borrowings 6,965,873,317 2,419,478,660 Proceeds from ICD 765,000,000 - Repayment of Long term borrowings (768,750,000) (487,500,000) Repayment of Short term borrowings (6,605,684,672) (1,847,049,140) Repayment of ICD (765,000,000) - Net Cash generated from Financing Activities 1,906,438,645 1,485,487,603
Net (decrease) increase in Cash and Cash Equivalents during the year (43,203,607) 432,975,260
Cash and Cash Equivalents at the beginning of the year 770,802,225 337,826,965
Cash and Cash Equivalents at the end of the year 727,598,618 770,802,225
As at
March 31, 2017
As at
March 31, 2016
Cash and Cash equivalents comprises of :
Cash on hand 8,499,753 3,770,712
Balance with banks:
- in current accounts 719,098,865 767,031,513
Total 727,598,618 770,802,225
Notes:
1
2
As per our report of even date
For S.R. BATLIBOI & CO. LLP For and on behalf of the Board of Directors of
ICAI Firm Registration No. 301003E/E300005 CAPITAL FIRST HOME FINANCE LIMITED
Chartered Accountants
per Shrawan Jalan V. Vaidyanathan Apul Nayyar
Partner Director DirectorMembership No. 102102 DIN No. 00082596 DIN No. 01738973
Deepak Kundalia Bhavik Gala
Chief Financial Officer Company Secretary
Place : Mumbai Place : MumbaiDate : May 09, 2017 Date : May 09, 2017
The above Cash Flow Statement has been prepared under the “Indirect Method “ as set out in Accounting Standard (AS) - 3 'Cash Flow Statements' notified under
section 133 of the Companies Act 2013, read together with Rule 7 of the Companies (Accounts) Rules 2014 and the Companies (Accounting Standards)
Amendment Rules, 2016.
Cash and cash equivalents in the balance sheet comprises of Cash in hand and Cash at bank.

CAPITAL FIRST HOME FINANCE LIMITED
NOTES TO THE FINANCIAL STATEMENTS FOR THE YEAR ENDED MARCH 31, 2017
1
2
2.1
(a)
(b)
(c)
(d)
(e)
(f)
Fee income
Fee income on loan is recognised as income over the tenor of the loan agreements. The unamortized balance is being disclosed as part of
current liabilities. For the agreements foreclosed, balance of processing fees is recognised as income at the time of such foreclosure.
SUMMARY OF SIGNIFICANT ACCOUNTING POLICIES
Profit/ Loss on sale of investments
On disposal of an investment, the difference between its carrying amount and net disposal proceeds is charged or credited to the statement
of profit and loss.
Interest income
Interest income from loans is accounted for by applying interest rate implicit in the contract.
In case of non-performing assets interest income is recognised on receipt basis as per NHB guidelines.
Revenue recognition
Revenue is recognized to the extent that it is probable that the economic benefits will flow to the Company and the revenue can be reliably
measured.
Loans
Loans are stated at the amount advanced, as reduced by the amounts received up to the balance sheet date.
As required by Schedule III, the Company has classified assets and liabilities into current and non-current based on the operating cycle. An
operating cycle is the time between the acquisition of assets for processing and their realisation in cash or cash equivalents. Since in case of
Housing Finance Company normal operating cycle is not readily determinable, the operating cycle has been considered as 12 months.
Income from assignment
Income from assignment of loans and receivables is amortised over the tenure of loans.
Income on retained interest in the assigned asset, if any, is accounted on accrual basis except in case of non-performing assets wherein
interest income is recognised on receipt basis as per NHB prudential norms.
Use of estimates
CORPORATE INFORMATION
Capital First Home Finance Private Limited (the ‘Company’) was incorporated on December 23, 2010. The Company was converted into
Public Company as Capital First Home Finance Limited, a wholly owned subsidiary of Capital First Limited. The Company is engaged in the
business of housing finance without accepting public deposits.
BASIS OF PREPARATION OF FINANCIAL STATEMENTS
The financial statements have been prepared to comply in accordance with the Accounting Standards (‘AS’) notified under section 133 of the
Companies Act, 2013 (the ‘Act') read together with Rule 7 of the Companies (Accounts) Rules, 2014 and the Companies (Accounting
Standards) Amendment Rules, 2016 and other accounting principles generally accepted in India (IGAAP) and as per The National Housing
Bank Act, 1987 and Housing Finance Companies (NHB) Directions, 2010 as amended. The financial statements have been prepared on an
accrual basis and under the historical cost convention. The notified Accounting Standards (AS) are followed by the Company insofar as they
are not inconsistent with the NHB Direction.
Investments that are readily realisable and intended to be held for not more than a year from the date on which such investments are made
are classified as current investments. All other investments are classified as non-current investments. In accordance with the Guidelines
issued by National Housing Bank (NHB), Current investments are carried at lower of cost and fair value determined on an individual
investment basis and Non-Current investments are carried at cost. However, provision for diminution in value is made to recognise a decline
other than temporary in the value of the investments. Unquoted investments in the units of mutual funds are valued at the net asset value as
per guidelines issued by the NHB.
The preparation of financial statements in conformity with Indian Generally Accepted Accounting Principles ("IGAAP") requires the
management to make judgments, estimates and assumptions that affect the reported amounts of revenues, expenses, assets and liabilities
and the disclosure of contingent liabilities, at the end of the reporting period. Although these estimates are based on the management’s best
knowledge of current events and actions, uncertainty about these assumptions and estimates could result in the outcomes requiring a
material adjustment to the carrying amounts of assets or liabilities in future periods.
Current/ Non Current classification of assets and liabilities
Change in estimates
During the year, the Company has changed its accounting estimates related to provisioning for non performing loans. Consequent to the
change in such estimates, provision and write off for the year ended March 31, 2017 is higher by Rs. 15,806,457.
Investments

CAPITAL FIRST HOME FINANCE LIMITED
NOTES TO THE FINANCIAL STATEMENTS FOR THE YEAR ENDED MARCH 31, 2017
(g)
(h)
(i)
(j)
(k) Earnings per share
Tax expense comprises current and deferred tax. Current income-tax is measured at the amount expected to be paid to the tax authorities in
accordance with the Income-tax Act, 1961 enacted in India and tax laws prevailing in the respective tax jurisdictions where the company
operates. The tax rates and tax laws used to compute the amount are those that are enacted or substantively enacted, at the reporting date.
Current income tax relating to items recognized directly in equity is recognized in equity and not in the statement of profit and loss.
Deferred income taxes reflect the impact of timing differences between taxable income and accounting income originating during the current
year and reversal of timing differences for the earlier years. Deferred tax is measured using the tax rates and the tax laws enacted or
substantively enacted at the reporting date. Deferred income tax relating to items recognized directly in equity is recognized in equity and not
in the statement of profit and loss.
Deferred tax liabilities are recognized for all taxable timing differences. Deferred tax assets are recognized for deductible timing differences
only to the extent that there is reasonable certainty that sufficient future taxable income will be available against which such deferred tax
assets can be realized. In situations where the company has unabsorbed depreciation or carry forward tax losses, all deferred tax assets are
recognized only if there is virtual certainty supported by convincing evidence that they can be realized against future taxable profits.
The carrying amount of deferred tax assets are reviewed at each reporting date. The Company writes-down the carrying amount of deferred
tax asset to the extent that it is no longer reasonably certain or virtually certain, as the case may be, that sufficient future taxable income will
be available against which deferred tax asset can be realized. Any such write-down is reversed to the extent that it becomes reasonably
certain or virtually certain, as the case may be, that sufficient future taxable income will be available.
At each reporting date, the company re-assesses unrecognized deferred tax assets. It recognizes unrecognized deferred tax asset to the
extent that it has become reasonably certain or virtually certain, as the case may be, that sufficient future taxable income will be available
against which such deferred tax assets can be realized.
Minimum alternate tax (MAT) paid in a year is charged to the statement of profit and loss as current tax. The company recognizes MAT credit
available as an asset only to the extent that there is convincing evidence that the company will pay normal income tax during the specified
period, i.e., the period for which MAT credit is allowed to be carried forward. In the year in which the company recognizes MAT credit as an
asset in accordance with the Guidance Note on Accounting for Credit Available in respect of Minimum Alternative Tax under the Income-tax
Act, 1961, the said asset is created by way of credit to the statement of profit and loss and shown as “MAT Credit Entitlement.” The company
reviews the “MAT credit entitlement” asset at each reporting date and writes down the asset to the extent the company does not have
convincing evidence that it will pay normal tax during the specified period.
Provisioning / Write-off on assets
Nonperforming loans are written off / provided for, as per management estimates, subject to the minimum provision required as per Housing
Finance Companies (NHB) Directions 2010, as amended.
Provisioning for standard assets:
Provisioning / Write-off on Overdue assets:
Provision on standard assets is made as per the Housing Finance Companies (NHB) Directions 2010, as amended.
Basic earnings per share are calculated by dividing the net profit for the year attributable to equity shareholders by the weighted average
number of equity shares outstanding during the year.
For the purpose of calculating diluted earnings per share, the net profit for the year attributable to equity shareholders and the weighted
average number of shares outstanding during the year are adjusted for the effects of all dilutive potential equity shares.
Borrowing costs
Borrowing costs consists of interest and other ancillary cost that an entity incurs in connection with borrowing of funds. Ancillary costs
incurred in connection with the arrangement of borrowings are amortised over the tenor of borrowings.
Loan origination cost
Loan origination costs such as credit verification, agreement stamping, direct selling agents commission and valuation charges are
recognised as expense over the contractual tenor of the loan agreement. Full month’s amortization is done in the month of booking of loan.
For the agreements foreclosed, the unamortised portion of loan acquisition cost is recognised as charge to the Statement of Profit and Loss
at the time of such foreclose.
Income Taxes

CAPITAL FIRST HOME FINANCE LIMITED
NOTES TO THE FINANCIAL STATEMENTS FOR THE YEAR ENDED MARCH 31, 2017
(l)
(m)
(n) Cash and Cash Equivalents
Cash and Cash Equivalents for the purpose of cash flow statement comprise cash in hand and cash at bank including fixed deposit with
original maturity period of three months and short term highly liquid investments with an original maturity of three months or less.
Provisions
A provision is recognised when the Company has a present obligation as a result of past event; it is probable that outflow of resources will be
required to settle the obligation, in respect of which a reliable estimate can be made. Provisions are not discounted to its present value and
are determined based on best estimate required to settle the obligation at the balance sheet date. These are reviewed at each balance sheet
date and adjusted to reflect the current best estimates.
A contingent liability is a possible obligation that arises from past events whose existence will be confirmed by the occurrence or non-
occurrence of one or more uncertain future events beyond the control of the Company or a present obligation that is not recognized because
it is not probable that an outflow of resources will be required to settle the obligation. A contingent liability also arises in extremely rare cases
where there is a liability that cannot be recognized because it cannot be measured reliably. The Company does not recognize a contingent
liability but discloses its existence in the financial statements.
Contingent liabilities

CAPITAL FIRST HOME FINANCE LIMITED
NOTES TO THE FINANCIAL STATEMENTS FOR THE YEAR ENDED MARCH 31, 2017
Amounts in Rupees
As at
March 31, 2017
As at
March 31, 2016
3 Share Capital:
Authorised:
90,000,000 (Previous Year: 90,000,000) Equity shares of Rs. 10/- each 900,000,000 900,000,000 900,000,000 900,000,000
Issued, subscribed and fully paid up:
66,304,515 (Previous Year: 66,304,515) Equity shares of Rs. 10/- each 663,045,150 663,045,150 663,045,150 663,045,150
a Reconciliation of number of equity shares and amount outstanding at the beginning and at the end of the reporting year:
Number Rs. Number Rs.
At the beginning of the reporting year 66,304,515 663,045,150 36,275,000 362,750,000 Issued during the year (Refer Note No. 32) 30,029,515 300,295,150 Bought back during the reporting year - - - - At the close of the reporting year 66,304,515 663,045,150 66,304,515 663,045,150
b Terms / Rights attached to Equity Shares:
c
Number Rs. Number Rs.
Equity shares of Rs. 10/- eachCapital First Limited (including nominees) 66,304,515 663,045,150 66,304,515 663,045,150
d
Number Rs. Number Rs.
Capital First Limited (including nominees) 66,304,515 663,045,150 66,304,515 663,045,150
As at
March 31, 2017
As at
March 31, 2016 e
30,029,515 Nil
Amounts in Rupees As at
March 31, 2017
As at
March 31, 2016
4 Reserves and Surplus:
a Capital ReserveBalance as per last Balance Sheet 63,774,782 -
Addition during the year (Refer Note No. 32) - 63,774,782
63,774,782 63,774,782
b Statutory Reserve
Balance as per last Balance Sheet 19,956,599 7,472,681 Addition during the year 12,876,893 12,483,918
32,833,492 19,956,599
c Surplus in the Statement of Profit and Loss
Balance as per last Balance Sheet 103,433,935 41,935,577 Add: Addition on Merger - 11,562,684 Add: Net profit for the current year 64,384,466 62,419,592
167,818,401 115,917,853
Less: Appropriations: Transfer to Statutory Reserve (20% of current year) (12,876,893) (12,483,918)
154,941,508 103,433,935
251,549,782 187,165,316
As at
March 31, 2017
Particulars
As per Section 29C of The National Housing Bank Act, 1987
Shares held by the holding company (including nominees):
The Company has only one class of equity shares having a par value of Rs. 10 per share. Each holder of equity shares is entitled to one vote per
share. The dividend, if any is proposed by the Board of Directors and is subject to the approval of the shareholders in the ensuing Annual General
Meeting. In the event of liquidation of Company, the holders of equity shares will be entitled to receive remaining assets of the Company, after
distribution of all preferential amounts. The distribution will be in proportion to the number of equity shares held by the shareholders.
As at
March 31, 2016
Aggregate number of shares issued for a consideration other than cash during
the period of five years immediately preceeding the reporting date
As at
March 31, 2016
Particulars of equity share holders holding more than 5% of the total number of equity share capital:
As at
March 31, 2016
As at
March 31, 2017
As at
March 31, 2017
CAPITAL FIRST HOME FINANCE LIMITED
Amounts in Rupees
As at
March 31, 2017
As at
March 31, 2016
As at
March 31, 2017
As at
March 31, 2016
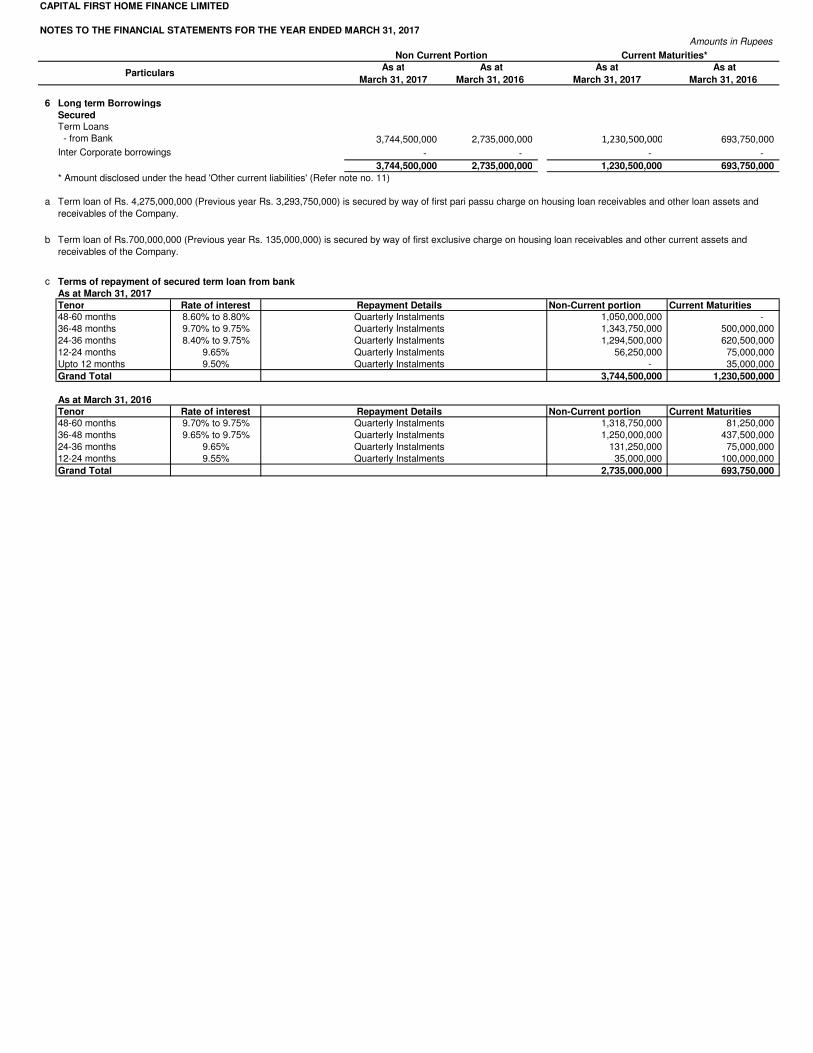
6 Long term Borrowings
Secured
Term Loans - from Bank 3,744,500,000 2,735,000,000 1,230,500,000 693,750,000
Inter Corporate borrowings - - - -
3,744,500,000 2,735,000,000 1,230,500,000 693,750,000
* Amount disclosed under the head 'Other current liabilities' (Refer note no. 11)
a
b
c
As at March 31, 2017
Tenor Rate of interest Non-Current portion Current Maturities
48-60 months 8.60% to 8.80% 1,050,000,000 - 36-48 months 9.70% to 9.75% 1,343,750,000 500,000,000 24-36 months 8.40% to 9.75% 1,294,500,000 620,500,000 12-24 months 9.65% 56,250,000 75,000,000 Upto 12 months 9.50% - 35,000,000
Grand Total 3,744,500,000 1,230,500,000
As at March 31, 2016
Tenor Rate of interest Non-Current portion Current Maturities48-60 months 9.70% to 9.75% 1,318,750,000 81,250,000 36-48 months 9.65% to 9.75% 1,250,000,000 437,500,000 24-36 months 9.65% 131,250,000 75,000,000 12-24 months 9.55% 35,000,000 100,000,000
Grand Total 2,735,000,000 693,750,000
Repayment Details
NOTES TO THE FINANCIAL STATEMENTS FOR THE YEAR ENDED MARCH 31, 2017
Current Maturities* Non Current Portion
Terms of repayment of secured term loan from bank
Term loan of Rs. 4,275,000,000 (Previous year Rs. 3,293,750,000) is secured by way of first pari passu charge on housing loan receivables and other loan assets and
receivables of the Company.
Term loan of Rs.700,000,000 (Previous year Rs. 135,000,000) is secured by way of first exclusive charge on housing loan receivables and other current assets and
receivables of the Company.
Particulars
Quarterly InstalmentsQuarterly Instalments
Quarterly InstalmentsQuarterly Instalments
Quarterly Instalments
Quarterly InstalmentsQuarterly InstalmentsQuarterly Instalments
Repayment Details
Quarterly Instalments

CAPITAL FIRST HOME FINANCE LIMITED
Amounts in Rupees
As at
March 31, 2017
As at
March 31, 2016
5 Deferred tax liability (Net)
Deferred tax liability
- Special Reserve 9,469,179 2,470,693
- Unamortised loan origination costs 29,346,571 13,307,036
- Unamortised bank fees 4,112,692 3,499,351 42,928,442 19,277,080
Deferred tax asset- Merger expense 304,119 586,527
- Unamortised preliminary expenses 46,623 106,899
- Unamortised processing fees 22,803,976 14,711,067
- Provision for standard assets 7,034,868 5,301,959
- Provision for doubtful loans and advances 9,443,025 1,012,927
39,632,611 21,719,379
Net Deferred tax liability/(Asset) 3,295,831 (2,442,299) (0)
Particulars
NOTES TO THE FINANCIAL STATEMENTS FOR THE YEAR ENDED MARCH 31, 2017

CAPITAL FIRST HOME FINANCE LIMITED
Amounts in Rupees
As at
March 31, 2017
As at
March 31, 2016
7 Other Long term liabilitiesUnamortised processing fees 70,971,472 39,400,062
70,971,472 39,400,062
8 Long term provisions: (Refer note no. 28)Provision for standard assets 23,828,589 15,540,246
Housing Loans 16,641,375 7,487,939 Loan Against Property 7,187,214 8,052,307
Provision for doubtful loans 30,717,197 3,013,418 Housing Loans 7,392,564 2,708,697 Loan Against Property 23,324,633 304,721
54,545,786 18,553,664
9 Short term borrowings
SecuredLoans repayable on demand from banks 933,176,248 572,987,603
933,176,248 572,987,603
Notes
10 Trade Payables:To Micro, Small and Medium Enterprises (refer note below) - - Others 52,398,022 32,287,993
52,398,022 32,287,993
* Disclosure under Micro, Small and Medium Enterprises Development Act, 2006
11 Other current liabilities:
Current maturities of long term debt (Refer note no. 6) 1,230,500,000 693,750,000
Unamortised processing fees & Subvention Income 8,099,180 5,093,985
Interest accrued but not due 2,394,445 1,175,117 1,348,710 610,380 6,559,159 920,033
Other liabilities* 39,951,050 1,586,578 1,288,852,544 703,136,093
* Includes payment to Related Party & statutory payments
12 Short term provisions:Provision for standard assets (Refer note no. 28) 564,157 495,683
Housing Loans 440,628 232,796 Loan Against Property 123,529 262,887
Provision for doubtful loans (Refer note no. 29) 2,025,607 50,208
Housing Loans 329,955 43,735
Loan Against Property 1,695,652 6,473
Provision for doubtful advances 575,022 575,022 Provision for tax (net of advance tax) 4,084,904 -
7,249,690 1,120,913
Advance received from customersIncome received in advance
Particulars
NOTES TO THE FINANCIAL STATEMENTS FOR THE YEAR ENDED MARCH 31, 2017
Cash Credit of Rs.933,176,248 (Previous year Rs. 572,987,603) is secured by way of first pari passu charge on housing
loan receivables and other loan assets and receivables of the Company.
There are no Micro and Small Enterprises, to whom the Company owes dues, which are outstanding for more than 45 days
as at March 31, 2017. The information as required to be disclosed under Micro, Small and Medium Enterprises
Development Act, 2006 (Act) has been determined to the extent such parties have been identified by the Company.

CAPITAL FIRST HOME FINANCE LIMITED
Amounts in RupeesAs at
March 31, 2017
As at
March 31, 2016
13 Long term loans and advances
Secured, considered good
Loans and advances relating to financing activity 5,908,479,839 3,850,760,583 Housing Loans 4,111,676,391 1,837,683,919 Loan Against Property 1,796,803,448 2,013,076,664
Secured, considered doubtful
Loans and advances relating to financing activity 68,301,311 15,992,815 Housing Loans 28,976,275 12,945,602 Loan Against Property 39,325,036 3,047,213
Unsecured, considered good
Advance taxes (net of provision for tax) 24,733,559 12,126,164 Advances recoverable in cash or in kind or for value to be
received-
6,001,514,709 3,878,879,562
14 Other non current assets
Unamortised loan origination cost 83,408,490 26,748,715 Unamortised borrowing costs 8,599,170 7,315,554
92,007,660 34,064,269
15 Cash and Bank Balances:
Cash and Cash Equivalents
Cash on hand * 8,499,753 3,770,712
Balance with Banks
- in current accounts 719,098,865 767,031,513 727,598,618 770,802,225
*Includes Cash in transit amounting to Rs.8,499,753
(Previous year Rs. 3,762,072)(Previous year Rs. NIL)
16 Short term loans and advances
Secured, considered good
Loans and advances relating to financing activity 141,039,270 123,920,724 Housing Loans 110,157,092 58,198,882 Loan Against Property 30,882,178 65,721,842
Secured, considered doubtful
Loans and advances relating to financing activity 4,152,154 308,562 Housing Loans 1,293,307 243,833 Loan Against Property 2,858,847 64,729
Unsecured, considered goodAdvances recoverable in cash or in kind or for value to be
received *30,020,547 90,635,977
Unsecured, considered doubtfulAdvances recoverable in cash or in kind or for value to be
received575,022 575,022
175,786,993 215,440,285
* Includes Rs. 7,390,383/- receivable from related party
17 Other Current Assets:
Interest accrued but not due 48,667,346 34,301,018
Unamortised loan origination cost 18,347,993 13,498,803 Unamortised borrowing costs 5,661,206 3,268,333
72,676,545 51,068,154
Particulars
NOTES TO THE FINANCIAL STATEMENTS FOR THE YEAR ENDED MARCH 31, 2017

CAPITAL FIRST HOME FINANCE LIMITED
NOTES TO THE FINANCIAL STATEMENTS FOR THE YEAR ENDED MARCH 31, 2017
Amounts in Rupees
For the year ended
March 31, 2017
For the year ended
March 31, 2016
18 Revenue from operations:
Interest income 659,859,929 342,818,712
Other financial services:
Proceesing fees and other charges 48,449,151 18,310,812 708,309,080 361,129,524
19 Other Income
Profit on sale of Investments 3,515,891 39,446,878 Excess provision written back - 1,166,678 Interest on Income Tax Refund 321,053 151,004
3,836,944 40,764,560
20 Employee benefits expense
Salaries and wages 46,900,318 8,586,438
46,900,318 8,586,438
21 Finance Costs:
Interest expense 376,543,109 249,178,135
Other borrowing costs 27,743,825 3,885,151
Bank charges 525,964 333,105
404,812,898 253,396,391
22 Other expenses:
Rent 177,159 116,030
Repairs others 395,204 397,930
Rates and taxes 449,267 6,734,903
Auditors' remuneration
- as auditor 1,250,000 1,300,000
- tax audit 150,000 200,000
- for Certification and others 269,425 85,600
- for reimbursement of expenses 35,450 57,750
Travelling expenses 9,463 13,039
Communication expenses 111,771 71,984
Printing and stationery 369,108 925,636
Advertisement and publicity expenses 955,512 1,990,105
Electricity charges 40,315 32,501
Membership and subscription 3,567 7,431
Amortised loan origination cost 20,622,761 8,118,919
Provision & Write offs:
Provision for doubtful loans and advances 29,679,177 1,721,815
Provision for standard assets 8,356,817 6,826,722
Bad debts written off (net of recovery) 82,521,444 8,771,251
120,557,438 17,319,788
Donations (Refer note below) 744,000 -
Legal and professional charges 16,720,355 8,595,751
Directors sitting fees 210,000 260,000
Miscellaneous expenses 254,729 316,566 163,325,524 46,543,933
Notei)
Particulars In cash Yet to be paid in cash Totali) Construction/acquistion of any asset - - - ii) On purposes other than (i) above 744,000 - 744,000
23 Earning per equity share ('EPS')
Basic & Diluted EPSNet Profit for the year 64,384,466 62,419,592 Weighted average number of equity shares 66,304,515 53,176,858 Nominal value per share 10 10 Earnings per equity share (Rs.) 0.97 1.17
c) Details of related party transaction as per Accounting Standard (AS-18), "Related Party Disclosures" is Rs. Nil.
Particulars
During the year, the Company has contributed Rs. 744,000 (Previous Year: Rs. Nil) towards Corporate Social Responsibility ('CSR')
Details of CSR spent during the financial year: a) Gross amount required to be spent by the company during the year is Rs. 743,958
b) Amount spent during the year on:

CAPITAL FIRST HOME FINANCE LIMITED
24 Contingent liabilities
Contingent Liabilities not provided for in respect of: Amount in Rupees
ParticularsAs at
March 31, 2017
As at
March 31, 2016
Income-tax
matters in
9,776,517 11,381,294
25 Capital Commitments
As at
March 31, 2017
As at
March 31, 2016
Commitments relating to loans sanctioned but undrawn 22,235,176 26,095,999
26 Related Party Disclosures
Cloverdell Investment Ltd.
Capital First Limited
Capital First Securities Limited Capital First Commodities Limited
27 Segment Reporting
28
Particulars
Standard Sub-Standard Doubtful Total
4,221,833,484 30,269,582 - 4,252,103,066 1,827,685,625 42,183,883 - 1,869,869,508
6,049,519,109 72,453,465 - 6,121,972,574
Standard Sub-Standard Doubtful
17,082,003 7,722,519 - 24,804,522 7,310,743 25,020,285 - 32,331,028
24,392,746 32,742,804 - 57,135,550
Particulars
Standard Sub-Standard Doubtful Total
1,895,882,801 13,189,435 - 1,909,072,236 2,078,798,506 3,111,942 - 2,081,910,448
3,974,681,307 16,301,377 - 3,990,982,684
Standard Sub-Standard Doubtful Total
7,720,735 2,752,432 - 10,473,167 8,315,194 311,194 - 8,626,389
16,035,929 3,063,626 - 19,099,555
* Includes standard asset provision created in Interest accrued but not due.
29
30
31
Disclosure regarding provisions made for standard assets as per the Prudential Norms contained in the Housing Finance Companies (NHB) Directions, 2010 as
amended.
The main business of the Company is to provide loans for purchase or construction of residential houses. All other activities of the Company revolve around the main
business and accordingly there are no separate reportable segments, as per "Accounting Standards (‘AS’) notified under Section 133 of the Companies Act, 2013 ('the
Act') read together with Rules 7 of the Companies (Accounts) Rules, 2014 and Companies (Accounting Standards) Rules, 2016.
The Company’s pending litigations comprise of claims against the Company primarily by the customers and proceedings pending with Tax authorities. The Company
has reviewed all its pending litigations and proceedings and has adequately provided for where provisions are required and disclosed the contingent liabilities where
applicable, in its financial statements. The Company does not expect the outcome of these proceedings to have a material adverse effect on its financial results at
March 31, 2017. Refer note 24 for details on contingent liabilities.
Disclosure regarding penalty or adverse comments as per Housing Finance Companies (NHB) Directions, 2010, as amended. During the current year, the Company
has:
a. Neither been imposed any penalty by National Housing Bank
NOTES TO THE FINANCIAL STATEMENTS FOR THE YEAR ENDED MARCH 31, 2017
Refer Annexure 1 &1A for the transactions with related parties
Relationship Name of the Party
Fellow subsidiaries
Ultimate Holding Company
Holding Company
Particulars
In terms of Accounting Standard 18 (AS-18) ‘Related Party Disclosures’, notified under Section 133 of the Companies Act, 2013 ('the Act') read together with
paragraph 7 of the Companies (Accounts) Rules, 2014., the disclosures of transactions with the related parties as defined in AS-18 are given below:
Loans
Housing loansMortgage Loans
Provisions
For the year ended March 31, 2016
For the year ended March 31, 2017
Loans
Housing loans *Mortgage Loans *
Total Provisions
Mortgage Loans *
Total Provisions
Housing loansMortgage LoansTotal Loans
Provisions
Housing loans *
Total Loans
The Company did not have any long term contracts including derivative contracts for which there were any material foreseeable losses.

CAPITAL FIRST HOME FINANCE LIMITED
32
33
ParticularsOther denomination
notes
Total
33,000 33,000 266,209,483 281,424,483
- -
266,023,714 281,238,714
218,769 218,769
34
35
36 Figures for previous year have been regrouped and/or reclassified wherever considered necessary, to conform to current year classifications.
Additional information as per notification issued by the National Housing Bank is given in Annexure 3.
The details of Specified Bank Notes (SBN) held and transacted during the period 08/11/2016 to 30/12/2016 as provided in the table below:-
SBNs
Closing cash in hand as on 08.11.2016 - (+) Permitted receipts (Refer note below)
(-) Permitted payments
(-) Amount deposited in Banks (Refer note 15,215,000.00 Closing cash in hand as on 30.12.2016 -
NOTES TO THE FINANCIAL STATEMENTS FOR THE YEAR ENDED MARCH 31, 2017
The additional information pursuant to Schedule III to the Companies Act, 2013 are either Nil or Not Applicable.
In the ordinary course of business, Company’s collection agencies have collected cash and customers have directly deposited cash
amounting to Rs. 281,238,714 as part of the loan repayments in the collection bank account of the Company during the period from
November 9, 2016 to December 30, 2016. The denomination wise details of such cash has been confirmed by the Company's bankers.
The Board of Directors at its meeting held on August 4, 2014, had approved a Scheme of Arrangement and Amalgamation between Capital first Home Finance
Limited (Formerly known as Capital first Home Finance Private Limited ) and Capital First Investment Advisory Limited (‘CFIAL’) (Scheme), inter-alia in terms of which
CFIAL has merged with CFHFL, under the provisions of Section 391 to 394, of the Companies Act, 1956. The Appointed Date under the Scheme is April 1, 2014. The
Scheme had been approved by the Hon'ble High Court of Judicature at Bombay vide its order dated July 31, 2015. The Company had filed the court order approving
the Scheme with the Registrar of Companies (‘ROC’), Mumbai on August 31, 2015 as required under section 391 of the Companies Act, 1956. The said scheme
became effective from August 31, 2015 but operative with retrospective effect from April 1, 2014, the appointed date.
Pursuant to the Scheme:
a) CFIAL ('Transferor') has merged with CFHFL ('Transferee') under the purchase method;
b) Assets and liabilities have been transferred at book value. The Company has issued 30,029,515 equity shares of Rs. 10 each fully paid up in consideration of net
assets acquired from the transferor Company.
c) The difference of Rs. 63,774,782 between the shares issued aggregating Rs. 300,295,150 and the net assets acquired aggregating Rs. 364,069,932 is treated as
Capital Reserve of the transferee company.
15,215,000.00
-

Annexure 3 of the Note No. 35 to the Financial Statements for the year ended March 31, 2017
3.1 Capital to Risk Assets Ratio (CRAR)
Particulars Current Year Previous Year
20.33% 24.11%
19.73% 23.63%0.60% 0.48%
- - - -
3.2 Disclosure regarding Reserve fund under Section 29C of NHB Act, 1987 as per NHB Circulars dated April 7, 2014.
Current Year Previous Year
- -
19,956,599 7,472,681
c) Total 19,956,599 7,472,681
- -
12,876,893 12,483,918
- -
- -
- -
32,833,492 19,956,599
32,833,492 19,956,599
3.3 Investments
Particulars Current Year Previous Year
3.5.1. Value of Investments
i) Gross Value of Investments (a) In India NIL NIL (a) Outside Indiaii) Provision for Depreciation (a) In India NIL NIL (a) Outside Indiaiii) Net Value of Investments (a) In India NIL NIL (a) Outside India3.5.2. Movement of provisions held towards depreciation on investments NIL NIL
i) Opening balanceii) Add: Provisions made during the yeariii) Less: Write-off/ write-back of excess provisions during the yeariv) Closing balance
3.4 Derivatives
3.4.1 Forward Rate Agreement (FRA) / Interest Rate Swap (IRS)
Current Year Previous Year
NIL NIL
NIL NIL
NIL NIL
NIL NIL
NIL NIL
3.4.2. Exchange Traded Interest Rate (IR) Derivative
Current Year Previous Year
NIL NIL
NIL NIL
NIL NIL
NIL NIL
(iii) Notional principal amount of exchange traded IR derivatives outstanding and not "highly effective"
(iv) Mark-to-market value of exchange traded IR derivatives outstanding and not "highly effective" (instrument-
(i) Notional principal amount of exchange traded IR derivatives undertaken during the year (instrument- wise)
(ii) Notional principal amount of exchange traded IR derivatives outstanding as on 31st March ……..…..
(v) The fair value of the swap book @
Particulars
b) Amount of special reserve u/s 36(1)(viii) of Income Tax Act, 1961 taken into account for the purposes
of Statutory Reserve under Section 29C of the NHB Act, 1987
c) Total
Particulars
(i) The notional principal of swap agreements
(ii) Losses which would be incurred if counterparties failed to fulfil their obligations under the agreements
(iii) Collateral required by the HFC upon entering into swaps
b) Amount withdrawn from special reserve u/s 36(1)(viii) of the Income Tax Act, 1961 which has been
taken into account for the purposes of provisions u/s 29C of the NHB Act, 1987
Balance at the end of the year
a) Statutory Reserve u/s 29C of the National Housing Bank Act, 1987
Particulars
Balance at the beginning of the year
a) Statutory Reserve u/s 29C of the National Housing Bank Act, 1987b) Amount of special reserve u/s 36(1)(viii) of Income Tax Act, 1961 taken into account for the purposes
of Statutory Reserve under Section 29C of the NHB Act, 1987
Addition / Appropriation / Withdrawal during the year
(iv) Concentration of credit risk arising from the swaps $
i) CRAR (%)
ii) CRAR - Tier I capital (%)iii) CRAR - Tier II Capital (%)iv) Amount of subordinated debt raised as Tier-II capitalv) Amount raised by issue of Perpetual Debt Instruments
Add: a) Amount transferred u/s 29C of the NHB Act, 1987b) Amount of special reserve u/s 36(1)(viii) of the Income Tax Act, 1961 taken into account for the
purposes of Statutory Reserve under Section 29C of the NHB Act, 1987Less: a) Amount appropriated from the Statutory Reserve u/s 29C of the NHB Act, 1987
CAPITAL FIRST HOME FINANCE LIMITED

3.4.3. Disclosures on Risk Exposure in Derivatives
A. Qualitative Disclosure
The Company doesn’t deal in Derivatives.
B. Quantitative Disclosure
Currency
Derivatives
Interest Rate
Derivatives
NIL NIL
NIL NIL
NIL NIL
NIL NIL
NIL NIL
NIL NIL
3.5
No. / Amount
1 NA
2 NA
NA
a)b)
a)b)
NA
a)
i.)ii.)
b)
i.)ii.)
a)
i.)ii.)
b)
i.)ii.)
3.5.2. Details of Financial Assets sold to Securitisation / Reconstruction Company for Asset Reconstruction
Current Year Previous Year
NIL NILNIL NILNIL NILNIL NIL
NIL NIL
3.5.3. Details of Assignment transactions undertaken by HFCs
Current Year Previous Year
522 NIL899,670,219 NIL899,670,219 NIL
NIL NIL
NIL NIL
3.5.4 Details of non-performing financial assets purchased / sold
A. Details of non-performing financial assets purchased:
Current Year Previous Year
NIL NIL
NIL NIL
B. Details of Non-performing Financial Assets sold:
Current Year Previous Year
NIL NIL
NIL NIL
NIL NIL
Particulars
1 No. of accounts sold
2 Aggregate outstanding
3 Aggregate consideration received
(iii) Aggregate consideration(iv) Additional consideration realized in respect of accounts transferred in earlier years
(v) Aggregate gain / loss over net book value
Particulars
1. (a) No. of accounts purchased during the year
(b) Aggregate outstanding
2. (a) Of these, number of accounts restructured during the year
(b) Aggregate outstanding
(iii) Aggregate consideration(iv) Additional consideration realized in respect of accounts transferred in earlier years
(v) Aggregate gain / loss over net book value
Particulars
(i) No. of accounts
(ii) Aggregate value (net of provisions) of accounts assigned
*Only the SPVs relating to outstanding securitisation transactions may be reported here
Particulars
(i) No. of accounts
(ii) Aggregate value (net of provisions) of accounts sold to SC / RC
(II)
On-balance sheet exposures towards Credit Enhancements
Exposure to own securitisations
Exposure to third party securitisations
4
Amount of exposures to securitisation transactions other than MRR
(I)
Off-balance sheet exposures towards Credit Enhancements
Exposure to own securitizations
Exposure to third party securitisations
3
Total amount of exposures retained by the HFC towards the MRR as on the date of balance sheet
(I)Off-balance sheet exposures towards Credit Enhancements
(II)On-balance sheet exposures towards Credit Enhancements
(iii) Credit Exposure [2]
(iv) Unhedged Exposures
Securitisation
Particulars
No of SPVs sponsored by the HFC for securitisation transactions*
Total amount of securitised assets as per books of the SPVs sponsored
Particulars
(i) Derivatives (Notional Principal Amount)
(ii) Marked to Market Positions [1]
(a) Assets (+)
(b) Liability (-)

3.7 Exposure
3.7.1. Exposures to real estate sector
Particulars Current Year Previous Year
a) Direct exposure
982,816,015 195,164,836
3,269,287,051 1,713,907,400
1,869,869,508 2,081,910,447
- -
- -
b) Indirect Exposure
- -
3.7.2. Exposure to Capital Market
Current Year Previous Year
NIL NIL
NIL NIL
NIL NILNIL NIL
NIL NIL
NIL NILNIL NIL
NIL NIL
NIL NIL
NIL NIL
3.7.3 Details of financing of parent company products
There are no such instances.
3.7.4. Details of Single Borrower Limit (SGL) / Group Borrower Limit (GBL) exceeded by the HFC
During the year, the Company has not exceeded SGL & GBL limits as prescribed under NHB Regulation.
3.7.5. Unsecured Advances
There are no loans and advances secured against rights, licences, authorities etc.
4 Miscellaneous
Particulars
Refer note no.26 for transactions with related party transactions
CARE : AA+
(b) Commercial paper CARE : A1+
(c) Non Convertible Debentures CARE : AA+
210,000
4.3 Related Party Transactions
4.4 Ratings assigned by credit rating agencies and migration of ratings during the year
(a) Long Term Bank facility
4.5 Remuneration of Directors (Non-executive)
- Sitting fees
Company Identification no. (CIN) : U65192MH2010PLC211307
4.2. Disclosure of Penalties imposed by NHB and other regulators
Penalties or fines pursuant to a contractual obligation are not considered as penalties or fines. Expenditure incurred for any purpose which is an offence or
which is prohibited by law is restricted to items where the disclosed purpose of such payment is, to the assessee’s knowledge, an offence or prohibited by
law.
(vii) bridge loans to companies against expected equity flows / issues;
(viii) All exposures to Venture Capital Funds (both registered and unregistered)
Total Exposure to Capital Market
4.1. Registration obtained from other financial sector regulators
NHB registration no. 01.0131.16
(i) direct investment in equity shares, convertible bonds, convertible debentures and units of equity- oriented
(ii) advances against shares / bonds / debentures or other securities or on clean basis to individuals for
(iii) advances for any other purposes where shares or convertible bonds or convertible debentures or units of
(iv) advances for any other purposes to the extent secured by the collateral security of shares or convertible
bonds or convertible debentures or units of equity oriented mutual funds i.e. where the primary security other
than shares
(v) secured and unsecured advances to stockbrokers and guarantees issued on behalf of stockbrokers and
market makers;
(vi) loans sanctioned to corporates against the security of shares / bonds / debentures or other securities or
on clean basis for meeting promoter’s contribution to the equity of new companies in anticipation of raising
resources;
Housing loans more than Rs. 15 lakhs
Non Housing Loans
(ii) Commercial Real Estate –
Lending secured by mortgages on commercial real estates (office buildings, retail space, multipurpose
commercial premises, multi-family residential buildings, multi-tenanted commercial premises, industrial or
warehouse space, hotels, land acquisition, development and construction, etc.). Exposure would also
include non-fund based (NFB) limits;(iii) Investments in Mortgage Backed Securities (MBS) and other securitised exposures -
a. Residential,
b. Commercial Real Estate.
Fund based and non-fund based exposures on National Housing Bank (NHB) and Housing Finance
Companies (HFCs).
Particulars
(i) Residential Mortgages –
Lending fully secured by mortgages on residential property that is or will be occupied by the borrower or
that is rented;
Housing loans up to Rs. 15 lakhs

5.1Current Year Previous Year
NIL NIL
32,722,818 30,947,730
29,679,177 1,721,815
8,356,817 6,826,722
Current Year Previous Year Current Year Previous Year
4,221,833,484 1,895,882,801 1,827,685,625 2,078,798,506
17,082,003 7,720,735 7,310,743 8,315,194
30,269,582 13,189,435 42,183,883 3,111,942
7,722,519 2,752,432 25,020,285 311,194
NIL NIL NIL NIL
NIL NIL NIL NIL
NIL NIL NIL NIL
NIL NIL NIL NIL
NIL NIL NIL NIL
NIL NIL NIL NIL
NIL NIL NIL NIL
NIL NIL NIL NIL
4,252,103,066 1,909,072,236 1,869,869,508 2,081,910,448
24,804,522 10,473,167 32,331,028 8,626,389
5.3. Concentration of Public Deposits, Advances, Exposures and NPAs
5.3.1. Concentration of Public Deposits (for Public Deposit taking/holding HFCs)
Current Year Previous Year
NA NA
NA NA
5.3.2. Concentration of Loans & Advances
Current Year Previous Year
701,617,635 748,347,332 11.5% 18.75%
5.3.3. Concentration of all Exposure (including off-balance sheet exposure)
Current Year Previous Year
701,617,635 748,347,332 11.5% 18.75%
5.3.4. Concentration of NPAs
Current Year Previous Year
51,261,098 16,301,377
5.3.5. Sector-wise NPAs (As certified by the management and relied upon by auditors)
Sr No. Sector POS PROV
A. Housing Loans: 1 Individuals 30,269,583 7,722,518 2 Builders/Project Loans 3 Corporates 4 Others (specify)
B. Non-Housing Loans: 1 Individuals 41,565,385 24,816,182 2 Builders/Project Loans 3 Corporates 618,498 204,104 4 Others (specify)
2.30%
0.97%
Particulars
Total Exposure to twenty largest borrowers /CustomersPercentage of Loans & Advances to twenty largest borrowers to Total Advances of the HFC
Particulars
Total Exposure to top ten NPA accounts
Percentage of NPAs to Total Advances in that
sector
0.72%
Total
a) Total Outstanding Amount
b) Provisions made
Particulars
Total Deposits of twenty largest depositors
Percentage of Deposits of twenty largest depositors to Total deposits
Particulars
Total Loans & Advances to twenty largest borrowersPercentage of Loans & Advances to twenty largest borrowers to Total Advances of the HFC
Doubtful Assets – Category-II
a) Total Outstanding Amount
b) Provisions made
Doubtful Assets – Category-III
a) Total Outstanding Amount
b) Provisions made
Loss Assets
a) Total Outstanding Amount
b) Provisions made
Standard Assets
a) Total Outstanding Amount
b) Provisions made
Sub-Standard Assets
a) Total Outstanding Amount
b) Provisions made
Doubtful Assets – Category-I
a) Total Outstanding Amount
b) Provisions made
Break up of 'Provisions and Contingencies shown under the head Expenditure in Profit and Loss
Account
1. Provision for depreciation on investments
2. Provision made towards Income tax
3. Provision towards NPA
4. Provision for Standard Assets (with details like teaser loan, CRE, CRE-RH,etc.)
5. Other Provision and Contingencies (with details)
Break up of Loan & Advances and Provisions thereon
Housing loans Non Housing loans

5.4. Movement of NPAs
Current Year Previous Year
0.65% 0.33%
16,301,377 4,066,094 72,453,466 12,338,874
(16,301,377) (103,591) 72,453,466 16,301,377
13,237,751 2,724,283 39,710,661 10,582,873
(13,237,751) (69,406) 39,710,661 13,237,751
3,063,626 1,341,811 32,742,805 1,756,000 (3,063,626) (34,185) 32,742,805 3,063,626
5.5 Overseas Assets
Current Year Previous Year
NIL NIL
5.6 Off-balance Sheet SPVs sponsored
Domestic Overseas
NA NA
6 Disclosure of Complaints
6.1. Customers Complaints (As certified by the management and relied upon by auditors)
Current Year Previous Year
- - 23 - 21 -
2 -
Name of the SPV sponsored
Particulars
a) No. of complaints pending at the beginning of the yearb) No. of complaints received during the yearc) No. of complaints redressed during the yeard) No. of complaints pending at the end of the year
c)Reductions during the year
d)Closing balance
(IV) Movement of provisions for NPAs (excluding provisions on standard assets)
a)Opening balanceb)Provisions made during the yearc)Write-off/write-back of excess provisions
d)Closing balance
Particulars
(II) Movement of NPAs (Gross)a) Opening balanceb) Additions during the yearc) Reductions during the year
d) Closing balance
(III) Movement of Net NPAs
a)Opening balanceb)Additions during the year
Particulars
(I) Net NPAs to Net Advances (%)

3.6 Asset Liability Management
1 day to 30-31
days (one month)
Over one month
to 2 months
Over 2 months up
to 3 months
Over 3 months to
6 months
Over 6 months to 1
year
Over 1 year to 3
years
Over 3 years to 5
years
Over 5 year to 7
years
Over 7 year to 10
years
Over 10 year Total
LiabilitiesDepositsBorrowings from Banks 40,625,000 68,750,000 193,750,000 288,125,000 1,572,426,239 2,875,750,000 868,750,000 - - - 5,908,176,239
Nil (25,000,000) (128,125,000) (153,125,000) (960,487,603) (1,741,250,000) (993,750,002) - - - (4,001,737,605)
Market Borrowings Nil Nil Nil Nil Nil Nil Nil Nil Nil Nil Nil
(Nil) (Nil) (Nil) (Nil) (Nil) (Nil) (Nil) (Nil) (Nil) (Nil) (Nil)
Foreign Currency liabilities Nil Nil Nil Nil Nil Nil Nil Nil Nil Nil Nil
(Nil) (Nil) (Nil) (Nil) (Nil) (Nil) (Nil) (Nil) (Nil) (Nil) (Nil)
Assets
Advances 11,962,879 11,493,433 11,613,032 35,569,958 74,552,122 420,159,104 570,022,064 703,120,196 1,136,284,137 3,147,195,650 6,121,972,575 (9,200,000) (10,100,000) (10,100,000) (31,000,000) (63,900,000) (279,300,000) (392,400,000) (497,400,000) (940,482,684) (1,757,100,000) (3,990,982,684)
Investments Nil Nil Nil Nil Nil Nil Nil Nil Nil Nil Nil
(Nil) (Nil) (Nil) (Nil) (Nil) (Nil) (Nil) (Nil) (Nil) (Nil) (Nil)
Foreign Currency Assets (Nil) (Nil) (Nil) (Nil) (Nil) (Nil) (Nil) (Nil) (Nil) (Nil) (Nil)
(Nil) (Nil) (Nil) (Nil) (Nil) (Nil) (Nil) (Nil) (Nil) (Nil) (Nil)
Figures in bracket relate to previous year.

CAPITAL FIRST HOME FINANCE LIMITED
Annexure 1
Transactions with Related parties
Relationship
Period April 1, 2016 to
March 31, 2017
April 1, 2015 to
March 31, 2016
April 01, 2016
to March 31, 2017
April 1, 2015 to
March 31, 2016
Purchase of Services 44,208,635 8,843,362 4,565,000 3,000,000
Interest expenses paid 25,170,910 475,711 - -
Loans/ Advances taken 2,017,390,600 362,016,491 - -
Loans/ Advances repaid 1,951,061,003 448,777,496 - -
Inter corporate deposits taken 765,000,000 314,000,000 - -
Inter corporate deposits repaid 765,000,000 314,000,000 - -
Closing Balances : Receivable / (Payable) As at
March 31, 2017
As at
March 31, 2016
As at
March 31, 2017
As at
March 31, 2016
Inter corporate deposits Receivable / (Payable) - - - -
Advances Recoverable / (Payable) 7,390,383 75,934,518 (4,530,750) (1,045,000)
Holding Company Fellow Subsidiaries
Amount in Rupees
NOTES TO THE FINANCIAL STATEMENTS FOR THE YEAR ENDED MARCH 31, 2017

CAPITAL FIRST HOME FINANCE LIMITED
Annexure 1A
Transactions with Related partiesAmount in Rupees
April 01, 2016
to March 31, 2017
April 01, 2015
to Mar 31, 2016
April 01, 2016
to March 31, 2017
April 01, 2015
to Mar 31, 2016
Purchases of services
Capital First Limited 44,208,635 8,843,362 Capital First Securities Limited - - 4,565,000 3,000,000 Total 44,208,635 8,843,362 4,565,000 3,000,000
Interest expenses paid
Capital First Limited 25,170,910 475,711 - - Total 25,170,910 475,711
Loans/ Advances taken
Capital First Limited 2,017,390,600 362,016,491 - - Total 2,017,390,600 362,016,491
Loans/ Advances repaid
Capital First Limited 1,951,061,003 448,777,496 - - Total 1,951,061,003 448,777,496
Inter corporate deposits taken
Capital First Limited 765,000,000 314,000,000 - - Total 765,000,000 314,000,000
Inter corporate deposits repaid
Capital First Limited 765,000,000 314,000,000 - - Total 765,000,000 314,000,000
Closing BalanceAs at
March 31, 2017
As at
March 31, 2016
As at
March 31, 2017
As at
March 31, 2016
Advances Recoverable / (Payable)
Capital First Limited 7,390,383 75,934,518 - -
Capital First Securities Limited - - (4,530,750) (1,045,000)
Total 7,390,383 75,934,518 (4,530,750) (1,045,000)
Holding Company Fellow Subsidiary Company
Particulars
NOTES TO THE FINANCIAL STATEMENTS FOR THE YEAR ENDED MARCH 31, 2017