Capital Budgeting for - InfoHouseinfohouse.p2ric.org/ref/25/24327.pdf · Capital Budgeting for...
18
Special Focus: The Small and Medium-Sized Company Capital Budgeting for 2~3~7 -3 - Environmental Professionals - Helping Smaller Companies Evaluate the Economics of Their P2 Projects Richard €3. Torborg Capital budgeting ofers companies a way to evaluate the economlc attractlveness of proposed pollution prevention projects - a step that Is critlcally important to ensuring that companles allocate their Investment dollars so as to maximLze their value. Thls article Lntroduces the baslcs of capital budgeting to enulronmental profession- als. and provides specific tools that can be applied In a small-company environment. CUITAL. BUDGETING IS the process of allocating investment dollars, or capital, to a business’s activities to maximize the value of the com- pany. This process can be of critical importance when a business is deciding whether to invest in a project that may further pollution prevention within the company’s operations. Background This article developed out of a series of workshops that the Massachusetts Office of Technical Assistance (OTA) has designed to assist companies with implementingthe toxic use reduction planning process mandated by the state’s Toxic Use Reduction Act (TURA).The TURA planning process contains an economic evaluation component that is designed to encourage companies to evaluate toxic use reduc- tion investments the same way they would any other business investment. As part of its TURA planning workshop, OTA has developed a segment on capital budgeting that is intended to specifi- cally address compliance with the TURA economic requirement. The material in this article, like the capital budgeting section of the workshop, emphasizes the basics of capital budgeting and their connection with the business planning process. The objectives of this article are to Provide an overview ofcapital budgetingso the environmental professional can appreciate the process at a business planning level; Improve the environmental professional’s ability to partici- pate in a capital budgeting exercise; and Provide some specific tools that can be directly applied in a small-company environment. * Richard H. Torborg is afinancial aduisor with the Executive Office ofEnuironmen- tal Affairs, Officeof Technical Assistance of the State ofMassachusetts, and assistant professor offinance (adjunct) at Bentley College in Waltham, Massachusetts. CCC 1053-4253/040447-18 Q 1994 John Wiley 8 Sons, Inc. 447
Transcript of Capital Budgeting for - InfoHouseinfohouse.p2ric.org/ref/25/24327.pdf · Capital Budgeting for...
Special Focus: The Small and Medium-Sized Company
Capital Budgeting for 2 ~ 3 ~ 7
-3 - Environmental Professionals -
Helping Smaller Companies Evaluate the Economics of Their P2 Projects
Richard €3. Torborg
Capital budgeting ofers companies a way to evaluate the economlc attractlveness of proposed pollution prevention projects - a step that I s critlcally important to ensuring that companles allocate their Investment dollars so as to maximLze their value. Thls article Lntroduces the baslcs of capital budgeting to enulronmental profession- als. and provides specific tools that can be applied In a small-company environment.
CUITAL. BUDGETING IS the process of allocating investment dollars, or capital, to a business’s activities to maximize the value of the com- pany. This process can be of critical importance when a business is deciding whether to invest in a project that may further pollution prevention within the company’s operations.
Background This article developed out of a series of workshops that the
Massachusetts Office of Technical Assistance (OTA) has designed to assist companies with implementing the toxic use reduction planning process mandated by the state’s Toxic Use Reduction Act (TURA). The TURA planning process contains an economic evaluation component that is designed to encourage companies to evaluate toxic use reduc- tion investments the same way they would any other business investment. As part of its TURA planning workshop, OTA has developed a segment on capital budgeting that is intended to specifi- cally address compliance with the TURA economic requirement. The material in this article, like the capital budgeting section of the workshop, emphasizes the basics of capital budgeting and their connection with the business planning process.
The objectives of this article are to
Provide an overview ofcapital budgetingso the environmental professional can appreciate the process a t a business planning level; Improve the environmental professional’s ability to partici- pate in a capital budgeting exercise; and Provide some specific tools that can be directly applied in a small-company environment.
*
Richard H. Torborg is afinancial aduisor with the Executive Office ofEnuironmen- tal Affairs, Officeof Technical Assistance of the State ofMassachusetts, and assistant professor offinance (adjunct) at Bentley College in Waltham, Massachusetts.
CCC 1053-4253/040447-18 Q 1994 John Wiley 8 Sons, Inc.
447

Rfchard H. Torborg
~~
Egectlue capital budgetfng gauges the economlc attractlueness of the uarious projects that a buslness mfght haue under conslderatlon.
Examples are used tomake the concepts more accessible to those with limited accounting or finance experience.
The techniques described in this article are applicable to projects that deal with cost reduction and/or process improvement within an existing business. The techniques also require that the firms evalu- ating their projects be relatively stable -Le., ones that are not going through major changes of business direction or significantly adjust- ing their capital structure by changing the balance of debt and equity in their financing of operations.
Overview of the Capital Budgeting Process Effective capital budgeting gauges the economic attractiveness of
the various projects that a business might have under consideration a t any given time. Once the economic attractiveness of each project is determined, the firm can decide (1) whether the anticipated return justifies the investment required to implement the project and (2) which projects are relatively more attractive. With the prioritization provided by step (2), investment dollars can be allocated to the most attractive projects first until those dollars are exhausted, or until there are no more attractive projects in which to invest.
The capital budgeting process is complex and broad in scope. It entails addressing four main estimation problems’:
1. The project’s future cash flows; 2. The discount rate, or “opportunity cost,” of capital; 3. The project’s effects on other parts of the business (cross-
sectional links between projects); and 4. The project’s effects on the business’s future investment op-
portunities (time series links).
The basic economic question that capital budgeting techniques are designed to answer is: Do the savings over future periods justify the up-front investment for the project? When attempting to answer this important question, companies often focus narrowly on the single process improvement under consideration, divorcing it from the rest of the operation. Thus, they often look narrowly a t cash flows and focus only on the individual production line in question. However, when the capital budgeting process is broadened to include the project’s effects on other parts of the business and on the business’s future investment opportunities, the evaluation can change substan- tially. It is hoped that this article will encourage companies to incorporate consideration offactors 3 and4 into their standard capital budgetingprocedure- thereby improving the quality of the decisions that flow from the capital budgeting process.
This article discusses each of the estimation problems listed above in turn.
Estimating Future Cash Flows Of the four capital budgeting estimation problems, estimating
448 Pollutiori Prevention ReulewlAutumn 1994
Capital Budgettngfor Enulronmental Professionals
~ ~~ ~
The best foundatton for a good cost estimate and cashflow forecast is an understandtng of baseline cost structure.
future cash flows is the most important and the most time-consuming. To determine future cash flows, it is necessary to estimate costs and then convert the cost data to cash flow data. Once costs are obtained, the conversion to cash flow requires the proper application of account- ing techniques.
The best foundation for agood cost estimate and cash flow forecast is an understandingofbaseline cost structure. Since the intent of the capital budgeting process is to evaluate alternatives (such as a piece of new equipment) that might change the cost of the existingprocess, ‘8aseline” as used here means the existing cost structure. This can mean the cost structure of a particular manufacturing line or that of the entire business. Once the baseline costs are obtained, the com- pany must forecast the costs that will be incurred if the proposed projed is implemented. The difference between the two is the incre- mental cost of the project.
Once obtained, this cost data must be converted to after-tax cash flow data. Illustrated below is a common estimation procedure for determining incremental after-tax cash flows - i.e., the cash flow difference, in each period of the project’s life, that implementation of the project produces for the firm. (See Example 2 on p. 453).
To summarize, the sequence for estimating cash flows is (1) establish baseline costs, (2) estimate the changes that will be induced by the project, and (3) convert the cost information to incremental after-tax cash flows.
Accounting systems as a source of cost information In order to begin the capital budgeting process, the practitioner
must have access to a reliable source of cost information for the company. The quality of this information will depend in part on the accounting system the business uses.
Publicly traded companies are required to use Generally Accepted Accounting Principles (GAAP) as put forth by the Financial Account- ing Standards Board (FASB). In addition, most private companies also comply, a t least to some extent, with GAAP. Depending on the complexity of the business, however, the financial information pro- duced under GAAP may not be very useful for management decision making. For example, the management of a manufacturing business with several products needs to know individual product costs to make the proper pricing decisions. However, GAAP requires only accurate aggregate costing, not accurate individual product costing.
Businesses that need more precise information than that provided by GAAP may develop management accounting systems that are individually tailored to their specific operations. But more precise cost information is generally more expensive to obtain. For this reason, many smaller businesses forgo establishingdual systems (i.e., one for financial accounting and one for cost accounting) and instead simply use the GAAP financial accounting system (with minor adjustments) for management decision making.
Pollution Preoentlon ReuiewlAutumn 1994 449
Rfchard H. Torborg
Cashflow Is used for evaluating capital budgeting projects because ft Is the most conseruatlue and unambiguous measure of
flnancfal performance.
Even among businesses that establish their own management accounting systems, the quality of the individual system can vary from company to company. Management accounting systems range in complexity from those that simply allocate overhead costs based on direct cost percentages to sophisticated systems such as activity based costing (ABC) that derive costs from transactions based on the exchange of materials and information in the manufacturing process.
Simple overhead allocation systems are easy and inexpensive to implement but can greatly distort cost allocations and lead to ill- informed pricing and investment decisions. By contrast, ABC sys- tems are expensive to implement and manage but are more accurate at allocating product costs.'
A sophisticated cost accounting system should be helpful in establishing baseline costs and forecasting the costs of incremental improvements in the manufacturing process. However, if the project involves a substantial change in existingprocedures (e.g., a complete redesign of a manufacturing process), then it is likely that no existing cost accounting system would shed much light on the new process costs.
In a smaller company that does not have a sophisticated cost accounting system, carefully analyzing both accounting information and relevant operating information should produce reasonably good cost data for capital budgetingpurposes. In this case, it is particularly important to examine overhead accounts carefully to avoid overlook- ingor misallocatingcosts. Among the costs that are usually booked in overhead accounts - and thus commonly missed in capital budgeting cost estimations - are toxics use and permitting fees and expendi- tures for training, waste handling, labeling, testing, and medical care.
Once cost information has been obtained, it must be converted to cash flow, as discussed below.
Understanding cash flow Cash flow is used for evaluating capital budgeting projects be-
cause it is the most conservative and unambiguous measure of financial performance. From an accounting standpoint, there are three basic categories of cash flow: cash flow from operations, cash flow from financing activities, and cash flow from capital investment expenditures. Adding these categories gives total cash flow for the business over a specified period - usually a year, a quarter year, or a month. With minor adjustments, this is also a good way to look a t project cash flows for capital budgeting purposes.
When estimating cash flows for capital budgeting purposes, only operating and investment cash flow are generally considered because the financingeffect (both principal and interest) is incorporated in the discount rate (the discount rate is discussed separately below). There are other techniques that consider financing explicitly, but they are beyond the scope of this discussion.
450 Pollution Preuention ReuiewlRutumn 1994

Capital Budgetlngfor Enulronmental Professionals
For capltal budgeting purposes. the releuant quantlty Ls operating Income.
Distinguishing between accounting information and cash flow
In double-entry or accrual accounting systems, which most busi- nesses employ, revenues and expenses are used to calculate profit (net income). For capital budgetingpurposes, however, the relevant quan- tity is operating income, which is revenue minus operating expenses and taxes; net income may incorporate items not relating to opera- tions, such as a gain from the sale of an asset no longer in use.
Under the double-entry accounting system, revenues and ex- penses are recorded on the income statement, while sales and pur- chases on account are recorded on the balance sheet (in accounts receivable and accounts payable, respectively). These accounts (among others) are classified in the areas of the balance sheet known as current assets and current liabilities. Current assets minus current liabilities are called working capital.
The entries made in this system are accountingconstructs that do not accurately measure cash flow. For example, if a firm ships a product to a customer on credit, a sale is recorded and revenues increase, but no cash is received until the customer sends a check. Similarly, if the firm receives materials for use in the manufacture of its products but does not pay for them until the next month, expenses increase but no cash leaves the firm in the current month.
By contrast, operating cash flow is a measure of how much cash the company is generating from its operating cycle. It indicates whether the business is self-sustaining on an operating basis. Oper- ating cash flow is calculated by adding depreciation3 expense back to operatingincome (revenue minus operating expenses and taxes), and then adjusting that number by net working capital changes (i.e., changes in current assets except cash, such as accounts receivable, and current liabilities, such as accounts payable). The basic formula for determining operating cash flow is
Operating cash flow = operating income + depreciation t changes in working capital (except cash)
Note that aggregate changes in working capital can be positive or negative.
Simplified cash flow estimation Because computing changes in working capital can be complex, a
common practice is to estimate operating cash flow by taking operat- ing income and adding back depreciation without including the working capital adjustment - i.e., operating cash flow (estimated) = operating income + depreciation. This approach assumes that rev- enue and expenses (except for depreciation) are reliable proxies for cash flow in and out of the firm during a reporting period.
This simplified technique gives a reasonable estimate of cash flow when the company’s operations are stable - i.e., when the firm is not
Pollution Preuentlon ReulewlAutumn 1994 45 1
Richard H. Torborg
on a steep growth or downsizing track. However, if the firm is experiencingrapid growth, it can require significant cash for working capital; the reverse would be true for firms that are downsizing. Under these conditions, an accurate estimate of cash flow would require working capital adjustments.
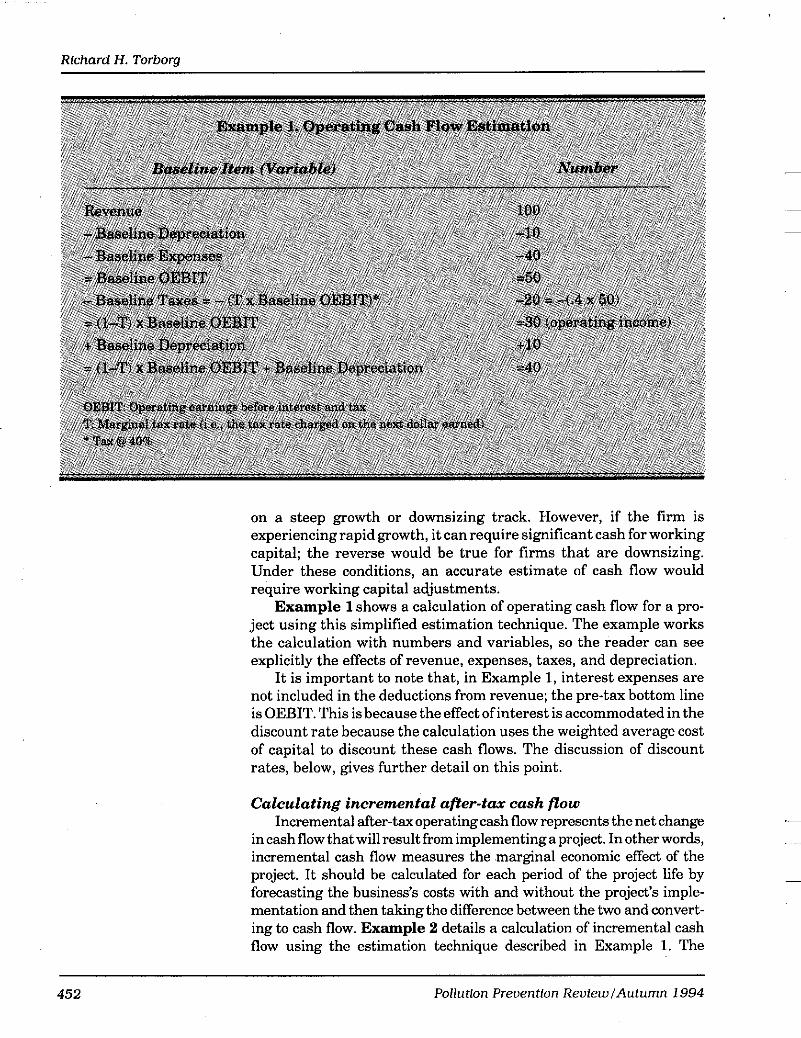
Example 1 shows a calculation of operating cash flow for a pro- ject using this simplified estimation technique. The example works the calculation with numbers and variables, so the reader can see explicitly the effects of revenue, expenses, taxes, and depreciation.
It is important to note that, in Example 1, interest expenses are not included in the deductions from revenue; the pre-tax bottom line is OEBIT. This is because the effect of interest is accommodated in the discount rate because the calculation uses the weighted average cost of capital to discount these cash flows. The discussion of discount rates, below, gives further detail on this point.
Calculating incremental after-tax cash flow Incremental after-tax operating cash flow represents the net change
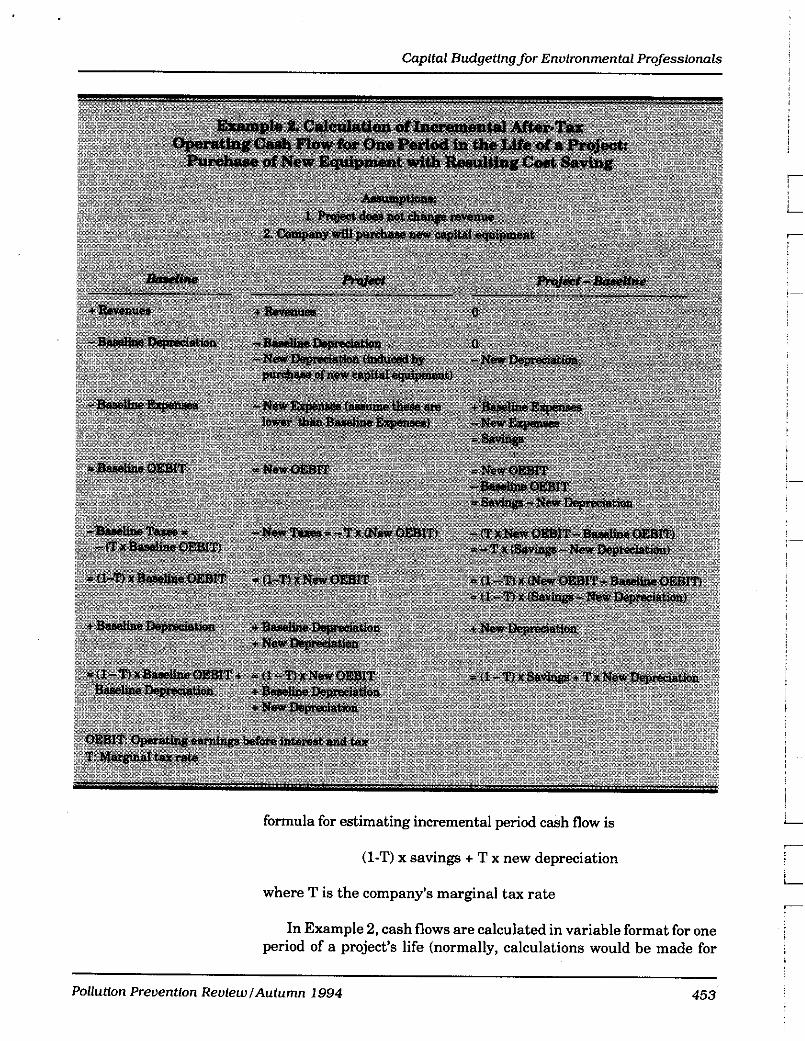
incashflow thatwillresultfromimplementingaprojed. Inotherwords, incremental cash flow measures the marginal economic effect of the project. It should be calculated for each period of the project life by forecasting the business’s costs with and without the project’s imple- mentation and then taking the difference between the two and convert- ing to cash flow. Example 2 details a calculation of incremental cash flow using the estimation technique described in Example 1. The
452 Pollution Prevention ReviewlAutumn 1994
Capltal Budgetlngfor Enulronmental Professlonals
formula for estimating incremental period cash flow is
(1-T) x savings t T x new depreciation
where T is the company’s marginal tax rate
In Example 2, cash flows are calculated in variable format for one period of a project’s life (normally, calculations would be made for
Pollutlon Prevention Reulew /Autumn 1994 453
L
i
Rfchard H . Torborg
It should be kept In mfnd that, In the capftal budgetfng process, the estfmated cashflow fs being deuelopedfrom
forecasted quantftfes.
several periods in an actual capital budgeting exercise). The example assumes that the company is considering buying a new machine that will reduce the use of a toxic chemical and also reduce costs.
There are two kinds of depreciation represented in the example: baseline depreciation (which already existed before the project’s implementation) and new depreciation (which results from the pur- chase of the new equipment necessary to implement the project). Baseline depreciation cancels out since it would be the same with or without the project.
It should be kept in mind that, in the capital budgeting process, the estimated cash flow is beingdeveloped from forecasted quantities. Thus, at best the process develops only a prediction on which to apply a measure of economic attractiveness (such as the net present value, internal rate of return, and/or payback measures discussed below in the section on discount rates and discounting cash flow).
Costs and cash flows: Additional factors In addition to the factors discussed above, participants in the
capital budgeting process should keep the following guidelines in mind when determining costs and cash flows:
Do not include sunk costs (Le., prior expenditures). Money already spent should not be included in the analysis because the decision on whether to implement a proposed future project cannot affect prior expenditures. Include opportunity costs. Floor space or employee time that will be freed up by the project are real savings to the firm that should be valued and included in the analysis. Do a sensitivity analysis. The cost of certain items that may be integral to a proposed project (such as a substitute chemical) can vary with volume or over time, and this can affect the overall economic viability of the proposed project. Thus, in estimating cash flows it is important to do multiple calculations using a range of values in key assumptions to get an idea of how cash flows may vary with changes in those assumptions. Incorporate inflation. Use nominal cash flow data (i.e., what will be observed at the time the future cash flow is forecast) with nominal discount rates (those established from values observed in the market). This means that if the forecast is in constant dollars, then an inflation factor should be applied to the forecast quantities before they are discounted. This is important because, as stated, the discount rate is determined from observed market values and will therefore incorporate inflation.
*
*
*
Discount Rates and Discounting Cash Flows Discount rates are used to adjust future cash flows for time and
risk so that they become comparable to cash flows received in the
454 Pollution Preuention ReufewlAutumn 1994

Capital Budgeting for Environmental Professfonals
The greater the market rlsk assocfated wfth an lnuestment, the higher the return that lnuestors will demand.
present with certainty. If a discount rate is known, the present value of any future cash flow can be calculated.
The discount rate is also called the “opportunity cost” of capital because it represents the return forgone by investing in a particular project rather than a financial security of comparable risk. When future cash flows are viewed as being essentially risk-free (i.e., in the risk class of, for instance, U S . government T-bills), then the discount rate should be very low since T-bills are earning about 2.5 percent to 3 percent as of this writing. On the other hand, if there is a higher degree of risk associated with the future cash flow, as is the case with projects in companies, then the discount rate must be adjusted upward to reflect the appropriate level of investment risk.
Understanding investment risk Because investment risk determines the discount rate used in the
capital budgeting process, it is important to understand its underly- ing factors.
Investors in companies fall into two basic categories: bondholders (debt investors) and stockholders (equity investors). Each has adifferent risk profile. The bondholders’ investment may be secured (i.e., backed by the assets of the company) so that, in the event ofbankruptcy, they will be entitled to be paid before other creditors - including both other debt holders with less security and, of course, stockholders. Bondholders receive periodic interest payments that are established in a legally binding loan agreement; if the firm misses an interest payment, the bondholder may be entitled to interest penalty payments and can often immediately call the full loan principal.
By contrast, stockholders receive their return in the form of dividends and stock appreciation. Dividends, which are set by the firm’s board of directors, are by no means guaranteed. In fact, when a company is facing financial difficulty, one of the first things it may do is lower or cancel its dividend. Similarly, stock appreciation is not locked in by a legal agreement, like bond interest. Instead, it is determined by the market, which establishes the stock’s value based on the ability of the firm to earn profits. Unlike a bondholder, whose return is legally pledged, a stockholder must either accept the return that the market dictates or sell the stock.
Considering these facts from the point of view of the investor, it is easy to see that the stockholder bears much more risk than the bond- holder. Investors can lessen this risk by diversifying their holdings-i.e., by investing in more than one company in different markets. With an appropriate diversification strategy, the investor bears an overall mar- ket risk but decreases the risk posed by any one company.
Balancing debt and equity financing The greater the market risk associated with an investment, the
higher the return that investors will demand. This translates into higher costs for a company when it wants to attract capital of a higher
Pollution Preuentfon ReuiewlAutumn 1994 455
Rlchard H. Torborg
It Is easy to estlmate the cost oflncremental debt
obtalnlng quotesfrom lendlng lnstltutlons.
C Q p l t d by Slmply
risk class. Accordingly, the interest cost of debt is generally less than the required return demanded for equity capital.
Since this is thecase, why don’t firms finance almost entirely with debt? The answer is that too much debt increases the risk of bank- ruptcy. Companies generally strive to obtain a balance of debt and equity financing. Although there is no specific formula for establish- ing the optimal debt-to-value ratio, many firms determine a target ratio (based onmarket, not book, value) and try to maintain it over the long run by issuing the appropriate amounts of debt or equity.
Determining the marginal cost of capital When determining a company’s cost of debt or equity capita1 for
capital budgeting purposes, the amount to be established is the marginal cost of capital (i.e., what it would take to obtain the next dollar of capital), rather than the average cost. In the case of debt financing, it is clear that if the firm is considering additional borrow- ing, the interest rate on the next amount borrowed, not the average interest rate on all of the firm’s debt, determines how much additional interest the firm will pay. The same reasoning holds true for the cost of equity capital.
Estimating the cost of debt It is easy to estimate the cost of incremental debt capital by simply
obtainingquotes from lendinginstitutions. (Since the firm can deduct interest payments for tax purposes, the actual cost of debt can be calculated with the following formula: interest rate times a figure that equals one minus the marginal tax rate.)
Estimating the cost of equity capital It is relatively easy to estimate the cost of equity capital for a
company whose stock is publicly traded, because the major stock brokerage houses periodically publish information from which the equity cost can be figured.
Determining the cost of equity capital is more difficult for pri- vately held companies, but some basic techniques can be recom- mended. One method is to identify a public company in a similar business with a similar debt-to-value ratio for which the cost ofequity is known; this can give a fairly good indication of the amount of risk the market assigns to the type of firm or project under consideration.
An approach that does not require a precise estimate of the cost of capital is to calculate net present values (NPVs) for a range of discount rates, thus establishing an investment profile that reveals how sensitive the results are to the discount rate! Granted, this technique sidesteps the issue of actually estimating equity capital costs, but it does provide some illumination when there is a high degree of uncertainty.
Companywide versus project-specific equity costs It is important to understand the relationship between the cost of
equity for a particular project within a company and the cost of equity
456 Pollution Preuentlon ReulewlAutumn 1994

Capltal Budgetlngfor Enulronmental Professlonals
The cost of equity for the company as a whole may be quite duerent from the costfor a particular project specflc to a sub-business of the company.
for the company itself. This relationship depends on both the product structure of the company and the type of project under consideration. If a firm is a single-product company and the project is simply an incremental improvement to the existing business, then the costs of equity for the company and the project will be the same. By contrast, if the company is highly diversified, the overall company cost of equity will be an aggregate figure that reflects the average market risk of all of the company’s lines of business. Consequently, in such a situation, the cost of equity for the company as a whole may be quite different from the cost for a particular project specific to a sub-business of the company. When this is the case, the project should be viewed as a mini-company with its own cost-of-equity-capital. The true cost of equity for the project will be the return that equity investors demand in the specific line of business for which the project is beingproposed. (Hence, the previous paragraph provides some direction on how to proceed in this case.)
Weighted average cost of capital (WACC) Once the participants in the capital budgeting process have
estimated the marginal debt and equity cost of capital, the target debt-to-value ratio ofthe company, and the incremental after-taxcash flows for a project, how can these numbers be used to discount the cash flows and obtain a present value (PV) that can be compared to the cost of the investment?
The answer to this question depends on how the cash flows were calculated. In the examples set out above in the discussion on estimat- ing future cash flows, the cash flows are calculated without deducting interest payments. Cash flows obtained in this way are used to service both debt and equity. However, as explained above, the cash flow streams to debt and equity investors involve different risks. Taking this into consideration in the capital budgeting process requires calculating the weighted average cost of capital, or WACC, which incorporates the cost of both debt and equity capital; cash flows calculated as above are then discounted with this weighted average. The following equation can be used to determine the WACC:
Let kwam be the WACC; Let ke be the cost of equity capital; Let k, be the cost of debt; and Let B and S be the market values of debt and equity, respectively, for the firm. Define B t S = V, the market value of the firm. Finally let T = the firm’s marginal tax rate.
Then,
In this formula, k,(l-T) is the after-tax cost of debt.
Pollutlon Preuentfon ReolewlAutumn 1994 45 7
Rfchard H . Torborg
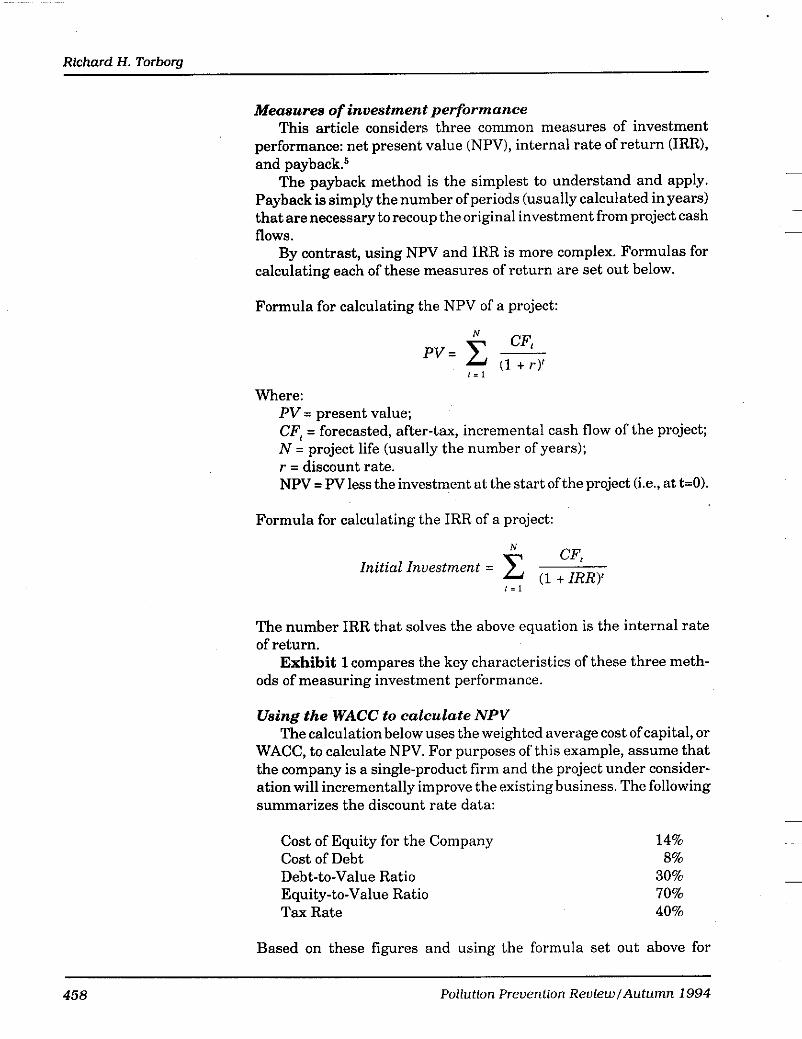
Measures of investment performance This article considers three common measures of investment
performance: net present value (NPV), internal rate of return (IRR),
The payback method is the simplest to understand and apply.
that are necessary to recoup the original investment from project cash flows.
By contrast, using NPV and IRR is more complex. Formulas for calculating each of these measures of return are set out below.
Formula for calculating the NPV of a project:
and payback.6 -
Payback is simply the number of periods (usually calculated in years) ~
-
CF, PV= ~
(1 t r)I 1 = 1
Where: PV = present value; CF, = forecasted, after-tax, incremental cash flow of the project; N = project life (usually the number of years); r = discount rate. NPV = PVless the investment at the start ofthe project (Le., at t=O).
Formula for calculating the IRR of a project:
CFt (1 t IRR)'
N
Initial Investment = i = l
The number IRR that solves the above equation is the internal rate of return.
Exhibit 1 compares the key characteristics of these three meth- ods of measuring investment performance.
Using the WACC to calculate NPV The calculation below uses the weighted average cost of capital, or
WACC, to calculate NPV. For purposes of this example, assume that the company is a single-product firm and the project under consider- ation will incrementally improve the existing business. The following summarizes the discount rate data:
Cost of Equity for the Company Cost of Debt Debt-to-Value Ratio Equity-to-Value Ratio Tax Rate
14% 8%
30% 70% 40%
Based on these figures and using the formula set out above for
458 Pollution Preuentlon ReulewlAutumn 1994
Capital Budgetlngfor Enulronmental Professlonals
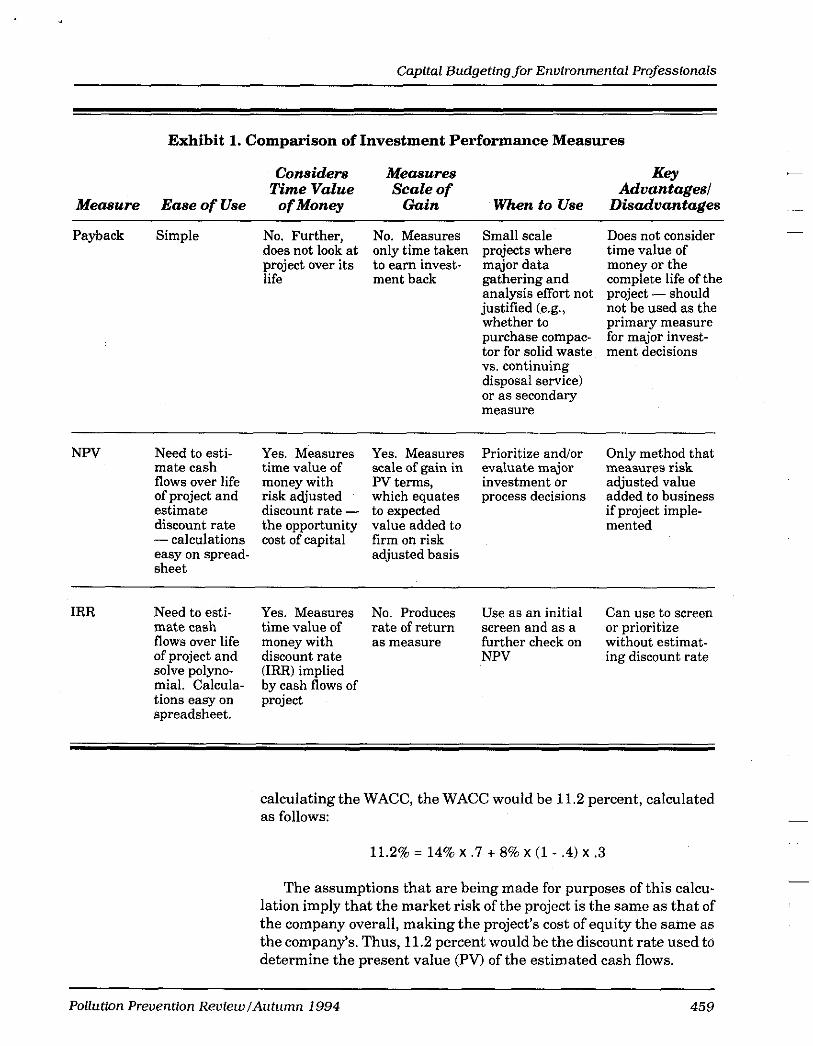
Exhibit 1. Comparison of Investment Performance Measures
Considers Measures Key Time Value Scale of Advantaged
Measure Ease of Use of Money Gain When to Use Disadvantages ~ ~ ~ ~~ ~
Payback Simple No. Further, No. Measures Small scale does not look at only time taken projects where project over its to earn invest- major data life ment back gathering and
analysis effort not justified (e.g., whether to purchase compac- tor for solid waste vs. continuing disposal service) or as secondary measure
Does not consider time value of money or the complete life of the project - should not be used as the primary measure for major invest- ment decisions
NPV Need to esti- mate cash flows over life of project and estimate discount rate - calculations easy on spread- sheet
Yes. Measures Yes. Measures Prioritize and/or Only method that time value of scale of gain in evaluate major measures risk money with PV terms, investment or adjusted value risk adjusted which equates process decisions added to business discount rate - to expected if project imple- the opportunity value added to mented cost of capital firm on risk
adjusted basis
IRR Need to esti- Yes. Measures No. Produces Use as an initial Can use to screen mate cash time value of rate of return screen and as a or prioritize flows over life money with as measure further check on without estimat- of project and discount rate NPV ing discount rate solve polyno- (IRR) implied mial. Calcula- tions easy on project spreadsheet.
by cash flows of
calculating the WACC, the WACC would be 11.2 percent, calculated as follows:
11.2% = 14% x .7 t 8% x (1 - .4) x .3
The assumptions that are being made for purposes of this calcu- lation imply that the market risk of the project is the same as that of the company overall, making the project’s cost of equity the same as the company’s. Thus, 11.2 percent would he the discount rate used to determine the present value (PV) of the estimated cash flows.
Pollution Preuentlon ReulewlAutumn 1994 459

Richard H. Torborg
Now suppose that the cash flows (calculated as shown in the examples set out above in the discussion of cash flow) are
Investment Year 1 Cash Flow Year 2 Cash Flow
$10,000 $5,500 $5,775
Note that Year 2 cash flow has been inflated by 5% ($5,775 = $5,500 x (1 t .05)); nominal cash flows have been matched with a nominal discount rate.
Thus, PV = $ 5 , 5 0 0 4 t .112) + $5,77541 t .112)’
= $4,946 + $4,670 = $9,616
= $ 3 8 4 NPV = $-10,000 t 9,616
The negative NPV indicates that the cash flows do not compensate for the investment on a risk-adjusted basis.
Using the WACC as a “hurdle rate” It is common to use the WACC as a “hurdle rate” for projects.
Under this approach, the internal rate of return (IRR) of a project is calculated and compared to the WACC hurdle rate. If the project’s IRR is larger than the hurdle rate, then the project is considered economically attractive.
The IRR for the project considered above (calculated using the formulasetoutpreviously for1RR)is 8.3 percent, less than the WACC of 11.2 percent - a result that would be expected since the NPV is negative. Thus, the project would be judged to be economically unattractive, because the IRR is less than the hurdle rate of 11.2 percent.
NPV and IRR versus the payback method
calculated as follows: The payback period for the project described above is 1.8 years,
1.8 = $10,000+5,500; or 1.8 = 1 + (10,000 - 5,500)+5,500
A project with a payback of less than two years sounds reasonably attractive-in fact, many companies set paybackperiodsoftwoyears as a cutoff for new projects. However, the other calculations described above indicate that the project would not be economically sound. Thus, doing these additional calculations demonstrates the defi- ciency of the payback method and explains in part why many larger companies have shifted to calculating NPV and IRR.6
460 Pollution Preucniion ReuiewlAutumn 1994
Capital Budgetlngfor Enuironmental Professionals
Currently used performance measures Over the years, a number of surveys have been conducted to
determine which measures of investment performance companies actually use. The trend is clearly toward the theoretically sound discounted cash flow (DCF) techniques (NPV and IRR). A 1985 survey' of the Fortune 500 companies, to which 367 companies responded, found that as a primary technique, 49 percent used IRR, 21 percent used NPV, and 19 percent used payback. Because of its simplicity, payback remained a popular secondary technique, with 35 percent of the companies using it for this purpose. Forty-eight percent of the firms used DCF techniques exclusively.
This same study summarized the results of other surveys that had been published over the period from 1959 to 1986. I t found, in addition to a clear increase in the popularity of DCF techniques, that the use of accounting rate of return as a primary technique dropped from 40 percent in 1959 to only 8 percent in 1986, and use of payback as a primary technique dropped from 42 percent to 19 percent.
Key points in using NPV and I R R There are several points to keep in mind when using the DCF
measures of investment performance discussed above to evaluate projects:
1.
Smallflrms should consider using the IRR as the primary measure of investment attractiueness and the NPVas a 2. seconda y measure.
3.
Calculate both IRR and NPV, ifpossible. (It is not necessary to estimate a discount rate in order to calculate IRR. Thus, because of the difficulty of estimating discount rates, small firms should consider using the IRR as the primary measure of investment attractiveness and the NPV as a secondary measure. This is, in practice, what the majority of large firms also do. However, keep in mind that without the NPV refer- ence, there is no measure of the scale of the gain.) The NPV procedure is valid for projects that are of the same risk class as the firm as a whole. If the firm is highly diversi- fied, or ifthe project is of a nature quite different from the usual business of the firm, then the firm's overall cost of equity capital should not be used for evaluating the project. Avoid the common error of using a discount rate (or WACC) that is too high.8 A discount rate above 20 percent, especially for incremental improvement projects, should be carefully reviewed. This rate woulddiscount a cash flow ten yearsoutby almost 84 percent: 1-41.W" - 0.16. For a discount rate of 12 percent, the result would be lt(1.12)10 = 0.32, or twice the weight as that arrived at by using20 percent. The effect of this error is to significantly devalue projects that have returns in the out years in comparison to projects that have close-in returns but taper off rapidly. It is important to note that many environmental projects fall into the former category because of their long project life and significant returns in later years.
Pollution Prevention Reulew/Autumn 1994 461

Rlchard H. Torborg
4. As a rule of thumb, the cost of equity capital should be somewhere between 10 percent and 15 percent for stable manufacturing businesses. This means the WACC will be somewhat lower, depending on the cost of debt a t the time of the project and the capital structure of the firm.
Cross-Sectional Links A project’s effects on other parts of the business - i.e., the cross-
sectional links between projects - can have a significant effect. Accordingly, these links, while often overlooked, should be properly considered in the capital budgeting analysis.
The following scenario describes the nature of cross-sectional links:
A project’s effects on other Parts ofthe business can h u e a slgnlflcant effect.
A firm is considering two projects for two distinct production lines (Line 1 and Line 2) that both use a particular listed toxic. The firm can implement recycling or materials substitution that eliminates the toxic. The summary below shows the results of the NPV calculations for the options for each production line:
Line Option 1 Substitution(S,) 1 Recycling(R,) 2 Substitution(S,) 2 Recycling(R,)
NPV 100 110 120 100
At first, it appears that recyclingis the better choice for Line 1, and substitution is the better choice for Line 2. However, after a closer look, the company discovers an unexpected result. When the effects of using the same technique on both lines are considered, consolida- tion of activities lowers some direct operating costs and some over- head costs, such as training and certain equipment costs. In fact, the cross-effect cost reduction is enough to lift the NPV of either technique on both lines above the NPVof the best mixed-technique choice. These conclusions can be summarized as follows:
Option Best mixed technique (R, + S,) Substitution on both lines (SI + S,) Recycling on both lines (R, t R,)
NPV 230 250 240
Time Series Links A company may invest in a project for the express purpose of
placingitself in a position to undertake other activities in the future. For example, an environmental technology company might invest in a research and development project that will provide the firm with a technology that can be tailored for several different markets. The ability to address a subset of these markets with a specific product
462 Pollution Preuentlon ReolewlAutumn 1994
) I *
Capital Budgeting for Enuironmental Professionals
The lnltlal project might well haue had a negative NPV !f the uafue of the future products were not consldered.
based on the technology is what the company has gained by investing in the project. Thus, in expending money for the R&D effort, the company would in effect be purchasing a valuable set of options that couldjustify the cost. However, the initial project might well have had anegative NPV ifthe value of the future products were not considered.
Looking a t time series links, a company might project that, through a series of investments, it can eliminate all toxics, emissions, and discharges from its manufacturing processes - in other words, the firm could become a “green” business. If this would open the possibility of entering substantial markets (such as green markets) that otherwise would not have been available, then the choice of entering these markets sometime in the future is an option that the company has purchased through investingin a series of projects that clean up its processes.
The estimation techniques discussed in this article are not ad- equate to value these “options.” Instead, special option valuation techniques must be used to quantitatively value projects of this type. These techniques arejust beginning to be applied to capital budgeting a n a l y ~ i s . ~
Because the quantitative valuation techniques are quite complex, it may be preferable to use a qualitative approach to this aspect of capital budgeting. In any case, it should be kept in mind that projects valued without consideration of the option value they can produce may fail to meet the firm’s acceptance criteria in NPV or IRR terms, even though they may in fact be economically viable when the value of such options is considered. For instance, the hypothetical company discussed above might be very likely to relax the criteria for projects that would open the “green” door for them.
Key Points in the Capital Budgeting Process Considering a project in an expanded context can improve deci-
sions that flow from the capital budgeting process. Points to remem- ber are as follows:
1. Calculation of incremental after-tax cash flows is the most time-consuming - but also most important - part of the exercise. A good understanding of the baseline cost structure is a necessary starting point from which to develop incremen- tal cash flows for a particular project.
2. Although determiningdiscount rates is theoretically complex, it need not be time-consuming; spend time on cash flow estimation rather than fine-tuning the discount rate. Uncer- tainty as to the rate can be handled by doing a sensitivity analysis. Excessively high rates (above 20 percent) should not be used for stable manufacturing businesses.
3. Cross-sectional links and time series links should be consid- ered an integral part of the capital budgeting analysis. If quantification obstacles are encountered (for instance, if the
Poflutlon Preuention ReuiewlAutumn 1994 463
Rtchard H. Torborg
complexityofquantifyingthese factors is beyond the company’s expertise), then consider these issues qualitatively.
4. Use the above results to evaluate the project in terms of the company’s business plan and thus its objectives.
5. Take the indicated action. + Notes 1. See S.C. Meyers,“FinanceTheory andFinancialStrategy,”Interfaces 14 (January- February 1984) at pp. 126-137.
2. See R.S. Kaplan and A.A. Atkinson, Aduanced Management Accounting, 2nd Ed., Prentice Hall, Englewood Cliffs, NJ, 1989.
For a manufacturing process using toxics, a simple but excellent comparison of a standard met system versus an ABC system is provided in Appendix A of S.E. Sefcik, N.S. Soderstrom, and C.H. Stinson, Accounting Through Green Colored Glasses: Environmental Accounting as an Integratiue Teaching Tool (manuscript, August 1993) (copies of the manuscript can be obtained by calling the University of Texas a t Austin (512) 471-5225 or the University of Washington (206) 543-4368). In addition, a techniquedeveloped by the Tellus Institute called Total Cost Assessment (TCA) should be very helpful in developing cost information, See A.L. White, M. Becker, and D. E. Savage, ‘73nvironmentally Smart Accounting: Using Total Cost Assessment to Advance Pollution Prwention,” Pollution Prevention Reuiew, Vol. 3, No. 3, Summer 1993.
3. Since depreciation is a deductible expense for tax purposes, the net effect of adding depreciation back to net income is to credit the firm with a depreciation tax shield equal to the tax rate times the amount of the depreciation. This is a n actual cash saving accruing to the business.
4. For further information on cost-of-capital issues, the reader can review basic financial texts such as R.A. Brealey and S.C. Myers, Principles of Corporate Finance, 4th Ed., McGraw-Hill, Inc., New York, 1991; S.A. Ross, R.W. Westerfield and J.F. Jaffe. Corporate Finance, 3rd Ed., Irwin, Homewood, Illinois and Boston, Massachu- setts, 1993; and R.C. Higgins, Analysis for Financial Management, 3rd Ed., Irwin, Homewood, Illinois andBoston, Massachusetts, 1992. In addition, HarvardBusiness School Case 9-276-183, Diversification, the Capital Asset Pricing Model and the Cost ofEquity Capital, provides a n accessible and usabledescription ofdiversification, the cost ofequity capital, and the Capital Asset Pricing Model, which is probably the most widely used tool for calculating the cost of equity capital. B. Rosenberg and A. Rudd, ‘The Corporate Uses of Beta,” in Issues i ~ i Corporate Finance, Stern, Stewart, Putnam & Macklis, New York, 1983, provides several methods for determining the cost of capital for capital budgeting applications. A brief but excellent teaching note onmatchingcash flows to discount rates is C.M. Young, Valuation: Discounted Cash Flow Techniques Teaching Note, Finance Department, Bentley College, Waltham, Massachusetts, 1992, (617) 891-2992.
5. This article does not consider accounting rate of return or profitability index, since these techniques enjoy limited use in practice.
6. See also S.H. Kim, C. Trevor, and S. H. Kim, “Do Executives Practice What Academics Preach?,” Managernent Accoumting (November 1986).
7. Id.
8. R.S. Kaplan and A.A. Atkinson, Aduanced Management Accounting, 2nd Ed., Prentice Hall, Englewood Cliffs, NJ, 1989.
9. See N.A. Nichols, “Scientific Management a t Merk,” Haruard Business Reuiew (January-February 1994), and R.D. Spitzer, ‘Valuing TQM Through Rigorous Financial Analysis,” Quality Progress (July 1993), for a description of recent appli- cations, and N. Kulatilaka and A.J. Marcus, “Project Valuation Under Uncertainty: When Does DCF Fail?,” Journal ofApplied Corporate Finance (Vol. 5, Fall 19921, for a n explanation of the limits of DCF techniques.
~~
464 Pollution Prevention ReuiewlAutumn 1994