Capillary Pressure & Relative Permeability Petrophysical Reservoir Models
Upload
ahmed-raafatCategory
view
79download
2
Petrophysics MSc Course Notes Capillary Pressure Exercise
Dr. Paul Glover Page i
CAPILLARY PRESSURE EXERCISE
This exercises uses data from the Elysian Field.
Well: 24-1XDepth: 3100 mLithology: Slightly shaly sandstone (90%sandstone, 10% shale)
A mercury injection capillary pressure experiment has been carried out on a core plug from well 24-1X of the Elysian Field at a depth of 3100 m.
The following data were collected:
Cap. Press.(Hg-Air)@25oC
(psi)
SHg SAir Sw So Cap. Press.(Oil-Water)
@ 25oC(psi)
Cap. Press.(Oil-Water)@ Reservoir
Temp.(psi)
HeightaboveFWL(m)
Changein Hg
Satura-tion
PoreThroatRadius(µµm)
1.00 0 1 0.16 106.722.00 0 14.00 0 17.00 0 19.00 0.05 0.959.03 0.12 0.88
11.70 0.25 0.7517.00 0.38 0.6224.00 0.46 0.5437.50 0.50 0.5057.89 0.55 0.4584.50 0.61 0.39
114.00 0.70 0.30154.00 0.77 0.23200.00 0.81 0.19270.00 0.85 0.15
Fluid System Interfacial Tension (dynes/cm) Wetting Angle (degrees)
Mercury-Air 368 0Oil-Water @ 25oC 35 0Oil-Water @ Reservoir Conditions 28 20
In the following calculations use values for interfacial tension and wetting angles given in the tableabove.
(a) Convert the mercury-air capillary pressure to oil-water capillary pressure at 25oC and fill inthe table.
(b) Fill in the appropriate values for water saturation and oil saturation that apply to the datacalculated in (a).

Petrophysics MSc Course Notes Capillary Pressure Exercise
Dr. Paul Glover Page ii
(c) Convert the oil-water capillary pressure at 25oC to oil-water capillary pressure at reservoirconditions and fill in the table.
(d) Draw a graph of the capillary pressures for both the oil-water at 25oC and the oil-watercapillary pressure at reservoir conditions (y-axis, linear 0 to 30 psi) against the saturation ofthe wetting phase (air or water) (x-axis, linear 0 to 1.00).
0
5
10
15
20
25
30
0 0.2 0.4 0.6 0.8 1
Saturation of Wetting Phase (Air or Water)
Cap
illar
y P
ress
ure
(p
si)
Petrophysics MSc Course Notes Capillary Pressure Exercise
Dr. Paul Glover Page iii
(e) Given that the reservoir interval contains both water and oil, and that the fluid pressuregradient in the oil leg is 1.015 psi/m, and in the water leg is 1.45 psi/m, calculate the heightabove the free water level for each value of capillary pressure, and insert the data into thetable.
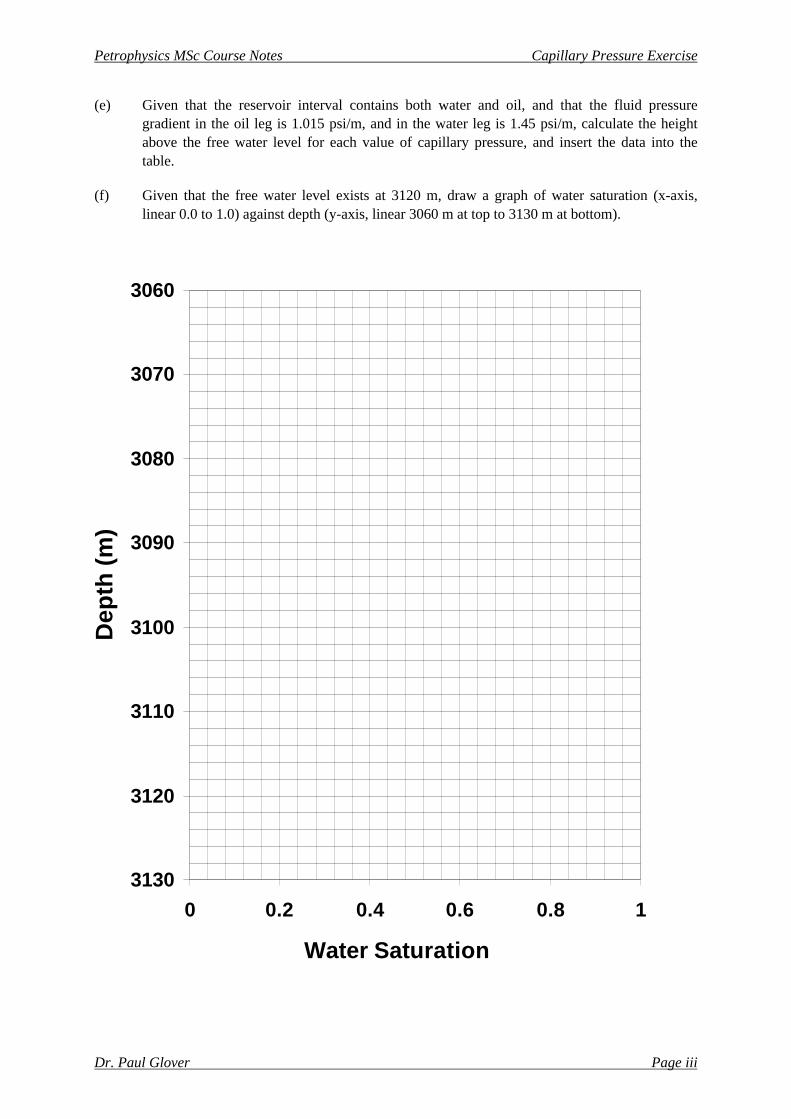
(f) Given that the free water level exists at 3120 m, draw a graph of water saturation (x-axis,linear 0.0 to 1.0) against depth (y-axis, linear 3060 m at top to 3130 m at bottom).
3060
3070
3080
3090
3100
3110
3120
3130
0 0.2 0.4 0.6 0.8 1
Water Saturation
Dep
th (
m)

Petrophysics MSc Course Notes Capillary Pressure Exercise
Dr. Paul Glover Page iv
(g) Mark the free water level on the graph.
(h) At what depth is the oil-water contact (OWC), and mark it on the graph?
(i) What are the water and oil saturations at the following depths: 3125 m, 3119 m, 3110 m, 3090m?
(j) What, approximately, is the value of the irreducible water saturation?
(k) If the rock sample had a greater percentage of shale, would you expect a higher or a lowervalue of Swi, and why? Draw on the graph created in part (f) an example of the curve thatwould be produced if the lithology was a sandy shale (say, 40% sandstone, 60% shale).
(l) Equation (4.4) in the notes relates capillary pressure to interfacial tension, wetting angle andthe radius of the aperture in which the fluid interface exists. This equation is for capillarypressure in dynes/cm2, interfacial tension in dynes/cm, wetting angle in degrees, and radius incm. If you multiply the right hand side of the equation by 0.145, the equation is valid forcapillary pressure in psi, interfacial tension in dynes/cm, wetting angle in degrees, and radiusin microns.
Rearrange this modified equation to calculate the radius of the aperture (in microns) from themercury-air capillary pressure (in psi).
Calculate the aperture values for each value of mercury-air capillary pressure, and insert theresults into the table. Note that these apertures represent the radii of pore throats in the rock.
(m) Calculate the incremental increase in mercury saturation for each row of the table, and insertthe results into the table.
(n) Draw a graph of incremental increase in mercury saturation (y-axis, linear 0.0 to 0.14) againstthe calculated radius (x-axis, logarithmic 1000 to 0. 1).
(o) Write a brief paragraph interpreting the physical meaning of this graph.
(p) Given that the graph calculated in (n) is for the rock sample at 3100 m, which is a sandstonewith a small amount of shale (say 90% sandstone, 10% shale), draw freehand on the graphconstructed in (m) the likely curve for a sandy shale (say 40% sandstone, 60% shale).
(q) Justify your choice of curve in (o).

Petrophysics MSc Course Notes Capillary Pressure Exercise
Dr. Paul Glover Page v
0
0.02
0.04
0.06
0.08
0.1
0.12
0.14
0.1 1 10 100 1000
Pore Throat Diamater (microns)
Ch
ang
e in
Hg
Inje
cted


![The Influence of Capillary Entry-Pressure Representation on CO2 … · 2021. 7. 29. · capillary transition zone [10], the impact of using different capillary-pressure models on](https://static.fdocuments.us/doc/165x107/6139f8c80051793c8c00c7a2/the-influence-of-capillary-entry-pressure-representation-on-co2-2021-7-29-capillary.jpg)