
Capillary Tube Test Fixture
128
School of Science, Engineering and Technology Department of Engineering Capillary Tube Test Fixture By Jack Nunnington Ryan Dixon Hannah Wilson Justin Dylla Senior Design Project Presented to the Department of Engineering In Partial Fulfillment of the Requirements For the Degree of Bachelor of Science In MECHANICAL ENGINEERING San Antonio, Texas April 2021 Supervising Advisor: Dr. Juan Ocampo ASSOCIATE PROFESSOR OF MECHANICAL ENGINEERING
Transcript of Capillary Tube Test Fixture

School of Science, Engineering and Technology
Department of Engineering
Capillary Tube Test Fixture
By Jack Nunnington
Ryan Dixon
Hannah Wilson
Justin Dylla
Senior Design Project Presented to the Department of Engineering
In Partial Fulfillment of the Requirements
For the Degree of
Bachelor of Science
In
MECHANICAL ENGINEERING
San Antonio, Texas
April 2021
Supervising Advisor:
Dr. Juan Ocampo ASSOCIATE PROFESSOR OF MECHANICAL ENGINEERING
i
ABSTRACT
Our senior design project is about finding a new test fixture and procedure for capillary
tubes for Friedrich Air Conditioning units. Capillary tubes are a critical part for the performance
of an air conditioner. Capillary tubes are simply copper tubes with a small bore (diameters
generally ranging down to 0.50 mm) with a length over diameter ratio greater than twenty. They
are used for two purposes: a meter for the refrigerant and helps the expansion process between
condenser and evaporator in those refrigeration systems. Friedrich Air Conditioning requires a
new capillary tube testing procedure because of an issue they recently had with two different
suppliers. The original supplier of capillary tubes for Friedrich had an explosion at the factory, so
the production of capillary tubes had to stop. In reaction to this, Friedrich received a new
capillary tube from another supplier whose capillary tubes had the same specifications as the old
supplier. Upon testing the capillary tubes with the current test procedure, the new suppliers'
capillary tubes passed. However, once the capillary tubes were installed into the air-conditioning
units, they failed to perform. Friedrich stopped receiving capillary tubes from this new supplier.
They now want a test procedure to find future quality issues if a situation like this arises again.
The testing method we develop, and build will have the potential to be incorporated into the
Friedrich Engineering test lab in San Antonio as well as at their manufacturing facility in
Monterrey, Mexico.

ii
ACKNOWLEDGEMENTS
We would like to thank Lionel Lopez (Friedrich Air Conditioning) for providing us with
the necessary guidance we needed to develop our project. We thank Rene Esqueda (Friedrich Air
Conditioning) for helping us with the technical side of building and testing. We thank
David Schaffer (Friedrich Air Conditioning) for helping us with the software and electrical side
of our project. We thank Sergio Neaves (Friedrich Air Conditioning) for testing the capillary
tubes’ performance in the A.C. units.
We also would like to thank Dr. Juan Ocampo (St. Mary’s University) for helping us stay
on track and guiding us in our senior Design. We thank Dr. Nazia Afrin (St. Mary’s University)
for giving advice on the necessary calculations needed for the fluid dynamics theoretical
analysis. Lastly, we thank Vernon Wier (St. Mary’s University) for allowing us access to the labs
on campus and showing us how to effectively use the machines.

iii
TABLE OF CONTENTS
Abstract ...................................................................................................................................... i
Acknowledgements ................................................................................................................... ii
Table of Contents ..................................................................................................................... iii
List of Figures ............................................................................................................................v
List of Tables .......................................................................................................................... vii
1. INTRODUCTION .................................................................................................................................................. 7
2. BRIEF OVERVIEW OF FINAL SYSTEM ..................................................................................................... 12
3. STANDARD DISSCUSION .............................................................................................................................. 13
3.1.1. Arrangment Of Apparatus ........................................................................................................ 13
3.1.2. Apparatuses Configurations ..................................................................................................... 13
3.1.3. Procedure .................................................................................................................................. 15
3.1.4. Correction To Standard Basis For Alternative Method ............................................................ 16
4. MASS FLOW RATE SYSTEM ........................................................................................................................ 17
5. SUMMARY OF THE ENGINEERING METHOD ....................................................................................... 32
5.13.1. 80/20 Extruded Aluminium .................................................................................................... 67
5.13.2. Fasteners and Brackets ........................................................................................................... 69
5.13.3. Quote from Shepard Controls................................................................................................. 70

iv
5.13.4. Panels and Worktops .............................................................................................................. 71
6. UNEXPECTED PROBELEMS ......................................................................................................................... 73
7. SYSTEM PROTOTYPE RESULTS ................................................................................................................. 75
8. FINITE ELEMENT ANALYSIS ....................................................................................................................... 94
9. FINAL DESIGN OF APPARATUS ................................................................................................................. 99
10. FINAL DESIGN OF TABLE UNIT AND NITROGEN CART .............................................................. 100
11. CONSTRUCTION PROCESS ....................................................................................................................... 104
12. COMPLETED FABRICTATION OF TABLE UNIT AND NITROGEN CART ................................. 107
13. COMPLETED NEW SYSTEM ..................................................................................................................... 109
14. FURTHER IMPLEMENTION AND DEVELOPMENT .......................................................................... 113
15. REFERENCES ................................................................................................................................................. 117
16. SMC CAPSTONE REFLECTIONS ............................................................................................................. 118
17. APPENDICES .................................................................................................................................................. 122

v
LIST OF FIGURES
Figure 1: Capillary Tube ............................................................................................................................... 8
Figure 2: Completed New Test Fixture. ...................................................................................................... 12
Figure 3: Friedrich’s Current Test Systems Design Is Based Off .............................................................. 13
Figure 4: Inlet Pressures For Deciding Capillary Tube Flow Rate ............................................................. 14
Figure 5: Current Testing Table Unit .......................................................................................................... 17
Figure 6: Label For Failed Capillary Tubes ................................................................................................ 18
Figure 7: Current Test System Configuration ............................................................................................. 19
Figure 8: Current Test Fixture Design Made In Solidworks. ...................................................................... 20
Figure 9: Ramer’s Connector ...................................................................................................................... 22
Figure 10: Example Of Ramer’s Product Sheet .......................................................................................... 22
Figure 11: Material Specification Of A Capillary Tube ............................................................................. 23
Figure 12: Cad Drawing For Assemblies .................................................................................................... 24
Figure13: Cad Drawing For Assemblies ..................................................................................................... 24
Figure 14: Nitrogen Tank In Middle Of Room ........................................................................................... 27
Figure 15: Testing Program Main Page ...................................................................................................... 28
Figure 16: Capillary Tube Part Selector ..................................................................................................... 29
Figure 17: Simulator Program .................................................................................................................... 30
Figure 18: Passing Output When Test Capillary Tube Or Assembly ......................................................... 31
Figure 19: Schematic Absolute Roughness Of Pipe ................................................................................... 33
Figure 20: First Concept For New Test System .......................................................................................... 34
Figure 21: First Version For Parallel Design .............................................................................................. 35
Figure 22: Second Version For Parallel Design .......................................................................................... 36
Figure 23: Third Version For Parallel Design ............................................................................................ 37
Figure 24: Fourth Version For Parallel System Design .............................................................................. 38
Figure 25: Final Version Of Testing System .............................................................................................. 39
Figure 27: Computer System 2 Flow Chart ................................................................................................ 40
Figure 28: Parallel System Flow Chart ....................................................................................................... 41
Figure 29: Moody Diagram ....................................................................................................................... 45
Figure 30: Moody Friction Factor Check ................................................................................................... 47
Figure 31: Stress Diagram Of Thick-Walled Vessel................................................................................... 50
Figure 32: 3d Stress States .......................................................................................................................... 51
Figure 33: Finite Element Analysis Of Stresses On Capillary Tube .......................................................... 55
Figure 34: Table Sketch With Dimensions ................................................................................................. 56
Figure 35: First Sketch New Table Unit ..................................................................................................... 57
Figure 36: Second Sketch New Table Unit ................................................................................................. 57
Figure 37: Extruded Aluminum .................................................................................................................. 58
Figure 38: Gyrovu 11” Arm ........................................................................................................................ 60
Figure 39: First Solidworks Design Of Table Unit ..................................................................................... 61
Figure 40: Second Solidworks Design Of Table Unit ................................................................................ 62
Figure 41: Third Solidworks Design Of Table Unit ................................................................................... 63
Figure 42: Fourth Solidworks Design Of Table Unit.................................................................................. 64
Figure 43: Fifth Solidworks Design With Nitrogen Tank Detached .......................................................... 65
Figure 44: Fifth Solidworks Design Of Table Unit .................................................................................... 66
Figure 45: Sixth Solidworks Design Of Table Unit .................................................................................... 66
Figure 46: 80/20 Cad Models Produced With Shepard Controls. ............................................................... 68
Figure 47: 1530-S 80/20 Used On Base Of Nitrogen Tank. ....................................................................... 68
Figure 48: Final Quote From Shepard Controls .......................................................................................... 70
Figure 49: Workspace Configuration .......................................................................................................... 72

vi
Figure 50: Experiment #1 Testing Device Configuration ........................................................................... 73
Figure 51: Nitrogen Flow Path ................................................................................................................... 74
Figure 52: Solution To Creating Back Pressure .......................................................................................... 74
Figure 53: Experiment #2 Diagram ............................................................................................................ 75
Figure 54: Experiment #2 Testing System .................................................................................................. 76
Figure 55: Mass Flow Rate Vs Pressure Drop Graph For Pn: 1389915 ..................................................... 80
Figure 56: Mass Flow Rate Vs Pressure Drop Graph For Pn: 03760518 ................................................... 80
Figure 57: Mass Flow Rate Vs Pressure Drop Graph For Pn: 03760553 ................................................... 81
Figure 58: Mass Flow Rate Vs Pressure Drop Graph For Pn: 03760482 ................................................... 81
Figure 59: Mass Flow Rate Vs Pressure Drop Graph For Pn: 03760451 ................................................... 82
Figure 60: Box & Whisker Plot For National Copper Vs Minallum (Pn: 03760518) ................................ 84
Figure 61: Mass Flow Vs Pressure Plot For National Copper Vs Minallum (Pn: 03760518) .................... 88
Figure 62: Box & Whisker Plot For National Copper Vs Minallum (Pn: 03760553) ................................ 90
Figure 63: Mass Flow Vs Pressure Plot For National Copper Vs Minallum (Pn: 03760518) .................... 93
Figure 64: Loading Regions ........................................................................................................................ 94
Figure 65: Stress Finite Element On Table Frame ...................................................................................... 95
Figure 66: Displacement Finite Element On Table Frame ......................................................................... 96
Figure 67: Stress Finite Element On Cart Frame ........................................................................................ 97
Figure 68: Displacement Finite Element On Cart Frame............................................................................ 98
Figure 69: Labeled Cad Drawing Of Final Version Of Testing Apparatus ................................................ 99
Figure 70: Dimetric View Of Final Version Of Table Unit ...................................................................... 100
Figure 71: Dimensions Of Final Version Of Table Unit ........................................................................... 101
Figure 72: Dimetric View Of Final Version Of Nitrogen Cart ................................................................. 102
Figure 73: Dimensions Of Final Version Of Nitrogen Cart ...................................................................... 103
Figure 74: Dimensions Of Final Version Of Nitrogen Cart ...................................................................... 104
Figure 75: Assembled 80/20 Framing ....................................................................................................... 107
Figure 76: Table And Cart Complete Construction .................................................................................. 108
Figure 77: New Workspace ...................................................................................................................... 109
Figure 78: New Testing Device ................................................................................................................ 110
Figure 79: Complete Shelf, Cart And Testing Device .............................................................................. 111
Figure 80: Under Workspace Storage ....................................................................................................... 112
Figure 81: Profilometer Surface Roughness Optics .................................................................................. 115

vii
LIST OF TABLES
Table 1: Tasks Each Member Will Be Involved With. ............................................................................... 11 Table 2: Representation Of Data From Testing Apparatus ......................................................................... 15 Table 3: Mass Flow System Components ................................................................................................... 21 Table 5: Approximate Physical Properties Of Gases At Standard Atmospheric Pressure .......................... 44 Table 6: Equivalent Roughness For New Pipes .......................................................................................... 46 Table 8: Stresses On Select Capillary Tubes Inner Diameter. .................................................................... 53 Table 9: Stresses On Select Capillary Tubes Out Diameter. ...................................................................... 54 Table 10: Required Lengths And Quantities Of 80/20 Extruded Aluminum ............................................. 67 Table 11: Connectors Required To Make Table Unit And Nitrogen Tank Cart. ........................................ 69 Table 12: Pressure Drop Theory Results .................................................................................................... 77 Table 13: Friction Factors Data Collected For PN: 03760518 ................................................................... 83 Table 14: AC Unit Performance Testing Results For PN: 03760518 ......................................................... 85 Table 15: Mass Flow Data At Increasing Input Pressures For PN: 03760518 ........................................... 86 Table 16: AC Unit Performance Testing Results For PN: 03760518 ......................................................... 87 Table 17: Tubes Selected For Performance Testing PN: 03760553 ........................................................... 89 Table 18: AC Unit Performance Testing Results For PN: 03760553 ......................................................... 91 Table 19: Mass Flow Data At Increasing Input Pressures For PN: 03760553 ........................................... 92 Table 20: Construction Process ................................................................................................................ 106
7
1. INTRODUCTION
COMPANY DESCRIPTION
Since its founding in 1883, Friedrich Air Conditioning Co. has had one manufacturing
standard – quality without compromise. Today, Friedrich is recognized as the top brand of
specialty air treatment products for the worldwide market, offering differentiated solutions for
room air conditioning, dehumidification, and air purification. Friedrich’s inventions commitment
to quality without compromise sparked what would become 135 years of steady growth and
development for this legendary San Antonio business.
PROBLEM STATEMENT
Our project’s goal is to create a new testing system for Friedrich because they have
recently encountered a problem with a new capillary tube supplier. Fredrich use to get some of
its capillary tubes from a supplier called National copper. Due to an incident this supplier was no
longer able to supply Fredrich with capillary tubes. Fredrich sourced a new supplier, Minallum
and ordered what appeared to be identical capillary tubes to the old supplier. The new capillary
tubes passed Fredrich’s current test system which is based off ASHRAE standard 28. However,
once the capillary tubes from the new supplier were installed into the system their performance
was failing causing the air conditioning units to have significantly less cooling capacity. So
therefore, the problem we are aiming to solve is how can we find out if two seemingly identical
capillary tubes or assemblies are in fact identical and supply a reliable test that will find any
inherent defects from a new capillary supplier.

8
OBJECTIVE
The major deliverable for our capillary tube project is to produce a table unit that can
accurately determine whether a capillary tube is performing at the correct specification. We also
know that this system will be required to be compatible with Friedrich’s metrics data recording
system. This will also be needed for current work order equipment tracking and first pass yield.
Additionally, our testing system will have new test metrics that will need to be integrated into the
current data recording system.
One of our team's main goals of the new capillary tube test fixture is the safety of the
engineer using the testing apparatus. We will focus heavily on ensuring that the new testing
apparatus we produce will have procedures in place so that it is safe to use and not pose any
health risks. The test apparatus will use pressurized nitrogen to test capillary tubes. Capillary
tubes are shown in Figure 1 below. While this is a relatively stable compound it does pose some
safety hazards. If heated to a certain temperature it can explode which can cause suffocation,
burns, and frostbite.
Figure 1: Capillary Tube

9
Another major goal of our testing system will be an effective calibration procedure. The
apparatus we design and build, will need to be constantly recalibrated. This will ensure that the
capillary tubes will not pass the test when in fact they would fail when installed into an air
conditioning unit. The apparatus we create may have some uncertainties or errors when being
used. So, another objective of ours to try to minimize and eliminate any possible uncertainties or
errors. In order to verify that our apparatus is working as intended it will need to be verified with
an extensive Gage repeatability and reproducibility (GR&R) study. This study is a series of
measurements to certify that the output is the same value as the input. Also, the same
measurements are obtained under the same operating conditions over a set duration.
LITERATURE SEARCH
The main source of information will come from the ASHRAE STD 28, this document has
a lot of information on how capillary tubes should be tested. Additionally, we will get
information from journals written about capillary tube testing. Initial research shows that one of
the main ways that capillary tubes fail is when debris or dirt find its way into the tube. This
blocks the refrigerant from getting through the tubes and to the evaporator and compressor.
Another way that a capillary tube can fail is when the system becomes overcharged. This allows
for liquids especially water to enter the lines and over time cause damage to the compressor.
However, since the tubes we are testing are new, they could be passing the test but at the same
time have issues once they are put into the units that cause them to underperform. Through
reading more journals and analysis we will need to find more clues to why the tubes have
underlying issues. To create the new testing system, we will also need to reference user manuals
and data sheets for the system components such as the data sheets we have found from Ramer
[8].

10
ENGINEERING CONSTRAINTS & REQUIREMENTS
Since we are working with Friedrich for our project are constraints come from what the
room dimensions and design layout that they are looking for. We will also be using ASHRAE
Standard 28 which applies to capillary tube testing and Friedrich currently uses information of
the standard as well. The size of the capillary tubes being tested vary which creates a constraint
on which connectors we will need.
• If possible, we should not use pneumatics.
• The test fixture should be contained in a table unit with dimensions that will ensure that it can
easily fit through a door.
• It should run on 115 VACS (volts AC power).
• Capillary tubes come in different inner and outer diameters, so the system connection fixtures
need to be flexible to fit the varying diameters.
• Making sure that the test device is correctly calibrated in order to retrieve the correct data when
testing the tubes. This constraint is from ASHRAE standard 28.
• The dry nitrogen supply has a minimum pressure of 850 kPa and the maximum dew point of -
32°C. This constraint is from ASHRAE standard 28.
PROPOSED SOLUTIONS
Our first step to find a solution to the problem statement we are going to solve, is running
tests on both the different manufactures capillary tubes. After determining that there were no
obvious issues such as bending, buckling or defects we posed the following solutions to solve why
the current test system was passing tubes when they were failing. This is a list of the proposed
solutions we created at the beginning of the project.
• Testing the capillary tubes with a different gas or fluid.

11
• Doing a longer more vigorous test on select capillary tubes.
• Creating a new calibration method for accurately calibrating testing apparatus.
• Changing the suppliers of the system components and creating an identical system to the
ASHRAE STD 28 standard.
• Adding a mass flow meter and pressure transducer at the end of the capillary tube to be able
to find the margin of error between calculations and results.
• Testing capillary tubes at different pressures.
DIVISION OF LABOR
Table 1 below shows how tasks will be distributed in our team. In general, for the fall
semester Jack and Hannah will be in responsible for the design, development, and calculations
for the new testing apparatus. Justin and Ryan will handle the computer aided design work and
designing the new table unit. In the spring semester the whole team will handle manufacturing
and prototyping the new test system. Hannah and Justin will be in charge of testing the new
apparatus. Jack and Ryan will be in charge of organizing the electronic systems required for the
new test apparatus.
HANNAH JACK JUSTIN RYAN
RESEARCH DESIGN CALCULATIONS ANALYSIS CAD TABLE CAD APPARATUS PROTOTYING MANUFACTURING TESTING ELECTRONICS REPORT WRITING
Table 1: Tasks each member will be involved with.

12
2. BRIEF OVERVIEW OF FINAL SYSTEM
Figure 2 is an image of the new test fixture found at Friedrich’s Design and Development
facility in San Antonio. The project can be broken down into three key parts, the testing
apparatus, the table unit which the testing apparatus is connected to as well as a cart that holds
nitrogen carts required for the testing process. The following sections will explain in detail how
we designed and constructed the new test fixture.
Figure 2: Completed new test fixture.

13
3. STANDARD DISSCUSION
ASHRAE STD 28
This standard is vital to our project because it gives us a baseline of how to create test
system for capillary tubes. There are two methods for testing capillary tubes outlined in the
standard that use dry nitrogen. This is because capillary tubes are made of copper and having any
fluid in them will cause oxidization meaning the tubes cannot go into a commercial AC unit.
Each method, the traditional and the alternative help determine the capillary tubes’ flow capacity
used as a metering device. These tests give the user an idea how the capillary tube will function
inside an actual air conditioning machine.
3.1.1. ARRANGMENT OF APPARATUS
Figure 3: Friedrich’s Current Test Systems Design Is Based Off [1]
3.1.2. APPARATUSES CONFIGURATIONS
(Figure 3 shows each test component and is explained below)
a. A supply of dry nitrogen (1) at a minimum pressure of 850 kPa gage (123.3 psig).
b. An on/off main solenoid switch (2).
14
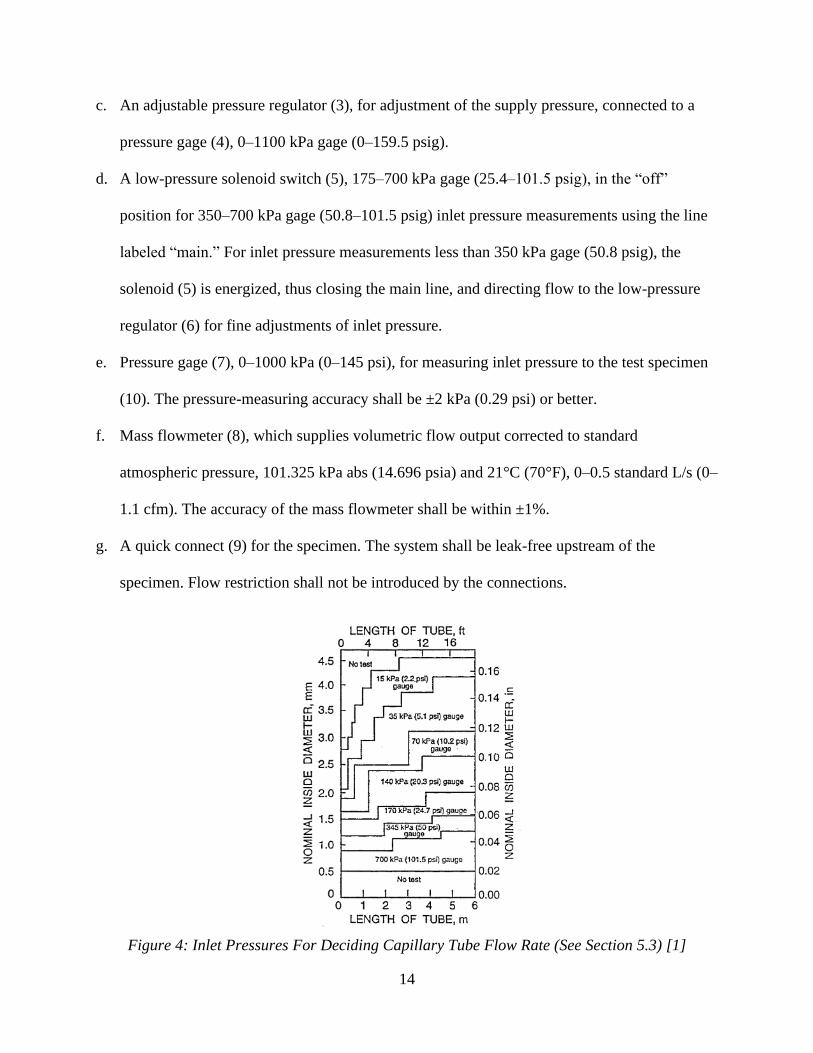
c. An adjustable pressure regulator (3), for adjustment of the supply pressure, connected to a
pressure gage (4), 0–1100 kPa gage (0–159.5 psig).
d. A low-pressure solenoid switch (5), 175–700 kPa gage (25.4–101.5 psig), in the “off”
position for 350–700 kPa gage (50.8–101.5 psig) inlet pressure measurements using the line
labeled “main.” For inlet pressure measurements less than 350 kPa gage (50.8 psig), the
solenoid (5) is energized, thus closing the main line, and directing flow to the low-pressure
regulator (6) for fine adjustments of inlet pressure.
e. Pressure gage (7), 0–1000 kPa (0–145 psi), for measuring inlet pressure to the test specimen
(10). The pressure-measuring accuracy shall be ±2 kPa (0.29 psi) or better.
f. Mass flowmeter (8), which supplies volumetric flow output corrected to standard
atmospheric pressure, 101.325 kPa abs (14.696 psia) and 21°C (70°F), 0–0.5 standard L/s (0–
1.1 cfm). The accuracy of the mass flowmeter shall be within ±1%.
g. A quick connect (9) for the specimen. The system shall be leak-free upstream of the
specimen. Flow restriction shall not be introduced by the connections.
Figure 4: Inlet Pressures For Deciding Capillary Tube Flow Rate (See Section 5.3) [1]

15
3.1.3. PROCEDURE
Before conducting tests on capillary tube, it must be considered that the capillary tubes
are preferably tested at a straight length rather than being formed. If the limitations of the test
apparatus make it necessary to coil or bend the specimen, the smallest radius of bend shall not be
less than 300 mm (11.8 in.). The following steps are in reference to Figure 3.
1. With the main solenoid valve off and no flow, install the capillary tube as shown in Figure 5
in the quick-connect fixture.
2. Adjust the pressure gage (7) and flowmeter (8) to zero as recommended by the manufacturer.
3. Open the nitrogen supply (1) and turn on the main solenoid switch (2)
4. Adjust the inlet pressure indicated on the pressure gage (7) by using the pressure regulator
(3). If the inlet pressure is less than 350 kPa gage (50.8 psig), turn on the solenoid (5) to
bypass the main line and direct the nitrogen flow through the low-pressure regulator (6) for
finer flow adjustments. The required inlet pressure is determined from Figure 4.
5. The nitrogen volumetric flow rate converted to the condition of 101.325 kPa abs (14.696
psia) and 21°C (70°F) shall be read from the flowmeter (8). A flow reading shall be taken
only when the flowmeter shows no fluctuations.
6. Data presentation: (Shown in Table 2)
Table 2: Representation of Data from Testing Apparatus[1]

16
8. A laboratory standard capillary tube developed in-house after equipment installation and
calibration should be kept for later equipment check.
3.1.4. CORRECTION TO STANDARD BASIS FOR ALTERNATIVE METHOD
The flow rate obtained from the testing apparatus shall be corrected for the barometric
pressure during the test. If the pressure is different from the standard pressure of 101.325 kPa abs
(14.696 psia) the equation below shall be used standardize the results.
𝑸𝒔 = 𝑸𝒎 𝑷𝒔𝑷𝒃 ((𝒓𝒔
𝟐 − 𝟏)
𝒓𝒕𝟐 − 𝟏
)
𝟎.𝟓
= 𝑸𝒎 𝑷𝒔𝑷𝒃
(
((𝑷𝒕𝒈 + 𝑷𝒔𝑷𝒔
)𝟐
− 𝟏)
(𝑷𝒕𝒈 + 𝑷𝒃𝑷𝒃
)𝟐
− 𝟏)
𝟎.𝟓
Where,
Qs = volumetric flow rate of dry nitrogen, L/s (cfm) at 21°C (70°F) and 101.325 kPa abs
(14.696 psia)
Qm = volumetric flow rate read from the meter, L/s (cfm)
Pb = corrected barometric pressure, kPa abs (psia)
rs = absolute pressure ratio across tube if discharge has been to standard barometric
pressure, dimensionless
rs = (Ptg + Ps)/Ps
Ptg = gage pressure at inlet to tube at time of test, kPa gage (psig)
Ps = standard pressure 101.325 kPa abs (14.696 psia)
rt = absolute pressure ratio across tube at time of test, dimensionless; and
rt = (Ptg + Pb)/ Pb

17
4. MASS FLOW RATE SYSTEM
SYSTEM OVERVIEW
Figure 5 is a photograph our team took on our first visit to Friederichs facility in San
Antonio. When looking at Fredrich’s current test system we immediately noticed some key
features and problems. On the left-hand side of the table is where the computer box is mounted
to the legs of the table unit. On the left-hand side of the backboard of the table unit is where the
testing system is mounted on an extruded aluminum framing which is attached to a steel peg
board. At the top of the pegboard there is storage box that has useful tools in it such as
Micrometers that measure internal and external diameters of capillary tubes. Attached to the
bottom of this storage box is fluorescent light. On the left-hand side of the table is where the
computer monitor, keyboard, and mouse are found which are required to interact with the testing
program.
Figure 5: Current Testing Table Unit

18
There is a ruler than runs across the length of the table which is used to check if the
correct test tube is being tested since there are over 60 tubes that have slightly different
dimensions. Also, this ruler is used by the engineering to trim the capillary tubes length down so
that they can be installed in prototype air condition units.
Below the tabletop are three large draws that are filled with documentation and capillary
tubes adapters. Friedrich have over 20 different adapters needed to test their range of capillary
tubes and assemblies. After seeing how the draws we wanted to find a better solution for how the
capillary tubes adapters were organized.
On the bottom of the table is a steel table which holds all the wiring for the testing
system. This is another area that we will aim to organize for Friedrich because there was a
bundle of wiring and networking devices. There is also a label maker which is used to print
labels for capillary tubes that have not passed tests so that they are not accidently put back into
the capillary tube storage matrix. The label that is created is shown in the Figure 6.
Figure 6: Label for Failed Capillary Tubes
Finally, on the back wall behind the table unit is a barometer and thermometer that are
needed to standardize the test results. The thermometer Is simply a mode from two
thermocouples. Overall, we can see a lot of areas that need improving and these improvements
and developments will be outlined further in section 5.6.

19
TESTING APARTATUS DESIGN
Figure 7 shows Fredrich’s current testing system configuration. As you can see there are
some modifications that have been made in comparison to the ASHRAE standard. The key
difference is that the mass flow meter comes before the second pressure transducer rather than
after it. This is a design decision we want to keep because this means that the after the nitrogen
passes through the second transducer it will have less disturbances and enter the capillary tube at
the closer to the pressure that is being displayed. Next Friedrich added a combination filter drier
to the apparatus which we also design decision we want to keep as it ensures that the nitrogen
entering the capillary tube is dry and will not leave any moisture inside the tube which would
make it unusable for a production unit. Finally, they do not have a feedback loop to goes to a
low-pressure regulator. As mentioned by a technician not having this feedback loop makes it
hard to set the pressure regulator to correct pressure because it is overly sensitive. So, we will
look into a way to have more precise control over the pressure regulator.
Figure 7: Current Test System Configuration

20
MASS FLOW SYSTEM COMPONENTS
The components used in the mass flow system will be a useful reference in creating our
testing device since the purpose of each component relates to measuring the flow of nitrogen.
The key components are the second pressure transducer and the mass flow meter. The pressure
transducer measures the pressure of the nitrogen after it exits the pressure regulator, and the mass
flow meter is instrument that determines whether the capillary tube has any defects that affect the
flow. Figure 8 is a SolidWORKS render of the testing system. Table 3 shows the purpose, name,
and pressure range of each component in the system. The component on the far left is the Manual
Shut-off Pressure Relief Valve, denoted as component 1. The component to the right of the relief
valve is component 2, and so on. After the second pressure transducer the system connects to a
plunger valve that the technicians close when they change the capillary tubes as well as a female
nozzle connector that the Raymer quick connectors attach to. See section 4.4 for more
information on these connectors
Figure 8: Current Test Fixture Design Made in SolidWORKS.

21
Component Name Operation Pressure range
0
VICTOR Regulator,
Cylinder
Pressure regulator on nitrogen
tank
Is not shown in figure_ as it is
not directly connected to the
mass flow system
Maximum inlet pressure 3,000
psi
Delivery pressure range: 10 -
200 psi
1
NITRA pneumatic
manual shut-off
pressure relief valve
Manual Shut-off Pressure
Relief Valve
Max pressure: 130psi
Pressure range: 20-130 psi
2
Combination Filter and
Regulators
Ensures nitrogen is dry
Pressure Range: 20-145 psi
Max Pressure: 145 psi
3 Honeywell 060-
H662-05 FP2000
Pressure Transducer #1 Range: 150 psig
4
Pressure Regulator Range: 0-100 psi
Max supply: 250 psi
5 Sierra SmartTrak 100
Mass Flow Meter Pressures up to 5000 psig
6 Honeywell 060-
H662-05 FP2000
Pressure Transducer #2 Range: 150 psig
Table 3: Mass Flow System Components
LEAK TESTING FITTINGS
To connect the capillary tubes and assemblies to the testing device we need to use special
adapters so there are no leaks in the system. These connecters can be seen in figure 9 and are
made to fit tubes with various size outer diameters and to withstand various pressures. The
adapters work by clamping down on the outside surface of the tube, this creates a seal so no air
can leave the system. The current test system is a low-pressure system, so they currently only use
low pressure adapters. We will be testing higher pressures so we need to get adapters that can
safely handle these pressures. Ramer products is the brand that make the adapters we will
be using; Figure 10 below shows the sizes we will need so that we have an adapter for every

22
possible capillary tube and assembly. We plan to have a pressure transducer after the capillary
tube in our testing device, this means we will need to order two of each adapter so we can clamp
onto each end of the tube. Figure 9 shows an example of Ramer’s product sheet which is where
the current adapters are from and where any adapters, we looked into were from as well.
Figure 9: Ramer’s Connector
Figure 10: Example of Ramer’s Product Sheet

23
DOCUMENTATION
Figures 11, 12 and 13 show the documentation used by Fredrich. Figure 11 is a material
specification sheet that contains useful information like the inner and outer diameters, nominal
lengths, inlet pressure, color coding and the part number as well as notes that are useful for
technicians and engineers accessing the document. Figures 12 and 13 are CAD drawings of some
of the assemblies that our test system is required to test. The corresponding CAD drawing is
displayed on the LabVIEW program when the technician selects a capillary tube or assembly.
This helps ensure that they are testing the correct assembly and provides any other information
they require.
Figure 11: Material Specification of a Capillary Tube

24
Figure 12: CAD Drawing for Assemblies
Figure13: CAD Drawing for Assemblies

25
CAPILLARY TUBE DATA
The capillary tubes at Friedrich all have a designated part number that shows the length,
diameters, nominal mass flow rates and the inlet pressures. Table 4 is a part of capillary tube
inventory at Friedrich, showing the forementioned properties each tube has.
Table 4: List of Capillary Tubes with Defected Tubes Noted In Red.
FPN ID (in) OD (in) LENGTH (in) MIN1 NOM1 MAX1
INLET
PRESSURE
(PSI)
REPORTED
DEFECTS
1 1389902 0.075 0.125 32 0.38 0.395 0.41 5 N
2 1389903 0.054 0.106 33.75 0.414 0.427 0.437 20 N
3 1389915 0.059 0.112 20.4 0.675 0.69 0.705 10 Y
4 1389975 0.064 0.125 21 0.506 0.5155 0.525 10 N
5 1389985 0.064 0.125 27.5 0.432 0.44 0.448 10 N
6 1390000 0.064 0.125 37.5 0.374 0.381 0.388 10 N
7 1390005 0.064 0.125 23.5 0.474 0.483 0.492 10 N
8 1390212 0.059 0.112 37 0.502 0.507 0.524 20 N
9 1390223 0.075 0.125 12.63 0.595 0.615 0.635 20 N
10 3760383 0.075 0.125 26.625 0.416 0.4315 0.447 20 N
11 3760394 0.064 0.125 17.5 0.536 0.546 0.559 20 N
12 3760395 0.075 0.125 22 0.46 0.478 0.496 20 N
13 3760432 0.08 0.14 15 0.675 0.697 0.719 20 N
14 3760451 0.049 0.099 19.5 0.418 0.43 0.442 20 Y
15 3760452 0.049 0.099 35 0.314 0.323 0.332 20 N
16 3760470 0.075 0.125 16.25 0.52 0.54 0.56 20 N
17 3760473 0.059 0.112 28.5 0.572 0.585 0.598 20 N
18 3760479 0.049 0.099 44.25 0.278 0.286 0.294 20 N
19 3760482 0.049 0.099 25 0.37 0.382 0.394 20 N
20 3760500 0.04 0.087 24.25 0.467 0.4845 0.502 50 N
21 3760501 0.064 0.125 30.25 0.423 0.432 0.441 10 N
22 3760502 0.04 0.087 20 0.278 0.298 0.317 25 N
23 3760504 0.09 0.15 22.375-25 1.124 1.148 1.172 20 N
24 3760507 0.064 0.125 13.75 0.598 0.61 0.622 10 N
25 3760508 0.08 0.14 18 0.592 0.612 0.632 20 N
26 3760510 0.09 0.15 30 1.038 1.061 1.084 20 N
27 3760511 0.059 0.112 23.25 0.621 0.6345 0.648 20 Y
28 3760512 0.064 0.125 33.25 0.4 0.413 0.416 10 N
29 3760513 0.049 0.099 30 0.34 0.35 0.36 20 N
30 3760514 0.064 0.125 46 0.35 0.357 0.364 20 N
31 3760516 0.054 0.106 45 0.364 0.373 0.383 50 N
32 3760517 0.049 0.099 52 0.305 0.314 0.323 25 N
33 3760518 0.054 0.106 29 0.45 0.461 0.472 20 Y
34 3760520 0.059 0.112 33.25 0.53 0.541 0.552 20 N
35 3760526 0.054 0.106 27 0.464 0.476 0.487 20 Y
36 3760527 0.054 0.106 26 0.48 0.491 0.5 20 N
37 3760527 0.054 0.106 26 0.48 0.491 0.5 20 N
38 3760534 0.04 0.087 34.5 0.396 0.411 0.426 50 N
39 3760543 0.049 0.099 40 0.295 0.303 0.311 20 N
40 3760544 0.064 0.125 16.63 0.554 0.564 0.574 10 N
Flow Rate (CFM)

26
MAJOR ISSUES WITH SYSTEM
As outlines in section 5.1 we first undertook this project, we found that there were several
issues that we needed to put effort into fixing or improving. One of the main problems we need
to find a solution for is to why the test system was passing capillary tubes that should not be
passing. This is an issue our new testing system addresses and provides fixes to this issue.
Another issue with the test apparatus itself is with setting regulator to the correct pressure for
each capillary tube. This is a key factor in slowing down the testing process because sometimes it
can take 2-3 minutes to set the inlet pressure for each capillary tube. We went and experienced
this problem firsthand, and we saw just how sensitive the pressure regulator is. Finding a
solution for speeding up the input pressure time is something we will investigate so that it is less
difficult to get the pressure needed when testing.
Another major goal we have is design a new and improved table unit for our new test
system to be attached to. The old desk they use is very heavy, so it is impossible to move. The
technician mentions they want to be able to move the entire system around the entire facility as
well. Our plan for the new system is to decrease the overall weight of the table unit and adding
wheels to the legs.
Another issue is how unorganized and cluttered the desk space is, including the wires
underneath the desk. If there was a problem with something under the desk involving the wires,
it would be exceedingly difficult to locate the issue. That is why we are planning to add a box
where all the wires can be stored to keep it organized and easily unplugged so that the table can
be moved. Also, with organization being a problem, there is also the issue of the adapters. Our
plan is to make the adapters more easily accessible and visible to the user of the test system. To
do this we will mount them onto the backboard of the table unit.

27
The last issue is about safety. Since the test system uses nitrogen gas, we need a tank that
stores the nitrogen. As shown in Figure 14, the tank that Friedrich currently uses is just sitting in
the middle of the room on a dolly. We realized that this is unsafe because it could easily be
knocked over and harm someone since these tanks weigh over 100 pounds. We will develop a
way to attach the nitrogen tank to the table unit so to keep the technicians and engineers using
the test system safe. They use an entire nitrogen tank every day so we will need to keep the tanks
easily accessible as well. We will also aim to increase storage capacity of nitrogen for the test
system by having space for more than one tank. This will mean the technicians will not have to
replace the tanks every day which over a career could reduce the wear and tear on the
technicians’ body. We will need to take all of these issues into consideration while we are
designing and developing a new test system for the Friedrich Company.
Figure 14: Nitrogen Tank in Middle of Room

28
LabVIEW program
Throughout the process of developing and designing a new test process for Friedrich Air
Conditioning, we were given access to a program called LabVIEW in which they had developed
the capillary tube testing program. LabVIEW is an object-oriented programming language
created by National Instruments. It differs from other programming languages in that LabVIEW
uses interconnected graphic icons instead of a standard text syntax. One of the employees at
Friedrich, David Schaeffer gave us the compiled program so that we could see how it works and
start planning how we will develop the program.
Figure 15: Testing Program Main Page
The main component of the program developed by David Schafer at Friedrich can be
seen in Figure 15. This is the general overview of the program with its data outputs of the
barometric pressure, room temperature, Nitrogen pressure, mass flow and Pressure inputs and
outputs. As well it has functionality to print results, save data, calibrate the testing apparatus,

29
select user, and select capillary tube or assembly. This program also has a helpful tool that gives
us the ability to test capillary tubes without having to use the actual test system in the facility
because it has a simulation mode.
There is also a window on the right-hand side of the main page of the program that
allows you to see the drawing and specifications of the certain cap tube or assembly that have
been selected. Below the diagram window there is a stopwatch to help the technicians run the
test for the required time that the ASHRAE 28 standard outlines.
The first step to test a capillary tube or assembly is to select a username and whether the
data source is from an actual test or the simulator. After this, the user then selects a cap tube or
an assembly by pressing on either of the buttons on the main screen, seen in Figure 16. The
testing program then provides information about the cap tube including the internal and outer
diameter, length, and the adapter color; this information is displayed on the main program page.
The adapter color is especially important because it allows you to connect the tube to the test
system. When using the simulator mode, the user does not need the adapter because everything
goes through the computer.
Figure 16: Capillary Tube Part Selector

30
In order to simulate capillary tubes testing there is a separate simulation program as
previously mentioned, seen in Figure 17. To use the simulation mode, a toggle is pressed on the
bottom right-hand corner of the main page which swaps the program between simulation mode
and testing mode. This program allows you to set different values for mass flow, pressure for
input and output, barometric pressure, and the temperature ambient and nitrogen. The most
important part of this program gives you the option to have noise to represent how the actual
system would work. In this case when the real test system is used it is not in a vacuum. This
means the values that are being read are not perfect and are constantly changing. Even though
these changes are exceedingly small, they could potentially cause the tube to pass or fail in
specific cases. This program is what gives the other testing program the numbers to see how cap
tubes work at different values of pressure or mass flow.
Figure 17: Simulator Program

31
During the testing process, the testing programs data display area is constantly updating.
The program visually lets you know how the capillary tube or assembly is performing by
displaying the gauges as green for passing or red for failing. After the required time has elapsed
and barometric pressure, room temperature, nitrogen pressure and pressure inputs and outputs are
green, but the mass flow is red then the capillary tube or assembly have failed.
Overall, this version of the program has helped our group experiment with different
pressures and mass flows that potentially could affect the entire system. It was also useful for us
to have a simulator because we were not able to go into the lab all the time to test with different
tubes because the facility was out of stock on some the tubes we wanted to test. However, the
simulation mode does not supply the most accurate data because it does not account for the
variables, we are wanting to test such as surface roughness.
Figure 18: Passing Output When Test Capillary Tube or Assembly

32
5. SUMMARY OF THE ENGINEERING METHOD
SUMMARY
In the following section we will present, discuss, and explain the engineering method our
team used to create the testing apparatus that solves Friedrich’s technical issues with capillary
tubes. We will cover our first hypothesis, calculations, design process, testing, part selection,
system design and CAD work.
HYPOTHESIS
When analyzing the issue Fredrich was having with the new supplier, we evaluated how
these new identical capillary tubes where greatly underperforming. This evaluation led us to
believe that possibly the key factor for this difference in performance was related to how the
capillary tubes were manufactured. The different manufacturing methods could lead to a
difference in how the internal surface is finished. As shown in Figure 19, we know that the
roughness of pipes and ducts affects the flow rates and pressure losses on fluids passing through
them. The absolute roughness, ε of a material is proportional to the friction factor, ƒ which is
related to the pressure drop, ∆P across the pipe or duct. Therefore, the goal new test systems we
develop will be to find the pressure drop across the capillary tube or assembly which will then
allow us to estimate the roughness of the pipe. We can then compare results of new suppliers
with the results of from tubes that have been proven to perform to the desired level by the
engineers at Fredrich. Additionally, we will compare the results to theoretical estimates to give a
second reference point on performance as well as provide a base line estimate on how a pipe
should perform if there are no past results to reference.

33
Figure 19: Schematic absolute roughness of pipe
This observation led us to formalize two hypotheses.
Hypothesis 1:
The relative surface roughness of the tube from Minallum is different than the
relative surface roughness of the tube from original capillary tube manufactures, National
copper. This could be causing a lower or greater pressure drop across the capillary tube which
will make the AC units less effective. We will need to create a testing system that can accurately
figure out the pressure drop across the capillary tube so that the relative surface roughness
estimate can be made for each capillary tube tested.
Hypothesis 2:
Running the test at a higher inlet pressure to exaggerate any issue that might exist inside
the tubes. The tubes run at higher pressures in the ac units, so we want to test the capillary tubes
at a pressure that better resembles the operating pressure compared to the relatively low
pressures tested in the ASHRAE 28 standard system.

34
ITERATIVE DESIGN OF TESTING APARATUS
Figure 20: First Concept for New Test System
Our first idea for the new testing apparatus as shown in Figure 20, involves replacing the
old pressure regulator with a new automatic regulator that is controlled by the computer. We
wanted to have a third pressure that is attached after the pressure regulator that would measure
the pressure drop across the capillary tube. However, we realized that we did not want to make
major changes like this to the original testing fixture as it has its design is supported by the
ASHRAE 28 standard. This led us to our next idea which was a system that runs in parallel to the
existing system, shown in Figure 21. This would give us more flexibility to test the capillary
tubes and assemblies for the specific variables needed. It important that this system is flexible
regarding where the two connectors attach to either end of the assembly as the assemblies are not
just linear pipes like the capillary tubes. The inputs and outputs of the assemblies vary in height,
orientation, and angle.

35
Figure 21: First Version For Parallel Design
Our first idea was to use a liquid such as water or R-410a to induce a flow through the
capillary tube. By using a liquid this would give us a better understanding of how the capillary
tubes would perform in one of the air conditioning units. The reservoir would induce a flow and
would allow us to find the pressure drop across the capillary tube. From the pressure drop
measured we can find the friction factor of the capillary tube and compare it to predetermined
data sets to see if the capillary tube is performing correctly. However, three issues arise from this
concept. The first is that the tubes will begin to oxidize if a fluid like water comes into contact
with the capillary tubes. This means that any tubes that are tested on this fixture would not be
able to be installed into AC units.
Another drawback we found with the first concept for a parallel system was that using a
fluid would pose safety issues such as spillages that could potentially damage electrical
equipment on the table unit and then harm the operator. Finally, the fluid would drain from the
reservoir. Resulting in a pressure induced by the fluid constantly decreasing, making the test
harder to operate and therefore less reliable and decreasing the validity of the results.

36
From this we developed our second idea for the parallel system that could use Nitrogen
instead of a liquid and have the nitrogen at a pressure greater than that used in existing test
system. This is so that the test is still cheap to run, and that there is no chance of the electrical
equipment in the space getting damaged. With this design we will need to implement a safety
system or device at the end of the system since we would be running tests at a higher pressure
than in the main system. The first idea was to have the components on right hand side of the cap
tube attached to a roller system to account for varying lengths of capillary tubes. Seen in Figure
22. However, as previously mentioned, this system needs to be flexible enough to test both
capillary tubes and assemblies. We would need something to provide more flexibility than a
simple roller system. This led us onto our third idea seen in Figure 23, which replaces the roller
system with an articulating arm. This arm would provide the freedom needed to attach both
capillary tubes and the more complex assemblies.
Figure 22: Second Version For Parallel Design

37
Figure 23: Third Version For Parallel Design
Figure 25 shows the fifth version of our system design which was created due to some
oversights on the earlier versions of the testing system. We realized two key issues with the
fourth version. The first is that we had planned to attach the beginning of the pressure drop
system to the pegboard in the same direction as the mass flow system, this would mean there is
not enough length on the table to test the longest capillary tubes used at Friedrich. This issue was
solved by deciding to invert the direction of the system. To achieve this the nitrogen hose would
need to connect around the back, allowed the system to go from right to left, therefore enabling
us to use the entire length of the table for testing. The second issue was that due to the nature of
the capillary tube connectors, the capillary tubes ran perpendicular to the system, meaning the
articulating arm and the second part of the system would not connect to the tubes. To solve this
problem, we will add a 90-degree elbow in between the pressure transducer and the capillary
tube connectors which will mean the capillary tubes run parallel to the system and the rail the
articulating arm is attached to it. Additionally, a coiled capillary tube can be seen at the send of
the pressure drop system, this is explained in section 6.1.

38
Figure 24: Fourth Version For Parallel System Design
FINAL ITERATIVE DESIGN VERSION
Figure 25 shows the last version of our iterative design process which was substantially
different to the fourth version. After creating the fourth version of the new testing system we
found it would be possible to save space and money by combining the mass flow system and the
pressure drop system into one system. Through extensive testing we found that testing the
capillary tube around 100 psig meant the system components would not get damaged as well as
the being able to amplify any coherent issues withing the capillary tubes. This meant we can add
the dryer, filter and pressure transducer components found at the start of the mass flow system to
the start of the pressure drop system as they are all rated at over 120 psig. This meant the system
could be used to both calculate the mass flow through the tube using the AHRAE 28 standard at
low pressures as well as our testing process at high pressures.

39
By combining the two systems into one system that can measure both variables required
for capillary tube testing at Fredrich it meant only one more pressure transducer had to be
purchased (pressure transducer #1). Pressure transducer #1 does not have to be as exact as the
pressure transducers #2 and #3 since its purpose is to just ensure the system inlet is getting 120
psi supplied by the nitrogen tanks. Pressure transducers #2 and #3 need to have the highest
accuracy possible since they are what measure the inlet and outlet pressure of the capillary tubes,
meaning these transducers determine the pressure drop across the capillary tube.
Figure 25: Final Version Of Testing System

40
SYSTEM FLOW CHART
The flow chart seen in Figure 28 shows how our new system would operate. The main
process of the new system is connecting the articulating arm to the capillary tube or assembly
and setting the pressure regulator to a pressure that is higher than that on the main system. Next
would-be measuring test results for the pressure drop to comparing the test results to theoretical
data and previously recorded data. All this data would help us to determine whether or not the
results are acceptable.
The parallel system flow chart that is predefined process box called “Computer system
2”, this process is outlined in Figure 27. This flow chart is a general outline for how we will
create the LabVIEW program needed to control the test procedure. The main points of focus for
this computer system are to have the ability to display the theoretical pressure drop
approximations as well as test data from other identical capillary tubes or assemblies.
Additionally, it shows we will need to process the data from the two pressure regulators to
calculate a pressure drop value. After processing the pressure data, we will then have the
computer compare the results and see if they are within an acceptable tolerance of both the
theoretical data and past test data,
Figure 27: Computer System 2 Flow Chart

41
Figure 28: Parallel System Flow Chart

42
FLUID DYNAMICS CALCULATIONS
REYNOLDS NUMBER CALCULATIONS
Introduction
We need to find the Reynold’s number so that we can find the friction factor, f, for the
capillary tubes. Below is the Reynolds Number calculated for part 3765018 to show the steps and
equations used. This was done for multiple parts and is used in our pressure drop
equations. All our equations are from the Fundamentals of Fluid Mechanics textbook [1].
Values
Part number: 3760518
Inner Diameter, ID = 0.054 𝑖𝑛ches
Outer Diameter, OD = 0.106 𝑖𝑛ches
Nominal Mass flow rate, �̇�𝑁 = 0.461 CFM
Nitrogen density, ρ = 0.0727 𝑙𝑏𝑚
𝑓𝑡3
Nitrogen viscosity, μ = 0.0425 𝑙𝑏𝑚
𝑓𝑡∙ℎ𝑟
Theory
𝑅𝑒 =𝜌𝑉𝐷
𝜇
(1) �̇� = 𝜌𝑉𝐴 ⟶ 𝑉 =�̇�
𝜌𝐴
(2) 𝐴 =𝜋𝐷2
4
Substitute (1) and (2) into Reynolds number equation
𝑹𝒆 =𝟒�̇�
𝝅𝑫𝝁
Calculations
𝑅𝑒 =4(0.461
𝑓𝑡3
𝑚𝑖𝑛×0.0727
𝑙𝑏𝑚𝑓𝑡3
)
𝜋(0.0425 𝑙𝑏𝑚𝑓𝑡∙ℎ𝑟
×1 ℎ𝑟
60 𝑚𝑖𝑛)(0.054 𝑖𝑛 ×
1 𝑓𝑡
12 𝑖𝑛)=
1.844 𝑙𝑏𝑚𝑚𝑖𝑛
1.001×10⁻⁵ 𝑙𝑏𝑚 𝑚𝑖𝑛
𝑹𝒆 = 𝟏𝟖𝟒𝟏𝟒𝟓 > 4100 𝑡ℎ𝑒𝑟𝑒𝑓𝑜𝑟𝑒, 𝑡ℎ𝑒 𝑓𝑙𝑜𝑤 𝑖𝑠 𝑡𝑢𝑟𝑏𝑢𝑙𝑎𝑛𝑡 𝑖𝑛 𝑡ℎ𝑒 𝑐𝑎𝑝𝑖𝑙𝑙𝑎𝑟𝑦 𝑡𝑢𝑏𝑒

43
PRESSURE DROP CALCULATIONS
Introduction
We found two pressure drop equations and two friction factor equations. The plan is to
add a pressure transducer at the end of the current test system to compare the results to the
differing equations. The capillary tubes that pass and work in the ac units should have an
accurate pressure drop. The capillary tubes that passed but ended up failing in the system, if our
hypothesis is correct will not have an accurate pressure drop because the estimated friction factor
would be smaller than the actual one. When we measure the pressure drop across the capillary
tube at Friedrich, we will also be able to do these calculations but find the actual friction factor.
Values
Part Number: 1389915
Inner Diameter: 0.059 𝑖𝑛 = 0.00492 𝑓𝑡
Outer Diameter: 0.112 𝑖𝑛.
Length: 20.4 𝑖𝑛 = 1.7 𝑓𝑡
Nominal Mass Flow (volumetric flow rate): 0.69 𝑐𝑓𝑚 = 0.01150𝑓𝑡3
𝑠
Nitrogen Dynamic Viscosity: 3.68𝐸 − 07𝑙𝑏𝑚
𝑓𝑡2∗2
Nitrogen kinematic Viscosity: 1.63𝐸 − 04𝑓𝑡2
2
Density of Nitrogen: 0.0026𝑆𝑙𝑢𝑔𝑠
𝑓𝑡3
Area: 0.00273 𝑖𝑛2 = 0.000019 𝑓𝑡2
𝑉𝑒𝑙𝑜𝑐𝑖𝑡𝑦, 𝑉 =𝑄
𝐴=
0.01150𝑓𝑡3
𝑠
0.000019 𝑓𝑡2= 605.7
𝑓𝑡
𝑠
The physical properties referenced above as well of the rest of the engineering theories
referenced in section 6.4 are obtained from Munson, Young and Okiishi's textbook called

44
Fundamentals of Fluid Mechanics. The physical properties table from the textbook is shown in
Table 5.
Table 5: Approximate Physical Properties of Gases at Standard Atmospheric Pressure
[Fundamentals of Fluid Mechanics Table 1.7]
Reynolds Number Calculations for PN 1389915
The Reynolds number for pipe flow is defined as 𝑅𝑒 =𝜌𝑉𝐿
𝜇. We found velocity by
rearranging the mass flow equation and inputted in the Reynolds equation. We put out units in
inches and seconds.
𝑅𝑒 = 18270.46
Pressure Drop Theory Overview
∆𝑝 = 𝑓𝐿
2𝐷𝜌𝑉2
ΔP = pressure drop in Pascals (psig)
V = velocity in meters per second (ft/sec)
L = length of pipe or hose in meters (in)
ρ = density of the fluid in kilograms per cubic meter (lb/ft for hydraulic oil)
D = inside diameter of pipe (in)
f = friction factor

45
Friction Factor Theory
The friction factor is a dimensionless quantity used in the Colebrook equation, for the
description of friction losses in pipe flow as well as open-channel flow. Figure 29 shows a
moody chart which is a non-dimensional form that relates the Colebrook friction factor fD,
Reynolds number Re, and surface roughness for fully developed flow in a circular pipe. The
moody chart is used to estimate the friction factor, f from the equation below as in this formula f
is a function of itself.
1
√ƒ = −2log10 (
𝜀
3.7𝐷ℎ+2.51
𝑅𝑒√ƒ )
Figure 29: Moody Diagram [Fundamentals of Fluid Mechanics Fig. 8.20]
However, since the Colebrook equation is in a form where the friction factor is a function
of itself its very complicated to analytically compute a value. The Haaland equation is an easier
way to solve for the friction factor and provides an adequate approximation.

46
1
√𝑓= −1.8log [(
6.9
𝑅𝑒) + (
𝜖/𝐷
3.7)1.11
]
The surface roughness for pipes can be found in table 6. Therefore, for the copper tubes
we are dealing with we will assume they have a similar surface roughness top drawn piping
would be 𝜖 = 0.000005 ft.
Table 6: Equivalent Roughness for New Pipes [Fundamentals of Fluid Mechanics Table]
Friction factor calculations for PN 1389915
𝑅𝑒 = 18270.46 the flow is turbulent which means we will used Using the Haaland
Equation to calculate the friction factor.
1
√𝑓= −1.8log [(
6.9
𝑅𝑒) + (
𝜖/𝐷
3.7)1.11
]
1
√𝑓= −1.8log [(
6.9
18270.5) + (
0.000005 𝑓𝑡/0.00492 𝑓𝑡
3.7)1.11
]
𝑓 = 0.028161904
Next, we cross checked this value with the moody chart to ensure that the Haaland
equation produced a good approximation.

47
𝜖/𝐷 = 0.000005
0.00492= 0.001.
The friction factor we got from moody chart was approximately 0.029 which is
remarkably close to what the Haaland equation approximate. We crossed checked these results
with other capillary tubes and the results were all good approximations of the moody chart, this
allowed up to be confident in the Haaland approximation equation when calculation friction
factors of other capillary tubes.
Figure 30: Moody Friction Factor Check [Fundamentals of Fluid Mechanics Fig. 8.20]
Pressure Drop Calculations for PN 1389915
Now we have the friction factor we can use equation 6.1 to estimate the pressure drop across the
capillary tubes.
∆𝑝 = 𝑓𝐿
2𝐷𝜌𝑉2
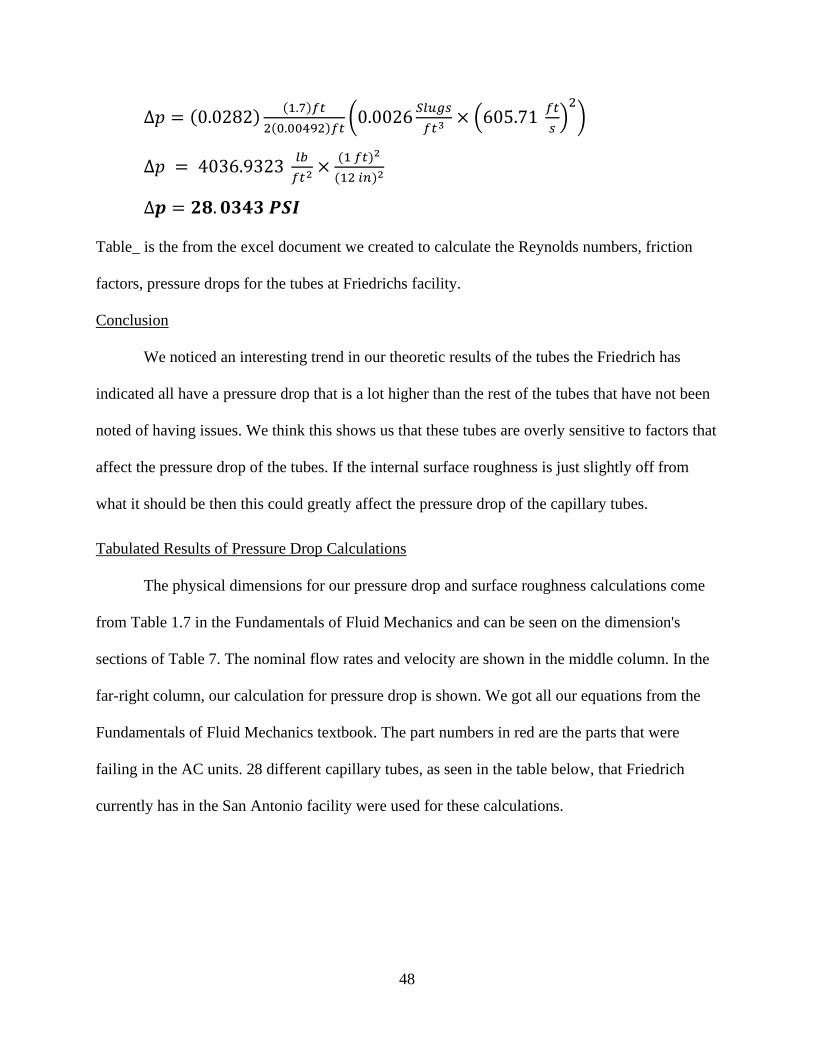
48
∆𝑝 = (0.0282)(1.7)𝑓𝑡
2(0.00492)𝑓𝑡(0.0026
𝑆𝑙𝑢𝑔𝑠
𝑓𝑡3× (605.71
𝑓𝑡
𝑠)2
)
∆𝑝 = 4036.9323 𝑙𝑏
𝑓𝑡2×
(1 𝑓𝑡)2
(12 𝑖𝑛)2
∆𝒑 = 𝟐𝟖. 𝟎𝟑𝟒𝟑 𝑷𝑺𝑰
Table_ is the from the excel document we created to calculate the Reynolds numbers, friction
factors, pressure drops for the tubes at Friedrichs facility.
Conclusion
We noticed an interesting trend in our theoretic results of the tubes the Friedrich has
indicated all have a pressure drop that is a lot higher than the rest of the tubes that have not been
noted of having issues. We think this shows us that these tubes are overly sensitive to factors that
affect the pressure drop of the tubes. If the internal surface roughness is just slightly off from
what it should be then this could greatly affect the pressure drop of the capillary tubes.
Tabulated Results of Pressure Drop Calculations
The physical dimensions for our pressure drop and surface roughness calculations come
from Table 1.7 in the Fundamentals of Fluid Mechanics and can be seen on the dimension's
sections of Table 7. The nominal flow rates and velocity are shown in the middle column. In the
far-right column, our calculation for pressure drop is shown. We got all our equations from the
Fundamentals of Fluid Mechanics textbook. The part numbers in red are the parts that were
failing in the AC units. 28 different capillary tubes, as seen in the table below, that Friedrich
currently has in the San Antonio facility were used for these calculations.

49
Tabulated Results
Table 7: Excel Data Sheet for Pressure Drop
ID (in.) ID (ft)Length
(in.)
Length
(ft)
NOM1
(cfm)
Q
(ft³/s)
Velocity
(ft/s) 𝜖Reynold
numberf
Pressure drop
(PSI)
1389902 0.075 6.25E-03 32.00 2.67 0.395 6.58E-03 214.58 5E-06 8.23E+03 3.35E-02 5.17
1389903 0.054 4.50E-03 33.75 2.81 0.427 7.12E-03 447.47 5E-06 1.24E+04 3.08E-02 30.23
1389975 0.064 5.33E-03 21.00 1.75 0.5155 8.59E-03 384.58 5E-06 1.26E+04 3.04E-02 11.57
1389985 0.064 5.33E-03 27.50 2.29 0.44 7.33E-03 328.26 5E-06 1.07E+04 3.15E-02 11.46
1390000 0.064 5.33E-03 37.50 3.13 0.381 6.35E-03 284.24 5E-06 9.30E+03 3.27E-02 12.14
1390005 0.064 5.33E-03 23.50 1.96 0.483 8.05E-03 360.34 5E-06 1.18E+04 3.09E-02 11.54
1390212 0.059 4.92E-03 37.00 3.08 0.507 8.45E-03 445.07 5E-06 1.34E+04 3.01E-02 29.31
1390223 0.075 6.25E-03 12.63 1.05 0.615 1.03E-02 334.10 5E-06 1.28E+04 3.01E-02 4.43
3760383 0.075 6.25E-03 26.63 2.22 0.4315 7.19E-03 234.41 5E-06 8.99E+03 3.28E-02 5.02
3760394 0.064 5.33E-03 17.50 1.46 0.546 9.10E-03 407.34 5E-06 1.33E+04 3.00E-02 10.68
3760395 0.075 6.25E-03 22.00 1.83 0.478 7.97E-03 259.67 5E-06 9.96E+03 3.19E-02 4.96
3760432 0.08 6.67E-03 15.00 1.25 0.697 1.16E-02 332.79 5E-06 1.36E+04 2.96E-02 4.82
3760452 0.049 4.08E-03 35.00 2.92 0.323 5.38E-03 411.09 5E-06 1.03E+04 3.23E-02 30.56
3760470 0.075 6.25E-03 16.25 1.35 0.54 9.00E-03 293.35 5E-06 1.12E+04 3.10E-02 4.54
3760473 0.059 4.92E-03 28.50 2.38 0.585 9.75E-03 513.54 5E-06 1.55E+04 2.91E-02 29.14
3760479 0.049 4.08E-03 44.25 3.69 0.286 4.77E-03 363.99 5E-06 9.12E+03 3.32E-02 31.18
3760482 0.049 4.08E-03 25.00 2.08 0.382 6.37E-03 486.17 5E-06 1.22E+04 3.11E-02 29.39
3760501 0.064 5.33E-03 30.25 2.52 0.432 7.20E-03 322.29 5E-06 1.05E+04 3.17E-02 12.20
3760502 0.04 3.33E-03 20.00 1.67 0.298 4.97E-03 569.14 5E-06 1.16E+04 3.18E-02 40.38
3760504 0.09 7.50E-03 24.00 2.00 1.148 1.91E-02 433.09 5E-06 1.99E+04 2.70E-02 10.60
3760507 0.064 5.33E-03 13.75 1.15 0.61 1.02E-02 455.08 5E-06 1.49E+04 2.93E-02 10.22
3760508 0.08 6.67E-03 18.00 1.50 0.612 1.02E-02 292.21 5E-06 1.20E+04 3.05E-02 4.59
3760510 0.09 7.50E-03 30.00 2.50 1.061 1.77E-02 400.27 5E-06 1.84E+04 2.75E-02 11.51
3760511 0.059 4.92E-03 23.25 1.94 0.6345 1.06E-02 556.99 5E-06 1.68E+04 2.87E-02 27.49
3760518 0.054 4.50E-03 29.00 2.42 0.461 7.68E-03 483.10 5E-06 1.33E+04 2.86E-02 28.11
3760526 0.054 4.50E-03 27.00 2.25 0.476 7.93E-03 498.82 5E-06 1.38E+04 2.83E-02 27.67
3760451 0.049 4.08E-03 19.50 1.63 0.43 7.17E-03 547.26 5E-06 1.37E+04 3.03E-02 28.30
1389915 0.059 4.92E-03 20.40 1.70 0.69 1.15E-02 605.71 5E-06 1.83E+04 2.82E-02 28.03
Pressure Drop
Part Number
Dimensions Flow rates

50
STRENGTHS CALCULATIONS
PRESSURE VESSEL CALCULATIONS
Introduction
The strength of the capillary tubes was calculated to predict if the copper tubing could
withstand a higher pressure. The tube functions with higher pressures inside the AC unit so we
wanted to test the at more realistic pressures to ensure the tube will not have issues
or exaggerate any issues. We were also able to compare these strength calculations to the data we
collected from conducting an experiment at 120 PSI. We used part number 3760518 to show the
strength calculations that we used. Figure 31 shows the stresses on a diagram of the copper tube
which is considered a thick-walled vessel.
Figure 31: Stress Diagram of Thick-Walled Vessel
Values
Part number: 3760518
Inner radius, ri = 𝐼𝐷
2=0.054 𝑖𝑛
2= 0.027 𝑖𝑛
Outer radius, ro = 𝑂𝐷
2=0.106 𝑖𝑛
2= 0.053 𝑖𝑛
Thickness, t = ro – ri = 0.052 in
Internal pressure, Pi = 120 psi (max pressure system components can handle)
External pressure, Po = 0 psi

51
Theory
Thick wall Vessel: 𝑡
𝐷≥
1
20
Thin wall Vessel: 𝑡
𝐷<
1
20
𝑡
𝐷=0.052
0.054= 0.96296 ≥
1
20
Therefore, this capillary tube can be considered as a thick-walled vessel.
RADIAL STRESS:
𝜎R = [(Piri
2−Poro2)
ro2−ri2] + [
(ri2ro
2(Po−Pi))
r2(ro2−ri2)]
Max stress when r = ri
CIRCUMFERENTIAL STRESS:
𝜎C = [(Piri
2−Poro2)
ro2−ri2 ] − [
(ri2ro
2(Po−Pi))
r2(ro2−ri2)]
Max stress when r = ro
AXIAL STRESS:
𝜎A =(Piri
2−Poro2)
ro2−ri2
VON MISES STRESS EQUATION
𝜎𝑣 = √1
2[(𝜎𝑥 − 𝜎𝑦)
2+ (𝜎𝑥 − 𝜎𝑦)
2+ (𝜎𝑥 − 𝜎𝑦)
2] + 3[𝜏𝑥𝑦2 + 𝜏𝑦𝑧2 + 𝜏𝑥𝑧2]
𝜎𝑣 = √1
2[(𝜎𝑅 − 𝜎𝐶)2 + (𝜎𝐶 − 𝜎𝐴)2 + (𝜎𝐴 − 𝜎𝑅)2]
Figure 32: 3D stress states

52
Example Calculations for PN 3760518
RADIAL STRESS:
r = ro = 0.053 in
𝜎𝑅 = [(120(0.027)2− 0)
0.0532−0.0272] + [
(0.02720.0532(0−120))
0.0532(0.0532−0.0272)] = 42.058 − 42.058
𝝈𝑹 = 𝟎 𝒑𝒔𝒊
CIRCUMFERENTIAL STRESS:
r = ro = 0.053 in
𝜎𝐶 = [(120(0.027)2− 0)
0.0532−0.0272] − [
(0.02720.0532(0−120))
0.0532(0.0532−0.0272)] = 42.058 − (−42.058)
𝝈𝑪 = 𝟖𝟒. 𝟏𝟐 𝒑𝒔𝒊
AXIAL STRESS:
𝜎𝐴 = [(120(0.027)2− 0)
0.0532−0.0272] = 42.058
𝝈𝑨 = 𝟒𝟐. 𝟎𝟓𝟖 𝒑𝒔𝒊
VON MISES STRESS:
𝜎𝑣 = √1
2[(0 − 84.12)2 + (84.12 − 42.058)2 + (42.058 − 0)2]
𝝈𝒗 = 𝟕𝟐. 𝟖𝟒𝟔 𝒑𝒔𝒊
Material Properties of Copper
𝜎𝑦 = 4830 𝑝𝑠𝑖
𝜎𝑈𝐿𝑇 = 30500 𝑝𝑠𝑖

53
Tabulated Results of Stress at Both the Inner and Outer Radius
The tables below are the results of assuming a 120 PSI pressure. The goal of this
experiment was to test our hypothesis that a higher pressure is more realistic and could amplify
any issues with the capillary tube. Table 8 is the stress at the inner radius and Table 9 is the stress
at the outer radius. The data helps to show that the copper tubing will not fail even at a higher
pressure such as 120 psi. The red part numbers show the parts that had existing issues when
placed in the AC units. The maximum stress happens on part number 3760551 due to its thin
walls.
r = INNER RADIUS
PN Pi (PSI) ri (in) ro (in) r (in) Radial Stress
(PSI) Circumferential
stress (PSI) Axial Stress
(PSI) Von missus
(PSI)
1389902 120 0.0375 0.0625 0.0375 -120.00 255.00 67.50 324.8 1389903 120 0.027 0.053 0.027 -120.00 204.12 42.06 280.7 1389975 120 0.032 0.0625 0.032 -120.00 205.27 42.63 281.7 1389985 120 0.032 0.0625 0.032 -120.00 205.27 42.63 281.7 1390000 120 0.032 0.0625 0.032 -120.00 205.27 42.63 281.7 1390005 120 0.032 0.0625 0.032 -120.00 205.27 42.63 281.7 1390212 120 0.0295 0.056 0.0295 -120.00 212.18 46.09 287.7 1390223 120 0.0375 0.0625 0.0375 -120.00 255.00 67.50 324.8 3760383 120 0.0375 0.0625 0.0375 -120.00 255.00 67.50 324.8 3760394 120 0.032 0.0625 0.032 -120.00 205.27 42.63 281.7 3760501 120 0.032 0.0435 0.032 -120.00 403.05 141.53 453.0 3760511 120 0.0295 0.056 0.0295 -120.00 212.18 46.09 287.7 3760518 120 0.027 0.053 0.027 -120.00 204.12 42.06 280.7 3760526 120 0.027 0.053 0.027 -120.00 204.12 42.06 280.7 1389915 120 0.0295 0.056 0.0295 -120.00 212.18 46.09 287.7 3760451 120 0.0245 0.0495 0.0245 -120.00 197.87 38.94 275.3
Table 8: Stresses on select capillary tubes inner diameter.

54
r = OUTER RADIUS
PN Pi (PSI) ri (in) ro (in) r (in) Radial Stress
(PSI) Circumferential
stress (PSI)
Axial Stress (PSI)
Von missus (PSI)
1389902 120 0.0375 0.0625 0.0625 0.00 135.00 67.50 116.91343
1389903 120 0.027 0.053 0.053 0.00 84.12 42.06 72.84606
1389975 120 0.032 0.0625 0.0625 0.00 85.27 42.63 73.84314
1389985 120 0.032 0.0625 0.0625 0.00 85.27 42.63 73.84314
1390000 120 0.032 0.0625 0.0625 0.00 85.27 42.63 73.84314
1390005 120 0.032 0.0625 0.0625 0.00 85.27 42.63 73.84314
1390212 120 0.0295 0.056 0.056 0.00 92.18 46.09 79.83143
1390223 120 0.0375 0.0625 0.0625 0.00 135.00 67.50 116.91343
3760383 120 0.0375 0.0625 0.0625 0.00 135.00 67.50 116.91343
3760394 120 0.032 0.0625 0.0625 0.00 85.27 42.63 73.84314
3760501 120 0.032 0.0435 0.0435 0.00 283.05 141.53 245.13032
3760511 120 0.0295 0.056 0.056 0.00 92.18 46.09 79.83143
3760518 120 0.027 0.053 0.053 0.00 84.12 42.06 72.84606
3760526 120 0.027 0.053 0.053 0.00 84.12 42.06 72.84606
1389915 120 0.0295 0.056 0.056 0.00 92.18 46.09 79.83143
3760451 120 0.0245 0.0495 0.0495 0.00 77.87 38.94 67.43763
Table 9: Stresses on select capillary tubes out diameter.
Conclusion
After checking all the different capillary tubes at Friedrichs facility we can see
that the copper tubing will not fail if tested at a pressure of 120 psi as the yield stress of
the copper used in to construct the capillary tube is over 10 times greater than the
maximum stress induced on the capillary tube.
𝜎𝑦 = 4830 𝑃𝑆𝐼 ≫ 𝜎𝑣,𝑚𝑎𝑥 = 453 𝑃𝑆𝐼

55
CAPILLARY TUBE FINITE ELEMENT ANALYSIS
The goal of this analysis was to prove that under the maximum pressure load the capillary
tubes will experience of 120 psi, there is no risk of them failing. As the analysis suggests, the
greatest stress that will be experienced by the capillary tube we selected will be 3502.4 psi.
However, these values are located at the end of the tube we were required to plug the capillary
tube to perform the analysis. However, these plugs will not present in the test fixture as the
nitrogen will be flowing through the tube. The greatest stress experienced by the capillary tube
were around 1300 psi which means there is a safety factor of 28 as shown in figure 33.
This test was done to ensure the safety of the technician, to ensure that the tube will not
have a catastrophic failure and explode.
Note that the yield strength of the copper material selected is stronger than that assumed
in earlier sections calculations. The yield strengths are similar and far greater in magnitude than
the maximum stress experienced by the capillary tube.
Figure 33: Finite Element Analysis Of Stresses On Capillary Tube

56
TABLE UNIT DESIGN DRAWINGS
Figure 34 is a sketch we did on one of our visits to Fredrich’s facility, and it contains the
dimensions of the table unit that is currently in use which would help us create our design in
SolidWORKS. The use of sketches was vital in the development stages of the design process as
it provided a fast solution to creating potential concepts that would solve many of the issues with
the table unit.
Figure 34: Table Sketch with Dimensions
We did over 10 sketches as quick brainstorm layout options. For example, we moved the
computer box from the left side of the table to be on top of the top of the table’s backboard. We
also moved the test system locations which inspired us to think of putting the monitor on an arm
that could be moved around by the technician to help with the productivity of the testing. We
discussed with technicians about their workflow using the testing system in order to make the
entire system easier to use.

57
Figures 35 and 36 are sketches we did before throughout the CAD design process and
show some early concept ideas for solving the requirements of the project.
Figure 35: First Sketch New Table Unit
Figure 36: Second Sketch New Table Unit

58
MATERIAL SELECTION FOR TABLE UNIT
EXTRUDED ALUMINIUM FRAME
We are going to build the frame of the table unit out of 80/20’s aluminum alloy extruded
framing. The reason we are planning on building with this extruded framing material is because
it is cheaper and more modular, compared to a welded steel frame. The framing has a T-slot
design seen in Figure 37 which allows the framing to be bolted together rather than welded,
nailed, or permanently fixed. This will decrease the assembly time needed to create the table
unit. It will also give us the flexibility to easily make changes to the first prototype table unit
without having to waste framing material and re-cut sections.
Furthermore, the framing material is exceptionally light at only 0.5lb per foot. The table
unit needs to be lightweight so that it can easily be wheeled around Fredrich’s facility, to
wherever the table testing unit is needed. The aluminum framing has a yield strength of 35,000
psi which will easily be strong enough for the loads we will be apply to it.
Figure 37: Extruded Aluminum

59
The framing also has a large catalog of different cross-sectional shapes and connectors
seen in section 5.12.2. This will give us more options when designing and building the table unit.
For example, at a high stress connection of two parts of the framing we could use a more heavy-
duty connector to ensure the structural integrity of the table unit.
ARTICULATING ARM
As we originally planned to just have the pressuring measuring side of the system on
rails, we realized this would work for straight capillary tubes this however would not
accommodate for the assemblies and wound tubes. From this we realized we had two routes to
take, re-evaluating the rail idea and creating a more complicated rail system that not only slides
back and forth but can slide up and down and shift side to side across the table unit. However,
we eventually decided that an articulating arm attached to a single rail that run across the length
of table unit would be the best way to have 3 degrees of freedom and the flexibility needed to for
the for the parallel system.
The arm would need a base that could be easily mounted onto a rail or the edge of a desk.
Also, the base would need some sort of rotating joint that would improve the reachability of the
articulating arm. Next the arm will need at least two arm sections so that it is able to reach any
location in the XY axis. Finally, at the end of the two arm sections we will need a ball joint that
will attach to the systems components and give the technician the ability to rotate the system so
that it can be attached to the non-linear assemblies. All the joints and hinges for the arm should
be able to be locked into position so that the system is stable when being testing.
The arm must have a minimum wight capacity of 6 lb which is the greatest weight we
estimate to be loaded onto the arm. Additionally, the arms will need to be within a range of 0

60
inches to 10 inches, in order to reach across the table and but also be able to reach the output of
assemblies that are close to the base of the arm.
We found a suitable solution from GyroVu seen in Figure 38 which is a 11” articulating
arm that has a maximum capacity of 11 lb and has all the features we require. Initially we
thought there might be an issue with this arm as that it may not be long enough to reach all the
necessary locations on the XY axis. Modifying the arm from GyroVu by extending the length of
one of arms is a possibility we are considering. However, through careful design we were able to
find a solution to use this arm without modifying it. The details of this design are explained in
section 9.
Figure 38: GyroVu 11” Arm

61
ITERATIVE DESIGN OF TABLE UNIT
We based our first design seen in figure 39, from the testing table they currently use at
Friedrich. They have a table unit that is a reasonable size and stores testing components such as
the capillary adapters. We created a basic work bench with drawers underneath. We plan to use
the backboard to mount the testing device and the work bench area can be used to support
the capillary tubes and assemblies. For this design we did not allocate any materials to the
surfaces because the goal of this table design was to just have a basic layout that we could
reference for developing the Table unit. We brainstormed and developed our ideas for improving
the table unit by sketching on top of these SolidWORKS drawings as shown in Figure 39. This
proved to be particularly useful because we could quickly sketch any ideas, we had for how the
table could be configured then share those drawings with the other team members.
Figure 39: First SOLIDWORKS design of Table Unit

62
For the next stage of the design seen in Figure 40, we focused on material selection and
solving some of the issues outline with the old test system. We used the aluminum extrusion for
the framing, as previously outlined in section 6.9. We created each part individually
in SolidWORKS and created an assembly. We plan to make the table and back board from sheet
stainless steel. This will supply good chemical resistance and add rigidity to the table unit. The
holes in the back board will be used to hold the adapters for the testing system. We also added
wheels as the engineers at Friedrich had informed us that they want the ability to move the table
around the facility and current it not easy to move their testing system since there system does
not have wheels These wheels will need to be heavy duty and have brakes to lock it in place
wherever the technician desires.
Figure 40: Second SOLIDWORKS design of Table Unit

63
The Third stage of the table development involved adding peripherals. We added a
monitor and bracket to hold the monitor to the back board. We did this to create more space on
the work top. We also added a wireless mouse and keyboard; the current test system is
unorganized and there are too many lose wires. Wireless computer peripherals have developed a
lot in recent years and the devices can last 3-4 months without being charged. We also added a
label printer on the bottom table to print the results of the test. On the work top they currently
have a ruler to measure the length of the capillary tubes, this is very convenient, so we wanted
to include that in our design.
Figure 41: Third SOLIDWORKS design of Table Unit
We then added the nitrogen tanks which are supported by a dolly as shown in Figure 41.
One of the issues with the current testing system is that the nitrogen tank is in the middle of the
room. We thought by having a dolly in the position shown, the engineers would be able to easily

64
move the tanks and change them once they are empty. We initially planned to use a smaller tank,
but we were told that an issue in the Mexico facility is that they need to change these tanks
daily. So, we decided to have two tanks, meaning the engineers do not need to go and get a new
tank as frequently.
After talking to our sponsor, we decided to not use a dolly as part of the design. Instead,
we decided it was best to have the tanks in a fixed location at the back of the device which can
be seen in Figure 42. When the engineers change out the bottles, they can use a dolly to bring
them to the testing unit. We plan to have chains to hold the bottles in place as well as padding on
the framing. As each nitrogen tank weighs around 100 lb, this prompted us to add extra wheels to
support the weight and take the applied load off the frame. We also mounted the computer unit
on the back of the table unit, this will make the testing unit look tidier and create more space
around the sides of the table for the engineer using the testing device. With the computer
mounted to the back it will allow us to make the table unit longer since the space that was once
used for the computer box mounted on the left-hand side of the table is no longer there.
Figure 42: Fourth SOLIDWORKS design of Table Unit

65
With our fifth iteration of the table unit, we made substantial changes to the design by
creating a detachable nitrogen tank cart. Due to the constraints of getting the table unit into its
designated room, it meant the nitrogen tanks attached to the back of the table unit seen in the
fourth version of the design would not work due to the width of the door entering the room. This
then led us to develop our design and make it so the nitrogen cart could be detached from the
table unit. This then solved another issue that we would have been an intensive process moving
the entire cart around the facility in order to replace the nitrogen tanks.
Figure 43: Fifth SOLIDWORKS design with Nitrogen Tank Detached
Now the nitrogen cart can easily be detached from the main table unit and wheeled
around the facility to be restocked. Detail A section in figure 44 shows our first idea that we will
have connectors on the main table unit that then connect to the nitrogen cart incase the entire unit
wants to be moved at once.
Additionally, in this version of the design we added the bar on which the articulating arm
would be attached. This bar can be seen below the monitor. Finally, in this version of the table

66
design we added a box on the bottom table that would act as a location to store cables so that the
table unit can be easily organized.
Figure 44: Fifth SOLIDWORKS design of Table Unit
The fifth version of the table unit had one addition to the design, the drawers below the
worktop of the table unit. This table will be attached to drawer runners that in turn are attached to
two new 80/20 bars seen in the side view in figure 45. Finally, in this version of the design the
cable management box was moved to the other side so that any cables did not interfere with the
nitrogen cart.
Figure 45: Sixth SOLIDWORKS design of Table Unit

67
COMPONENT SELECTION PROCESS
5.13.1. 80/20 Extruded Aluminium
The first step in our component selection process was to determine how much 80/20
extruded aluminum we required to create our table unit and Nitrogen cart. Table 10 shows the
lengths of extruded aluminum we required as well as the amount of each component we needed.
In total we needed approximately 73 ft of the 1.50” x 1.50” fractional 15 series extruded
aluminum. The 15 series price per inch is $0.53 meaning it will cost $465.28 for the raw
materials. We will be cutting and machining the 80/20 in house.
TABLE UNIT
(15 series PN: 1515) NITROGEN TANK CART
Components Quantity Length
(inches) Components Quantity
Length
(inches)
Font legs
(Vertical) 2 38
Legs
(Vertical) 4 36
Back legs
(Vertical) 2 64
Short side
(Horizontal) 3 11
Short side
(Horizontal) 7 21
Long side
(Horizontal) 4 21
Long side
(Horizontal) 5 48
Tank base
(1530-S)
2
21
TOTAL (ft) ~52 Ft TOTAL (ft) ~21 ft
Table 10: Required Lengths and Quantities Of 80/20 Extruded Aluminum

68
Figure 46 shows our table and cart designs without any additional components for our
testing apparatus. This model was then used to determine what type of fasteners and fixtures we
were going to use to attach the 80/20 components together. Figure 47 shows the cross section of
the 1530-S 15 series aluminum which will be used on the base of the cart to support the two
nitrogen tanks.
Figure 46: 80/20 CAD Models Produced with Shepard Controls.
Figure 47: 1530-S 80/20 Used on Base of Nitrogen Tank.

69
5.13.2. Fasteners and Brackets
Since we are using 80/20 extruded aluminum, we also bought the fasteners and brackets
from the same company. After creating the layout for the unit, we were able to find how many
connectors and which variety of connector we will need. Table 11 shows the connectors chosen,
the quantity, and a picture and diagram of each part. We used different drill bits and counter bore
to attach all of the 80/20 extruded aluminum using the connectors.
NAME OF
CONNECTOR
PART
NUMBER
QUANTITY
PICTURE OF
CONNECTOR
DIAGRAM OF
CONNECTOR
Double end
fastener 3793 4
End fastener 3660 26
Anchor
fastener 3380 20
Corner
bracket 4301 8
Screw & T-
Nuts 3320 40
Table 11: Connectors Required to Make Table Unit and Nitrogen Tank Cart.

70
5.13.3. Quote from Shepard Controls
Figure 48 is the final quote for the 80/20 parts required for our project. Note that this
order was made in bulk and two items in are for another team working at Friedrich. With their
component prices deducted the total price for the framing and connectors is $796.85.
Figure 48: Final Quote from Shepard Controls

71
5.13.4. Panels and Worktops
The panels used on the backboard of our table unit are pegboards from Diamond Life
Gear. We ordered two 2'x3' Light Brushed Aluminum pegboards that are rated at one-half ton
(evenly distributed). The peg boards will need to be cut down to the correct sizes and then
attached to the 80/20 extruded aluminum using fasteners bought from Shepard Controls.
Pegboards were chosen as the back board as it provides the ability to easily fasten anything we
want onto it with any machining. The previous system was attached to a pegboard, so this will
also make it quick and easy to switch the system over onto the new table once it is manufactured.
We selected an aluminum construction as it ensures that the pegboard can withhold all the
attachments added and prevent bending from the weight as well as for its lightweight
construction.
The worktop the team decided on a 1-½ x 48 x 25-inch slab of butcher block. We cut it
down to size to fit on the top of the worktable. We then will seal it with oil-based clear
satin polyurethane which will prevent water damage and superficial scratches. We will plan to
use 90-degree brackets on the bottom side of the butcher block and the 80/20 fasteners to attach
the worktop to the 80/20 extruded aluminum. First, we will slide the fasteners into place on the
80/20 and then the fasteners will need be tightened into place using a Hex key. Once the brackets
are in the right location on the 80/20 framing, we will drill in screws through the other bracket
hole and into the wood to fasten down the butcher block.

72
WORKSPACE DESIGN
As follow up to the table unit and testing apparatus design we need to create a workspace
plane for the project. Figure 49 shows the final workspace configuration we designed, which we
believe will help improve productivity of technicians and engineers using the testing unit. Both
testing systems are easily accessible as well as the connectors that are regularly being changed.
The connectors will be found at the top of the workspace in four different tool holders, which
will be clearly organized. Additionally, storage bins will be found on the pegboard workspace for
other commonly used tools in the testing process. The monitor is going to be attached to the
workspace pegboard via a monitor arm so that it is off the workspace, creating free space on the
tabletop.
Figure 49: Workspace Configuration

73
6. UNEXPECTED PROBELEMS
TEST #1
Before we ordered system components for the mass flow system, we wanted to create a
prototype that would prove our hypothesize by enabling us to find the pressure drops across
capillary tubes. Figure 50 shows our first experimental concept for finding the pressure drop
across the capillary tubes. However, an unexpected problem showed up after we had created the
system shown below. The nitrogen flowing through the system was not being measured by the
pressure gauge as it was bypassing the sensor and exiting the T-junction without any pressure
build up. This is depicted in figure 51. This unexpected problem turned out to be particularly
useful as it enabled us to find a solution before the system components arrived, saving us time
overall. We brainstormed solutions from using pitot tubes, a pressure transducer after the
pressure gauge and to adding another mass flow device to be used to back calculate the pressure.
These three solutions had long lead times and would cost money to test without any certainty that
they would be suitable solutions.
Figure 50: Experiment #1 Testing Device Configuration

74
Figure 51: Nitrogen Flow Path
To resolve this issue can be seen in Figure 52. Through testing we founded that adding a
second quick connector with a coiled capillary tube connected to it we can create the back
pressure we need. The second connector and coiled tube creates a constriction similar to what
occurs in the inlet of the mass flow system enabling the pressure to be measured by the
transducer downstream of the capillary tube. After we found this solution, we test for deciding
what type of coiled capillary tube should be used. We found that having a capillary tube that had
a larger inner diameter than the tube being tested meant there was the lowest impact on the mass
flow rate of the system.
Figure 52: Solution to Creating Back Pressure

75
7. SYSTEM PROTOTYPE RESULTS
PROTOTYPE TEST #2
PRESSURE DROP THEROY TESTING
OBJECTIVES:
Determine how accurate our theoretical pressure drop calculator is when compared to real
results obtained by our prototype testing device. Additionally, we will compare pressure drops
using our prototype apparatus of two identical capillary tubes that come from two different
suppliers.
LIST OF EQUIPMENTS USED:
• Capillary tubes
• Calibrated gauge
• Nitrogen tank
• Quick connectors
• Existing capillary tube testing device components
PROCEDURE:
Figure 53: Experiment #2 Diagram

76
1. Select capillary tubes we will be testing.
2. Connect capillary tubes to the prototype testing apparatus.
3. Set inlet pressure to be 50 psi.
4. Manually record outlet pressure from calibrated gauge and calculate pressure drop
across capillary tube.
5. Use our pressure drop calculator to predict what the pressure drop should be.
6. Compare results from experimental results and Predicted results.
TESTING SET UP:
Figure 54: Experiment #2 Testing System
DISCUSSION:
Before collecting data for this experiment, we assumed the data we collected would be
very different from the predicted values of pressure drop as many large assumptions were made
in order to find the pressure drop theoretically. The main assumption was the surface roughness,
𝜖 of the capillary tubes were all the same at 0.000005 [1], which we know will not be the case as

77
well as the roughness we are using for the calculations is only an estimate. The data collected
form the first test can be seen in Table 12.
RESULTS:
RED CONNECTOR
PART NUMBERS
ID LENGTH INLET
PRESSURE OUTLET
PRESSURE
PRESSURE IFFERENCE MEASURED
MASS FLOW MEASURED
PRESSURE DIFFERENCE PREDICTED
% DIFFERENCE PRESSURE
DROP
(INCH) (INCH) (PSI) (PSI) (PSI) (CFM) (PSI) %
3760451 0.05 19.5 50 40.42 9.58 0.43 28.3 98.83
3760482 0.05 25 50 34.68* 15.32 0.382 29.39 62.93
3760557 0.04 30 50 23.5 26.5 0.289 57.35 73.58
3760513 0.05 30 50 39.372 10.628 0.424 38.5 113.46
3760451 0.05 19.5 50 42.75 7.25 0.424 28.3 118.42
YELLOW CONNECTOR
PART NUMBERS
ID LENGTH INLET
PRESSURE OUTLET
PRESSURE
PRESSURE IFFERENCE MEASURED
MASS FLOW MEASURED
PRESSURE DIFFERENCE PREDICTED
% DIFFERENCE PRESSURE
DROP
(INCH) (INCH) (PSI) (PSI) (PSI) (CFM) (PSI) %
3760451 0.049 19.5 50 33.43 16.57 0.643 28.3 52.28
3760557 0.036 30 50 13.42 36.58 0.323 57.35 44.22
3760557 0.036 30 50 13.42 36.58 0.323 57.35 44.224
3760432 0.049 25 50 31.37 18.73 0.608 4.82 118.138
3760482 0.049 25 50 31.27 18.83 0.609 29.39 43.792
Table 12: Pressure Drop Theory Results

78
CONCLUSION:
In conclusion our predicted pressure drop was clearly different from the
measured pressure drop, but this was to be expected. Since we were making a lot
of assumptions about the predicted pressure drop such as the roughness of the
tubes, we knew the results would not match.
This experiment made us realize that rather than trying to predict the
pressure drop across the tubes we should focus on the friction factors of the tubes
themselves as that is something we can measure with the prototype testing device
as it measures the mass flow rate and the pressure difference. These two
parameters are the only experimental parameters we need to find the friction factor.
Additionally, it gave us an insight into what connectors work best with what
capillary tubes on the outlet of the calibrated gauge. What we found worked best
was to use the same-colored Remer connector with a capillary tube that has a
larger inner diameter than the one being tested for the pressure difference.
In a future experiment using the prototype testing device we explore this
concept in detail. While this experiment was not successful in the sense of
predicting results, it was successful in regard to progressing the project and
developing our understanding of how capillary tubes behave.

79
PROTOTYPE TEST #3
NATIONAL COPPER VS MINALLUM CAPILLARY TUBE PRESSURE DROP TEST
OBJECTIVES:
Determine and compare the pressure drops of two identical capillary tubes that come
from two different suppliers using the same prototype testing apparatus.
LIST OF EQUIPMENTS USED:
• Capillary tubes
• Calibrated gauge
• Nitrogen tank
• Quick connectors
• Existing capillary tube testing device components
PROCEDURE:
1. Select two identical capillary tubes from both suppliers (four tubes total).
2. Connect capillary tubes to the prototype apparatus.
3. Set inlet pressure to different high pressures (40 – 80 psig).
4. Manually record outlet pressure and mass flow rates from the system and
calculate pressure drop across two capillary tubes from national copper. Repeat
steps for all four tubes.
5. Repeat for different capillary tube part numbers.
6. Compare pressure drop results from both capillary tube suppliers.
DISCUSSION:
The graphs seen in Figures 55 through Figure 59 show the data we recorded when
conducting this test. The tabulated data can be found in the appendix in section 17.1. With the
data we gathered we created pressure drop vs mass flow rate graphs to show the differences in
the capillary tube data our prototype system is capable of determining.

80
Figure 55: Mass flow rate vs Pressure drop graph for PN: 1389915
Figure 56: Mass flow rate vs Pressure drop graph for PN: 03760518
5
5.5
6
6.5
7
7.5
8
8.5
9
9.5
10
10.5
11
0.45 0.5 0.55 0.6 0.65 0.7 0.75 0.8 0.85 0.9 0.95
Pre
ssu
re D
rop
(P
SIG
)
Massflow (CFM)
National Copper VS Minallum Capillary tubes (PN = 1389915)
Nation CopperSample 1
Nation CopperSample 2
Minallum CopperSample 1
Minallum CopperSample 2
99.510
10.511
11.512
12.513
13.514
14.515
15.516
16.517
17.518
18.519
19.520
0.4 0.45 0.5 0.55 0.6 0.65 0.7 0.75 0.8 0.85
Pre
ssu
re D
rop
(P
SIG
)
Massflow (CFM)
National Copper VS Minallum Capillary tubes (PN = 3760518)
Nation CopperSample 1
Nation CopperSample 2
Minallum CopperSample 1
Minallum CopperSample 2

81
Figure 57: Mass flow rate vs Pressure drop graph for PN: 03760553
Figure 58: Mass flow rate vs Pressure drop graph for PN: 03760482
212223242526272829303132333435363738394041
0.38 0.43 0.48 0.53 0.58 0.63 0.68
Pre
ssu
re D
rop
(P
SIG
)
Massflow (CFM)
National Copper VS Minallum Capillary tubes (PN = 03760553)
Nation CopperSample 1
Nation CopperSample 2
Minallum CopperSample 1
Minallum CopperSample 2
16
17
18
19
20
21
22
23
24
25
26
27
28
0.48 0.53 0.58 0.63 0.68 0.73 0.78 0.83 0.88
Pre
ssu
re D
rop
(P
SIG
)
Massflow (CFM)
National Copper VS Minallum Capillary tubes (PN = 03760553)
Nation CopperSample 1
Nation CopperSample 2
Minallum CopperSample 1
Minallum CopperSample 2

82
Figure 59: Mass flow rate vs Pressure drop graph for PN: 03760451
CONCLUSION:
From this experiment we found that through our prototype testing setup we were able to
measure different pressure drops across different capillary tubes at varying mass flow rates and
inlet pressures. This proved that our prototype testing system for finding the pressure drop across
the capillary tubes has the potential to find inherent problems within the capillary tubes that the
mass flow test would not be able to detect.
13
14
15
16
17
18
19
20
21
22
23
0.5 0.55 0.6 0.65 0.7 0.75 0.8 0.85 0.9 0.95
Pre
ssu
re D
rop
(P
SIG
)
Massflow (CFM)
National Copper VS Minallum Capillary tubes (PN = 03760553)
Nation CopperSample 1
Nation CopperSample 2
Minallum CopperSample 1
Minallum CopperSample 2

83
PROTOTYPE TEST #4
LARGE SCALE TEST ON PN: 03760518
OBJECTIVES:
Conduct a large-scale test on one type of capillary tube, Part number 03760518 to see if
we are able to find a variation in the friction factor of the two manufacturers capillary tubes.
LIST OF EQUIPMENTS USED:
• Capillary tubes
o 7 National Copper tubes
o 12 Minallum Tubes
• Calibrated gauge
• Nitrogen tank
• Quick connectors
• Existing capillary tube testing device components
PROCEDURE:
1. Connect the first national copper capillary tubes to the prototype apparatus.
2. Set inlet pressure to 80 psig.
3. Manually record outlet pressure from calibrated gauge as well as the mass flow rate and
calculate the friction factor of the capillary tubes.
4. Repeat for all seven National Copper tubes and all 12 Minallum tubes.
RESULTS:
Tabulated data results found in the appendix, section 17.2.
Table 13: Friction Factors Data Collected For PN: 03760518
DATA NATIONAL COPPPER MINALLUM
MIN 0.004995781 0.005058478
Q1 0.005042427 0.005083036
MEDIAN 0.005074127 0.00511544
Q3 0.005122381 0.005189467
MAX 0.005143365 0.005233381

84
Figure 60: Box & Whisker plot for National Copper VS Minallum (PN: 03760518)
CONCLUSION:
From this test we found a large variation in friction factors when comparing the National
Copper tubes with the Minallum tubes, shown in a box and whisker graph in Figure 60. As a
result, we selected three capillary rubes to be tested in AC units at Friedrich. We selected a base
line tube from national copper, which was close to the average value of friction factor for
National Copper tubes. Then we selected a base line tube from Minallum, which was close to the
average value of friction factor for Minallum tubes. Finally, we selected a Minallum tube which
had the greatest friction factor.
0.00498
0.00503
0.00508
0.00513
0.00518
0.00523
NATIONAL COPPPER MINALLUM
Box & Whisker plot for National Copper VS Minallum
PN: 03760518

85
RESULTS FROM AC UNIT PERFORMANCE TEST #1
The aim of Test #4 was to measure the friction factors of lots of capillary tubes and then
compare the data we found. With the testing performed with the prototype system in our fourth
test we selected three capillary tubes to be performance tested in an AC unit. From the
performance testing we obtained performance-based results which can be seen in Table 14.
The AC unit the capillary tubes we tested in was: UNIT KHS12A33A - SN2003M93068. This
Air conditioning unit is rated at 12,000 Btu/hr and has a CEER of 10.8 and runs on 230V, 60Hz.
CEER stands for Combined Energy Efficiency Ratio which is a standard used for window air
conditioners and measures the combined efficiency of the unit when it is in standby and when it
is cooling a space.
Tube Label Manufacturer Friction Factor
(Straight)
Capacity
(BTU/hr.) CAP % CEER
RAC20-066D National copper
(Stock tube) N/A 11,042 92.0% 10.9
RAC20-066E National copper
(Tube #2) 0.005085273 11,636 97.0% 10.9
RAC20-066F Minallum
(Tube #3) 0.005081843 11,535 96.1% 10.8
RAC20-066G Minallum
(Tube #12) 0.00523338 11,563 96.4% 10.8
Table 14: AC Unit Performance Testing Results For PN: 03760518
Description of work:
1. Run standard cooling with stock tube.
2. Remove stock capillary tube, label cap tubes as “stock.”
3. Install (2) cap tubes provided by STMU Team, include capillary tube information
(supplier, flow, etc.) in notes.
4. Run standard cooling.

86
DISCUSSION:
The results from the performance testing were not what we expected them to look like as
we predicted RAC20-066G would have the worst performance when in fact RAC20-066F had
the worst performance. While the results did not match our predictions, they still supplied a
useful insight.
RAC20-066D RAC20-066F RAC20-066G RAC20-066E
VARIATION National
copper
(Stock tube)
Minallum
(Tube #3)
Minallum
(Tube #12)
National
Copper
(Tube #2)
PIN MASS
FLOW PIN MASS
FLOW PIN MASS
FLOW PIN MASS
FLOW
MAX
MASS FLOW
MIN
MASS FLOW
%
DIFFERENCE
20.02 0.453 19.99 0.454 20.00 0.450 20.00 0.449 0.454 0.449 1.11%
25.19 0.537 25.18 0.534 25.17 0.528 25.16 0.528 0.537 0.528 1.69%
30.24 0.618 30.24 0.612 30.24 0.605 30.24 0.605 0.618 0.605 2.13%
35.12 0.697 35.11 0.685 35.10 0.680 35.10 0.679 0.697 0.679 2.62%
40.02 0.764 40.02 0.748 40.02 0.741 40.02 0.745 0.764 0.741 3.06%
45.14 0.851 45.12 0.83 45.12 0.821 45.12 0.821 0.851 0.821 3.59%
50.05 0.93 50.05 0.94 50.05 0.895 50.05 0.895 0.940 0.895 4.90%
55.03 1.009 55.02 0.975 55.02 0.969 55.02 0.966 1.009 0.966 4.35%
60.00 1.089 60.04 1.05 60.00 1.046 60.00 1.039 1.089 1.039 4.70%
65.06 1.168 65.06 1.123 65.06 1.113 65.06 1.105 1.168 1.105 5.54%
Table 15: Mass Flow Data at Increasing Input Pressures For PN: 03760518

87
After the tubes were formed into a coil and the performance was tested in an AC unit, we
checked the mass flow rates of the capillary tubes again and found a correlation between the data
and the mass flow rates when testing at increasing pressures. Through extensive testing we found
a direct correlation to increased pressures creating a larger variation in mass flow rates, this can
be seen in Table 15 and graphically displayed Figure 56. Additionally, when we analysis the
performance testing data we can see that the flow rate was proportional to the capacity of the AC
unit, seen in Table 16.
To find this correlation we tested the mass flow rate at pressure ranging from 20 psig to
65 psig at intervals of 5 psig. To improve the accuracy of these tests we ensured the input
pressured remained within a window of 0.5%. We then graphed the data we collected and plotted
them on a pressure’s vs mass flow graph. This can be seen in Figure 61. It is clear that at low
pressures the mass flow rates varied less between the four tubes than at high pressures.
Tube Label Manufacturer Pressure
(PSI)
Mass
flow
(CFM)
Capacity
(BTU/hr.) CAP %
RAC20-066D National copper
(Stock tube) 60.0005 1.089 11,042 92.00%
RAC20-066F Minallum
(Tube #3) 60.043 1.05 11,535 96.10%
RAC20-066G Minallum
(Tube #12) 60.003 1.046 11,563 96.40%
RAC20-066E National copper
(Tube #2) 60.001 1.039 11,636 97.00%
Table 16: AC Unit Performance Testing Results For PN: 03760518

88
Figure 61: Mass flow Vs Pressure plot for National Copper VS Minallum (PN: 03760518)
As Fredrich has over 30 capillary tube variations at their San Antonio Facility we will not
conclude that every tube performs in this nature, Further testing will need to be conducted to
further explore the correlations found from these performance tests on difference capillary tubes
part types.
18
23
28
33
38
43
48
53
58
63
68
0.4 0.5 0.6 0.7 0.8 0.9 1 1.1 1.2
INLE
T P
RES
SUR
E (P
SIG
)
MASS FLOW RATE (DFM)
POST PERFORMANCE MASS FLOW TESTING PN: 03760518
RAC20-066D
RAC20-066F
RAC20-066G
RAC20-066E

89
PROTOTYPE TEST #5
LARGE SCALE TEST ON PN: 03760553
OBJECTIVES:
Conduct a large-scale test on one type of capillary tube, Part number 03760553 to see if
we are able to find a variation in the friction factor of the two manufacturers capillary tubes.
LIST OF EQUIPMENTS USED:
• Capillary tubes
o 10 National Copper tubes
o 11 Minallum Tubes
• Calibrated gauge
• Nitrogen tank
• Quick connectors
• Existing capillary tube testing device components
PROCEDURE:
5. Connect the first national copper capillary tubes to the prototype apparatus.
6. Set inlet pressure to 80 psig.
7. Manually record outlet pressure from calibrated gauge as well as the mass flow rate and
calculate the friction factor of the capillary tubes.
8. Repeat for all 10 National Copper tubes and all 10 Minallum tubes.
RESULTS:
Tabulated data results found in the appendix, section 17.3.
PART NUMBERS
ID LENGTH PRESSURE
DIFFERENCE MEASURED
PRESSURE DIFFERENCE MEASURED
MASS FLOW MEASURED
FRICTION FACTOR
(INCH) (INCH) (PSI) PSF (CFM)
NC2 0.042 25 47.051 6775.344 0.807 0.0051543
NC9 0.042 25 47.186 6794.784 0.805 0.0051948
M5 0.042 25 46.162 6647.328 0.823 0.0048622
M11 0.042 25 46.46 6690.24 0.817 0.0049657
Table 17: Tubes selected for performance testing PN: 03760553

90
Figure 62: Box & Whisker plot for National Copper VS Minallum (PN: 03760553)
CONCLUSION:
From the testing of tube 03760553 we selected two sets of two capillary tubes from
National Copper and Minallum. The National copper tubes had a low mass flow rate and a high
friction factor straight tube. The Minallum tubes had a high flow rate with a low friction factor
straight tube. The results can be seen in section 7.6. All tubes pass flow rate tests at 20 psig.
0.0048
0.0049
0.005
0.0051
0.0052
0.0053
NATIONAL COPPPER MINALLUM
Box & Whisker plot for National Copper VS Minallum
PN: 03760553

91
RESULTS FROM AC UNIT PERFORMANCE TEST #2
The aim of Test #5 was to predict what capillary tubes would perform better than others.
With the testing performed with the prototype system in our fifth test we selected two sets of two
capillary tubes to be performance tested in an AC unit. From the performance testing we
obtained performance-based results which can be seen in Table 18. The AC unit the capillary
tubes we tested in was: UNIT WCT12A30B-A SN 2101M01275. This Air conditioning unit is
rated at 12,000 Btu/hr and has a CEER of 10.5 and runs on 230V, 60Hz. We predicted the
National copper tubes would perform the best as for this performance test we selected Minallum
tubes with the highest flow rates at elevated pressures.
Tube 1 Tube 2 Manufacturer Capacity
(BTU/hr.)
CAP
% CEER
RAC21-033A
Stock #1
RAC21-033A
Stock #2
National
Copper 12,405 103.4 10.6
RAC21-033B
NC2
RAC21-033B
NC9
National
Copper 12,425 103.5 10.7
RAC21-033C
M5
RAC21-033C
M11 Minallum 12,100 100.8 10.5
Table 18: AC Unit Performance Testing Results For PN: 03760553
Description of work:
1. Run standard cooling with stock tube.
2. Remove stock capillary tube, label cap tubes as “stock.”
3. Install (4) cap tubes provided by STMU Team, include capillary tube information
(supplier, flow, etc.) in notes.
4. Run standard cooling.

92
DISCUSSION:
From these results we could see the Minallum tubes with High flow rate with a low
friction factor performed worse than the National copper tubes which had a low mass flow rate
and a high friction factor, as we expected. This is a great result for our testing device as it proves
its possible to measure the mass flow rate and pressure drop at elevated pressures and predict
what capillary tubes will perform the best.
We also conducted the same analysis on the formed capillary tubes after they had been
performance tested. However, with these particular tubes we did not see the same trend as we did
with PN: 03760518, this can be seen in Table 19 and Figure63. This could be due to the
properties of the capillary tube such as length and inner diameter. We would recommend
Friedrich tests more capillary tubes with different part numbers; we will detail this more in
section 14.
RAC21-033A RAC21-033B RAC21-033C VARIATION National copper
(Stock Average)
National copper
(Average)
National copper
(Average)
PRESSURE MASS FLOW
PRESSURE MASS FLOW
PRESSURE MASS FLOW
MAX
MASS
FLOW
MIN
MASS
FLOW
% DIFFERENCE
20.122 0.265 20.099 0.268 20.075 0.2785 0.279 0.265 4.97% 30.057 0.3585 30.038 0.36 30.049 0.3765 0.377 0.359 4.90% 40.213 0.451 40.191 0.4505 40.188 0.4675 0.468 0.451 3.70% 50.117 0.5295 50.074 0.5235 50.066 0.5445 0.545 0.524 3.93% 60.216 0.638 60.202 0.6315 60.196 0.6565 0.657 0.632 3.88% 70.227 0.734 70.166 0.7235 70.164 0.739 0.739 0.724 2.12% 80.180 0.821 80.100 0.804 80.095 0.832 0.832 0.804 3.42% 89.996 0.9185 89.949 0.898 89.942 0.9225 0.923 0.898 2.69% 96.000 0.9765 95.935 0.952 95.927 0.9755 0.977 0.952 2.54%
Nominal flow rate values 0.560 0.528 5.88%
Table 19: Mass Flow Data at Increasing Input Pressures For PN: 03760553

93
Something key to note with this data is that on average the capillary tube mass flow vs
pressure did not vary more than the nominal flow rate difference percentage supplied by the
capillary tube supplier or 5.88%. However this particular units pressures exceed 135.5 psig,
which is outside of the testing window we can test with at Friedrich. If equipment was not the
limiting factor here we would have continued to the test capillary tubes to pressures that exceed
135.5 psig.
Figure 63: Mass flow Vs Pressure plot for National Copper VS Minallum (PN: 03760518)
15.000
25.000
35.000
45.000
55.000
65.000
75.000
85.000
95.000
105.000
0.2 0.3 0.4 0.5 0.6 0.7 0.8 0.9 1
Pre
ssu
re (
PSI
G)
mass flow rate (CFM)
Post Performance mass flow testing PN: 03760553
National copper (Stock tube #1)
National copper (Stock tube #2)
National copper (Tube #2)
National copper (Tube #9)
Minallum (Tube #5)
Minallum (Tube #11)

94
8. FINITE ELEMENT ANALYSIS
Through using finite element analysis, we were able to locate what regions of the table
are under the highest stress as well as what regions of the table will deflect the most. For this
analysis we applied 200-pound force to the four work surface beams, to simulate a two people
leaning on the table or a large object being placed on the work surface, the locations of the loads
can be seen in Figure 64. This load is a lot higher than the load normally being applied to the
table unit. We estimate the normal load on the table is 50 lb on to the work surface and 30 lb
applied to the workspace(pegboard). Additionally, the force of gravity was applied to create a
more realistic analysis. The matrial that was selected for this analysis for Aluminium 6063-T5
which was the closest comparison to the material 80/20 is made from, 6105-T5. The yueild
strength of 6105-T5 is 35,000 psi.
Figure 64: Loading Regions

95
From Figure 65 we were able to see that the highest stresses were located at the top of the
front legs. We will re-enforce this region with additional brackets and the strongest fasteners
from 80/20 to ensure that if a large load is suddenly applied to the table, it will not break at this
region. The max stress under this extreme load is 1200 psi. With a yield strength of 35,000 psi,
the aluminum framing of the table unit will not begin to deform plastically under realistic and
extreme loads.
Figure 65: Stress Finite Element on Table Frame

96
Figure 66 is a displacement analysis under the same load that was previously outlined.
Under this load we found that the most deflection will occur in the long horizontal beams. The
deflection in this region is 0.661 mm, which under the extreme load shows these members are
strong enough to not bend out of shape under any realistic loads that will be applied to it. The
scale of the deformation in Figure 60 is exaggerated.
Figure 66: Displacement Finite Element on Table Frame
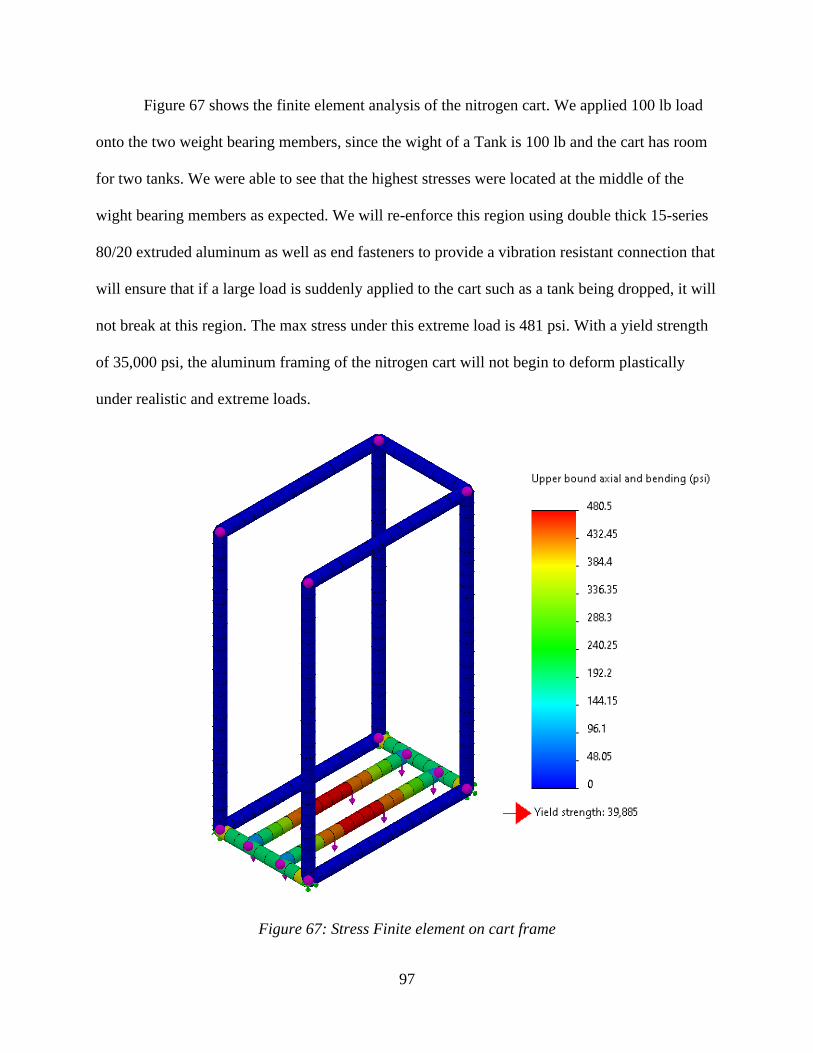
97
Figure 67 shows the finite element analysis of the nitrogen cart. We applied 100 lb load
onto the two weight bearing members, since the wight of a Tank is 100 lb and the cart has room
for two tanks. We were able to see that the highest stresses were located at the middle of the
wight bearing members as expected. We will re-enforce this region using double thick 15-series
80/20 extruded aluminum as well as end fasteners to provide a vibration resistant connection that
will ensure that if a large load is suddenly applied to the cart such as a tank being dropped, it will
not break at this region. The max stress under this extreme load is 481 psi. With a yield strength
of 35,000 psi, the aluminum framing of the nitrogen cart will not begin to deform plastically
under realistic and extreme loads.
Figure 67: Stress Finite element on cart frame

98
Figure 68 is a displacement analysis under the same load that was previously outlined for
the Nitrogen cart. Under this load we found that the most deflection will occur at the middle of
the wight bearing members as expected. The deflection in this region is 0.0977 mm, which under
the extreme load shows these members are strong enough to not bend out of shape under any
realistic loads that will be applied to it. The scale of the deformation in Figure 68 is exaggerated.
Figure 68: Displacement Finite element on cart frame

99
9. FINAL DESIGN OF APPARATUS
DETAILED SYSTEM OVERIVEW OF NEW SYSTEM
Figure 69: Labeled CAD Drawing of Final Version of Testing Apparatus
DISCUSSION
After finalizing our design of our new testing system through many different iterative versions
we ended on a final design seen in Figure 69. This model was created in SolidWORKS to show a
3D version of what we had created using 2D visualization tools. The system is separated into two
key parts, the mass flow section and the pressure differential section. The mass flow section is
the main part of the system that can accurately measure the mass flow rate through the capillary
tube. This can run with or without the pressure differential section depending on what parameters
Friedrich engineers require. Most of the time just the mass flow system will be in use since it
provides accurate pass/fail results on capillary tubes that are understood. The pressure
differential component of the system will be used when a new capillary tube supplier is utilized
at Friedrich and the properties of the new tubes need to be analyzed.

100
10. FINAL DESIGN OF TABLE UNIT AND NITROGEN CART
DETAILED SYSTEM OVERIVEW OF NEW TABLE UNIT
Figure 70 shows the system overview of the new table unit. As you can see, we have
added the testing unit to the pegboard as well as the articulating arm to the rail. The monitor is
also attached to the pegboard, this allows for a large workspace on the tabletop. The cable
management box on the bottom shelf has tidied the cables making it much more organized than
the current testing system at Friedrich.
Figure 70: Dimetric View of Final Version of Table Unit

101
Figure 71 shows the dimensions of the final design, it is fifty inches wide, seventy inches
tall and the tabletop is forty-six inches from the floor. The tabletop is twenty-four inches wide.
These dimensions are larger than the dimensions of the current testing unit. By increasing
the dimensions, it allows us to create a larger work surface for the technician.
Figure 71: Dimensions of Final Version of Table Unit

102
DETAILED SYSTEM OVERIVEW OF NEW CART
Figure 72 shows the final design of the nitrogen cart, this will be used to transport the
nitrogen tanks around the testing facility when they need to be changed out. Additionally a chain
will be attached on the open side for safety purposes.
Figure 72: Dimetric View of Final Version of Nitrogen Cart

103
Figure 73 shows the dimensions of the nitrogen cart, it is forty-four inches from the floor.
You can see in the detailed cross section view that we used the double width extruded aluminum.
This is to support the larger load from the nitrogen tanks, as they are 100lb each.
Figure 73: Dimensions of Final Version of Nitrogen Cart

104
11. CONSTRUCTION PROCESS
After receiving the order of the 80/20 Aluminum we developed a plan to cut the 20-foot
sections into specific lengths in order to match the dimensions made in SolidWORKS. We used a
table-saw provided to us from the Friedrich facility to cut the pieces needed, this can be seen in
Figure 74. After all the aluminum was cut at the facility, it was moved to the Annex construction
laboratory at St. Mary’s University. This is a place where we continued the construction process
by smoothing out all the edges of the Aluminum by using a metal cleaning scrapper and a
grinder provided by the lab. While this was going on Mr. Wier, the technician at the Annex
helped us set up the drill press with the milling piece we had ordered online. Seem in Table 20.
After milling each necessary Aluminum piece, we set up the drill press for drilling access hole
where they were needed for the construction of the table. Knowing that all the correct holes were
drilled we then began to put the frame of the table together and transfer it back to the Friedrich
facility.
Figure 74: Dimensions of Final Version of Nitrogen Cart

105
When the table was put together at the facility, we started to end tap the necessary holes
for the wheels to go in under the table and for the end fasteners as well seen in Table 20. As a
group the next thing we did was getting sheet metal provided to us at the facility and cutting it to
a specific length to add as the bottom shelf and the nitrogen tank cart. We worked with the
Technician Rene to use the machine press at the facility in order to cut the sheet metal precisely,
seen in Table 20. There also needed corners cut for each shelf of sheet metal so we used the 90-
degree sheet cutter for this part. Next, when the pegboard came in, we used the same process as
before to cut the metal to the correct length. Using the sheet metal press with Rene we were able
to get the correct length and successfully attach the pegboard to the back part of the table. To
attach the pegboard to the Aluminum we used a T-nut by dropping it down the center of the
80/20 metal and then using a screw to fasten it tightly to the Aluminum. To make sure we had
extra support for certain areas of the frame that may have been unstable, we used an L-bracket in
order to secure those areas.
The next part of the process we worked on was when the wooden butcher block came in
to serve as our work surface. When we received the table, we figure that it was hanging of the
edge of the frame too much, so we cut off about an inch to make it more square with the
frame. To secure the wooden surface to the table we mounted 90-degree brackets on the inside
faces of the 80/20 that support the wooden work surface. These were used to fasten the wooden
butcher block to the tables frame.
The next step was to use a sheet metal punch to create some hole in order to feed some of
the adapters needed for the test system that Friedrich is using. We used two-hole punches with
diameter of 1.5” and ¾" to make adequately sized holes needed to put the adapter through the
pegboard. On the top right side of the table, we used screws and 80/20 T-nuts in order to securely
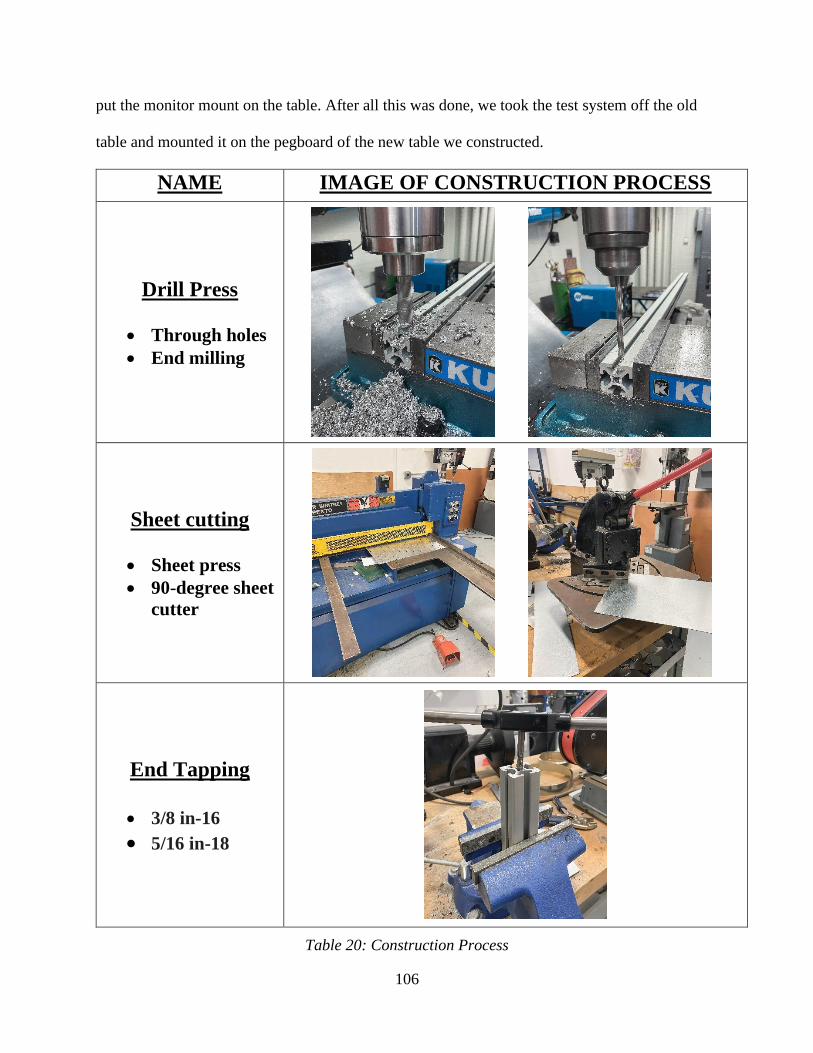
106
put the monitor mount on the table. After all this was done, we took the test system off the old
table and mounted it on the pegboard of the new table we constructed.
NAME IMAGE OF CONSTRUCTION PROCESS
Drill Press
• Through holes
• End milling
Sheet cutting
• Sheet press
• 90-degree sheet
cutter
End Tapping
• 3/8 in-16
• 5/16 in-18
Table 20: Construction Process

107
12. COMPLETED FABRICTATION OF TABLE UNIT AND
NITROGEN CART
Figures 75 and 76 show two key moments in the construction of the table and cart units.
Figure 75 is a photo of table with the frame’s members correctly assembled. Figure 76 is a photo
of the table and cart units with all the panels and work surfaces attached. From this stage in the
project, we then set about connected the system components and hardware to the table.
Figure 75: Assembled 80/20 Framing

108
Slight modifications will be made in the process of attaching system components onto the
table as we will need to attach the main computer box using brackets to the back of the table as
well as put more screws onto the pegboard to improve its rigidity. Also notice how the drawers
have not been constructed yet, this is because it is not a critical component of the system and will
consume a large amount of time to manufacture. This will be completed after we finalize the rest
of the testing systems.
Figure 76: Table and Cart complete construction

109
13. COMPLETED NEW SYSTEM
TESTING APPARATUS
After completing the basic construction of the tables frame we began creating the testing
system we had planned and designed leading up to this point in the project. As we went about
fabricating the new testing system we had to make minor modifications to our original designs in
order to create a better system. The main difference that is noticeable is that we inverted the
layout of the testing system, seen in Figure 77. This is because the mass flow meter has a fixed
screen and direction of flow. By inverting the system, the screen on the meter is facing the inside
of the table rather facing out of the table. This means we had to move the location of the
computer monitor as well as the location of the system.
Figure 77: New Workspace
As well as making minor changes to the design we had to fabricate parts in order to
facilitate the design. We fabricated the bracket that supports the mass flow meter in its new

110
position as well as an elbow to create the additional 90-degree bend before the mass flow meter.
These fabricated parts can be best seen in Figure 78 as well as Figure 77.
The 90-degree elbow consists of two brass adapters braised to a ½ in copper pipe. While
the copper pipe is quite a fragile component due to its low ductile strengths a suggestion we
would be to use a metal such as brass. The bracket was made of a 16-gauge aluminum that was
bent into the desired shape using a sheet bender. This bracket was then screwed into the
worksurface.
The final new addition to the system was a triangular bracket that the end of the capillary
tube could be threaded through. While we did not fabricate this component, it’s provides
clearance at the end of the tube so that when it rests on the table the flow rate is not disturbed.
This component can be best seen in figure 77.
Figure 78: New Testing Device

111
TABLE UNIT AND NITROGEN CART
While the testing apparatus is the most important component of our project, it was still
important that the table was functional and optimized for ease of use. While most of these
considerations were implemented with the testing system itself, the table was the framework that
housed the system. As seen in Figure 79 the table unit is complete with a ruler to measure
capillary tubes, easy access storage for adapters and tools, bulk storage for documents and other
miscellaneous tools used in capillary tube testing, and cable organization.
Figure 79: Complete Shelf, Cart and Testing Device

112
Next to the table unit in Figure 79 the nitrogen cart can been see holding one tank. This
tank is strapped to the framing of the cart for safety purposes.
Near the end of completing the project we purchased a Husky toolbox to house the
documents and other miscellaneous tools that we originally planned on putting into a drawer. We
went with this solution as it a more cost and time effective solution compared to fabricating a
large sliding drawer. The toolbox can be seen in Figure 80.
Figure 80: Under Workspace Storage

113
14. FURTHER IMPLEMENTION AND DEVELOPMENT
LIMITING FACTORS
The major limiting factor for our project other than time was the limits of the equipment. The
problem we were trying to solve requires deeper more accurate analysis than just testing the
mass flow rate at low unrealistic pressures. Ideally, we would have created a system that
precisely can measure the mass flow rate and pressure at the inlet of the capillary tube and outlet
of the capillary tube. In reality this is not possible as the Ramer connected are needed to connect
the small diameter of the capillary tube to the larger diameter mass flow meters and pressure
transducers.
FURTHER TESTING
Although we have conducted countless tests on capillary tubes in Friedrich’s database
there is still more extensive testing that can be conducted. While we have been analyzing
National copper and Minallum tubes, Friedrich has made it clear that Minallum tubes will no
longer be used for AC units. We suggest that when Friedrich next gets a new supplier, they
follow the testing methods outlined below.
1. Perform extensive testing on a large sample of the new capillary tubes at elevated
pressures (greater than 70 psig) and compare the results of those tests to a large-scale
test of national copper tubes at the same inlet pressure.
a. This data can be analyzed through calculating the friction factors of the
capillary tube at the elevated pressure using the following equation.
𝑓 =∆𝑝 2𝐷
𝐿𝜌𝑉2

114
The fraction factors from all the tubes can be compared and if it is found there
is a substantial different, further performance testing can be conducted. When
looking at the calculated friction factors of the capillary tubes, realizes this
variable is not just of the tube but in reality, the friction factor of the entire
system. The only variable that is changing however is the capillary tube. This
is due to the limiting factor of the equipment and the technology of the testing
system.
b. This data can also be analyzed through testing the tubes mass flow rates at
increasing pressure intervals without the pressure drop transducer connected.
See Section 7.3 and Section 7.4 for an example of this analysis.
2. After a large quantity of tubes have been tested using the testing device, we
recommend selecting tubes for performance testing. We recommend selecting tubes
from the new supplier that have high mass flow rates at high pressure or tubes with
low friction factors when compared to seemingly identical national copper capillary
tubes. Then select baseline tubes from national copper to compare the results with. See
Section 7.5 and Section 7.6 for an example of this.
SURFACE ROUGHNESS OPTICAL TESTER
We also have another recommendation for Friedrich to consider. Purchasing an optical
surface roughness testing device such as the one seen in Figure 81. With this device an engineer
could cut open a capillary tube and directly test the surface roughness of the new suppliers’
capillary tubes. This device would be used in the early stages of receiving new capillary tubes as
it would provide empirical evidence of differing manufacturing standards used in creating the
capillary tubes. We still suspect Minallum and National copper have different manufacturing

115
processes which result in different microscopic differences in the properties of the tubes. This
difference is what causes different mass flow rates and different pressure drops.
Figure 81: Profilometer Surface Roughness Optics
LABVIEW PROGRAMMING
While we initially planned to develop the LabVIEW program during our time working on
the project. However, it became clear that developing a new program was not vital to testing the
pressure drop across the capillary tubes as the calibrated gauge provided the same useful
measurements required to do analysis. If in the future Fredrich develop our system more and find
tolerances that the friction factors need to be withing for each specific capillary tube, then we
would recommend developing the LabVIEW program we outlined in Section 5.5.

116
CONSTRICTING CAPILLARY TUBE
One aspect of the design we did not have enough time to fully investigate was the coiled
capillary tube at the outlet of the pressure drop component. When the coiled tube was connected
it reduced the mass flow rate of the system which makes sense as it equivalent to testing two
tubes at once. This again relates to how the equipment was limiting factor, but we would
recommend further development on this component. We recommend testing different diameters
and lengths of coiled outlet tube with different inner diameter test capillary tubes. From what we
found through our time testing capillary tubes having an outlet tube that had a larger inner
diameter than that of the tube being testing. Something we did not investigate was reducing the
length of the tube, but we would recommend this being the first place to start when trying to
create a backpressure without effecting the mass flow rate.
MASS FLOW METER
The final recommendation we have is to investigate adding another mass flow meter after
the capillary tube. Measuring the mass flow at the inlet and outlet may prove useful. While we
are not confident this would help show differences in the capillary tube it could be a possible
course of action in the future if the other recommendations we have provided don’t resolve the
issue of the testing device falsely passing tubes that will eventually fail in AC units.

117
15. REFERENCES
[1] Method of testing flow capacity of refrigerant capillary tubes (ASHRAE Standard 28).
(1996). Atlanta, GA: The Society.
[2] Munson, B. R., Young, D. F., & Okiishi, T. H. (2016). Munson, Young, and Okiishi's
fundamentals of fluid mechanics (8th ed.). Hoboken, NJ: Wiley.
[3] Rocha, T. T., Paula, C. H., Cangussu, V. M., Maia, A. A., & Oliveira, R. N. (2020). Effect of
surface roughness on the mass flow rate predictions for adiabatic capillary tubes.
International Journal of Refrigeration, 118, 269-278. doi:10.1016/j.ijrefrig.2020.05.020
[4] 4.4 Capillary tubes. (n.d.). Retrieved August 30, 2020, from
https://www.swepusa.com/refrigerant-handbook/4.-expansion-valves/adf4/
[5] Kargarpour, M., & Dandekar, A. (2015, December 10). Analysis of asphaltene deposition in
Marrat oil well string: A new approach. Retrieved November 05, 2020, from
https://link.springer.com/article/10.1007/s13202-015-0221-7/figures/5
Schematic absolute roughness of pipe
[6] A. (2019, April 30). Nitrogen safety data sheet. Retrieved September 10, 2020, from
https://www.airgas.com/msds/001040.pdf
[7] Stress in Thick-Walled Cylinders - or Tubes. (n.d.). Retrieved October 20, 2020, from
https://www.engineeringtoolbox.com/stress-thick-walled-tube-d_949.html
[8] Remer Products. (n.d.). (Remerproducts) Retrieved from
https://ramerproducts.com/products/40-series

118
16. SMC CAPSTONE REFLECTIONS
Jack Nunnington Reflection
The past four years at St Mary’s University have been the most defining years of my life.
The people, experiences, knowledge, wisdom, and self-understanding that St Mary's University
has bestowed me with will forever be the foundations of the rest of my personal and professional
life. I have learned to be resourceful, responsible, independent, and imaginative.
Part of how St Mary’s has shaped me into the person I am today is through the core
classes. These classes have provided me with experiences from a wide variety of disciplines
enabling me to become a well-rounded person. In the course SMC Others, I began to learn about
my responsibility to the common good. In Civic Engagement, I learned about the importance of
giving back to your community. In Literature, I gained an invaluable understanding of the
immense struggle of minorities across the world. However, my most defining class was Ethics.
My Ethics course with a focus on engineering made me truly aware of the social responsibility I
will soon have as a professional engineer, as well as an understanding to uphold my personal and
professional ethical obligations. It is rare in most universities for engineers to take the classes
that I have mentioned and yet the lessons I learned in them are extremely essential for the rest of
my career. Shortly, I will be working in the real world, and be in situations where what I do will
affect people’s lives. I am grateful for these courses as they helped define my moral obligations
in my career and as a human being in this world. I could not be any more appreciative of every
single moment I have had at St Mary’s and I can't wait to apply what I’ve learned into making
the world a better, safer place for all.

119
Justin Dylla Reflection
My experience at St. Mary’s University has been rather interesting to say the least. From
Hurricane Harvey to the snow days in February; from my appendicitis sophomore year to the
pandemic of the Coronavirus. Those were just some of the things I had to go through as a student
developing his skills to go into the professional world. And what ways to hone those skills that I
need by taking the St. Mary’s Core (SMC) classes. These classes helped me gain an
understanding to topics that were outside my specific major of mechanical engineering.
Now at the time of taking some of these classes I honestly did not see a point to taking
them. However, looking back and reflecting on my time at St. Mary’s I found that many of the
classes were invaluable in giving me skills I needed as I move away to my career. There are
several classes that really interested me over the years. One of those classes had to be SMC
Self with Professor Brei. This class made us think very philosophically about the things we did
and how they affected us. Another class that was most fascinating was SMC Fine Arts: Music
with Professor Rankin. Even though my major has nothing to do with music this class made me
appreciate how older music has played a role in the history of Europe and America. Finally, the
best class that was the most beneficial of the SMCs was SMC Ethics with Professor Brei and
Ocampo. This class gave us different situations that allowed us to figure out what was ethically
wrong with the specific situations. Going into the Mechanical Engineering field will yield similar
situations to the ones we saw in this class. This talked about moral dilemmas that engineers had
to face in their everyday lives, and it made me more aware to think about the things that
engineers design can potentially have an impact on the whole world.
So, reflecting on my past years at St. Mary’s, I can safely say that the SMC core classes
have helped me tremendously on my path to become a professional.

120
Hannah Wilson Reflection
I chose St. Mary’s University because of their academic and athletic programs. I have
grown to love St. Mary’s and appreciate all the experiences, relationships, and knowledge that I
have been given through this school. I heard about St. Mary’s core classes during orientation and
did not see how they would apply to my already challenging major.
However, once I began taking core classes, they became a large part of my education and
gave me lessons that I could immediately apply to my life. Engineering courses are challenging
and interesting and the technical knowledge that I have learned will help me in my future career.
St. Mary’s core classes provide lessons that I can apply to my life on a personal and professional
level. They have helped me to become more understanding and open to other people's beliefs,
opinions, and ideas. SMC Ethics had a large focus on the engineering code of conduct which
encouraged invaluable conversation about how to deal with unethical or confusing circumstances
in the professional environment. This was the class that showed me how my future career will
directly impact people and how to take advantage of that by putting people first. SMC Civic
Engagement gave me an opportunity to perform community outreach with my peers and SMC
Fine Arts gave me the chance to pursue one of my favourite hobbies of drawing that I would not
have gotten to do in any other engineering program. The engineering program has given me the
knowledge to be successful in my career which I am grateful for, but SMC core classes have
given me knowledge and experiences that helped me to grow into the person I am and will help
me in my professional and personal life decisions.

121
Ryan Dixon Reflection
When I first applied to St. Mary’s, I was looking for a good engineering school, as well
as a good golf program. In did not know how hard this would be, to dedicate time to both a
rigorous course load and the golf team. During my first couple of semesters, I found the time
management aspect to be a struggle, and I was not sure whether I was going to be able to do
both. I am so pleased that I worked hard and got the work done, as these last four years have
been so rewarding.
Part of my personal development has come through education in the St. Mary’s core
classes. They have taught me to become a more rounded person, developing my knowledge and
understanding of topics that I would not have learned about, had it not been for these classes. I
developed an understanding of music and the history of the development of music over time in
my SMC music class. Most of these classes are not directly related to engineering, however my
ethics class covered ethical and moral issues that I will encounter in my future career, something
that I think is very important to have, especially in engineering.
I believe that most of my development and growth as a person, is due to the knowledge
and experience I have gained through the SMC core classes, I will continue to apply what I have
learned in these classes to help me progress in my career as an engineer.

122
17. APPENDICES
TABULATED DATA RESULTS FROM TEST #3: DIFFERENT
SUPPLIERS’ COMPARISON
Results: PN 1389915
Results: PN 3760518
PART NUMBER LENGTH (IN) ID (IN)MASS FLOW
NOM (CFM)
MASS FLOW
RECORDED (CFM)
INLET
PRESSURE
(PSIG)
CALI GAUGE
PRESSURE
(PSIG)
PRESSURE
DROP
(PSIG)
SPECIMEN NOTE OUTLET
TUBEOUTLET TUBE NOTE
1389915 20 0.058 0.69 0.514 30.17 23.93 6.24 SM1- NATIONAL COPPER COILED 03760518 WIDE COIL
1389915 20 0.058 0.69 0.646 39.99 32.34 7.65 SM1- NATIONAL COPPER COILED 03760518 WIDE COIL
1389915 20 0.058 0.69 0.769 50.04 41.02 9.02 SM1- NATIONAL COPPER COILED 03760518 WIDE COIL
1389915 20 0.058 0.69 0.905 59.945 49.66 10.285 SM1- NATIONAL COPPER COILED 03760518 WIDE COIL
1389915 20 0.058 0.69 0.514 30.08 23.83 6.25 SM2- NATIONAL COPPER COILED 03760518 WIDE COIL
1389915 20 0.058 0.69 0.647 39.97 32.26 7.71 SM2- NATIONAL COPPER COILED 03760518 WIDE COIL
1389915 20 0.058 0.69 0.774 49.983 41.14 8.843 SM2- NATIONAL COPPER COILED 03760518 WIDE COIL
1389915 20 0.058 0.69 0.519 30.056 24.1 5.956 SM3- MINALLUM COILED 03760518 WIDE COIL
1389915 20 0.058 0.69 0.652 39.89 32.54 7.35 SM3- MINALLUM COILED 03760518 WIDE COIL
1389915 20 0.058 0.69 0.777 50.03 41.34 8.69 SM3- MINALLUM COILED 03760518 WIDE COIL
1389915 20 0.058 0.69 0.514 30.005 23.8 6.205 SM4- MINALLUM COILED 03760518 WIDE COIL
1389915 20 0.058 0.69 0.648 39.975 32.27 7.705 SM4- MINALLUM COILED 03760518 WIDE COIL
1389915 20 0.058 0.69 0.77 50.045 40.91 9.135 SM4- MINALLUM COILED 03760518 WIDE COIL
PART NUMBER LENGTH (IN) ID (IN)MASS FLOW
NOM (CFM)
MASS FLOW
RECORDED (CFM)
INLET
PRESSURE
(PSIG)
CALI GAUGE
PRESSURE
(PSIG)
PRESSURE
DROP
(PSIG)
SPECIMEN NOTE OUTLET
TUBEOUTLET TUBE NOTE
3760518 29 0.054 0.461 0.4422 30.01 19.34 10.67 SM1- NATIONAL COPPER COILED 03760518 WIDE COIL
3760518 29 0.054 0.461 0.558 40.073 26.64 13.433 SM1- NATIONAL COPPER COILED 03760518 WIDE COIL
3760518 29 0.054 0.461 0.673 49.986 33.94 16.046 SM1- NATIONAL COPPER COILED 03760518 WIDE COIL
3760518 29 0.054 0.461 0.777 60.054 41.44 18.614 SM1- NATIONAL COPPER COILED 03760518 WIDE COIL
3760518 29 0.054 0.461 0.441 30.03 19.34 10.69 SM2- NATIONAL COPPER COILED 03760518 WIDE COIL
3760518 29 0.054 0.461 0.555 39.934 26.52 13.414 SM2- NATIONAL COPPER COILED 03760518 WIDE COIL
3760518 29 0.054 0.461 0.672 50.066 33.93 16.136 SM2- NATIONAL COPPER COILED 03760518 WIDE COIL
3760518 29 0.054 0.461 0.442 30.014 19.35 10.664 SM3- MINALLUM COILED 03760518 WIDE COIL
3760518 29 0.054 0.461 0.556 39.976 26.57 13.406 SM3- MINALLUM COILED 03760518 WIDE COIL
3760518 29 0.054 0.461 0.671 49.83 33.93 15.9 SM3- MINALLUM COILED 03760518 WIDE COIL
3760518 29 0.054 0.461 0.775 60.001 41.37 18.631 SM3- MINALLUM COILED 03760518 WIDE COIL
3760518 29 0.054 0.461 0.442 30.032 19.37 10.662 SM4- MINALLUM COILED 03760518 WIDE COIL
3760518 29 0.054 0.461 0.558 40.167 26.72 13.447 SM4- MINALLUM COILED 03760518 WIDE COIL
3760518 29 0.054 0.461 0.673 50.076 34.02 16.056 SM4- MINALLUM COILED 03760518 WIDE COIL

123
Results: PN 3760553
Results: PN 3760482
PART NUMBER LENGTH (IN) ID (IN)MASS FLOW
NOM (CFM)
MASS FLOW
RECORDED (CFM)
INLET
PRESSURE
(PSIG)
CALI GAUGE
PRESSURE
(PSIG)
PRESSURE
DROP
(PSIG)
SPECIMEN NOTE OUTLET
TUBEOUTLET TUBE NOTE
3760553 25 0.042 0.545 0.403 39.994 16.84 23.154 SM1- NATIONAL COPPER COILED 03760518 WIDE COIL
3760553 25 0.042 0.545 0.483 50.034 21.88 28.154 SM1- NATIONAL COPPER COILED 03760518 WIDE COIL
3760553 25 0.042 0.545 0.546 60.073 26.99 33.083 SM1- NATIONAL COPPER COILED 03760518 WIDE COIL
3760553 25 0.042 0.545 0.647 70.227 32.24 37.987 SM1- NATIONAL COPPER COILED 03760518 WIDE COIL
3760553 25 0.042 0.545 0.396 39.961 16.39 23.571 SM2- NATIONAL COPPER COILED 03760518 WIDE COIL
3760553 25 0.042 0.545 0.473 49.962 21.31 28.652 SM2- NATIONAL COPPER COILED 03760518 WIDE COIL
3760553 25 0.042 0.545 0.552 59.965 26.31 33.655 SM2- NATIONAL COPPER COILED 03760518 WIDE COIL
3760553 25 0.042 0.545 0.409 40.092 17.27 22.822 SM3- MINALLUM COILED 03760518 WIDE COIL
3760553 25 0.042 0.545 0.49 50.065 22.36 27.705 SM3- MINALLUM COILED 03760518 WIDE COIL
3760553 25 0.042 0.545 0.572 60.098 27.54 32.558 SM3- MINALLUM COILED 03760518 WIDE COIL
3760553 25 0.042 0.545 0.654 70.011 32.75 37.261 SM3- MINALLUM COILED 03760518 WIDE COIL
3760553 25 0.042 0.545 0.411 39.941 17.37 22.571 SM4- MINALLUM COILED 03760518 WIDE COIL
3760553 25 0.042 0.545 0.493 50.025 22.57 27.455 SM4- MINALLUM COILED 03760518 WIDE COIL
3760553 25 0.042 0.545 0.576 60.001 27.8 32.201 SM4- MINALLUM COILED 03760518 WIDE COIL
PART NUMBER LENGTH (IN) ID (IN)MASS FLOW
NOM (CFM)
MASS FLOW
RECORDED (CFM)
INLET
PRESSURE
(PSIG)
CALI GAUGE
PRESSURE
(PSIG)
PRESSURE
DROP
(PSIG)
SPECIMEN NOTE OUTLET
TUBEOUTLET TUBE NOTE
3760482 25 0.049 0.382 0.52 40.591 24.16 16.431 SM1- NATIONAL COPPER COILED 03760518 WIDE COIL
3760482 25 0.049 0.382 0.621 50.092 30.555 19.537 SM1- NATIONAL COPPER COILED 03760518 WIDE COIL
3760482 25 0.049 0.382 0.728 60.3 37.34 22.96 SM1- NATIONAL COPPER COILED 03760518 WIDE COIL
3760482 25 0.049 0.382 0.828 70.147 44.31 25.837 SM1- NATIONAL COPPER COILED 03760518 WIDE COIL
3760482 25 0.049 0.382 0.614 50.001 29.985 20.016 SM2- NATIONAL COPPER COILED 03760518 WIDE COIL
3760482 25 0.049 0.382 0.718 59.842 36.59 23.252 SM2- NATIONAL COPPER COILED 03760518 WIDE COIL
3760482 25 0.049 0.382 0.816 70.11 43.55 26.56 SM2- NATIONAL COPPER COILED 03760518 WIDE COIL
3760482 25 0.049 0.382 0.511 40.047 23.55 16.497 SM3- MINALLUM COILED 03760518 WIDE COIL
3760482 25 0.049 0.382 0.617 49.99 30.18 19.81 SM3- MINALLUM COILED 03760518 WIDE COIL
3760482 25 0.049 0.382 0.724 60.005 36.995 23.01 SM3- MINALLUM COILED 03760518 WIDE COIL
3760482 25 0.049 0.382 0.824 70.175 43.885 26.29 SM3- MINALLUM COILED 03760518 WIDE COIL
3760482 25 0.049 0.382 0.619 50.263 30.25 20.013 SM4- MINALLUM COILED 03760518 WIDE COIL
3760482 25 0.049 0.382 0.723 60.158 36.92 23.238 SM4- MINALLUM COILED 03760518 WIDE COIL
3760482 25 0.049 0.382 0.819 70.102 43.665 26.437 SM4- MINALLUM COILED 03760518 WIDE COIL

124
Results: PN 3760451
PART NUMBER LENGTH (IN) ID (IN)MASS FLOW
NOM (CFM)
MASS FLOW
RECORDED (CFM)
INLET
PRESSURE
(PSIG)
CALI GAUGE
PRESSURE
(PSIG)
PRESSURE
DROP
(PSIG)
SPECIMEN NOTE OUTLET
TUBEOUTLET TUBE NOTE
3760451 19.5 0.049 0.43 0.546 40.346 25.765 14.581 SM1- NATIONAL COPPER COILED 03760518 WIDE COIL
3760451 19.5 0.049 0.43 0.661 50.255 32.995 17.26 SM1- NATIONAL COPPER COILED 03760518 WIDE COIL
3760451 19.5 0.049 0.43 0.761 60.069 40.255 19.814 SM1- NATIONAL COPPER COILED 03760518 WIDE COIL
3760451 19.5 0.049 0.43 0.884 70.23 47.89 22.34 SM1- NATIONAL COPPER COILED 03760518 WIDE COIL
3760451 19.5 0.049 0.43 0.658 50.151 32.855 17.296 SM2- NATIONAL COPPER COILED 03760518 WIDE COIL
3760451 19.5 0.049 0.43 0.763 60.313 40.38 19.933 SM2- NATIONAL COPPER COILED 03760518 WIDE COIL
3760451 19.5 0.049 0.43 0.882 70.183 47.79 22.393 SM2- NATIONAL COPPER COILED 03760518 WIDE COIL
3760451 19.5 0.049 0.43 0.549 39.842 26.005 13.837 SM3- MINALLUM COILED 03760518 WIDE COIL
3760451 19.5 0.049 0.43 0.666 50.157 33.385 16.772 SM3- MINALLUM COILED 03760518 WIDE COIL
3760451 19.5 0.049 0.43 0.766 60.076 40.55 19.526 SM3- MINALLUM COILED 03760518 WIDE COIL
3760451 19.5 0.049 0.43 0.8825 70.056 47.815 22.241 SM3- MINALLUM COILED 03760518 WIDE COIL
3760451 19.5 0.049 0.43 0.668 50.35 33.525 16.825 SM4- MINALLUM COILED 03760518 WIDE COIL
3760451 19.5 0.049 0.43 0.767 60.197 40.63 19.567 SM4- MINALLUM COILED 03760518 WIDE COIL
3760451 19.5 0.049 0.43 0.885 70.323 48.005 22.318 SM4- MINALLUM COILED 03760518 WIDE COIL

125
TABULATED DATA RESULTS FROM TEST #4: LARGE SCALE
TEST ON PN: 03760518
PART NUMBER LENGTH (IN) ID (IN)MASS FLOW
NOM (CFM)
MASS FLOW
RECORDED
(CFM)
INLET PRESSURE
(PSIG)
CALI GAUGE
PRESSURE (PSIG)
PRESSURE
DROP
(PSIG)
SPECIMEN NOTE
3760518 29 0.054 0.461 1.006 80.234 56.58 23.654 SM1- NATIONAL COPPER
3760518 29 0.054 0.461 1.004 80.143 56.42 23.723 SM2- NATIONAL COPPER
3760518 29 0.054 0.461 1.004 80.121 56.45 23.671 SM3- NATIONAL COPPER
3760518 29 0.054 0.461 1.0005 80.067 56.24 23.827 SM4- NATIONAL COPPER
3760518 29 0.054 0.461 1.002 80.121 56.32 23.801 SM5- NATIONAL COPPER
3760518 29 0.054 0.461 1.005 80.11 56.54 23.57 SM6- NATIONAL COPPER
3760518 29 0.054 0.461 1.007 80.11 56.665 23.445 SM7- NATIONAL COPPER
3760518 29 0.054 0.461 1.004 80.129 56.459 23.670 AVERAGES
3760518 29 0.054 0.461 1.002 80.11 56.33 23.78 SM1- MINALLUM
3760518 29 0.054 0.461 1.003 80.112 56.43 23.682 SM2- MINALLUM
3760518 29 0.054 0.461 1.004 80.112 56.405 23.707 SM3- MINALLUM
3760518 29 0.054 0.461 1.005 80.112 56.385 23.727 SM4- MINALLUM
3760518 29 0.054 0.461 1.001 80.165 56.325 23.84 SM5- MINALLUM
3760518 29 0.054 0.461 1.002 80.0975 56.34 23.7575 SM6- MINALLUM
3760518 29 0.054 0.461 0.998 80.0975 56.07 24.0275 SM7- MINALLUM
3760518 29 0.054 0.461 1.003 80.095 56.36 23.735 SM8- MINALLUM
3760518 29 0.054 0.461 1.004 80.098 56.5 23.598 SM9- MINALLUM
3760518 29 0.054 0.461 0.998 80.095 56.1 23.995 SM10- MINALLUM
3760518 29 0.054 0.461 1.002 80.115 56.285 23.83 SM11- MINALLUM
3760518 29 0.054 0.461 0.998 80.113 55.99 24.123 SM12- MINALLUM
3760518 29 0.054 0.461 1.0007 80.102 56.235 23.867 AVERAGES
LARGE SCALE TEST ON PN:3760518

126
TABULATED DATA RESULTS FROM TEST #4: LARGE SCALE
TEST ON PN: 03760553
PART NUMBERLENGTH
(IN)ID (IN)
MASS FLOW
NOM (CFM)
MASS FLOW
RECORDED
(CFM)
INLET
PRESSURE
(PSIG)
CALI GAUGE
PRESSURE
(PSIG)
PRESSURE
DROP
(PSIG)
SPECIMEN NOTE
037605-53 25 0.042 0.545 0.819 89.953 43.61 46.343 NC1 - NATIONAL COPPER
037605-53 25 0.042 0.545 0.807 89.941 42.89 47.051 NC2 - NATIONAL COPPER
037605-53 25 0.042 0.545 0.786 89.944 41.63 48.314 NC3 - NATIONAL COPPER
037605-53 25 0.042 0.545 0.814 89.932 43.23 46.702 NC4 - NATIONAL COPPER
037605-53 25 0.042 0.545 0.81 89.935 43.04 46.895 NC5 - NATIONAL COPPER
037605-53 25 0.042 0.545 0.814 89.932 43.3 46.632 NC6 - NATIONAL COPPER
037605-53 25 0.042 0.545 0.815 89.932 43.31 46.622 NC7 - NATIONAL COPPER
037605-53 25 0.042 0.545 0.811 89.932 43.04 46.892 NC8 - NATIONAL COPPER
037605-53 25 0.042 0.545 0.805 89.936 42.75 47.186 NC9 - NATIONAL COPPER
037605-53 25 0.042 0.545 0.7995 89.932 42.35 47.582 NC10 - NATIONAL COPPER
Average 25 0.042 0.545 0.809 89.937 42.915 47.022 NATIONAL COPPER
037605-53 25 0.042 0.545 0.807 89.939 42.825 47.114 M1- MINALLUM
037605-53 25 0.042 0.545 0.815 89.932 43.28 46.652 M2- MINALLUM
037605-53 25 0.042 0.545 0.819 89.932 43.53 46.402 M3- MINALLUM
037605-53 25 0.042 0.545 0.808 89.938 42.955 46.983 M4- MINALLUM
037605-53 25 0.042 0.545 0.823 89.932 43.77 46.162 M5- MINALLUM
037605-53 25 0.042 0.545 0.819 89.932 43.6 46.332 M6- MINALLUM
037605-53 25 0.042 0.545 0.811 89.932 43.05 46.882 M7- MINALLUM
037605-53 25 0.042 0.545 0.817 89.9385 43.37 46.5685 M8- MINALLUM
037605-53 25 0.042 0.545 0.805 89.937 42.695 47.242 M9- MINALLUM
037605-53 25 0.042 0.545 0.811 89.936 43.01 46.926 M10- MINALLUM
Average 25 0.042 0.545 0.8126 89.935 43.145 46.790 MINALLUM
LARGE SCALE TEST ON PN: 03760553


![A Gas-filled Capillary Based Plasma Source for Wakefield ...Figure 3: Preliminary design of the housing for the capillary tube. was carried out in Autodesk CFD Flex [4]. This was 2D,](https://static.fdocuments.us/doc/165x107/607cee8e25ea26666e22b035/a-gas-filled-capillary-based-plasma-source-for-wakefield-figure-3-preliminary.jpg)