Capillary electrophoresis for monitoring carboxylic, in ... · PDF fileG H L I G H T S...
146
• V I S I O N S • S C I E N C E • T E C H N O L O G Y • R E S E A R C H H I G H L I G H T S Dissertation 47 Capillary electrophoresis for monitoring carboxylic, phenolic and amino acids in bioprocesses Heidi Turkia
Transcript of Capillary electrophoresis for monitoring carboxylic, in ... · PDF fileG H L I G H T S...

•VIS
ION
S•SCIENCE•TEC
HN
OL
OG
Y•RESEARCHHIGHLI
GH
TS
Dissertation
47
Capillary electrophoresis for monitoring carboxylic, phenolic and amino acids in bioprocessesHeidi Turkia


VTT SCIENCE 47
Capillary electrophoresisfor monitoring carboxylic,phenolic and amino acidsin bioprocesses
Heidi TurkiaVTT Technical Research Centre of Finland
Lappeenranta University of Technology, Faculty of Technology,Department of Chemistry, Process and Environmental Analytics
Thesis for the degree of Doctor of Philosophy to be presented with duepermission for public examination and criticism in Auditorium 1381, atthe Lappeenranta University of Technology, on the 24.1.2014 at 10:00.

ISBN 978-951-38-8107-8 (Soft back ed.)ISBN 978-951-38-8108-5 (URL: http://www.vtt.fi/publications/index.jsp)
VTT Science 47
ISSN-L 2242-119XISSN 2242-119X (Print)ISSN 2242-1203 (Online)
Copyright © VTT 2013
JULKAISIJA – UTGIVARE – PUBLISHER
VTTPL 1000 (Tekniikantie 4 A, Espoo)02044 VTTPuh. 020 722 111, faksi 020 722 7001
VTTPB 1000 (Teknikvägen 4 A, Esbo)FI-02044 VTTTfn. +358 20 722 111, telefax +358 20 722 7001
VTT Technical Research Centre of FinlandP.O. Box 1000 (Tekniikantie 4 A, Espoo)FI-02044 VTT, FinlandTel. +358 20 722 111, fax +358 20 722 7001
Kopijyvä Oy, Kuopio 2013

3
Capillary electrophoresis for monitoring of carboxylic, phenolic andamino acids in bioprocesses
Kapillaarielektrofeesin käyttö karboksyyli-, fenoli- ja aminohappojen monitorointiinbioprosesseissa. Heidi Turkia. Espoo 2013. VTT Science 47. 103 p. + app. 36 p.
AbstractBioprocess technology is a multidisciplinary industry that combines knowledge ofbiology and chemistry with process engineering. It is a growing industry becauseits applications have an important role in the food, pharmaceutical, diagnosticsand chemical industries. In addition, the current pressure to decrease our depend-ence on fossil fuels motivates new, innovative research in the replacement ofpetrochemical products. Bioprocesses are processes that utilize cells and/or theircomponents in the production of desired products. Bioprocesses are already usedto produce fuels and chemicals, especially ethanol and building-block chemicalssuch as carboxylic acids. In order to enable more efficient, sustainable and eco-nomically feasible bioprocesses, the raw materials must be cheap and the biopro-cesses must be operated at optimal conditions. It is essential to measure differentparameters that provide information about the process conditions and the maincritical process parameters including cell density, substrate concentrations andproducts. In addition to offline analysis methods, online monitoring tools are be-coming increasingly important in the optimization of bioprocesses.
Capillary electrophoresis (CE) is a versatile analysis technique with no limita-tions concerning polar solvents, analytes or samples. Its resolution and efficiencyare high in optimized methods creating a great potential for rapid detection andquantification. This work demonstrates the potential and possibilities of CE as aversatile bioprocess monitoring tool. As a part of this study a commercial CE de-vice was modified for use as an online analysis tool for automated monitoring. Thework describes three offline CE analysis methods for the determination of carbox-ylic, phenolic and amino acids that are present in bioprocesses, and an online CEanalysis method for the monitoring of carboxylic acid production during biopro-cesses. The detection methods were indirect and direct UV, and laser-inducedfrescence. The results of this work can be used for the optimization of bioprocessconditions, for the development of more robust and tolerant microorganisms, andto study the dynamics of bioprocesses.
Keywords bioprocess monitoring, capillary electrophoresis, online capillary electro-phoresis, carboxylic acids, phenolic acids, amino acids

4
Kapillaarielektroforeesin käyttö karboksyyli-, fenoli- jabioprosesseissa
Capillary electrophoresis for monitoring of carboxylic, phenolic and amino acids in bioprocesses.Heidi Turkia. Espoo 2013. VTT Science 47. 103 s. + liitt. 36 s.
TiivistelmäBioprosessitekniikka on monitieteellinen teollisuudenala, joka yhdistää biologian jakemian tietämyksen kemiantekniikkaan. Se on kasvava teollisuudenala, koska sensovellukset ovat hyvin tärkeitä ruoka-, farmasia-, diagnostiikka- ja kemianteolli-suudelle. Tämän lisäksi riippuvuutta öljystä tulee vähentää merkittävästi, mikämahdollistaa uuden ja innovatiivisen tutkimuksen petrokemikaalituotteiden kor-vaamiseksi. Bioprosessit ovat prosesseja, jotka käyttävät soluja ja/tai niiden osiatuottamaan haluttuja tuotteita. Bioprosesseja on jo käytetty polttoaineiden ja kemi-kaalien tuottamiseen, erityisesti etanolin ja ns. building-block kemikaalien, kutenkarboksyylihappojen, tuottamiseen. Jotta bioprosesseista saadaan tehokkaampiaja taloudellisesti kannattavampia, raaka-aineiden on oltava halpoja ja bioprosessienon toimittava optimaalisissa olosuhteissa. Erilaisten parametrien mittaaminen onvälttämätöntä, sillä ne antavat tietoja prosessin tilasta ja kriittisistä prosessipara-metreista, joita ovat biomassa, lähtöaineet ja tuotteet. Offline-mittausten lisäksionline-määritykset kasvattavat merkitystään bioprosessien optimoinnissa.
Kapillaarielektroforeesi (CE) on monipuolinen analyysitekniikka, jolla ei ole ra-joituksia polaaristen liuottimien, analyyttien tai näytteiden kanssa. Optimoitujenmenetelmien korkea resoluutio ja tehokkuus mahdollistavat nopean detektoinnin jakvantifioinnin. Tämä työ osoittaa CE:n potentiaalin monipuolisena bioprosessi-monitorointityökaluna. Osana tätä tutkimusta kaupallinen CE-laitteisto muutettiintoimimaan online-analysointilaitteistona prosessien automaattista monitorointiavarten. Tämä työ kuvaa kolme offline-CE analyysimenetelmää karboksyyli-, fenoli-ja aminohappojen analysointiin sekä yhden online-CE analyysimenetelmän kar-boksyylihappojen monitorointiin bioprosessien aikana. Käytetyt detektointimene-telmät olivat epäsuora ja suora UV sekä laser-indusoitu fluoresenssi. Työn tuloksiavoidaan käyttää bioprosessiolosuhteiden optimoinnissa, elinvoimaisempien jakestävämpien mikro-organismien kehittämisessä sekä bioprosessien dynamiikantutkimisessa.
Avainsanat bioprocess monitoring, capillary electrophoresis, online capillary electro-phoresis, carboxylic acids, phenolic acids, amino acids

5
PrefaceThis work was carried out at VTT Technical Research Centre of Finland during theperiod 2008–2013. Financial support from the Finnish Centre of Excellence inWhite Biotechnology – Green Chemistry Research granted by the Academy ofFinland (grant number 118573), the EU-project Nanobe which received fundingfrom the European Community’s Seventh Framework Programme (FP7/2007–2013) under grant agreement no. 227243, Laboratory of Chemistry at theLappeenranta University of Technology and Graduate School for ChemicalSensors and Microanalytical Systems (CHEMSEM) is gratefully acknowledged.
I express my deepest gratitude to my supervisors Professor Heli Sirén and Dr.Sci. (tech.) Juha-Pekka Pitkänen. Your help, support and encouragement duringthe work was invaluable. The fruitful conversations and brainstorming were ofgreat importance for the success of this study. In addition, your knowledge andenthusiasm has been inspirational for me. Vice President of Bio and ProcessTechnology Dr. Anu Kaukovirta-Norja, Technology manager Dr. Kirsi-Marja Oks-man-Caldentey, her predecessor Dr. Tiina Nakari-Setälä, and team leader Dr.Jaana Uusitalo are acknowledged for providing excellent working facilities andresearch equipment.
I thank Professor Mihkel Kaljurand and Professor Krist V. Gernaey for their ex-cellent review of the thesis. Kathleen Ahonen and Michael Bailey are thanked forthe language revision of the articles, and Michael Bailey for the language revisionof the thesis. Your work upgraded the scientific value of my writings.
I thank my co-authors Sami Holmström, Toni Paasikallio, Merja Penttilä, Juha-Pekka Pitkänen, Heli Sirén and Marilyn Wiebe for your contribution. Working withyou has been a privilege. All the supervisors and students at the CHEMSEMgraduate school are thanked for the interesting and fruitful annual meetings andcourses.
I would also like to thank all of my colleagues, especially Sami, Toni, Jouni, Su-sanne, Dorothee and everyone else in my team. Working with you has been apleasure and I sure do hope to work with you in the future. I have had so manyinteresting conversations with the people in the morning coffee table of all imagi-nable subjects, thank you for making starts of mornings so much fun.

6
Finally I would like to thank my friends and family for their love and support.Especially my husband Ville is acknowledged for his never ending support andunderstanding. I love you so much.
Espoo, December 2013
Heidi

7
Academic dissertationSupervisors Professor Heli Sirén
Department of ChemistryFaculty of TechnologyLappeenranta University of TechnologyLappeenranta, Finland
D.Sc. (tech.), Principal Scientist Juha-Pekka PitkänenVTT Technical Research Centre of FinlandEspoo, Finland
Reviewers Professor Mihkel KaljurandDepartment of ChemistryTallinn University of TechnologyTallinn, Estonia
Professor Krist V. GernaeyDepartment of Chemical and Biochemical EngineeringTechnical University of DenmarkLyngby, Denmark
Opponent Professor Mihkel KaljurandDepartment of ChemistryTallinn University of TechnologyTallinn, Estonia
Custos Professor Heli Sirén

8
List of publicationsThis thesis is based on the following original publications which are referred to inthe text as I–IV. The publications are reproduced with kind permission from thepublishers.
I Turkia, H., Sirén, H., Pitkänen, J.-P., Wiebe, M., Penttilä, M., 2010.Capillary electrophoresis for the monitoring of carboxylic acid production byGluconobacter oxydans. Journal of Chromatography A 1217, 1537–1542.
II Turkia, H., Sirén, H., Penttilä, M., Pitkänen, J.-P., 2013. Capillaryelectrophoresis for the monitoring of phenolic compounds in bioprocesses.Journal of Chromatography A 1278, 175–180.
III Turkia, H., Holmström, S., Paasikallio, T., Sirén, H., Penttilä, M., Pitkänen, J.-P.,2013. Online capillary electrophoresis for monitoring carboxylic acidproduction by yeast during bioreactor cultivations. Analytical Chemistry 85,9705–9712.
IV Turkia H., Sirén, H., Penttilä, M., Pitkänen, J.-P., 2013. Capillaryelectrophoresis with laser-induced fluorescence detection for studyingamino acid uptake of yeast during beer fermentation. Submitted to Journalof Chromatography B.

9
Author’s contributionsI The author carried out the method development and wrote the article
together with the co-authors.
II The author invented the original idea, carried out the methoddevelopment and wrote the article together with the co-authors.
III The author invented the original idea, assisted in the design andassembly of the online CE system, carried out the method developmentand wrote the article together with the co-authors.
IV The author invented the original idea, carried out the methoddevelopment and wrote the article together with the co-authors.

10
ContentsAbstract ........................................................................................................... 3
Tiivistelmä ....................................................................................................... 4
Preface ............................................................................................................. 5
Academic dissertation ..................................................................................... 7
List of publications .......................................................................................... 8
Author’s contributions .................................................................................... 9
Abbreviations ................................................................................................ 12
List of symbols .............................................................................................. 14
1. Introduction ............................................................................................. 151.1 Overview of bioprocesses ................................................................. 15
1.1.1 Cultivation modes .................................................................. 181.1.2 Microorganisms in bioprocesses............................................. 191.1.3 Carboxylic acids in bioprocesses ............................................ 211.1.4 Phenolic acids in bioprocesses ............................................... 241.1.5 Amino acids in bioprocesses .................................................. 25
1.2 Bioprocess monitoring ...................................................................... 251.2.1 Chromatography and electrodriven separations ...................... 26
1.2.1.1 Carboxylic acids ............................................................ 261.2.1.2 Phenolic acids/compounds ............................................ 311.2.1.3 Amino acids .................................................................. 33
1.2.2 Online monitoring................................................................... 361.2.2.1 In situ probes ................................................................ 361.2.2.2 Separation techniques ................................................... 38
1.3 Capillary electromigration techniques ................................................ 391.3.1 Capillary zone electrophoresis ................................................ 401.3.2 Micellar electrokinetic chromatography ................................... 431.3.3 Detection methods ................................................................. 45

11
2. Aims of the study .................................................................................... 50
3. Materials and methods ............................................................................ 513.1 Chemicals and materials ................................................................... 513.2 Instruments ...................................................................................... 53
3.2.1 Capillary electrophoresis ........................................................ 533.2.2 Online analysis system .......................................................... 533.2.3 Other instrumentation ............................................................ 55
3.3 Methods ........................................................................................... 563.3.1 CZE with indirect UV detection for studying carboxylic acids ... 563.3.2 CZE with direct UV detection for studying phenolic acids......... 563.3.3 Online CE analysis of carboxylic acids .................................... 563.3.4 MEKC with LIF detection for studying amino acids .................. 573.3.5 Bioreactor cultivations ............................................................ 573.3.6 Other analysis techniques ...................................................... 58
4. Results and discussion........................................................................... 594.1 Determination of carboxylic acids by CZE with indirect UV detection .. 59
4.1.1 Method development ............................................................. 594.1.2 Analysis of cultivation samples ............................................... 61
4.2 Determination of phenolic compounds by CZE-UV ............................. 634.2.1 Method development ............................................................. 634.2.2 Analysis of cultivation samples ............................................... 65
4.3 Online analysis of carboxylic acids by CZE with indirect UV detection ...... 694.3.1 Method development ............................................................. 694.3.2 Online analysis of cultivations................................................. 73
4.4 Determination of amino acids by MEKC-LIF....................................... 774.4.1 Method development ............................................................. 774.4.2 Labeling chemistry ................................................................. 804.4.3 Analysis of beer fermentation samples ................................... 81
5. Conclusions and future prospects ......................................................... 83
References ..................................................................................................... 85
Appendices
Publications I–IV

12
Abbreviations
18C6 18-Crown-6-ether
2,3-PDC 2,3-Pyridinecarboxylic acid
AD Amperometry detector
ADP Adenosine diphosphate
ATP Adenosine triphosphate
BGE Background electrolyte
CD Conductivity detector
CE Capillary electrophoresis
CHAPSO 3-[(3-Cholamidopropyl)-dimethylammonio]-2-hydroxy-1-propanesulfonate
CMC Critical micelle concentration
CZE Capillary zone electrophoresis
ED Electrochemical detector
EOF Electroosmotic flow
FDA United States Food and Drug Administration
FID Flame ionization detector
GABA -Aminobutyric acid
GC Gas chromatography
GLYR1 Glyoxylate reductase
GMO Genetically modified organism
GRAS Generally recognized as safe
HPLC High performance liquid chromatography
IC Ion chromatography

13
ICL1 Isocitrate lyase
IR Infrared
IUPAC International Union of Pure and Applied Chemistry
LC Liquid chromatography
LIF Laser-induced fluorescence
LMW Low-molecular-weight
M3C Measurement, monitoring, modeling and control
MEKC Micellar electrokinetic chromatography
MLS2 Malate synthase
MS Mass spectrometer/spectrometry
MTAH Myristyltrimethylammonium hydroxide
NAD(H) Nicotinamide adenine dinucleotide
NADP(H) Nicotinamide adenine dinucleotide phosphate
OD Optical density
OG-SE Oregon green® 488 succinimidyl ester
PAT Process Analytical Technology
PIPES 1,4-Piperazinediethane sulfonic acid
RI Refractive index
RPLC Reversed phase liquid chromatography
SDS Sodium dodecyl sulfate
TCA Tricarboxylic acid
UPLC Ultra-performance liquid chromatography
UV/Vis Ultraviolet/visible

14
List of symbols
A Absorbance
Molar absorption coefficient
c Concentration of an analyte
E Electric field strength
Dielectric constant
Fin Flow rate into the bioreactor
Fout Flow rate from the bioreactor
I.D. Inner diameter of a capillary
l Optical path length
Viscosity of the background electrolyte solution
O.D. Outer diameter of a capillary
q Charge of a molecule
r Radius of a molecule
eo Electroosmotic mobility of a molecule
ep Electrophoretic mobility of a molecule
tot Total mobility of a molecule
v Ion velocity
V Volume
veo Electroosmotic velocity of a molecule
Zeta-potential

1. Introduction
15
1. Introduction
1.1 Overview of bioprocesses
A bioprocess can be defined as any process that uses cells or their components toproduce desired products. For centuries bioprocesses have been utilized to pro-duce bread, cheese, cultured milk products, soy sauce, vinegar, beer and wineeven before the existence of microorganisms was known. In these traditional bio-processes, natural microbial flora or a small amount of the previous fermentedmaterial were used as inoculum. Even today, good starter dough is treasured andpassed from generation to generation. These processes are carried out with amixed microbial culture, but in bioprocess industry, the use of mixed cultures israre. Such applications include manufacturing of traditional foods, beverages andalcohols, waste water treatment and biogas production. [1]
The bio-based industry is a multidisciplinary industry that combines theknowledge of biology, chemistry and chemical engineering in order to develop andoperate its processes. The applications of biotechnology have an important role inthe food, pharmaceutical, diagnostics and chemical industries. [2] Global marketsof some fine chemicals produced in bioprocesses are presented in Table 1.
Table 1. Global markets for fine chemicals produced by microorganisms. [3]
Chemical 2009 $ millions 2013 $ millionsa
Amino acids 5 410 7 821
Enzymes 3 200 4 900
Organic acids (lactic acid 20%) 2 651 4 036
Vitamins and related compounds 2 397 2 286
Antibiotics 1 800 2 600
Xanthan 443 708
Total 15 901 22 351a Estimate
The majority of chemicals are produced from petroleum. Petroleum is a non-renewable starting material, hence the petrochemical products are unsustainable,

1. Introduction
16
and the production is polluting and has an effect on climate change. There isgrowing interest in the use of renewable feedstock, such as lignocellulose andalgal biomass, for the production of chemicals. [4] Lignocellulose is biomass that isderived from plants, and it is estimated to account for about 50% of all biomass onEarth. It has a complex structure consisting of three main fractions: cellulose(~45% of dry weight), hemicellulose (~30%), and lignin (~25%). The proportions ofthe three fractions vary between different plant species. Cellulose and hemicellu-lose are polymers that are composed of glucose, and of xylose, glucose, galac-tose, mannose and arabinose, respectively. These polymers can be hydrolyzed tomonomeric sugars that can be fermented by microorganisms. Lignin is an aro-matic polymer that is a dehydration product of three monomeric alcohols: p-coumaryl alcohol, p-coniferyl alcohol and p-sinapyl alcohol. The structure of ligninvaries considerably and hence it is not known exactly, and the lignin monomerscannot be utilized by current industrial microorganisms. [5]
Figure 1. Compounds that can be derived from succinate by chemical conversion. [6]
Fuels and chemicals, especially building-block chemicals for the chemical indus-try, can be produced in bioprocesses. As an example, carboxylates are among themost important chemicals that are produced in microbial processes. Because oftheir functional groups, carboxylic acids are very important starting materials (e.g.building-block chemicals) for the chemical industry. For example succinic acid isused widely as a surfactant, detergent or antifoaming agent, as an ion chelatorand in the food industry (as an acidulant, flavoring agent or anti-microbial agent)as well as in the pharmaceutical industry (antibiotics). Some of the compoundsthat can be derived from succinic acid by chemical conversion are presented in

1. Introduction
17
Figure 1. Butanediol, tetrahydrofuran and -butyrolactone are common feedstocksfor the chemical industry, both as solvents and for fiber and polymer production.Succinate can also be polymerized directly to form biodegradable polymers. Suc-cinic acid can be produced from petroleum, but the process is too expensive to beused for the production of succinate for lower value applications. However, micro-bially produced succinate could be a solution to this problem. [6] Some companiesthat produce or plan to produce carboxylic and amino acids for commercial pur-poses in biotechnological processes are presented in Table 2.
Table 2. Companies producing bio-based building-block chemicals. [7]
Company Country Product Capacity(t/a)
Startyear
BioAmber USA Succinic acid 17 000 2013
USA Succinic acid 3 000 2009
Cargill/Novozymes USA/Denmark Acrylic acid 10
CSM/BASF the Netherlands/Germany
Succinic acid 15 000 2011
Evonik Industries Germany Methionine 580 000 2014
Germany Methylmethacrylic acid 10
Galactic Belgium Lactic acid 1 650 2000
HiSun China Lactic acid 5 500 2008
Lanxess Germany Succinic acid 20 000 2012
Myriant Technologies/DavyProcess Technology
USA/UK Succinic acid 15 000 2013
NatureWorks USA Lactic acid 155 000 2015
USA Lactic acid 155 000 2005
OPX Biotechnologies/DOW USA Acrylic acid 20 2015
Perstorp Sweden Propionic acid and 3-hydroxypropionic acid
1 000 2012
PHB Industrial Brazil S.A. Brazil Polyhydroxybutyric acid 100
Purac the Netherlands Lactic acid 100 000 2007
Roquette/DSM France/the Netherlands Succinic acid 10 000 2012
Segetis USA Levulinic acid 120 2009
Tianjin GreenBio Material Co. China Polyhydroxybutyric acid 10 000 2009
Tong-Jie-Lang China Lactic acid 100 2007
Verdezyne USA Adipic acid 40 2013
Wacker Chemie AG Germany Acetic acid 500 2010
t/a tons per year
There are indications that full transition from the petrochemical industry to bio-based chemical industry is possible but there are a variety of biological, technical,economic and ecological challenges to be met. These issues can be divided intofive major engineering and decision-making challenges: (1) novel cell factories for

1. Introduction
18
the production of building-block chemicals and a wide range of fine chemicalsmust be developed and optimized; (2) upstream and downstream processes mustbe improved, including conversion of biomass to fermentable carbon sources, andproduct separation and purification methods; (3) novel bioprocesses must beeconomically viable and competitive with the traditional approaches; (4) the eco-logical benefits of biochemical industry must be evaluated objectively; and (5)research efforts and funding should be focused in a more strategic way to enablethe research on the most promising combinations of feedstock, technologies andpotential products in both economic and ecological perspectives. [4]
In order to make the bioprocesses more feasible and profitable, methods inmeasurement, monitoring, modeling, and control (M3C) are crucial. M3C methodologiesthat are currently applied in industrial cell culture technologies include for examplechromatographic techniques for culture media optimization, and online monitoring ofbioreactor state variables (temperature, dissolved oxygen and carbon dioxide, pH,agitation, redox, conductivity and the intake of substrate and the formation of productsand by-products (chromatography, in situ probes). [8] Methods for the measurementand monitoring of bioprocesses are discussed in Section 1.2 in more detail.
1.1.1 Cultivation modes
The International Union of Pure and Applied Chemistry (IUPAC) has defined that abioreactor is “an apparatus used to carry out any kind of bioprocess; examplesinclude fermenter and enzyme reaction”. [9] Bioreactors for growing microorganismsmust be sterilizable and air tight in order to prevent contamination by externalmicrobes. [10] In Figure 2 a general description of a stirred tank bioreactor ispresented. It has a volume V and it is fed with a stream of fresh and sterilecultivation medium with a flow rate Fin. Simultaneously, liquid is removed from thebioreactor with a flow rate Fout. [11] These flow rates determine whether thecultivation is batch, fed-batch or continuous cultivation.
Figure 2. Schematic figure of a bioreactor. Fin presents flow going into thebioreactor and Fout flow from the bioreactor. Adapted from [11].

1. Introduction
19
Batch cultivation. In batch cultivation, Fin=Fout=0 and volume is constant, whichmeans that all the necessary ingredients (substrates, nutrients etc.) are added tothe bioreactor in the beginning of cultivation. After this, the process is closed untilthe cultivation is ended after a given time whereupon the mixture of substratetogether with the products is withdrawn. However, during the cultivation, gases(nitrogen, oxygen), anti-foaming agent and acid or base (pH adjustment) can beadded to the media as in all cultivation modes, and samples are taken forbioprocess monitoring. Batch cultivation is the most simple experimental setupand is easy to perform. [9–11]
Fed-batch cultivation. In fed-batch cultivation, Fin 0 and Fout=0 which meansthat the volume of the culture increases during cultivation when fresh medium isadded to the bioreactor. This cultivation mode is probably the most common modein industrial bioprocesses because it enables the control of substrateconcentration at a certain level to maximize product formation and finalconcentration. In addition, fed-batch operation is often preferred to avoid issueswith substrate inhibition. Especially in fed-batch cultivation, online monitoring of theprocess is essential for the control of liquid flow into the bioreactor (Fin). [10, 11]
Continuous cultivation. In continuous cultivation, Fin=Fout 0 and volume isconstant which means that fresh cultivation medium is added with same flow rateas cultivation medium is removed from the bioreactor. The most commonoperations of continuous bioreactor are chemostat and turbidostat. In a chemostatconcentration of rate-limiting substrate defines the cell density and dilution ratedetermines the growth rate. In a turbidostat, the inlet flow rate is adjusted to keepthe biomass concentration constant throughout the cultivation. Thus the cultivationis growth rate limited. In the chemical industry continuous processes are the mostcommon processes and they are also becoming more important in bioprocesstechnology because they improve overall reactor productivity. [10, 11]
1.1.2 Microorganisms in bioprocesses
Yeast was one of the first microorganisms to be utilized by humans. It has beenused for thousands of years to produce wine and beer through ethanolfermentation. In modern biotechnology, in addition to yeast, bacteria, molds, fungiand algae are also used as host organisms to produce desired products. Strainselection for production of desired products depends both on strain characteristicsand on the product properties and application. [12]
In any industrial technology, raw material costs are in direct correlation with thefinal cost of products. Lignocellulosic material is much cheaper than starchy rawmaterial (corn, wheat) but in addition to hexose sugars the microorganism mustalso be able to utilize pentoses, especially xylose. In order to be as cost efficientas possible, it is preferred that the microorganism is able to utilize pentoses andhexoses simultaneously. [13] Nowadays, genetically modified organisms (GMO)are widely used in biotechnological processes. For example, the production levelsof enzymes can be increased or metabolic routes can be modified to enable

1. Introduction
20
production of novel compounds or to eliminate side-products. Furthermore,genetic manipulation is essential when using raw materials that are not naturalnutrients of the microorganism. Usually, a gene or genes are transferred to thehost organism from other organisms. In this case, the functioning of thetransferred gene(s) in an unfamiliar environment must be ensured. [14] Themicroorganisms used in this study are reviewed briefly in the following.
Yeast. Yeasts are unicellular eukaryotic microorganisms that reproducevegetatively by budding or fission. Yeast identification and characterization is ofgreat importance in biotechnology. For example it is essential to distinguishbetween wild yeast and cultured yeasts in industrial processes. In the brewingindustry the presence of wild yeast may cause undesirable off-flavors in the finalproduct, and during baker´s yeast propagation contaminating wild yeasts such asCandida utilis may easily outgrow strains of Saccharomyces cerevisiae because oftheir more efficient sugar utilization. [15]
Saccharomyces cerevisiae (baker´s yeast) is the most important commerciallyutilized microorganism, and it is regarded as a GRAS organism (generallyrecognized as safe). It has been used extensively because of its capacity for theethanolic fermentation of carbohydrate feedstock. S. cerevisiae has two majorpathways in its energy metabolism: glycolysis and aerobic respiration. Ethanol isan important compound in both pathways being an end product in glycolysis and acarbon source in aerobic respiration. [16] Ethanol red is a S. cerevisiae strain thathas been developed for industrial ethanol production from glucose. Because of ithas high tolerance for alcohol, the ethanol production yields can be up to 18%(v/v). The fermentation temperature range is relatively wide, 30–40 °C, and itutilizes less glucose for cell maintenance. It is also rather tolerant to high stressenvironments.
Kluyveromyces lactis was originally isolated from milk-derived products andbecause of its origin it has GRAS status for industrial use. K. lactis is primarily anaerobic organism but it can ferment glucose to ethanol, and is able to assimilate awider variety of carbon sources than S. cerevisiae. These carbon sources includedifferent sugars, alcohols, carboxylic acids and amino acids. K. lactis is able to uselactose as sole source of carbon and energy which makes it a suitable microorganismfor a number of applications in the dairy industry, e.g. in yogurt production and inthe production of chymosin that is used for cheese manufacturing. [17]
Gluconobacter oxydans. Aerobic microorganisms usually oxidize their carbonsources to carbon dioxide and water. During this process, energy and intermediatemetabolites that are mandatory for biosynthesis are produced. Gluconobacteroxydans is an acetic acid bacterium. It is a Gram-negative, obligate aerobic androd-shaped acidophilic organism that oxidizes its substrates incompletely even innormal growth conditions. High oxidation rates usually correlate with low biomassproduction which is favorable in the biotechnology industry. It is non-pathogenicand its natural habitats are sugary niches such as flowers and fruits. It can also befound from alcoholic beverages and soft drinks as an undesirable contaminantbecause it causes off-flavors and spoilage. [18]

1. Introduction
21
G. oxydans can be utilized in biotechnology in various processes because of itsincomplete oxidation of a wide range of sugars, alcohols and acids to correspondingaldehydes, ketones and organic acids. The products are almost always extracellularcompounds and are produced in approximately equimolar yields which makesG. oxydans an important industrial microorganism. The most common applicationsare the production of L-sorbose from D-sorbitol (vitamin C synthesis); D-gluconicacid, 5-keto- and 2-ketogluconic acids from D-glucose; and dihydroxyacetone fromglycerol. Strains of the Gluconobacter genus can also produce aliphatic, aromaticcarbocyclic and thiocarboxylic acids that can be used as e.g. flavoring ingredients.G. oxydans is able to grow in solutions containing high sugar concentration and atlow pH values. [18, 19] The G. oxydans strain used in this study was VTT E-97003, a suboxydans subspecies. It has been widely studied for its capabilities inxylonic acid production. [20–23]
1.1.3 Carboxylic acids in bioprocesses
Carboxylic acids are involved in many metabolic processes of the cell and they areimportant metabolites of several biochemical pathways in microorganisms. They arefrequently either the main products or significant by-products in bioprocesses. [24]Probably the most well-known metabolic pathway is the tricarboxylic acid (TCA)cycle, in which the main metabolites are di- and tricarboxylic acids (Figure 3). TheTCA cycle is also known as the citrate cycle or Krebs cycle and it is an importantaerobic pathway for the oxidation of fuel molecules such as amino acids, fattyacids and carbohydrates. The cycle starts with acetyl-CoA, the activated form ofacetate derived from glycolysis and pyruvate oxidation of carbohydrates and from
-oxidation of fatty acids. The two-carbon acetyl group in acetyl-CoA is transferredto the four-carbon compound oxaloacetate to form the six-carbon compoundcitrate. In a series of reactions two carbons from citrate are oxidized to carbondioxide (CO2) and the reaction pathway supplies NADPH or NADH for use inoxidative phosphorylation and other metabolic processes. The pathway alsosupplies important precursor metabolites including -ketoglutarate. At the end ofthe cycle the remaining four-carbon component is transformed back to oxaloacetate.The enzymes that are used in the citric acid cycle are also presented in Figure 3. [25]

1. Introduction
22
Figure 3. Main metabolic routes of carboxylic acids. AcCoA acetyl coenzyme A,ACD acetaldehyde, AKG -ketoglutarate, ATP adenosine triphosphate, CIT citrate,CO2 carbon dioxide, FUM fumarate, GTP guanosine triphosphate, ICIT isocitrate,MAL malate, NADH nicotinamide adenine dinucleotide, NADPH nicotinamideadenine dinucleotide phosphate, OAA oxaloacetate, SUC succinate, SucCoAsuccinyl coenzyme A. Enzymes of the TCA cycle: (1) citrate synthase, (2)aconitase, (3) isocitrate dehydrogenase, (4) -ketoglutarate dehydrogenase, (5)succinyl CoA synthetase, (6) succinate dehydrogenase, (7) fumarase, (8) malatedehydrogenase. Enzymes of the glyoxylate cycle: (A) citrate synthase, (B)aconitase, (C) isocitrate lyase, (D) fumarate reductase/succinate dehydrogenase,(E) fumarase, (F) malate dehydrogenase, (G) malate synthase, (H) glyoxylatereductase.
The TCA cycle is the dominant metabolic route of yeast when using sugars as acarbon source in cultivations. When more simple compounds, such as acetate orethanol, are used as substrate, the TCA cycle cannot produce enough biosyntheticprecursors to maintain cell growth. Therefore, yeast employs a modified metabolicroute of TCA called the glyoxylate cycle (Figure 3) which is able to convert two-carbon substrates into four-carbon dicarboxylic acids. As in the TCA cycle, acetyl-CoA reacts with oxaloacetate to produce citrate which in turn is converted toisocitrate. The glyoxylate cycle requires two additional enzymes. One is isocitratelyase which converts isocitrate to succinate and glyoxylate. The other is malatesynthase, that is used to produce malate from acetyl-CoA and glyoxylate. [26] Inaddition, glyoxylic acid can be converted to glycolic acid but the conversion is notefficient.

1. Introduction
23
The difference between the TCA and glyoxylate cycles, in addition to the car-bon source, is that the former occurs in the mitochondria and the latter in the cyto-sol and peroxisome of the cell. When glucose is utilized, it is converted to pyruvatethat can enter the mitochondrial matrix. Pyruvate is oxidatively converted to acetyl-CoA, which enters the TCA cycle. When ethanol or acetate is used as carbonsource, the conversion into acetyl-CoA occurs in cytosol, where it enters the gly-oxylate cycle. In addition, lactic acid can be produced from pyruvate. [27] Theinteraction of these metabolic routes can also been seen in Figure 3.
The glyoxylate cycle can be further modified by metabolic engineering to con-vert glyoxylic acid to glycolic acid. Glycolic acid is one of the building-block chemi-cals that can be produced in bioprocesses. As depicted earlier, glycolic acid canbe produced from glyoxylate but the conversion is not very efficient in yeast andthe yield is low. In genetically modified K. lactis yeast the production of glycolicacid was enabled by deletion of the genes encoding malate synthase (MLS2) andby overexpressing the genes for isocitrate lyase (ICL1) and glyoxylate reductase(GLYR1) (Figure 4). [28]
Figure 4. Engineered glyoxylate cycle. [28] Enzymes: CIT3 citrate synthase,ACO1 aconitase, ICL1 isocitrate lyase, FRD fumarate reductase/succinate dehy-drogenase, FUM1 fumarase, MDH3 malate dehydrogenase, MLS2 malate syn-thase, GLYR1 glyoxylate reductase. The overexpressed enzymes are indicated inblue and the deleted enzyme in red.
Carboxylic acids are also formed during hydrolysis of lignocellulosic material. Themost abundant carboxylates generated are acetic acid that is released from hemi-cellulose by de-acetylation and levulinic acid originating from cellulose and hemi-cellulose. Some formic acid is also produced from the same sources as levulinicacid. [29] These acids act as inhibitors in bioprocesses. Figure 5 illustrates theknown inhibition mechanisms of weak acids in S. cerevisiae. In high concentra-tions they inhibit yeast fermentation by reducing biomass growth and ethanol yield.The main mechanisms of inhibition are presented in two theories: the uncoupling

1. Introduction
24
theory and the intracellular anion accumulation theory. According to the uncou-pling theory, the dissociated weak acid can diffuse from fermentation mediumacross the plasma membrane of the yeast, thus decreasing the cytosolic pH.Plasma membrane ATPase, which pumps protons out of the cell, is activated andit tries to increase intracellular pH. This causes ATP depletion in cytosol and leadsto decreased biomass formation. However, in low acid concentrations, the ATPproduction is probably stimulated by the acids, leading to increased biomass for-mation and ethanol yield. The intracellular anion accumulation theory states thatthe anionic form of the acid is captured inside the cell and the undissociated acidwill diffuse into the cell until equilibrium is reached. Formic acid is more inhibitorythan levulinic acid, which in turn is more inhibitory than acetic acid. Weak acidshave also been demonstrated to inhibit yeast growth by reducing the uptake ofaromatic amino acids from the cultivation medium. [30]
Figure 5. Known inhibition mechanisms of phenolic compounds and weak acids inS. cerevisiae. Adapted from [30]
1.1.4 Phenolic acids in bioprocesses
Aromatic compounds that are present in bioprocesses originate from the ligninbreakdown and carbohydrate degradation during the hydrolysis of lignocellulosicmaterial. They are present in very diverse forms and in low concentrationsbecause of their low solubility in water. The concentrations are dependent on theharshness of the hydrolysis. Phenolic compounds have inhibitory effects onmicroorganisms even at low concentrations, and the compounds with the highestinhibitory effect are low molecular weight molecules. [29] Known inhibitionmechanisms of phenolic compounds in S. cerevisiae are illustrated in Figure 5.The biomass yield, growth rate and ethanol productivity of the yeast are more

1. Introduction
25
decreased than ultimate ethanol yields. It has been noted that low-molecularweight phenolic compounds are more inhibitory than high-molecular weightphenolic compounds and that the substituent position has an effect on compoundtoxicity. Furthermore, the higher hydrophobicity of the phenolic compoundscorrelates with reduced ethanol productivity in yeast. In general, aldehydes andketones act as stronger inhibitors than acids, which are in turn more inhibitory thanalcohols. The inhibition mechanisms of phenolic compounds have been studied,but the mechanisms are still not completely understood. Phenolic compounds mayact on cell membranes, causing loss of integrity which leads to loss of membranefunctionality as selective barrier and enzyme matrix. Weakly acidic phenoliccompounds may destroy the electrochemical gradient by transporting the protonsback across the mitochondrial membranes. They can also cause uncoupling andaccumulation of reactive oxygen species in the cell. [30]
1.1.5 Amino acids in bioprocesses
In nature, nitrogen sources always occur in diverse and complex forms. Nitrogenis also one of the main elements in many macromolecules of living organisms,playing a central role in structure and function, and most organisms have detailedcontrol mechanisms to maintain a constant supply of nitrogen. [31] Yeast is able touse a wide variety of compounds as nitrogen source, but it prefers ammonia or theamino acids asparagine, glutamine and glutamate. In the absence of theseprimary nitrogen sources or if they are present in concentrations low enough tolimit growth, other nitrogen sources, such as nitrite, nitrate, amides, peptides andother amino acids can be utilized. [32]
In bioprocess technology, it has been noted that the amino acid composition ofcultivation broth has an effect on biomass accumulation, productivity and viabilityof yeast during the cultivation. In addition, in beer fermentation amino acids affectthe concentration of flavor-active higher alcohols, vicinal diketones, and esters.The total concentration and composition of amino acids is also important becausethe use of sugar supplements in cultivation medium reduces the nitrogen/carbonratio, resulting in potential limited growth of yeast and the need for nitrogensupplement addition. Brewery (all-malt) wort is composed of a wide variety ofnatural nitrogen sources, of which amino acids are the most abundant. It containsall the physiologically active amino acids but there are differences in individualamino acid concentrations between different wort types. Amino acids are taken upsequentially, although the exact order of uptake is strain specific. [33]
1.2 Bioprocess monitoring
Monitoring and control of processes in bioreactors have gained well-earnedattention in biotechnology. The most important measurements in bioprocessmonitoring are the determination of substrate uptake rate, specific growth rate ofthe organism, and the product formation rate. In practice, the most widely

1. Introduction
26
measured and controlled parameters are pH, dissolved oxygen and carbondioxide, temperature and pressure. Cell density, substrates and products are themain critical process parameters in bioprocesses that also need to be monitored inorder to enable more efficient, sustainable and controlled applications inbiotechnology. Measurements of yield, final concentration of the product and side-products, and both volumetric (grams of product per volume per hour, g L-1 h-1)and specific (grams of product per cell mass per hour, g g-1 L-1) productivity are ofgreat importance in the definition of successful process. [10]
1.2.1 Chromatography and electrodriven separations
1.2.1.1 Carboxylic acids
Carboxylic acids are intermediates or final metabolites of several biochemicalpathways in living organisms, as well as products in industrial biotechnologicalprocesses. Therefore, the analysis of these compounds can serve as an indicatorof a process and as a means of quality control. [34] Carboxylic acids are weakorganic acids and they are partially dissociated in aqueous systems. According totheir pKa-value and pH of the solution, equilibrium is established between undis-sociated, uncharged molecules and their anionic form(s). [35]
Traditionally carboxylic acids have been analyzed by gas or liquid chromatog-raphy but an increasing number of articles describing capillary electrophoresis asan analysis technique have recently been published.
Gas chromatography (GC) is an analysis technique for the determination andseparation of volatile and thermally stable compounds. In addition, with a derivati-zation procedure many compounds can be modified to enable their analysis withGC. In the gas phase analyte molecules move along with the carrier gas and theyare affected by random diffusion and random collisions with the carrier gas mole-cules. The molecules can also move and diffuse in the stationary phase of thecapillary. This procedure is influenced by the thickness of the stationary phase,and by the size and diffusion constant of the molecule. When a molecule diffusesto the surface of the stationary phase, it can detach from it and move back to thegas phase. The probability of a molecule being moved to the gas phase dependson its kinetic energy and molecular interactions with the stationary phase. Thekinetic energy is dependent on the temperature. The separation of analyte mole-cules is defined by the number and frequency of the contacts with the stationaryphase. On the other hand, the diffusion rate of analyte is dependent on the proper-ties of the gas, analysis temperature and the molecular mass of the analyte. [36]
Detectors used in carboxylic acid analyses include flame-ionization detection(FID) and mass spectrometer (MS). In most cases, carboxylates are derivatized bysilylation prior to the analysis. The derivatization procedures are laborious andtime-consuming analysis steps. In bioprocess monitoring, GC has been used toanalyse carboxylic acids in anaerobic cultivation of municipal solid waste [37, 38],microbial culture media [39], cultured maize embryos [42], foodstuffs such as beer,

1. Introduction
27
wine and soy sauce [43], and in fermented soy bean paste [46]. In addition, it hasbeen used to study carboxylic acids in tobacco [40], rye grass [41], and clinicalsamples [44, 45]. GC methods for the analysis of carboxylates in different matricesare presented in Table 3.
Table 3. GC methods for carboxylic acid analysis.
Detection Derivati-zation Application a Analytes Ref.
FID - Aliphatic carboxylic acids in anaerobiccultivation of municipal solid waste Ace, But, Cap, Hep, Pro, Val [37]
MS
- Aliphatic carboxylic acids in anaerobiccultivation of municipal solid waste Ace, But, For, Pro [38]
SilylationOrganic acid profile of culture mediafrom Lactobacillus pentosus andPediococcus lolli
Cit, Gla, Lac, Pyr, Suc [39]
Silylation Volatile organic acids in tobaccoAce, Buta, Cap, Dec, Dod, For,Fur, Hep, Hex, Non, Oct, Pen,Pro, Tet
[40]
Silylation Organic acids in rye grass samples Cit, Fum, Glu, Gly, Icit, Mal,Male, Oxa, Pyr, Suc, Tar [41]
Silylation Organic acids in cultured maizeembryos
Akg, Cit, Fum, Icit, Mal, Oaa,Suc [42]
- Organic acids in foodstuffsAce, But, Cit, Dod, Fum, Hda,Hex, Lac, Lev, Mal, 2-Mbut,Non, Oct, Pen, Pro, Sor, Suc
[43]
Silylation Organic acids in human plasma, urineand rat brain tissue Aaa, Gluy, Oaa, Pyr [44]
Silylation Metabolomic profiling of human urine inhepatocellular carcinoma Ace, But, Male, Pro, Tar, Xyl [45]
Silylation Metabolite profiling of a fermentedsoybean paste during fermentation
Cit, Fum, Gal, Glu, Ita, Lac, Mal,Malo, Oxa, Suc, Tar [46]
a Bioprocess monitoring applications are in bold.Aaa acetoacetate, Ace acetate, Akg -ketoglutarate, But butyrate, Buta butanoic acid, Cap caproate, Citcitrate, Dec decanoic acid, Dod dodecanoic acid, For formate, Fum fumarate, Fur 2-furoic acid, Galgalactarate, Gla glycolate, Glu gluconate, Gly glyceric acid, Glyo glyoxylate, Had heptadecanoic acid, Hepheptanoic acid, Hex hexanoic acid, Icit isocitrate, Ita itaconate, Lac lactate, Lev levulinic acid, Mal malate,Male maleinate, Malo malonate, Non nonanoic acid, Oaa oxaloacetate, Oct octanoic acid, Oxa oxalate,Pen pentanoate, Pro propionate, Pyr pyruvate, Sor sorbic acid, Suc succinate, Tar tartrate, Tet tetradeca-noic acid, Val valeric acid
Liquid chromatography (LC) has been used extensively for the analysis of carboxylicacids from various matrices and applications. The most common LC sub-technique used is ion chromatography (IC), but reversed phase liquid chromatog-raphy (RPLC) has also been used. IC is an analysis technique to separate ioniccompounds, such as inorganic cations and anions, and low-molecular-weight(LMW) organic acids and bases. The separation can be based on ion-exclusion,ion-exchange and/or ion-pair phenomenon. [47] In ion-exclusion chromatography,the electric charges of the dissociated functional groups in the stationary phase ofthe column are the same as that of the ionic compounds to be separated. Thus,

1. Introduction
28
when analyzing anionic compounds, such as carboxylates, cation-exchange resinfunctionalized with anionic groups (e.g. sulfonate, carboxylate) is used in the column.The dissociation equilibrium that is formed between the neutral, undissociatedform and the corresponding anionic form of the acidic solute is vitally important.Amongst other things, this equilibrium is dependent on the acidity and activity ofthe analyte, and on the proton activity, electrolyte content and dielectric constantof the mobile phase. The more dissociated the analytes are, the less interactionthere is with the stationary phase because of electrostatic repulsion, and the fasterthey reach the detector. The undissociated analytes have an interaction with thestationary phase, which causes retardation related to the mobile phase flow. [48]The separation principle of ion-exchange chromatography is the opposite to that ofion-exclusion chromatography: with anionic analytes, anion-exchange resin isused in the column. Hence the more dissociated analytes interact with the station-ary phase longer than undissociated ones that elute with the mobile phase flow.The retention is mainly influenced by the counter-ion type, temperature, and theion strength, pH and modifier content of the mobile phase. When using ion-pairchromatography, a lipophilic ionic compound is added to the stationary phase ofthe column to enhance the formation of ion-pairs between stationary phase andanalyte. [47]
RPLC is probably the most common LC technique in general. It is well suited tothe analysis of polar and ionogenic analytes. The stationary phase is nonpolar,chemically modified silica or other nonpolar packing material, and the mobilephase is a mixture of organic solvent and aqueous buffer or water. The retention isbased on the interactions between analyte and solvent because the interactionbetween analyte and stationary phase is relatively weak. The retention decreaseswith increasing polarity of the analyte and the most important parameter affectingthe retention of nonionic analytes is the concentration and type of the organicmodifier. A buffer chemical (phosphate, ammonium acetate, formate or carbonate)is often used in RPLC to reduce the protolysis of ionogenic analytes because theretention of ionic compounds is low. [47]
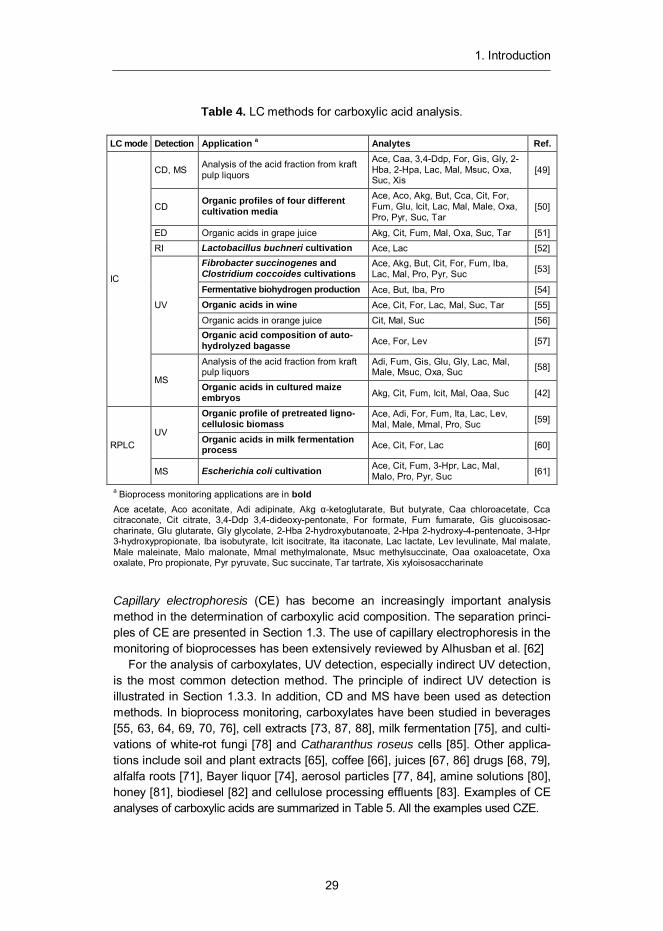
Carboxylic acids are usually monitored by refractive index (RI) or ultraviolet(UV) detectors but electrochemical (ED), conductivity (CD) and mass spectrometer(MS) detectors have also been used. In bioprocess monitoring, IC has been usedto analyze carboxylic acids in cultivation media [50], different cultivations [52, 53, 61],biohydrogen production [54], wine [55], autohydrolyzed bagasse [57], culturedmaize embryos [42], pretreated lignocellulosic biomass [59], and milk fermentation[60]. Other applications include kraft pulp liquors [49, 58] and different juices [51,56]. RPLC has been used to study carboxylates in lignocellulosic biomass [59],milk fermentation [60] and Escherichia coli cultivation [61]. Examples of LCmethods for the analysis of carboxylic acids are presented inTable 4.
1. Introduction
29
Table 4. LC methods for carboxylic acid analysis.
LC mode Detection Application a Analytes Ref.
IC
CD, MS Analysis of the acid fraction from kraftpulp liquors
Ace, Caa, 3,4-Ddp, For, Gis, Gly, 2-Hba, 2-Hpa, Lac, Mal, Msuc, Oxa,Suc, Xis
[49]
CD Organic profiles of four differentcultivation media
Ace, Aco, Akg, But, Cca, Cit, For,Fum, Glu, Icit, Lac, Mal, Male, Oxa,Pro, Pyr, Suc, Tar
[50]
ED Organic acids in grape juice Akg, Cit, Fum, Mal, Oxa, Suc, Tar [51]RI Lactobacillus buchneri cultivation Ace, Lac [52]
UV
Fibrobacter succinogenes andClostridium coccoides cultivations
Ace, Akg, But, Cit, For, Fum, Iba,Lac, Mal, Pro, Pyr, Suc [53]
Fermentative biohydrogen production Ace, But, Iba, Pro [54]Organic acids in wine Ace, Cit, For, Lac, Mal, Suc, Tar [55]Organic acids in orange juice Cit, Mal, Suc [56]Organic acid composition of auto-hydrolyzed bagasse Ace, For, Lev [57]
MS
Analysis of the acid fraction from kraftpulp liquors
Adi, Fum, Gis, Glu, Gly, Lac, Mal,Male, Msuc, Oxa, Suc [58]
Organic acids in cultured maizeembryos Akg, Cit, Fum, Icit, Mal, Oaa, Suc [42]
RPLCUV
Organic profile of pretreated ligno-cellulosic biomass
Ace, Adi, For, Fum, Ita, Lac, Lev,Mal, Male, Mmal, Pro, Suc [59]
Organic acids in milk fermentationprocess Ace, Cit, For, Lac [60]
MS Escherichia coli cultivation Ace, Cit, Fum, 3-Hpr, Lac, Mal,Malo, Pro, Pyr, Suc [61]
a Bioprocess monitoring applications are in boldAce acetate, Aco aconitate, Adi adipinate, Akg -ketoglutarate, But butyrate, Caa chloroacetate, Ccacitraconate, Cit citrate, 3,4-Ddp 3,4-dideoxy-pentonate, For formate, Fum fumarate, Gis glucoisosac-charinate, Glu glutarate, Gly glycolate, 2-Hba 2-hydroxybutanoate, 2-Hpa 2-hydroxy-4-pentenoate, 3-Hpr3-hydroxypropionate, Iba isobutyrate, Icit isocitrate, Ita itaconate, Lac lactate, Lev levulinate, Mal malate,Male maleinate, Malo malonate, Mmal methylmalonate, Msuc methylsuccinate, Oaa oxaloacetate, Oxaoxalate, Pro propionate, Pyr pyruvate, Suc succinate, Tar tartrate, Xis xyloisosaccharinate
Capillary electrophoresis (CE) has become an increasingly important analysismethod in the determination of carboxylic acid composition. The separation princi-ples of CE are presented in Section 1.3. The use of capillary electrophoresis in themonitoring of bioprocesses has been extensively reviewed by Alhusban et al. [62]
For the analysis of carboxylates, UV detection, especially indirect UV detection,is the most common detection method. The principle of indirect UV detection isillustrated in Section 1.3.3. In addition, CD and MS have been used as detectionmethods. In bioprocess monitoring, carboxylates have been studied in beverages[55, 63, 64, 69, 70, 76], cell extracts [73, 87, 88], milk fermentation [75], and culti-vations of white-rot fungi [78] and Catharanthus roseus cells [85]. Other applica-tions include soil and plant extracts [65], coffee [66], juices [67, 86] drugs [68, 79],alfalfa roots [71], Bayer liquor [74], aerosol particles [77, 84], amine solutions [80],honey [81], biodiesel [82] and cellulose processing effluents [83]. Examples of CEanalyses of carboxylic acids are summarized in Table 5. All the examples used CZE.

1. Introduction
30
Table 5. CE methods for carboxylic acid content measurement.
Detection Application a Analytes Ref.
UV
Organic acids in beverages Ace, But, Cit, For, Glu, Gluc, Lac,Mal, Male, Oxa, Pyr, Suc, Tar [63]
Organic acids in grape-derived products Ace, Cit, For, Fum, Lac, Mal, Oxa,Suc, Tar [64]
Organic acids in soil and plant extracts Ace, Cit, Fum, Mal, Male, Malo,Oxa, Tar [65]
Short-chain organic acids in coffeeAce, Cit, Citr, For, Fum, Gly, Icit,Lac, Mal, Male, Mes, Oxa, Pro,Suc
[66]
Adulteration markers in orange juice Cit, Icit, Mal, Tar [67]Organic acids in traditional Chinese medicine Fum, Lau, Lin, Suc [68]
Organic acids in wines Ace, Cit, Fum, Lac, Mal, Oxa,Suc, Tar [69]
Organic acids in beer Akg, Fum, Mal, Mes, Oxa, Pyr [70]Organic acids in Plateau alfalfa roots Aco, Cit, Mal [71]
indirectUV
Organic acids in port wine Ace, Glyo, Lac, Mal, Suc, Tar [72]Carboxylic acid metabolites from the tricarbox-ylic acid cycle in Bacillus subtilis cell extract
Ace, Akg, Cit, For, Fum, Icit, Lac,Mal, Pyr, Suc [73]
Organic acids in Bayer liquor Ace, For, Malo, Oxa, Suc [74]Carboxylates in milk fermentation using Lacto-bacillus delbruecki and Streptococcus ther-mophilus
Ace, Cit, For, Lac [75]
Organic acids in beverages Ace, Cit, Lac, Mal, Suc, Tar [76]Dicarboxylic acids in atmospheric aerosolparticles
Adi, Aze, Glu, Malo, Oxa, Pim,Seb, Sub, Suc [77]
indirectUV
Production of organic acids by different white-rot fungi Mal, Malo, Oxa, Tar [78]
Organic acids in pharmaceutical drug substances Ace, For, Msa, Piv, Suc, Tfa [79]Organic acids in amine solutions for sour gastreatment
Ace, But, For, Gly, Mal, Oxa, Pro,Tar [80]
Organic acids in honey Cit, For, Gluc, Mal, Oxa, Cit [81]Organic acids in wines Ace, Cit, For, Lac, Mal, Suc, Tar [55]
CD Carboxylic acids in biodiesel Ace, For, Pro [82]
MS
Carbohydrate- and lignin-derived components incomplex effluents from cellulose processing
Aze, Dec, Glc, Glr, 8-Hoa, Mal,Suc, Thr, Xyl [83]
Functionalized carboxylic acids from atmosphericparticles
Adi, Aze, Cma, Glu, 8-Hoa, 3-Hmg, 5-Oaa, 6-Oha, 7-Ooa, 4-Opa, 4-Opim, 4-Osa, Pim, Seb,Sub
[84]
Anionic metabolites for Catharanthus roseus(a flower) cultured cells Akg, Cit, Fum, Icit, Mal, Suc [85]
Carboxylic acids in apple juice Cit, Mal, Male, Suc, Tar [86]Organic acids in Bacillus subtilis extracts Akg, Cit, Fum, Lac, Mal, Pyr, Suc [87]Carboxylic acids in Escherichia coli extracts Akg, Cit, Mal, Suc [88]
a Bioprocess monitoring applications are in boldAce acetate, Aco aconitate, Adi adipinate, Akg -ketoglutarate, Ara arabonic acid, Aze azelaic acid, Butbutyrate, Cit citrate, Citr citraconate, Cma citramalate, Dec decanoic acid, For formate, Fum fumarate, Galgalacturonic acid, Gala galactaric acid, Glc glycerate, Glr glucoronate, Glu glutarate, Gluc gluconate, Glyglycolate, Glyo glyoxylate, 3-Hmg 3-hydroxy-3-methylglutarate, 8-Hoa 8-hydroxyoctanoic acid, Iba isobu-tyrate, Icit isocitrate, 2-Ipa 2-isopropylmalate, Ita itaconate, Lac lactate, Lau lauric acid, Lev levulinate, Linlinolenic acid, Mal malate, Male maleinate, Malo malonate, Mes mesaconic acid, Mmal methylmalonate,Msa methanesulfonic acid, Msuc methylsuccinate, 5-Oaa 5-oxoazelaic acid, 6-Oha 6-oxoheptanoic acid,7-Ooa 7-oxooctanoic acid, 4-Opa 4-oxopentanoic acid, 4-Opim 4-oxopimelic acid, 4-Osa 4-oxosebabicacid, Oxa oxalate, Pim pimelic acid, Piv pivalic acid, Pro propionate, Pyr pyruvate, Seb sebacic acid, Sorsorbate, Sub suberic acid, Suc succinate, Tar tartrate, Tfa trifluoroacetate, Th threonic acid, Xyl xylonate

1. Introduction
31
1.2.1.2 Phenolic acids/compounds
In the IUPAC Gold Book it is defined that phenols are compounds having one ormore hydroxyl groups attached to a benzene or other arene ring. [9] For examplein winemaking technology, phenolic compounds are responsible for wine sensoryproperties such as color, flavor, astringency and bitterness. [89] In addition, phe-nolic compounds are present in vegetables, fruits, chocolate, honey, herbs, bever-ages, oil and cereals as antioxidants. [90] In bioprocesses, phenolic compoundsare produced by some fungi and bacteria as a part of their secondary metabolism[91] or they originate from hydrolyzed lignocellulosic material [92]. The use of GCfor the analysis of phenolic compounds is a time-consuming process because ofthe necessary purification of the sample and silylation before analysis. In biopro-cess monitoring, GC has been used to study phenolic compounds in beer, wineand soy sauce [43]. In addition, it has been used to analyse phenolic compoundsin tobacco [40], rye grass samples [41], clinical samples [93, 94], leaf extracts [95],yerba mate [96] and beverages [97, 98]. GC methods for the analysis of phenoliccompound are presented in Table 6.
Table 6. GC methods for phenolic compound analysis.
Detection Derivatization Application a Analytes Ref.
MS
Silylation Volatile organic acids in tobacco Ben [40]
Silylation Organic acids in the metabolites in ryegrass samples
Asc, Ben, 4-Hba, 6-Hba, Nic, Qui [41]
- Organic acids in foodstuffs Ben, Paa, Pht, Tol [43]
Silylation Metabolic profiling of cerebrospinal fluid Ben, Hip, 4-Nba [93]
Silylation Metabolic profiling of human urine Asc, Ura [94]
Silylation Metabolic profiling of Arabidopsis thalianaleaf extracts
Ben [95]
- Phenolics in yerba mate Ben, Fur, Gua, Phe,Van [96]
FID- Organic acids in beverage samples Ben, Sor [97]
Methylation Phenolics in soft drink, juice, food dressing,and cough syrup Ben, Sor [98]
a Bioprocess monitoring application are in boldAsc ascorbate, Ben benzoic acid, Fur furfural, Gua guaiacol, 4-Hba 4-hydroxybenzoate, 6-Hba 6-hydroxybenzoate, Hip hippuric acid, 4-Nba 4-nitrobenzoic acid, Nic nicotinic acid, Paa phenylacetate, Phephenol, Pht phthalate, Sor sorbic acid, Qui quinic acid, Tol toluic acid, Ura uric acid, Van vanillin.
In the analysis of phenolic compounds, RPLC with UV detection is the most com-mon LC technique. In bioprocess monitoring, RPLC has been used to study phe-nolic compounds in wines [99–101] and lignocellulosec biomass [59]. In addition, ithas been used in the analysis of orange juice [56] and in retention modeling [102].The methods for the analysis of phenolic compounds by RPLC are presented inTable 7.

1. Introduction
32
Table 7. LC methods for phenolic acid analysis.
Detection Application a Analytes Ref.
UV
Phenolic composition of grapeextracts and wines Cat, Cou, Gal, Epi, Res [99]
Organic acids in orange juice Asc, Caf, Chl, Cou, Fer, Gal, 4-Hba, Pro,Sin, Vaa [56]
Organic profile of pretreatedlignocellulosic biomass
Ben, Fua, Fur, Gal, 3,4-Hba, 3,5-Hba, 4-Hba, 3,4-Hbd, 4-Hbd, 4-Hc, 3-Mca, 4-Mca,Phe, Sya, Syr, Tol, Vaa, Van
[59]
Phenolic compounds in red wine Caf, Cat, Cou, Fer, Mor, Que [100]
Phenolic compounds in Brazilianfortified wines Caf, Cat, Cou, Fer, Gal, Que, Res [101]
Retention modeling Ben, Pht, Sal [102]a Bioprocess monitoring application are in boldAsc ascorbate, Ben benzoate, Caf caffeic acid, Cat catechin, Chl chlorogenic acid, Cou p-coumarate, Epiepicatechin, Fer ferulate, Fua 2-furoic acid, Fur furfural, Gal gallic acid, 3,4-Hba 3,4-dihydroxybenzoate,3,5-Hba 3,5-dihydroxybenzoate, 4-Hba 4-hydroxybenzoate, 3,4-Hbd 3,4-hydroxybenzaldehyde, 4-Hbd 4-hydroxybenzaldehyde, 4-Hc 4-hydroxycoumarin, 3-Mca 3-hydroxy-4-methoxycinnamate, 4-Mca 4-hydroxy-3-methoxycinnamate, Mor morin, Phe phenol, Pht phtalic acid, Pro protocatechuic acid, Quequercitin, Res resveratrol, Sal salicylic acid, Sin sinapic acid, Sya syringic acid, Syr syringaldehyde, Toltoluic acid, Vaa vanillate, Van vanillin.
Capillary electrophoresis has been used to study phenolic compounds from vari-ous matrices. CZE is the most common CE technique, but MEKC has also beenused. The most common detection method is UV because of the good UV absorb-ance of the benzene ring in the structure. In addition, MS has been used as adetection method. In bioprocess monitoring, CE has been used for the determina-tion of phenolic compounds in different beverages [63, 70, 104–106] and in cul-tured cells of Catharanthus roseus [85]. It has also been used for the analysis ofphenolic compounds in soil and plant extracts [65], coffee [66], Chinese medicine[68], oils [90, 103], plants [71, 107], cellulose processing effluents [83], and fromathmospheric particles [84] and aerosols [108]. CE analysis methods of phenoliccompounds are presented in Table 8.

1. Introduction
33
Table 8. CE for the analysis of phenolic compounds.
Detection Application a Analytes Ref.
UV
Organic acids in beverages Asc, Ben, Sor [63]
Organic acids in soil and plantextracts Ben, Cou, Fer, 4-Hba, Pht, Sal, Sin [65]
Short-chain organic acids in coffee Fur, Pyro, Qui [66]
Organic acids in traditional Chinesemedicine Asc, Ben, Caf, Cou [68]
Phenolic acids in vegetable oils Ben, Caf, Cin, Cou, Fer, Gal, Hba, 2,4-Hba, Syr, Vaa [90]
Phenolics in virgin olive oil Caf, Cou, Fer, 3,4-Hpa, 4-Hpa, Vaa [103]
Organic acids in beer 4-Aba, 4-Hba, Ben, Fer, Gal, Pht, Pro,Pyro, Sin, Sor, Syr [70]
Phenolic compounds in wines Caf, Cat, Cin, Cou, Epi, Fer, Gal, 3,4-Hba,Kae, Myr, Nar, Que, Res, Rut, Vaa [104]
Organic acids in Plateau alfalfa roots Gal [71]
Phenolic compounds in red wine Caf, Cat, Cou, Epi, Fer, Gal, Kae, Pro,Que, Rut, Syr, Vaa [105]
Polyphenols in Spanish winesCaf, Cin, Cou, Epi, Fer, Fis, Gal, 3,4-Hba,4-Hba, Hga, Hva, Que, Res, Sin, Syr,Van, Ver
[106]
Phenolic acids in Brassica oleracea(broccoli) Caf, Cou, Fer, Sin [107]
MS
Carbohydrate- and lignin-derivedcomponents in complex effluentsfrom cellulose processing
Ava, Fer, 4-Hap, 4-Hba, 4-Hbd, Vaa, Van [83]
Functionalized carboxylic acids fromatmospheric particles
Ben, Cin, 2-Hba, 4-Hba, 2-H3n, 2-H4n,Hpht, 4-Mpa, Pht, Tpa [84]
Anionic metabolites forCatharanthus roseus culturedcells
Shi [85]
Organic acids in atmospheric aero-sols Ben, 4-Mpa, Pht, Pyr, Tol, Tere, Tri, Trim [108]
a Bioprocess monitoring applications are in bold4-Aba 4-aminobenzoate, Ace acetoguaiacone, Asc ascorbate, Ava acetovanillone, Ben benzoate, Cafcaffeic acid, Cat catechin, Cin trans-cinnamate, Con coniferyl aldehyde, Cou p-coumarate, Epi epicate-chin, Fer ferulate, Fis fisetin, Fur furanoate, Gal gallic acid, 4-Hap 4-hydroxyacetophenone, Hba p-hydroxybenzoate, 2-Hba 2-hydroxybenzoate, 3,4-Hba 3,4-dihydroxybenzoate, 4-Hba 4- hydroxybenzoate, 4-Hbd 4-hydroxybenzaldehyde, Hga homogentistic acid, 2-H3n 2-hydroxy-4-nitrobenzoate, 2-H4n 2-hydroxy-4-nitrobenzoate, 3,4-Hpa 3,4-dihydroxyphenylacetate, 4-Hpa 4-hydroxyphenylacetate, Hpht homophthalate,Hva homovanillate, Kae kaempferol, 4-Mpa 4-methylphtalate, Myr myricetin, Nar narirutin, Phe phenol,Pht phthalate, Pro protocatechuic acid, Pyr pyromellitic acid, Pyro pyroglutamate, Que quercitin, Quiquinate, Res resveratrol, Rut rutin, Sal salicylic acid, Shi shikimate, Sin sinapinate, Sor sorbate, Syasyringaldehyde, Syr syringic acid, Tere terephthalate, Tol toluic acid, Tpa terephthalate, Tri trimesic acid,Trim trimellitic acid, Vaa vanillic acid, Van vanillin, Ver veratric acid
1.2.1.3 Amino acids
Amino acids are important metabolites of the cell. They are the building blocks ofproteins and peptides, which makes them one of the most important groups ofsmall molecules in living organisms. Usually they contain one or two primary ami-

1. Introduction
34
no groups, one or two carboxyl groups, and a side chain with properties varyingbetween different amino acids. [109] Because of the high polarity, low volatility andzwitterionic character of amino acids, their simultaneous separation and detectioncan be difficult. When using GC as an analysis method, amino acids must bederivatized to increase their volatility. FID and MS are the most common detectorsin GC analysis of amino acids. In bioprocess monitoring, amino acids have beenstudied by GC in fermented soy bean paste [46] and beer [110]. It has also beenused in the analysis of amino acids in rye grass [41], clinical samples [45, 93, 94],leaf extracts [95], and in quince fruit and jam [111]. GC methods for the analysis ofamino acids from different applications are summarized in Table 9.
Table 9. GC for the analysis of amino acids.
Detection Derivatization Application a Analytes Ref.
MS
Silylation Amino acids in the metabolitesin rye grass samples
Ala, Arg, Asn, Asp, Cys, Gln, Glu,Gly, His, Ile, Leu, Lys, Met, Phe,Pro, Ser, Thr, Trp, Tyr, Val
[41]
SilylationMetabolomic profiling ofhuman urine in hepatocellularcarcinoma
Ala, Asp, Gly, Leu, Lys, Pro, Ser,Thr, Trp, Val [45]
SilylationMetabolite profiling of afermented soybean pasteduring fermentation
Ala, Arg, Asn, Asp, Glu, Gly, His,Ile, Leu, Lys, Met, Phe, Pro, Ser,Thr, Trp, Tyr, Val
[46]
Silylation Metabolic profiling of cerebro-spinal fluid
Ala, Arg, Asp, Cys, Glu, Gly, His,Ile, Leu, Lys, Met, Phe, Pro, Ser,Thr, Tyr, Val
[93]
Silylation Metabolic profiling of humanurine
Ala, Asp, Gly, Leu, Lys, Pro, Ser,Thr, Trp, Tyr, Val [94]
Silylation Metabolic profiling of Ara-bidopsis thaliana leaf extracts
Ala, Asp, Glu, Leu, Val [95]
FID
BHT Amino acids in beer and rawmaterials
Ala, Asp, Glu, Gly, Ile, Leu, Lys,Met, Phe, Pro, Ser, Thr, Tyr, Val
[110]
Chloroformate Free amino acids in quincefruit and jam
Ala, Asn, Asp, Cys, Gln, Glu, Gly,His, Ile, Leu, Lys, Met, Phe, Pro,Ser, Thr, Trp, Tyr, Val
[111]
a Bioprocess applications are in boldAla alanine, Arg arginine, Asn asparagine, Asp aspartate, Cys cysteine, Gln glutamine, Glu glutamate, Glyglycine, His histidine, Ile isoleucine, Leu leucine, Lys lysine, Met methionine, Phe phenylalanine, Proproline, Ser serine, Thr threonine, Tyr tyramine, Trp tryptophan, Val valine
HPLC has been used to study amino acids in various matrices. The most commontechnique is RPLC because amino acids are polar compounds. When using UV orLIF detection, amino acids are usually derivatized pre- or post-column. Underivat-ized amino acids can be detected with MS. RPLC has been used to study aminoacids in fermentations [115, 117]. In addition, it has been used for the determina-tion of amino acids in clinical samples [112–114, 116]. IC has been used to studyamino acids in urine. [118] Applications for amino acid analyses are presented inTable 10.

1. Introduction
35
Table 10. HPLC for the analysis of amino acids.
LC mode Detection Application a Analytes Ref.
RPLC
UV
Amino acids in rat serum Ala, Arg, Asn, Asp, Cys, Gln,Glu, Gly, His, Hyp, Ile, Leu, Lys,Met, Orn, Phe, Pro, Ser, Tau,Thr, Trp, Tyr, Val
[112]
Amino acids of hydrolyzed pro-teins
Ala, Arg, Asn, Asp, Gln, Glu,Leu, Lys, Phe
[113]
Amino acids in patient bloodsamples
Ile, Leu, Met, Phe, Tyo, Val [114]
LIF
Non-canonical amino acids infermentation process of Esche-richia coli
Leu, Nleu, Nval, Val [115]
Amino acids in biological fluids Ala, Arg, Asn, Asp, Cys, Glu,Gly, Hcys, His, Ile, Leu, Lys,Met, Orn, Phe, Ser, Tau, Thr,Trp, Tyr, Val
[116]
MSAmino acid metabolism moni-toring during fermentation
Ala, Arg, Asn, Asp, Cys, Gln,Glu, Gly, His, Ile, Leu, Lys, Met,Phe, Pro, Ser, Thr, Trp, Tyr, Val
[117]
IC UV Amino acids in urine Cre, Crn, His, Met, Phe, Trp, Tyr [118]aBioprocess monitoring applications are in boldAla alanine, Arg arginine, Asn asparagine, Asp aspartate, Cre creatinine, Crn creatine, Cys cysteine, Glnglutamine, Glu glutamate, Gly glycine, Hcys homocysteine, His histidine, Hyp hydroxyproline, Ile isoleu-cine, Leu leucine, Lys lysine, Met methionine, Nleu norleucine, Nval norvaline, Orn ornithine, Phe phenyl-alanine, Pro proline, Ser serine, Tau taurine, Thr threonine, Trp tryptophan, Tyo tyrosine, Tyr tyramine,Val valine
Amino acid analysis is very common with CE. The lack of a strong chromophore inthe aliphatic amino acid structure sets challenges for the detection. With UV detec-tion, the amino acids must be derivatized or else indirect UV detection must beemployed. LIF detection also requires derivatization but the sensitivity is far betterthan with UV detection. MS is also a versatile detection method for the analysis ofamino acids. In addition, CD has been used. CZE has been used to study aminoacids in a bacterial cultivation [119] and in beer [120]. In bioprocess monitoring,MEKC has been used to study Bacillus subtilis extracts. [87] It has also been usedto analyze amino acid concentrations in juice [121], pineapple leafs [122], dietarysupplements [123], human serum [124] and soy sauce [125]. CE methods for theamino acid analysis are summarized in Table 11.

1. Introduction
36
Table 11. CE for the analysis of amino acids.
CE mode Detection Application a Analytes Ref.
CZE
UV Amino acids in Bacillus subtiliscultivation
Ala, Arg, Asn, Asp, Cys, Gln, Glu,Gly, His, Ile, Leu, Lys, Met, Phe,Pro, Ser, Thr, Trp, Tyr, Val
[119]
CD Amino acids in Swiss lager beerAla, Arg, Asn, Asp, Cys, Gln, Glu,Gly, His, Ile, Leu, Lys, Met, Phe,Pro, Ser, Thr, Trp, Tyr, Val
[120]
MEKC
LIFAmino acids in pomegranate juiceand for the detection of adultera-tion with apple juices
Ala, Arg, Asn, Asp, Glu, Leu, Pro,Ser, Trp [121]
MS
Organic acids in Bacillussubtilis extracts
Ala, Arg, Asn, Asp, Gln, Glu, Gly,His, Ile, Leu, Lys, Met, Phe, Pro,Ser, Thr, Tyr, Val
[87]
Amino acids in pineapple leafextract
Ala, Arg, Asn, Asp, Gln, Glu, Gly,His, Ile, Leu, Lys, Met, Phe, Pro,Ser, Thr, Trp, Tyr, Val
[122]
Amino acids in dietary supple-ments containing royal jelly
Ala, Arg, Asp, Cys, Glu, Gly, His,Ile, Leu, Lys, Met, Phe, Pro, Ser,Thr, Tyr, Val
[123]
Amino acids in human serum Ala, Arg, Ile, Leu, Lys, Met, Phe,Pro, Thr, Tyr, Val [124]
Amino acids in soy sauceAla, Arg, Asn, Asp, Cys, Glu, Gly,His, Ile, Leu, Lys, Met, Phe, Pro,Ser, Thr, Trp, Tyr, Val
[125]
a Bioprocess application are in boldAla alanine, Arg arginine, Asn asparagine, Asp aspartate, Cys cysteine, Gln glutamine, Glu glutamate, Glyglycine, His histidine, Ile isoleucine, Leu leucine, Lys lysine, Met methionine, Phe phenylalanine, Proproline, Ser serine, Thr threonine, Tyr tyramine, Trp tryptophan, Val valine
1.2.2 Online monitoring
The United States Food and Drug Administration (FDA) has launched a ProcessAnalytical Technology (PAT) initiative that encourages the use of real-timeprocess monitoring and controlling tools to enhance the feasibility, productivity andquality control of manufacturing processes. [126] Better monitoring of theproduction process allows verifying and tracing back the integrity and quality of theproducts. The greatest advantage of automated measurements is the absence ofmanual steps of the analysis procedure such as sample pretreatment, which isusually the most laborious and error-prone part of the analysis.
1.2.2.1 In situ probes
Most common online monitoring tools in biotechnology are in situ probes that areinserted into the bioreactor and provide real-time measurement information. Thereare several general requirements for a reliable probe in bioprocess monitoring: thepossibility of calibration, linear dependency, precision at both low and high celldensities, they should be sterilizable, they should withstand high temperature and

1. Introduction
37
pressure and they should be resistant to corrosion and biologically inactive. Forindustrial applications, the probe calibration should be repeatable after severalcultivations, sterilizations and cleaning cycles. The most common in situ probesare based on electrochemical, temperature, direct optical or electrical measurementprinciples and in most cases are specific for a certain parameter or analyte. [127]
Electrochemical and temperature probes are the prevailing sensortechnology in process control. They are used to measure temperature, pH anddissolved oxygen. The temperature analysis is performed by a platinum resistancetemperature detector. The electrical resistance of the platinum wire is measuredand the result is proportional to temperature. Traditional pH analysis is carried outwith a standard potentiometric ion selective glass electrode, and a Clarkamperometric electrode is used to measure dissolved oxygen that is a substrate inmany bioprocesses. [128]
Optical-density (OD) probes are the most common in situ probes for onlinebioprocess monitoring in bioprocesses using unicellular microorganisms. They areused for estimating cell growth and biomass concentration by measuring lightabsorption or scattering continuously in the visible (390–700 nm) and near-infrared(750–1400 nm) wavelengths. The wavelength required is dependent on the size ofthe measured object: smaller objects require lower wavelengths. However, thisapproach cannot analyze cell viability, and any particles or bubbles that might bepresent in cultivation media can interfere with the analysis. [129]
Infrared (IR) spectroscopy is becoming more important in bioprocessmonitoring. The analysis is based on molecular vibrations of organic compoundsin the IR region that are characteristic for certain molecule structures. Sensorsusing near-IR and mid-IR spectra can simultaneously detect several organiccompounds including glucose, fructose, lactate, glutamate, glutamine, proline,ammonia and CO2. As a drawback, the calibration of this method can be complexand the peaks in IR spectra are usually broad due to overlapping whichnecessitates multivariate data analysis methods. [126, 130]
Fluorescence spectroscopy is a technique specific for compounds thatpossess fluorescent properties. The principle of fluorescence is presented inSection 1.3.3 in more detail. It is more sensitive than light absorption measurementsbecause the measured signal has, in principle, zero background. Many biologicalcompounds have fluorescent properties, e.g. proteins, enzymes, coenzymes,amino acids, vitamins, and primary or secondary metabolites of microbial growth.The applications are sensitive but not specific. The most common applications areprotein and NAD(P)H sensors to study protein content and for biomass estimation,respectively. Simultaneous measurement of multiple analytes can be achievedwith 2D fluorescence, in which the fluorometer uses several excitation and emissionwavelengths. However, two compounds with same fluorescent properties cannotbe separated. [131, 132]
Dielectric spectroscopy utilizes the complex electrical properties of viablecells through capacitance and conductance measurements. It can provide informationon the total and viable cell volume, since only cells with intact membranes haveelectrical properties. The analysis of viable cells is important as a measure of

1. Introduction
38
growth of the microorganism. In addition, some growth-related products can beindirectly monitored with dielectric spectroscopy. [133]
In general, the issue with spectroscopic techniques is the complexity of thespectrum. In addition, cultivation conditions have an effect on the spectrum. Becauseof this, the determination of blank and linearity calibration of the measurementrange of spectroscopic sensors for the analysis of specific compounds oftenrequires an extensive experimental approach.
1.2.2.2 Separation techniques
Liquid chromatography, gas chromatography and capillary electrophoresis are themost common offline analysis techniques that are used in biotechnology. Thesemethods are also applicable to online monitoring. The advantage of chromato-graphic online techniques is that there is a wide variety of methods available andseveral compounds and/or compound groups can be analyzed simultaneously.However, the analysis takes more time than with the in situ probes and thus is notperformed in real-time mode. In addition, the automated sampling and sampletreatment, the most difficult and important parts of the online analyses, involvechallenges. The sampling must be safe for the process without any risk of contam-ination, and the sample must be representative of the cultivation. Furthermore, thesample treatment must be designed for the analysis purposes: cells must be re-moved from the sample for the analysis of extracellular compounds or cells mustbe lysed for the analysis of intracellular compounds. A sample port has been de-signed, constructed and patented for the liquid sampling of bioprocess samples atVTT Technical Research Centre of Finland. [134] Other automated sampling de-vices are for example bioPROBE (BBI-Biotech, Germany), GPA 1000 (GrotonBiosystems, USA), Seg-Flow (Flownamics, USA), and MultiTRACE (Trace Analyt-ics, Denmark).
Liquid chromatography is the most common online chromatographic analysismethod. Assembling the device is much simpler than with other chromatographictechniques because the sample is in liquid form. There are at least threemanufacturers worldwide that sell online LC devices: Waters® (USA) hasdeveloped the PATROLTM UPLCTM Process Analyzer that uses ultraperformanceliquid chromatography (UPLC), Dionex (USA) has a DX-800 Process Analyzer thatis based on both ion chromatography (IC) and high performance liquidchromatography (HPLC), and Bayer (Germany) has developed the BaychroMAT®process analysis system that combines HPLC, gel permeation chromatographyand gas chromatography. In addition, Groton Biosystems has developed a samplingsystem interface called Automated Reactor Sampling System (ARSTM) that ismarketed together with Agilent 1200 Series LC system (USA). Furthermore,several research laboratories have made their own online LC devices that havebeen used in several biotechnological applications. Online HPLC has been usedfor the monitoring of sugar consumption and carboxylic acid production ofEscherichia coli [135] and to monitor and control ethanol fermentation by

1. Introduction
39
Zymomonas mobilis [136]. It has also been used to monitor extracellularmetabolite concentrations during a batch cultivation of S. cerevisiae [137], anionsand carboxylic acids in wastewater treatment processes [138], degradationproducts of dyes in textile industry process waters [139, 140], for carbohydratesand volatile fatty acids in fermentative biohydrogen production [141], and forglucose and ethanol in Escherichia coli cultivation [142].
Gas chromatography is the most common chromatographic analysistechnique for gaseous and volatile sample compounds whereas for online analysisof aqueous samples it is probably the least popular because of the necessaryderivatization procedure. However, online GC has been used to analyzedihydroxyacetone and glycerol from fermentation broths by pyrolytic methylationGC with a vertical microfurnace pyrolyzer. In this system, the analytes wereconverted into their corresponding methyl ethers and analyzed by GC with a flameionization detector (FID). [143] An online GC-MS system has also been used tomonitor crude wastewater in an automated manner. A two-stage injector wasassembled in-house to enable the analysis of 140 volatile and semi-volatilecompounds. [144]
Capillary electrophoresis is a new approach for online monitoring. Only onecommercial approach has been established. Fixion (Capilix, Netherlands) is anonline measurement tool for industrial applications that exploits microchip CEtechnology and is designed to analyze inorganic cations and anions, and volatilefatty acids. Other applications are performed with reconstructed offline or in-housebuilt CE devices. Online CE (UCE) with an in-house constructed sample flow cellhas been developed at VTT Technical Research Centre of Finland. The UCEdevice has been used for process monitoring in the pulp and paper industry toanalyze dissolvable inorganic ions and carboxylic acids from circulation waters ofpulp and paper machines. [145, 146] In online bioprocess monitoring, CE hasbeen used to analyze carboxylic acids [147], adenosine triphosphate (ATP) andadenosine diphosphate (ADP) [148], and heavy metals [149]. In addition,glutamate and -aminobutyric acid (GABA) levels in rat brain have been studiedwith in vivo microdialysis coupled online to CE-LIF. [150]
1.3 Capillary electromigration techniques
Capillary electrophoresis is a family of related separation techniques that usenarrow-bore fused silica capillaries to separate large and small molecules in a highelectric field. According to their separation principles, the most common capillaryelectromigration techniques are divided into the following categories: capillaryzone electrophoresis, micellar electrokinetic chromatography, capillary gel electro-phoresis, capillary isoelectric focusing and capillary electrochromatography. [151]The uniqueness of capillary electrophoretic techniques is that there are no limitationsregarding polar solvents, analytes or samples. Resolution and efficiency are high inoptimized methods, creating a great potential for rapid detection and quantification.[152] The techniques used in this study are reviewed briefly in the following.

1. Introduction
40
1.3.1 Capillary zone electrophoresis
In capillary electrophoresis, the separation of analytes is based on theirdifferences in velocity in an electric field. The velocity of an ion (v) can bepresented as:
v= ep E (1)
where µep is the electrophoretic mobility of an ion and E is the electric fieldstrength applied during analysis (in V/cm). The electrophoretic mobility is stronglyinfluenced by the composition of the background electrolyte (BGE) including pH,ionic strength, concentration of organic cosolvents, and electrolyte additives. Inaddition, the µep is proportional to the size (radius, r) and charge (q) of themolecule:
ep= qr
(2)
where is the viscosity of the BGE solution. Therefore, for a given ion andsolution medium, the electrophoretic mobility is a constant which is characteristicfor that specific ion. From this equation it can be noticed that small, highly chargedmolecules have high mobility whereas large molecules with low charge numberhave low mobility. [153, 154]
In addition to the electrophoretic mobility, electroosmotic flow (EOF) also hasan influence on the separation of analytes. EOF is a bulk property of the BGE. It isa consequence of the surface charge of the interior wall of fused silica capillary i.e.the anionic silanol groups (SiO-). Counterions originating from BGE (usuallycations) build up an oppositely charged counterionic layer near the capillarysurface to maintain charge balance. A diffuse double-layer is formed and apotential difference (zeta-potential) is created very close to the capillary wall.When voltage is applied across the capillary, a double-layer wall consisting ofcations starts to move towards the cathode, creating the bulk flow that is calledEOF. The magnitude of EOF can be calculated from:
veo= E (3)
or
eo= (4)
where veo is the electroosmotic velocity, the dielectric constant of BGE solution, zeta-potential, viscosity of the BGE solution, E electric field strength and eo
electroosmotic mobility. Because zeta-potential is determined by the surface

1. Introduction
41
charge on the capillary wall, it is strongly pH dependent. This results in higherEOF with higher pH. Furthermore, zeta-potential is dependent on ionic strength ofthe BGE as described by double-layer theory. When ionic strength is increased,the double-layer is compressed, which decreases zeta-potential and thus EOF isreduced. As long as the temperature is kept constant, the applied electric field isproportional to the electroosmotic velocity. [150, 155]
Figure 6 presents the effect of electrophoretic mobility ( ep) and electroosmoticmobility ( eo) on the total mobility ( tot) of an analyte that is neutral (N), positivelycharged (+) or negatively charged ( ), and is influenced by positive electric field.For a neutral compound, the total mobility is equal to electroosmotic mobility, forcations the total mobility is the sum of electrophoretic and electroosmotic mobility,and for anions the total mobility is the difference between these mobilities. [156]Because of the electroosmotic flow, all the analytes will migrate to the detectoreventually.
Figure 6. Schematic presentation of CZE separation principle. Adapted from [153]
Overall, the electroosmotic flow (EOF) is one of the most important factorsaffecting the separation efficiency in capillary electrophoresis. In CZE, the mostrapid separation is achieved when the electrophoretic mobility of the analyte andEOF are in the same direction. This phenomenon is called co-EOF, and itdecreases resolution because in that case the analytes mainly move to thedetector too fast. In the other case, when the electrophoretic mobility and EOF arein different directions (counter-EOF), the resolution is better but the analysis timeis increased. Thus, the control of EOF is of high importance in either case.Methods for controlling EOF are summarized in Table 12. [157]

1. Introduction
42
Table 12. Methods for controlling EOF. [150]
Variable Effect
Electric field Directly proportional to the electroosmotic velocity.
pH of BGE EOF increases when pH increases.
Ionic strength of BGE EOF decreases when ion strength increases.
Temperature during analysis The viscosity of BGE changes approximately 2–3% per °C, thusEOF increases when temperature increases.
Organic modifier in the BGE Changes the zeta-potential and the viscosity of BGE.
BGE additives (e.g. surfactants) Change the magnitude and direction of EOF. Anionic surfactantsincrease EOF and cationic surfactants decrease EOF.
Capillary coating Increases, decreases or stops EOF
Covalent bonded surface coating EOF changes depending on the charge and polarity of the coating.
When analyzing anionic compounds with CZE using normal polarity, the analytesreach the detector at the late part of the analysis with the aid of EOF as presentedin Figure 6. When the polarity is changed to negative, anions have electrophoreticmobility towards the anode, but the direction of EOF is towards the cathode asshown in Figure 7A which causes peak broadening. To overcome this problem, thefused silica capillary needs to be coated with cationic surfactant that changes thedirection of the EOF. [158] Furthermore, capillary surface modification suppressesinteractions of sample components with the surface. [159] The capillary coating canbe achieved by dynamic or covalent and non-covalent coating.
Dynamic coating of a capillary is achieved by using modifiers in BGE. Becausethe modifier is a chemical in the BGE, the coating is regenerated continuously andpermanent stability is not needed. When cationic surfactant is added to the elec-trolyte, EOF is reversed because of the formed double layer and positive chargeon the capillary surface making the EOF move in the same direction as negativelycharged anions (Figure 7C). This results in good peak shapes. [160] The genera-tion of dynamic coating is easy, and normal fused silica capillary can be used. Themodification chemicals are usually quite cheap, and the coating is applicable overa wide range of buffer concentrations and pH values. However, the dynamicallycoated capillaries need equilibrium time to obtain reproducible surface and con-stant EOF, and post-column analyses (MS, enzymatic assays) are usually notpossible because they are sensitive to additives. The modifiers used for dynamiccoating are surfactants, and thus the concentration must be below the criticalmicelle concentration (CMC) or the mechanism of the CE separation will changeto micellar electrokinetic chromatography (MEKC). Usually the concentration isaround 0.5 mM. Some cationic modifiers are listed in Table 13. [156]

1. Introduction
43
Figure 7. Elimination and reversal of electroosmotic flow with a cationic surfactant.Adapted from [156]
Covalent and non-covalent coating of a capillary is typically achieved by attachingcovalently hydrophilic polymers such as polyethyleneimine or polyacrylamide tothe silanol groups on the capillary wall. In most cases, the capillary is firstdeactivated by silanization reagent and then coated with a functional group. [161]Even though these modifications are meant to be permanent and they shouldrequire little or no maintenance, regeneration of the capillary might be necessaryeven between analyses depending on the sample matrix. Furthermore, the pHrange of the permanently coated capillaries is not as wide as with the dynamicallycoated capillaries and they are significantly more expensive. [156] However, in ourstudy, the repeatability of migration times with a permanently coated capillary wasbetter than with a dynamically coated capillary because analysis time is shorterand the coating is more robust. [Publication III]
1.3.2 Micellar electrokinetic chromatography
Micellar electrokinetic chromatography (MEKC) was originally developed for theanalysis of neutral compounds that CZE is not able to separate because neutralcompounds migrate with EOF. Takeshi Nakawaga introduced an idea combiningthe micellar solubilization phenomenon known in chromatography with CZEseparation. Instead of a chromatographic approach in which micelles act asstationary phase, in CE it is referred to as pseudostationary phase because themicelles are moving freely in the BGE solution. [162]
In MEKC a pseudostationary phase is formed in the capillary from the BGE anda surfactant above its critical micelle concentration (CMC) that is measured in

1. Introduction
44
water. In addition to the separation based on charge-to-mass ratio, the migrationof an analyte is also dependent on its partition coefficient between the micellesand aqueous phase of the BGE. [163]
Detergents are water-soluble, surface-active agents that consist of a hydrophilichead and hydrophobic or lipophilic tail. Because of their amphiphilic character,detergent molecules aggregate in solution to form micelles. They can also align ataqueous/non-aqueous interfaces, thus reducing surface tension, increasingmiscibility and stabilizing emulsions. Detergents can be divided into fourcategories according to the nature of the hydrophilic head group: non-ionic,anionic, cationic and zwitterionic. [164] Common detergents in MEKC and theirproperties are summarized in Table 13.
Table 13. Detergents used in MEKC and their properties. [161]
Chemical MW(g/mol)
CMC(mM)
Average micellarweight (g/mol)
Nonionic
Brij®35 1200 0.05–0.1 48 000
Triton® X-100 625 0.2–0.9 80 000
Tween® 20 1228 0.06 *
Anionic
Sodium cholate 431 9–15 900–1300
Sodium deoxycholate 415 2–6 1200–5000
Lithium dodecyl sulfate 272 7–10 *
Sodium dodecyl sulfate (SDS) 289 7–10 18 000
Cationic
Hexadecyltrimethylammonium bromide (CTAB) 365 1 62 000
Myristyltrimethylammonium hydroxide (MTAH) 239 * *
Trimethyl(tetradecyl)ammonium bromide (TTAB) 337 4–5 27 000
Zwitterionic
3-[(3-Cholamidopropyl)-dimethylammonio]-1-propanesulfonate (CHAPS) 615 6 6150
3-[(3-Cholamidopropyl)-dimethylammonio]-2-hydroxy-1-propanesulfonate (CHAPSO) 631 8 7000
MW molecular weightCMC critical micelle concentration in water at 20–25 °C*Data not available
The separation principle of MEKC is presented in Figure 8. When an electric fieldis applied to the capillary, the ionic micelles start to migrate towards the electrodehaving a polarity opposite to the charge of the micelle. However, the EOF isusually stronger than the electrophoretic mobility of the micelles and micelles willmigrate in the same direction as the analytes but at retarded velocity. [159] Whenan analyte is injected into the micellar BGE, it interacts with the micelles. Theseparation depends on the individual partitioning equilibrium of the analytes

1. Introduction
45
between the micellar and aqueous phase. Analytes with higher interactions withthe micelles have lower mobilities than analytes interacting mainly with the bulksolution. When using anionic micelles and normal polarity, the migration order isopposite to that in CZE. Anions will migrate first as they remain mostly in bulksolution due to the electrostatic repulsion of micelles; neutral compounds migratesecond according to their hydrophobicity; and cations migrate last due to strongelectrostatic attraction with the micelles. However, this generalization does notapply if strong hydrophobic interactions between analyte and micelles occur sincethey overcome repulsion and attractions. Furthermore, electrophoretic mobilities ofanalytes can also change the migration order. [148]
Figure 8. Schematic presentation of MEKC separation principle. Adapted from[148].
1.3.3 Detection methods
The narrow-bore capillary that is used in CE makes the detection of analyteschallenging. Low analyte concentrations in a sample with high detection sensitivityand narrow analyte zone widths require innovative methods to detect lowconcentrations from nanoliter (or even smaller) sample volumes. Careful choice ofthe detector enables separations of analytes in low concentrations from manydifferent and complex matrices. [165] The most common detection methods usedin CE are summarized in Table 14 along with their detection limits. The detectionmethods used in this study are presented later on.

1. Introduction
46
Table 14. Most common detection methods for CE. [166]
Method Mass detectionlimit (mol)
Concentrationdetection limit(mol/L)*
Notes
UV/Vis absorption(UV/Vis)
10-12–10-15 10-5–10-7 Universal and most commondetection method, diode arraydetection (DAD) provides spectralinformation.
Laser inducedfluorescence (LIF)
10-18–10-20 10-9–10-12 The most sensitive detectionmethod, usually requiresderivatization.
Amperometry (AD) 10-18–1019 10-10–10-11 Sensitive and selective but only forelectroactive analytes. Not robust.
Conductivity (CD) 10-15–10-16 10-6–10-7 Universal.
Mass spectrometry(MS)
10-16–10-17 10-8–10-9 Sensitive and gives structuralinformation. Interfacing CE and MSis complicated.
Indirect UV,indirect fluorescence,indirect amperometry
10–100 times lesssensitive than thedirect method
Universal but with lower sensitivitythan that of the direct method.
*Assume 10 nL injection
UV/Vis detection. UV/Vis detection is the most common detection method in CEand is compatible with all the modes of CE. However, some restrictions in theBGE composition exist due to the optical properties of the BGE itself. With UV/Visdetection, any molecule that possesses a UV chromophore in its structure can bedetected. A chromophore is a functional group that absorbs light in the UV/Visregion of the electromagnetic spectrum. If the analyte does not contain a chromo-phore or it absorbs weakly, the analyte can either be derivatized or detected withindirect UV detection. In indirect UV detection, a highly UV absorbing chemical isadded to the BGE to produce a high and constant background signal. When ananalyte with no UV absorbance reaches the detector, the analyte is seen in theelectropherogram as a negative peak. The detection with UV/Vis is based on theBeer-Lambert law which indicates that absorbance is proportional to the concen-tration of the analyte. The magnitude of the signal is also dependent on the ana-lyte; analytes with high molar absorptivities of 104 to 105 are strong absorbers andanalytes with molar absorptivities of 103 are weak absorbers. Furthermore, thepH and composition of the BGE, and the degree of ionization have an effect on themolar absorptivity value and on the maximum wavelength of absorption. [162] TheBeer-Lambert law is presented as:
A= lc, (5)
where A is absorbance, is molar absorption coefficient (in cm-1M-1), l is opticalpath length and c is concentration.

1. Introduction
47
Fluorescence detection. Fluorescence is the most sensitive and second mostcommon detection method in CE. The detection limits are below 10-21 mol, makingit almost 1000 times more sensitive than UV detection. [162] Fluorescence can bedivided into three stages: 1) excitation, 2) excited-state lifetime, and 3)fluorescence emission. These stages can be illustrated by the Jablonski diagram(Figure 9A) which represents the electronic states of each stage. In stage 1, thefluorophore absorbs a photon of energy h EX that is delivered by a light sourcesuch as a laser, and moves to the excited electronic single state (S1´). The excitedstate exists for a limited time, typically 1–10 ns (stage 2). First, the energy of S1´ ispartially dissipated, yielding a relaxed singlet excited state (S1) which is the originof fluorescence emission. Second, the molecules that were not excited by theabsorption in stage 1 return to the ground state S0. After this, stage 3 occurs whenelectronically excited fluorophore emits a photon of energy h EM and returns to theground state. Because of the energy dissipation during stage 2, the energy of thisphoton is lower than in stage 1. The difference between these photon energies(h EX – h EM) is called Stokes shift (Figure 9B). [162, 167]
Figure 9. A) Jablonski diagram, and B) Stokes shift. [164]
The intensity of fluorescence detection is also defined by the Beer-Lambert law.The most important parameters of a fluorophore are molar absorption coefficient
), fluorescence quantum yield and photostability of the molecule. Fluorescencequantum yield illustrates the number of fluorescence photons emitted per excita-tion photo absorbed, thus accounting for the efficiency of fluorescence detectionwith certain fluorophores. Theoretical maximum of the quantum yield is 1.0.
However, most of the analytes do not have native fluorescence and thereforethe use of this detection method involves attaching fluorescent probe molecules tothe analyte. Most fluorescent probes can be designed to contain a reactive moietycapable of coupling to a specific functional group of a biomolecule. With this deri-vatization procedure it is possible to enhance the selectivity of the detection. [162]Common fluorescent labels in capillary electrophoresis and their properties andapplications are listed in Table 15.

1. Introduction
48
Table 15. Common fluorescent labels used in CE.
Label MW(g/mol)
Excitation/emissionmaximum
wavelength(nm)
Quantumyield [164] Reactivity Ref.
8-Aminonaphtalene-1,3,6-trisulfonic acid(ANTS)
427.34 356/512 na 7 200 carbohydrates [168]
8-Aminopyrene-1,3,6-trisulfonic acid (APTS) 523.40 420/500 na 19 000 carbohydrates [165]
Fluorescamine 278.26 391/464 0.11 7 800 primary aliphaticamines [165]
Fluorescein 332.31 490/514 0.93 93 000 amines
Fluoresceinisothiocyanate (FITC) 389.38 492/518 na 77 000 amines [165,
169]
Oregon green®succinimidyl ester 5-isomer
509.38 495/521 na 76 000primary andsecondaryaliphatic amines
Oregon green®succinimidyl ester 6-isomer
509.38 496/516 na 82 000primary andsecondaryaliphatic amines
1-Pyrenyldiazomethane(PDAM) 242.27 340/375 na 41 000 carboxylic acid [165]
MW molecular weight
na not available
molar absorption coefficient (in cm-1M-1)
Oregon green™ 488 succinimidyl ester (OG-SE) used in the Publication IV is thefluorinated analogue of fluorescein. The molecular structure of OG-SE ispresented in Figure 10A. Conjugates of Oregon green fluorophores are morephotostable than those of fluorescein and are not as pH sensitive. The excitationand emission maximums wavelengths of the label are at 496 nm and 524 nm,respectively, (Figure 10B) and are well suited for detection with argon-ion laser.Reaction of OG-SE with primary and secondary amines creates stable amide andimide linkages, respectively, and the reaction occurs rapidly in mild conditions.[170]

1. Introduction
49
Figure 10. A) Structure of Oregon green® 488 succinimidyl ester [167], and B)Absorption and fluorescence emission spectra of Oregon Green® 488 [164]. Theblue line is absorption and the red line is emission.

2. Aims of the study
50
2. Aims of the study
The overall object of this study was to develop novel analytical methods tomeasure and control the productivity of microorganisms in bioreactors duringcultivations. For this purpose, capillary electrophoresis with UV- and LIF-detectionwas used to assist research of industrial biotechnology and validation ofbiotechnological manufacturing processes. In addition, an online CE system wasassembled from modified commercial capillary electrophoresis device and an in-house constructed flow-through sample vial.
Specifically the aims were:
- to develop CE methodologies and technologies to study carboxylic acidsthat are present in bioprocesses in both offline (I) and online (III) mode
- to develop CE methodologies to study phenolic compounds with inhibito-ry effects on bioprocesses (II)
- to develop CE methodologies to study the consumption of amino acids byyeast during beer fermentation (IV).

3. Materials and methods
51
3. Materials and methods
3.1 Chemicals and materials
All the materials and chemicals that were used in this study are summarized inTable 16.
Table 16. Chemicals and materials used in this study.
Compound Manufacturer/supplier Comments Publ.
18-crown-6-ether (18C6) Sigma-Aldrich BGE additive, surfactant II, IV
2,3-Pyridinecarboxylic acid(2,3-PDC)
Sigma-Aldrich BGE additive, UV absorbing reagentfor indirect UV detection I
3-[(3-Cholamidopropyl)-dimethylammonio]-2-hydroxy-1-propanesulfonate(CHAPSO)
Sigma-Aldrich BGE additive, surfactant II, IV
4-Hydroxybenzoic acid Sigma-Aldrich Standard II
Acetic acid Fluka Standard I
Acetoguaiacone Sigma-Aldrich Standard II
Acrodisc® GHP syringe filter Pall Life Science 0.45 µm, hydrophilic polypropanemembrane, for filtration of BGE I–IV
L-Alanine Merck Standard IV
Ammonia Merck 25%, pH adjustment I
Ammonium acetate Sigma-Aldrich BGE salt II
Arabonic acid VTT Standard I
L-Arginine Fluka Standard IV
L-Asparagine Fluka Standard IV
L-Aspartic acid Fluka Standard IV
Benzoic acid Fluka Standard II
Calcium chloride dihydrate Riedel-de Haen BGE additive, complex forming agent I
Cinnamic acid Sigma-Aldrich Standard II
Citric acid (monohydrate) Merck Standard I
Coniferyl aldehyde Sigma-Aldrich Standard II
p-Coumaric acid Sigma-Aldrich Standard II

3. Materials and methods
52
Compound Manufacturer/supplier Comments Publ.
-Cyclodextrin Sigma-Aldrich BGE additive, surfactant II, IV
L-Cysteine Fluka Standard IV
Dimethylsulfoxide (DMSO) Sigma-Aldrich Solvent for fluorescent label IV
eCAP amine capillary Beckmann Coulter Permanently coated amine capillary,i.d. 50 µm, o.d. 360 µm III
Ethanol Altia 99.5%, solvent for standards II
Formic acid Merck Standard I
Fused silica capillary Teknolab i.d. 50 µm, o.d. 360 µm I, II, IV
Galactaric acid Fluka Standard I
Galacturonic acid Fluka Standard I
Gluconic acid (lactone) Fluka Standard I
L-Glutamic acid Fluka Standard IV
L-Glutamine Fluka Standard IV
L-Glycine Merck Standard IV
Glycolic acid Fluka Standard I
L-Histidine Fluka Standard IV
Isocitric acid Sigma-Aldrich Standard I
L-Isoleucine Fluka Standard IV
-Ketoglutaric acid Sigma-Aldrich Standard I
Lactic acid (lithium salt) Fluka Standard I
L-Leucine Fluka Standard IV
L-Lysine Fluka Standard IV
Magnesium chloridehexahydrate
Riedel-de Haen BGE additive, complex forming agent I
Maleic acid Sigma-Aldrich Standard I
Malic acid Sigma-Aldrich Standard I
Malonic acid Merck Standard I
Methanol Fluka LC-MS grade, solvent for standards II
Methanol Rathburn BGE additive I
L-Methionine Fluka Standard IV
Myristyltrimethyl-ammoniumhydroxide (MTAH) Waters BGE additive, surfactant and EOF
modifier I
Oregon green® 488succinimidyl ester
Molecular probesInc. Fluorescent label IV
Oxalic acid Sigma-Aldrich Standard I
Phenol Sigma-Aldrich Standard II
L-Phenylalanine Merck Standard IV
1,4-Piperazinediethanesulfonic acid (PIPES) Sigma-Aldrich Standard III
L-Proline Fluka Standard IV
Propionic acid Fluka Standard I
L-Serine Fluka Standard IV

3. Materials and methods
53
Compound Manufacturer/supplier Comments Publ.
Sodium acetate Sigma-Aldrich BGE salt II
Sodium dodecyl sulfate(SDS)
Sigma-Aldrich BGE additive, surfactant II, IV
Sodium hydroxide,0.1M solution
FF-Chemicals Ab Capillary conditioning I–IV
Sodium tetraboratedecahydrate
Sigma-Aldrich BGE salt II, IV
Succinic acid Sigma-Aldrich Standard I
Syringaldehyde SAFC Standard II
L-Threonine Fluka Standard IV
L-Tryptophan Fluka Standard IV
L-Tyrosine Merck Standard IV
DL-Valine Sigma-Aldrich Standard IV
Vanillic acid Fluka Standard II
Vanillin Sigma-Aldrich Standard II
Water Millipore Milli-Q purified water for solvent andcapillary conditioning I–IV
Xylonic acid (calcium salt) VTT Standard I
3.2 Instruments
3.2.1 Capillary electrophoresis
All capillary electrophoretic analyses in Publications I–IV were made with theP/ACE MDQ capillary electrophoresis system (Beckmann Coulter Inc., Fullerton,CA, USA). The data were collected and processed with 32Karat Software(Beckmann Coulter Inc.). The CE device was equipped with a photodiode arraydetector (Beckmann Coulter Inc.) with UV wavelength range 190–600 nm inPublications I–III, and with laser-induced fluorescence detection (BeckmannCoulter Inc.) in Publication IV. The LIF detector had an argon-ion laser with488 nm excitation and 520 nm emission wavelengths.
3.2.2 Online analysis system
In Publication III, an online capillary electrophoresis system (Figure 11) was as-sembled from a peristaltic pump with an 8-channel pump head (MCP, IsmatecLabortechnik Analytik, Zurich, Switzerland), a 3-way solenoid-operated pinch valve(Bio-Chem valve, Boonton, NJ, USA), a cross-flow filter (A-Sep, Applikon, Schie-dam, the Netherlands) with 45 mm diameter filter membranes (GVWP, Millipore)of 0.22 µm pore size, a 500-µL flow-through sample vial made in-house and asingle-channel peristaltic pump (Watson Marlow 101U/R, Falmouth, England).

3. Materials and methods
54
Silicone tubing (Saint-Gobain, Charny, France) with 0.8 mm inner diameter and2.4 mm outer diameter was used for fluid lines. Pharmed tubing (Saint-Gobain)with 1.6 mm inner diameter and 3.2 mm outer diameter was used in the pumps. ANational Instruments USB-6009 data acquisition device (National Instruments,Austin, TX, USA) was used for sending analog voltage signals to the 8-channelperistaltic pump, for sending digital output signals to an additional relay supplying24 V to the pinch valve, and for receiving digital input signals from the CE instru-ment. National Instruments LabVIEW software (version 8.5) was used to developcontrol software for the automated measurement sequence. Timing of the sam-pling was controlled by the CE software and the sampling and filtration sequencewas started on the basis of the digital output signal sent from the CE instrument.
Figure 11. Schematic view of online capillary electrophoresis system. [III]
In order to enable online capillary electrophoretic analysis of carboxylic acids, acommercial capillary electrophoresis device was modified and a flow-through vial(Figure 12A) of 500 µL volume was in-house engineered for this project. The vialwas made from a solid PEEK block by drilling, and inserted inside a plastic vialholder (Beckmann Coulter, Figure 12B and C). The flow-through vial was placedto the inlet side buffer tray inside the CE device from where the injections wereperformed. It was essential to make the fluid flow from the bottom of the vialupwards because this decreased the possibility of air bubbles to become trappedin the vial, which in turn would not be favorable in sample injection to capillaryelectrophoresis. Furthermore, with this approach the surface height of the liquidsample remains constant during the analysis.

3. Materials and methods
55
Figure 12. A) Schematic figure of the flow-through sample vial with dimensions.Picture of the sample vial B) without and C) with cap. [III]
The sampling sequence of the online CE system is presented in Table 17. Thesampling duration was determined by measuring the time needed for the sampleto reach the flow-through vial, and the liquid volume of vial was changed at least 5times. The sampling started when the Labview software received a trigger signalfrom the CE device.
Table 17. Sampling sequence.
Task Duration (s) Notes
Start 1 Start of sequence
Wait 1 Sequence is halted and waits for a trigger signal from CE device
Sampling 200 Valve is opened and pump is turned on, liquid flow is from bioreactortoward flow-through vial through the cross-flow filter
Break 400 Pump off, sample injection to the capillary is executed during this taskaccording to the CE method
Wash 300 Valve is closed and pump is turned on, liquid flow is from wash bottletoward flow-through vial through the cross-flow filter; tubing, filter andflow-through vial are cleaned
Pump off 1 Pump is turned off
End 1 Sequence ends and next run is started
3.2.3 Other instrumentation
All pH measurements were performed with a Knick 766 Laboratory pH meter (Ber-lin, Germany) equipped with a Mettler Toledo InLab® Routine pH electrode. Thecalibration was performed with commercial buffers of pH 4.00, 7.00 and 10.00 (FF-Chemicals Ab, Haukipudas, Finland).

3. Materials and methods
56
3.3 Methods
Before all CE analyses the BGE was degassed by ultrasound for 10 minutes andfiltered through a 0.45 m Acrodisc GHP syringe filter (Pall Life Science, AnnArbor, USA). Detailed descriptions of method development and capillaryconditioning are presented in Publications I–IV.
3.3.1 CZE with indirect UV detection for studying carboxylic acids
In Publication I, the BGE was prepared with 20 mM 2,3-PDC, 0.3 mM MTAH,30 mg/L Ca2+ and 30 mg/L Mg2+ in methanol: water (10:90, v/v). The pH of thesolution was adjusted to 9 with 25% ammonia. Fused silica capillary with totallength 80 cm (70 cm to the detector) was used. Standards and samples wereinjected by using 0.5 psi pressure for 15 s. Separation was carried out at -20 kV(reversed polarity) at a constant capillary temperature of 25 °C. Indirect UV detec-tion was at 254 nm wavelength. Samples were centrifuged at 10 000 rpm for5 minutes and diluted with Milli-Q purified water 5-fold, 100-fold and/or 250-fold.
3.3.2 CZE with direct UV detection for studying phenolic acids
In the optimized method of Publication II, the BGE was prepared with 40 mM sodi-um tetraborate and 40 mM 18-crown-6-ether in milli-Q purified water. The pH ofthe solution was 9.0. Standards and samples were injected by using 0.5 psi pres-sure for 5 s. Separation was carried out at +30 kV at a constant capillary tempera-ture of +20 °C. Fused silica capillary with total length 50 cm (40 cm to the detec-tor) was used. Sample cartridge temperature was set at +10 °C. Direct UV detec-tion was at 200 and 254 nm. For the determination and quantification of phenols,vanillin, coumaric acid, vanillic acid, benzoic acid and cinnamic acid, 200 nm wasused. For the determination and quantification of coniferyl aldehyde, acetoguai-acone, syringaldehyde and 4-hydroxybenzoic acid, the detection wavelength was254 nm. The samples were centrifuged at 10 000 rpm for 5 minutes and analyzedwithout dilution or diluted 2-fold with Milli-Q purified water.
3.3.3 Online CE analysis of carboxylic acids
The online and offline CE analyses of Publication III were performed with a BGEthat consisted of 20 mM 2,3-PDC with 80 mg/L Ca2+, 40 mg/L Mg2+ and 10% (v/v)IPA (pH 9 adjusted with 25% ammonia). Negative voltage was set to –20 kV,capillary temperature was 25 °C, and detection wavelength was 254 nm. Aminecoated eCAP silica capillary with total length 60 cm (50 cm to the detector) wasused. Injection was performed with 0.5 psi vacuum for 5 s.
The sampling was performed both online and offline. In the K. lactis cultivation,the online sampling was performed once an hour until 73 hours and thereafter

3. Materials and methods
57
every two hours until the cultivation was ended at 137 hours. In the S. cerevisiaecultivation, the online sampling was performed once an hour until the cultivationwas ended at 64 hours. The samples were drawn from the bioreactor and filteredwith a cross-flow filter using a 0.22 m pore size filter membrane to provide cell-free sample. The sample was diluted 5-fold with sterile Milli-Q purified wateronline. Then the sample was injected to the CE device from the flow-through sam-ple vial that was placed in the inlet side of the CE buffer tray. During the analysis,all of the lines including the sample vial were flushed with sterile milli-Q purifiedwater. The sample was injected about 8 minutes after the sampling was started.The total sample volume removed from the reactor was approximately 9 mL persample. In order to correct errors of sampling, dilution and analysis, results werecorrected with internal standards that were added to the cultivation media (1,4-Piperazinediethane sulfonic acid, PIPES) and to diluent (gluconic acid). Offlinesamples were drawn manually from the bioreactor, centrifuged 10 min at 3 000 rpm(Biofuge Stratos, Heraeus Instruments, Osterode, Germany), diluted 5-fold (v/v) withMilli-Q purified water and frozen. The volume of the samples was 3 mL. The sam-ples were analyzed with CE for carboxylic acids and with HPLC for sugars and alco-hols. A total of 97 online and 41 offline samples were collected from the K. lactiscultivation, and 62 online and 23 offline samples from the S. cerevisiae cultivation.
3.3.4 MEKC with LIF detection for studying amino acids
In the optimized analysis method of Publication IV the BGE consisted of 50 mMtetraborate, 30 mM SDS and 20 mM 18C6, pH 9.0. Standards and samples wereinjected by using 0.5 psi pressure for 10 s. The analysis voltage and temperaturewere +30 kV and 15 °C, respectively. Total capillary length was 60 cm with 50 cmto the detector. Detection with LIF was set to 488 nm excitation and 520 nm emissionwavelengths.
The samples were centrifuged at 10 000 rpm for 5 minutes and diluted prior toanalysis. The OG-SE derivatization procedure was performed by adding 10 µL of2 mM OG-SE solution, 5 µL of 5-fold diluted sample and 35 µL of 30 mM tetra-borate buffer (pH 9.0) to an Eppendorf tube. The reaction mixture was vortexed for10 s and microcentrifuged for 20 s before leaving it at room temperature for thereaction to proceed. After 15 minutes, 5 L of the sample was diluted with 395 µLof 30 mM tetraborate buffer (pH 9.0) and analyzed with the optimized analysismethod. The dilution was 400-fold.
3.3.5 Bioreactor cultivations
All cultivations were batch cultivations using wheat straw hydrolysate (Publication I),synthetic spruce hydrolysate (Publication II), spruce hydrolysate (Publication II),YNB-medium (Publication III), YDB-medium (Publication III) or wort (Publication IV)as cultivation media. Microorganisms were Gluconobacter oxydans (Publication I),

3. Materials and methods
58
Saccharomyces cerevisiae (Publications II–IV) and Kluyveromyces lactis (Publication III).Detailed descriptions of the bioreactor cultivations are presented in Publications I–IV.
3.3.6 Other analysis techniques
In Publications III and IV the bioreactor samples were also analyzed by HPLC inorder to determine the concentrations of carbohydrates and alcohols. A WatersAlliance 2690 HPLC system (Waters, Milford, MA, USA) with Waters 2487 dualwavelength UV (210 nm) detector and Waters 2414 differential refractometer wereused with an injection volume of 20 µL in Publication III and 10 µL in PublicationIV. In Publication III, the columns used were an Aminex HPX-87H Organic AcidColumn (300 mm x 7.8 mm, Bio-Rad, Hercules, CA, USA) connected to a FastAcid Analysis Column (100 mm x 7.8 mm, Bio-Rad). In Publication IV, the columnswere an ICSep ION-310 Fast Analysis Column (150 mm x 6.5 mm, Transgenomic,Inc., Omaha, NE, USA) connected to an ICSep ICE-ORH-801 Column (300 mm x6.5 mm, Transgenomic). The eluent was 5 mM H2SO4 (Titrisol, Merck), flow rate0.5 mL/min and analysis temperature +55 °C. In Publication IV, cell density andcell dry weight were determined. The cell density was determined as the opticaldensity of the sample and it was measured with a Shimadzu UV-1201spectrometer (Kyoto, Japan) at 600 nm (= OD600). The cell dry weight (CDW) wasdetermined by filtering 20 mL of sample through a tared filter paper, washing itwith distilled water and drying it in an oven (105 °C) for at least 16 hours. After thatthe cells were weighed with the filtration paper and the CDW was calculated.

4. Results and discussion
59
4. Results and discussion
4.1 Determination of carboxylic acids by CZE with indirect UVdetection
The aim of Publication I was to develop a CE method for the simultaneous separa-tion, identification and quantification of carboxylic acids that are potentially presentin microbial cultivations. The optimized analysis method was used to monitor car-boxylic acid production in Gluconobacter oxydans fermentation of wheat strawhydrolysate.
4.1.1 Method development
To improve the separation efficiency of anionic analytes in CE, it is essential toapply a negative voltage during analysis to shorten the analysis times. In addition,EOF modifier must be used to invert the direction of EOF towards the detector.[64] There are a wide variety of EOF modifiers available and myristyltrime-thylammonium hydroxide (MTAH) used in this study is a common cationic surfac-tant in the analysis of carboxylic acids. [64, 77] Other possible cationic surfactantsinclude tetradecyltrimethylammonium bromide [65] and cetyltrimethylammoniumbromide [55, 71, 72, 74, 78, 79, 81]. The surfactants are added to the BGE in lowconcentrations in order to prevent the conversion of CZE to MEKC.
Aliphatic carboxylic acids have no or very low UV absorbance because theylack a chromophore in their structure. The use of indirect UV detection by additionof UV absorbing chemical to the BGE enables the analysis without the derivatiza-tion procedure. As a result of the UV absorbing chemical, the detector is able tomonitor high UV background signal during analysis and the analytes without UVabsorption are seen as negative peaks in the electropherogram. There are severalchemicals available for this purpose such as potassium hydrogen phthalate [78,79], 1,3,5-benzenetricarboxylic acid [76], 2,3-pyridinedicarboxylic acid (2,3-PDC)[77], 2,6-pyridinecarboxylic acid [55, 72, 81] and trimellitic acid [63]. 2,3-PDC waschosen as UV absorbing chemical on the basis of previous studies of the researchgroup. [77] As presented in Figure 13, 20 mM concentration resulted in the bestseparation efficiency and the most stable baseline.

4. Results and discussion
60
Figure 13. Effect of 2,3-PDC concentration on the separation. BGE 0.3 mMMTAH, 30 mg/L Ca2+, 30 mg/L Mg2+, 10% MeOH (v/v), and A) 20 mM 2,3-PDC, B)25 mM, C) 30 mM, D) 40 mM, and E) 50 mM, pH 9.0. Other conditions: negativevoltage –20 kV, capillary temperature 25 °C, sample injection 0.5 psi 15 s, andindirect UV detection at 254 nm. Unpublished data.
Cations of alkali earth metals have strong tendencies to form partially dissociatedcomplexes in solution with anions of carboxylic acids and other weak acids. Theaffinity of this association tends to increase with the number of carboxylic acidgroups of the acid anion, and the tendency is higher with aliphatic acids than witharomatic acids. [171] Formation of these metal complexes is generally rapid, andthe relatively weak complexes are in equilibrium with the noncomplexed compo-nents. This type of complex formation is widely exploited in chromatography toachieve selectivity. The most important parameters affecting complexation equilib-rium are type and concentration of the metal and the pH of the BGE. [172]
It has been noted that the use of metals in BGE decreases the efficiency andreproducibility of the analysis. Metals can absorb to the silanol groups of thecapillary wall, thus lowering zeta potential and decreasing electroosmotic flow. Inaddition, the complex formation of the analytes with the metals attached to silanolgroups causes peak broadening and decrease in efficiency. The use of EOFmodifier in BGE helps to prevent this undesirable phenomenon. [169]
The addition of methanol, up to 20%, to the BGE reduces EOF which results inincreased migration times and resolution. In addition, due to its lower dielectricconstant than that of water, it promotes complex formation reactions and theformation of highly complex compounds. This results in additional possibilities forseparation improvement. [169]
The optimized method was able to resolve 18 different carboxylic acids that arepotentially present in bioprocess cultivations. Different microorganisms havedifferent metabolic routes and various substrates are used cultivations, and

4. Results and discussion
61
therefore the number of products is high. In addition, many side-products may alsobe formed. Therefore, it was essential that the method was able to resolve asmany carboxylates as possible even though they are not present in the samplessimultaneously. After Publication I was published, 4 carboxylic acids were addedto the method. The separation of 22 carboxylates is presented in Figure 14.
Figure 14. Electrophoregram of the optimized analysis method. BGE 20 mM 2,3-PDC, 0.3 mM MTAH, 30 mg/L Ca2+, 30 mg/L Mg2+, and 10% MeOH (v/v), pH 9.0.Other conditions: negative voltage –20 kV, capillary temperature 25 °C, sampleinjection 0.5 psi 15 s, and indirect UV detection at 254 nm. Peak assignments: 1)formate, 2) fumarate, 3) malonate, 4) maleinate, 5) -ketoglutarate, 6) succinate,7) oxalate, 8) malate, 9) adipic acid, 10) isocitrate, 11) galactarate, 12) acetate,13) glycolate, 14) glyoxylate, 15) propionate, 16) lactate, 17) levulinate, 18) citrate,19) xylonate, 20) arabonate, 21) gluconate, and 22) galacturonate. Unpublished data.
4.1.2 Analysis of cultivation samples
The optimized analysis method was used for the analysis of cultivation samplesfrom Gluconobacter oxydans culture on wheat straw hydrolysate. Wheat strawhydrolysate is rich in xylose (39 g/L) but also contains some glucose (5.3 g/L). Inaddition, high concentrations of formic, malic and acetic acids were analyzed fromthe hydrolysate but they did not have an inhibitory effect on the cultivation. Elec-trophoregrams of samples are presented in Figure 15.

4. Results and discussion
62
Figure 15. Electrophoretic separation of carboxylic acids in a G. oxydans cultiva-tion. Fermentation time: (A) 0h, (B) 19.8 h, and (C) 119.1 h. Peak assignments: 1.formate, 2. succinate, 3. malate, 4. acetate, 5. lactate, 6. xylonate, and 7. glu-conate. Analysis conditions as described in Figure 14. [Publication I]
The production yield of xylonic acid from xylose was 45%, and that of gluconicacid from glucose was 96%. As presented in Figure 16, the production of glu-conate was completed within 20 hours but the production of xylonate continued forover twice as long.
Figure 16. Product formation rate of xylonate and gluconate during G. oxydanscultivation on wheat straw hydrolysate. [Publication I]

4. Results and discussion
63
4.2 Determination of phenolic compounds by CZE-UV
In Publication II, a CE method for the analysis of phenolic compounds in biopro-cesses was developed. The optimized method was used to study the concentra-tions of phenolic compounds during Saccharomyces cerevisiae cultivations insynthetic inhibitor mix media and in spruce hydrolysate. The composition of syn-thetic inhibitor mix is presented in Table 18. The concentrations together amountto a 100% inhibitor mix.
Table 18. Synthetic inhibitor composition of spruce hydrolysate. [92]
Compound Concentration (mg/L)5-Hydroxymethylfurfural (5-HMF) 3400
Furfural 1100
Acetic acid 6300
Formic acid 1200
Levulinic acid 2400
Hydroquinone 20
Vanillin 140
Syringaldehyde 120
Coniferyl aldehyde 50
Cinnamic acid 1
4-Hydroxybenzoic acid 20
Acetoguaiacone 20
4.2.1 Method development
Sodium acetate, ammonium acetate and sodium tetraborate were studied asbackground electrolyte chemicals, and sodium tetraborate was found to be themost suitable one. Tetraborate ion is able to form complexes with certain analytescontaining hydroxyl groups and to produce negatively charged borate complexeswhich enhance the separation efficiency. [173]
The analysis of phenolic compounds present in hydrolysates is very difficultwith UV detection. The concentrations of analytes are low and the matrix consistsof a wide variety of UV-absorbing compounds. The separation efficiency wasenhanced with the use of MEKC. Several surfactants were studied to find asuitable one for this application. The effects of sodium dodecyl sulfate (SDS), -cyclodextrin, 3-[3-Cholamidopropyl)-dimethylammonio]-2-hydroxy-1-propane-sulfonate(CHAPSO) and 18-crown-6-ether (18C6) additions were tested. SDS and CHAPSOhad some effect on the separation and -cyclodextrin hampered the analysis but18C6 improved the separation efficiency significantly. The effect of 18C6 additionto the BGE is presented in Figure 17. The addition of 18C6 does not provideMEKC, and so the analysis method was CZE.

4. Results and discussion
64
Figure 17. Effect of 18C6 addition to BGE. BGE 40 mM tetraborate, pH 9 with A)10 mM, B) 20 mM C) 30 mM, D) 40 mM and E) 50 mM 18C6. Other conditions:voltage +14 kV, capillary temperature 20 °C, total capillary length 30 cm (20 cm tothe detector), sample injection 0.5 psi 5 s, and UV detection at 200 nm. Peakassignments: 1) phenols, 2) coniferyl aldehyde, 3) acetoguaiacone, 4) syringalde-hyde, 5) vanillin, 6) ferulic acid, 7) cinnamic acid, 8) catechol, 9) benzoic acid, 10)p-coumaric acid, 11) vanillic acid, 12) 4-hydroxybenzoic acid, 13) caffeic acid, and14) protocatechuic acid. Unpublished data.
After the most potential electrolyte solutions were found, the capillary length wastested to enhance the separation efficiency. Different separation voltages werealso tested. The optimized separation of 14 different phenolic compounds is pre-sented in Figure 18.

4. Results and discussion
65
Figure 18. Separation of 14 phenolic compounds. BGE 40 mM tetraborate with40 mM 18C6, pH 9.0. Other analytical conditions: voltage +30 kV, temperature20 °C, capillary length 50 cm (40 cm to the detector), injection 0.5 psi 5 s anddetection at 200 and 254 nm wavelengths. Peak assignments (andconcentrations): 1) phenols (20 mg/L), 2) coniferyl aldehyde (20), 3)acetoguaiacone (20), 4) syringaldehyde (20), 5) vanillin (10), 6) ferulic acid (20), 7)cinnamic acid (10), 8) catechol (5), 9) p-coumaric acid (20), 10) vanillic acid (15),11) benzoic acid (10), 12) 4-hydroxybenzoic acid (10), 13) caffeic acid (20), and14) protocatechuic acid (10). Unpublished data.
4.2.2 Analysis of cultivation samples
Four cultivations were performed and the samples were analyzed with the opti-mized method. Three of the cultivations were made with synthetic spruce hydroly-sate medium in which the inhibitory compounds were added to the media in con-centrations simulating real spruce hydrolysate. Synthetic medium is used whenindividual inhibitor conditions need to be regulated, and their effects on the organ-ism and on the overall bioprocess are studied. [174] An electropherogram of thecultivation #1 in which the final concentration of the inhibitor mix was 50% is pre-sented in Figure 19: the concentrations of the 100% inhibitor mix were presentedin Table 18 above.

4. Results and discussion
66
Figure 19. Electrophoretic separation of phenolic compounds present in cultiva-tion 1 with synthetic medium at A) 0h, B) 2h, C) 19h, D) 23h, and E) 48h. Peakassignments: (1) phenols, (2) coniferyl aldehyde, (3) acetoguaiacone, (4) syringal-dehyde, (5) vanillin, (6) cinnamic acid, and (7) 4-hydroxybenzoic acid. Analysisconditions as described in Figure 18. [Publication II]
In cultivation #1 the inhibitor concentration was 50% and the initial biomass wasapproximately 0.15 g/L. As illustrated in Figure 20, the concentrations of vanillinand coniferyl aldehyde decreased during the cultivation whereas the concentrationof phenols increased until the concentration of vanillin was below the detectionlimit. Furthermore, the glucose was consumed in less than 20 hours. However, theyeast was able to consume the xylose only slightly during the cultivation. Theconcentration of syringaldehyde remained approximately constant throughout thecultivation.
Figure 20. Diagram of cultivation #1 results. [Publication II] HPLC results areunpublished data.

4. Results and discussion
67
In cultivation #2 the inhibitor concentration was decreased to 20%, but the initialbiomass was same as in cultivation #1, 0.15 g/L. Figure 21 shows that the concen-trations of vanillin, coniferyl aldehyde and acetoguaiacone decreased below thedetection limit. The concentration of these phenols increased until other phenoliccompounds were not detectable. The glucose was consumed in ca. 15 hourswhich was faster than in cultivation #1. The yeast was able to utilize xylose untilthe end of cultivation, although the consumption rate was not high. The concentra-tion of syringaldehyde remained unchanged throughout the cultivation.
Figure 21. Diagram of cultivation #2 results. [Publication II] HPLC results areunpublished data.
The inhibitor mix concentration in cultivation #3 was the same as in cultivation #2,but the initial biomass concentration was increased 10-fold to 1.5 g/L. The glucoseutilization rate was about 5 hours and the xylose was consumed in 20 hours. Fig-ure 22 presents that the concentrations of vanillin and coniferyl aldehyde de-creased below their detection limits as in other cultivations and the concentrationof phenols increased, although the concentration was two times lower and it start-ed to decrease after 15 hours. The concentration of syringaldehyde remainedunchanged.
Figure 22. Diagram of cultivation #3 results. [Publication II] HPLC results areunpublished data.

4. Results and discussion
68
It can be concluded from cultivations #1–3 that the concentrations of inhibitors andof yeast biomass both affected the xylose utilization rate of the yeast. In addition,the ethanol production rate was also affected by the inhibitors and yeast biomass.
Cultivation #4 was performed in spruce hydrolysate which is a harsher mediumfor the cultivation than synthetic hydrolysate because it contains more compoundswith possible synergistic inhibitory effects on microorganisms. Electropherogramsof 4 time points of the cultivation are presented in Figure 23, in which a morecomplex background than in the cultivations on synthetic hydrolysate can be seen.
Figure 23. Electropherogram of the phenolic compounds present in cultivation 4with spruce hydrolysate at A) 0.3h, B) 4h, C) 49h, and D) 88h. Peak assignments:(1) phenols, (2) coniferyl aldehyde, (3) syringaldehyde, (4) vanillin, (5) p-coumaricacid, (6) vanillin acid, (7) benzoic acid, and (8) 4-hydroxybenzoic acid. Analysisconditions as described in Figure 18. [Publication II]
More phenolic compounds were observed in spruce hydrolysate, and probablybecause of the harshness of the cultivation media, the results differed from thoseof the synthetic inhibitor mix cultivations. The concentrations of coniferyl aldehydeand vanillin were decreased, and, surprisingly, in addition to the concentration ofphenols, the concentration of syringaldehyde was also increased. The concentra-tions of p-coumaric, vanillic, benzoic and 4-hydroxybenzoic acids were approxi-mately constant. A diagram of the cultivation #4 results is presented in Figure 24.

4. Results and discussion
69
Figure 24. Diagram of cultivation #4 results. [Publication II]
4.3 Online analysis of carboxylic acids by CZE with indirectUV detection
In Publication III, the aim was to assemble an online CE system for the monitoringof carboxylic acid production by Kluyveromyces lactis and Saccharomyces cere-visiae during bioreactor cultivation. A flow-through vial was designed and con-structed to enable the online analysis with commercial CE device.
4.3.1 Method development
As in Publication I, 2,3-PDC at the optimized concentration was used asbackground electrolyte and UV absorbing agent in this study.
When using online CE, it is essential that the analyses remain repeatable andreliable for several days. Drawbacks related to the dynamic coating of the capillaryinclude potential interferences between dynamic coating agent and analytes, andremoval of the coating agent from the capillary. [175] During routine analysis ofcarboxylic acids with the analysis method described in Publication I, occasionalirreproducibility of the dynamic capillary coating was observed. Furthermore,drifting of migration times occurred especially when the same capillary was usedfor some time. Therefore, in order to reach the performance needed for onlineanalysis of carboxylic acids, an amine-coated eCAP capillary was used to obtainhigher analysis precision. The capillary utilizes polyamine-modified surface andbecause of the strong cationic charge that is created on the capillary wall, the EOFis reversed, and negative voltage must be applied. Furthermore, the analysis timeis shorter than with untreated capillary. [158] As a result, the repeatability of

4. Results and discussion
70
migration was improved and the analyte zones were narrow which led to lowerquantification limits than in Publication I.
Because of the permanently coated capillary, the concentrations of Ca2+ andMg2+ were re-optimized. The effect of Ca2+ addition on the BGE is presented inFigure 25, where it can be observed that the addition enhanced the separation ofsuccinate and malate, and of acetate and glycolate. It can be noted from theelectropherogram that the greatest complex formation effect of Ca2+ was withmalate, glycolate and gluconate because retardation of migration times can beseen. Furthermore, the addition resulted in better peak shapes.
Figure 25. The effect of Ca2+ addition on the BGE performance. BGE 20 mM 2,3-PDC (pH 9) and A) 0 mg/L, B) 10 mg/L, C) 20 mg/L, D) 30 mg/L, E) 40 mg/L, F)50 mg/L, G) 60 mg/L, H) 70 mg/L, I) 80 mg/L, J) 90 mg/L, and K) 100 mg/L Ca2+.Peak assignments: 1. formate; 2. succinate; 3. malate; 4. acetate; 5. glycolate; 6.glyoxylate; 7. lactate; and 8. gluconate. The concentration of the analytes was50 mg/L. Other analysis conditions: amine coated eCAP silica capillary with 50 µmI.D. and 50/60 cm length, separation voltage –20 kV and temperature 25 °C,injection with 0.5 psi vacuum for 5 s. [Publication III]
After Ca2+ was optimized, the concentration of Mg2+ was studied. It was noted thatMg2+ improved the separation especially between acetate and glycolate, andmade the method slightly faster as presented in Figure 26. However, in concentra-tions above 50 mg/L the complex formation with malate became a drawback andthe peak started to diminish. Furthermore, the gluconate peak started to becomesmaller with higher Mg2+ concentration.

4. Results and discussion
71
Figure 26. The effect of Mg2+ addition on the BGE performance. BGE 20 mM 2,3-PDC with 80 mg/L Ca2+ (pH 9) and A) 0 mg/L, B) 10 mg/L, C) 20 mg/L, D)30 mg/L, E) 40 mg/L, F) 50 mg/L, G) 60 mg/L, H) 70 mg/L, I) 80 mg/L, J) 90 mg/L,and K) 100 mg/L Mg2+. Peak assignments: 1. formate; 2. succinate; 3. malate; 4.acetate; 5. glycolate; 6. glyoxylate; 7. lactate; and 8. gluconate. The concentrationof the analytes was 50 mg/L. Other analysis conditions as described in Figure 25.[Publication III]
Methanol was added to the BGE but it was noted (Figure 27) that in theelectropherogram the glyoxylate peak started to broaden and made theidentification and data processing difficult especially in low concentrations. Theaddition of alcohol had a significant effect on the separation because of itsretardation effect on the analytes, and therefore the addition of isopropanol wastested (Figure 28). Addition of isopropanol in 10% (v/v) quantity enabled betterresolution for the separation.

4. Results and discussion
72
Figure 27. The effect of methanol addition on the separation efficiency. BGE 20 mM2,3-PDC, 80 mg/L Ca2+ and 40 mg/L Mg2+ (pH 9) with A) 0%, B) 5%, C) 10%, D)15%, and E) 20% methanol (v/v). Peak assignments: 1. formate; 2. succinate; 3.malate; 4. acetate; 5. glycolate; 6. PIPES; 7. glyoxylate; 8. lactate; 9. gluconate;and 10. xylonate. The concentration of the analytes was 20 mg/L, except PIPES,gluconate and xylonate 50 mg/L. Other analysis conditions as described in Figure25 [Publication III]
Figure 28. The effect of isopropanol addition on the separation efficiency. BGE 20 mM2,3-PDC, 80 mg/L Ca2+ and 40 mg/L Mg2+ (pH 9) with A) 0%, B) 5%, C) 10%, D)15%, and E) 20% isopropanol (v/v). Peak assignments: 1. formate; 2. succinate; 3.malate; 4. acetate; 5. glycolate; 6. glyoxylate; 7. PIPES; 8. lactate; 9. gluconate;and 10. xylonate. The concentration of the analytes was 20 mg/L, except PIPES,gluconate and xylonate 50 mg/L. Other analysis conditions as described in Figure25. [Publication III]

4. Results and discussion
73
4.3.2 Online analysis of cultivations
The optimized analysis method was used to analyze carboxylic acid productiononline during K. lactis and S. cerevisiae cultivations. The K. lactis cultivation lastedfor almost 140 hours, and a total of 97 online and 41 offline samples were collected.The separation of carboxylates during the cultivation is presented in Figure 29.
Figure 29. Online analysis of carboxylic acids during a bioreactor cultivation ofK. lactis. A) Separation of standards at 50 mg/L; B) bioreactor sample at 0 h; andC) bioreactor sample at 60 h. Peak assignments: 1. formate; 2. malate; 3. succin-ate; 4. acetate; 5. glycolate; 6. glyoxylate; 7. PIPES; 8. lactate; and 9. gluconate.Analysis conditions: BGE 20 mM 2,3-PDC with 80 mg/L Ca2+, 40 mg/L Mg2+ and10% IPA (pH 9), amine coated eCAP silica capillary with 50 µm I.D. and 50/60 cmlength, separation voltage –20 kV and temperature 25 °C, injection with 0.5 psivacuum for 5 s. [Publication III]
The purpose of the K. lactis cultivation was to monitor the production of glycolatefrom ethanol in aerobic conditions. The online analysis results were compared tooffline analysis results as presented in Figure 30 where the HPLC analysis resultsare also summarized. The concentration of acetate increased to about 1 g/L(Figure 30A) but it began to decrease after 90 hours of cultivation. At that point,the yeast had consumed all the ethanol (Figure 30D) provided as substrate and itstarted to use acetate as carbon source. From Figure 30 B and C it can be notedthat the concentrations of glycolic and glyoxylic acids increased throughout thecultivation. The concentrations of acetate and glyoxylate were slightly higher inonline analysis compared to offline analyses, which was probably due to lossesduring manual sampling. In the manually taken sample, the conditions duringsample preparation are not as oxidizing as in the cultivation which enhances theformation of glycolate from glyoxylate. For this reason, and because the amount of

4. Results and discussion
74
yeast cells increases during cultivation, the offline concentration of glycolate ishigher especially at the end of the cultivation. In addition, the change in the condi-tions during sample preparation compared to those in the cultivation might enablethe formation of acetaldehyde or ethanol from acetate. In the online analysis sys-tem the cells are removed from the sample faster than during manual sampling,and the balanced cultivation conditions are not altered by the sampling event.Furthermore, in this particular cultivation, the online analysis of the product glyco-late and the by-products acetate and glyoxylate could be used to optimize theaeration conditions for maximizing the production of glycolate.
Figure 30. Comparison of online and offline CE analysis results of a K. lactis culti-vation, and the offline HPLC results. A) Acetate; B) glycolate; C) glyoxylate; andD) HPLC results of ethanol and xylose. [Publication III]
The S. cerevisiae cultivation lasted for almost 70 hours, and in total 62 online and23 offline samples were collected. The separation of carboxylates during the culti-vation is presented in Figure 31.

4. Results and discussion
75
Figure 31. Online analysis of carboxylic acids during a bioreactor cultivation ofS. cerevisiae. A) Separation of standards at 50 mg/L; B) bioreactor sample at 0 h;and C) bioreactor sample at 22 h. Peak assignments: 1. formate; 2. malate; 3.succinate; 4. acetate; 5. PIPES; 6. lactate; and 7. gluconate. Analysis conditionsas described in Figure 29. [Publication III]
The objective in the S. cerevisiae cultivation was to study the production of ethanolfrom xylose under anaerobic conditions in which the carboxylates are by-productsof the cultivation. As presented in Figure 32, the concentrations of malate andacetate (Figure 32A and B, respectively) increased during cultivation but the pro-duction of lactate (Figure 32C) ended already after 20 hours. At that point, glucosehad been consumed almost completely (Figure 32D). When the cultivation wasended at 64 hours, xylose was still not completely utilized by the yeast. As theHPLC results depict, alcohols were also formed during the cultivation, especiallyethanol and xylitol but also small amounts of glycerol. Online measurements pro-vided detailed information about the dynamics of the production of the by-productsacetate, malate and lactate when comparing the metabolism of glucose and xy-lose.

4. Results and discussion
76
Figure 32. Comparison of online and offline CE analysis results of a S. cerevisiaecultivation, and the offline HPLC results. A) Malate; B) acetate; C) lactate; and D)HPLC results of glucose, xylose, ethanol, glycerol, and xylitol. [Publication III]
During both cultivations, concentrations of internal standards were monitored, andduring data processing they were used to correct the results. 1,4-piperazinedi-ethane sulfonic acid (PIPES) was added to the cultivation media in order to studythe sampling and filtration, and gluconic acid was added to the diluent in order tostudy the online dilution process. The data collected from the internal standardpeak areas during the cultivation is presented in Figure 33. It can be seen that inboth cultivations, the concentration of gluconic acid remained approximately thesame throughout the cultivation but the concentration of PIPES began to decreaseslowly. This was primarily caused by the online filtration because in theS. cerevisiae cultivation (Figure 33B) the filter paper was changed at 45 hours andthe peak area was normalized. However, the concentration started to decreasequite rapidly, probably due to the high cell concentration in the bioreactor.
Figure 33. Comparison of internal standard peak areas. A) K. lactis, B)S. cerevisiae. PIPES was added to the cultivation media and gluconate to thediluent. [Publication III]

4. Results and discussion
77
4.4 Determination of amino acids by MEKC-LIF
In Publication IV, CE with LIF detection was used to develop an analysis methodfor studying amino acids. The optimized method was used to monitor amino acidconsumption of S. cerevisiae during beer fermentation.
4.4.1 Method development
For the analysis of amino acids, an extensive study was made to find a suitableBGE composition. The tested electrolyte chemicals were tetraborate [166, 176–179], phosphate [180], tetraborate–phosphate, lithium carbonate [181], ammoniumacetate [182] and ammonium formate [120, 183–185] which are all common elec-trolytes in amino acid analyses. Tetraborate was found to be the most suitableelectrolyte chemical for the method. The separation efficiency of tetraborate ispresented in Figure 34.
Figure 34. The effect of tetraborate concentration on the separation of aminoacids. A) 30 mM, and B) 50 mM. Other analysis conditions: voltage +25 kV, tem-perature 20 °C, capillary length 60 cm (50 cm to the detector), injection 0.5 psi10 s and LIF excitation 488 nm and emission 520 nm. Unpublished data.
To enhance the separation between amino acids sodium dodecyl sulfate (SDS)[162, 166, 176, 186], 3-[3-Cholamidopropyl)-dimethylammonio]-2-hydroxy-1-propane-sulfonate (CHAPSO) [178], 18-crown-6-ether (18C6) [187] and -cyclodextrin[166,174,188] were tested. It was noted that the addition of CHAPSO in 10 mMconcentration gave the best separation efficiency above all other BGE solutionstested but there were precipitation problems with the BGE that could not be re-

4. Results and discussion
78
solved. The addition of the second best surfactant SDS to the BGE is presented inFigure 35.
Figure 35. SDS addition to the BGE. BGE: 50 mM tetraborate with A) 20 mM, B)30 mM, C) 40 mM, and D) 50 mM SDS, pH 9.0. Other conditions as in Figure 34.Unpublished data.
The separation efficiency was not as good with the SDS compared to CHAPSO,and therefore further modification was needed. -Cyclodextrin and 18C6 wereadded to the BGE consisting of tetraborate and SDS. 18C6 is classified as a classI organic modifier in SDS-mediated MEKC and it is used to tune selectivity andresolution. Class I modifiers have an effect on the pseudostationary phase throughdirect interaction with the micelles. [184] The effect of 18C6 addition to the BGE ispresented in Figure 36.

4. Results and discussion
79
Figure 36. The effect of 18C6 addition to the BGE. BGE: 50 mM tetraborate with30 mM SDS and A) 10 mM, B) 20 mM and C) 30 mM 18C6, pH 9.0. Other condi-tions as in Figure 34. [Publication IV]
After optimization of the BGE, other analysis conditions were tested. The separation ofamino acids with the optimized analysis method is presented in Figure 37. Leucine andisoleucine migrated as one peak because no chiral selector was used in this study.
Figure 37. Separation of amino acids. BGE: 50 mM tetraborate, 30 mM SDS and20 mM 18C6, pH 9.0. Other analysis conditions: voltage +30 kV, temperature15 °C, capillary length 60 cm (50 cm to the detector), injection 0.5 psi 10 s and LIFexcitation 488 nm and emission 520 nm. The current during analysis was ~62 µA.Peak assignments: 1) arginine, 2) lysine, 3) leucine/isoleucine, 4) tyramine, 5) histi-dine, 6) glutamine, 7) valine, 8) phenylalanine, 9) threonine/asparagine, 10) proline,11) serine, 12) glycine, 13) glutamic acid, and 14) aspartic acid. [Publication IV]

4. Results and discussion
80
4.4.2 Labeling chemistry
Succinimidyl esters react with nucleophiles with release of N-hydroxysuccinimide(Figure 38). Reaction with primary and secondary amines creates stable amideand imide linkages, respectively. With succinimidyl esters, the hydrolysis andamine reactivity both increase with increasing pH. [189] For our purpose, it wasimportant that the derivatization reaction occurs in mild conditions and relativelyrapidly. As presented in Figure 39, the use of 6-isomer resulted in less peaksoriginated from the label in the electropherogram. The resulting reaction productsare very stable at room temperature.
Figure 38. Labeling reaction of Oregon green 488® succinimidyl ester (6-isomer)with an amino acid. [Publication IV]
Figure 39. Comparison of 5- and 6-isomers of Oregon green 488® succinimidylester. A) 5-isomer and B) 6-isomer. Analysis conditions as in Figure 37.[Publication IV]

4. Results and discussion
81
4.4.3 Analysis of beer fermentation samples
Beer fermentation samples were analyzed with the optimized analysis method forthe determination of amino acids. An electropherogram of standard separation anda cultivation sample is presented in Figure 40.
Figure 40. Electrophoretic separation of a cultivation sample. Analysis conditionsas in Figure 37. Peak assignments: 1) arginine, 2) lysine, 3) leucine/isoleucine, 4)tyramine, 5) histidine, 6) glutamine, 7) valine, 8) phenylalanine, 9) threonine/asparagine, 10) proline, 11) serine, 12) glycine, 13) glutamic acid, and 14) asparticacid. [Publication IV]
The results of the fermentation are presented in Figure 41, where the concentra-tion changes of amino acids are presented as a function of fermentation time. Itcan be seen that the concentrations of most of the amino acids decreased duringcultivation, as expected. The most rapid decrease in amino acid concentrationsoccurred during the first 30 hours of the cultivation when the glucose was alsoconsumed (Figure 42A). In addition, the fastest increase in biomass concentration(Figure 42B) occurred at the same time, indicating that glucose and most of theamino acids are used for the growth of the biomass. The increase in some aminoacid concentrations might have been caused by stress experienced by the yeastcells during the fermentation. When yeast cells are stressed they may releaseproteolytic enzymes, in particular protease A, which has the effect of liberating freeamino acids from peptides or proteins.

4. Results and discussion
82
Figure 41. The consumption of amino acids by Saccharomyces cerevisiae duringbeer fermentation. [Publication IV]
The results in Figure 42A show that the concentrations of maltose and maltotriosedecreased during the cultivation and the concentration of ethanol increased. In thebeginning of the cultivation some glycerol was formed but the concentration re-mained low. The results in Figure 42B illustrate that the biomass concentrationremained approximately the same between 70 h and 120 h but started to de-crease after maltose was consumed from the fermentation broth.
Figure 42. A) HPLC and B) biomass results of the beer fermentation. [Publication IV]

5. Conclusions and future prospects
83
5. Conclusions and future prospects
New capillary electrophoretic analysis methods with UV- and LIF-detections weredeveloped for the monitoring of bioprocesses in both offline and online mode.Offline CE analyses were performed for the analysis of bioreactor cultivationscontaining carboxylic, phenolic and amino acids. An online CE set-up wasmodified from a commercial CE device and a flow-through sample vial wasdesigned and constructed to enable sampling to the CE instrument. The onlineanalysis system was used to monitor carboxylic acid production in two differentbioreactor cultivations.
The offline analysis of carboxylic acid enabled the simultaneous analysis andquantification of 22 carboxylic acids. The analysis method was used for monitoringGluconobacter oxydans cultivation in wheat straw hydrolysate, which has a com-plex composition. The G. oxydans was able to convert xylose to xylonic acid andglucose to gluconic acid with 45% and 96% yield, respectively.
Carboxylic acids were also monitored online in Kluyveromyces lactis and Sac-charomyces cerevisiae cultivations. In genetically engineered K. lactis cultivationthe production of glycolic acid from ethanol in aerobic conditions was studied, andin S. cerevisiae cultivation the production of ethanol from xylose was monitoredunder anaerobic conditions in which carboxylates are by-products. The online andoffline analysis results correlated rather well in both cultivations.
Phenolic compounds were studied in cultivations that were performed in a syn-thetic inhibitor mix and in spruce hydrolysate medium. The optimized analysismethod was able to separate and quantitate 14 phenolic compounds. It was notedthat the Saccharomyces cerevisiae strains used in this study were able to de-crease the concentrations of some of the phenolic compounds. In addition, theconcentration of inhibitors and biomass had an effect on the productivity of ethanoland on the consumption of glucose and xylose that were used as substrates.
Amino acid consumption of Saccharomyces cerevisiae during beer fermenta-tion was studied with CE using LIF detection. The amino acids were labelled withOregon Green 488 succinimidyl ester-label, which is a fluorinated analogue offluorescein. Reaction of OG-SE with primary and secondary amines creates stableamide and imide linkages, respectively, and the reaction occurs rapidly in mildconditions. The most rapid consumption of amino acids occurred during the first30 hours when glucose was also utilized. This indicates that most of the growth of

5. Conclusions and future prospects
84
the yeast occurred during that time, and the OD600 and CDW results supportedthis observation.
Capillary electrophoresis is widely known for its use in academia and in theanalysis of macromolecules such as DNA, RNA and proteins. This thesis demon-strates the use of capillary electrophoresis in industrial applications illustrating itsversatility for the analysis of small molecules that are present in bioprocesses.With small adjustments, a commercial CE device was used as an automated bio-process monitoring device that produced high quality data from real processes in arobust and repeatable manner. Overall, the CE was proven to be a diverse andfeasible routine analysis device for several different cultivations using even hydrol-ysate as cultivation medium. With CE, it is possible to develop analysis methodsfor a wide variety of compounds that are present in bioprocesses and other pro-cesses. In addition, depending on the sampling and sample treatment, CE haspotential for the online and offline analysis of cultivations using other microorgan-isms than yeast and bacteria, such as filamentous organisms, and mammalianand plant cells.

85
References
1 W. Sabra, D. Dietz, D. Tjahjasari, A.-P. Zeng, Eng. Life Sci. 10 (2010) 407–421. “Biosystems analysis and engineering of microbial consortia forindustrial biotechnology”
2 E. Aittomäki, T. Eerikäinen, M. Leisola, H. Ojamo, I. Suominen, N. vonWeymarn, Bioprosessitekniikka, WSOY, Finland 2002. ”Introduction”
3 International Energy Agency (IEA) Bioenergy, Bio-based chemicals Report 2012http://www.iea-bioenergy.task42-biorefineries.com/nl/publications/reports/“Bio-based chemicals – value added products from biorefineries”
4 K. Zhuang, B.R. Bakshi, M.J. Herrgård, Biotechnol. J. 8 (2013) 973–984.“Multi-scale modelling for sustainable chemical production”
5 J. Zaldivar, J. Nielsen, L. Olsson, Appl. Microbiol. Biotechnol. 56 (2001) 17–34.“Fuel ethanol production from lignocellulose: a challenge for metabolicengineering and process integration”
6 M. Sauer, D. Porro, D. Mattanovich, P. Branduardi, Trends Biotechnol. 26 (2008)100–108. “Microbial production of organic acids: expanding the markets”
7 Nova-Institute GmbH, World-wide investments in bio-based chemicals 2012http://www.bio-based.eu/policy/en/
8 M.J.T. Carrondo, P.M. Alves, N. Carinhas, J. Glassey, F. Hesse, O.-W.Merten, M. Micheletti, T. Noll, R. Oliveira, U. Reichl, A. Staby, A.P. Teixeira,H. Weichert, C.-F. Mandenius, Biotechnol. J. 7 (2012) 1522–1529. “How canmeasurement, monitoring, modelling and control advance cell culture inindustrial biotechnology”
9 International Union of Pure and Applied Chemistry (IUPAC), Compendium ofChemical Terminology (The Gold Book), version 2.3.2, USA 2012.
10 E. Aittomäki, T. Eerikäinen, M. Leisola, H. Ojamo, I. Suominen, N. von Weymarn,Bioprosessitekniikka, WSOY, Finland 2002. ”Manufacturing processes”
11 G.N. Stephanopoulos, A.A. Aristiodou, J. Nielsen, Metabolic Engineering.Principles and Methodologies, Elsevier Science, USA 1998. “Comprehensivemodels for cellular reactions”

86
12 E. Aittomäki, T. Eerikäinen, M. Leisola, H. Ojamo, I. Suominen, N. vonWeymarn, Bioprosessitekniikka, WSOY, Finland 2002. ”Industrial organisms”
13 K. Öhgren, O. Bengtsson, M.F. Gorwa-Grauslund, M. Galbe, B. Hahn-Hägerdal, G. Zacchi, J. Biotechnol. 126 (2006) 488–498. “Simultaneoussaccharification and co-fermentation of glucose and xylose in steam-pretreated corn stover at high fiber content with Saccharomyces cerevisiaeTMB3400”
14 E. Aittomäki, T. Eerikäinen, M. Leisola, H. Ojamo, I. Suominen, N. vonWeymarn, Bioprosessitekniikka, WSOY, Finland 2002. ”Genetic engineering”
15 G.M. Walker, Yeast Physiology and Biotechnology, John Wiley & Sons Ltd.,England 1998. “Introduction to yeasts”
16 O. de Smidt, J.C. du Preez, J. Albertyn, FEMS Yeast Res. 8 (2008) 967–978.“The alcohol dehydrogenases of Saccharomyces cerevisiae: a comprehensivereview”
17 M. Wésolowski-Louvel, K.D. Breunig, H. Fukuhara, in K. Wolf (Ed.)Nonconventional Yeasts in Biotechnology, Springer-Verlag, Germany 1996.“Kluyveromyces lactis”
18 C. Prust, M. Hoffmeister, H. Liesegang, A. Wiezer, W.F. Fricke, A. Ehrenreich,G. Gottschalk, U. Deppenmeier, Nat. Biotechnol. 23 (2005) 195–200.“Complete genome sequence of the acetic acid bacterium Gluconobacteroxydans”
19 A. Gupta, V.K. Singh, G.N. Qazi, A. Kumar, J. Mol. Microbiol. Biotechnol. 3(2001) 445–456. “Gluconobacter oxydans: its biotechnological application”
20 J. Buchert, J. Puls, K. Poutanen, Appl. Microbiol. Biotechnol. 28 (1988) 367–372. “Comparison of Pseudomonas fragi and Gluconobacter oxydans forproduction of xylonic acid from hemicellulose hydrolyzates”
21 J. Buchert, L. Viikari, Appl. Microbiol. Biotechnol. 29 (1988) 375–379.“Oxidative D-xylose metabolism of Gluconobacter oxydans”
22 J. Buchert, K. Niemelä, J. Puls, K. Poutanen, Proc. Biochem. 25 (1990) 176–180.“Improvement in the fermentability of steamed hemicellulose hydrolysate by ionexclusion”

87
23 B.W. Chun, B. Dair, P.J. Macuch, D. Wiebe, C. Porteneuve, A. Jeknavorian,Appl. Biochem. Biotechnol. 129–132 (2006) 645 – 658. “The development ofcement and concrete additive”
24 M. Kudrjashova, H. Tahkoniemi, K. Helmja, M. Kaljurand, Proc. EstonianAcad. Sci. Chem. 53 (2004) 51–64. “Capillary electrophoretic monitoring ofmicrobial growth: determination of organic acids”
25 Kyoto Encyclopedia of Genes and Genomes (KEGG), www.genome.jp/kegg/
26 Y.J. Lee, J.W. Jang, K.J. Kim, P.J. Maeng, Yeast 28 (2011) 153–166. “TCAcycle-independent acetate metabolism via the glyoxylate cycle inSaccharomyces cerevisiae”
27 G.M. Walker, Yeast Physiology and Biotechnology, John Wiley & Sons Ltd.,England 1998. “Yeast metabolism”
28 O.M. Koivistoinen, J. Kuivanen, D. Barth, H. Turkia, J.-P. Pitkänen, M.Penttilä, P. Richard, Microbial Cell Factories 12:82 (2013). ”Glycolic acidproduction in the engineered yeasts Saccharomyces cerevisiae andKluyveromyces lactis”
29 L. Olsson, H. Jørgensen, K. Krogh, C. Roca, in S. Dumitriu (Ed.) Polysaccharides:Structural Diversity and Functional Versatility, 2nd edition, Marcel Dekker, Inc.,USA 2005. “Bioethanol production from lignocellulosic material”
30 J.R.M. Almeida, T. Modig, A. Petersson, B. Hähn-Hägerdahl, G. Lidén, M.F.Gorwa-Grauslund, J. Chem. Technol. Biotechnol. 82 (2007) 340–349.“Increased tolerance and conversion of inhibitors in lignocellulosichydrolysates by Saccharomyces cerevisiae”
31 M. Batistote, S.H. da Cruz, J.R. Ernandes, J. Inst. Brew. 112 (2006) 84–91.“Altered patterns of maltose and glucose fermentation by brewing and wineyeasts influenced by the complexity of nitrogen source”
32 S.H. da Cruz, E.M. Cilli, J.R. Ernandes, J. Inst. Brew. 108 (2002) 54–61.“Structural complexity of the nitrogen source and influence on yeast growthand fermentation”
33 B.R. Gibson, C.A. Boulton, W.G. Box, N.S. Graham, S.J. Lawrence, R.S.T.Linforth, K.A. Smart, J. Am. Soc. Brew. Chem. 67 (2009) 157. “Amino aciduptake and yeast gene transcription during industrial brewery fermentation”

88
34 V. Galli, A. Garcia, L. Saavedra, C. Barbas, Electrophoresis 24 (2003) 1951–1981. “Capillary electrophoresis for short-chain organic acids and inorganicanions in different samples”
35 M. Casal, S. Paiva, O. Queirós, I. Soares-Silva, FEMS Microbiol. Rev. 32(2008) 974–994. “Transport of carboxylic acids in yeasts”
36 M.-L. Riekkola, T. Hyötyläinen, Kolonnikromatografia ja kapillaarielektromigraatio-tekniikat, 2nd edition, Yliopistopaino, Finland 2002. ”Gas chromatography”
37 C. Aiello-Mazzarri, G. Coward-Kelly, F.K. Agbogbo, M.T. Holtzapple, Appl.Biochem. Biotechnol. 127 (2005) 79–93. “Conversion of municipal solidwaste into carboxylic acids by anaerobic countercurrent fermentation”
38 D. Papurello, C. Soukoulis, E. Schuhfried, L. Cappellin, F. Gasperi, S. Silvestri,M. Santarelli, F. Biasioli, Bioresource Technology 126 (2012) 254–265.“Monitoring of volatile compound emissions during dry anaerobic digestion ofthe organic fraction of municipal solid waste by proton transfer reaction time-of-flight mass spectrometry”
39 J.Y. Lee, D.-T. Nguyen, Y.S. Park, K.Y. Hwang, Y.S. Cho, K.-D. Kang, J. Yoon,J. gall, S.-T. Yee, Y.H. Ahn, G. Lee, S.-I. Seong, M.-J. Paik, Mass Spectrom.Lett. 3 (2012) 74–77. “Organic acid profiling analysis in culture media oflactic acid bacteria by gas chromatography – mass spectrometry”
40 S.-H. Sun, J.-P. Xie, F.-W. Xie, Y.-L. Zong, J. Chromatogr. A 1179 (2008)89–95. “Determination of volatile organic acids in oriental tobacco by needle-based derivatization headspace liquid-phase microextraction coupled to gaschromatography/mass spectrometry”
41 J.L. Hope, B.J. Prazen, E.J. Nilsson, M.E. Lidstrom, R.E. Synovec, Talanta65 (2005) 380–388. “Comprehensive two-dimensional gas chromatographywith time-of-flight mass spectrometry detection: analysis of amino acid andorganic acid trimethylsilyl derivatives, with application to the analysis ofmetabolites in rye grass sample”
42 M. Koubaa, J.-C. Cocuron, B. Thomasset, A.P. Alonso, Anal. Biochem. 436(2013) 151–159. “Highlighting the tricarboxylic acid cycle: liquid and gaschromatography – mass spectrometry analyses of 13C-labeled organic acids”
43 B. Jurado-Sánchez, E. Ballesteros, M. Gallego, Talanta 84 (2011) 924–930.“Gas chromatographic determination of 29 organic acids in foodstuffs aftercontiniuous solid-phase extraction”

89
44 D.-T. Nguyen, G. Lee, M.-J. Paik, J. Chromatogr. B 913–914 (2013) 48–54. ”Ketoacid profiling analysis as ethoxime/tert-butyldimethylsilyl derivatives by gaschromatography – mass spectrometry”
45 H. Wu, R. Xue, T. Liu, C. Deng, H. Zeng, X. Shen, Anal. Chim. Acta 648(2009) 98–104. “Metabolic profiling of human urine in hepatocellularcarcinoma patients using gas chromatography/mass spectrometry”
46 M.K. Park, I.H. Cho, S. Lee, H.-K. Choi, D.-Y. Kwon, Y.-S. Kim, Food Chem.122 (2010) 1313–1319. “Metabolite profiling of Cheonggukjang, a fermentedsoybean paste, during fermentation by gas chromatography – massspectrometry and principal component analysis”
47 W.M.A. Niessen, Liquid Chromatography – Mass Spectrometry, 3rd edition,Chromatographic science series, Vol. 97, CRC Press, Taylor & FrancisGroup, USA 2006. “Liquid chromatography and sample pretreatment”
48 K. Fischer, Anal. Chim. Acta 465 (2002) 157–173. “Environmental analysis ofaliphatic carboxylic acids by ion-exclusion chromatography”
49 J.M. Käkölä, R.J. Alén, J.P. Isoaho, R.B. Matilainen, J. Chromatogr. A 1190(2008) 150–156. “Determination of low-molecular-mass aliphatic carboxylicacids and inorganic anions from kraft black liquors by ion chromatography”
50 X. Geng, S. Zhang, Q. Wang, Z. Zhao, J. Chromatogr. A 1192 (2008) 187–190.“Determination of organic acids in the presence of inorganic anions by ionchromatography with suppressed conductivity detection”
51 P. Masson, J. Chromatogr. A 881 (2000) 387–394. “Influence of organicsolvents in the mobile phase on the determination of carboxylic acids andinorganic anions in grape juice by ion chromatography”
52 S. Liu, K.M. Bischoff, S.R. Hughes, T.D. Leathers, N.P. Price, N. Qureshi,J.O. Rich, Lett. Appl. Microbiol. 48 (2009) 337–342. “Conversion of biomasshydrolysates and other substrates to ethanol and other chemicals byLactobacillus buchneri”
53 M.A. Eiteman, M.J. Chastain, Anal. Chim. Acta 338 (1997) 69–75.“Optimization of the ion-exchange analysis of organic acids from fermentation”
54 L.R.V. De Sá, M.A.L. de Oliveira, M.C. Cammarota, A. Matos, V.S. Ferreira-Laitão, Int. J. Hydrogen Energ. 36 (2011) 15177–15186. “Simultaneous analysisof carboxylic acids by HPLC for monitoring fermentative biohydrogen production”

90
55 A. de Villiers, F. Lynen, A. Crouch, P. Sandra, Eur. Food Res. Technol. 217(2003) 535–540. “A robust capillary electrophoresis method for thedetermination of organic acids in wines”
56 H. Kelebek, S. Selli, J. Sci. Food Agric. 91 (2011) 1855–1862. “Determination ofvolatile, phenolic, organic acid and sugar components in a Turkish cv,Dortyol (Citrus sinensis L. Osbeck) orange juice”
57 C. Asada, Y. Nakamura, F. Kobayashi, Biotechnol. Bioproc. Eng. 10 (2005)346–352. “Chemical characteristics and ethanol fermentation of the cellulosecomponent in autohydrolyzed bagasse”
58 J. Käkölä, R. Alén, J. Sep. Sci. 29 (2006) 1996–2003. ”A fast method fordetermination of low-molecular-mass aliphatic carboxylic acids by high-performance liquid chromatography – atmospheric pressure chemicalionization mass spectrometry”
59 S.-F. Chen, R.A. Mowery, V.A. Castelberry, G.P. van Walsum, C.K.Chambliss, J. Chromatogr. A 1104 (2006) 54–61. “High-performance liquidchromatography method for simultaneous determination of aliphatic acid,aromatic acid and neutral degradation products in biomass pretreatmenthydrolysates”
60 M.-C. Wei, C.-T. Chang, J.-F. Jen, Chromatographia 54 (2001) 601–605.“Determination of organic acids in fermentation products of milk with highperformance liquid chromatography/onlined micro-dialysis”
61 K.L. Ross, T.T. Tu, S. Smith, J.J. Dalluge, Anal. Chem. 79 (2007) 4840–4844. “Profiling of organic acids during fermentation by ultraperformanceliquid chromatography – tandem mass spectrometry”
62 A.A. Alhusban, M.C. Breadmore, R.M. Guijt, Electrophoresis 34 (2013)1465–1482. “Capillary electrophoresis for monitoring bioprocesses"
63 I. Mato, J.F. Huidobro, J. Simal-Lozano, M.T. Sancho, Anal. Chim. Acta 565(2006) 190–197. “Simultaneous determination of organic acids in beveragesby capillary electrophoresis”
64 M.V.G. Moreno, C.J. Jurado, C.G. Barroso, Chromatographia 57 (2003)185–189. “Determination of organic acids by capillary electrophoresis withsimultaneous addition of Ca and Mg as complexing agents”

91
65 J. Xu, ZL Chen, J.C. Yu, C. Tang, J. Chromatogr. A 942 (2002) 289– 94.“Simultaneous determination of inorganic anions, carboxylic and aromaticcarboxylic acids by capillary zone electrophoresis with direct UV detection”
66 V. Galli, C. Barbas, J. Chromatogr. A 1032 (2004) 299–304. “Capillaryelectrophoresis for the analysis of short-chain organic acids in coffee”
67 L. Saavedra, A. Garcia, C. Barbas, J. Chromatogr. A 881 (2000) 395–401.“Development and validation of a capillary electrophoresis method for directmeasurement of isocitric, citric, tartaric and malic acids as adulterationmarkers in orange juice”
68 Q. Zhu, X. Xu, Y. Huang, L. Xu, G. Chen, J. Chromatogr. A 1246 (2012) 35–39. “Field enhancement sample stacking for analysis of organic acids intraditional Chinese medicine by capillary electrophoresis”
69 L. Saavedra, C. Barbas, Electrophoresis 24 (2003) 2235–2243. “Validatedcapillary electrophoresis method for small-anions measurement in wines”
70 S. Cortacero-Remírez, A. Segura-Carretero, M. Hernáinz-Bermúdez deCastro, A. Fernéndez-Gutiérrez, J. Chromatogr. A 1064 (2005) 115–119.“Determination of low-moleular-mass organic acids in any type of beersamples by coelectromostic capillary electrophoresis”
71 X. Li, Y. Ju, Y. Xu, W. Wang, Y. Dong, Y. Ma, X. Chen, Anal. Chim. Acta 789(2013) 100–106. “Online capillary electrophoresis enrichment by combinationchitosan trapping with surfactant assisted sample stacking for the ultratracedetermination of organic acids in Plateau alfalfa roots”
72 V.I. Esteves, S.S.F. Lima, D.L.D. Lima, A.C. Duarte, Anal. Chim. Acta 513(2004) 163–167. “Using capillary electrophoresis for the determination oforganic acids in Port wine”
73 M.J. Markuszewski, K. Otsuka, S. Terabe, K. Matsuda, T. Nishioka, J.Chromatogr. A 1010 (2003) 113–121. ”Analysis of carboxylic acidmetabolites from the tricarboxylic acid cycle in Bacillus subtilis cell extract bycapillary electrophoresis using an indirect photometric detection method”
74 M. Chovancek, P. Choo, M. Macka, Electrophoresis 25 (2004) 437–443.“Development of a fully buffered molybdate electrolyte for capillaryelectrophoresis with indirecrt detection and its use for analysis of anions inBayer liquor”

92
75 M. Ligor, R. Jarmalaviciene, M. Szumski, A. Maruška, B. Buszewski, J. Sep.Sci. 31 (2008) 2707–2713. “Determination of volatile and non-volatileproducts of milk fermentation processes using capillary zone electrophoresisand solid phase microextraction coupled to gas chromatography”
76 Y.S. Fung, K.M. Lau, Electrophoresis 24 (2003) 3224–3232. “Analysis oforganic acids and inorganic anions in beverage drinks by capillaryelectrophoresis”
77 H. Adler, H. Sirén, M. Kulmala, M.-L. Riekkola, J. Chromatogr. A 990 (2003)133–141. ”Capillary electrophoretic separation of carboxylic acids inatmospheric aerosol particles”
78 S. Galkin, T. Vares, M. Kalsi, A. Hatakka, Biotechnol. Tech. 12 (1998) 267–271. ”Production of organic acids by different white-rot fungi as detectedusing capillary zone electrophoresis”
79 S. John Prasanna, T. Kaleemullah, S. Appala Chararyulu, H. Kurma Sharma,K. Mukkanti, J. Chem. Pharm. Res. 4 (2012) 5039–5047. “Determination andvalidation of low molecular mass organic acids in pharmaceutical drugsubstances by capillary electrophoresis”
80 N. Bord, G. Crétier, J.-L. Rocca, C. Bailly, J.-P. Souchez, J. Chromatogr. A1100 (2005) 223–229. “Simultaneous determination of inorganic anions andorganic acids in amine solution for sour gas treatment by capillaryelectrophoresis with indirect UV detection”
81 F. Tezcan, S. Kolayli, H.S.-E. Ulusoy, F.B. Erim, J. Food Nutr. Res. 50(2011) 33–40. “Evaluation of organic acids, saccharide composition andantioxidant properties of some authentic Turkish honeys”
82 T. Nogueira, C.L. do Lago, Microchem. J. 99 (2011) 267–272. “Determinationof Ca, K, Mg, Na, sulphate, phosphate, formate, acetate, propionate, andglycerol in biodiesel by capillary electrophoresis with capacitatively coupledcontactless conductivity detection”
83 A. Bogolitsyna, M. Backer, A.-L. Dupont, A. Borgards, T. Rosenau, A.Potthast, J. Chromatogr. A 1218 (2011) 8561–8566. “Determination ofcarbohydrate- and lignin-derived components in complex effluents fromcellulose processing by capillary electrophoresis with electrospray ionization-mass spectrometric detection”

93
84 P. van Pinxteren, M. Teich, H. Herrmann, J. Chromatogr. A 1267 (2012)178–188. “Hollow fibre liquid-phase microextraction of functionalizedcarboxylic acids from atmospheric particles combined with capillaryelectrophoresis/mass spectrometric analysis”
85 K. Harada, Y. Ohyama, T. Tabushi, A. Kobayashi, E. Fukusaki, J. Biosci.Bioeng. 105 (2008) 249–260. “Quantitative analysis of anionic metabolitesfor Catharanthus roseus by capillary electrophoresis using sulfonatedcapillary coupled with electrospray ionization-tandem mass spectrometry”
86 H. Sawada, C. Nogami, Anal. Chim. Acta 507 (2004) 191–198. “Capillaryelectrophoresis-electrospray ionization mass spectrometry using uncoated fused-silica capillaries and alkaline buffer solution for the analysis of small carboxylic acids”
87 T. Soga, Y. Ohashi, Y. Ueno, H. Naraoka, M. Tomita, T. Nishioka, J. Prot.Res. 2 (2003) 488–494. ”Quantitative metabolome analysis using capillaryelectrophoresis mass spectrometry”
88 J.L. Edwards, C.N. Chisolm, J.G. Shackman, R.T. Kennedy, J. Chromatogr. A1106 (2006) 80–88. “Negative mode sheathless capillary electrophoresiselectrospray ionization-mass spectrometry for metabolite analysis of prokaryotes”
89 M.I. Spranger, M.C. Clímaco, B. Sun, N. Eiriz, C. Fortunato, A. Nunes, M.C.Leandro, M.L. Avelar, A.P. Belchior, Anal. Chim. Acta 513 (2004) 151–161.“Differentiation of red winemaking technologies by phenolic and volatilecomposition”
90 N.B.A. Bakar, A. Makahleh, B. Saad, Anal. Chim. Acta 742 (2012) 59–66.“In-vial liquid-liquid microextraction – capillary electrophoresis method for thedetermination of phenolic acids in vegetable oils”
91 J. Bernal, J.A. Mendiola, E. Ibáñez, A. Cifuentes, J. Pharmaceut. Biomed.Anal. 55 (2011) 758–774. “Advanced analysis of nutraceuticals"
92 R. Koppram, E. Albers, L. Olsson, Biotechnol. Biofuels 5 (2012).“Evolutionary engineering strategies to enhance tolerance of xylose utilizingrecombinant yeast to inhibitors derived from spruce biomass”
93 A. Carrasco-Pancorbo, E. Nevedomskaya, T. Arthen-Engeland, T. Zey, G.Zurek, C. Baessmann, A.M. Deelder, O.A. Mayboroda, Anal. Chem. 81(2009) 10071–10079. “Gas chromatography/atmospheric pressure chemicalionization – time of flight mass spectrometry: analytical validation andapplicability to metabolic profiling”

94
94 H. Wu, R. Xue, L. Dong, T. Liu, C. Deng, H. Zeng, X. Shen, Anal. Chim. Acta648 (2009) 98–104. “Metabolic profiling of human urine in hepatocellularcarcinoma patients using gas chromatography/mass spectrometry”
95 O. Fiehn, J. Kopka, P. Dörmann, T. Altmann, R.N. Trethewey, L. Willmitzer,Nature Biotechnol. 18 (2000) 1157–1161. “Metabolite profiling for plantfunctional genomics”
96 G. Purcaro, P.Q. Tranchida, R.A. Jacques, E.B. Caramão, S. Moret, L.Conte, P. Dugo, G. Dugo, L. Mondello, J. Sep. Sci 32 (2009) 3755–3763.“Characterization of the yerba mate (Ilex paraguariensis) volatile fractionusing solid-phase microextraction comprehensive 2-D GC-MS”
97 T.A. Kokya, K. Farhadi, A.A. Kalhori, Food Anal. Methods 5 (2012) 351–358.“Optimized dispersive liquid-liquid microextraction and determination ofsorbic acid and benzoic acid in beverage samples by gas chromatography”
98 Y. Sun, X. Wang, Y. Huang, Z. Pan, L. Wang, J. Sep. Sci 36 (2013) 2268–2276.“Derivatization following hollow-fiber microextraction with tetramethylamoniumacetate as a dual-function reagent for the determination of benzoix acid andsorbic acid by GC”
99 E. Revilla, J.-M. Ryan, J. Chromatogr. A 881 (2000) 461–469. “Analysis ofseveral phenolic compound with potential antioxidant properties in grapeextracts and wines by high-performance liquid chromatography – photodiodearray detection without sample preparation”
100 V.M. Burin, S. G. Arcari, L.L.F. Costa, M.T. Bordignon-Luiz, J. Chromatogr.Sci. 49 (2011) 647–651. “Determination of some phenolic compounds in redwine by RP-HPLC: method development and validation”
101 S.G. Arcari, E.S. Chaves, R. Vanderlinde, J.P. Rosier,M.T. Bordignon-Luiz,Food Res. Int. 53 (2013) 164–173. “Brazilian fortified wines: chemicalcomposition, chromatic properties and antioxidant activity”
102 K.L. Ng, B. Paull, P.R. Haddad, K. Tanaka, J. Chromatogr. A 850 (1999) 17–27. “Retention modelling of electrostatic and adsorption effects of aliphaticand aromatic carboxylic acids in ion-exclusion chromatography”
103 M.D.P. Godoy-Caballero, M.J. Culzoni, T. Galeano-Díaz, M.I. Acedo-Valenzuela, Anal. Chim. Acta 763 (2013) 11–19. “Novel combination of non-aqueous capillary electrophoresis and multivariate curve resolution-alternating least squares to determine phenolic acids in virgin olive oil”
95
104 C.A. Ballus, A.D. Meinhart, R.G. de Oliveira, H.T. Godoy, Food Res. Int. 45(2012) 136–144. “Optimization of capillary zone electrophoresis separationand online preconcentration of 16 phenolic compounds from wines producedin South America”
105 R. Hamoudová, M. Urbánek, M. Pospíšilová, M. Polášek, J. Chromatog. A1032 (2004) 281–287. “Assay of phenolic compounds in red wine by onlinecombination of capillary isotacophoresis with capillary zone electrophoresis”
106 H. Franquet-Griell, A. Checa, O. Núñez, J. Saurina, S. Hernández-Cassou,L. Puignou, J. Agr. Food Chem. 60 (2012) 8340–8349. “Determination ofpolyphenols in Spanish wines by capillary zone electrophoresis. Applicationto wine characterization by using chemometrics”
107 I.S.L. Lee, M.C. Boyce, M.C. Breadmore, Food Chem. 127 (2011) 797–801.“A rapid quantitative determination of phenolic acids in Brassica oleacea bycapillary zone electrophoresis”
108 M.M. Yassine, E. Dabek-Zlotorzynska, M. Harir, P. Schmitt-Kopplin, Anal.Chem. 84 (2012) 6586–6594. “Identification of weak and strong organic acidsin atmospheric aerosols by capillary electrophoresis/mass spectrometry andultra-high-resolution fourier transform ion cyclotron resonance massspectrometry”
109 K. Wilson in K. Wilson, J. Walker (Eds.) Principles and Techniques ofPractical Biochemistry, 4th edition, Cambridge University Press, Great Britain1994. “Protein and enzyme techniques”
110 T. Erbe, H. Brückner, J. Chromatogr. A 881 (2000) 81–91. “Chromatographicdetermination of amino acid enantiomers in beer and raw materials used fortheir manufacture”
111 B.M. Silva, S. Casal, P.B. Andrade, R.M. Seabra, M.B. Oliveira, M.A.Ferreira, Anal. Sci. 19 (2003) 1285–1290. “Development and evaluation of aGC/FID method for the analysis of free amino acids in quince fruit and jam”
112 X. Chang, T. Zhao, T. Cheng, X. Liu, H. Zhang, J. Chromatogr. B 906 (2012)91–95. “Rapid resolution liquid chromatography (RRLC) analysis of aminoacids using pre-column derivatization”
113 M.P. Bartolomeo, F. Maisano, J. Biomolec. Techn. 17 (2006) 131–137.“Validation of a reversed-phase HPLC method for quantitative amino acidanalysis”

96
114 Y. Qu, R.H. Slocum, J. Fu, W.E. Rasmussen, H.D. Rector, J.B. Miller, J.G.Coldwell, Clin. Chim. Acta 312 (2001) 153–162. “Quantitative amino acidanalysis using a Beckman system gold HPLC 126AA analyser”
115 M. Biermann, B. Bardl, S. Vollstädt, J. Linnemann, U. Knüpfer, G. Seidel, U. Horn,Amino Acids 44 (2013) 1225–1231. “Simultaneous analysis of the non-canonicalamino acids norleucine and norvaline in biopharmaceutical-related fermentationprocesses by a new ultra-high performance liquid chromatography approach”
116 S.V. Suresh Babu, M.M. Shareef, A. Pavan Kumar Shetty, K. Taranath Shetty,Ind. J. Clin. Biochem. 17 (2002) 7–26. “HPLC method for amino acids profile inbiological fluids and inborn metabolic disorders of aminoacidopathies”
117 J.J. Dalluge, S. Smith, F. Sanchez-Riera, C. McGuire, R. Hobson, J.Chromatogr. A 1043 (2004) 3–7. “Potential of fermentation profiling via rapidmeasurement of amino acid metabolism by liquid chromatography – tandemmass spectrometry”
118 Y. Yokoyama, S. Tsuji, H. Sato, J. Chromatogr. A 1085 (2005) 110–116.”Simultaneous determination of creatinine, creatine and UV-absorbing amino acidsusing dual-mode gradient low-capacity cation-exchange chromatography”
119 Y. Ren, J. Zhou, X. Zhang, Z. Li, J. Zhong, J. Yang, T. Xu, H. Tan,Biotechnol. Bioproc. Eng. 17 (2012) 1244–1251. “Analysis of free aminoacids during fermentation by Bacillus subtilis using capillary electrophoresis”
120 J. Tanyanyiwa, K. Schweizer, P.C. Hauser, Electrophoresis 24 (2003) 2119–2124.“High-voltage contactless conductivity detection of underivatized amino acidsin capillary electrophoresis”
121 F. Tezcan, S. Uza , G. Uyar, N. Öztekin, F.B. Erim, Food Chem. 141(2013) 1187–1191. “Determination of amino acids in pomegranate juices andfingerprint for adulteration with apple juices”
122 M. Wakayama, N. Aoki, H. Sasaki, R. Ohsugi, Anal. Chem. 82 (2010) 9967–9976.”Simultaneous analysis of amino acids and carboxylic acids by capillaryelectrophoresis – mass spectometry using an acidic electrolyte and uncoatedfused-silica capillary”
123 S. Akamatsu, T. Mitsuhashi, J. Food Compos. Anal. 30 (2013) 47–51.“Development of a simple analytical method using capillary electrophoresis –tandem mass spectrometry for product identification and simultaneousdetermination of free amino acids in dietary supplements containing royal jelly”

97
124 J.-S. Jeong, S.-K. Kim, S.-R. Park, Electrophoresis 33 (2012) 2112–2121.“Capillary electrophoresis mass spectrometry with sheathless electrosprayionization for high sensitivity analysis of underivatized amino acids”
125 T. Soga, Anal. Chem. 72 (2000) 1236–1241. “Amino acid analysis bycapillary electrophoresis electrospray ionization mass spectrometry”
126 United States Food and Drug Administration (FDA), Guidance for Industry,PAT-A Framework for Innovative Pharmaceutical Development, Manufacturing,and Quality Assurance, USA 2004.
127 K. Kiviharju, K. Salonen, U. Moilanen, T. Eerikäinen, J. Ind. Microbiol.Biotechnol. 35 (2008) 657–665. “Biomass measurement online: theperformance of in situ measurements and software sensors”
128 V. Vojinovi , J.M.S. Cabral, L.P. Fonseca, Sensor Actuator B Chem. 114(2006) 1083–1091. “Real-time bioprocess monitoring, part I: in situ sensors”
129 S. Marose, C. Lindemann, R. Ulber, T. Scheper, Trends Biotechnol. 17(1999) 30–34. “Optical sensor systems for bioprocess monitoring”
130 D. Landgrebe, C. Haake, T. Höpfner, S. Beutel, B. Hitzmann, T. Scheper, M.Rhiel, K.F. Reardon, Appl. Microbiol. Biotechnol. 88 (2010) 11–22. “Onlineinfrared spectroscopy for bioprocess monitoring”
131 N.D. Lourenço, J.A. Lopes, C.F. Almeida, M.C. Sarraguça, H.M. Pinheiro,Anal. Bioanal. Chem. 404 (2012) 1211–1237. “Bioreactor monitoring withspectroscopy and chemometrics: a review"
132 S. Beutel, S. Henkel, Appl. Microbiol. Biotechnol. 91 (2011) 1493–1505. “Insitu sensor techniques in modern bioprocess monitoring”
133 I. Marison, S. Hennessy, R. Foley, M. Schuler, S. Sivaprakasam, B. Freelandin C.-F. Mandenius, N.J. Titchener-Hooker (Eds.) Measurement, Monitoring,Modelling and Control of Bioprocesses, Springer-Verlag, Germany 2013.“The choice of suitable online analytical techniques and data processing formonitoring of bioprocesses”
134 J.-P. Pitkänen, A. Hokkanen, P. Heimala, J. Kauhaniemi, K. Kolari, P.Savolahti, J. Uusitalo, Finnish patent application FI20095568 andInternational patent application PCT/FI2010/050410. ”Sample port, multi-layer filter, method for sampling and use of the sample port in sampling”

98
135 C. Turner, N.F. Thornhill, N.M. Fish, Biotechnology Techniques 7 (1993) 19–24.“A novel method for the online analysis of fermentation broth using asampling device, microcentrifuge and HPLC”
136 Y.-C. Liu, F.-S. Wang, W.-C. Lee, Biochem. Eng. J. 7 (2001) 17–25. “Onlinemonitoring and controlling system for fermentation processes”
137 N. Tohmola, J. Ahtinen, J.-P. Pitkänen, V. Parviainen, S. Joenväärä, M.Hautamäki, P. Lindroos, J. Mäkinen, R. Renkonen, Biotechnol. Bioproc. Eng.16 (2011) 264–272. “Online high performance liquid chromatographymeasurements of extracellular metabolites in an aerobic batch yeast(Saccharomyces cerevisiae) culture”
138 P. von Zumbusch, T. Meyer-Jens, G. Brunner, H. Märkl, Appl. Microbiol.Biotechnol. 42 (1994) 140–146. “Online monitoring of organic substanceswith high-pressure liquid chromatography (HPLC) during the anaerobicfermentation of wastewater”
139 A. Rehorek, K. Urbig, R. Meurer, C. Schäfer, A. Plum, G. Braun, J.Chromatogr. A 949 (2002) 263–268. “Monitoring of azo dye degradationprocesses in a bioreactor by online high-performance liquid chromatography”
140 A. Rehorek, A. Plum, Anal. Bioanal. Chem. 384 (2006) 1123–1128. “OnlineLC-MS-MS process monitoring for optimization of biological treatment ofwastewater containing azo dye concentrates”
141 L.R.V. de Sá, M.A.L. de Oliveira, M.C. Cammarota, A. Matos, V.S. Ferreira-Laitão, Int. J. Hydrogen Energ. 36 (2011) 15177–15186. “Simultaneousanalysis of carbohydrates and volatile fatty acids by HPLC for monitoringfermentative biohydrogen production”
142 C. Kaiser, T. Pototzki, A. Ellert, R. Luttmann, Eng. Life Sci. 8 (2008) 132–138.“Applications of PAT – Process Analytical Technology in recombinant proteinprocesses with Escherichia coli”
143 W. Lili, Q. Jie, H. Zhongce, H. Wei, Anal. Chim. Acta 557 (2006) 262–266.“Determination of dihydroxyacetone and glycerol in fermentation broth bypyrolytic methylation/gas chromatography”
144 M. Wortberg, W. Ziemer, M. Kugel, H. Müller, H.-J. Neu, Anal. Bioanal.Chem. 384 (2006) 1113–1122. “Monitoring industrial wastewater by onlineGC-MS with direct aqueous injection”

99
145 H. Sirén, R. Kokkonen, T. Hiissa, T. Särme, O. Rimpinen, R. Laitinen, J.Chromatogr. A 895 (2000) 189–196. ”Determination of soluble anions andcations from waters of pulp and paper mills with online coupled capillaryelectrophoresis”
146 R. Kokkonen, H. Sirén, S. Kauliomäki, S. Rovio, K. Luomanperä, J.Chromatogr. A 1032 (2004) 243–252. ”Online process monitoring of water-soluble ions in pulp and paper machine waters by capillary electrophoresis”
147 S. Ehala, I. Vassiljeva, R. Kuldvee, R. Vilu, M. Kaljurand, Fresen. J. Anal.Chem. 371 (2001) 168–173. “Online coupling of miniatyrized bioreactor withcapillary electrophoresis, via a membrane interface, for monitoring theproduction of organic acids by microorhanisms”
148 M. Kulp, M. Kaljurand, J. Chromatogr. A 1032 (2004) 305–312. “Onlinemonitoring of enzymatic conversion of adenosine triphosphate to adenosinediphosphate by micellar electrokinetic chromatography”
149 H. Tahkoniemi, K. Helmja, A. Menert, M. Kaljurand, J. Pharmaceut. Biomed.Anal. 41 (2006) 1585–1591. “Fermentation reactor coupled with capillaryelectrophoresis for online bioprocess monitoring”
150 C.J. Watson, R. Lydic, H.A. Baghdoyan, J. Neurochem. 118 (2011) 571–580.“Sleep duration varies as a function of glutamate and GABA in rat pontinereticular formation”
151 G. Hancu, B. Simon, A. Rusu, E. Mircia, Á. Gyéresi, Adv. Pharmaceut. Bull.3 (2013) 1–8. “Principles of micellar electrokinetic capillary chromatographyapplied in pharmaceutical analysis”
152 M. Chiari, N. Dell’Orto, L. Casella, J. Chromatogr. A 745 (1996) 93–101.”Separation of organic acids by capillary zone electrophoresis in bufferscontaining divalent metal cations”
153 H.H. Lauer, G.P. Rozing, High Performance Capillary Electrophoresis – aPrimer, 2nd edition, Agilent Technologies, Germany 2010. “Principles ofcapillary electrophoresis”
154 J.M. Izco, M. Tormo, R. Jiménez-Flores, J. Agric. Food Chem. 50 (2002)1765–1773. “Development of CE method to analyse organic acids in dairyproducts: application to study the metabolism of heat-shocked spores”

100
155 B.L. Karger in M.G. Khaledi (Ed.) High Performance Capillary Electrophoresis,Chemical Analysis Series, Vol. 146, John Wiley & Sons, Inc., USA 1998.“Capillary electrophoresis: overview and perspective”
156 J.P. Kutter, O. Geschke in O. Geschke, H. Klank, P. Telleman (Eds.)Microsystem Engineering of Lab-on-a-Chip Devices, 2nd edition, Wiley-VCHVerlag GmbH & Co. KGaA, Germany 2008. “Analytical chemistry onmicrosystems”
157 J.E. Melanson, N.E. Baryla, C.A. Lucy, TrAC 20 (2001) 365–374. “Dynamiccapillary coatings for electroosmotic flow control in capillary electrophoresis”
158 K.D. Altria, LC·GC Europe, 25 (2012) 201–206. “Enhanced capillaryelectrophoresis performance using dynamic surface coatings”
159 H.H. Lauer, G.P. Rozing, High Performance Capillary Electrophoresis – aPrimer, 2nd edition, Agilent Technologies, Germany 2010. “Practicaloperation and method development”
160 K.D. Altria, LC·GC Europe, 25 (2012) 682–684. “Analysis of small organicacids by capillary electrophoresis”
161 H. Schwartz, T. Pritchett, Separation of Proteins and Peptides by CapillaryElectrophoresis: Application to Analytical Biotechnology, CE Primer,Beckmann Coulter, USA 1994. “Prediction of electrophoretic mobility”
162 S. Terabe, Chem. Rec. 8 (2008) 291–301. “Micellar electrokinetic chromatographyfor high-performance analytical separation”
163 C.P. Palmer, S. Terabe, Anal. Chem. 69 (1997) 1852–1860. “Micellepolymers as pseudostationary phases in MEKC: chromatographic performanceand chemical selectivity”
164 http://www.sigmaaldrich.com/img/assets/15402/Detergent_Selection_Table.pdf
165 L. Cruz, S.A. Shippy, J.V. Sweedler in M.G. Khaledi (Ed.) High PerformanceCapillary Electrophoresis, Chemical Analysis Series, Vol. 146, John Wiley &Sons, Inc., USA 1998. “Capillary electrophoretic detectors based on light”
166 H.H. Lauer, G.P. Rozing, High Performance Capillary Electrophoresis – aPrimer, 2nd edition, Agilent Technologies, Germany 2010. “Instrumentation”

101
167 The Molecular Probes® Handbook: A Guide to Fluorescent Probes andLabeling Technologies, 11th edition, Life Technologies Corporation, USA2010. “Introduction to fluorescent techniques”
168 H.A. Bardelmeijer, J.C.M. Waterval, H. Lingeman, R. van´t Hof, A. Bult,W.J.M. Underberg, Electrophoresis 18 (1997) 2214–2227. “ Pre-, on- andpost-column derivatization in capillary electrophoresis”
169 M. Herrero, E. Ibáñez, S. Fanali, A. Cifuentes, Electrophoresis 28 (2007)2701–2709. “Quantitation of chiral amino acids from microalgae by MEKCand LIF detection”
170 The Molecular Probes® Handbook: A Guide to Fluorescent Probes andLabeling Technologies, 11th edition, Life Technologies Corporation, USA2010. “Fluorophores and their amine-reactive derivatives”
171 N.R. Joseph, J. Biol. Chem. 164 (1946) 529–541. “The dissociation constantsof organic calcium complexes”
172 M. Chiari, J. Chromatogr. A 805 (1998) 1–15. ”Enhancement of selectivity incapillary electrophoretic separations of metals and ligands through complexformation”
173 S. Ehala, M. Vaher, M. Kaljurand, J. Agric. Food Chem. 53 (2005) 6484–6490.“Characterization of phenolic profiles of northern European berries bycapillary electrophoresis and determination of their antioxidant activity”
174 C. Martin, L.J. Jönsson, Enzyme Microb. Technol. 32 (2003) 386–395.“Comparison of the resistance of industrial and laboratory strains ofSaccharomyces and Zygosaccharomyces to lignocellulose-derivedfermentation inhibitors”
175 L. Sola, M. Chiari, J. Chromatogr. A 1270 (2012) 324–329. “Modulation ofelectroosmotic flow in capillary electrophoresis using functional polymercoatings”
176 Z. Wagner, T. Tábi, T. Jakó, G. Zachar, A. Csillag, É. Szök , Anal. Bioanal.Chem. 404 (2012) 2363–2368. “Chiral separation and determination ofexcitatory amino acids in brain samples by CE-LIF using dual cyclodextrinsystems”

102
177 M.P. Lorenzo, A. Navarrete, C. Balderas, A. Garcia, J. Pharm. Biomed. Anal.73 (2013) 116–124. “Optimization and validation of a CE-LIF method foramino acid determination in biological samples”
178 H.-L. Chen, X.-J. Zhang, S.-D. Qi, H.X. Xu, J.J.Y. Sung, Z.-X. Bian, J.Chromatogr. B 877 (2009) 3248–3252. “Simultaneous determination ofglutamate and aspartate in rat periaqueductal gray matter microdialysates bycapillary electrophoresis with laser-induced fluorescence”
179 S. Anouti, O. Vandenabeele-Trambouze, D. Koval, H. Cottet, Anal. Chem. 80(2008) 1730–1736. “Heart-cutting two-dimensional capillary electrophoresisfor the on-line purification and separation of derivatized amino acids”
180 A.B. Martínez-Girón, C. García-Ruiz, A.L. Crego, M.L. Marina,Electrophoresis 30 (2009) 696–704. “Development of an in-capillaryderivatization method by CE for the determination of chiral amino acids indietary supplements and wines”
181 T.N. Chiesl, W.K. Chu, A.M. Stockton, X. Amashukeli, F. Grunthaner, R.A.Mathies, Anal. Chem. 81 (2009) 2537–2544. “Enhanced amine and aminoacid analysis using Pacific Blue and the Mars Organic Analyzer microchipcapillary electrophoresis system”
182 P. Kubá , P. Bo ek, J. Chromatogr. A 1234 (2012) 2–8. “On-line coupling of aclean-up device with supported liquid membrane to capillary electrophoresisfor direct injection and analysis of serum and plasma samples”
183 A.V.C Simionato, E.P. Moraes, E. Carrilho, M.F.M. Tavares, E. Kenndler,Electrophoresis 29 (2008) 2051–2058. “Determination of amino acids bycapillary electrophoresis-electrospray ionization-mass spectrometry: anevaluation of different protein hydrolysis procedures”
184 T. Atherton, R. Croxton, M. Baron, J. Gonzalez-Rodriguez, L. Gámiz-Gracia,A.M. García-Campaña, J. Sep. Sci. 35 (2012) 2994–2999. “Analysis ofamino acids in latent fingerprint residue by capillary electrophoresis-massspectrometry”
185 S. Sato, T. Soga, T. Nishioka, M. Tomita, Plant J. 40 (2004) 151–163.”Simultaneous determination of the main metabolites in rice leaves usingcapillary electrophoresis mass spectrometry and capillary electrophoresisdiode array detection”

103
186 N. Zhang, H. Wang, Z.-X. Zhang, Y.-H. Deng, H.-S. Zhang, Talanta 76(2008) 791–797. “Sensitive determination of biogenic amines by capillaryelectrophoresis with a new fluorogenic reagent 3-(4-fluorobenzoyl)-2-quinolinecarboxaldehyde”
187 R.M. Burks, D.S. Hage, Electrophoresis 30 (2009) 657–660. “18-crown-6 asa class I organic modifier in MEKC”
188 I. Fradi, A.-C. Servais, C. Lamalle, M. Kallel, M. Abidi, J. Crommen, M. Fillet,J. Chromatogr. A 1267 (2012) 121–126. “Chemo- and enantio-selectivemethod for the analysis of amino acids by capillary electrophoresis with in-capillary derivatization”
189 G.T. Hermanson, Bioconjugate Techniques, 2nd edition, Elsevier Inc., USA2008. “The chemistry of reactive groups”


PUBLICATION I
Capillary electrophoresis for the monitoring of carboxylic
acid production byGluconobacter oxydans
In: Journal of Chromatography A 1217, pp. 1537–1542.
Copyright 2009 Elsevier.Reprinted with permission from the publisher.

I/1
Journal of Chromatography A, 1217 (2010) 1537–1542
Contents lists available at ScienceDirect
Journal of Chromatography A
journa l homepage: www.e lsev ier .com/ locate /chroma
Capillary electrophoresis for the monitoring of carboxylic acid production byGluconobacter oxydans
Heidi Turkiaa,∗, Heli Siréna,b, Juha-Pekka Pitkänena, Marilyn Wiebea, Merja Penttiläa
a VTT Biotechnology, P.O. Box 1000, Fin-02044 VTT, Espoo, Finlandb Lappeenranta University of Technology, P.O. Box 20, FIN-53580 Lappeenranta, Finland
a r t i c l e i n f o
Article history:Received 1 September 2009Received in revised form22 December 2009Accepted 24 December 2009Available online 4 January 2010
Keywords:Capillary electrophoresisOrganic acidsComplex forming agents in electrolytesolutionBioprocess monitoring
a b s t r a c t
Determination of carboxylic acids in Gluconobacter oxydans fermentations of wheat straw hydrolyzatewas carried out. This matrix is of complex composition containing carbohydrates, organic compounds(e.g., amino acids, toxins), and inorganic salts making the analysis challenging even with separationtechniques. A method based on capillary electrophoresis with indirect UV detection was developed for thesimultaneous quantification of 18 carboxylic acids. The background electrolyte solution of ammonia, 2,3-pyridinedicarboxylic acid, and Ca2+ and Mg2+ salts, containing myristyltrimethylammonium hydroxideas a dynamic capillary coating reagent, was validated for the robust and repeatable separation of thecarboxylic acids. Intraday relative standard deviations in the optimized method were less than 1.6% formigration times and between 1.0% and 5.9% for peak area. Interday relative standard deviations were lessthan 5.0% for migration times and between 5.7% and 9.3% for peak area. With 11 nl injected, detectionlimits for the analytes were between 10 and 43 �mol/l. Detection limits ranged from 0.1 to 0.5 pmol atsignal-to-noise ratio of 3. The results demonstrated that wheat straw hydrolyzate was a suitable substratefor G. oxydans with a product yield of 45% for the formation of xylonic acid from xylose and 96% for theformation of gluconic acid from glucose.
© 2009 Elsevier B.V. All rights reserved.
1. Introduction
Monitoring and control of processes in bioreactors is of criticalimportance in biotechnology [1]. The essential tasks in bioprocessmonitoring are the determination of substrate uptake rate, spe-cific growth rate of the organisms, and the product formation rate.In practice, the most widely measured and controlled parametersare pH, dissolved oxygen and carbon dioxide, temperature andpressure [2,3]. Carboxylic acids are involved in many metabolicprocesses of the cell and they are important metabolites of sev-eral biochemical pathways in microorganisms. Because they arefrequently either the main products or significant by-products inbioprocesses, monitoring them is often essential [4].
There has been a considerable interest in the use of lignocel-lulosic materials as a renewable source of chemicals for over twodecades now [5]. Lignocellulose is a highly promising raw mate-rial; it is a natural and cheap polymer that is abundantly presentin agricultural waste (wheat straw, corn stalks, soybean residues,sugarcane bagasse), industrial waste (pulp and paper industry),forestry residues, and municipal solid waste. Lignocellulose is esti-
∗ Corresponding author at: VTT Technical Research Centre of Finland, P.O. Box1000, Fin-02044 VTT, Espoo, Finland. Tel.: +358 40 358 1271; fax: +358 20 722 7071.
E-mail address: [email protected] (H. Turkia).
mated to account for about 50% of all biomass on Earth [6]. Itconsists of three main components: cellulose, hemicellulose, andlignin. Wheat straw is composed of 35–45% cellulose and 20–30%hemicelluloses with a relatively low lignin content (<20%) [7]. Cel-lulose and hemicellulose are composed of chains of carbohydratemolecules that can be hydrolyzed to monomeric sugars. Celluloseis composed of glucose and hemicellulose of galactose, mannose,glucose, xylose, and arabinose [8]. The pentose monosaccharidexylose together with the hexose monosaccharide glucose, are twoof the most abundant sugars found in nature. Xylose is the predom-inant hemicellulosic sugar of hardwoods and agricultural residues,accounting for up to 25% of the dry biomass of some plant species.The abundance and ease of isolation of xylose makes it an impor-tant potential feedstock for the production of bulk chemicals suchas carboxylic acids [9].
Most monomeric sugars can be metabolized by microorganisms,but an organism which is able to efficiently convert a variety ofsugars (pentoses and hexoses) to useful products, and to toleratetoxins and stress conditions is required to exploit lignocellulosicmaterial [6]. Bacterial metabolism of xylose characteristically gen-erates multiple products, including alcohols (butanol, ethanol,isopropanol, 2,3-butanediol), carboxylic acids (acetic, butyric,formic, and lactic), polyols (arabitol, glycerol, xylitol), ketones(acetone), and gases (methane, carbon dioxide, hydrogen) [1]. Glu-conobacter oxydans has an exceptional capacity for the oxidative
0021-9673/$ – see front matter © 2009 Elsevier B.V. All rights reserved.doi:10.1016/j.chroma.2009.12.075

I/2 I/3
H. Turkia et al. / J. Chromatogr. A 1217 (2010) 1537–1542 1539
Fig. 1. (A) Blank cultivation medium; and (B) cultivation medium where the studied 18 organic acids have been added in concentration of 50 mg/l. Peak assignments: 1,formic acid; 2, malonic acid; 3, maleic acid; 4, �-ketoglutaric acid; 5, succinic acid; 6, oxalic acid; 7, malic acid; 8, isocitric acid; 9, galactaric acid; 10, acetic acid; 11, glycolicacid; 12, propionic acid; 13, lactic acid; 14, citric acid; 15, xylonic acid; 16, arabonic acid; 17, gluconic acid; and 18, galacturonic acid. Analysis conditions as described in thetext.
carboxylic acids potentially present in microbial fermentation pro-cess samples. Identification and quantification of these acids is ofgreat importance in controlling the bioprocess and in monitoringthe behavior of microorganisms in order to estimate the reac-tion kinetics. The carboxylic acids of this study are presented inTable 1.
2. Experimental
2.1. Chemicals
All chemicals were of reagent grade. Chemicals for the BGE were2,3-pyridinedicarboxylic acid (2,3-PDC) (Sigma–Aldrich, Stein-heim, Germany), myristyltrimethylammonium hydroxide (MTAH)(Waters, Milford, USA), calcium chloride dihydrate and magne-sium chloride hexahydrate (Riedel-de Haen, Seelze, Germany), andmethanol (Rathburn, Walkerburn, Scotland). Gluconic acid (lac-tone), galacturonic acid, acetic acid, propionic acid, galactaric acid,d-lactic acid (lithium salt), and glycolic acid were purchased fromFluka (Buchs, Switzerland). Formic acid, malonic acid, and citric acid(citric acid monohydrate) were from Merck (Darmstadt, Germany).Isocitrate, maleic acid, malic acid, succinic acid, oxalic acid, and �-ketoglutaric acid were from Sigma–Aldrich. Xylonic acid (calciumsalt) and arabonic acid were produced and purified at VTT (Espoo,Finland). 1000 mg/l stock solutions were prepared of the 18 car-boxylic acids and calcium and magnesium salts. Sodium hydroxide(Akzo Nobel, Bohus, Sweden) was prepared as a 1 M stock solu-tion.
2.2. Instrumentation
All the measurements were made with the P/ACE MDQ capil-lary electrophoresis system (Beckmann Coulter Inc., Fullerton, USA)equipped with a PDA detector. Untreated fused-silica capillaries(Teknolab, Norway) with inner diameter of 50 �m, outer diameterof 365 �m, and total length of 80 cm (70 cm to the detector) wereused. Capillaries were conditioned before use with 0.1 M NaOH,Milli-Q purified water, and BGE for 20, 10, and 20 min, respectively.Voltage (20 kV) was then applied for 10 min. Between analyses, cap-
illaries were rinsed with 0.1 M NaOH and Milli-Q purified water for1 min each and with BGE for 3 min. Data was collected and pro-cessed with 32Karat software (Beckmann Coulter Inc., Fullerton,USA). All of the solutions were prepared in Milli-Q purified water(Millipore, Bedford, USA).
2.3. Analysis conditions
BGE was prepared with 20 mM 2,3-PDC, 0.3 mM MTAH, 30 mg/lCa2+ and 30 mg/l Mg2+ in methanol:water (10:90, v/v). The pH ofthe solution was adjusted to 9 with ammonia (25% (v/v), Merck).Before analysis, the BGE was degassed by ultrasound and filteredthrough a 0.45 �m Acrodisc GHP syringe filter (Pall Life Science,Ann Arbor, USA).
Standards and samples were injected by using 0.5 psi pressurefor 15 s. Separation was carried out at −20 kV (reversed polarity) atconstant capillary temperature 25 ◦C. Indirect UV detection was at254 nm.
2.4. Microbial growth conditions
G. oxydans E97003 was maintained in 300–450 ml culturesin Infors 500 ml Multifors bioreactors at pH 5.6, 30 ◦C, agi-tation 500 rpm, and aeration of 1.3 ± 0.2 volume air [volumeculture]−1 min−1. Cultures were inoculated with cells grown for2 days in medium containing 5 g/l yeast extract, 5 g/l (NH4)2SO4,2 g/l K2HPO4·3H2O, 1 g/l KH2PO4, 0.5 g/l MgSO4·7H2O, 8 g/l glyc-erol, 1 g/l glucose and 1 g/l xylose to give an initial concentrationof approximately 0.1 g/l biomass. Cultures were maintained inmedium derived from wheat straw hydrolyzate (Abengoa Bioen-ergia Nuevas Tecnologias, Spain) supplemented with 5 g/l yeastextract. To avoid contamination and for sterilizing, the medium wasautoclaved at 121 ◦C for 20 min.
2.5. Sample preparation
For standardization, five levels of calibration mixtures were pre-pared for the 18 carboxylic acids. The concentration range of thestandard mixtures was 5–100 mg/l. Before analysis the fermenta-
1538 H. Turkia et al. / J. Chromatogr. A 1217 (2010) 1537–1542
Table 1Carboxylic acids and their structures.
Compound Molecular weight (g/mol) Structure Compound Molecular weight (g/mol) Structure
Formic acid 46.026 Acetic acid 60.052
Propionic acid 74.078 Glycolic acid 76.052
Oxalic acid 90.036 Lactic acid 90.078
Malonic acid 104.062 Maleic acid 116.072
Succinic acid 118.088 Malic acid 134.088
�-Ketoglutaric acid 146.098 Arabonic acid 166.13
Xylonic acid 166.13 Citric acid 192.124
Isocitrate 192.124 Galacturonic acid 194.14
Gluconic acid 196.156 Galactaric acid 210.139
transformation of carbohydrates to polyhydric alcohols, and car-boxylic acids [5].
The most widely available and accessible sources of ligno-cellulosic biomass are agricultural residues [10]. Wheat straw isthe major crop residue in Europe and the second largest agricul-tural residue in the world [11]. The wheat straw hydrolyzate usedhere was prepared as a xylose rich hydrolyzate, containing smallamounts of glucose and arabinose. G. oxydans is able to convert glu-cose and xylose to gluconic acid and xylonic acid, respectively, andthese two carboxylic acids can be further used as ligands, buffers,dispersants, etc.
Traditionally, carboxylic acids have been analyzed by gaschromatography (GC) [12,13] and either by liquid chromatogra-phy (LC) [14–17] or by its submethod ion chromatography (IC)[18,19]. However, these methods have some deficiencies. Whenusing GC, traditionally the carboxylic acids have been analyzedafter derivatization to make them volatile, and therefore directquantification has not been used [20]. LC is time-consumingand limited by a narrow linear dynamic range, high limitsof detection (g/l), and susceptibility to matrix interferences[14]. IC lacks selectivity for carboxylic acids, which are weaklyretained onto ion exchange materials. Furthermore, it has fairlymodest chromatographic efficiency and low duration of thestationary phases [21].
Capillary electrophoresis (CE) is a versatile technique with nospecial need for derivatization and no limitation on polar solvents,analytes or samples. Resolution and efficiency are high in optimizedmethods, creating great potential for rapid detection and quantifi-cation [22]. Usually, the separation of analytes by CE is based on
their different electrophoretic mobilities, which are strongly influ-enced by the composition of the background electrolyte (BGE), pH,ionic strength, concentration of organic cosolvents, and electrolyteadditives [23]. The technique offers great possibilities for the anal-ysis of real life samples.
CE has been widely used in the analysis of carboxylic acids.Methods have been developed to determine them in a diversity ofmatrices, including juice [24–26], wine [20,27,28], beer [29,30], cof-fee [31] and dairy products [12,22,32]. Few studies have dealt withcarboxylic acids in fermentation samples of lignocellulosic material[10,15,33,34], and only one study has been made by capillary elec-trophoresis [35]. Soga and Ross [36] established a CE method forthe analysis of 23 different organic acids from soy sauce, nutrienttonic and pineapple. For our analysis purposes this method was notefficient enough. The high pH would have caused problems becauseof very high concentration of sugars in the fermentation samples.Sugars are ionized at pH above 12 and can be seen in the electro-pherogram. In lower pH values the separation was not sufficientenough. Moreno et al. [20] introduced a CE method for the analy-sis of 9 organic acids from must, wine, brandy and vinegar. Theyused sodium tetraborate buffer and Ca2+ and Mg2+ as the metalsto complex the carboxylic acids. Combination of these two alkaliearth metals enhanced the separation significantly. Even so, usingtetraborate buffer was not applicable in this study because mostof the organic acids presented in this article could not be detectedusing this electrolyte solution. Combining these two CE methodsgave the right separation efficiency.
The aim of this work was to develop a CE method for thesimultaneous separation, identification and quantification of 18

I/3
H. Turkia et al. / J. Chromatogr. A 1217 (2010) 1537–1542 1539
Fig. 1. (A) Blank cultivation medium; and (B) cultivation medium where the studied 18 organic acids have been added in concentration of 50 mg/l. Peak assignments: 1,formic acid; 2, malonic acid; 3, maleic acid; 4, �-ketoglutaric acid; 5, succinic acid; 6, oxalic acid; 7, malic acid; 8, isocitric acid; 9, galactaric acid; 10, acetic acid; 11, glycolicacid; 12, propionic acid; 13, lactic acid; 14, citric acid; 15, xylonic acid; 16, arabonic acid; 17, gluconic acid; and 18, galacturonic acid. Analysis conditions as described in thetext.
carboxylic acids potentially present in microbial fermentation pro-cess samples. Identification and quantification of these acids is ofgreat importance in controlling the bioprocess and in monitoringthe behavior of microorganisms in order to estimate the reac-tion kinetics. The carboxylic acids of this study are presented inTable 1.
2. Experimental
2.1. Chemicals
All chemicals were of reagent grade. Chemicals for the BGE were2,3-pyridinedicarboxylic acid (2,3-PDC) (Sigma–Aldrich, Stein-heim, Germany), myristyltrimethylammonium hydroxide (MTAH)(Waters, Milford, USA), calcium chloride dihydrate and magne-sium chloride hexahydrate (Riedel-de Haen, Seelze, Germany), andmethanol (Rathburn, Walkerburn, Scotland). Gluconic acid (lac-tone), galacturonic acid, acetic acid, propionic acid, galactaric acid,d-lactic acid (lithium salt), and glycolic acid were purchased fromFluka (Buchs, Switzerland). Formic acid, malonic acid, and citric acid(citric acid monohydrate) were from Merck (Darmstadt, Germany).Isocitrate, maleic acid, malic acid, succinic acid, oxalic acid, and �-ketoglutaric acid were from Sigma–Aldrich. Xylonic acid (calciumsalt) and arabonic acid were produced and purified at VTT (Espoo,Finland). 1000 mg/l stock solutions were prepared of the 18 car-boxylic acids and calcium and magnesium salts. Sodium hydroxide(Akzo Nobel, Bohus, Sweden) was prepared as a 1 M stock solu-tion.
2.2. Instrumentation
All the measurements were made with the P/ACE MDQ capil-lary electrophoresis system (Beckmann Coulter Inc., Fullerton, USA)equipped with a PDA detector. Untreated fused-silica capillaries(Teknolab, Norway) with inner diameter of 50 �m, outer diameterof 365 �m, and total length of 80 cm (70 cm to the detector) wereused. Capillaries were conditioned before use with 0.1 M NaOH,Milli-Q purified water, and BGE for 20, 10, and 20 min, respectively.Voltage (20 kV) was then applied for 10 min. Between analyses, cap-
illaries were rinsed with 0.1 M NaOH and Milli-Q purified water for1 min each and with BGE for 3 min. Data was collected and pro-cessed with 32Karat software (Beckmann Coulter Inc., Fullerton,USA). All of the solutions were prepared in Milli-Q purified water(Millipore, Bedford, USA).
2.3. Analysis conditions
BGE was prepared with 20 mM 2,3-PDC, 0.3 mM MTAH, 30 mg/lCa2+ and 30 mg/l Mg2+ in methanol:water (10:90, v/v). The pH ofthe solution was adjusted to 9 with ammonia (25% (v/v), Merck).Before analysis, the BGE was degassed by ultrasound and filteredthrough a 0.45 �m Acrodisc GHP syringe filter (Pall Life Science,Ann Arbor, USA).
Standards and samples were injected by using 0.5 psi pressurefor 15 s. Separation was carried out at −20 kV (reversed polarity) atconstant capillary temperature 25 ◦C. Indirect UV detection was at254 nm.
2.4. Microbial growth conditions
G. oxydans E97003 was maintained in 300–450 ml culturesin Infors 500 ml Multifors bioreactors at pH 5.6, 30 ◦C, agi-tation 500 rpm, and aeration of 1.3 ± 0.2 volume air [volumeculture]−1 min−1. Cultures were inoculated with cells grown for2 days in medium containing 5 g/l yeast extract, 5 g/l (NH4)2SO4,2 g/l K2HPO4·3H2O, 1 g/l KH2PO4, 0.5 g/l MgSO4·7H2O, 8 g/l glyc-erol, 1 g/l glucose and 1 g/l xylose to give an initial concentrationof approximately 0.1 g/l biomass. Cultures were maintained inmedium derived from wheat straw hydrolyzate (Abengoa Bioen-ergia Nuevas Tecnologias, Spain) supplemented with 5 g/l yeastextract. To avoid contamination and for sterilizing, the medium wasautoclaved at 121 ◦C for 20 min.
2.5. Sample preparation
For standardization, five levels of calibration mixtures were pre-pared for the 18 carboxylic acids. The concentration range of thestandard mixtures was 5–100 mg/l. Before analysis the fermenta-

I/4 I/5
H. Turkia et al. / J. Chromatogr. A 1217 (2010) 1537–1542 1541
Fig. 2. Electrophoretic separation of carboxylic acids in wheat straw hydrolyzate. Fermentation time: (A) 0 h; (B) 19.8 h; and (C) 119.1 h. Peak assignments: 1, formic acid;2, succinic acid; 3, malic acid; 4, acetic acid; 5, lactic acid; 6, xylonic acid; and 7, gluconic acid. Analysis conditions as in Fig. 1.
Table 3Concentrations (mg/l) of carboxylic acids in wheat straw hydrolyzates.
Sample id
52(1) 52(2) 52(3) 52(4) 52(5) 52(8) BS52(6) BS52(7)0a 3.5a 19.8a 26.8a 44.3a 76.7a 99.9a 119.1a
Formic acid 960 960 980 1130 1050 1080 1200 1040Succinic acid 130 130 140 150 160 190 200 180Malic acid 770 590 610 1140 660 710 800 680Acetic acid 6100 5600 6100 7000 6000 6100 6100 5400Lactic acid 98 104 91 88 80 71 67 73Xylonic acid nd 2200 9700 10 800 15 800 16 900 17 200 17 400Gluconic acid nd 3000 5500 5300 5200 5100 5600 5100
nd, not detected.a Fermentation time (h).
acids were less than 5.0% and those for peak areas between 5.7%and 9.3%. Detection limits for the standards were between 2 and5 mg/l, i.e. 0.1–0.5 pmol. Correlation coefficients for the calibrationcurves were between 0.9921 and 0.9996.
The calibration curves, correlation coefficients, repeatabilities,and reproducibilities of the method are summarized in Table 2.
3.3. Analysis of fermentation samples
The optimized method was applied to the analysis of sam-ples from a G. oxydans culture in wheat straw hydrolyzate, whichwas rich in xylose. Samples were diluted to three different dilu-tions before analysis: 1:5 (v/v) for the analysis of carboxylic acidsin small concentrations (less than 100 mg/l), 1:100 (v/v) for highconcentrations (100–10 000 mg/l) and 1:250 (v/v) for very highconcentrations (>10 000 mg/l). Electropherograms for samples arepresented in Fig. 2. The fermentation time in Fig. 2A is 0, in 2B it is19.8 and in 2C it is 119.1 h. The negative peaks in Fig. 2B and C aremost probably UV absorbing carboxylic acids, e.g., different pheno-lic acids or furan derivatives that are formed during fermentations.The formation of these compounds is highly avoidable in fermen-tations since they can act as inhibitors. The results are summarizedin Table 3. As the results demonstrate, there was rapid increase inxylonic acid and gluconic acid concentration during fermentation(Fig. 3). Changes in the levels of other carboxylic acids were insignif-icant. Because every sample had different ion strength, migrationtimes of organic acids varied between samples. However, the pro-file of the electropherograms and peak shapes remained the same
and the identification was easy. Just to make sure, the identificationwas assured by spiking the first sample. The metabolism of G. oxy-dans and its ability to convert certain sugars to certain organic acidsis well known. Using this strain and these cultivation conditions,only 7 organic acids were formed.
It is worth noting that the hydrolyzate from the fermentationof wheat straw contained glucose (5.3 g/l) as well as xylose (39 g/l).Gluconic acid production was complete within less than 20 h, butxylonic acid production continued. The yield for the production ofxylonic acid from xylose was 45%, and for the production of glu-conic acid from glucose was 96%. Thus, G. oxydans was able toproduce large amounts of the desired carboxylic acids from wheatstraw hydrolyzate. The high concentrations of formic, malic andacetic acids were not metabolized by G. oxydans, but did not pre-
Fig. 3. Production of xylonic (�) and gluconic (�) acids from wheat strawhydrolyzate by Gluconobacter oxydans.
1540 H. Turkia et al. / J. Chromatogr. A 1217 (2010) 1537–1542
Table 2Performance of the method under optimized conditions. Analytes are prepared in yeast extract.
Formic acid Malonic acid Maleic acid �-Ketoglutaric acid Succinic acid Oxalic acid
Migration time (intraday)a 0.74 0.78 0.81 0.81 0.82 0.84Migration time (interday)b 3.01 3.12 3.15 3.20 3.21 3.34Peak area (intraday)a 5.34 5.91 4.79 5.11 3.02 4.01Peak area (interday)b 9.34 6.93 7.70 9.00 5.71 6.64Calibration equation y = 77.85x + 138.79 y = 76.522x + 97.892 y = 53.912x − 10.12 y = 53.702x − 155.72 y = 82.747x + 723.29 y = 73.784x − 77.377Calibration correlation coefficient 0.9996 0.9951 0.9984 0.9966 0.9987 0.9921Detection limit (mg/l) 2 2 2 2 2 2Quantification limit (mg/l) 5 5 5 5 5 5
Malic acid Isocitric acid Galactaric acid Acetic acid Glycolic acid Propionic acid
Migration time (intraday)a 0.85 0.94 0.99 1.01 1.01 1.13Migration time (interday)b 3.37 3.41 3.49 3.55 3.62 3.78Peak area (intraday)a 2.22 5.71 5.76 5.34 2.61 4.30Peak area (interday)b 7.27 7.23 8.12 8.12 6.44 6.81Calibration equation y = 63.709x + 71.634 y = 57.933x − 172.07 y = 48.6x − 82.184 y = 124.07x + 419.46 y = 92.3x − 60.602 y = 89.502x + 76.24Calibration correlation coefficient 0.9992 0.9992 0.9989 0.9968 0.9993 0.9987Detection limit (mg/l) 2 2 5 2 2 2Quantification limit (mg/l) 5 5 10 5 5 5
Lactic acid Citric acid Xylonic acid Arabonic acid Gluconic acid Galacturonic acid
Migration time (intraday)a 1.14 1.45 1.46 1.46 1.56 1.61Migration time (interday)b 3.91 3.98 4.71 4.73 4.94 5.01Peak area (intraday)a 4.28 4.79 5.89 3.76 5.18 0.99Peak area (interday)b 7.26 7.31 6.43 7.95 7.04 6.30Calibration equation y = 97.321x + 921.61 y = 93.506x − 278.23 y = 64.405x − 206.7 y = 70.445x − 90.896 y = 54.059x − 166.4 y = 62.454x − 313.05Calibration correlation coefficient 0.9988 0.9980 0.9937 0.9995 0.9988 0.9985Detection limit (mg/l) 2 5 5 5 5 5Quantification limit (mg/l) 5 10 10 10 10 10
a Percentage of relative standard deviation, n = 8.b Percentage of relative standard deviation, n = 4.
tion samples were diluted to 1:5, 1:100, and 1:250 with Milli-Qpurified water and centrifuged at 10 000 rpm for 10 min.
3. Results and discussion
3.1. Method validation
Determination of organic acids has often been achieved in CEwith direct UV detection. However, all the analytes of interest donot exhibit sufficient UV absorption. Use of indirect UV detection byadding a UV absorbing reagent to the BGE is one way to overcomethe problem [21]. From the wide variety of different UV absorbingchemicals, we chose 2,3-PDC due to research group’s prior experi-ments [37].
MTAH, a surfactant that is commonly used in the analysis of car-boxylic acids, was added as modifier to change the direction of theelectroosmotic flow (EOF) [20,26,38,39]. Therefore, negative volt-age could be applied to accelerate the separation of the carboxylicacids.
Cations of the alkali earth group have strong tendencies toform partially dissociated complexes in solution with the anionsof carboxylic acids and other weak acids. The affinity of the asso-ciation increases with the number of carboxylic acid groups of theacid anion [40]. Formation of these metal complexes is generallyrapid, and the relatively weak complexes are in equilibrium withthe noncomplexed components. This type of complex formationis widely exploited in chromatography to achieve selectivity. Themost important parameters affecting complexation equilibrium aretype and concentration of the metal and the pH of the electrolyte[41]. Ca2+ and Mg2+ ions were added to the BGE to enhance sepa-ration efficiency.
The addition of methanol, up to 20% to the BGE has been foundto increase migration times and resolution. Methanol acts in theelectrolyte solution used for the separation by reducing EOF. Inaddition its dielectric constant is lower than that of the water. Com-
plexation reactions and formation of high degree complexes canbe promoted in a low dielectric constant medium thus providingadditional possibilities for improving the separation [41].
Different compositions of the BGE were studied. Concentra-tions of 2,3-PDC, Ca2+, and Mg2+ varied between 20 and 50 mM,10 and 90 ppm and 10 and 60 ppm, respectively. pH of the BGEwas studied between 8 and 10. Different analytical conditionswere also examined. Voltage, analysis temperature, and detectionwavelength were optimized in the ranges of 15–30 kV, 20–30 ◦Cand 200–300 nm, respectively. In the optimized method, concen-trations of 2,3-PDC, MTAH, Ca2+ and Mg2+ were 20 mM, 0.3 mM,30 mg/l and 30 mg/l, respectively, in methanol–water mixture(10:90, v/v). The pH was 9 and it was adjusted after mixing allthe components of BGE. Voltage was −20 kV, capillary temperature25 ◦C and detection wavelength 254 nm.
In Fig. 1A is presented an electropherogram of cultivationmedium that was used in this study. The performance of the devel-oped method is presented in Fig. 1B where the 18 organic acidshave been added to the cultivation medium. The exact composi-tion of cultivation medium is presented in Section 2.4. Withoutaddition of Ca2+ and Mg2+ as the metals to complex organic acids orusing either of them, the separation would not be sufficient enoughfor identification and quantification of organic acids introduced inTable 1. Most of the organic acids could not even be separated fromeach other without using both metals for complexation.
3.2. Quantification
For the quantification of the carboxylic acids, calibration curvesbased on matrix-matched standards were prepared. Standardswere added to yeast extract. Standards were calibrated for con-centrations between 5 and 100 mg/l. Intraday relative standarddeviations for migration times of the carboxylic acids were lessthan 1.3% and those for peak areas between 2.7% and 5.6%. Interdayrelative standard deviations for migration times of the carboxylic

I/5
H. Turkia et al. / J. Chromatogr. A 1217 (2010) 1537–1542 1541
Fig. 2. Electrophoretic separation of carboxylic acids in wheat straw hydrolyzate. Fermentation time: (A) 0 h; (B) 19.8 h; and (C) 119.1 h. Peak assignments: 1, formic acid;2, succinic acid; 3, malic acid; 4, acetic acid; 5, lactic acid; 6, xylonic acid; and 7, gluconic acid. Analysis conditions as in Fig. 1.
Table 3Concentrations (mg/l) of carboxylic acids in wheat straw hydrolyzates.
Sample id
52(1) 52(2) 52(3) 52(4) 52(5) 52(8) BS52(6) BS52(7)0a 3.5a 19.8a 26.8a 44.3a 76.7a 99.9a 119.1a
Formic acid 960 960 980 1130 1050 1080 1200 1040Succinic acid 130 130 140 150 160 190 200 180Malic acid 770 590 610 1140 660 710 800 680Acetic acid 6100 5600 6100 7000 6000 6100 6100 5400Lactic acid 98 104 91 88 80 71 67 73Xylonic acid nd 2200 9700 10 800 15 800 16 900 17 200 17 400Gluconic acid nd 3000 5500 5300 5200 5100 5600 5100
nd, not detected.a Fermentation time (h).
acids were less than 5.0% and those for peak areas between 5.7%and 9.3%. Detection limits for the standards were between 2 and5 mg/l, i.e. 0.1–0.5 pmol. Correlation coefficients for the calibrationcurves were between 0.9921 and 0.9996.
The calibration curves, correlation coefficients, repeatabilities,and reproducibilities of the method are summarized in Table 2.
3.3. Analysis of fermentation samples
The optimized method was applied to the analysis of sam-ples from a G. oxydans culture in wheat straw hydrolyzate, whichwas rich in xylose. Samples were diluted to three different dilu-tions before analysis: 1:5 (v/v) for the analysis of carboxylic acidsin small concentrations (less than 100 mg/l), 1:100 (v/v) for highconcentrations (100–10 000 mg/l) and 1:250 (v/v) for very highconcentrations (>10 000 mg/l). Electropherograms for samples arepresented in Fig. 2. The fermentation time in Fig. 2A is 0, in 2B it is19.8 and in 2C it is 119.1 h. The negative peaks in Fig. 2B and C aremost probably UV absorbing carboxylic acids, e.g., different pheno-lic acids or furan derivatives that are formed during fermentations.The formation of these compounds is highly avoidable in fermen-tations since they can act as inhibitors. The results are summarizedin Table 3. As the results demonstrate, there was rapid increase inxylonic acid and gluconic acid concentration during fermentation(Fig. 3). Changes in the levels of other carboxylic acids were insignif-icant. Because every sample had different ion strength, migrationtimes of organic acids varied between samples. However, the pro-file of the electropherograms and peak shapes remained the same
and the identification was easy. Just to make sure, the identificationwas assured by spiking the first sample. The metabolism of G. oxy-dans and its ability to convert certain sugars to certain organic acidsis well known. Using this strain and these cultivation conditions,only 7 organic acids were formed.
It is worth noting that the hydrolyzate from the fermentationof wheat straw contained glucose (5.3 g/l) as well as xylose (39 g/l).Gluconic acid production was complete within less than 20 h, butxylonic acid production continued. The yield for the production ofxylonic acid from xylose was 45%, and for the production of glu-conic acid from glucose was 96%. Thus, G. oxydans was able toproduce large amounts of the desired carboxylic acids from wheatstraw hydrolyzate. The high concentrations of formic, malic andacetic acids were not metabolized by G. oxydans, but did not pre-
Fig. 3. Production of xylonic (�) and gluconic (�) acids from wheat strawhydrolyzate by Gluconobacter oxydans.

I/6 7
1542 H. Turkia et al. / J. Chromatogr. A 1217 (2010) 1537–1542
vent conversion of glucose and xylose to gluconic and xylonic acids,respectively.
4. Conclusions
A capillary electrophoretic method for the simultaneous analy-sis of 18 carboxylic acids was developed for bioprocess monitoring.The method was successfully applied in the analysis of samplesfrom a fermentation broth of complex composition. G. oxydanshas an exceptional capacity for transforming carbohydrates to car-boxylic acids, which could be used as ligands, buffer chemicals anddispersants.
Acknowledgements
This work was carried out within the Finnish Centre of Excel-lence in Green Chemistry and White Biotechnology Researchgranted by Academy of Finland (grant number 118573). Cul-tivations were performed within the EU project BioSynergy(038994-SES6). We also thank Tarja Laakso for technical assistancewith the fermentations.
References
[1] S. Ehala, I. Vassiljeva, R. Kuldvee, R. Vilu, Fresen. J. Anal. Chem. 371 (2001) 168.[2] G. Gastrock, K. Lemke, J. Metze, Rev. Mol. Biotechnol. 82 (2001) 123.[3] P. Harms, Y. Kostov, G. Rao, Curr. Opin. Biotechnol. 13 (2002) 124.[4] M. Kudrjashova, H. Tahkoniemi, K. Helmja, M. Kaljurand, Proc. Estonian Acad.
Sci. Chem. 53 (2004) 51.[5] J. Buchert, Biotechnical Oxidation of d-Xylose and Hemicellulose Hydrolyzates
by Gluconobacter oxydans, VTT Publications70, Technical Research Centre ofFinland, Espoo, 1990, ISBN 951-38-3941-9, p. 9.
[6] J. Zaldivar, J. Nielsen, L. Olsson, Appl. Microbiol. Biotechnol. 56 (2001) 17.[7] Y. Zhang, B. Min, L. Huang, I. Angelidaki, Appl. Environ. Microbiol. 75 (2009)
3389.[8] M. Galbe, G. Zacchi, Appl. Microbiol. Biotechnol. 59 (2002) 618.[9] R.H.W. Maas, R.R. Bakker, G. Eggink, R.A. Weusthuis, Appl. Microbiol. Biotech-
nol. 72 (2006) 861.
[10] S. Liu, K.M. Bischoff, S.R. Hughes, T.D. Leathers, N.P. Price, N. Qureshi, J.O. Rich,Lett. Appl. Microbiol. 48 (2009) 337.
[11] T.I. Georgieva, M.J. Mikkelsen, B.K. Ahring, Appl. Biochem. Biotechnol. 145(2008) 99.
[12] M. Ligor, R. Jarmalaviciene, M. Szumski, A. Maruska, B. Buszewski, J. Sep. Sci. 31(2008) 2707.
[13] C. Aiello-Mazzarri, G. Coward-Kelly, F.K. Agbogbo, M.T. Holtzapple, Appl.Biochem. Biotechnol. 127 (2005) 79.
[14] K.L. Ross, T.T. Tu, S. Smith, J.J. Dalluge, Anal. Chem. 79 (2007) 4840.[15] P.V. Iyer, S. Thomas, Y.Y. Lee, Appl. Biochem. Biotechnol. 84–86 (2000) 665.[16] S. Katahira, Y. Fujita, A. Mizuike, H. Fukuda, A. Kondo, Appl. Environ. Microbiol.
70 (2004) 5407.[17] M.-C. Wei, C.-T. Chang, J.-F. Jen, Chromatographia 54 (2001) 601.[18] X. Geng, S. Zhang, Q. Wang, Z. Zhao, J. Chromatogr. A 1192 (2008) 187.[19] M.A. Eiteman, M.J. Chastain, Anal. Chim. Acta 338 (1997) 69.[20] M.V.G. Moreno, C.J. Jurado, C.G. Barroso, Chromatographia 57 (2003) 185.[21] N. Bord, G. Crétier, J.-L. Rocca, C. Bailly, J.-P. Souchez, J. Chromatogr. A 1100
(2005) 223.[22] J.M. Izco, M. Tormo, R. Jiménez-Flores, J. Agric. Food Chem. 50 (2002) 1765.[23] M. Chiari, N. Dell’Orto, L. Casella, J. Chromatogr. A 745 (1996) 93.[24] L. Saavedra, A. García, C. Barbas, J. Chromatogr. A 881 (2000) 395.[25] Y.S. Fung, K.M. Lau, Electrophoresis 24 (2003) 3224.[26] I. Mato, J.F. Huidobro, J. Simal-Lozano, T. Sancho, Anal. Chim. Acta 565 (2006)
190.[27] L. Saavedra, C. Barbas, Electrophoresis 24 (2003) 2235.[28] V.I. Esteves, S.S.F. Lima, D.L.D. Lima, A.C. Duarte, Anal. Chim. Acta 513 (2004)
163.[29] S. Cortacero-Ramírez, A. Segura-Carretero, M. Hernáinz-Bermúdez de Castro,
A. Fernández-Gutiérrez, J. Chromatogr. A 1064 (2005) 115.[30] T. Soga, G.A. Ross, J. Chromatogr. A 767 (1997) 223.[31] V. Galli, C. Barbas, J. Chromatogr. A 1032 (2004) 299.[32] J.M. Izco, M. Tormo, R. Jiménez-Flores, J. Dairy Sci. 85 (2002) 2122.[33] S.-F. Chen, R.A. Mowery, V.A. Castleberry, G.P. van Walsum, C.K. Chambliss, J.
Chromatogr. A 1104 (2006) 54.[34] C. Asada, Y. Nakamura, F. Kobayashi, Biotechnol. Bioprocess. Eng. 10 (2005)
346.[35] S. Galkin, T. Vares, M. Kalsi, A. Hatakka, Biotechnol. Tech. 12 (1998) 267.[36] T. Soga, G.A. Ross, J. Chromatogr. A 837 (1999) 213.[37] H. Adler, H. Sirén, M. Kulmala, M.-L. Riekkola, J. Chromatogr. A 990 (2003) 133.[38] R. Castro, M.V.G. Moreno, R. Natera, F. García-Rowe, M.J. Hernández, C.G. Bar-
roso, Chromatographia 56 (2002) 57.[39] M.V.G. Moreno, C.J.J. Campoy, C.G. Barroso, Eur. Food Res. Technol. 213 (2001)
381.[40] N.R. Joseph, J. Biol. Chem. 164 (1946) 529.[41] M. Chiari, J. Chromatogr. A 805 (1998) 1.

7
PUBLICATION II
Capillary electrophoresis for the monitoring of phenolic
compounds in bioprocesses
In: Journal of Chromatography A 1278, pp. 175–180.
Copyright 2013 Elsevier.Reprinted with permission from the publisher.

II/1
Journal of Chromatography A, 1278 (2013) 175–180
Contents lists available at SciVerse ScienceDirect
Journal of Chromatography A
journa l homepage: www.e lsev ier .com/ locate /chroma
Capillary electrophoresis for the monitoring of phenolic compounds inbioprocesses
Heidi Turkiaa,∗, Heli Sirénb, Merja Penttiläa, Juha-Pekka Pitkänena
a VTT Technical Research Centre of Finland, PO Box 1000, Fin-02044 VTT, Finlandb Lappeenranta University of Technology, PO Box 20, FIN-53580 Lappeenranta, Finland
a r t i c l e i n f o
Article history:Received 12 October 2012Received in revised form19 December 2012Accepted 3 January 2013Available online 10 January 2013
Keywords:Bioprocess monitoringCapillary electrophoresisPhenolic compounds
a b s t r a c t
Hydrolysates of lignocellulosic biomass, used as substrates for the sustainable production of fuels andchemicals often contain high amounts of phenolic compounds inhibiting the production microbiota.Quantification of these inhibitor compounds may help to understand possible difficulties in bioprocessingand further the development of more efficient, robust and tolerable processes. A separation method basedon capillary electrophoresis with UV detection was developed for the simultaneous quantification of10 phenolic compounds that may have inhibitor properties. Intraday relative standard deviations wereless than 0.7% for migration times and between 2.6% and 6.4% for peak areas. Interday relative standarddeviations were less than 3.0% for migration times and between 5.0% and 7.2% for peak areas. The methodwas applied to demonstrate that Saccharomyces cerevisiae was able to decrease the concentrations ofvanillin, coniferyl aldehyde, syringaldehyde, acetoguaiacone and cinnamic acid during the cultivation,whereas the concentrations of phenols increased.
© 2013 Elsevier B.V. All rights reserved.
1. Introduction
The use of lignocellulosic materials as a renewable source forthe production of fuels and chemicals has increased during recentyears. Lignocellulose is a natural, abundant and cheap material thatconsisting of three main components: cellulose, hemicellulose, andlignin [1]. In order to obtain monomeric sugars that can be metab-olized by microorganisms, cellulose and hemicellulose must behydrolyzed. Particularly during acid hydrolysis, several byproductsare also formed in addition to sugars. Some of these byproducts canbe toxic to the production organism. Therefore in high concentra-tions they decrease the product yield by inhibiting the metabolism[2].
Inhibitors originating from lignocellulosic material can broadlybe divided into three groups: aliphatic acids, furan derivatives, andphenolic compounds. The number and amount of these inhibitingbyproducts may vary significantly between different raw materialsand pretreatments and hydrolysis conditions [3]. Analysis of theinhibitors may provide additional information for the optimizationof bioprocesses and may represent a valuable tool in the productionof tolerant production hosts [4].
The inhibition mechanisms of phenolic compounds have beenstudied, but the mechanisms are still not completely understood.
∗ Corresponding author. Tel.: +358 40 358 1271; fax: +358 20 722 7071.E-mail address: [email protected] (H. Turkia).
It has been found that biomass yields, growth rates and ethanolproductivities are decreased. Phenolic compounds may also act oncell membranes. In general, aldehydes and ketones are strongerinhibitors than alcohols [4–7].
Two approaches can be used to study the effects of phenoliccompounds in cultivation; either the use of hydrolysates derivedfrom lignocellulosic materials or synthetic media in which all thenecessary compounds have been artificially added to the culti-vation medium. When using synthetic inhibitors, it is easier toregulate individual inhibitor conditions and to study their effects onthe organism and on the overall bioprocess [8]. The inhibitor com-position of synthetic spruce hydrolysate is presented in Table 1 [9].
Phenolic compounds have been analyzed from differenthydrolysates by gas chromatography (GC) [3,10] and liquid chro-matography (LC) [2,11]. The use of GC for the analysis of phenoliccompounds is rather time-consuming process because of the neces-sity of purification of the sample and silylation before analysis. LC isa versatile analysis technique, but it is time-consuming and it lackssensitivity. Capillary electrophoresis (CE) has also been used forthe analysis of phenolic compounds in green tea [12], olive oil [13],wines and beverages [14–16], propolis (“bee glue”) [17], and berries[18]. Phenolic compounds of lignocellulosic origin have been ana-lyzed by CE with UV and mass spectrometric (MS) detection fromaged papers [19,20] and with CE–MS from complex effluents fromcellulose processing [21] and from aerosol samples from biomassburning [22]. To the best knowledge of the authors, CE has nothitherto been used for the analyses of phenolic compounds in lig-nocellulosic hydrolysates.
0021-9673/$ – see front matter © 2013 Elsevier B.V. All rights reserved.http://dx.doi.org/10.1016/j.chroma.2013.01.004

II/2 II/3
H.Turkia
etal./J.Chrom
atogr.A1278 (2013) 175–180
177
Table 2Phenolic compounds and their structures.
Compound Molecularweight (g/mol)
Structure Solubility Compound Molecularweight (g/mol)
Structure Solubility
Phenol 94.11 Water p-Coumaricacid
164.16 Ethanol
Benzoic acid 122.12 Water Acetoguaiacone 166.17 Methanol
4-Hydroxybenzoic acid 138.12 Water Vanillic acid 168.15 Methanol
Cinnamic acid 148.17 Methanol Coniferylaldehyde
178.18 Methanol
Vanillin 152.15 Water Syringaldehyde 182.17 Methanol
176 H. Turkia et al. / J. Chromatogr. A 1278 (2013) 175–180
Table 1Synthetic inhibitor composition of spruce hydrolysate.
Compound Concentration (mg/L)
5-HMF 3400Furfural 1100Acetic acid 6300Formic acid 1200Levulinic acid 2400Hydroquinone 20Vanillin 140Syringaldehyde 120Coniferyl aldehyde 50Cinnamic acid 14-Hydroxybenzoic acid 20Acetoguaiacone 20
In this study a CE method was developed for the simulta-neous separation, identification, and quantification of 10 phenoliccompounds. This method was applied for bioprocess monitor-ing of yeast cultivations using either synthetic media or sprucehydrolysate as cultivation media. Using the method, identificationand quantification of the phenolic inhibitors were acheived. Thisstudy enables a monitoring system with great importance for theoptimization of bioprocesses and the development of tolerant hostsfor biofuels production. The phenolic compounds investigated inthis study are presented in Table 2.
2. Experimental
2.1. Chemicals
Standards were prepared in LC–MS grade methanol fromFluka (Buchs, Switzerland), in 99.5% ethanol from Altia (Rajamaki,Finland) or in 18 m� deionized water (Millipore, Bedford, MA,USA) at 1000 mg/L quantity according to their solubility presentedin Table 2. Phenol (≥99.5%), coniferyl aldehyde (98%), p-coumaricacid (≥98%), 4-hydroxybenzoic acid (99%), acetoguaiacone (98%),vanillin (99%), and cinnamic acid (≥99%) were purchased fromSigma–Aldrich (Steinheim, Germany). Benzoic acid (≥99.5%) andvanillic acid (≥97%) were from Fluka, and syringaldehyde (≥98%)was from SAFC (Arklow, Ireland).
Background electrolyte solutions (BGE) were prepared fromsodium tetraborate decahydrate (≥99.5%), sodium acetate (≥99%),ammonium acetate (≥98%), sodium dodecyl sulphate (SDS) (≥99%),18-crown-6-ether (99%), �-cyclodextrin (≥97%), and CHAPSO(≥98%), which were purchased from Sigma–Aldrich. A 0.1 Msodium hydroxide solution for the capillary conditioning was fromFF-Chemicals Ab (Haukipudas, Finland).
2.2. Instrumentation
All the measurements were made with the P/ACE MDQ capillaryelectrophoresis system (Beckmann Coulter Inc., Fullerton, CA, USA)equipped with a PDA detector. Untreated fused-silica capillaries(Teknolab, Trollasen, Norway) with inner diameter 50 �m, outerdiameter 365 �m, and total length 50 cm (40 cm to the detector)were used. Capillaries were conditioned before use with 0.1 MNaOH, Milli-Q purified water, and BGE for 10 min each. Voltage(+30 kV) was then applied for 5 min. Between analyses, capillar-ies were rinsed with 0.1 M NaOH and 18 m� deionized water for1 min and with BGE for 1.5 min. Data were collected and processedwith 32Karat software (Beckmann Coulter Inc., Fullerton, CA, USA).
2.3. Analysis conditions
BGE was prepared with 40 mM sodium tetraborate and 40 mM18-crown-6-ether in Milli-Q purified water. The pH of the
solution was 9.0. Before analysis, the BGE was degassed by ultra-sound and filtered through a 0.45 �m Acrodisc GHP syringe filter(Pall Life Science, Ann Arbor, MI, USA).
Standards and samples were injected by using 0.5 psi pressurefor 5 s, giving rise to an injection volume of 5 nL. Separation wascarried out at +30 kV at constant capillary temperature +20 ◦C. Sam-ple cartridge temperature was set at +10 ◦C. Direct UV detectionwas at 200 and 254 nm. For the determination and quantifica-tion of phenols, vanillin, coumaric acid, vanillic acid, benzoic acidand cinnamic acid 200 nm were used. For the determination andquantification of coniferyl aldehyde, acetoguaiacone, syringalde-hyde and 4-hydroxybenzoic acid the detection wavelength were254 nm.
2.4. Cultivation conditions
2.4.1. Cultivation 1Saccharomyces cerevisiae strain HDY·GUF6 (provided by NEMO
EU-project partner Prof. Eckhard Boles at Goethe University ofFrankfurt in Germany) was maintained in 1.5 L culture in BiostatB bioreactor (Sartorius, Germany) at pH 5.0, temperature +30 ◦C,agitation 200 rpm, under anaerobic conditions with 0.5 L/minnitrogen. Cultures were inoculated with cells grown for 24 h inYPD-medium (10 g/L yeast extract, 20 g/L peptone and 20 g/L dex-trose) at 30 ◦C and 200 rpm to give an initial biomass concentrationof approximately 0.15 g/L. Cultivation was performed in syntheticmedium simulating spruce hydrolysate supplemented with min-imum mineral medium [23] and with 20 g/L glucose and 50 g/Lxylose as the main carbon sources. The final concentration of theinhibitor mix was 50%. The inhibitor mix in 100% concentration ispresented in Table 1.
2.4.2. Cultivation 2Same as cultivation 1, but with 20% inhibitor mix.
2.4.3. Cultivation 3Same as cultivation 2, but the initial biomass concentration was
1.5 g/L.
2.4.4. Cultivation 4S. cerevisiae (ethanol red) was maintained in 1.5 L culture in a
Biostat CT-DCU bioreactor (Sartorius, Germany) at pH 4.9, temper-ature +32 ◦C, agitation 300 rpm, and in anaerobic conditions with1 L/min nitrogen. The cells were grown for 24 h in medium con-taining 16.6 g/L glucose, 7.5 g/L (NH4)2SO4, 3.5 g/L KH2PO4, 0.75 g/LMgSO4, 10 mL/L trace metal solution [24], and 1 mL/L vitaminsolution [24] (sterile filtered) in pH 5.0, temperature +30 ◦C andagitation 180 rpm. After this, cells were transferred to the bioreac-tor where they were grown for 20 h in medium containing 20 g/Lglucose, 20 g/L (NH4)2SO4, 10 g/L KH2PO4, 2 g/L MgSO4, 27 mL/Ltrace metal solution, and 2.7 mL/L vitamin solution (sterile filtered)in pH 5.0, +30 ◦C, agitation 800 rpm and air flow rate 1.2 L/min togive an initial biomass concentration of approximately 3.5 g/L. Cul-tures were maintained in medium derived from spruce hydrolysate(heat exploded, pH adjusted to 4.8; SEKAB, Örnsköldsvik, Sweden)supplemented with 0.5 g/L (NH4)2HPO4, 1 g/L yeast extract and0.025 g/L MgSO4·7H2O.
2.5. Sample preparation
For calibration, five concentration levels of standard mixtureswere prepared for the 10 phenolic compounds. The concentra-tion range in the mixtures was 1–100 mg/L. Before analyses boththe cultivation and the hydrolysate samples were centrifuged at

II/3
H.Turkia
etal./J.Chrom
atogr.A1278 (2013) 175–180
177
Table 2Phenolic compounds and their structures.
Compound Molecularweight (g/mol)
Structure Solubility Compound Molecularweight (g/mol)
Structure Solubility
Phenol 94.11 Water p-Coumaricacid
164.16 Ethanol
Benzoic acid 122.12 Water Acetoguaiacone 166.17 Methanol
4-Hydroxybenzoic acid 138.12 Water Vanillic acid 168.15 Methanol
Cinnamic acid 148.17 Methanol Coniferylaldehyde
178.18 Methanol
Vanillin 152.15 Water Syringaldehyde 182.17 Methanol

II/4 II/5
H. Turkia et al. / J. Chromatogr. A 1278 (2013) 175–180 179
Fig. 2. Electrophoretic separation of phenolic compounds present in cultivation 1 with synthetic media at 5 different time points. Peak assignments: (1) phenol; (2) coniferylaldehyde; (3) acetoguaiacone; (4) syringaldehyde; (5) vanillin; (6) cinnamic acid; and (7) 4-hydroxybenzoic acid. Analysis conditions as described in the text.
were less than 0.7% and those for peak areas that were between 2.6%and 6.4%. Interday RSD% for migration times of the studied com-pounds were less than 3.0% and those for peak areas were between5.0% and 7.2%. The detection limits for the phenolic compound stan-dards were between 0.1 and 0.3 mg/L. Correlation coefficients forthe calibration curves varied between 0.9712 and 0.9987. The corre-lation coefficients, repeatability, and reproducibility of the analysismethod are summarized in Table 3.
3.3. Analysis of cultivation samples
Electropherograms of the samples are presented in Figs. 2 (culti-vation 1) and 3 (cultivation 4). Significant results of the cultivationsare summarized in Fig. 4.
The optimized method was applied to the analyses of phe-nolic compounds in four different cultivations. The purpose ofthis study was to compare the concentration levels of these com-pounds during different cultivations. In cultivations 1–3 a syntheticmedium was used to study the effect of inhibitors presented inTable 1 on the S. cerevisiae strain HDY.GUF6. Cultivations 1 and2 are comparable, since they both had the same initial biomass
concentration (0.15 g/L), but with different inhibitor mix concen-trations (50% vs. 20%, respectively). Cultivations 2 and 3 had thesame inhibitor mix concentration (20%), but the initial biomassconcentrations were 0.15 g/L and 1.5 g/L, respectively. During thesecultivations concentrations of vanillin, coniferyl aldehyde, andsyringaldehyde decreased below their detection limit and at firstthe concentration of phenols increased. Furthermore in cultiva-tion 2 the acetoguaiacone and in cultivation 1 the cinnamic acidconcentrations decreased below their detection limit. Thereafterthe concentration increase of phenols halted or even started todecrease. This implies that S. cerevisiae is able to metabolize thesephenolic compounds. The concentrations of acetoguaiacone and4-hydroxybenzoic acid remained at the same level throughoutthe cultivation in cultivations 1 and 3. In cultivation 2, the con-centration of 4-hydroxybenzoic acid remained constant. Higherinhibitor concentration (Fig. 4A) in cultivation 1 slowed down theconversion of phenolic compounds when compared to cultivation2 (Fig. 4B). Higher initial biomass concentration in cultivation 3(Fig. 4C) enabled faster conversion compared to cultivation 2.
Spruce hydrolysate is a more hostile medium for the cultiva-tion than the synthetic hydrolysate and contains more compounds
Fig. 3. Electrophoretic separation of phenolic compound present in cultivation 4 with spruce hydrolysate at 4 different time points. Peak assignments: (1) phenol; (2) coniferylaldehyde; (3) syringaldehyde; (4) vanillin; (5) p-coumaric acid; (6) vanillic acid; (7) benzoic acid; and (8) 4-hydroxybenzoic acid. Analysis conditions as described in the text.
178 H. Turkia et al. / J. Chromatogr. A 1278 (2013) 175–180
Fig. 1. Electrophoretic separation of 10 phenolic compounds. Peak assignments: (1) phenol; (2) coniferyl aldehyde; (3) acetoguaiacone; (4) syringaldehyde; (5) vanillin; (6)cinnamic acid; (7) p-coumaric acid; (8) vanillic acid; (9) benzoic acid; and (10) 4-hydroxybenzoic acid. The concentrations of the analytes were 20 mg/L. Analysis conditionsas described in the text.
10,000 rpm for 5 min. In addition, the hydrolysate samples werediluted to 1:2 (v/v) with Milli-Q water.
3. Results and discussion
3.1. Method validation
For the development of a method for quantification of phe-nolic compound using capillary electrophoresis, sodium acetate,ammonium acetate, and sodium tetraborate were studied in theoptimization of BGE in different concentrations and pH values.Sodium tetraborate was found to be the most suitable bufferchemical for this application. The phenolic compounds presentin hydrolysates are difficult to analyze with direct UV detec-tion, because of the low concentrations of the analytes andthe complex media containing large number of UV-absorbingcompounds. In order to enhance separation of the studied com-pounds, the use of micellar electokinetic chromatography (MEKC)was studied. In MEKC a pseudostationary phase is formed inthe capillary from the buffer and a surfactant above its criti-cal micelle concentration (cmc). In addition to the separationbased on charge-to-mass ratio, the migration of an analyte is alsodependent on its partition coefficient between the micelles andaqueous phase of the BGE [25]. Several surfactants were studiedin order to identify a suitable one for this application. Additions
of sodium dodecyl sulphate (SDS) and �-cyclodextrin were foundto be ineffective. 3-[(3-Cholamidopropyl)dimethylammonio]-2-hydroxy-1-propanesulfonate (CHAPSO) had some effect on theseparation, but the addition of 18-crown-6-ether improved theseparation significantly. pH between 8 and 11 was tested for theBGE. An electropherogram of the optimized analysis is presentedin Fig. 1.
Different analytical conditions were also examined. Voltage,analysis temperature, capillary length, and detection wavelengthwere optimized in the ranges of 5–30 kV, 15–40 ◦C, 30–80 cm (totallength), and 200–300 nm, respectively.
In the optimized method 40 mM sodium tetraborate decahy-drate with 40 mM 18-crown-6-ether, pH 9 was used for theanalysis. Voltage was set to +30 kV, capillary temperature +20 ◦C,total capillary length was 50 cm, and detection wavelengths were200 and 254 nm.
Fig. 1 illustrates an electropherogram of standard solutionwhere the 10 phenolic compounds presented in Table 2 are sep-arated.
3.2. Quantification
Concentration calibration between 1 mg/L and 100 mg/L wasused for each phenolic compound in the cultivation samples. Intra-day relative standard deviations (RSD%) for migration times that
Table 3Performance of the method under optimized conditions.
Phenol Coniferyl aldehyde Acetoguaiacone Syringaldehyde Vanillin
Migration time (intraday)a 0.1 0.1 0.1 0.1 0.1Migration time (interday)b 0.8 1.4 1.6 1.6 1.8Peak area (intraday)a 6.4 2.8 3.6 3.2 3.7Peak area (interday)b 7.2 5.0 5.8 5.9 5.9Calibration correlation coefficient 0.9712 0.9973 0.9980 0.9987 0.9985Detection limit (mg/L) 0.2 0.1 0.2 0.3 0.3
Cinnamic acid p-Coumaric acid Vanillic acid Benzoic acid 4-Hydroxybenzoic acid
Migration time (intraday)a 0.1 0.1 0.5 0.5 0.7Migration time (interday)b 1.8 2.3 2.3 2.4 3.0Peak area (intraday)a 2.6 2.8 2.9 3.1 2.9Peak area (interday)b 6.9 6.4 6.2 7.2 6.4Calibration correlation coefficient 0.9942 0.9876 0.9990 0.9915 0.9949Detection limit (mg/L) 0.1 0.1 0.2 0.3 0.3
a Percentage of relative standard deviation, n = 10.b Percentage of relative standard deviation, n = 5.

II/5
H. Turkia et al. / J. Chromatogr. A 1278 (2013) 175–180 179
Fig. 2. Electrophoretic separation of phenolic compounds present in cultivation 1 with synthetic media at 5 different time points. Peak assignments: (1) phenol; (2) coniferylaldehyde; (3) acetoguaiacone; (4) syringaldehyde; (5) vanillin; (6) cinnamic acid; and (7) 4-hydroxybenzoic acid. Analysis conditions as described in the text.
were less than 0.7% and those for peak areas that were between 2.6%and 6.4%. Interday RSD% for migration times of the studied com-pounds were less than 3.0% and those for peak areas were between5.0% and 7.2%. The detection limits for the phenolic compound stan-dards were between 0.1 and 0.3 mg/L. Correlation coefficients forthe calibration curves varied between 0.9712 and 0.9987. The corre-lation coefficients, repeatability, and reproducibility of the analysismethod are summarized in Table 3.
3.3. Analysis of cultivation samples
Electropherograms of the samples are presented in Figs. 2 (culti-vation 1) and 3 (cultivation 4). Significant results of the cultivationsare summarized in Fig. 4.
The optimized method was applied to the analyses of phe-nolic compounds in four different cultivations. The purpose ofthis study was to compare the concentration levels of these com-pounds during different cultivations. In cultivations 1–3 a syntheticmedium was used to study the effect of inhibitors presented inTable 1 on the S. cerevisiae strain HDY.GUF6. Cultivations 1 and2 are comparable, since they both had the same initial biomass
concentration (0.15 g/L), but with different inhibitor mix concen-trations (50% vs. 20%, respectively). Cultivations 2 and 3 had thesame inhibitor mix concentration (20%), but the initial biomassconcentrations were 0.15 g/L and 1.5 g/L, respectively. During thesecultivations concentrations of vanillin, coniferyl aldehyde, andsyringaldehyde decreased below their detection limit and at firstthe concentration of phenols increased. Furthermore in cultiva-tion 2 the acetoguaiacone and in cultivation 1 the cinnamic acidconcentrations decreased below their detection limit. Thereafterthe concentration increase of phenols halted or even started todecrease. This implies that S. cerevisiae is able to metabolize thesephenolic compounds. The concentrations of acetoguaiacone and4-hydroxybenzoic acid remained at the same level throughoutthe cultivation in cultivations 1 and 3. In cultivation 2, the con-centration of 4-hydroxybenzoic acid remained constant. Higherinhibitor concentration (Fig. 4A) in cultivation 1 slowed down theconversion of phenolic compounds when compared to cultivation2 (Fig. 4B). Higher initial biomass concentration in cultivation 3(Fig. 4C) enabled faster conversion compared to cultivation 2.
Spruce hydrolysate is a more hostile medium for the cultiva-tion than the synthetic hydrolysate and contains more compounds
Fig. 3. Electrophoretic separation of phenolic compound present in cultivation 4 with spruce hydrolysate at 4 different time points. Peak assignments: (1) phenol; (2) coniferylaldehyde; (3) syringaldehyde; (4) vanillin; (5) p-coumaric acid; (6) vanillic acid; (7) benzoic acid; and (8) 4-hydroxybenzoic acid. Analysis conditions as described in the text.

II/6 1
180 H. Turkia et al. / J. Chromatogr. A 1278 (2013) 175–180
Fig. 4. Diagram of the cultivation results. (A) Cultivation 1; (B) cultivation 2; (C) cultivation 3; and (D) cultivation 4. Symbols: phenol (�); syringaldehyde (�); vanillin (�);acetoguaiacone (×); and coniferyl aldehyde (�).
with possible synergistic inhibitory effects on microorganisms.Cultivation 4 was performed in spruce hydrolysate, and phenoliccompounds were analyzed in order to test the resolving power ofthe analysis method in more complex media. Although the repeat-ability of the migration times was very good even with the sprucehydrolysate, the migration of the analytes was tested with standardaddition methods for compounds characterization. It was notedthat in more phenolic compounds were observed this cultivationmedium (Fig. 4D). Furthermore, probably due to the harshnessof the media, results differed from the synthetic media used incultivations 1–3. The concentrations of coniferyl aldehyde andvanillin were decreased. Surprisingly, in addition to the concen-tration of phenols, the concentration of syringaldehyde was alsoincreased. The concentrations of p-coumaric, vanillic, benzoic and4-hydroxybenzoic acids were approximately constant.
4. Conclusions
An analysis method for the identification and quantification of10 phenolic compounds was developed for capillary electrophore-sis. This method was successfully used in the monitoring of fourdifferent S. cerevisiae cultivations. The yeast strains used in thisstudy were able to tolerate synthetic media with inhibitor mixor real spruce hydrolysate and were able to metabolize some ofthe phenolic compounds. Metabolic routes for the degradation ofphenolic compounds are not generally known for yeast.
Acknowledgements
This work was carried out within the Finnish Center of Excel-lence in White Biotechnology – Green Chemistry Research grantedby the Academy of Finland (grant number 118573). Heidi Turkiawas also supported by Graduate School for Chemical Sensorsand Microanalytical Systems (CHEMSEM). Cultivations were per-formed within the EU project NEMO, which received funding
from the European Community’s Seventh Framework Programme(FP7/2007–2013) (grant agreement no. 222699). We also thankStefan Bruder and Eila Leino for their technical assistance in per-forming the cultivations.
References
[1] J. Zaldivar, J. Nielsen, L. Olsson, Appl. Microbiol. Biotechnol. 56 (2001) 17.[2] P. Persson, J. Andersson, L. Gorton, S. Larsson, N.-O. Nilvebrant, L.J. Jönsson, J.
Agric. Food Chem. 50 (2002) 5318.[3] P. Persson, S. Larsson, L.J. Jönsson, N.-O. Nilvebrant, B. Sivik, F. Munteanu, L.
Thörneby, L. Gorton, Biotechnol. Bioeng. 79 (2002) 694.[4] H.B. Klinke, A.B. Thomsen, B.K. Ahring, Appl. Microbiol. Biotechnol. 66 (2004)
10.[5] J.R.M. Almeida, T. Modig, A. Petersson, B. Hähn-Hägerdal, G. Lidén, M.F. Gorwa-
Grauslund, J. Chem. Technol. Biotechnol. 82 (2007) 340.[6] E. Palmqvist, B. Hahn-Hägerdal, Bioresour. Technol. 74 (2000) 25.[7] H.J. Heipieper, F.J. Weber, J. Sikkema, H. Keweloh, J.A.M. de Bont, Trends Bio-
technol. 10 (1994) 409.[8] C. Martin, L.J. Jönsson, Enzyme Microb. Technol. 32 (2003) 386.[9] R. Koppram, E. Albers, L. Olsson, Biotechnol. Biofuels 5 (2012) 32.
[10] C. Martin, H.B. Klinke, M. Marcet, L. García, E. Hernández, A.B. Thomsen, Holz-forschung 61 (2007) 483.
[11] X. Jing, X. Zhang, J. Bao, Appl. Biochem. Biotechnol. 159 (2009) 696.[12] L. Arce, A. Ríos, M. Valcárcel, J. Chromatogr. A 827 (1998) 113.[13] A.C. Pancorbo, C. Cruces-Blanco, A.S. Carretero, A.F. Gutiérrez, J. Agric. Food
Chem. 52 (2004) 6687.[14] G. Cartoni, F. Coccioli, R. Jasionowska, J. Chromatogr. A 709 (1995) 209.[15] S. Moane, S. Park, C.E. Lunte, M.R. Smyth, Analyst 123 (1998) 1931.[16] R.G. Peres, G.A. Micke, M.F.M. Tavares, D.B. Rodriguez-Amaya, J. Sep. Sci. 32
(2009) 3822.[17] Y.H. Cao, Y. Wang, Q. Yuan, Chromatographia 59 (2004) 135.[18] S. Ehala, M. Vaher, M. Kaljurand, J. Agric. Food Chem. 53 (2005) 6484.[19] A.-L. Dupont, C. Egasse, A. Morin, F. Vasseur, Carbohydr. Polym. 68 (2007) 1.[20] A.-L. Dupont, A. Seemann, B. Lavédrine, Talanta 89 (2012) 301.[21] A. Bogolitsyna, M. Becker, A.-L. Dupont, A. Borgards, T. Rosenou, A. Potthast, J.
Chromatogr. A 1218 (2011) 8561.[22] Y. Iinuma, H. Herrmann, J. Chromatogr. A 1018 (2003) 105.[23] C. Verduyn, E. Postma, W.A. Scheffers, J.P. van Dijken, Yeast 8 (1992)
501.[24] M.J. Taherzadeh, G. Lidén, L. Gustafsson, C. Niklasson, Appl. Microbiol. Bio-
technol. 46 (1996) 176.[25] C.P. Palmer, S. Terabe, Anal. Chem. 69 (1997) 1852.

1
PUBLICATION III
Online Capillary Electrophoresis for Monitoring
Carboxylic Acid Production by Yeast during Bioreactor
Cultivations
In: Analytical Chemistry 85, pp. 9705–9712.Copyright 2013 American Chemical Society.
Reprinted with permission from the publisher.

III/1
Online Capillary Electrophoresis for Monitoring Carboxylic AcidProduction by Yeast during Bioreactor CultivationsHeidi Turkia,*,†,‡ Sami Holmstrom,† Toni Paasikallio,† Heli Siren,‡ Merja Penttila,†
and Juha-Pekka Pitkanen†
†VTT Technical Research Centre of Finland, P.O. Box 1000, FIN-02044 VTT Espoo, Finland‡Lappeenranta University of Technology, P.O. Box 20, FIN-53580 Lappeenranta, Finland
*S Supporting Information
ABSTRACT: Bioprocess monitoring can improve the under-standing and control of biotechnological processes. Whenanalyses are carried out as automated online measurements,manual steps of the analysis procedures are avoided, thusdecreasing both the time required for analyses and systematicerrors. In this study, an online capillary electrophoresis (CE)system with flow-through sample vial made in-house andaction control programming was assembled to monitor carboxylic acid production by Kluyveromyces lactis and Saccharomycescerevisiae during two different bioreactor cultivations. The relative standard deviations were less than 0.6% for intraday migrationtimes and the total analysis time was less than 20 min. The system operated continuously and automatically up to 6 days andproduced data concerning carboxylic acid production during the cultivations. The successful test runs demonstrated that thissystem has potential for the monitoring of biotechnological processes.
The analysis of products, byproducts, and other phys-icochemical parameters is of great importance in
bioprocess technology. When optimizing bioprocesses for theproduction of fuels and chemicals, the lack of accurate real-timemonitoring of different physical, chemical, and biologicalcultivation parameters can represent a significant bottleneck.The US Food and Drug Administration (FDA) has issued aninitiative for process analytical technology (PAT) with the goalof improving understanding and control of manufacturingprocesses as a result of real-time monitoring.1 The greatestadvantage of automated measurements is the avoidance ofmanual steps during the analysis procedure. In addition to theanalysis of pH and temperature, the most common onlineanalyses in bioprocess monitoring are performed in situ withdifferent kinds of probes utilizing infrared or fluorescencespectroscopy. The biggest drawback of these approaches is thelimited number of analytes which can be determined and thedifficulty of calibration, but the main advantage is that theseanalyses are conducted in real-time.2 When using chromato-graphic techniques in online bioprocess monitoring, theanalysis of several compounds is possible simultaneously.Liquid chromatography (LC) is probably the most commontechnique in chromatographic online analyses. There are atleast three companies worldwide manufacturing online LCdevices, including Waters, Dionex and Bayer. Online HPLC hasbeen used for the monitoring of sugar consumption andcarboxylic acid production during Escherichia coli fermenta-tions,3 and for online monitoring and control of ethanolfermentation by Zymomonas mobiliz.4 Extracellular metaboliteconcentrations have been monitored during a batch cultivationof Saccharomyces cerevisiae.2 Online HPLC has also been used
for monitoring anions and carboxylic acids in wastewatertreatment processes,5 degradation products of dyes in textileindustry process waters,6,7 for carbohydrates and volatile fattyacids in fermentative biohydrogen production,8 and for glucoseand ethanol in Escherichia coli cultivation.9
For the analysis of gaseous and volatile samples, GC is themost common chromatographic technique. However, theonline GC analysis of aqueous samples can be difficult becauseof the necessary derivatization procedure. Dihydroxyacetoneand glycerol have been analyzed from fermentation broths bypyrolytic methylation GC with a vertical microfurnacepyrolyzer in which the analytes were converted into theircorresponding methyl ethers and analyzed by GC with a flameionization detector (FID).10 An online GC-MS system hasbeen used for automated monitoring of crude wastewater. Atwo-stage injector made in-house enabled the analysis of 140volatile and semivolatile compounds.11
Capillary electrophoresis (CE) is a relatively new approachfor online monitoring. Hitherto, commercial devices are notavailable so all the published work has been carried out withreconstructed offline or in-house built CE devices. Online CEhas been used for process monitoring in the pulp and paperindustry. A device that used an in-house constructed sampleflow cell was developed for the analysis of dissolvable inorganicions as well as some carboxylic acids from circulation waters ofpulp and paper machines.12,13 Portable CE instruments havebeen developed for the analysis of inorganic anions and cations,
Received: July 11, 2013Accepted: September 23, 2013Published: September 23, 2013
Article
pubs.acs.org/ac
© 2013 American Chemical Society 9705 dx.doi.org/10.1021/ac402113x | Anal. Chem. 2013, 85, 9705−9712

III/2 III/3
and organic acids.14,15 In online bioprocess monitoring, CE hasbeen used for the analysis of carboxylic acids,16 adenosinetriphosphate (ATP) and adenosine diphosphate (ADP),17 andheavy metals.18 Furthermore, in vivo microdialysis has beencoupled online to CE-LIF in order to study glutamate andGABA levels in rat brain.19
Carboxylic acids are important metabolites of severalbiochemical pathways in microorganisms. Because they arefrequently either the main products or significant byproducts ofbioprocesses, their monitoring is often of considerableimportance.20
In this study, a commercial capillary electrophoresis devicewas modified, a flow-through sample vial was designed andconstructed, and a sampling and filtration system wasassembled to enable online analysis of carboxylic acidproduction by two yeast species, Kluyveromyces lactis andSaccharomyces cerevisiae.
■ EXPERIMENTAL SECTIONReagents and Materials. All chemicals used for standards
were of analytical reagent grade and were prepared in 18 mΩdeionized water (Millipore, Bedford, MA, USA) at 10 g/L.Acetic acid, D-lactic acid (lithium salt), and glycolic acid werepurchased from Fluka (Buchs, Switzerland). Formic acid wasfrom Merck (Darmstadt, Germany). Gluconic acid (sodiumsalt), glyoxylic acid, (monohydrate), malic acid, succinic acid,and PIPES (1,4-piperazinediethane sulfonic acid, disodium salt)were from Sigma-Aldrich (Steinheim, Germany).Chemicals used for the background electrolyte solution
(BGE) were 2,3-pyridinedicarboxylic acid (2,3-PDC) (Sigma-Aldrich), calcium chloride dihydrate and magnesium chloridehexahydrate (Riedel-de Haen, Seelze, Germany), methanol(Merck), and isopropanol (Merck). A 0.1 M sodium hydroxidesolution for the capillary conditioning was from FF-ChemicalsAB (Haukipudas, Finland). Amine regeneration solution forcapillary conditioning was purchased from Beckman Coulter(Fullerton, CA, U.S.A.).Online Setup. The automated sampling system presented
in Figure 1 consisted of a peristaltic pump with an 8-channel
pump head (MCP, Ismatec Labortechnik Analytik, Zurich,Switzerland) for withdrawing the sample from the bioreactorand delivering it forward to filtration and to analysis, and alsofor pumping the diluent; a 3-way solenoid-operated pinch valve(Bio-Chem valve, Boonton, NJ, U.S.A.) for selecting betweenthe sampling line from the bioreactor and a line for washingliquid; a cross-flow filter (A-Sep, Applikon, Schiedam, theNetherlands) with 45 mm diameter filter membranes (GVWP,Millipore) of 0.22 μm pore size for providing a cell-free sample;
a 500-μL flow-through sample vial made in-house with an inletat the bottom and outlet at the top (Figure 2A); and a single-channel peristaltic pump (Watson Marlow 101U/R, Falmouth,England) for withdrawing the sample from the sample vial. Theflow-through sample vial was made from solid PEEK block bydrilling, and inserted inside plastic vial holder (BeckmannCoulter, Figures 2B and C). Holes were drilled to fit the PEEKtubing for liquid flow. The sample vial was placed in the inletside of the buffer tray in the CE instrument, from where thesample was injected. As presented in Figure 2A, the sample flowwas from the bottom of the vial to the top to maintain thesample liquid surface constant. Furthermore, this configurationprevents problems caused by air bubbles. To insert the tubingfrom pump to the sample vial, a hole was drilled to the coversof CE device. From that same hole the tubing from the samplevial to the waste via pump was run. Silicone tubing (Saint-Gobain, Charny, France) with 0.8 mm inner diameter and 2.4mm outer diameter was used for fluid lines. Pharmed tubing(Saint-Gobain) with 1.6 mm inner diameter and 3.2 mm outerdiameter was used in the pumps. Sample was diluted 5-fold (v/v) by mixing the filtered sample pumped through one pumpchannel to the diluent pumped through four pump channels. ANational Instruments USB-6009 data acquisition device(National Instruments, Austin, TX, U.S.A.) was used forsending analog voltage signals to the 8-channel peristalticpump, for sending digital output signals to an additional relaysupplying 24 V to the pinch valve, and for receiving digitalinput signals from the CE instrument. National InstrumentsLabVIEW software (version 8.5) was used to develop controlsoftware for the automated measurement sequence. Timing ofthe sampling was controlled by the CE software and thesampling and filtration sequence (Table 1) was started on thebasis of the digital output signal sent from the CE instrument.
Capillary Electrophoresis. All the measurements weremade with the P/ACE MDQ capillary electrophoresis system(Beckman Coulter) equipped with a PDA detector. Amine-coated eCAP silica capillaries (Beckman Coulter) with innerdiameter 50 μm, outer diameter 365 μm, and total length 60cm (50 cm to the detector) were used. Capillaries wereconditioned before use with 0.1 M NaOH, Milli-Q purifiedwater, amine regeneration solution and BGE for 4, 2, 4, and 4min, respectively. Voltage (−20 kV) was then applied for 1 min.Between analyses, capillaries were rinsed with 0.1 M NaOH,Milli-Q purified water, amine regeneration solution and withBGE for 2, 1, 2, and 2 min, respectively. The BGE vials werereplaced every 25 analyses. Data was collected and processedwith 32Karat software version 8.0 (Beckman Coulter).
Internal Standards. Two internal standards were used tocorrect and monitor possible defects in the automatedsampling, filtration, dilution and analysis steps. PIPES wasadded to the cultivation broth at 1 g/L and gluconic acid to thediluent at 250 mg/L. Thus in CE analysis both internalstandards were at 200 mg/L.
Bioreactor Cultivations. Batch bioreactor cultivationswere carried out in a 1.6 L bioreactor (KLF+ solo,Bioengineering, Wald, Switzerland) The preculture of genet-ically modified Kluyveromyces lactis (strain H3985)21 wascultivated for 24 h in shake-flasks containing synthetic completemedium lacking uracil (SC-ura) with 6.7 g/L yeast nitrogenbase (YNB) and 20 g/L glucose. The bioreactor cultivationmedium contained SC-ura with 6.7 g/L YNB, 20 g/L xylose, 15g/L ethanol, and 250 μL/L silicone antifoam agent. Thebioreactor was inoculated with cells from a preculture in 20 mL
Figure 1. Schematic figure of the online analysis system.
Analytical Chemistry Article
dx.doi.org/10.1021/ac402113x | Anal. Chem. 2013, 85, 9705−97129706

III/3
of 0.9% NaCl to start the cultivation at an optical density at 600nm (OD600) of 0.5. Cultivation conditions were: pH 5.0,temperature +30 °C, agitation 500 rpm and aeration 0.33 L/min air.The preculture of genetically modified Saccharomyces
cerevisiae (strain VTT C-10883)22 was grown for 24 h inshake flasks on Yeast Peptone Dextrose (YPD)-mediumcontaining 10 g/L yeast extract, 20 g/L peptone and 20 g/LD-glucose. The medium used in the bioreactor contained 20 g/L glucose, 50 g/L xylose, 5 g/L (NH4)2SO4, 3 g/L KH2PO4,
0.5 g/L MgSO4·7H2O, 1 mL/L trace mineral solution,23 1mL/L vitamin solution,23 and 250 μL/L silicone antifoamagent. The cells were added to the bioreactor in 20 mL of 0.9%NaCl so that the initial OD600 was 0.5 in the cultivation broth.The cultivation conditions were: temperature +30 °C, pH 5.0,agitation 500 rpm and anaerobic conditions were maintainedwith a stream of 0.33 L/min nitrogen to the bioreactorheadspace.
Sampling. In the K. lactis cultivation, the online samplingwas performed once an hour until 73 h and thereafter every twohours until the cultivation was ended at 137 h. In the S.cerevisiae cultivation, the online sampling was performed oncean hour until the cultivation was ended at 64 h. In bothcultivations offline sampling was also performed at some of thesampling points in order to enable comparison between onlineand offline analyses. Offline samples were drawn manually fromthe bioreactor, centrifuged 10 min at 3 000 rpm (BiofugeStratos, Heraeus Instruments, Osterode, Germany) and diluted5-fold (v/v) with Milli-Q purified water. A total of 97 onlineand 41 offline samples were collected from the K. lactiscultivation, and 62 online and 23 offline samples from the S.cerevisiae cultivation.
Offline Analyses. The concentrations of xylose and ethanolin the K. lactis cultivation and the concentrations of glucose,xylose, xylitol, glycerol and ethanol in the S. cerevisiae
Figure 2. (A) Schematic figure of the flow-through sample vial with dimensions. Picture of the sample vial (B) without and (C) with cap.
Table 1. Sampling Sequence
taskduration
(s) notes
start 1 start of sequencewait 1 sequence is halted and waits for a trigger signal from
CE devicesampling 200 valve is opened and pump is turned on, liquid flow is
from bioreactor toward flow-through vial throughthe filter
break 400 pump off, waiting for injectionwash 300 valve is closed and pump is turned on, liquid flow is
from wash bottle toward flow-through vial throughthe filter
pump off 1 pump is turned offend sequence ends and next run is started
Figure 3. Effect of the addition of Ca2+ as complex-forming agent to the BGE. Peak assignments: 1, formate; 2, succinate; 3, malate; 4, acetate; 5,glycolate; 6, glyoxylate; 7, lactate; and 8, gluconate. The concentration of the analytes was 50 mg/L. Other analysis conditions: BGE 20 mM 2,3-PDC (pH 9), amine coated eCAP silica capillary with 50 μm I.D. and 50/60 cm length, separation voltage −20 kV, temperature 25 °C, and injectionwith 0.5 psi vacuum for 5 s.
Analytical Chemistry Article
dx.doi.org/10.1021/ac402113x | Anal. Chem. 2013, 85, 9705−97129707

III/4 III/5
When reassessing the concentration of methanol in BGE, itwas noted that the addition of methanol made the glyoxylicacid peak broader, which made the separation significantly
poorer especially at low concentrations (Supporting Informa-tion Figure S-2). Because of this phenomenon, the effect ofisopropanol on the separation was tested (Figure 4).Isopropanol at a concentration of 10% (v/v) was found to bethe most suitable auxiliary substance for this purpose. Ingeneral, the addition of alcohol slows down the separation andthus increases the resolution.25 The addition of either of thealcohols had the greatest effect on the separation of PIPES andglyoxylic acid, which were not separated without the addition.Other analysis conditions were also revised. Voltage and
analysis temperature were optimized in the ranges from −15 to−30 kV and 20 to 30 °C, respectively. Indirect UV detectionwas set to 254 nm. Because of the flow-through vial that wasused for the online analysis of the cultivation samples, it wasnot possible to use normal pressure injection. Instead, a vacuumwas applied to the outlet vial during the injection. However,this approach led to poorer repeatability of the peak area. Theintraday RSD% varied between 5.6% and 8.5% for pressureinjection, whereas for vacuum injection the repeatability was
Figure 5. Online analysis of carboxylic acids during a bioreactor cultivation of K. lactis. (A) Separation of standards at 50 mg/L, (B) bioreactorsample at 0 h, and (C) bioreactor sample at 60 h. Peak assignments: 1, formate; 2, malate; 3, acetate; 4, glycolate; 5, glyoxylate; 6, PIPES; and 7,gluconate. Analysis conditions: BGE 20 mM 2,3-PDC with 80 mg/L Ca2+, 40 mg/L Mg2+, and 10% IPA (pH 9), amine coated eCAP silica capillarywith 50 μm I.D. and 50/60 cm length, separation voltage −20 kV and temperature 25 °C, injection with 0.5 psi vacuum for 5 s.
Figure 6. Online analysis of carboxylic acids during a bioreactor cultivation of S. cerevisiae. (A) Separation of standards at 50 mg/L, (B) bioreactorsample at 0 h, and (C) bioreactor sample at 22 h. Peak assignments: 1, formate; 2, malate; 3, acetate; 4, PIPES; 5, lactate; 6, gluconate. Analysisconditions as described in Figure 5
Table 3. Correlation of the Online (x) and Offline (y) CEAnalyses
K. lactis
acetate glycolate glyoxylate
equation y = 0.8758x −0.0396
y = 1.2193x −0.1573
y = 0.7493x −0.0416
correlationcoefficient
0.9530 0.8870 0.9703
S. cerevisiae
acetate malate lactate
equation y = 0.9578x +0.0312
y = 0.6967x +0.0121
y = 1.2767x +0.0165
correlationcoefficient
0.9768 0.7927 0.9061
Analytical Chemistry Article
dx.doi.org/10.1021/ac402113x | Anal. Chem. 2013, 85, 9705−97129709
cultivation were analyzed offline using HPLC. A WatersAlliance 2690 HPLC system (Waters, Milford, MA, U.S.A.)with Waters 2487 dual wavelength UV (210 nm) detector andWaters 2414 differential refractometer were used with aninjection volume of 20 μL. The columns used in this study werean Aminex HPX-87H Organic Acid Column (300 mm × 7.8mm, Bio-Rad, Hercules, CA, U.S.A.) connected to a Fast AcidAnalysis Column (100 mm × 7.8 mm, Bio-Rad). The eluentwas 5 mM H2SO4 (Titrisol, Merck), flow rate 0.5 mL/min andanalysis temperature +55 °C.
■ RESULTS AND DISCUSSION
Method Development. In our previous work, a CEanalysis method using uncoated fused silica capillaries wasdeveloped for the simultaneous quantification of 18 carboxylicacids potentially present in bioreactor samples with indirect UVdetection.24 In this study, it was noted that the dynamic coatingdeveloped on the capillary was not as robust as it should be inonline bioprocess monitoring in which the analyses cannot bemade with many replicates. Furthermore, in the future possibleautomated control of a cultivation based on analysis datarequires very repeatable migration times. A permanently coatedamine capillary was found to fulfill both requirements. In ourprevious work, intraday relative standard deviations (RSD%)for migration times varied between 0.74% and 1.61% whereaswith permanently coated capillary the RSD% were between0.3% and 0.6%. Furthermore, the analysis time was muchshorter improving from 20 min to less than 10 min. The aminecoated capillary is positively charged, thus it changes thedirection of electroosmotic flow. Hence, negative voltage wasapplied during the analysis.Because of this fundamental change in the analysis method,
other factors also had to be re-examined. The concentration ofthe UV absorbing agent and the pH of the BGE were the samebut the concentrations of complex forming-agents Ca2+ andMg2+, and the addition of alcohol were revalidated. Theconcentrations of both complex-forming agents were studied
between 0 and 100 mg/L individually and in different mixtures.The effect of Ca2+ addition to the BGE is presented in Figure 3.The most notable effects on the separation were observed withsuccinate, malate, acetate, glycolate, and gluconate. The optimalconcentration of Ca2+ was chosen to be 80 mg/L. Using thisconcentration, the separation enhancement properties of Mg2+
were studied and is presented in Supporting Information FigureS-1. Mg2+ improved the separation especially between acetateand glycolate, and made the method slightly faster. The optimalconcentration of Mg2+ was 40 mg/L.
Figure 4. Effect of isopropanol addition to the BGE. Peak assignments: 1, formate; 2, succinate; 3, malate; 4, acetate; 5, glycolate; 6, glyoxylate; 7,PIPES; 8, lactate; 9, gluconate. The concentration of the analytes was 20 mg/L, except PIPES and gluconate 50 mg/L. Other analysis conditions:BGE 20 mM 2,3-PDC with 80 mg/L Ca2+ and 40 mg/L Mg2+ (pH 9), amine coated eCAP silica capillary with 50 μm I.D. and 50/60 cm length,separation voltage −20 kV, temperature 25 °C, and injection with 0.5 psi vacuum for 5 s.
Table 2. Performance of the Method under OptimizedConditions
formate succinate malate acetate glycolate
RSD% of migrationtime (intraday)a
0.3 0.3 0.3 0.4 0.4
RSD% of migrationtime (interday)b
1.0 1.0 1.1 1.1 1.1
RSD% of peak area(intraday)a
14.5 13.7 15.1 18.3 12.2
RSD% of peak area(interday)b
16.3 13.9 16.0 20.7 13.3
detection limit(mg/L)
0.5 0.5 1 1 1
calibrationcorrelationcoefficient
0.9996 0.9980 0.9973 0.9996 0.9982
glyoxylate PIPES lactate gluconate
RSD% of migration time(intraday)a
0.5 0.5 0.5 0.6
RSD% of migration time(interday)b
1.1 1.2 1.2 1.4
RSD% of peak area (intraday)a 13.1 12.3 12.6 9.7
RSD% of peak area (interday)b 16.4 13.6 13.7 10.3
detection limit (mg/L) 2 2 1 3
calibration correlation coefficient 0.9985 0.9988 0.9988 0.9996aPercentage of relative standard deviation, n = 8. bPercentage ofrelative standard deviation, n = 4.
Analytical Chemistry Article
dx.doi.org/10.1021/ac402113x | Anal. Chem. 2013, 85, 9705−97129708

III/5
When reassessing the concentration of methanol in BGE, itwas noted that the addition of methanol made the glyoxylicacid peak broader, which made the separation significantly
poorer especially at low concentrations (Supporting Informa-tion Figure S-2). Because of this phenomenon, the effect ofisopropanol on the separation was tested (Figure 4).Isopropanol at a concentration of 10% (v/v) was found to bethe most suitable auxiliary substance for this purpose. Ingeneral, the addition of alcohol slows down the separation andthus increases the resolution.25 The addition of either of thealcohols had the greatest effect on the separation of PIPES andglyoxylic acid, which were not separated without the addition.Other analysis conditions were also revised. Voltage and
analysis temperature were optimized in the ranges from −15 to−30 kV and 20 to 30 °C, respectively. Indirect UV detectionwas set to 254 nm. Because of the flow-through vial that wasused for the online analysis of the cultivation samples, it wasnot possible to use normal pressure injection. Instead, a vacuumwas applied to the outlet vial during the injection. However,this approach led to poorer repeatability of the peak area. Theintraday RSD% varied between 5.6% and 8.5% for pressureinjection, whereas for vacuum injection the repeatability was
Figure 5. Online analysis of carboxylic acids during a bioreactor cultivation of K. lactis. (A) Separation of standards at 50 mg/L, (B) bioreactorsample at 0 h, and (C) bioreactor sample at 60 h. Peak assignments: 1, formate; 2, malate; 3, acetate; 4, glycolate; 5, glyoxylate; 6, PIPES; and 7,gluconate. Analysis conditions: BGE 20 mM 2,3-PDC with 80 mg/L Ca2+, 40 mg/L Mg2+, and 10% IPA (pH 9), amine coated eCAP silica capillarywith 50 μm I.D. and 50/60 cm length, separation voltage −20 kV and temperature 25 °C, injection with 0.5 psi vacuum for 5 s.
Figure 6. Online analysis of carboxylic acids during a bioreactor cultivation of S. cerevisiae. (A) Separation of standards at 50 mg/L, (B) bioreactorsample at 0 h, and (C) bioreactor sample at 22 h. Peak assignments: 1, formate; 2, malate; 3, acetate; 4, PIPES; 5, lactate; 6, gluconate. Analysisconditions as described in Figure 5
Table 3. Correlation of the Online (x) and Offline (y) CEAnalyses
K. lactis
acetate glycolate glyoxylate
equation y = 0.8758x −0.0396
y = 1.2193x −0.1573
y = 0.7493x −0.0416
correlationcoefficient
0.9530 0.8870 0.9703
S. cerevisiae
acetate malate lactate
equation y = 0.9578x +0.0312
y = 0.6967x +0.0121
y = 1.2767x +0.0165
correlationcoefficient
0.9768 0.7927 0.9061
Analytical Chemistry Article
dx.doi.org/10.1021/ac402113x | Anal. Chem. 2013, 85, 9705−97129709

III/6 III/7
interval was either once an hour or once per two hours. Underoptimized conditions the separation could be performed at leastevery 20 min to facilitate accurate monitoring of fasterprocesses. The sample was injected about 8 min after thesampling was started. The total sample volume removed fromthe reactor was approximately 9 mL per sample. To correcterrors of sampling, dilution and analysis, results were correctedwith internal standards that were added to the cultivation media(PIPES) and to diluent (gluconic acid). It was noted that inboth cultivations, the concentration of gluconic acid remainedthe same throughout the cultivation, but the concentration ofPIPES started to decrease slowly. This was primarily caused bythe online filtration because in S. cerevisiae cultivation the filterpaper was changed at 45 h and the concentration normalized.Data collected from the internal standards is presented inSupporting Information Figures S-3 and S-4. Offline sampleswere taken and treated manually directly after the sampling.The volume of the samples was 3 mL. The separation ofcarboxylic acids during cultivations of K. lactis and S. cerevisiae ispresented in Figures 5 and 6, respectively.In K. lactis cultivation, in which the purpose was to study the
production of glycolate from ethanol in aerobic conditions, theonline and offline CE analysis results correlated rather well, asillustrated in Table 3 in which offline results are presented as afunction of online results. The concentration of acetateincreased to about 1 g/L (Figure 7A), but it began to decreaseafter 90 h of cultivation. At that point, the yeast had consumedall the ethanol (Figure 7D) provided as substrate and it startedto consume acetate as a substrate. As presented in Figures 7Band C, the concentrations of glycolic and glyoxylic acidsincreased throughout the cultivation. The concentrations ofacetate and glyoxylate were higher in online analysis comparedto offline analysis. This was probably due to losses duringmanual sampling. In the manually taken sample, the conditionsduring sample preparation (centrifugation) are not as oxidizingas in the cultivation, thus enhancing the formation of glycolatefrom glyoxylate. For this reason, and because the level of yeastcells increases during cultivation, the offline concentration ofglycolate is higher especially at the end of the cultivation. Onthe other hand, the change in the conditions during samplepreparation might enable the formation of acetaldehyde orethanol from acetate. In the online analysis system, cells areremoved from the sample faster than in manual sampling andthe balanced cultivation conditions are not altered by thesampling event. Furthermore in the case of this particularcultivation, the online analysis of the product glycolate and thebyproducts acetate and glyoxylate could be used to optimizethe aeration conditions for maximizing the production ofglycolate.The correlation between online and offline analyses of the S.
cerevisiae cultivation was also rather good, as presented in Table3. In this study the purpose was to study the production ofethanol from xylose under anaerobic conditions in whichcarboxylic acids are byproducts of the cultivation. Theconcentrations of malate (Figure 8A) and acetate (Figure 8B)increased throughout the cultivation, but the production oflactate (Figure 8C) ended already after 20 h. At that point, aspresented in the HPLC results (Figure 8D), glucose had beenconsumed almost completely. When the cultivation was endedat 64 h, xylose was still not completely utilized by themicroorganism. As presented in Figure 8D, alcohols were alsoformed during the cultivation, particularly ethanol and xylitolbut also small amounts of glycerol. Online measurements
provided detailed information about the dynamics of theproduction of the byproducts acetate, malate and lactate whencomparing the metabolism of glucose and xylose.
■ CONCLUSIONSAn online capillary electrophoresis system with flow-throughsample vial was constructed for monitoring bioreactorcultivations. The procedure was used to monitor carboxylicacid production by two yeasts, K. lactis and S. cerevisiae. Theonline system ran independently for almost 6 days, indicatingits potential as a continuous monitoring tool for feed-backcontrol of bioreactor cultivations.
■ ASSOCIATED CONTENT*S Supporting InformationEffect of Mg2+ addition to the BGE, the effect of methanoladdition the BGE, and variations of internal standard peak areasduring cultivations. This material is available free of charge viathe Internet at http://pubs.acs.org.
■ AUTHOR INFORMATIONCorresponding Author*Phone: (+358) 40 358 1271. E-mail: [email protected].
NotesThe authors declare no competing financial interest.
■ ACKNOWLEDGMENTSThis work was carried out within the Finnish Centre ofExcellence in White BiotechnologyGreen Chemistry Re-search granted by the Academy of Finland (grant number118573) and partly within the EU-project Nanobe, whichreceived funding from the European Community’s SeventhFramework Programme (FP7/2007−2013) under grant agree-ment no. 227243. H.T. was also supported by Graduate Schoolfor Chemical Sensors and Microanalytical Systems (CHEM-SEM). Outi Koivistoinen and Laura Salusjarvi are acknowl-edged for providing the K. lactis and S. cerevisiae strains,respectively, for the bioreactor cultivations. We would also liketo thank Ingmar Stuns for constructing the flow-throughsample vial.
■ REFERENCES(1) Clementschitsch, F.; Bayer, K. Microb. Cell Fact. 2006, 5, 19−29.(2) Tohmola, N.; Ahtinen, J.; Pitkanen, J.-P.; Parviainen, V.;Joenvaara, S.; Hautamaki, M.; Lindroos, P.; Makinen, J.; Renkonen,R. Biotechnol. Bioproc. Eng. 2011, 16, 264−272.(3) Turner, C.; Thornhill, N. F.; Fish, N. M. Biotechnol. Tech. 1993, 7,19−24.(4) Liu, Y.-C.; Wang, F.-S.; Lee, W.-C. Biochem. Eng. J. 2001, 7, 17−25.(5) von Zumbusch, P.; Meyer-Jens, T.; Brunner, G.; Markl, H. Appl.Microbiol. Biotechnol. 1994, 42, 140−146.(6) Rehorek, A.; Urbig, K.; Meurer, R.; Schafer, C.; Plum, A.; Braun,G. J. Chromatogr. A 2002, 949, 263−268.(7) Rehorek, A.; Plum, A. Anal. Bioanal. Chem. 2006, 384, 1123−1128.(8) De Sa, L. R. V.; De Oliveira, M. A. L.; Cammarota, M. C.; Matos,A.; Ferreira-Laitao, V. S. Int. J. Hydrogen Energy 2011, 36, 15177−15186.(9) Kaiser, C.; Pototzki, T.; Ellert, A.; Luttmann, R. Eng. Life Sci.2008, 8, 132−138.(10) Lili, W.; Jie, Q.; Zhongce, H.; Yuguo, Z.; Wei, H. Anal. Chim.Acta 2006, 557, 262−266.
Analytical Chemistry Article
dx.doi.org/10.1021/ac402113x | Anal. Chem. 2013, 85, 9705−97129711
between 9.7% and 18.3%, but it was still suitable for ourpurposes. The injection time was tested between 3 and 5 s. Theperformance of the optimized analysis method was studied inoffline analysis mode and the summary is presented in Table 2.In the optimized method 20 mM 2,3-PDC with 80 mg/L
Ca2+, 40 mg/L Mg2+, and 10% (v/v) IPA (pH 9 adjusted with
25% ammonia) was used for the analysis. Negative voltage wasset to −20 kV, capillary temperature was 25 °C, total capillarylength was 50 cm, and detection wavelength was 254 nm.
Analysis of Cultivation Samples. The online analysis ofcarboxylic acids during bioreactor cultivations was performedautomatically with the optimized CE method. The sampling
Figure 7. Comparison of online and offline CE analysis results of a K. lactis cultivation, and the offline HPLC results: (A) acetate, (B) glycolate, (C)glyoxylate, and (D) HPLC results of ethanol and xylose.
Figure 8. Comparison of online and offline CE analysis results of a S. cerevisiae cultivation, and the offline HPLC results: (A) malate, (B) acetate, (C)lactate, and (D) HPLC results of glucose, xylose, ethanol, glycerol, and xylitol.
Analytical Chemistry Article
dx.doi.org/10.1021/ac402113x | Anal. Chem. 2013, 85, 9705−97129710

III/7
interval was either once an hour or once per two hours. Underoptimized conditions the separation could be performed at leastevery 20 min to facilitate accurate monitoring of fasterprocesses. The sample was injected about 8 min after thesampling was started. The total sample volume removed fromthe reactor was approximately 9 mL per sample. To correcterrors of sampling, dilution and analysis, results were correctedwith internal standards that were added to the cultivation media(PIPES) and to diluent (gluconic acid). It was noted that inboth cultivations, the concentration of gluconic acid remainedthe same throughout the cultivation, but the concentration ofPIPES started to decrease slowly. This was primarily caused bythe online filtration because in S. cerevisiae cultivation the filterpaper was changed at 45 h and the concentration normalized.Data collected from the internal standards is presented inSupporting Information Figures S-3 and S-4. Offline sampleswere taken and treated manually directly after the sampling.The volume of the samples was 3 mL. The separation ofcarboxylic acids during cultivations of K. lactis and S. cerevisiae ispresented in Figures 5 and 6, respectively.In K. lactis cultivation, in which the purpose was to study the
production of glycolate from ethanol in aerobic conditions, theonline and offline CE analysis results correlated rather well, asillustrated in Table 3 in which offline results are presented as afunction of online results. The concentration of acetateincreased to about 1 g/L (Figure 7A), but it began to decreaseafter 90 h of cultivation. At that point, the yeast had consumedall the ethanol (Figure 7D) provided as substrate and it startedto consume acetate as a substrate. As presented in Figures 7Band C, the concentrations of glycolic and glyoxylic acidsincreased throughout the cultivation. The concentrations ofacetate and glyoxylate were higher in online analysis comparedto offline analysis. This was probably due to losses duringmanual sampling. In the manually taken sample, the conditionsduring sample preparation (centrifugation) are not as oxidizingas in the cultivation, thus enhancing the formation of glycolatefrom glyoxylate. For this reason, and because the level of yeastcells increases during cultivation, the offline concentration ofglycolate is higher especially at the end of the cultivation. Onthe other hand, the change in the conditions during samplepreparation might enable the formation of acetaldehyde orethanol from acetate. In the online analysis system, cells areremoved from the sample faster than in manual sampling andthe balanced cultivation conditions are not altered by thesampling event. Furthermore in the case of this particularcultivation, the online analysis of the product glycolate and thebyproducts acetate and glyoxylate could be used to optimizethe aeration conditions for maximizing the production ofglycolate.The correlation between online and offline analyses of the S.
cerevisiae cultivation was also rather good, as presented in Table3. In this study the purpose was to study the production ofethanol from xylose under anaerobic conditions in whichcarboxylic acids are byproducts of the cultivation. Theconcentrations of malate (Figure 8A) and acetate (Figure 8B)increased throughout the cultivation, but the production oflactate (Figure 8C) ended already after 20 h. At that point, aspresented in the HPLC results (Figure 8D), glucose had beenconsumed almost completely. When the cultivation was endedat 64 h, xylose was still not completely utilized by themicroorganism. As presented in Figure 8D, alcohols were alsoformed during the cultivation, particularly ethanol and xylitolbut also small amounts of glycerol. Online measurements
provided detailed information about the dynamics of theproduction of the byproducts acetate, malate and lactate whencomparing the metabolism of glucose and xylose.
■ CONCLUSIONSAn online capillary electrophoresis system with flow-throughsample vial was constructed for monitoring bioreactorcultivations. The procedure was used to monitor carboxylicacid production by two yeasts, K. lactis and S. cerevisiae. Theonline system ran independently for almost 6 days, indicatingits potential as a continuous monitoring tool for feed-backcontrol of bioreactor cultivations.
■ ASSOCIATED CONTENT*S Supporting InformationEffect of Mg2+ addition to the BGE, the effect of methanoladdition the BGE, and variations of internal standard peak areasduring cultivations. This material is available free of charge viathe Internet at http://pubs.acs.org.
■ AUTHOR INFORMATIONCorresponding Author*Phone: (+358) 40 358 1271. E-mail: [email protected].
NotesThe authors declare no competing financial interest.
■ ACKNOWLEDGMENTSThis work was carried out within the Finnish Centre ofExcellence in White BiotechnologyGreen Chemistry Re-search granted by the Academy of Finland (grant number118573) and partly within the EU-project Nanobe, whichreceived funding from the European Community’s SeventhFramework Programme (FP7/2007−2013) under grant agree-ment no. 227243. H.T. was also supported by Graduate Schoolfor Chemical Sensors and Microanalytical Systems (CHEM-SEM). Outi Koivistoinen and Laura Salusjarvi are acknowl-edged for providing the K. lactis and S. cerevisiae strains,respectively, for the bioreactor cultivations. We would also liketo thank Ingmar Stuns for constructing the flow-throughsample vial.
■ REFERENCES(1) Clementschitsch, F.; Bayer, K. Microb. Cell Fact. 2006, 5, 19−29.(2) Tohmola, N.; Ahtinen, J.; Pitkanen, J.-P.; Parviainen, V.;Joenvaara, S.; Hautamaki, M.; Lindroos, P.; Makinen, J.; Renkonen,R. Biotechnol. Bioproc. Eng. 2011, 16, 264−272.(3) Turner, C.; Thornhill, N. F.; Fish, N. M. Biotechnol. Tech. 1993, 7,19−24.(4) Liu, Y.-C.; Wang, F.-S.; Lee, W.-C. Biochem. Eng. J. 2001, 7, 17−25.(5) von Zumbusch, P.; Meyer-Jens, T.; Brunner, G.; Markl, H. Appl.Microbiol. Biotechnol. 1994, 42, 140−146.(6) Rehorek, A.; Urbig, K.; Meurer, R.; Schafer, C.; Plum, A.; Braun,G. J. Chromatogr. A 2002, 949, 263−268.(7) Rehorek, A.; Plum, A. Anal. Bioanal. Chem. 2006, 384, 1123−1128.(8) De Sa, L. R. V.; De Oliveira, M. A. L.; Cammarota, M. C.; Matos,A.; Ferreira-Laitao, V. S. Int. J. Hydrogen Energy 2011, 36, 15177−15186.(9) Kaiser, C.; Pototzki, T.; Ellert, A.; Luttmann, R. Eng. Life Sci.2008, 8, 132−138.(10) Lili, W.; Jie, Q.; Zhongce, H.; Yuguo, Z.; Wei, H. Anal. Chim.Acta 2006, 557, 262−266.
Analytical Chemistry Article
dx.doi.org/10.1021/ac402113x | Anal. Chem. 2013, 85, 9705−97129711

III/8 1
(11) Wortberg, M.; Ziemer, W.; Kugel, M.; Muller, H.; Neu, H.-J.Anal. Bioanal. Chem. 2006, 384, 1113−1122.(12) Siren, H.; Kokkonen, R.; Hiissa, T.; Sarme, T.; Rimpinen, O.;Laitinen, R. J. Chromatogr. A 2000, 895, 189−196.(13) Kokkonen, R.; Siren, H.; Kauliomaki, S.; Rovio, S.; Luomanpera,K. J. Chromatogr. A 2004, 1032, 243−252.(14) Mai, T. D.; Pham, T. T. T.; Pham, H. V.; Saiz, J.; Ruiz, C. G.;Hauser, P. C. Anal. Chem. 2013, 85, 2333−2339.(15) Gaudry, A. J.; Guijt, R. M.; Macka, M.; Hutchinson, J. P.; Johns,C.; Hilder, E. F.; Dicinoski, G. W.; Nesterenko, P. N.; Haddad, P. R.;Breadmore, M. C. Anal. Chim. Acta 2013, 781, 80−87.(16) Ehala, S.; Vassiljeva, I.; Kuldvee, R.; Vilu, R.; Kaljurand, M.Fresen. J. Anal. Chem. 2001, 371, 168−173.(17) Kulp, M.; Kaljurand, M. J. Chromatogr. A 2004, 1032, 305−312.(18) Tahkoniemi, H.; Helmja, K.; Menert, A.; Kaljurand, M. J.Pharmaceut. Biomed. Anal. 2006, 41, 1585−1591.(19) Watson, C. J.; Lydic, R.; Baghdoyan, H. A. J. Neurochem. 2011,118, 571−580.(20) Kudrjashova, M.; Tahkoniemi, H.; Helmja, K.; Kaljurand, M.Proc. Estonian Acad. Sci. Chem. 2004, 53, 51−64.(21) Koivistoinen, O. M.; Kuivanen, J.; Barth, D.; Turkia, H.;Pitkanen, J.-P.; Penttila, M.; Richard, P. Microb. Cell Fact. 2013,DOI: 10.1186/1475-2859-12-82.(22) Salusjarvi, L.; Kaunisto, S.; Holmstrom, S.; Vehkomaki, M.-L.;Koivuranta, K.; Pitkanen, J.-P.; Ruohonen, L. J. Ind. Microbiol.Biotechnol. 2013, In press.(23) Taherzadeh, M. J.; Liden, G.; Gustafsson, L.; Niklasson, C. Appl.Microbiol. Biotechnol. 1996, 46, 176−182.(24) Turkia, H.; Siren, H.; Pitkanen, J.-P.; Wiebe, M.; Penttila, M. J.Chromatogr. A 2010, 1217, 1537−1542.(25) Chiari, M. J. Chromatogr. A 1998, 805, 1−15.
Analytical Chemistry Article
dx.doi.org/10.1021/ac402113x | Anal. Chem. 2013, 85, 9705−97129712

1
PUBLICATION IV
Capillary electrophoresis with laser-induced fluorescence
detection for studying amino acid uptake by yeast during beer
fermentation
Submitted to Journal of Chromatography B.

IV/1

IV/1
Capillary electrophoresis with laser-induced fluorescencedetection for studying amino acid uptake by yeast
during beer fermentation
Heidi Turkiaa,b*, Heli Siréna, Merja Penttiläb, and Juha-Pekka Pitkänenb
a Lappeenranta University of Technology, P.O. Box 20, FIN-53580 Lappeenranta, Finlandb VTT Technical Research Centre of Finland, P.O. Box 1000, Fin-02044 VTT, Finland
*Corresponding author. E-mail: [email protected]. Tel: +358 40 358 1271; fax: +358 20 722 7071
ABSTRACTThe amino acid composition of cultivation broth is known to affect the biomass accumulation,productivity, and vitality of yeast during cultivation. In addition, it is known to affect the concentra-tion of flavor-active higher alcohols, vicinal diketones, and esters in beer. The total concentrationand composition of amino acids is also important because the use of sugar supplements in cultiva-tion has the effect of reducing the nitrogen/carbon ratio, potentially limiting yeast growth and ne-cessitating the addition of nitrogen supplements. In this study capillary electrophoresis with laser-induced fluorescence (LIF) detection was used for the determination of amino acid consumption bySaccharomyces cerevisiae during beer fermentation. Intraday relative standard deviations were lessthan 2.1% for migration times and between 2.9% and 9.9% for peak areas. Interday relative stand-ard deviations were less than 2.5% for migration times and between 4.4% and 18.9% for peak areas.The detection limit was even as low as 62.5 pM which equals to below attomole level detection.The method was applied to study the rate of amino acid utilization during fermentation.
Keywords: Bioprocess monitoring; Capillary electrophoresis; Amino acids; Laser-induced flu-orescence detection; Beer fermentation
1. IntroductionNitrogen is one of the main elements in macro-molecules of all living organisms. It plays acentral role in structure and function, and mostorganisms have detailed control mechanisms tomaintain a constant supply of nitrogen. Yeast isable to use a wide variety of compounds as ni-trogen sources, but it prefers ammonia, aspara-gine, glutamine or glutamate. In the absence ofthese primary nitrogen sources or if they arepresent in concentrations low enough to limitgrowth, other nitrogen sources such as nitrite,nitrate, amides, amino acids and peptides areused. [1]
Amino acid composition of cultivation brothis known to affect the biomass accumulation,productivity, and vitality of yeast during cultiva-tion. In addition, it is known to affect the con-centration of flavor-active higher alcohols, vici-
nal diketones, and esters in beer. The total con-centration and composition of amino acids isalso important because the use of sugar supple-ments in cultivation has the effect of reducingthe nitrogen/carbon ratio, potentially limitingyeast growth and necessitating the addition ofnitrogen supplements. [2] Thus, it is essentialfor the optimization of process parameters andcultivation performance to monitor amino aciduptake and consumption.
All-malt brewery wort contains a wide vari-ety of natural nitrogen sources, of which aminoacids are the most abundant. It contains all thephysiologically active amino acids, but therecan be differences in individual amino acid con-centrations between wort types. However, theoverall proportions of amino acids tend to berelatively constant. Amino acids are taken up

IV/2 IV/3
2.2 Instrumentation
All the measurements were made with a P/ACEMDQ capillary electrophoresis system equippedwith an LIF detector (Beckmann Coulter Inc.,Fullerton, CA, USA). The LIF detector had anargon-ion laser with 488 nm excitation and 520nm emission wavelengths. Bare fused-silicacapillaries (Teknolab, Trollasen, Norway) withinner diameter 50 m, outer diameter 365 m,and total length 60 cm (50 cm to the detector)were used. The capillaries were conditionedbefore use with 0.1 M NaOH, Milli-Q purifiedwater, and BGE for 10 minutes each. Voltage(+30 kV) was then applied for 5 minutes. Betweenanalyses, capillaries were rinsed with 0.1 MNaOH, 18 m deionized water and with BGEfor 2, 1 and 2 minutes, respectively. Data wascollected and processed with 32Karat software(Beckmann Coulter Inc., Fullerton, CA, USA).
2.3 Analysis conditions
BGE was prepared with 50 mM sodium tetra-borate, 30 mM SDS and 20 mM 18-crown-6-ether in milli-Q purified water. The pH of thesolution was 9.0. Before analysis, the BGE wasdegassed by ultrasound and filtered through a0.45 µm Acrodisc GHP syringe filter (Pall LifeScience, Ann Arbor, MI, USA). Fused silicacapillaries with inner diameter 50 µm, outerdiameter 360 µm and total lengths of 60 cm(50 cm to the detector) were used.
Standards and samples were injected by us-ing 0.5 psi pressure for 10 s, giving rise to aninjection volume of 8 nL. Separation was car-ried out at +30 kV at constant capillary tempera-ture +15 °C. Sample cartridge temperature wasset at +15 °C. The analytes were detected withthe LIF detector using an excitation wavelengthof 488 nm and emission wavelength of 520 nm.Concentrations of sugars and alcohols were ana-lyzed by a Waters Alliance 2690 HPLC system(Milford, MA, USA) with Waters 2487 dualwavelength UV (210 nm) detector and Waters2414 differential refractometer with an injectionvolume of 10 µL. The columns were an ICSepION-310 Fast Analysis Column (150 mm x 6.5mm, Transgenomic, Inc., Omaha, NE, USA)connected to an ICSep ICE-ORH-801 Column(300 mm x 6.5 mm, Transgenomic). The eluent
was 5 mM H2SO4 (Titrisol, Merck), flow rate0.5 mL/min and analysis temperature +55 °C.The optical density of the sample was measuredby a Shimadzu UV-1201 spectrometer (Kyoto,Japan) at wavelength 600 nm (=OD600). OD600is a measure of cell density. The cell dry weight(CDW) was determined by filtering 20 mL ofsample through a measured filter paper, washingit with distilled water and drying it in an oven(105 °C) for at least 16 hours. After that thecells were weighed with the filtration paper andthe CDW was calculated.
2.4 Cultivation conditions and sampling
To obtain a pre-culture, Saccharomyces cere-visiae strain VTT A-6035 (VTT, Finland) waspropagated as a 2 L culture in a Biostat C-DCUbioreactor (B. Braun Biotech International,Germany) at temperature +24 °C, agitation400 rpm, under aerobic conditions with 0.4 L/minair. The bioreactor was inoculated with cellsgrown for 16 hours in YPD medium (10 g/Lyeast extract, 20 g/L peptone and 20 g/L dex-trose) at 28 °C and 200 rpm. Cultivation wasperformed in wort (Sinebrychoff, Finland) for26 hours. After this the yeast was allowed tosink to the bottom of the bioreactor without agi-tation for 22 hours at 10 °C. Excess fermenta-tion broth was removed and the cells were trans-ferred to a 10 L Biostat C-DCU bioreactor (B.Braun Biotech International, Germany). Thecultivation was maintained in wort at tempera-ture +20 °C, agitation 200 rpm and nitrogenflow rate 0.4 L/min for 210 hours. Sampleswere collected automatically from the bioreactorwith a Jipster sampling carousel (Medicel, Es-poo, Finland) every hour and stored at -30 °C.During sampling the samples were filteredthrough 0.22 µm GV filtration paper (Millipore)with an automated A-SEP cross flow filtrationmodule (Applikon, Delft, the Netherlands).
2.5 Sample preparation
The OG-SE derivatization procedure was per-formed by adding 10 µL of 2 mM OG-SE solu-tion, 5 µL of sample and 35 µL of 30 mM tetra-borate buffer (pH 9.0) to an Eppendorf tube.The reaction mixture was vortexed for 10 s andmicrocentrifuged for 20 s to bring possible
sequentially, although the exact order of uptakeis strain specific. [2]
Capillary electrophoresis (CE) is an excellentanalysis tool for bioprocess monitoring. It hashigh resolution, strong separation efficiency,fast analysis times and low consumption ofsample and reagents. [3] CE has been used ex-tensively for the analysis of amino acids in dif-ferent matrices and with different detectors.Amino acids have been analyzed with indirectUV [4], mass spectrometric (MS) [5–8], con-ductivity [9] and laser-induced fluorescence(LIF) [10–15] detection.
Amino acid separation and identification bydirect UV detection is very difficult, becausethey do not have a chromophore in their struc-ture. It is possible to use indirect UV detection,in which chemicals containing chromophoresare added to the background electrolyte (BGE)solution, but the sensitivity is even lower thanwith direct UV detection. [13] Laser-inducedfluorescence (LIF) detection is used widely toimprove the sensitivity of CE. It is the most sen-sitive detection method available with detectionlimits below 10-21 mol, which makes it almost1000 times more sensitive than UV detection.Most of the analytes do not have native fluores-cence and therefore the use of this detectionmethod involves attaching fluorescent probemolecules to the analyte. Most fluorescent
probes can be designed to contain a reactivemoiety capable of coupling to a specific func-tional group of a biomolecule. With this derivat-ization procedure it is possible to enhance theselectivity of the detection. [16]
Oregon green™ 488 carboxylic acid, succin-imidyl ester (OG-SE) is a fluorinated analogueof fluorescein. Conjugates of Oregon greenfluorophores are more photostable than those offluorescein and are less pH sensitive. The exci-tation and emission maxima of the label are at496 nm and 524 nm, respectively, which aresuitable for use with an argon-ion laser. Reac-tion of OG-SE with primary and secondaryamines creates stable amide and imide linkages,respectively, and the reaction occurs rapidly inmild conditions.
In this study a derivatization technique cou-pled with capillary electrophoresis separationwas developed for the simultaneous monitoring,identification and quantification of amino acids.This method was applied for monitoring theamino acid uptake of yeast during beer fermen-tation. The results were compared to the con-sumption of sugars present in the wort and tothe production of ethanol during the bioprocess.This study provides a monitoring system withgreat importance for the optimization of processparameters and cultivation performance.
2. Experimental
2.1 ChemicalsStock solutions of amino acid standards wereprepared in 18 m deionized water (Millipore,Bedford, MA, USA) at 10 mM concentration.Oregon green® 488 carboxylic acid, succin-imidyl ester 6-isomer (Molecular Probes Inc.,Eugene, OR, USA) was prepared in dimethyl-sulfoxide (DMSO, Sigma-Aldrich, Steinheim,Germany) as a 2 mM solution.
L-isoleucine ( 99.5%), L-serine ( 99%),L-leucine ( 99%), L-histidine ( 99.5%),L-threonine ( 99%), L-tryptophan ( 99%),L-lysine ( 98%), L-methionine ( 99%),L-arginine ( 99%), L-glutamic acid ( 99%),L-cysteine ( 99.5%), L-asparagine ( 99%),L-aspartic acid ( 99%), L-proline ( 99%), andL-glutamine ( 99%) were purchased from Fluka
(Buchs, Switzerland). L-tyrosine ( 99%),L-phenylalanine ( 99%), L-alanine ( 99%) andL-glycine ( 99.7%) were from Merck (Darm-stadt, Germany). DL-valine ( 97%) was fromSigma-Aldrich.
Background electrolyte (BGE) solutionswere prepared from sodium tetraborate decahy-drate ( 99.5%), sodium dodecyl sulfate (SDS)
99%), 18-crown-6-ether (99%), -cyclodextrin97%), and CHAPSO ( 98%), which were
purchased from Sigma-Aldrich. A 0.1 M sodi-um hydroxide solution for the capillary condi-tioning was from FF-Chemicals Ab (Haukipudas,Finland).

IV/3
2.2 Instrumentation
All the measurements were made with a P/ACEMDQ capillary electrophoresis system equippedwith an LIF detector (Beckmann Coulter Inc.,Fullerton, CA, USA). The LIF detector had anargon-ion laser with 488 nm excitation and 520nm emission wavelengths. Bare fused-silicacapillaries (Teknolab, Trollasen, Norway) withinner diameter 50 m, outer diameter 365 m,and total length 60 cm (50 cm to the detector)were used. The capillaries were conditionedbefore use with 0.1 M NaOH, Milli-Q purifiedwater, and BGE for 10 minutes each. Voltage(+30 kV) was then applied for 5 minutes. Betweenanalyses, capillaries were rinsed with 0.1 MNaOH, 18 m deionized water and with BGEfor 2, 1 and 2 minutes, respectively. Data wascollected and processed with 32Karat software(Beckmann Coulter Inc., Fullerton, CA, USA).
2.3 Analysis conditions
BGE was prepared with 50 mM sodium tetra-borate, 30 mM SDS and 20 mM 18-crown-6-ether in milli-Q purified water. The pH of thesolution was 9.0. Before analysis, the BGE wasdegassed by ultrasound and filtered through a0.45 µm Acrodisc GHP syringe filter (Pall LifeScience, Ann Arbor, MI, USA). Fused silicacapillaries with inner diameter 50 µm, outerdiameter 360 µm and total lengths of 60 cm(50 cm to the detector) were used.
Standards and samples were injected by us-ing 0.5 psi pressure for 10 s, giving rise to aninjection volume of 8 nL. Separation was car-ried out at +30 kV at constant capillary tempera-ture +15 °C. Sample cartridge temperature wasset at +15 °C. The analytes were detected withthe LIF detector using an excitation wavelengthof 488 nm and emission wavelength of 520 nm.Concentrations of sugars and alcohols were ana-lyzed by a Waters Alliance 2690 HPLC system(Milford, MA, USA) with Waters 2487 dualwavelength UV (210 nm) detector and Waters2414 differential refractometer with an injectionvolume of 10 µL. The columns were an ICSepION-310 Fast Analysis Column (150 mm x 6.5mm, Transgenomic, Inc., Omaha, NE, USA)connected to an ICSep ICE-ORH-801 Column(300 mm x 6.5 mm, Transgenomic). The eluent
was 5 mM H2SO4 (Titrisol, Merck), flow rate0.5 mL/min and analysis temperature +55 °C.The optical density of the sample was measuredby a Shimadzu UV-1201 spectrometer (Kyoto,Japan) at wavelength 600 nm (=OD600). OD600is a measure of cell density. The cell dry weight(CDW) was determined by filtering 20 mL ofsample through a measured filter paper, washingit with distilled water and drying it in an oven(105 °C) for at least 16 hours. After that thecells were weighed with the filtration paper andthe CDW was calculated.
2.4 Cultivation conditions and sampling
To obtain a pre-culture, Saccharomyces cere-visiae strain VTT A-6035 (VTT, Finland) waspropagated as a 2 L culture in a Biostat C-DCUbioreactor (B. Braun Biotech International,Germany) at temperature +24 °C, agitation400 rpm, under aerobic conditions with 0.4 L/minair. The bioreactor was inoculated with cellsgrown for 16 hours in YPD medium (10 g/Lyeast extract, 20 g/L peptone and 20 g/L dex-trose) at 28 °C and 200 rpm. Cultivation wasperformed in wort (Sinebrychoff, Finland) for26 hours. After this the yeast was allowed tosink to the bottom of the bioreactor without agi-tation for 22 hours at 10 °C. Excess fermenta-tion broth was removed and the cells were trans-ferred to a 10 L Biostat C-DCU bioreactor (B.Braun Biotech International, Germany). Thecultivation was maintained in wort at tempera-ture +20 °C, agitation 200 rpm and nitrogenflow rate 0.4 L/min for 210 hours. Sampleswere collected automatically from the bioreactorwith a Jipster sampling carousel (Medicel, Es-poo, Finland) every hour and stored at -30 °C.During sampling the samples were filteredthrough 0.22 µm GV filtration paper (Millipore)with an automated A-SEP cross flow filtrationmodule (Applikon, Delft, the Netherlands).
2.5 Sample preparation
The OG-SE derivatization procedure was per-formed by adding 10 µL of 2 mM OG-SE solu-tion, 5 µL of sample and 35 µL of 30 mM tetra-borate buffer (pH 9.0) to an Eppendorf tube.The reaction mixture was vortexed for 10 s andmicrocentrifuged for 20 s to bring possible

IV/4 IV/5
BGE consisting of tetraborate and SDS. 18C6 isclassified as a class I organic modifier in SDS-mediated MEKC and it is used to tune selectivi-ty and resolution. Class I modifiers have an ef-fect on the pseudostationary phase through di-rect interaction with the micelles. [20] The op-timum pH of the optimized BGE was tested atvalues between 8 and 10.
Different analytical conditions were also ex-amined. Voltage, analysis temperature, capillarylength, and detection wavelength were opti-
mized in the ranges of 20–30 kV, 15–30 °C, and60–80 cm (total length), respectively.
In the optimized method 50 mM sodiumtetraborate decahydrate with 30 mM SDS and20 mM 18-crown-6-ether, pH 9 was used for theanalysis. Voltage was set to +30 kV, capillarytemperature +15 °C and total capillary lengthwas 60 cm. The sample was injected to the ca-pillary with 0.5 psi pressure for 10 s. An elec-tropherogram of standard solution containingamino acids of this study are analyzed is pre-sented in Figure 2.
Figure 2. Electrophoretic separation of the studied amino acids. BGE: 50 mM tetraborate, 30 mMSDS and 20 mM 18C6, pH 9.0. Other analysis conditions: voltage +30 kV, temperature 15 °C, ca-pillary length 60 cm (50 cm to the detector), injection 0.5 psi 10 s and LIF excitation 488 nm andemission 520 nm. The current during analysis is ~62 µA. Peak assignments: 1) arginine, 2) lysine,3) leucine/isoleucine, 4) tyramine, 5) histidine, 6) glutamine, 7) valine, 8) phenylalanine, 9) threo-nine/asparagine, 10) proline, 11) serine, 12) glycine, 13) glutamic acid, and 14) aspartic acid.
3.3 Method performance
Intraday relative standard deviations (RSD%,n=8) for migration times varied between 0.1%and 2.1% and those for peak areas between2.9% and 9.9%. Interday RSD% for migrationtimes of the studied compounds were less than2.5% and those for peak areas were between
4.4% and 18.9%. The detection limits for theamino acid standards were between 62.5 pMand 31.25 nM. Correlation coefficients for thecalibration curves varied between 0.9944 and0.9997. The method performance parameters aresummarized in Table 1.
droplets to the bottom of the tube before leavingit at room temperature for the reaction to pro-ceed. After 15 minutes, the sample was dilutedby adding 5 µL of labeled sample with 395 µLof 30 mM tetraborate buffer (pH 9.0) and ana-lyzed with the optimized analysis method.
For calibration, six concentration levels ofstandard mixtures were prepared for the studiedamino acids present in the cultivation samples.Before analyses, cultivation samples were cen-trifuged at 10 000 rpm for 5 minutes and diluted100-fold with milli-Q purified water.
3. Results and discussion
3.1 Fluorescence labeling chemistry
Succinimidyl esters react with nucleophiles,releasing N-hydroxysuccinimide (Figure 1).Reaction with primary and secondary aminescreates stable amide and imide linkages, respec-tively. In the case of succinimidyl esters, thehydrolysis and amine reactivity both increasewith increasing pH. [17] For our purpose, it wasimportant that the derivatization reaction shouldoccur in mild conditions and relatively fast. Inthis study, the reaction was tested at room tem-
perature in tetraborate buffer concentrationsbetween 10 and 150 mM, and pH values be-tween 2 and 12. Derivatization reaction timewas tested between 5 and 60 minutes. The opti-mal reaction occurred in 30 mM tetraboratebuffer at pH 9.0, and the derivatization reachedcompletion in approximately 15 minutes. Theresulting reaction products were very stable atroom temperature.
Figure 1. Labeling reaction of Oregon green 488® succinimidyl ester (6-isomer) with an amino acid.
3.2 Method validation
For the analysis of amino acids, an extensivestudy was made to determine the best BGEcomposition. The tested electrolyte chemicalswere tetraborate [10, 12–14, 18], phosphate [15],tetraborate–phosphate, lithium carbonate [19],ammonium acetate [9] and ammonium formate[5–8] which are common electrolytes in aminoacid analyses. The pH values of BGE solutionsvaried between 5 and 10. Tetraborate was foundto be the most suitable electrolyte chemical forthe method. Because the relative difference ofmolecular weights between labeled amino acidsis small, the separation is not as straightforwardas without labeling. To enhance the separation
between amino acids, sodium dodecyl sulphate(SDS) [3,10,16,18], 3-[3-Cholamidopropyl)-dimethylammonio]-2-hydroxy-1-propanesulphonate (CHAPSO) [19], 18-crown-6-ether (18C6) [20] and -cyclodextrin[10,13,21] were tested. It was noted that theaddition of CHAPSO in 10 mM concentrationgave the best separation efficiency of all theBGE solutions tested, but there were precipita-tion problems with the BGE that could not beresolved. The separation efficiency was not asgood with SDS compared to CHAPSO, andtherefore further modification was needed.
-Cyclodextrin and 18C6 were added to the

IV/5
BGE consisting of tetraborate and SDS. 18C6 isclassified as a class I organic modifier in SDS-mediated MEKC and it is used to tune selectivi-ty and resolution. Class I modifiers have an ef-fect on the pseudostationary phase through di-rect interaction with the micelles. [20] The op-timum pH of the optimized BGE was tested atvalues between 8 and 10.
Different analytical conditions were also ex-amined. Voltage, analysis temperature, capillarylength, and detection wavelength were opti-
mized in the ranges of 20–30 kV, 15–30 °C, and60–80 cm (total length), respectively.
In the optimized method 50 mM sodiumtetraborate decahydrate with 30 mM SDS and20 mM 18-crown-6-ether, pH 9 was used for theanalysis. Voltage was set to +30 kV, capillarytemperature +15 °C and total capillary lengthwas 60 cm. The sample was injected to the ca-pillary with 0.5 psi pressure for 10 s. An elec-tropherogram of standard solution containingamino acids of this study are analyzed is pre-sented in Figure 2.
Figure 2. Electrophoretic separation of the studied amino acids. BGE: 50 mM tetraborate, 30 mMSDS and 20 mM 18C6, pH 9.0. Other analysis conditions: voltage +30 kV, temperature 15 °C, ca-pillary length 60 cm (50 cm to the detector), injection 0.5 psi 10 s and LIF excitation 488 nm andemission 520 nm. The current during analysis is ~62 µA. Peak assignments: 1) arginine, 2) lysine,3) leucine/isoleucine, 4) tyramine, 5) histidine, 6) glutamine, 7) valine, 8) phenylalanine, 9) threo-nine/asparagine, 10) proline, 11) serine, 12) glycine, 13) glutamic acid, and 14) aspartic acid.
3.3 Method performance
Intraday relative standard deviations (RSD%,n=8) for migration times varied between 0.1%and 2.1% and those for peak areas between2.9% and 9.9%. Interday RSD% for migrationtimes of the studied compounds were less than2.5% and those for peak areas were between
4.4% and 18.9%. The detection limits for theamino acid standards were between 62.5 pMand 31.25 nM. Correlation coefficients for thecalibration curves varied between 0.9944 and0.9997. The method performance parameters aresummarized in Table 1.

IV/6 IV/7
Figure 4. The consumption of amino acids by Saccharomyces cerevisiae during beer fermentation.
Figure 5. A) HPLC and B) biomass results of the beer fermentation.
4. ConclusionsAn analysis method for the measurement ofamino acids was developed for capillary elec-trophoresis. This method was used in the moni-toring of amino acid consumption of Saccharo-myces cerevisiae during beer fermentation. Theyeast utilized all amino acids to some extent,and was able to produce ethanol from maltoseand maltotriose in addition to glucose. This
analysis method can be used for optimization ofcultivation conditions and for the indication ofcell stress during fermentation. The use of LIFas detection method enabled the analysis ofamino acids even below the attomole level. Theresults correlated well with the results that canbe found from the literature.
3.4 Analysis of cultivation samples
The optimized method was applied to the analy-sis of amino acids in beer fermentation brothsamples. The purpose of this study was to moni-
tor amino acid consumption of yeast during cul-tivation. An electropherogram of a cultivationsample is presented in Figure 3.
Figure 3. Electrophoretic separation of a cultivation sample. Analysis conditions as in Figure 2.Peak assignments: 1) arginine, 2) lysine, 3) leucine/isoleucine, 4) tyramine, 5) histidine, 6) gluta-mine, 7) valine, 8) phenylalanine, 9) threonine/asparagine, 10) proline, 11) serine, 12) glycine, 13)glutamic acid, and 14) aspartic acid.
Results of the cultivation are presented in Figure4, from which it may be noted that the mostrapid amino acid consumption occurred duringthe first 30 hours of cultivation when glucosewas present in the cultivation broth as depictedin Figure 5A. After glucose was consumed, therate of amino acid consumption decreased sig-nificantly. The glucose and amino acids areused for growth of the yeast, which is supportedby the optical data and cell dry mass measure-ments presented in Figure 5B. Aspartic acid,glutamine and glutamic acid were consumedmost efficiently to a concentration below thequantification limit in less than 40 hours. In
addition, lysine, leucine and isoleucine werealso utilized, although at a lower rate. The con-centrations of proline and tyramine decreasedonly slightly. Other amino acids were utilized tosome extent. The production of ethanol fromother carbohydrate sources halted at the sametime as maltose was consumed. The increase insome amino acid concentrations might havebeen caused by stress experienced by the yeastcells during the fermentation. When yeast cellsare stressed they may release proteolytic en-zymes, in particular protease A, which has theeffect of liberating free amino acids from pep-tides or proteins.

IV/7
Figure 4. The consumption of amino acids by Saccharomyces cerevisiae during beer fermentation.
Figure 5. A) HPLC and B) biomass results of the beer fermentation.
4. ConclusionsAn analysis method for the measurement ofamino acids was developed for capillary elec-trophoresis. This method was used in the moni-toring of amino acid consumption of Saccharo-myces cerevisiae during beer fermentation. Theyeast utilized all amino acids to some extent,and was able to produce ethanol from maltoseand maltotriose in addition to glucose. This
analysis method can be used for optimization ofcultivation conditions and for the indication ofcell stress during fermentation. The use of LIFas detection method enabled the analysis ofamino acids even below the attomole level. Theresults correlated well with the results that canbe found from the literature.

IV/8 PB
AcknowledgementsThis work was carried out within the FinnishCentre of Excellence in White Biotechnology –Green Chemistry Research granted by theAcademy of Finland (grant number 118573) andin the Centre of Separation Technology (CST)of Lappeenranta University of Technology (LUT).Heidi Turkia was also supported by GraduateSchool for Chemical Sensors and MicroanalyticalSystems (CHEMSEM) and LUT Booze project.
Cultivations were performed within the projectBiocontrol (project number 1050/31/07), whichreceived funding from the National TechnologyAgency of Finland (TEKES). We also thankToni Paasikallio for performing the cultivations,and Dr. Brian Gibson and Dr. John Londes-borough for brewing discussions. We are verygrateful to Sinebrychoff for providing the wortfor the experiments.
References
[1] S.H. da Cruz, E.M. Cilli, J.R. Ernandes, J. Inst.Brew. 108 (2002) 54.
[2] B.R. Gibson, C.A. Boulton, W.G. Box, N.S.Graham, S.J. Lawrence, R.S.T. Linforth, K.A.Smart, J. Am. Soc. Brew. Chem. 67 (2009) 157.
[3] N. Zhang, H. Wang, Z.-X. Zhang, Y.-H. Deng,H.-S. Zhang, Talanta 76 (2008) 791.
[4] T. Soga, M. Imaizumi, Electrophoresis 22 (2001) 3418.
[5] M. Wakayama, N. Aoki, H. Sasaki, R. Ohsugi,Anal. Chem. 82 (2010) 9967.
[6] A.V.C Simionato, E.P. Moraes, E. Carrilho,M.F.M. Tavares, E. Kenndler, Electrophoresis 29(2008) 2051.
[7] T. Atherton, R. Croxton, M. Baron, J. Gonzalez-Rodriguez, L. Gámiz-Gracia, A.M. García-Campaña, J. Sep. Sci. 35 (2012) 2994.
[8] S. Sato, T. Soga, T. Nishioka, M. Tomita, Plant J.40 (2004) 151.
[9] P. Kubá , P. Bo ek, J. Chromatogr. A 1234 (2012) 2.
[10] M. Herrero, E. Ibáñez, S. Fanali, A. Cifuentes,Electrophoresis 28 (2007) 2701.
[11] L. Qi, M. Liu, Z. Guo, M. Xie, C. Qiu, Y. Chen,Electrophoresis 28 (2007) 4150.
[12] Z. Wagner, T. Tábi, T. Jakó, G. Zachar, A. Csillag,É. Szök , Anal. Bioanal. Chem. 404 (2012) 2363.
[13] M.P. Lorenzo, A. Navarrete, C. Balderas, A.Garcia, J. Pharm. Biomed. Anal. 73 (2013) 116.
[14] H.-L. Chen, X.-J. Zhang, S.-D. Qi, H.X. Xu, J.J.Y.Sung, Z.-X. Bian, J. Chromatogr. B 877 (2009) 3248.
[15] A.B. Martínez-Girón, C. García-Ruiz, A.L. Crego,M.L. Marina, Electrophoresis 30 (2009) 696.
[16] L. Cruz, S.A. Shippy, J.V. Sweedler, in: M.G.Khaledi (Ed.), High Performance Capillary Elec-trophoresis, Chemical Analysis Series, Vol. 146,John Wiley & Sons, Inc., New York, USA 1998, p.303.
[17] G.T. Hermanson, Bioconjugate Techniques, Elsevier,2nd ed., San Diego, USA 2008.
[18] S. Anouti, O. Vandenabeele-Trambouze, D. Koval,H. Cottet, Anal. Chem. 80 (2008) 1730.
[19] T.N. Chiesl, W.K. Chu, A.M. Stockton, X.Amashukeli, F. Grunthaner, R.A. Mathies, Anal.Chem. 81 (2009) 2537.
[20] R.M. Burks, D.S. Hage, Electrophoresis 30 (2009)657.
[21] I. Fradi, A.-C. Servais, C. Lamalle, M. Kallel, M.Abidi, J. Crommen, M. Fillet, J. Chromatogr. A1267 (2012) 121.

Series title and numberVTT Science 47
Title Capillary electrophoresis for monitoring ofcarboxylic, phenolic and amino acids inbioprocesses
Author(s) Heidi TurkiaAbstract Bioprocess technology is a multidisciplinary industry that combines knowledge
of biology and chemistry with process engineering. It is a growing industrybecause its applications have an important role in the food, pharmaceutical,diagnostics and chemical industries. In addition, the current pressure to de-crease our dependence on fossil fuels motivates new, innovative research inthe replacement of petrochemical products. Bioprocesses are processes thatutilize cells and/or their components in the production of desired products.Bioprocesses are already used to produce fuels and chemicals, especiallyethanol and building-block chemicals such as carboxylic acids. In order toenable more efficient, sustainable and economically feasible bioprocesses, theraw materials must be cheap and the bioprocesses must be operated at opti-mal conditions. It is essential to measure different parameters that provideinformation about the process conditions and the main critical process parame-ters including cell density, substrate concentrations and products. In addition tooffline analysis methods, online monitoring tools are becoming increasinglyimportant in the optimization of bioprocesses.
Capillary electrophoresis (CE) is a versatile analysis technique with no limi-tations concerning polar solvents, analytes or samples. Its resolution andefficiency are high in optimized methods creating a great potential for rapiddetection and quantification. This work demonstrates the potential and possibil-ities of CE as a versatile bioprocess monitoring tool. As a part of this study acommercial CE device was modified for use as an online analysis tool forautomated monitoring. The work describes three offline CE analysis methodsfor the determination of carboxylic, phenolic and amino acids that are presentin bioprocesses, and an online CE analysis method for the monitoring of car-boxylic acid production during bioprocesses. The detection methods wereindirect and direct UV, and laser-induced frescence. The results of this workcan be used for the optimization of bioprocess conditions, for the developmentof more robust and tolerant microorganisms, and to study the dynamics ofbioprocesses.
ISBN, ISSN ISBN 978-951-38-8107-8 (Soft back ed.)ISBN 978-951-38-8108-5 (URL: ttp://www.vtt.fi/publications/index.jsp)ISSN-L 2242-119XISSN 2242-119X (Print)ISSN 2242-1203 (Online)
Date December 2013
Language English, Finnish abstract
Pages 103 p. + app. 36 p.
Name of the project
Commissioned by
Keywords Bioprocess monitoring, capillary electrophoresis, online capillary electrophoresis,carboxylic acids, phenolic acids, amino acids
Publisher VTT Technical Research Centre of FinlandP.O. Box 1000, FI-02044 VTT, Finland, Tel. +358 20 722 111


Julkaisun sarja ja numeroVTT Science 47
Nimeke Kapillaarielektroforeesin käyttö karboksyyli-, fenoli-ja aminohappojen monitorointiin bioprosesseissa
Tekijä(t) Heidi Turkia
Tiivistelmä Bioprosessitekniikka on monitieteellinen teollisuudenala, joka yhdistää biologian jakemian tietämyksen kemiantekniikkaan. Se on kasvava teollisuudenala, koska sensovellukset ovat hyvin tärkeitä ruoka-, farmasia-, diagnostiikka- ja kemianteollisuudelle.Tämän lisäksi riippuvuutta öljystä tulee vähentää merkittävästi, mikä mahdollistaauuden ja innovatiivisen tutkimuksen petrokemikaalituotteiden korvaamiseksi. Bio-prosessit ovat prosesseja, jotka käyttävät soluja ja/tai niiden osia tuottamaan haluttujatuotteita. Bioprosesseja on jo käytetty polttoaineiden ja kemikaalien tuottamiseen,erityisesti etanolin ja ns. building-block kemikaalien, kuten karboksyylihappojen,tuottamiseen. Jotta bioprosesseista saadaan tehokkaampia ja taloudellisesti kan-nattavampia, raaka-aineiden on oltava halpoja ja bioprosessien on toimittava opti-maalisissa olosuhteissa. Erilaisten parametrien mittaaminen on välttämätöntä, silläne antavat tietoja prosessin tilasta ja kriittisistä prosessiparametreista, joita ovatbiomassa, lähtöaineet ja tuotteet. Offline-mittausten lisäksi online-määrityksetkasvattavat merkitystään bioprosessien optimoinnissa.
Kapillaarielektroforeesi (CE) on monipuolinen analyysitekniikka, jolla ei olerajoituksia polaaristen liuottimien, analyyttien tai näytteiden kanssa. Optimoitujenmenetelmien korkea resoluutio ja tehokkuus mahdollistavat nopean detektoinnin jakvantifioinnin. Tämä työ osoittaa CE:n potentiaalin monipuolisena bioprosessi-monitorointityökaluna. Osana tätä tutkimusta kaupallinen CE-laitteisto muutettiintoimimaan online-analysointilaitteistona prosessien automaattista monitorointiavarten. Tämä työ kuvaa kolme offline-CE analyysimenetelmää karboksyyli-, fenoli- jaaminohappojen analysointiin sekä yhden online-CE analyysimenetelmän karboksyyli-happojen monitorointiin bioprosessien aikana. Käytetyt detektointimenetelmät olivatepäsuora ja suora UV sekä laser-indusoitu fluoresenssi. Työn tuloksia voidaankäyttää bioprosessiolosuhteiden optimoinnissa, elinvoimaisempien ja kestävämpienmikro-organismien kehittämisessä sekä bioprosessien dynamiikan tutkimisessa.
ISBN, ISSN ISBN 978-951-38-8107-8 (nid.)ISBN 978-951-38-8108-5 (URL: http://www.vtt.fi/publications/index.jsp)ISSN-L 2242-119XISSN 2242-119X (painettu)ISSN 2242-1203 (verkkojulkaisu)
Julkaisuaika Joulukuu 2013
Kieli Englanti, suomenkielinen tiivistelmä
Sivumäärä 103 s. + liitt. 36 s.
Projektin nimi
Toimeksiantajat
Avainsanat Bioprocess monitoring, capillary electrophoresis, online capillary electrophoresis,carboxylic acids, phenolic acids, amino acids
Julkaisija VTTPL 1000, 02044 VTT, puh. 020 722 111

VT
T S
CIE
NC
E 4
7
Ca
pilla
ry ele
ctro
ph
ore
sis for m
on
itorin
g c
arb
oxylic
, ph
en
olic
an
d a
min
o... ISBN 978-951-38-8107-8 (Soft back ed.)
ISBN 978-951-38-[8108-5 (URL: http://www.vtt.fi/publications/index.jsp)ISSN-L 2242-119XISSN 2242-119X (Print)ISSN 2242-1203 (Online)
Capillary electrophoresis for monitoring carboxylic, phenolic and amino acids in bioprocesses
Bioprocess technology is a multidisciplinary industry that combines the knowledge of biology and chemistry with process engineering. The applications have an important part in the food, pharmaceutical, diagnostics and chemical industries. The current pressure for decreasing the dependence on fossil fuels introduces new and innovative research opportunities in the replacement of petrochemical products. Bioprocesses utilize cells or their components in the production of desired products, such as fuels and chemicals. In order to enable more efficient, sustainable and economically viable bioprocess-based production processes, the raw materials must be cheap and the bioprocesses must be operated at optimal conditions. Bioprocess monitoring technologies are valuable tools both during the development of the bioprocesses and while operating them.
Capillary electrophoresis (CE) is a versatile analysis method for the determination of a variety of compounds from different matrices. It is an electrodriven separation technique that separates molecules according to their charge-to-mass ratio. This thesis presents three offline-methods and one online-CE-method for the determination of carboxylic, phenolic and amino acids in bioprocesses. These analysis methods were successfully used for bioprocess monitoring.