CapacityAllocationandPricingStrategiesforWireless ... ·...
32
arXiv:1205.1196v1 [cs.NI] 6 May 2012 Capacity Allocation and Pricing Strategies for Wireless Femtocell Services Lingjie Duan Department of Information Engineering, The Chinese University of Hong Kong [email protected] Biying Shou Department of Management Sciences, City University of Hong Kong, Hong Kong, [email protected] Jianwei Huang Department of Information Engineering, The Chinese University of Hong Kong, [email protected] Indoor cell phone users often suffer from poor connectivity. One promising solution, fem- tocell technology, has been rapidly developed and deployed over the past few years. One of the biggest challenges for femtocell deployment is lack of a clear business model. This paper investigates the economic incentive for the cellular operator (also called macrocell op- erator) to enable femtocell service by leasing spectrum resource to an independent femtocell operator. On the one hand, femtocell services can increase communication service quality and thus increase the efficiency of the spectrum resource. On the other hand, femtocell services may introduce more competition to the market. We model the interactions between a macrocell operator, a femtocell operator, and users as a three-stage dynamic game, and derive the equilibrium pricing and capacity allocation decisions. We show that when spec- trum resources are very limited, the macrocell operator has incentive to lease spectrum to femtocell operators, as femtocell service can provide access to more users and efficiently in- crease the coverage. However, when the total spectrum resource is large, femtocell service offers significant competition to macrocell service. Macrocell operator thus has less incentive to enable femtocell service. We also investigate the issue of additional operational cost and limited coverage of femtocell service on equilibrium decisions, consumer surplus and social welfare. Key words: game theory; simulation: analysis; telecommunications 1. Introduction Today there are over 5 billion cellphone users in the world (Global mobile statistics 2011). Many users experience poor indoor reception at home or office. This is because in the current cellular network (also called macrocell network), high-frequency and low-power cell signal has 1
Transcript of CapacityAllocationandPricingStrategiesforWireless ... ·...

arX
iv:1
205.
1196
v1 [
cs.N
I] 6
May
201
2
Capacity Allocation and Pricing Strategies for WirelessFemtocell Services
Lingjie DuanDepartment of Information Engineering, The Chinese University of Hong Kong [email protected]
Biying ShouDepartment of Management Sciences, City University of Hong Kong, Hong Kong, [email protected]
Jianwei HuangDepartment of Information Engineering, The Chinese University of Hong Kong, [email protected]
Indoor cell phone users often suffer from poor connectivity. One promising solution, fem-
tocell technology, has been rapidly developed and deployed over the past few years. One
of the biggest challenges for femtocell deployment is lack of a clear business model. This
paper investigates the economic incentive for the cellular operator (also called macrocell op-
erator) to enable femtocell service by leasing spectrum resource to an independent femtocell
operator. On the one hand, femtocell services can increase communication service quality
and thus increase the efficiency of the spectrum resource. On the other hand, femtocell
services may introduce more competition to the market. We model the interactions between
a macrocell operator, a femtocell operator, and users as a three-stage dynamic game, and
derive the equilibrium pricing and capacity allocation decisions. We show that when spec-
trum resources are very limited, the macrocell operator has incentive to lease spectrum to
femtocell operators, as femtocell service can provide access to more users and efficiently in-
crease the coverage. However, when the total spectrum resource is large, femtocell service
offers significant competition to macrocell service. Macrocell operator thus has less incentive
to enable femtocell service. We also investigate the issue of additional operational cost and
limited coverage of femtocell service on equilibrium decisions, consumer surplus and social
welfare.
Key words: game theory; simulation: analysis; telecommunications
1. Introduction
Today there are over 5 billion cellphone users in the world (Global mobile statistics 2011).
Many users experience poor indoor reception at home or office. This is because in the current
cellular network (also called macrocell network), high-frequency and low-power cell signal has
1
Macrocell coverage
Wireline central office to
address cellular traffics
Wireline Home Internet connections
Macrocell users
Femtocell users
DSL router
Macrocell
base
station
Femtocell base station
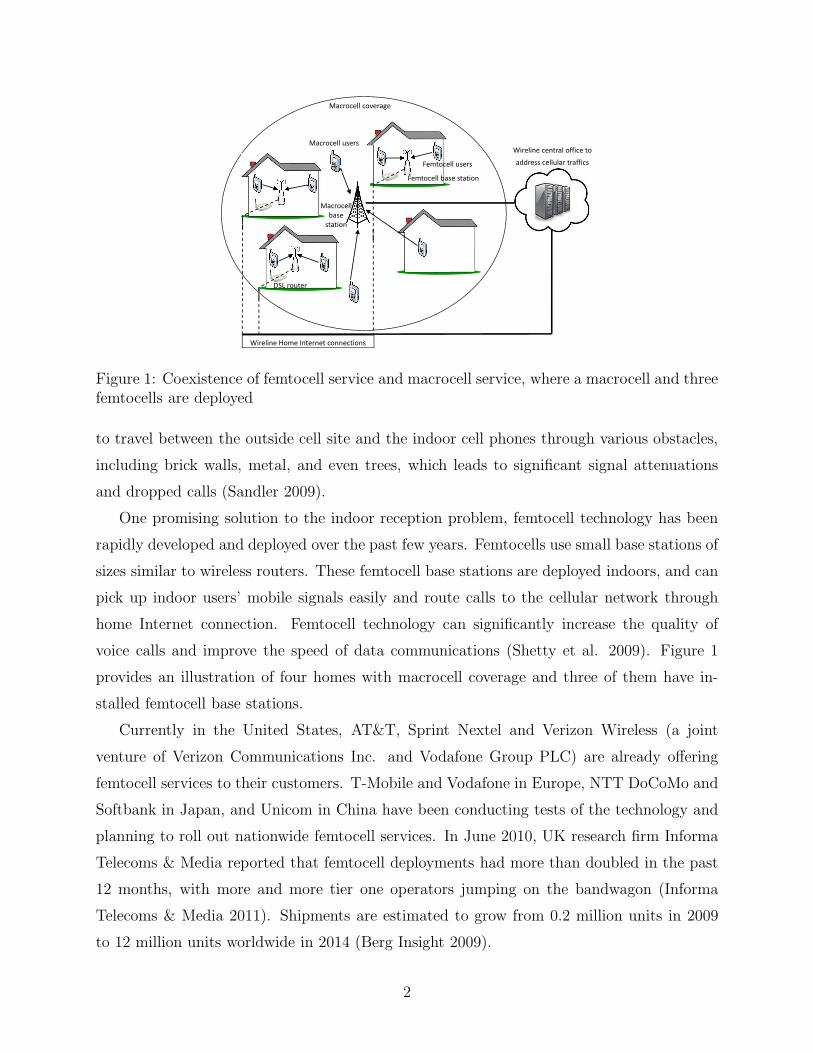
Figure 1: Coexistence of femtocell service and macrocell service, where a macrocell and threefemtocells are deployed
to travel between the outside cell site and the indoor cell phones through various obstacles,
including brick walls, metal, and even trees, which leads to significant signal attenuations
and dropped calls (Sandler 2009).
One promising solution to the indoor reception problem, femtocell technology has been
rapidly developed and deployed over the past few years. Femtocells use small base stations of
sizes similar to wireless routers. These femtocell base stations are deployed indoors, and can
pick up indoor users’ mobile signals easily and route calls to the cellular network through
home Internet connection. Femtocell technology can significantly increase the quality of
voice calls and improve the speed of data communications (Shetty et al. 2009). Figure 1
provides an illustration of four homes with macrocell coverage and three of them have in-
stalled femtocell base stations.
Currently in the United States, AT&T, Sprint Nextel and Verizon Wireless (a joint
venture of Verizon Communications Inc. and Vodafone Group PLC) are already offering
femtocell services to their customers. T-Mobile and Vodafone in Europe, NTT DoCoMo and
Softbank in Japan, and Unicom in China have been conducting tests of the technology and
planning to roll out nationwide femtocell services. In June 2010, UK research firm Informa
Telecoms & Media reported that femtocell deployments had more than doubled in the past
12 months, with more and more tier one operators jumping on the bandwagon (Informa
Telecoms & Media 2011). Shipments are estimated to grow from 0.2 million units in 2009
to 12 million units worldwide in 2014 (Berg Insight 2009).
2
However, one of the biggest challenges to companies’ wide femtocell deployment is the
lack of a clear business model. As Emin Gurdenli, chief technology officer of Deutsche
Telekom AG’s T-Mobile U.K., put it (The Wall Street Journal, Feb. 2009):
“The rationale for femtocells is well-established, but a quantitative business case with a
clear business model in terms of how we go to market is not there yet.”
The purpose of this paper is to develop such a quantitative model to examine the trade-off
regarding femtocell deployment. In particular, we look at the following research questions:
• Should current macrocell operators deploy femtocell services? How would operators
allocate bandwidth (capacity) resources and make pricing decisions? There are two
common approaches to the deployment of femtocell service. In an integrated system,
a macrocell operator directly provides femtocell service to users and fully controls
bandwidth resource allocation and femtocell service price. We also submitted a paper
on the economic operation of integrated system (Duan et al. 2011). In a distributed
system, a macrocell operator leases its spectrum resources to a femtocell operator. The
femtocell operator determines the service provision and pricing independently. We can
find many such examples in industry: Sprint leases licensed spectrum to Virgin Mobile
USA to provide femtocell service (Fitchard 2009), and BT Mobile is using Vodafone’s
resource to provide femtocell service (Atkinson 2011). Recently there are more research
on the distributed system (e.g., Hong and Tsai 2010 and Chen et al. 2011), and this
paper focuses on the distributed system. The key tradeoff for the macrocell operator is
obtaining more revenue by leasing resources to the femtocell operator as against having
fewer resources for its own services and facing increased market competition.
• How would users choose between femtocell and macrocell services? With the deploy-
ment of indoor femtocell stations, femtocell users no longer experience signal attenua-
tion and poor reception problem, and can achieve the maximum quality of service. In
contrast, when users are connected to the outdoor macrocell base stations, the quality
of service highly depends on the user locations and the communication environments.
When different qualities of services are coupled with different pricing schemes, different
users have different preferences between macrocell and femtocell services.
Our main results are summarized as follows:
3
• Characterization of equilibrium decisions: We derive the threshold of spectrum effi-
ciency level which segments users who prefer femtocell to macrocell services. Fur-
thermore, we characterize the femtocell operator’s equilibrium femtocell price and the
macrocell operator’s capacity allocation and pricing decisions.
• Analysis of impact of macrocell’s total limited capacity: Wireless spectrum is a very
scarce resource so macrocell operators often face capacity constraints. In the U.S.
700MHZ spectrum auction in March 2008, the total bid price is nearly $20b (WNN
Wi-Fi Net News 2008). We show that macrocell operator has more incentive to lease
spectrum to the femtocell operator when its capacity is small, but chooses to offer only
macrocell service when its capacity is large.
• Calculation of consumer surplus and social welfare: With no additional operational
cost and full coverage, femtocell service can increase both the total consumer surplus
and social welfare. However, we show that some users might experience a smaller payoff
from the adoption of the femtocell service if, for example, they do not experience much
service quality improvement with the femtocell service but need to pay a higher price.
In addition, we have examined two extensions of the basic model. The first is with
additional femtocell operational cost. Although femtocells are low in deployment costs, the
femtocell service may incur additional operational cost compared to macrocell service. For
instance, femtocell operators may be charged by internet service providers for routing traffic
through wireline broadband internet to reach the cellular network (McKnight et al. 1997).
The impact of the additional operator cost on the femtocell operator is obviously negative;
its impact on the macrocell operators, however, is unclear and deserves detailed exploration.
The second is the impact of limited femtocell coverage. A femtocell base station typically
has a smaller spatial coverage. For instance, a femtocell device may only cover a region with
a diameter of 50-100 meters, whereas a macrocell covers a larger range with a diameter of
more than 10 kilometers. The femtocell service may have limited coverage when it does not
have enough femtocell base stations. We examine the impact of such limited coverage on
macrocell and femtocell operators’ profits.
The rest of the paper is organized as follows. We introduce the network model of macro-
cell service in Section 3, which serves as a benchmark for later analysis. In Section 4, we
introduce the network model of femtocell service and analyze how the macrocell operator
4
and femtocell operator make capacity and pricing decisions to maximize their own profits.
Then, in Sections 5 and 6, we extend the results in Section 4 by examining the various
effects of femtocell operational cost and limited femtocell coverage. In Section 7 we present
the conclusion to our study and discuss future work.
2. Literature Review
Our work is closely related to two main streams of literature: i) studies of femtocell deploy-
ment in the telecommunication literature, and ii) studies of dual channel competition in the
management science and operations research literature.
Most existing work on femtocell deployment in the telecommunication literature (e.g.,
Chandrasekhar and Andrews 2009) focus on various technical issues in service provision such
as access control, resource management, and interference mangement. Only a few papers
discuss the economic issues of femtocells (e.g., Claussen et al. 2007, Yun et al. 2011, Shetty
et al. 2009, Chen et al. 2011), examining the impact of network deployment costs and
femtocells’ openness to macrocell users. The key difference between our paper and such
existing literature is that we study the provision of dual services in terms of both spectrum
allocations and pricing decisions. We also characterize the impact of the femtocell operational
cost and limited femtocell coverage on the service provision.
Our work is also closely related to the literature on dual channel competition in the area
of management science and operations research. In this body of literature, there are usually
two types of decision makers: a manufacturer and a retailer. The manufacturer can sell the
products through a direct channel, a retailer channel, or both. Chiang et al. study whether
and how a manufacturer should operate a new direct channel when it already has a retailer
partner. They show that direct marketing can indirectly increase the flow of profits through a
retail channel by reducing the degree of double marginalization. Also, the direct channel may
not be a threat to the retailer since the wholesale price is driven down. Tsay and Agrawal
2004 further exploit several means whereby the manufacturer can mitigate channel conflict
between the direct channel and the retailer channel, including adjustments of wholesale price,
paying a commission to a retailer, and entirely conceding demand fulfillment on the part of
the retailer. More general results are obtained motivated by the models in Chiang et al. 2003
and Tsay and Agrawal 2004. For example, Huang and Swaminathan 2009 posit a stylized
deterministic demand model where each channel relies on prices, degree of substitution across
5

channels, and the overall market potential. Dumrongsiri et al. 2008 investigate the influence
of demand variability on prices and manufacturer’s incentive to open direct channel.
In the context with which we are concerned, that of femtocell deployment, we can view
the macrocell operator as the manufacturer, the femtocell operator as the retailer, and the
macrocell service as the direct channel. Our paper has four key differences from prior liter-
ature.
First, we consider a different order of introducing the new channel. Instead of introducing
the direct channel after the retailer channel, as is the case in Chiang et al. 2003, Tsay and
Agrawal 2004a, Huang and Swaminathan 2009, Dumrongsiri et al. 2008, we consider the
case in which the manufacturer owns the direct channel first and decides on the best way to
open the retailer channel.
Second, the limited capacity model considerably complicates the analysis of our model.
The dual channel literature generally assumes unlimited potential supply, i.e., that the man-
ufacturer can produce as many products as possible (with a production cost) to maximize
its profit.However, a macrocell operator often has only a limited total capacity in the deci-
sion time scale considered here. This is because the spectrum allocation to cellular service
providers are often regulated by government authorities (e.g., FCC in USA and Ofcom in
UK). The macrocell operator often obtains spectrum licenses that last for years or decades.
The long license period ensures enough motivation for the macrocell providers to invest in
the necessary network infrastructure, which is often very expensive.
Third, the heterogeneity of users in our model is motivated by the unique characteristics
of wireless communications, and is thus different from that considered by prior literature.
In particular, users have different channel conditions (and thus different evaluations of the
same resource allocation) under the macrocell service (direct channel), but have the same
maximum channel condition under the femtocell service (retailer channel). In contrast,
prior literature either assumes that users are homogenous or are different in willingness
to pay. Moreover, the users’ utility functions here are also motivated by today’s wireless
communication technologies, which renders some of the prior generic analysis inapplicable.
Finally, we characterize the impact of limited femtocell coverage on the new service
provision. Very few prior studies have considered a similar constraint. Rubin 1978 considers
a related constraint where the monitoring costs of company-owned outlets rise with physical
distance from headquarters, and thus direct channel becomes non-profitable in suburban
areas. What we considered is the limitation of coverage of the retailer channel, and the
6

model thus is different.
3. Benchmark Scenario: Macrocell Service Only
Throughout this paper, we focus on the monopoly case in the two-tier market with a single
macrocell operator and a single femtocell operator. The reason is that we can observe many
monopoly examples in macrocell service worldwide (e.g., America Movil (the world’s fourth
largest mobile network operator in Mexico and many places in Latin America), and MTS in
some central Asian countries). Also, since femtocell service just emerged from last decade,
many fetmocell operators are still local monopolists (e.g., Virgin Mobile USA in US and
BT Mobile in UK). Moreover, monopoly is a first step leading to a more general oligopoly
market and we plan to study oligopoly case as a future direction as in Section 7.
As a benchmark case, we first look at how the macrocell operator prices the macrocell
service to maximize its profit without introducing the femtocell service. When we consider
the introduction of femtocell service in Sections 4 and 5, the macrocell operator needs to
achieve a profit no worse than this benchmark case.
For the sake of discussion, we will focus on the operation of a single macrocell. In general,
a macrocell operator owns multiple macrocells. Non-adjacent macrocells can share the same
frequency (called frequency reuse). The analysis of this paper can be extended to the more
general case without changing the main managerial insights.
The macrocell operator owns wireless spectrum (also called bandwidth) with a limited
capacity; a user needs to access the bandwidth in order to complete its wireless communi-
cations (e.g., voice calls, video streaming, data transfer). A larger bandwidth means more
resources to the user and thus better communication quality of service (QoS), but also leads
to a greater expense.
As shown in Fig. 2, we model the interactions between the macrocell operator and end
users as a two-stage Stackerberg game. In Stage I, the macrocell operator determines the
macrocell price pM per unit bandwidth. In Stage II, each user decides how much bandwidth
to purchase. The operator wants to maximizes its profit, while the users want to maximize
their payoff. Such usage-based pricing scheme is widely used in today’s cellular macrocell
networks, especially in Europe and Asia (Courcoubetis and Weber 2003, Altmann and Chu
2001). In US, AT&T (since a year ago) and Verizon (since July 2011) have adopted the
usage-based pricing for wireless data services. Usage-based pricing for femtocells has just
7

Figure 2: Two-stage Stackelberg game between the macrocell operator and users.
→No service Macrocell service
0 pM 1Macrocell spectrum efficiency θ
Figure 3: Distribution of users’ macrocell spectrum efficiency θ
started. For example, AT&T’s femtocell service counts the femtocell data usage as part
of the regular cellular usage (together with the macrocell data usage), which is subject to
usage-based pricing (AT&T 2011). Due to the exponential growth of wireless data traffic
and the scarce spectrum resource, we envision that usage-based pricing for both macrocell
and femtocell services will become more and more common in the near future.
Next, we solve this two-stage Stackelberg game by backward induction (Myerson 1997).
3.1 Stage II: Users’ Bandwidth Demand Given A Fixed Price pM
The QoS of a wireless communication session depends not only on the resource allocation
but also on the condition of the wireless channel between the transmitter and receiver. The
channel condition is determined by both the locations of transmitter and receiver and the
surrounding environment. As an example, let us consider uplink transmissions from the
users mobile phones to the common single macrocell base station (as in Fig. 1). The channel
condition in general decreases with the distance between the user and the base station, and
can become very weak if the user is inside a house with thick walls. A user with a bad
channel condition will not be able to achieve a high data rate even with a large bandwidth
allocation.
Here we model the users’ channel heterogeneity by a macrocell spectrum efficiency θ,
which is assumed to be uniformly distributed in [0, 1] (see Fig. 3). The uniform distribution
is assumed for analytical tractability. A more complicated distribution based on field mea-
surements will not change the main managerial insights obtained in this paper. A larger θ
means a better channel condition and a higher spectrum efficiency when using the macrocell
service.
For a user with a macrocell spectrum efficiency θ < 1, when allocated macrocell band-
8

width b, its effective resource allocation is θb. Its utility u(θ, b) (e.g., data rate) can be
modeled as (similar to Sengupta and Chatterjee 2009, Wang and Li 2005)
u(θ, b) = ln(1 + θb),
which is concave in b representing the diminishing return in bandwidth consumption. The
more bandwidth a user obtains, he can experience a higher data rate and a better QoS when
communicating with others. The user needs to pay a linear payment pMb to the macrocell
operator, where the price pM is announced by the macrocell operator in Stage I. Note that
the usage-based pricing is becoming a main trend in macrocell service market (and replacing
flat-fee pricing for data traffics) (Goldstein 2011). The user’s payoff is the difference between
the utility and payment, i.e.,
rM(θ, b, pM) = ln(1 + θb)− pMb. (1)
The optimal value of bandwidth (demand) that maximizes the user’s payoff with the
macrocell service is
b∗(θ, pM) =1
pM−
1
θ(2)
if pM ≤ θ and 0 otherwise. Notice that b∗(θ, pM) is decreasing in pM and increasing in θ (if
pM ≤ θ). When pM > θ, the user chooses not to start the wireless communication as it is
too expensive (by taking its macrocell spectrum efficiency θ into consideration). The user’s
maximum payoff with macrocell service is
rM(θ, b∗(θ, pM), pM) = ln
(
θ
pM
)
− 1 +pMθ
(3)
if pM ≤ θ and 0 otherwise. Notice that the payoff is always nonnegative.
3.2 Stage I: Macrocell Operator’s Pricing pM
Next we consider the macrocell operator’s optimal choice of price pM in Stage I. To achieve
a positive profit, the macrocell operator needs to set pM ≤ maxθ∈[0,1] θ = 1, otherwise no
user will request any bandwidth in Stage II.
Without loss of generality, we normalize the total user population to 1. The fraction of
users choosing macrocell service is 1− pM as shown in Fig. 3. The total user demand is
QM(pM) =
∫ 1
pM
(
1
pM−
1
θ
)
dθ =1
pM− 1 + ln pM , (4)
9

which is a decreasing function of pM .
Recall that the macrocell operator has a limited bandwidth capacity B, and thus can
only satisfy a total demand no larger than B. The macrocell operator’s profit is
πmacro(pM) = pM min
(
B,1
pM− 1 + ln pM
)
.
The operator will choose price pM to maximize profit, i.e.,
max0<pM≤1
πmacro(pM). (5)
Theorem 1 characterizes the unique optimal solution to Problem (5).
Theorem 1. The equilibrium macrocell price pbenchM that maximizes the macrocell operator’s
profit in the two-stage Stackelberg game in Fig. 2 is the unique solution to the following
equation:
B =1
pM− 1 + ln pM . (6)
The total user demand equals the maximum capacity at the equilibrium, i.e., QM(pbenchM ) = B.
The equilibrium price pbenchM decreases with B, and the macrocell operator’s equilibrium profit
πmacro(pbenchM ) increases with B.
Notice that no users with a macrocell spectrum efficiency θ less than pbenchM will receive
macrocell service. When the total bandwidth B is small, the equilibrium macrocell price
pbenchM is close to 1 and thus most users will not get service. This motivates the macrocell
operator to adopt the femtocell service, which is able to serve these users and leads to
additional profit, which is shared by the macrocell and femtocell operators.
4. Femtocell Deployment
We now turn to the question of how femtocell service may improve the macrocell operator’s
profit. We are interested in understanding the following issues:
• Strategic decision: Is it economically beneficial for the macrocell operator to lease
spectrum to a femtocell operator, who will compete with the macrocell operator in
serving the same group of end users?
• Operational decisions: If the answer to the previous question is yes, how should the
macrocell operator allocate and price the spectrum resources?
10
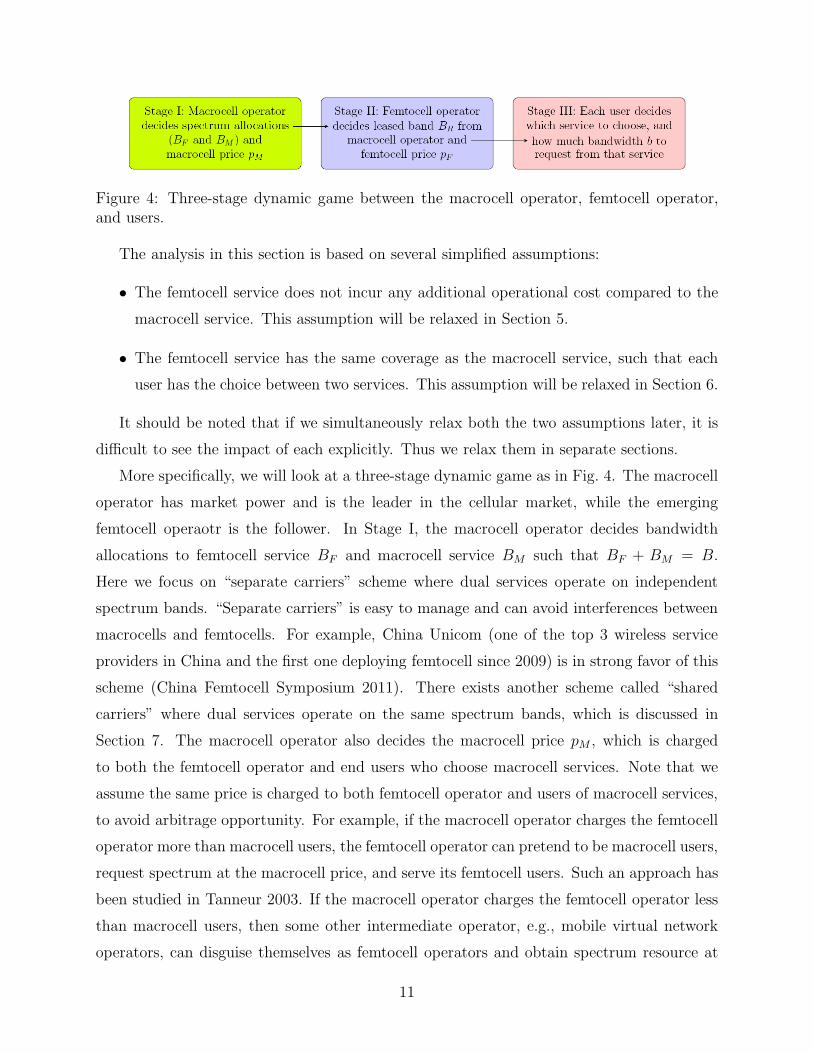
Figure 4: Three-stage dynamic game between the macrocell operator, femtocell operator,and users.
The analysis in this section is based on several simplified assumptions:
• The femtocell service does not incur any additional operational cost compared to the
macrocell service. This assumption will be relaxed in Section 5.
• The femtocell service has the same coverage as the macrocell service, such that each
user has the choice between two services. This assumption will be relaxed in Section 6.
It should be noted that if we simultaneously relax both the two assumptions later, it is
difficult to see the impact of each explicitly. Thus we relax them in separate sections.
More specifically, we will look at a three-stage dynamic game as in Fig. 4. The macrocell
operator has market power and is the leader in the cellular market, while the emerging
femtocell operaotr is the follower. In Stage I, the macrocell operator decides bandwidth
allocations to femtocell service BF and macrocell service BM such that BF + BM = B.
Here we focus on “separate carriers” scheme where dual services operate on independent
spectrum bands. “Separate carriers” is easy to manage and can avoid interferences between
macrocells and femtocells. For example, China Unicom (one of the top 3 wireless service
providers in China and the first one deploying femtocell since 2009) is in strong favor of this
scheme (China Femtocell Symposium 2011). There exists another scheme called “shared
carriers” where dual services operate on the same spectrum bands, which is discussed in
Section 7. The macrocell operator also decides the macrocell price pM , which is charged
to both the femtocell operator and end users who choose macrocell services. Note that we
assume the same price is charged to both femtocell operator and users of macrocell services,
to avoid arbitrage opportunity. For example, if the macrocell operator charges the femtocell
operator more than macrocell users, the femtocell operator can pretend to be macrocell users,
request spectrum at the macrocell price, and serve its femtocell users. Such an approach has
been studied in Tanneur 2003. If the macrocell operator charges the femtocell operator less
than macrocell users, then some other intermediate operator, e.g., mobile virtual network
operators, can disguise themselves as femtocell operators and obtain spectrum resource at
11

a lower price than macrocell price, and then provide macrocell service to users to make a
profit. This eventually decreases the macrocell operator’s market share and profit. Such
scenarios have been considered in Dewenter and Haucap 2006.
In Stage II, femtocell operator decides how much bandwidth BR to lease from the macro-
cell operator such thatBR ≤ BF , and payBRpM to the macrocell operator. It also determines
femtocell price pF to end users choosing the femtocell service. In Stage III, each user decides
which service to choose and how much bandwith to purchase for the service. If a user’s
preferred service is not available (when demand is larger than capacity for that service), the
user will seek the other service. Here we focus on a large group of users, where a single
user’s demand is infinitesimal to the total demand. Thus we can ignore cases in which a user
purchases bandwidth from both services.
Our considered decision process in Stages I and II is like the existing spectrum auction,
where the spectrum holder announces total bandwidth amount and price first, then bidders
request and give out payment. There may possibly exist some other decision process, e.g.,
femtocell operator requests some bandwidth from macrocell operator first and then macrocell
operator decides how much to satisfy at some price. Intuitively, these two processes should
lead to the same equilibrium outcome. This is because the macrocell operator can adjust
macrocell price to make its decided femtocell band matches femtocell operator’s demand.
It should also be noted that it is optimal for the femtocell operator to announce femtocell
price after purchasing bandwidth from the macrocell operator. Otherwise, it may run out of
bandwidth at a low price or waste some bandwidth.
We will again analyze this three-stage dynamic game using backward induction.
To differentiate from the macrocell service only benchmark in Section 3, we refer to the
setup in this section as dual services. Notice that dual services may degenerate to the case
of benchmark when the macrocell operator decides not to lease spectrum to the femtocell
operator, i.e., when the total capacity is large as shown later in this section.
4.1 Stage III: Users’ Service Choice and Bandwidth Demand
If a user has a macrocell spectrum efficiency θ, his optimal payoff by using the macrocell
service is given in (3). Next, we consider a user’s payoff by using the femtocell service.
Since femtocell base stations are deployed indoors and are very close to users’ cell phones,
it is reasonable to assume that all users using the femtocell service have equally good channel
12

conditions and achieve the same maximum spectrum efficiency. This means that, indepen-
dent of the macrocell spectrum efficiency θ, each user achieves the same payoff rF (b, pF )
when using a bandwidth of b under femtocell service,
rF (b, pF ) = ln(1 + b)− pF b. (7)
The user’s optimal demand in femtocells is
b∗(pF ) =1
pF− 1 (8)
if pF ≤ 1 and 0 otherwise. A user’s maximum payoff under the femtocell service is
rF (b∗(pF ), pF ) = ln
(
1
pF
)
− 1 + pF (9)
if pF ≤ 1, and 0 otherwise. which is always nonnegative. Note that some operators have
adopted a flat-fee charging scheme for femtocell services to encourage early user adoptions.
In this paper, we focus on analyzing the usage-based pricing for femtocell services in a mature
market. It should also be noted that usage-based pricing often leads to a higher profit than
the flat-fee charging (Courcoubetis and Weber 2003).
We will show that pF > pM at the equilibrium, i.e., the femtocell price pF in Stage II, is
always larger than the macrocell price pM in Stage I. By comparing the user’s payoffs in (3)
and (9), it is clear that a user with θ = 1 will always choose macrocell service to maximize
his payoff. On the other hand, a user with a small θ would choose femtocell service to
improve his payoff. As a result, we define the following thresholds of θ that separate the user
population into two service groups.
Definition 1 (Users’ preferred partition threshold θprth). Users with θ ∈ [0, θprth) prefer to use
the femtocell service, and users with θ ∈ [θprth , 1] prefer to use the macrocell service.
Definition 2 (Users’ finalized partition threshold θth). The finalized partition threshold θth
is the minimum macrocell spectrum efficiency among all the users actually served by the
macrocell service. Users with θ ∈ [θth, 1] receive the macrocell service, while users with
θ ∈ [0, θth) receive either the femtocell service or no service.
The preferred partition threshold θprth only depends on prices pM and pF . If all users’
demands from their preferred services are satisfied, then users’ preferred partition threshold
equals users’ partition threshold (i.e., θprth = θth). However, in general θth may be different
from θprth , depending on the values of BF , BM , and BR in Stages I and II.
13
By comparing a user’s optimal payoff with macrocell and femtocell services in (3) and
(9), we obtain the following result.
Lemma 1. Users’ preferred partition threshold θprth = pM/pF .
Now we introduce the concept of finalized demand.
Definition 3 (User’s Finalized Demand). If a user’s demand from his preferred service is
satisfied, then his finalized demand equals his preferred demand. If not, the user switches to
the alternative service and the new demand becomes the finalized demand.
Note that a user’s finalized demand may not be realized, e.g., when the price is set too
low and the total finalized demand is larger than the supply.
4.2 Stage II: Femtocell Operator’s Spectrum Purchase and Pric-ing
Now we analyze Stage II, where the femtocell operator determines BR and pF to maximize
its profit. In this stage, the macrocell operator’s decisions on pM and BF (and BM = B−BF )
are determined and known to the femtocell operator. Let us denote the femtocell operator’s
equilibrium decisions as B∗R(pM , BF ) and p∗F (pM , BF ), both of which are functions of pM and
BF .
To maximize profit, the femtocell operator needs to know which users will choose femtocell
service and their characteristics. Users with macrocell spectrum efficiency θ ∈ [0, θprth) =
[0, pM/pF ) will choose femtocell service first. Some other users may also choose femtocell
service if their demands cannot be satisfied by the macrocell services. The following lemma,
however, shows that the macrocell operator will reserve enough bandwidth BM during Stage
I, such that all users who prefer to use macrocell service will be able to do so.
Lemma 2. At the equilibrium of the three-stage dynamic game as in Fig. 4, the macrocell
operator satisfies all preferred demands from users with θ ∈ [θprth , 1] = [pM/pF , 1] in macrocell
service.
Lemma 2 is derived regardless of the decisions of femtocell operator. Thus at the equi-
librium of the whole three-stage game, Lemma 2 holds and we can use it to derive femtocell
operator’s equilibrium decisions in Stage II.
14

We will further discuss the intuitions of Lemma 2 in the next subsection. Since femtocell
operator only serves users with θ ∈ [0, pM/pF ), its profit is
πFemto(pF , BR) = pF min
(
BR,
∫
pMpF
0
(
1
pF− 1
)
dθ
)
− pMBR
= min
(
(pF − pM)BR, (1− pF )pMpF
− pMBR
)
. (10)
The femtocell operator’s profit-maximization problem is:
maxpF≥0,BR≥0
πFemto(pF , BR)
subject to BR ≤ BF . (11)
By solving Problem (11), we have the following result.
Lemma 3. In Stage II, the femtocell operator’s equilibrium femtocell price is
p∗F (pM , BF ) = max
(
2pM1 + pM
,−pM +
√
(pM)2 + 4BFpM2BF
)
, (12)
and its equilibrium femtocell bandwidth purchase is
B∗R(pM , BF ) = min
(
1− (pM)2
4pM, BF
)
, (13)
which equals users’ total preferred demand in femtocell service. Then users’ preferred parti-
tion threshold equals equilibrium partition threshold ( i.e., θprth = θth).
The proof of Lemma 3 is given in Appendix 1. Lemma 3 shows that the femtocell operator
will also satisfy the users’ preferred demands, and it does not want the users to switch to its
competitor (i.e., the macrocell operator).
4.3 Macrocell Operator’s Spectrum Allocations and Pricing inStage I
Now we come back to Stage I, where the macrocell operator determines pM , BF , and BM
to maximize its profit. Let us denote the macrocell operator’s equilibrium decisions as p∗M ,
B∗F , and B∗
M .
Notice that Lemma 2 shows that it is optimal for the macrocell operator to serve all
users with θ ∈ [pM/p∗F (pM , BF ), 1] by macrocell service, where p∗F (pM , BF ) is the equilibrium
femtocell price given in Lemma 3. This means that the macrocell operator does not want
15

users with large macrocell spectrum efficiency θ to choose its competitor (i.e., the femtocell
operator). Intuitively, users with a large θ demand more bandwidth in macrocell service
than in femtocell service, and thus lead to a larger profit to the macrocell operator if they
choose macrocell service.
Since BM = B − BF , we can write the macrocell operator’s profit as a function of pM
and BF , i.e.,
πMacro(pM , BF ) = pMB∗R(pM , BF ) + pM
∫ 1
pMp∗F
(pM ,BF )
(
1
pM−
1
θ
)
dθ. (14)
The macrocell operator’s profit-maximization problem is
maxpM≥0,BF≥0
πMacro(pM , BF )
subject to
∫ 1
pMp∗F
(pM,BF )
(
1
pM−
1
θ
)
dθ ≤ B − BF , (15)
where p∗F (pM , BF ) and B∗R(pM , BF ) are given in (12) and (13), respectively. The constraint
shows that macrocell band BM = B−BF can satisfy users’ total preferred macrocell demand.
Problem (15) is not convex and is difficult to solve in closed-form, but can be solved
easily using numerical methods. Next we introduce a useful lemma that facilitates our later
discussions on numerical results.
The macrocell operator wants to sell its total capacity B at the highest macrocell price
pM . Under a fixed price, the total demand from the users depends on which services they
subscribe to. If we can maximize the user demand under any fixed price, then we can achieve
the maximum revenue by optimizing the choice of price accordingly.
Recall that a user’s demand is 1p∗F(pM ,BF )
− 1 in femtocell service and 1pM
−1θin macrocell
service. We have the following lemma.
Lemma 4. The macrocell operator wants users with θ ∈
[
0, 11
pM− 1
p∗F
(pM ,BF )+1
)
to choose
femtocell service, and rest of the users with θ ∈
[
11
pM−
1p∗F
(pM ,BF )+1
, 1
]
to choose macrocell
service. That is, it prefers users’ partition threshold to be θ̃th = 11
pM− 1
p∗F
(pM,BF )+1
.
Note that the threshold in Lemma 4 is what the macrocell operator wants to see; however,
it may not equal the users’ finalized partition threshold θth = pMp∗F(pM ,BF )
. This is because that
the macrocell operator cannot fully control the femtocell operator’s decisions. The difference
between these two thresholds are due to the market competition between macrocell and
femtocell operators.
16

0 1 2 3 4 5 60
1
2
3
4
5
6
Bandwidth capacity B
Mac
roce
ll op
erat
or’s
ban
d al
loca
tions Femtocell band B
F∗
Macrocell band BM∗
Figure 5: Equilibrium bands B∗F and B∗
M asfunctions of capacity B
0 1 2 3 4 5 60.1
0.2
0.3
0.4
0.5
0.6
0.7
0.8
0.9
Bandwidth capaicty B
Equ
ilibr
ium
pric
es
Femtocell price pF∗
Macrocell price pM∗
Macrocell price pMbench
Figure 6: p∗F and p∗M in dual services, andbenchmark price pbenchM as functions of B
4.4 Numerical Results
Solving Problem (15) numerically, we obtain the macrocell operator’s equilibrium femtocell
band B∗F , and macrocell band B∗
M = B − B∗F , and the macrocell price p∗M . Plugging into
(12), we obtain the equilibrium femtocell price p∗F .
Figure 5 shows the macrocell operator’s equilibrium bandwidth allocation. The X axis
is total bandwidth capacity B and the Y axis is the macrocell and femtocell bandwidth B∗F
and B∗M , respectively. It shows that when the total bandwidth capacity B is small, the
macrocell operator would lease spectrum to the femtocell operator, so both macrocell and
femtocell services are provided to end users; however, when the total bandwidth capacity B
becomes large, only macrocell service is provided (i.e, B∗F = 0 and B∗
M = B). The intuition
behind this is as follows: with large bandwidth capacity, the macrocell operator can already
serve most users by macrocell service. The potential benefit of reaching the remaining small
portion of customers through facilitating femtocell service can not compensate the potential
loss due to new market competition. Hence the macrocell operator has no motive to lease
spectrum to femtocell provider. However, with small capacity B, the macrocell service price
p∗M is high, and thus most users with θ ∈ [0, p∗M) would not request macrocell service. By
leasing bandwidth to femtocell operator, the macrocell operator can obtain a larger profit
from serving more users (indirectly through femtocell operator). It should be noted that
B = 4.77 (that distinguishes total capacity to be small or large) is a normalized value
compared to users’ population, as we have normalized users’ population to be 1.
17
0 1 2 3 4 5 60
0.2
0.4
0.6
0.8
1
Bandwidth capacity B
Use
rs’ p
artit
ion
thre
shol
ds o
ver
dual
ser
vice
s
Users’ finalized partition pM∗ /p
F∗
Macrocell operator’s preferred partition
Figure 7: Users’ equilibrium partition thresh-old θth =
p∗M
p∗F
and macrocell operator’s pre-
ferred θ̃th = 11
p∗M
− 1p∗F+1
as functions of B
0 1 2 3 4 5 60
0.1
0.2
0.3
0.4
0.5
0.6
Bandwidth capacity B
Mac
roce
ll op
erat
or’s
equ
ilibr
ium
pro
fits
Macrocell service onlyDual services
Figure 8: Macrocell operator’s profits inmacrocell service only case and current dualservice case as functions of capacity B
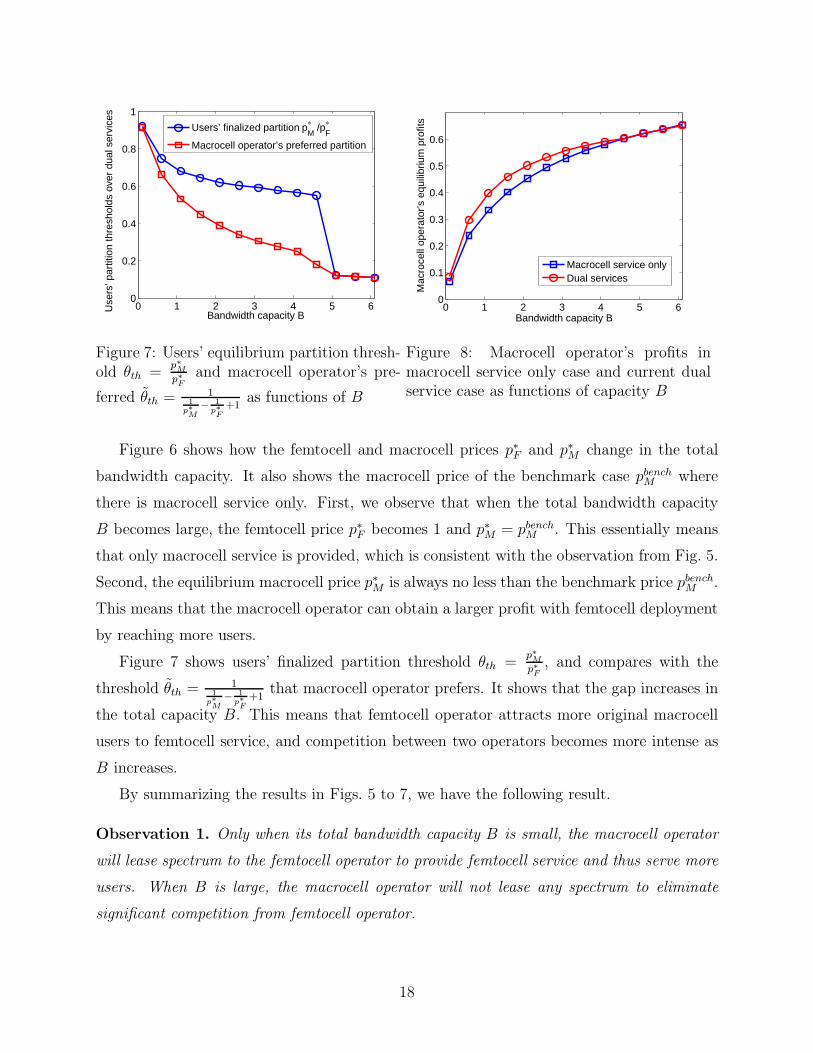
Figure 6 shows how the femtocell and macrocell prices p∗F and p∗M change in the total
bandwidth capacity. It also shows the macrocell price of the benchmark case pbenchM where
there is macrocell service only. First, we observe that when the total bandwidth capacity
B becomes large, the femtocell price p∗F becomes 1 and p∗M = pbenchM . This essentially means
that only macrocell service is provided, which is consistent with the observation from Fig. 5.
Second, the equilibrium macrocell price p∗M is always no less than the benchmark price pbenchM .
This means that the macrocell operator can obtain a larger profit with femtocell deployment
by reaching more users.
Figure 7 shows users’ finalized partition threshold θth =p∗M
p∗F
, and compares with the
threshold θ̃th = 11
p∗M
− 1p∗F+1
that macrocell operator prefers. It shows that the gap increases in
the total capacity B. This means that femtocell operator attracts more original macrocell
users to femtocell service, and competition between two operators becomes more intense as
B increases.
By summarizing the results in Figs. 5 to 7, we have the following result.
Observation 1. Only when its total bandwidth capacity B is small, the macrocell operator
will lease spectrum to the femtocell operator to provide femtocell service and thus serve more
users. When B is large, the macrocell operator will not lease any spectrum to eliminate
significant competition from femtocell operator.
18

0 1 2 3 4 5 60
0.1
0.2
0.3
0.4
0.5
0.6
0.7
0.8
Bandwidth capacity B
Tot
al c
onsu
mer
sur
plus
Macrocell service onlyDual services
Figure 9: Comparison of total consumer sur-plus between dual services and macrocell ser-vice only benchmark as functions of B.
0 0.2 0.4 0.6 0.8 10
0.1
0.2
0.3
0.4
0.5
0.6
0.7
0.8
Macrocell spectrum efficiency θ
Any
use
r’s p
ayof
f
Macrocell service onlyDual services
Figure 10: Comparison of a consumer’s payoffbetween dual services and macrocell serviceonly benchmark as functions of θ. Here wefix B = 2.1.
Today’s macrocell operators have “small” capacities in big cities, in the sense that their
capacities are not enough to match the too many people’s sharp growth of wireless data
demand. For example, we can witness poor service coverage of AT&T’s macrocell service in
New York City and San Francisco due to lack of spectrum resource (LaVallee 2009, WNN
Wi-Fi Net News 2008). The absolute value of total capacity is small and we have small
B ≤ 4.77 in these cities (WNN Wi-Fi Net News 2008). Thus we can observe macrocell
operators’ strong incentives to lease spectrum to femtocell operators in big cities(e.g., Sprint
to Virgin Mobile USA and Vodafone to BT Mobile) to serve more users. However, in many
other places with fewer user density, femtocell services haven’t been deployed yet.
Next we investigate how the introduction of femtocell service affects the macrocell op-
erator’s profit, consumer surplus (i.e., users’ aggregate payoff), and the social welfare (i.e.,
summation of the profits of both operators and the payoffs of all users). In each figure, we
compare the dual services with the macrocell service only benchmark. Our discussions focus
on the dual-service region.
Figure 8 shows the profits of the macrocell operator when both services are provided vs.
when only macrocell service is provided, both of which are increasing in capacity B. The
provision of femtocell service improves the macrocell operator’s profit significantly, especially
when B is small (e.g., 27% when B = 0.1).
Figure 9 shows that the total consumer surplus increases with the deployment of femtocell
service. This is mainly because users with low spectrum efficiency (small values of θ) will be
19

able to obtain high quality service by using femtocell and have better payoffs.
Nevertheless, some consumers could actually be worse off with dual services. Figure 10
shows users’ surplus (payoff) with respect to their macrocell spectrum efficiency θ. Here we
let the total capacity B = 2.1. From Figure 9 we know that, in this case, femtocell deploy-
ment increases the total consumer surplus. However, Figure 10 shows that, for individual
users, a user with small θ obtains great payoff enhancement with femtocell deployment,
whereas the payoff for a user with large θ actually becomes worse off. The former is due to
the benefit of service availability and quality improvement, while the latter is due to higher
macrocell price.
Based on Figs. 8 to 10, we have the following result.
Observation 2. After introducing femtocell service, the macrocell operator’s profit increases
since more users can be served now. Similarly, the total consumer surplus increases though
some users’ payoffs decrease. Overall, the total social welfare increases.
5. Extension I: With Femtocell Operational Cost
In Section 4, we consider a model where femtocell service does not incur any additional cost
comparing with the macrocell service. As shown in Figure 1, femtocell users’ traffic will first
go through users’ home wireline broadband connections before reaching the control center
of the cellular network. The broadband connection is owned by an Internet Service Provider
(ISP). When the femtocell operator and the ISP belong to the same entity (e.g., both
belonging to AT&T) or the ISP is sharing-friendly (NetShare 2002), there is no additional
cost for broadband access. Otherwise there is usually an access charge. In this section, we
study the more general case where the ISP charges the femtocell operator fees for using the
wireline Internet connection. We are interested in understanding how this operational cost
affects the provision of femtocell service.
For simplicity, we assume that the total operational cost is linearly proportional to fem-
tocell bandwidth with a coefficient C ∈ (0, 1). This is motivated by the fact that femtocell
traffics will use ISP’s broadband resource, and many ISPs have adopted usage-based pricing
(Deleon 2011). If C ≥ 1, we can show that the femtocell operator will charge a femtocell
price pF > C ≥ 1, and no user will choose the femtocell service (see (8)). Thus we will focus
on the case where the linear coefficient C ∈ (0, 1). The three-stage decision process is similar
20

to that shwon in Figure 4. The analysis of Stage III is the same as in Section 4.3, and we
hence focus on Stage II.
5.1 Stage II: Femtocell Operator’s Spectrum Purchase and Pric-ing Decisions
In Stage II, the femtocell operator determines BR and pF to maximize its profit. We still use
B∗R(pM , BF ) and p∗F (pM , BF ) to denote the equilibrium decisions of the femtocell operator.
By following a similar analysis as in Lemma 2, we obtain the following result.
Lemma 5. At the equilibrium, the macrocell operator will satisfy all preferred demands from
users with θ ∈ [θprth , 1].
The proof of Lemma 5 is very similar to Lemma 2 and is omitted. Based on Lemma 5,
the femtocell operator will serve users with θ ∈ [0, pM/pF ), and its profit is
πFemto(pF , BR) = (pF − C)min
(
BR,
∫
pMpF
0
(
1
pF− 1
)
dθ
)
− pMBR. (16)
we can explicitly write the femtocell operator’s profit-maximization problem as
maxpF≥0,BR≥0
πFemto(pF , BR)
subject to BR ≤ BF ,
pM + C ≤ pF ≤ 1, (17)
where the second constraint shows that the femtocell price pF should at least cover the total
cost (pM + C) for the femtocell operator. By solving Problem (17), we obtain the following
result.
Lemma 6. In Stage II, the femtocell operator’s equilibrium femtocell price is
p∗F (pM , BF ) = max
(
2
1 + 1pM+C
,−pM +
√
(pM)2 + 4BFpM2BF
)
, (18)
and its equilibrium femtocell bandwidth purchase is
B∗R(pM , BF ) = min
(
pM
1(pM+C)2
− 1
4, BF
)
, (19)
which equals users’ total preferred demand in femtocell service. Then, users’ preferred par-
tition threshold equals users’ finalized partition threshold ( i.e., θth = θprth).
The proof of Lemma 6 is given in Appendix 2.
21

5.2 Stage I: Macrocell Operator’s Spectrum Allocations and Pric-ing Decisions
Now let us study Stage I, where the macrocell operator determines pM , BF , and BM to
maximize its profit. Let us denote its equilibrium decisions as p∗M , B∗F , and B∗
M .
Notice that Lemma 5 shows that it is optimal for the macrocell operator to serve all users
with θ ∈
[
pMp∗F(pM ,BF )
, 1]
by the macrocell service. By using the fact that BM = B − BF , we
can eliminate variable BM . The macrocell operator’s profit is
πMacro(pM , BF ) = pMB∗R(BF , pM) + pM
∫ 1
pMp∗F
(BF ,pM )
(
1
pM−
1
θ
)
dθ. (20)
The macrocell operator’s profit-maximization problem is
maxBF ,pM
πMacro(pM , BF ),
subject to 0 ≤ BF +
∫ 1
pMp∗F
(BF ,pM )
(
1
pM−
1
θ
)
dθ ≤ B,
0 < pM ≤ 1− C, (21)
where B∗R(BF , pM) and p∗F (BF , pM) are given in (18) and (19), respectively. The second
constraint shows that the total cost C + pM to femtocell operator should be less than 1.
Otherwise, the femtocell price pF needs to be larger than C + pM and thus larger than 1,
and no user will subscribe to the femtocell service.
5.3 Numerical Results
Problem (21) is not convex and is difficult to solve in closed-form, but can be solved easily
using numerical methods. Similar to Section 4, we can see that dual services degenerate to
the macrocell service only benchmark when capacity is large. Here we will focus on how
cost C will affect the division of two capacity regimes and the performance when capacity is
small.
5.3.1 Impact of C on Capacity Regime Boundary
Figure 11 illustrates how cost C affects the boundary between the low capacity and high
capacity regimes. Recall that the boundary is 4.77 when C = 0 (i.e., Figures 5, 6, and
7). When C increases, the femtocell price p∗F increases and demand for femtocell service
decreases. This makes it less attractive to provide femtocell service. On the other hand,
22

0 0.1 0.2 0.3 0.43.5
4
4.5
5
5.5
Cost C
Bou
ndar
y be
twee
n tw
o ca
paci
ty r
egim
es
Figure 11: The boundary between low andhigh capacity regimes change with femtocelloperational cost C.
0 0.1 0.2 0.3 0.40
0.05
0.1
0.15
0.2
0.25
Cost C
Diff
bet
wee
n p M*
/ p F*
and
1/ (
1/ p
M* −
1/ p
F*+
1)
B=1.1B=2.1
Figure 12: The difference between users’partition threshold θth =
p∗Mp∗F
and macro-
cell operator’s preferred threshold θ̃th =1
1p∗M
− 1p∗F+1
as a function of C and B
the increase of price p∗F also reduces the market competition, which makes the macrocell
operator more willing to lease spectrum to the femtocell operator. The interactions of these
two factors determine the boundary of the two capacity regimes. More specifically, with
a small cost C ≤ 0.12, the decrease of femtocell demands dominates and the boundary
decreases. With a large cost C > 0.12, the decrease of competition dominates and the
boundary increases. We will discuss these two factors in more details at a later point.
Figure 12 explicitly illustrates that a larger C decreases the gap between users’ finalized
partition threshold θth =p∗M
p∗F
and the threshold θ̃th = 11
p∗M
− 1p∗F+1
that the macrocell operator
prefers, and thus makes the service competition less fierce. This gives more incentive to the
macrocell operator to lease spectrum to the femtocell operator, which is the dominant factor
that increases the boundary between two capacity regions when C increases (as shown in
Figure 11).
Observation 3. As cost C increases in femtocells, the femtocell operator has less incentive
to provide femtocell service. However, the macrocell operator may benefit from the increase
of C in terms of its profit since the service competition from femtocell operator become less
intense.
When cost C increases but is still small, we can show that femtocell price increases to
compensate cost, and the macrocell operator will face the decrease of femtocell demands. In
23

0 0.1 0.2 0.3 0.40.34
0.36
0.38
0.4
0.42
0.44
0.46
0.48
0.5
Cost C
Mac
roce
ll op
erat
or’s
equ
ilibr
ium
pro
fit
B=1.1B=2.1
Figure 13: Macrocell operator’s equilibriumprofit as a function of cost C and capacity B
0 0.1 0.2 0.3 0.4 0.5 0.6
0.16
0.165
0.17
0.175
0.18
0.185
0.19
0.195
0.2
Cost C
Tot
al c
onsu
mer
sur
plus
Macrocell service onlyDual services
Figure 14: Comparison of total consumer sur-plus between dual services and macrocell ser-vice only benchmark as functions of C. Herewe fix B = 1.1.
this case, less femtocell band is needed and the macrocell operator’s profit decreases in C (see
Fig. 13). However, when cost C is large, competition between dual services mitigates and
the macrocell operator allow the existence of femtocell service even for a large B. We can
further observe from Fig. 11 that the macrocell operator still wants to lease bandwidth to
femtocell operator even when B = 5.2 under C = 0.4, while no femtocell service is provided
under C = 0 in this case. Thus the macrocell operator benefits from the high cost for large
B in terms of its profit.
5.3.2 Impact of C on Consumer Surplus and Social Welfare
In Figures 14 and 15, we investigate how the cost C affects total consumer surplus and social
welfare. We focus on the low capacity regime only.
Figure 14 shows that the total consumer surplus is larger with dual services when C < 0.3,
but is smaller with dual services when C > 0.3. In the latter case, femtocell users experience
only small QoS improvements due to the high cost p∗F , and macrocell users experience a p∗M
larger than pbenchM . Note that macrocell price increases since all users can be served. As a
result, the total consumer surplus decreases with dual services.
Figure 15 shows that social welfare is always larger with dual services for all possible
values of C. Together with Figure 14, this shows that the macrocell operator obtains a
larger profit by sacrificing the consumer surplus when C > 0.3.
24

0 0.1 0.2 0.3 0.4 0.5 0.6 0.70.45
0.5
0.55
0.6
0.65
0.7
Cost C
Soc
ial w
elfa
reMacrocell service onlyDual services
Figure 15: Comparison of social welfare be-tween dual services and macrocell service onlyas functions of cost C. Here the total capacityis fixed at B = 1.1
Users normalized population
1
0 *
Mp 1Macrocell spectrum efficiency
*
th
Macrocell service
Femtocell
service
Macrocell
service
No service
Figure 16: Users’ possible service partitionsover space and macrocell spectrum efficiencyθ
Observation 4. After introducing femtocell service, total consumer surplus increases only
when the cost C is small. The social surplus always increases.
6. Extension II: With Limited Femtocell Coverage
In Section 4, we assume that femtocell service has the same ubiquitous coverage as the
macrocell service. In this section, we look at the general case where the femtocell service
only covers η ∈ (0, 1) portion of the user population, as illustrated in Figure 1. Then 1 − η
portion of users can only access the macrocell service. Figure 16 illustrates the users’ possible
service partitions over space and macrocell spectrum efficiency θ. We call the η fraction users
overlapped users, and the rest 1−η non-overlapped users. We are interested in understanding
how the limited coverage affects the provision of femtocell service.
The three-stage decision process is similar to that depicted in Figure 4. The analysis of
Stage III is the same as Section 4.3. Next we focus on Stage II.
Following a similar analysis as in Lemma 2, we can also conclude that overlapped users
with θ ∈ [θprth , 1] will be served by macrocell service, and the other overlapped users will be
served by femtocell service. That is, θth = θprth . Then we can similarly derive the following
result.
Lemma 7. In Stage II, the femtocell operator’s equilibrium femtocell price is
p∗F (pM , BF ) = max
(
21
pM+ 1
,−pMη +
√
(pMη)2 + 4pMBFη
2BF
)
, (22)
25

and its leased bandwidth from macrocell operator is
B∗R(pM , BF ) = min
(
ηpM
(
1(pM )2
− 1
4
)
, BF
)
, (23)
which equals overlapped users’ total preferred demand in femtocell service.
6.1 Macrocell Operator’s Spectrum Allocations and Pricing in
Stage I
Now we are ready to study Stage I, where the macrocell operator’s profit-maximization
problem is
maxpM ,BF
πMacro(pM , BF ) = pMB∗R(pM , BF ) + pM
∫
pMp∗F
(pM ,BF )
(
1
pM−
1
θ
)
dθ,
subject to, 0 < BF +
∫
pMp∗F
(pM ,BF )
(
1
pM−
1
θ
)
dθ ≤ B, (24)
where p∗F (pM , BF ) and B∗R(pM , BF ) are respectively given in (22) and (23).
6.2 Numerical Results
Problem (24) is not convex and is difficult to solve in closed-form, but can be solved easily
using numerical methods. As in Sections 4.4 and 5.3, we can again clearly observe different
behaviors in two capacity regimes: dual services degenerate to the macrocell service only
benchmark in the high capacity regime. Unlike Section 5.3, the femtocell coverage η does
not affect the boundary of the two capacity regions (i.e., always atB = 4.77). The two effects
(QoS improvement and competition brought by femtocell service) coexist in η coverage.
We can show that as η increases, it is more attractive to provide femtocell service and
the equilibrium femtocell (macrocell) band B∗F (B∗
M) increases (decreases). Yet both prices
p∗F and p∗M increase in η (see Fig. 17). Intuitively, as η increases, more users are served with
a larger total demand in femtocell service, which leads to a larger p∗F . The overall wireless
service (macrocell plus femtocell) become more efficient and the total user demand (of both
services) will increase. Thus we can observe a larger p∗M . Since the macrocell operator can
sell total capacity in higher dual prices, its profit increases in η.
Figure 18 further shows that the total consumer surplus is larger with dual services than
macrocell service only benchmark. This result is similar to Fig. 9 in Section 4.4.
26

0.2 0.4 0.6 0.8 10.35
0.4
0.45
0.5
0.55
Femtocell coverage η
p F∗ B=1.1B=2.1
0.2 0.4 0.6 0.8 10.2
0.25
0.3
0.35
Femtocell coverage η
p M*
B=1.1B=2.1
Figure 17: Equilibrium prices p∗F and p∗M asfunctions of η and B
0.2 0.4 0.6 0.80.16
0.165
0.17
0.175
0.18
0.185
0.19
0.195
0.2
Femtocell coverage η
Tot
al c
onsu
mer
sur
plus
Macrocell service onlyDual services
Figure 18: Comparison of total consumersurplus between dual services and macrocellbenchmark under B = 1.1.
Observation 5. As femtocell coverage expands, the overall wireless service (macrocell plus
femtocell) becomes more efficient. Both macrocell operator’s profit and total consumer surplus
(as well as social welfare) increase in η.
7. Conclusion
This paper studies the economic incentives for a macrocell operator to deploy new femtocell
service in addition to its existing macrocell service. The femtocell service is provided by an-
other party, the femtocell operator, who needs to lease the macrocell operator’s capacity. We
model the interactions among macrocell operator, femtocell operator, and users as a three-
stage dynamic game, and derive the equilibrium capacity allocation and pricing decisions.
Our analysis shows that the macrocell operator has an incentive to enable both macrocell
and femtocell services when its total bandwidth is small, as femtocell service enhances user
coverage and improves profits for both macrocell and femtocell operators. Notice that not
all users will experience a payoff increase by the introduction of femtocell service in this case.
However, when the total bandwidth is large, femtocell service becomes a severe competitor
to macrocell service, and the macrocell operator thus has less incentive to lease its bandwidth
to the femtocell operator. In this case, only macrocell service is provided to users.
Also, we further study the impact of operational cost of femtocell service. On one hand,
we show that the increase of operational cost of femtocell service makes both operators’
profits decrease. On the other hand, we show that the operational cost can mitigate femtocell
operator’s competition with macrocell operator. Finally, we investigate the impact of limited
27

femtocell coverage where only some users have access to femtocell service.
There are several directions to extend the results in this paper.
• We can further consider the “shared carriers” scheme besides “separate carriers”, where
femtocell service and macrocell service share part of or the whole spectrum. We need
to optimize the pricing and spectrum allocation decisions by trading off the increased
spectrum efficiency and mutual interferences between macrocell and femtocell services.
• We can also consider the frequency spectrum reuse, where multiple femtocells can reuse
the same spectrum if they do not overlap with each other in terms of coverage. In this
case, femtocell service will become more attractive to the femtocell operator, as a single
frequency band may support more users. However, frequency reuse might make the
interference management complicated in areas where femtocells are densely deployed.
• We may also consider a more practical users’ models in dual services, by incorporating
their heterogeneous levels of willingness to pay or sensitivity to achieved data rates.
• Moreover, we can extend our current monopoly case to oligopoly case, where multiple
macrocell (femtocell) operators compete with each other. Intuitively, we can envi-
sion no provision of femtocell service only when all macrocell operators have adequate
bandwidth. But the macrocell and femtocell prices will go down due to operators’
competitions.
Appendix
Appendix 1: Proof of Lemma 3
We first notice that the first term in the min operation of πFemto(pF , BR) in (10) is
increasing in both pF and BR, while the second term is decreasing in both pF and BR.
Hence, the equilibrium p∗F (pM , BF ) and B∗R(pM , BF ) should make these two terms equal
(i.e., femtocell operator’s capacity equals users’ total preferred femtocell demand). Then we
can write B∗R(pM , BF ) as a function of pF , i.e.,
B∗R(pF ) =
(1− pF )pM(pF )2
, (25)
which should be no larger than BF by a proper choice of pF .
28

Then the femtocell operator’s profit-maximization problem can be simplified from (11)
to
maxpF
πFemto(pF ) = πFemto(pF , B∗R(pF )) =
pM(1− pF )(pF − pM)
(pF )2
subject to(1− pF )pM
(pF )2≤ BF . (26)
Let us check the first derivative of πFemto(pF ) over pF , i.e.,
dπFemto(pF )
dpF= pM
2pM − (1 + pM)pF(pF )3
,
which is positive when pF < 2pM/(1 + pM) and is negative otherwise. Thus πFemto(pF )
reaches its maximum when pF = 2pM/(1 + pM). Also, pF needs to satisfy the constraint in
(26). Then the equilibrium femtocell price is
p∗F (pM , BF ) = max
(
2pM1 + pM
,−pM +
√
(pM)2 + 4BFpM2BF
)
.
By substituting this into (27), we obtain the equilibrium femtocell bandwidth purchase as
B∗R(pM , BF ) = min
(
1− (pM)2
4pM, BF
)
.
Appendix 2: Proof of Lemma 6
We can rewrite the femtocell operator’s profit in (17) as
πFemto(BR, pF ) = min (SF (BR, pF ), QF (BR, pF )) ,
where
SF (BR, pF ) = BR(pF − pM − C)
and
QF (BR, pF ) =pMpF
(
1
pF− 1
)
(pF − C)− pMBR.
It is clear that SF (BR, pF ) is increasing in BR and pF , and QF (BR, pF ) is decreasing in BR.
Let us consider the following two cases at the equilibrium:
• If SF (BR, pF ) > QF (BR, pF ), the femtocell operator’s profit equals QF (BR, pF ). Then
the femtocell operator will decrease BR, which will decrease SF (BR, pF ) and increase
SF (BR, pF ) until SF (BR, pF ) = QF (BR, pF ). The profit will be improved. Thus
SF (BR, pF ) > QF (BR, pF ) cannot be true at the equilibrium.
29

• Similarly, we can show that it is not possible to have SF (BR, pF ) < QF (BR, pF ) at the
equilibrium.
As a result, SF (BR, pF ) = QF (BR, pF ) at the equilibrium, which leads to
B∗R(pF ) =
pMpF
(
1
pF− 1
)
. (27)
The choice of pF should satisfy that B∗R(pF ) < BF , i.e.,
pF ≥−pM +
√
(pM)2 + 4pMBF
2BF
. (28)
Then the femtocell operator’s profit-maximization problem in (17) can be simplified as
maxpF
πFemto(pF ) =pMpF
(
1
pF− 1
)
(pF − pM − C),
subject to pF ≥−pM +
√
(pM)2 + 4pMBF
2BF
. (29)
The first order derivative of πFemto(pF ) in (29) over pF is
dπFemto(pF )
dpF=
pM(pF )2
(
(C + pM)
(
2
pF− 1
)
− 1
)
,
which is positive when pM < 21+ 1
pM+C
and negative otherwise. Thus πFemto(pF ) achieves its
maximum at pF = 21+ 1
pM+C
. Also, pF needs to satisfy the constraint in Problem (29). Hence,
we obtain the equilibrium femtocell price p∗M(pM , BF ) in (18). By substituting (18) into (27),
we can derive the equilibrium femtocell bandwidth request B∗R(pM , BF ) in (19).
References
Altmann, J., K. Chu. 2001. How to charge for network services-flat-rate or usage-based?
Computer Networks 36(5-6) 519–531.
Atkinson, J. 2011. Vodafone and BT mobile mvno renew contract for five years. http://www.mobiletoday.co.uk/News/11089/Vodafone and BT Mobile MVNO renew contract
for
five years .aspx.
AT&T, Frequently Asked Questions. 2011. AT&T 3g micocell. http://www.att.com/shop/wireless/
devices/3gmicrocell.jsp?fbid=2RqBuNua27C#faqs.
Berg Insight. 2009. Femtocells and fixed-mobile convergence. http://www.berginsight.com/
ReportPDF/ProductSheet/bi-fmc-ps.pdf.
30
Chen, Y., J. Zhang, Q. Zhang. 2011. Utility-aware refunding framework for hybrid access
femtocell network. IEEE Transactions on Wireless Communications.
Chiang, W. K., D. Chhajed, J. D. Hess. 2003. Direct marketing, indirect profits: a strategic
analysis of dual-channel supply-chain design. Management Science 49(1) 1–20.
China Femtocell Symposium. 2011, Beijing. http://www.conference.cn/femto/2011/en/
Conference.asp?ArticleID=475.
Claussen, H., L. Ho, L. Samuel. Financial analysis of a pico-cellular home network deploy-
ment. IEEE ICC.
Courcoubetis, C., R. Weber. 2003. Pricing communication networks- economics, technology
and modeling. New York: Wiley.
Deleon, N. 2011. Usage-based billing hits Canada: say goodbye to Internet innovation.
TechCrunch Hot Topics. http://techcrunch.com/2011/02/01/usage-based-billing-hits-canada-say-goodbye-to-internet-innovation/
Dewenter, R., J. Haucap. 2006. Incentives to lease mobile virtual network operators (mvnos).
presented at the 34th Res. Conf. Commun., Inf. Internet Policy.
Duan, L., J. Huang, B. Shou. 2011. Economic incentives of femtocell service provision.
submitted to IEEE Transactions on Mobile Computing.
Dumrongsiri, A., M. Fan, A. Jain, K. Moinzadeh. 2008. A supply chain model with direct
and retail channels. European Journal of Operational Research 187(3) 691-718.
Fitchard, K. 2009. http://connectedplanetonline.com/wireless/news/sprint-femtocells-whole
sale-services-0610.
Goldstein, P. 2011. Verizon confirms it will ditch unlimited smartphone data plans starting
July 7. Fierce Wireless. http://www.fiercewireless.com/story/verizon-confirms-it-will-
ditch-unlimited-smartphone-data-plans-starting-jul/2011-07-05.
Hong, W., Z. Tsai. 2010. On the femtocell-based MVNO model: a game theoretic approach
for optimal power setting. IEEE 71st Vehicular Technology Conference (VTC).
Huang, W., J. M. Swaminathan. 2009. Introduction of a second channel: implications for
pricing and profits. European Journal of Operational Research 194(1) 258–279.
Informa Telecoms & Media. 2011. Femtocell deployments more than double in 12 months
with strong growth byond the home. http://www.informatm.com/itmgcontent/icoms/s/
press-releases/20017850662.html.
31
LaVallee, A. 2009. AT&T to New York and San Francisco: we are working on it. The Wall
Street Journal.
McKnight, L. W., J. P. Bailey. 1998. Internet economics. MIT Press Cambridge, Mas-
sachusetts.
Myerson, R. B. 2002. Game theory: analysis of conflict. Cambridge, MA: Harvard University
Press.
NetShare Speakeasy. 2002. http://www.prnewswire.com/news-releases/speakeasy-breaks-
with-mainline-isps-embraces-wi-fi-and-promotes-shared-broadband-connections-76903267.html
Rubin, P. H.. 1978. The theory of the firm and the structure of the franchise contract. The
Journal of Law and Economics 21(1) 223–233.
Sandler, Kathy. 2009. House calls: ‘femtocells’ promise to boost the cellphone signals inside
your home. The Wall Street Journal.
Sengupta, S., M., Chatterjee. 2009. An economic framework for dynamic spectrum access
and service pricing. ACM/IEEE Transactions on Networking 17(4) 1200–1213.
Shetty, N., S. Parekh, J. Walrand. 2009. Economics of femtocells. IEEE GLOBECOM.
Tanneur, E. P. L. 2003. Residential resale of wireless broadband via wireless. Thesis at
Ecole Polytechnique.
Tsay, A. A., N. Agrawal. 2004. Channel conflict and coordination in e-commerce age.
Production and Operations Management 13(1) 93–110.
Wang, W., B. Li. 2005. Market-driven bandwidth allocation in selfish overlay networks.
IEEE INFOCOM.
WNNWi-Fi Net News. 2008. Verizon wins big 700MHZ auction block. http://wifinetnews.com
/archives/2008/03/verizon wins big 700 mhz auction block.html.
Yun, S., Y. Yi, D. Cho, J. Mo, Open or close: on the sharing of femtocells. IEEE INFOCOM
Mini-Conference.
32