![Distribution Capability Statement [2018 2020]€¦ · MEDC Distribution Capability Statement (2018-2020) – V2.2 1 1. INTRODUCTION 1.1. Purpose of the Statement This Capability Statement](https://static.fdocuments.us/doc/165x107/5f12790bcf97f0031e3acc85/distribution-capability-statement-2018-2020-medc-distribution-capability-statement.jpg)
Capability Statement EQ Eng Rev 02 - Royal … · Capability Statement . ... load pattern...
17
Earthquake Engineering Capability Statement
Transcript of Capability Statement EQ Eng Rev 02 - Royal … · Capability Statement . ... load pattern...
Earthquake Engineering
Capability Statement
Earthquake Engineering © HaskoningDHV Nederland B.V. 1
Capability Statement: Earthquake Engineering
For further commercial information please contact:
Mr. Marcel Ticheloven BSc
T: +31 (0)88 3485393
M: +31 (0)6 46283171
For further technical information please contact our expert:
Dr. Sander J.H. Meijers
T: +31 (0)88 3488412
M: +31 (0) 652018690
Copyright © March 2014 HaskoningDHV Nederland B.V.
Project details throughout this document may have been utilised the services of companies previously acquired by Royal HaskoningDHV.

Earthquake Engineering © HaskoningDHV Nederland B.V. 2
1 Contents 1 Quickscan .................................................................................................................... 4
2 Response spectrum analysis ..................................................................................... 4
3 Time-history analysis ................................................................................................. 6
4 Push-over analysis ..................................................................................................... 6
5 Soil-structure-interaction ........................................................................................... 7
6 Liquefaction and cyclic softening ............................................................................. 7
7 Displacement based design ....................................................................................... 7
8 Detailing of structures ................................................................................................ 8
9 Quantitative risk analysis ........................................................................................... 9
10 Projects ...................................................................................................................... 10
Earthquake Engineering © HaskoningDHV Nederland B.V. 3
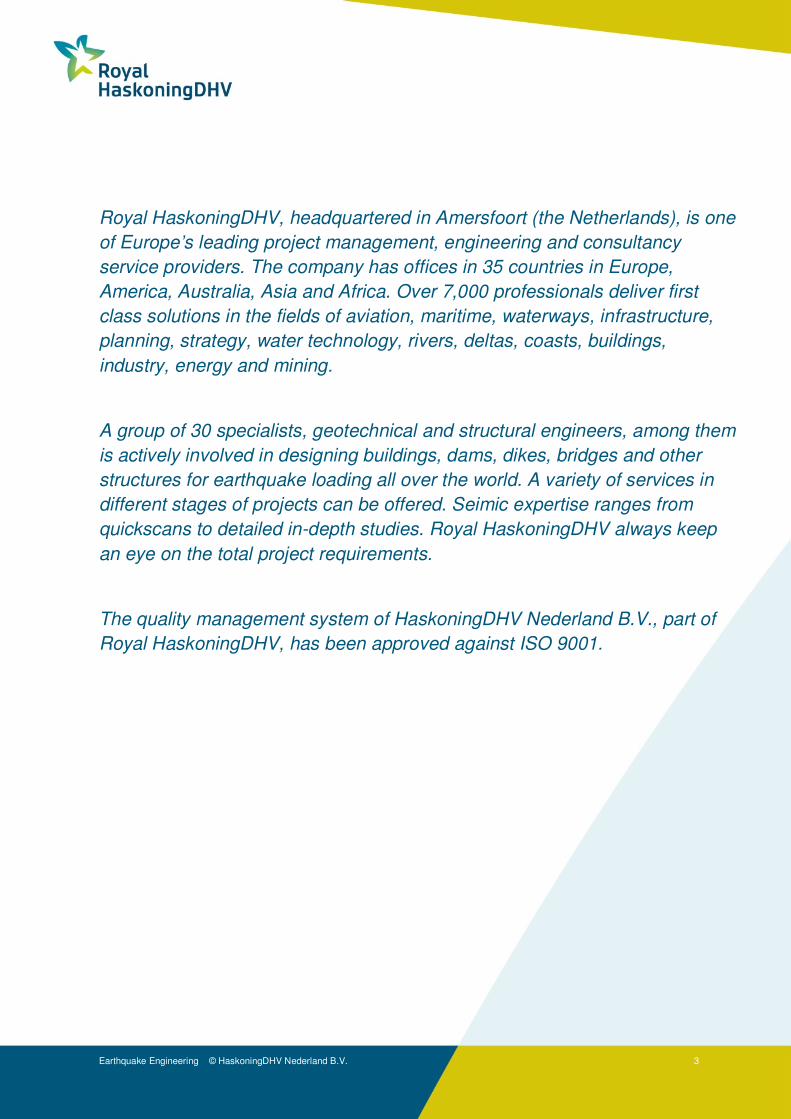
Royal HaskoningDHV, headquartered in Amersfoort (the Netherlands), is one
of Europe’s leading project management, engineering and consultancy
service providers. The company has offices in 35 countries in Europe,
America, Australia, Asia and Africa. Over 7,000 professionals deliver first
class solutions in the fields of aviation, maritime, waterways, infrastructure,
planning, strategy, water technology, rivers, deltas, coasts, buildings,
industry, energy and mining.
A group of 30 specialists, geotechnical and structural engineers, among them
is actively involved in designing buildings, dams, dikes, bridges and other
structures for earthquake loading all over the world. A variety of services in
different stages of projects can be offered. Seimic expertise ranges from
quickscans to detailed in-depth studies. Royal HaskoningDHV always keep
an eye on the total project requirements.
The quality management system of HaskoningDHV Nederland B.V., part of
Royal HaskoningDHV, has been approved against ISO 9001.
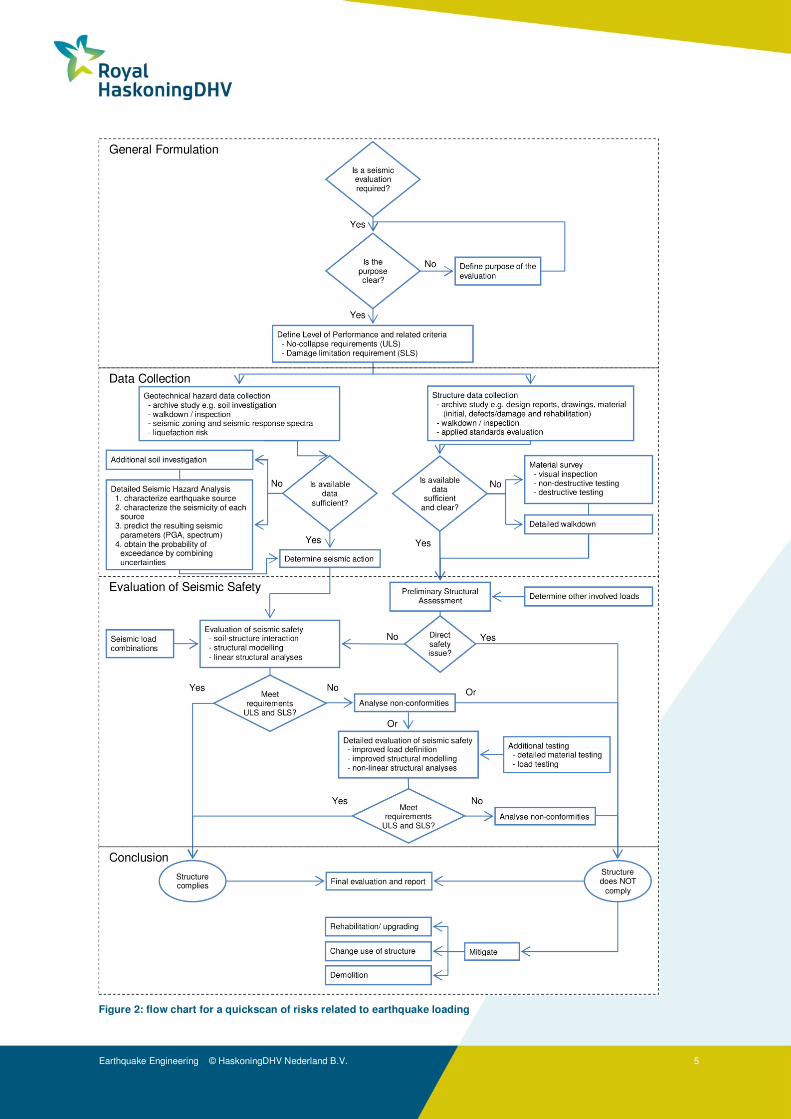
1 Quickscan A company, municipality or (governmental) institution is generally responsible for a group of structures that may be affected by earthquake loading. If a seismic hazard assessment has been carried out for a specific area rather than a single structure, Royal HaskoningDHV can perform a quickscan in order to identify and mitigate the most prominent risks. For that purpose the flow chart in Figure 2 can be followed.
2 Response spectrum analysis
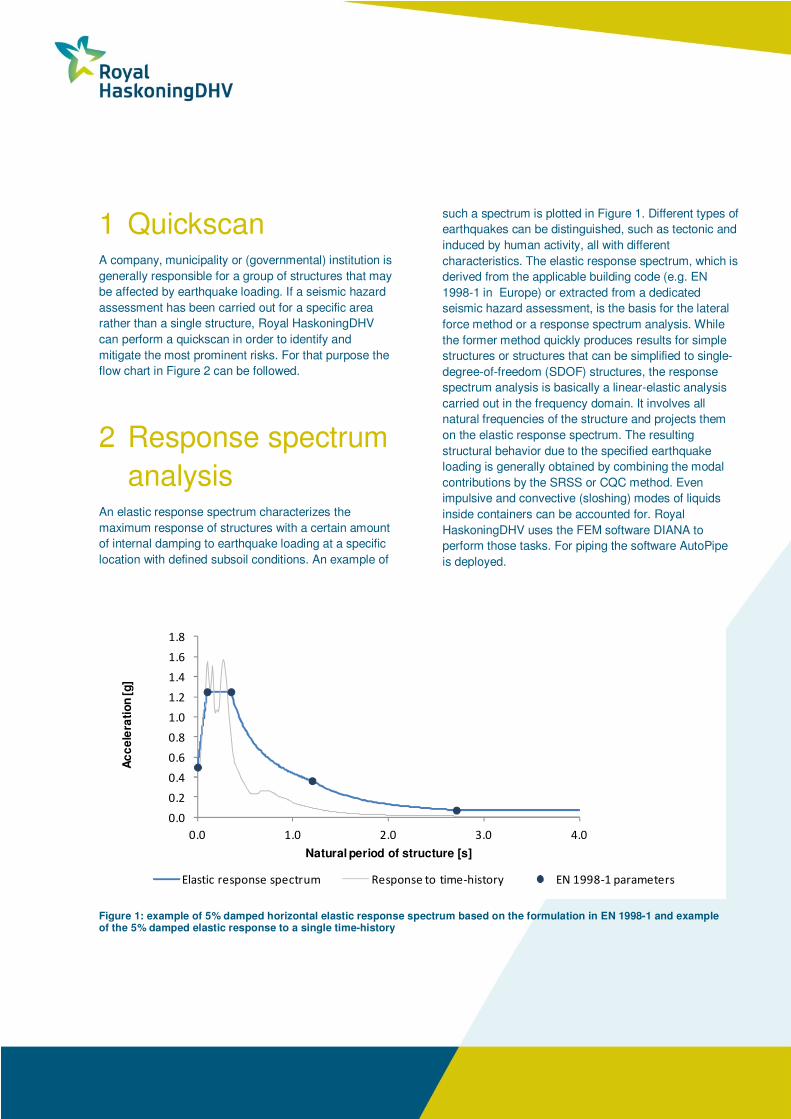
An elastic response spectrum characterizes the maximum response of structures with a certain amount of internal damping to earthquake loading at a specific location with defined subsoil conditions. An example of
such a spectrum is plotted in Figure 1. Different types of earthquakes can be distinguished, such as tectonic and induced by human activity, all with different characteristics. The elastic response spectrum, which is derived from the applicable building code (e.g. EN 1998-1 in Europe) or extracted from a dedicated seismic hazard assessment, is the basis for the lateral force method or a response spectrum analysis. While the former method quickly produces results for simple structures or structures that can be simplified to single-degree-of-freedom (SDOF) structures, the response spectrum analysis is basically a linear-elastic analysis carried out in the frequency domain. It involves all natural frequencies of the structure and projects them on the elastic response spectrum. The resulting structural behavior due to the specified earthquake loading is generally obtained by combining the modal contributions by the SRSS or CQC method. Even impulsive and convective (sloshing) modes of liquids inside containers can be accounted for. Royal HaskoningDHV uses the FEM software DIANA to perform those tasks. For piping the software AutoPipe is deployed.
Figure 1: example of 5% damped horizontal elastic response spectrum based on the formulation in EN 1998-1 and example of the 5% damped elastic response to a single time-history
0.0
0.2
0.4
0.6
0.8
1.0
1.2
1.4
1.6
1.8
0.0 1.0 2.0 3.0 4.0
Ac
ce
lera
tio
n [g
]
Natural period of structure [s]
Elastic response spectrum Response to time-history EN 1998-1 parameters
Earthquake Engineering © HaskoningDHV Nederland B.V. 5
Figure 2: flow chart for a quickscan of risks related to earthquake loading
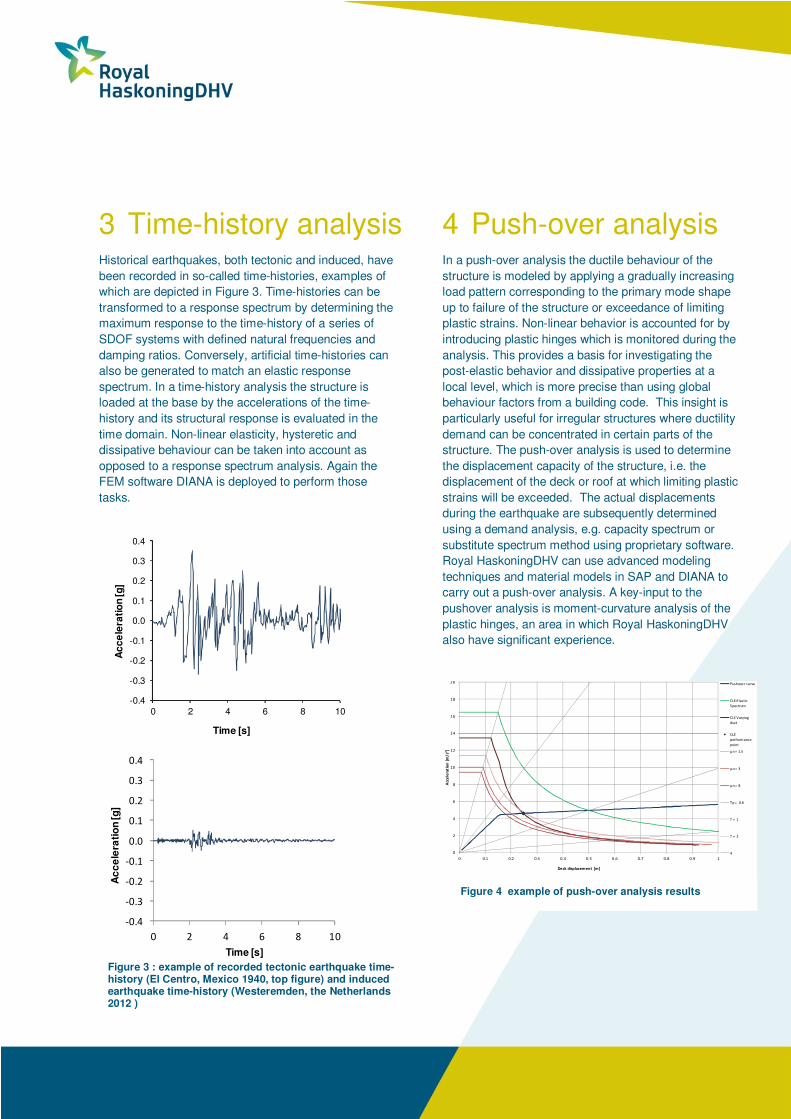
3 Time-history analysis Historical earthquakes, both tectonic and induced, have been recorded in so-called time-histories, examples of which are depicted in Figure 3. Time-histories can be transformed to a response spectrum by determining the maximum response to the time-history of a series of SDOF systems with defined natural frequencies and damping ratios. Conversely, artificial time-histories can also be generated to match an elastic response spectrum. In a time-history analysis the structure is loaded at the base by the accelerations of the time-history and its structural response is evaluated in the time domain. Non-linear elasticity, hysteretic and dissipative behaviour can be taken into account as opposed to a response spectrum analysis. Again the FEM software DIANA is deployed to perform those tasks.
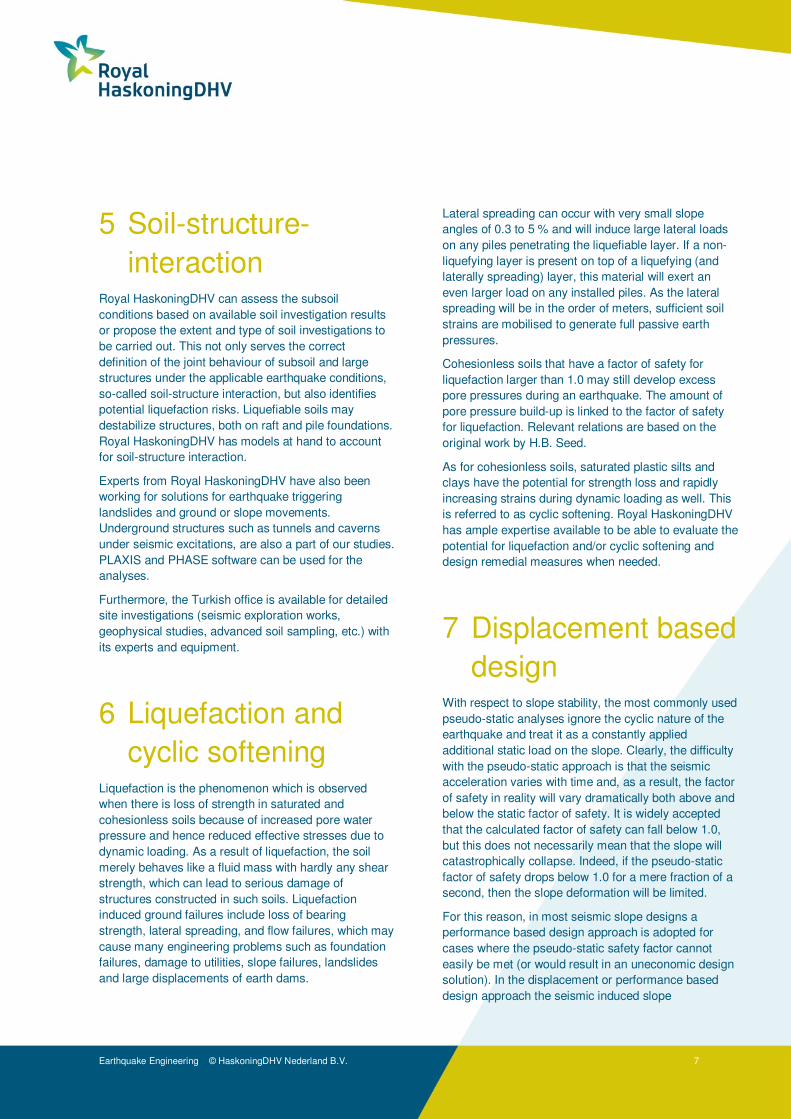
4 Push-over analysis In a push-over analysis the ductile behaviour of the structure is modeled by applying a gradually increasing load pattern corresponding to the primary mode shape up to failure of the structure or exceedance of limiting plastic strains. Non-linear behavior is accounted for by introducing plastic hinges which is monitored during the analysis. This provides a basis for investigating the post-elastic behavior and dissipative properties at a local level, which is more precise than using global behaviour factors from a building code. This insight is particularly useful for irregular structures where ductility demand can be concentrated in certain parts of the structure. The push-over analysis is used to determine the displacement capacity of the structure, i.e. the displacement of the deck or roof at which limiting plastic strains will be exceeded. The actual displacements during the earthquake are subsequently determined using a demand analysis, e.g. capacity spectrum or substitute spectrum method using proprietary software. Royal HaskoningDHV can use advanced modeling techniques and material models in SAP and DIANA to carry out a push-over analysis. A key-input to the pushover analysis is moment-curvature analysis of the plastic hinges, an area in which Royal HaskoningDHV also have significant experience.
-0.4
-0.3
-0.2
-0.1
0.0
0.1
0.2
0.3
0.4
0 2 4 6 8 10
Ac
ce
lera
tio
n [g
]
Time [s]
0
2
4
6
8
10
12
14
16
18
20
0 0.1 0.2 0.3 0.4 0.5 0.6 0.7 0.8 0.9 1
Acc
ele
rati
on
[m
/s2
]
Deck displacement [m]
Pushover curve
CLE Elastic
Spectrum
CLE Varying
duct
CLE
performance
point
μn = 1.5
μn = 3
μn = 8
Tp = 0.6
T = 1
T = 2
4
-0.4
-0.3
-0.2
-0.1
0.0
0.1
0.2
0.3
0.4
0 2 4 6 8 10
Ac
ce
lera
tio
n [g
]
Time [s]
Figure 3 : example of recorded tectonic earthquake time-history (El Centro, Mexico 1940, top figure) and induced earthquake time-history (Westeremden, the Netherlands 2012 )
Figure 4 example of push-over analysis results
Earthquake Engineering © HaskoningDHV Nederland B.V. 7
5 Soil-structure-interaction
Royal HaskoningDHV can assess the subsoil conditions based on available soil investigation results or propose the extent and type of soil investigations to be carried out. This not only serves the correct definition of the joint behaviour of subsoil and large structures under the applicable earthquake conditions, so-called soil-structure interaction, but also identifies potential liquefaction risks. Liquefiable soils may destabilize structures, both on raft and pile foundations. Royal HaskoningDHV has models at hand to account for soil-structure interaction.
Experts from Royal HaskoningDHV have also been working for solutions for earthquake triggering landslides and ground or slope movements. Underground structures such as tunnels and caverns under seismic excitations, are also a part of our studies. PLAXIS and PHASE software can be used for the analyses.
Furthermore, the Turkish office is available for detailed site investigations (seismic exploration works, geophysical studies, advanced soil sampling, etc.) with its experts and equipment.
6 Liquefaction and cyclic softening
Liquefaction is the phenomenon which is observed when there is loss of strength in saturated and cohesionless soils because of increased pore water pressure and hence reduced effective stresses due to dynamic loading. As a result of liquefaction, the soil merely behaves like a fluid mass with hardly any shear strength, which can lead to serious damage of structures constructed in such soils. Liquefaction induced ground failures include loss of bearing strength, lateral spreading, and flow failures, which may cause many engineering problems such as foundation failures, damage to utilities, slope failures, landslides and large displacements of earth dams.
Lateral spreading can occur with very small slope angles of 0.3 to 5 % and will induce large lateral loads on any piles penetrating the liquefiable layer. If a non-liquefying layer is present on top of a liquefying (and laterally spreading) layer, this material will exert an even larger load on any installed piles. As the lateral spreading will be in the order of meters, sufficient soil strains are mobilised to generate full passive earth pressures.
Cohesionless soils that have a factor of safety for liquefaction larger than 1.0 may still develop excess pore pressures during an earthquake. The amount of pore pressure build-up is linked to the factor of safety for liquefaction. Relevant relations are based on the original work by H.B. Seed.
As for cohesionless soils, saturated plastic silts and clays have the potential for strength loss and rapidly increasing strains during dynamic loading as well. This is referred to as cyclic softening. Royal HaskoningDHV has ample expertise available to be able to evaluate the potential for liquefaction and/or cyclic softening and design remedial measures when needed.
7 Displacement based design
With respect to slope stability, the most commonly used pseudo-static analyses ignore the cyclic nature of the earthquake and treat it as a constantly applied additional static load on the slope. Clearly, the difficulty with the pseudo-static approach is that the seismic acceleration varies with time and, as a result, the factor of safety in reality will vary dramatically both above and below the static factor of safety. It is widely accepted that the calculated factor of safety can fall below 1.0, but this does not necessarily mean that the slope will catastrophically collapse. Indeed, if the pseudo-static factor of safety drops below 1.0 for a mere fraction of a second, then the slope deformation will be limited.
For this reason, in most seismic slope designs a performance based design approach is adopted for cases where the pseudo-static safety factor cannot easily be met (or would result in an uneconomic design solution). In the displacement or performance based design approach the seismic induced slope
Earthquake Engineering © HaskoningDHV Nederland B.V. 8
displacements are assessed and it is checked whether the resulting displacements can still meet the project’s performance requirements. It is checked whether the seismic induced displacements can still be safely accommodated by the slope or the structures that might exist within the zone of influence. The performance based approach results in a fit-for-purpose and economic design solution.
Seismic induced slope deformations can be assessed using real or ‘developed’ time histories (accelerograms) by means of a full dynamic analysis (using e.g. PLAXIS FEM software).
Alternatively it could be considered to use the Newmark (or similar) method to estimate the slope deformations in cases that the pseudo-static slope safety factor is less than unity. In its simplest form, the Newmark approach models the moving part of the slope as a rigid-plastic block which starts to move (accelerate) along its base when a critical (yield) acceleration is exceeded. The ratio between the design peak acceleration and the yield acceleration is a measure for the corresponding block displacement. Figure 5 illustrates the principle of the displacement calculation, based on a double integration of the ‘excess’ acceleration (the part of acceleration that exceeds the yield acceleration and makes the block moving).
Figure 5 : Principle Newmark analysis
In reality, different parts of a slope will have different yield accelerations. The yield acceleration normally
increases with increased depth of the slip surface, unless there is a weak (e.g. liquefying) layer present in the slope. Obviously, the lower the yield acceleration for a particular slope section, the larger the earthquake induced displacement will be.
Royal HaskoningDHV has access to dedicated software programs to perform performance based seismic slope designs, like PLAXIS and SHAKE2000. Alternatively, simplified Newmark analyses may be performed based on e.g. Ambraseys and Menu.
It is finally noted that seismic displacement is not only resulting from the inertia force acting on the slope. Liquefaction induced displacement (cyclic shake down) settlement can also significantly contribute to the total seismic induced displacement. Any performance based design approach should also account for cyclic softening and seismic induced pore pressure build-up.
8 Detailing of structures
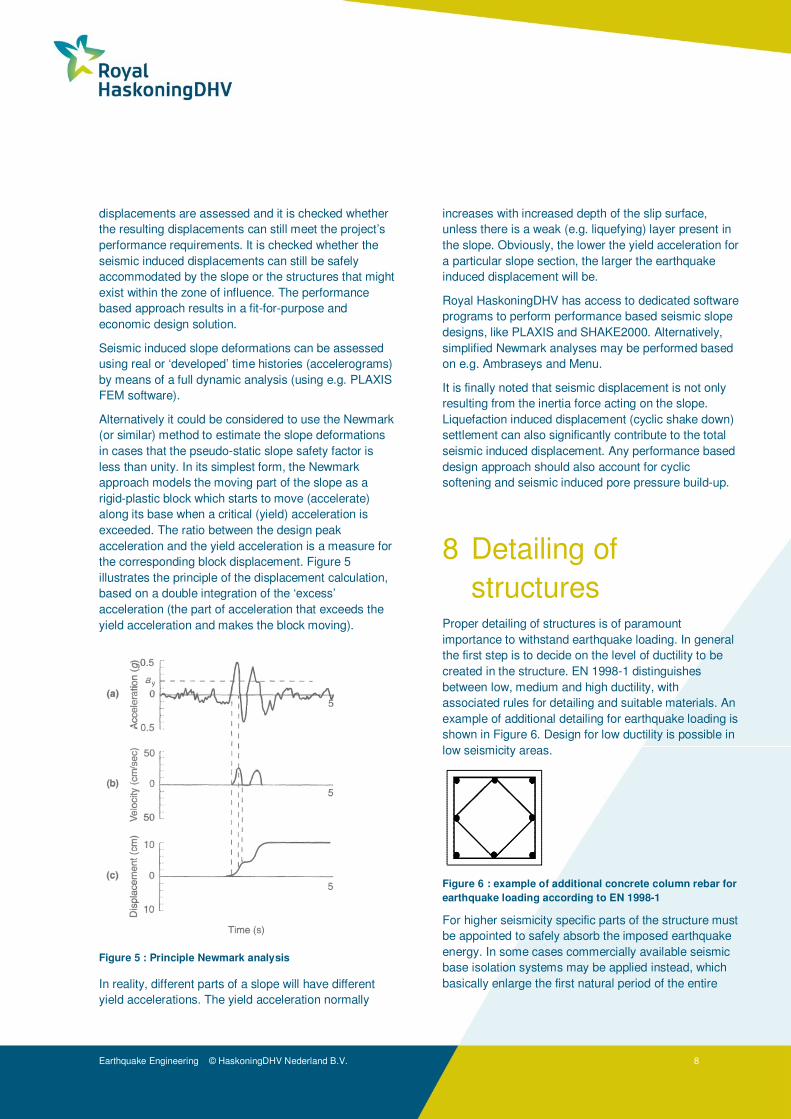
Proper detailing of structures is of paramount importance to withstand earthquake loading. In general the first step is to decide on the level of ductility to be created in the structure. EN 1998-1 distinguishes between low, medium and high ductility, with associated rules for detailing and suitable materials. An example of additional detailing for earthquake loading is shown in Figure 6. Design for low ductility is possible in low seismicity areas.
Figure 6 : example of additional concrete column rebar for
earthquake loading according to EN 1998-1
For higher seismicity specific parts of the structure must be appointed to safely absorb the imposed earthquake energy. In some cases commercially available seismic base isolation systems may be applied instead, which basically enlarge the first natural period of the entire
Earthquake Engineering © HaskoningDHV Nederland B.V. 9
structure to such a level that the overall seismic response is reduced drastically.
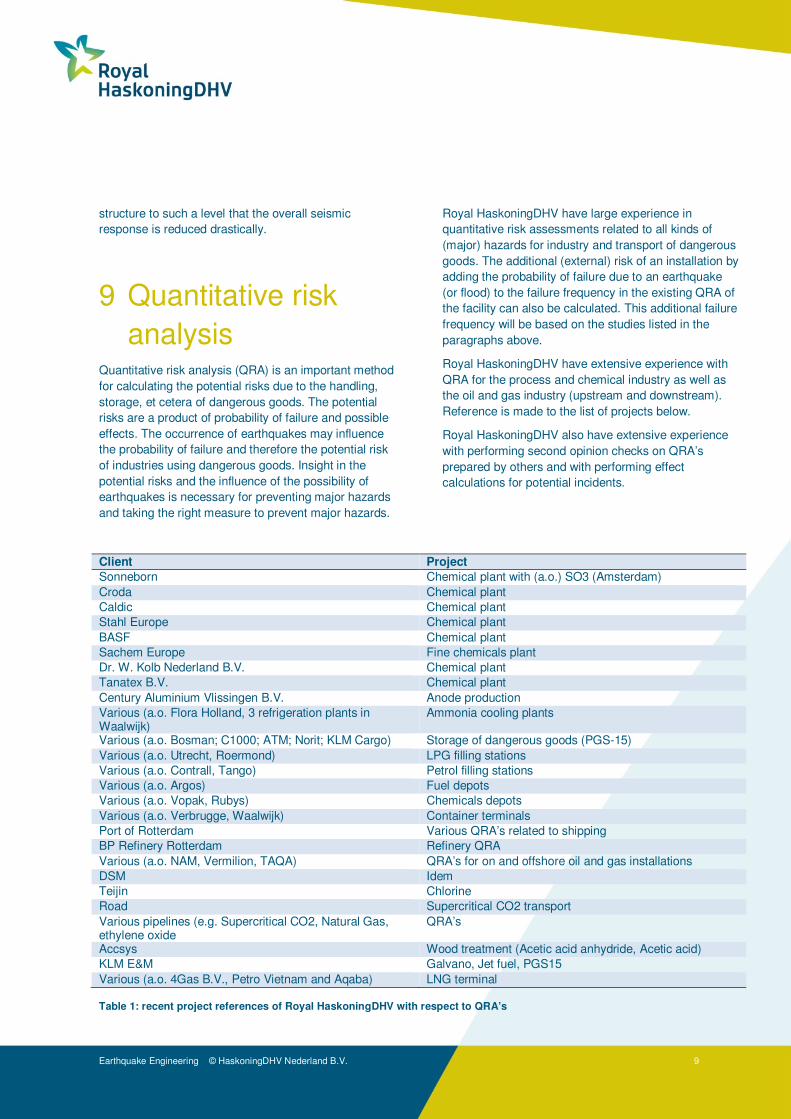
9 Quantitative risk analysis
Quantitative risk analysis (QRA) is an important method for calculating the potential risks due to the handling, storage, et cetera of dangerous goods. The potential risks are a product of probability of failure and possible effects. The occurrence of earthquakes may influence the probability of failure and therefore the potential risk of industries using dangerous goods. Insight in the potential risks and the influence of the possibility of earthquakes is necessary for preventing major hazards and taking the right measure to prevent major hazards.
Royal HaskoningDHV have large experience in quantitative risk assessments related to all kinds of (major) hazards for industry and transport of dangerous goods. The additional (external) risk of an installation by adding the probability of failure due to an earthquake (or flood) to the failure frequency in the existing QRA of the facility can also be calculated. This additional failure frequency will be based on the studies listed in the paragraphs above.
Royal HaskoningDHV have extensive experience with QRA for the process and chemical industry as well as the oil and gas industry (upstream and downstream). Reference is made to the list of projects below.
Royal HaskoningDHV also have extensive experience with performing second opinion checks on QRA’s prepared by others and with performing effect calculations for potential incidents.
Client Project
Sonneborn Chemical plant with (a.o.) SO3 (Amsterdam) Croda Chemical plant Caldic Chemical plant Stahl Europe Chemical plant BASF Chemical plant Sachem Europe Fine chemicals plant Dr. W. Kolb Nederland B.V. Chemical plant Tanatex B.V. Chemical plant Century Aluminium Vlissingen B.V. Anode production Various (a.o. Flora Holland, 3 refrigeration plants in Waalwijk)
Ammonia cooling plants
Various (a.o. Bosman; C1000; ATM; Norit; KLM Cargo) Storage of dangerous goods (PGS-15) Various (a.o. Utrecht, Roermond) LPG filling stations Various (a.o. Contrall, Tango) Petrol filling stations Various (a.o. Argos) Fuel depots Various (a.o. Vopak, Rubys) Chemicals depots Various (a.o. Verbrugge, Waalwijk) Container terminals Port of Rotterdam Various QRA’s related to shipping BP Refinery Rotterdam Refinery QRA Various (a.o. NAM, Vermilion, TAQA) QRA’s for on and offshore oil and gas installations DSM Idem Teijin Chlorine Road Supercritical CO2 transport Various pipelines (e.g. Supercritical CO2, Natural Gas, ethylene oxide
QRA’s
Accsys Wood treatment (Acetic acid anhydride, Acetic acid) KLM E&M Galvano, Jet fuel, PGS15 Various (a.o. 4Gas B.V., Petro Vietnam and Aqaba) LNG terminal Table 1: recent project references of Royal HaskoningDHV with respect to QRA’s
Royal HaskoningDHV
Earthquake Engineering © HaskoningDHV Nederland B.V. 10
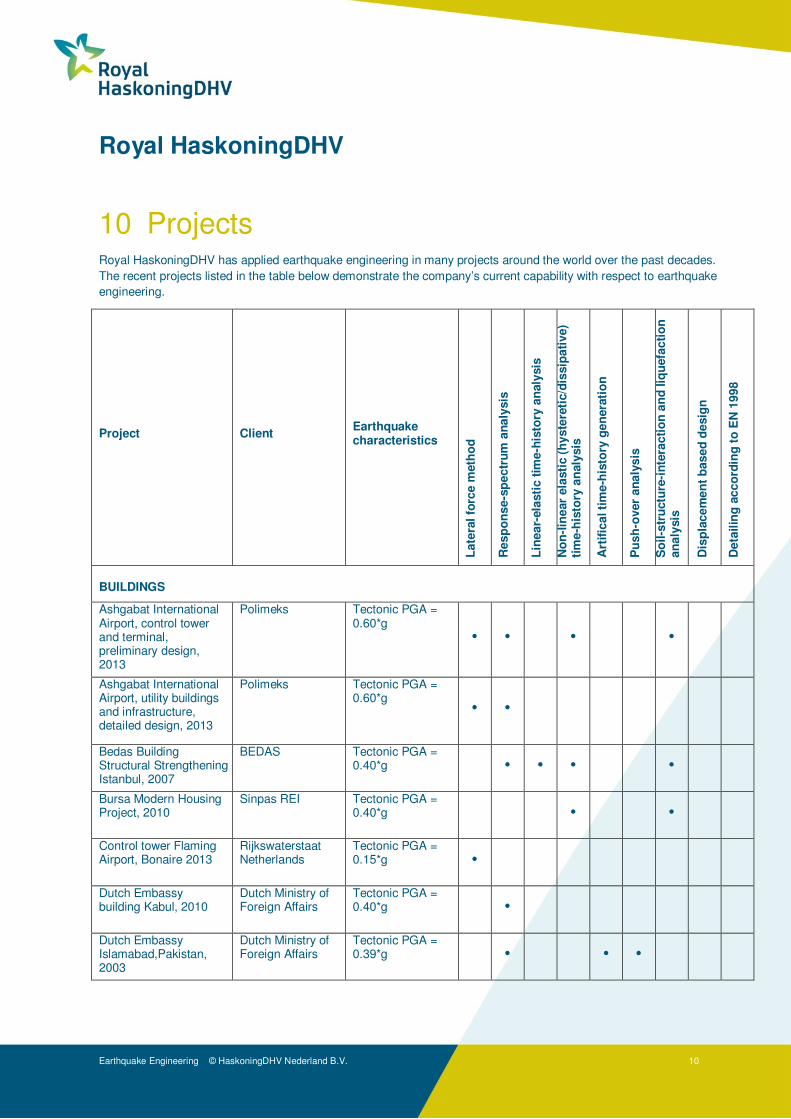
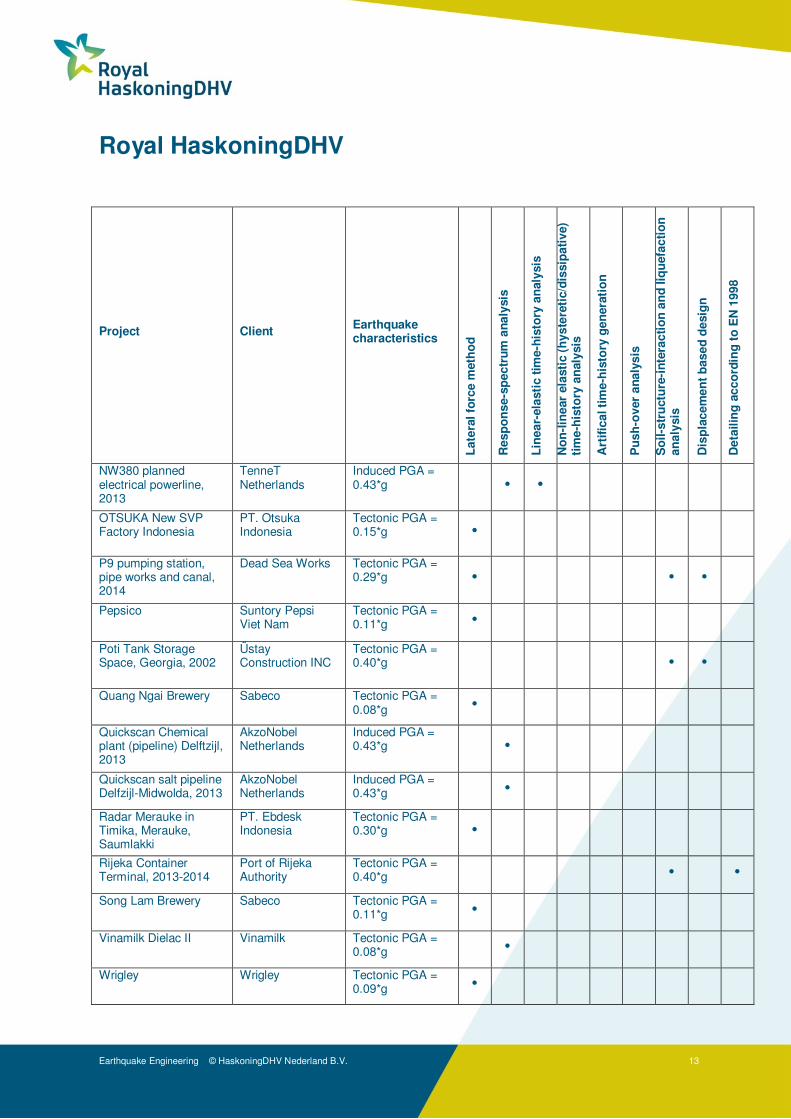
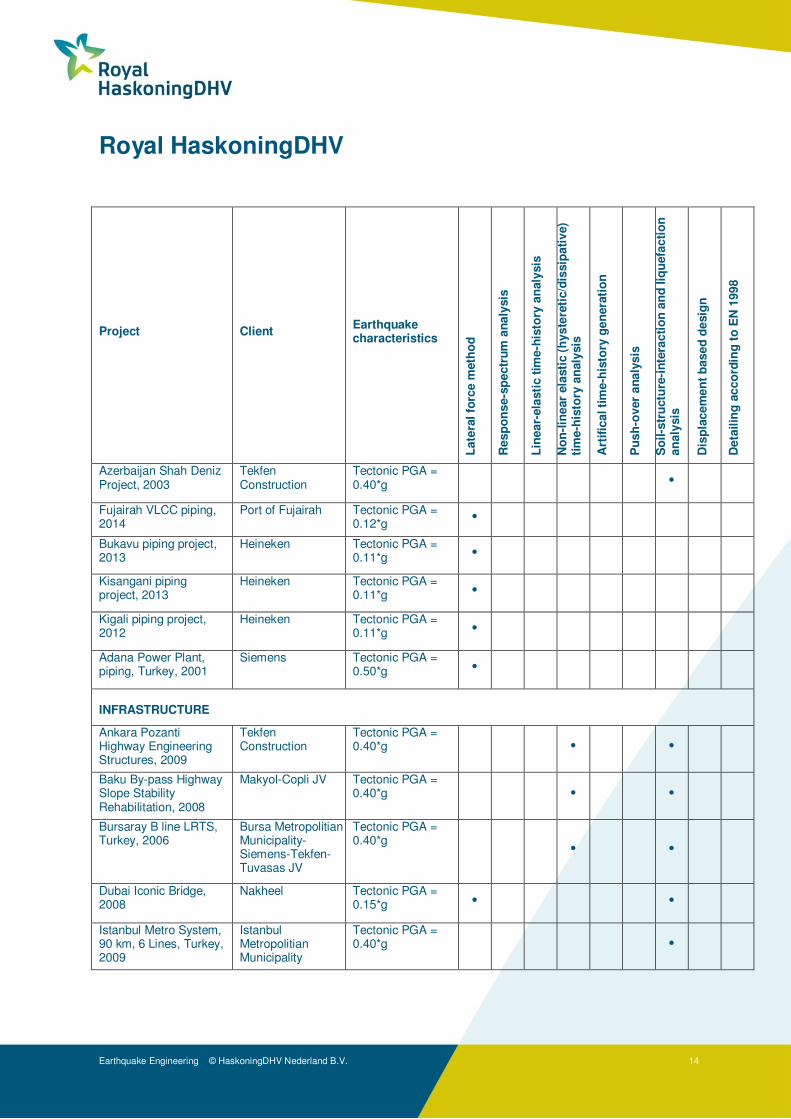
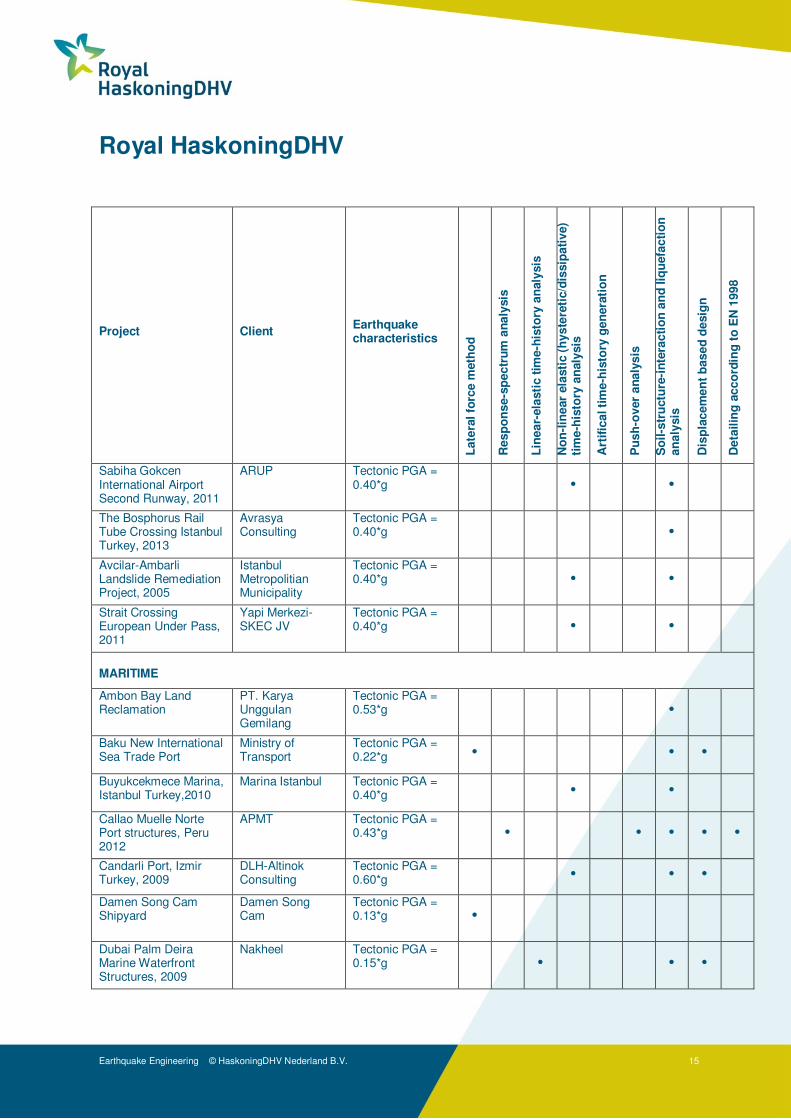
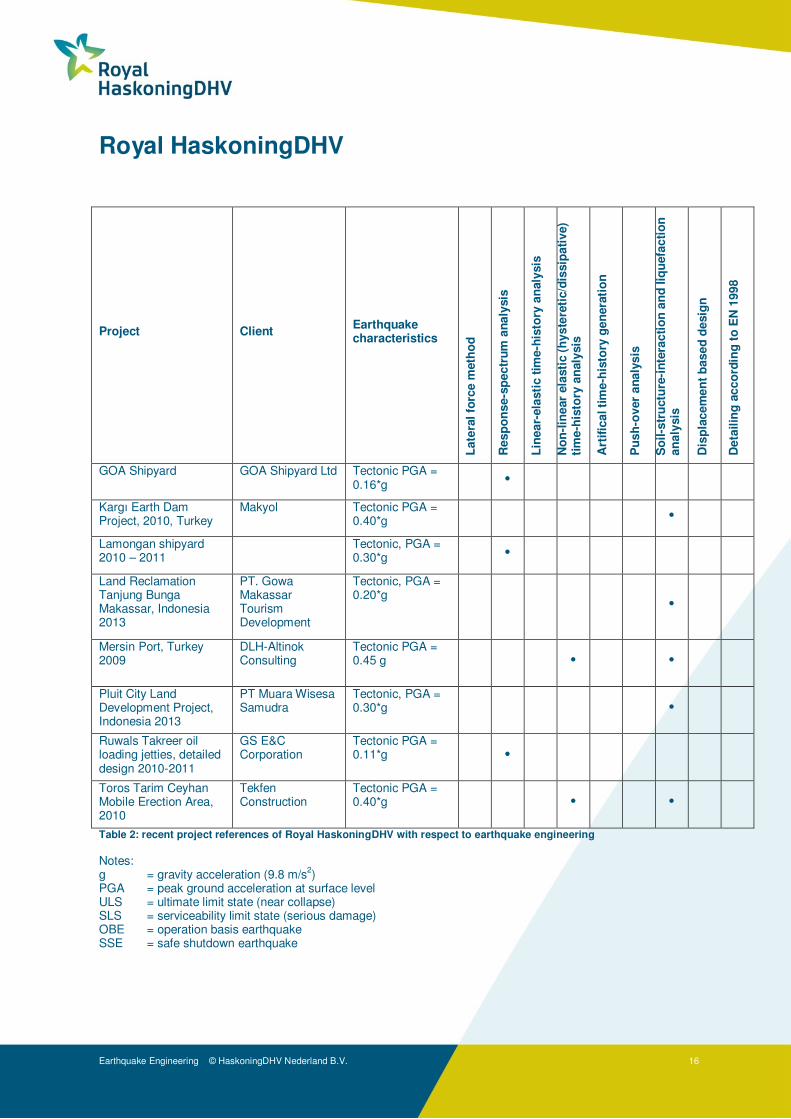
10 Projects Royal HaskoningDHV has applied earthquake engineering in many projects around the world over the past decades. The recent projects listed in the table below demonstrate the company’s current capability with respect to earthquake engineering.
Project Client Earthquake characteristics
Late
ral fo
rce m
eth
od
Resp
on
se-s
pectr
um
an
aly
sis
Lin
ear-
ela
sti
c t
ime-h
isto
ry a
naly
sis
No
n-l
inear
ela
sti
c (
hyste
reti
c/d
issip
ati
ve)
tim
e-h
isto
ry a
naly
sis
Art
ific
al ti
me-h
isto
ry g
en
era
tio
n
Pu
sh
-over
an
aly
sis
So
il-s
tru
ctu
re-i
nte
racti
on
an
d liq
uefa
cti
on
an
aly
sis
Dis
pla
cem
en
t b
ased
desig
n
Deta
ilin
g a
cco
rdin
g t
o E
N 1
998
BUILDINGS
Ashgabat International Airport, control tower and terminal, preliminary design, 2013
Polimeks Tectonic PGA = 0.60*g
• • • •
Ashgabat International Airport, utility buildings and infrastructure, detailed design, 2013
Polimeks Tectonic PGA = 0.60*g
• •
Bedas Building Structural Strengthening Istanbul, 2007
BEDAS Tectonic PGA = 0.40*g • • • •
Bursa Modern Housing Project, 2010
Sinpas REI Tectonic PGA = 0.40*g • •
Control tower Flaming Airport, Bonaire 2013
Rijkswaterstaat Netherlands
Tectonic PGA = 0.15*g •
Dutch Embassy building Kabul, 2010
Dutch Ministry of Foreign Affairs
Tectonic PGA = 0.40*g •
Dutch Embassy Islamabad,Pakistan, 2003
Dutch Ministry of Foreign Affairs
Tectonic PGA = 0.39*g • • •
Royal HaskoningDHV
Earthquake Engineering © HaskoningDHV Nederland B.V. 11
Project Client Earthquake characteristics
Late
ral fo
rce m
eth
od
Resp
on
se-s
pectr
um
an
aly
sis
Lin
ear-
ela
sti
c t
ime-h
isto
ry a
naly
sis
No
n-l
inear
ela
sti
c (
hyste
reti
c/d
issip
ati
ve)
tim
e-h
isto
ry a
naly
sis
Art
ific
al ti
me-h
isto
ry g
en
era
tio
n
Pu
sh
-over
an
aly
sis
So
il-s
tru
ctu
re-i
nte
racti
on
an
d liq
uefa
cti
on
an
aly
sis
Dis
pla
cem
en
t b
ased
desig
n
Deta
ilin
g a
cco
rdin
g t
o E
N 1
998
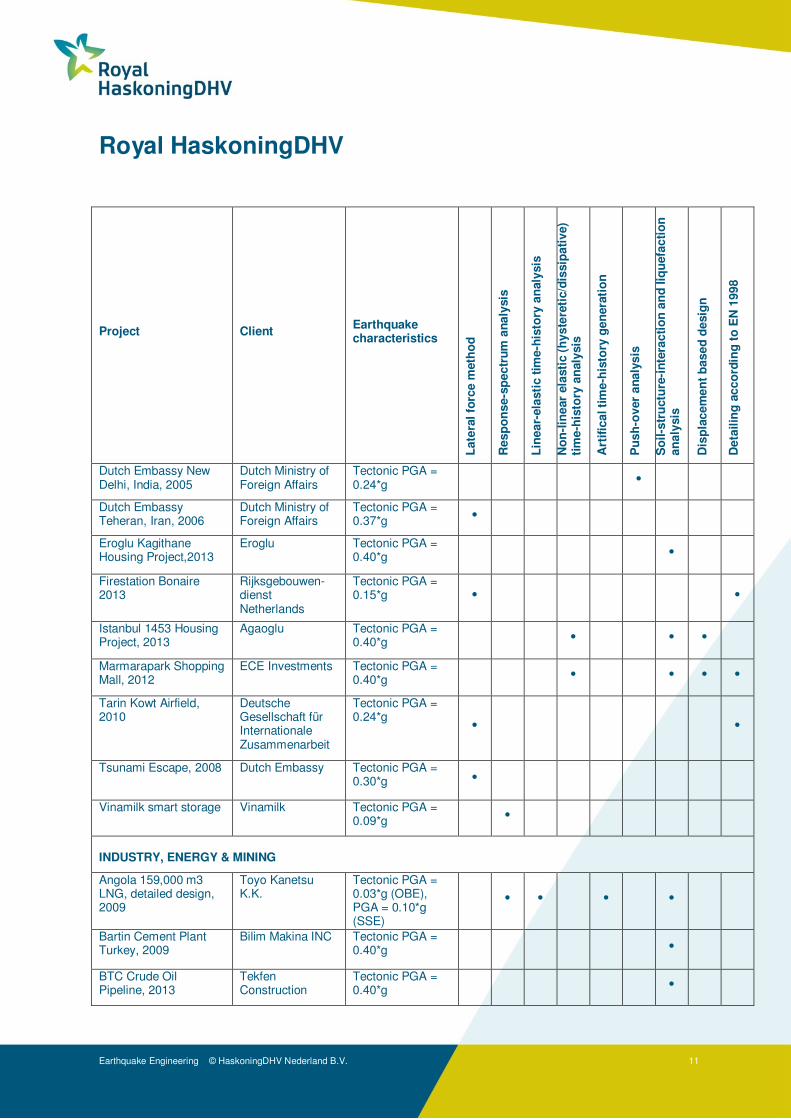
Dutch Embassy New Delhi, India, 2005
Dutch Ministry of Foreign Affairs
Tectonic PGA = 0.24*g
•
Dutch Embassy Teheran, Iran, 2006
Dutch Ministry of Foreign Affairs
Tectonic PGA = 0.37*g •
Eroglu Kagithane Housing Project,2013
Eroglu Tectonic PGA = 0.40*g •
Firestation Bonaire 2013
Rijksgebouwen-dienst Netherlands
Tectonic PGA = 0.15*g •
•
Istanbul 1453 Housing Project, 2013
Agaoglu Tectonic PGA = 0.40*g • • •
Marmarapark Shopping Mall, 2012
ECE Investments Tectonic PGA = 0.40*g • • • •
Tarin Kowt Airfield, 2010
Deutsche Gesellschaft für Internationale Zusammenarbeit
Tectonic PGA = 0.24*g
•
•
Tsunami Escape, 2008 Dutch Embassy Tectonic PGA = 0.30*g •
Vinamilk smart storage Vinamilk Tectonic PGA = 0.09*g •
INDUSTRY, ENERGY & MINING
Angola 159,000 m3 LNG, detailed design, 2009
Toyo Kanetsu K.K.
Tectonic PGA = 0.03*g (OBE), PGA = 0.10*g (SSE)
• • • •
Bartin Cement Plant Turkey, 2009
Bilim Makina INC Tectonic PGA = 0.40*g •
BTC Crude Oil Pipeline, 2013
Tekfen Construction
Tectonic PGA = 0.40*g •
Royal HaskoningDHV
Earthquake Engineering © HaskoningDHV Nederland B.V. 12
Project Client Earthquake characteristics
Late
ral fo
rce m
eth
od
Resp
on
se-s
pectr
um
an
aly
sis
Lin
ear-
ela
sti
c t
ime-h
isto
ry a
naly
sis
No
n-l
inear
ela
sti
c (
hyste
reti
c/d
issip
ati
ve)
tim
e-h
isto
ry a
naly
sis
Art
ific
al ti
me-h
isto
ry g
en
era
tio
n
Pu
sh
-over
an
aly
sis
So
il-s
tru
ctu
re-i
nte
racti
on
an
d liq
uefa
cti
on
an
aly
sis
Dis
pla
cem
en
t b
ased
desig
n
Deta
ilin
g a
cco
rdin
g t
o E
N 1
998
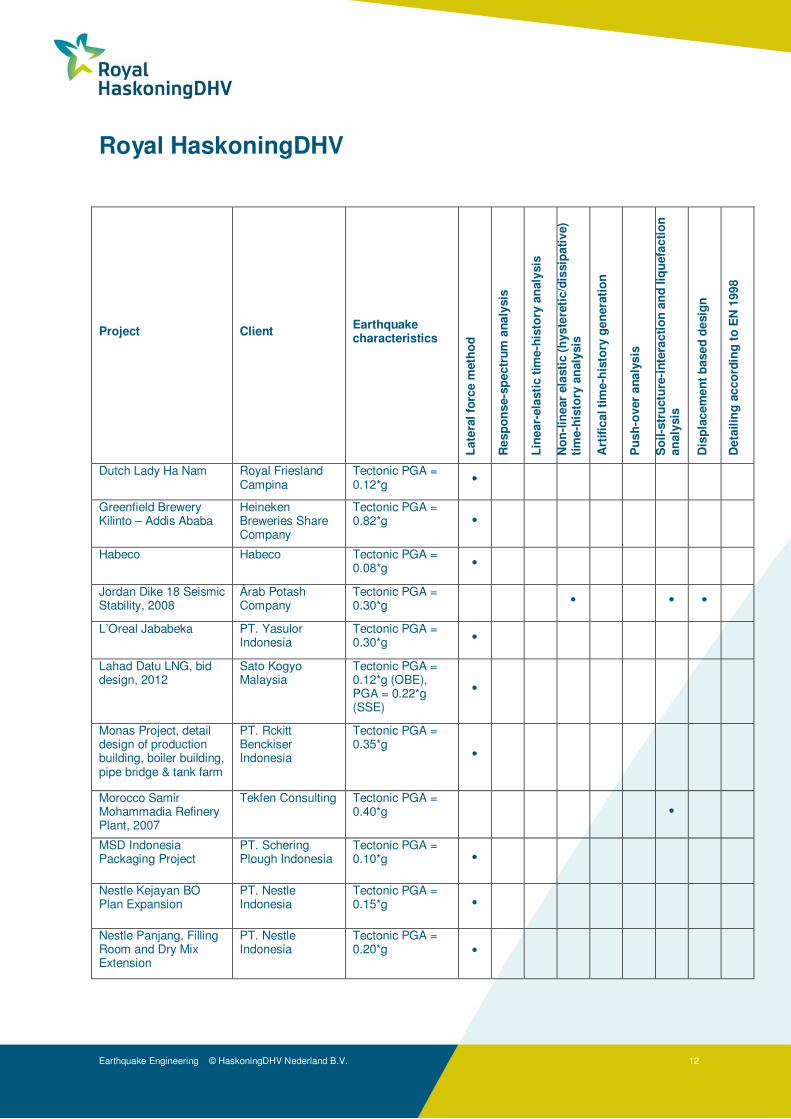
Dutch Lady Ha Nam Royal Friesland Campina
Tectonic PGA = 0.12*g •
Greenfield Brewery Kilinto – Addis Ababa
Heineken Breweries Share Company
Tectonic PGA = 0.82*g •
Habeco Habeco Tectonic PGA = 0.08*g •
Jordan Dike 18 Seismic Stability, 2008
Àrab Potash Company
Tectonic PGA = 0.30*g • • •
L’Oreal Jababeka PT. Yasulor Indonesia
Tectonic PGA = 0.30*g •
Lahad Datu LNG, bid design, 2012
Sato Kogyo Malaysia
Tectonic PGA = 0.12*g (OBE), PGA = 0.22*g (SSE)
•
Monas Project, detail design of production building, boiler building, pipe bridge & tank farm
PT. Rckitt Benckiser Indonesia
Tectonic PGA = 0.35*g
•
Morocco Samir Mohammadia Refinery Plant, 2007
Tekfen Consulting Tectonic PGA = 0.40*g •
MSD Indonesia Packaging Project
PT. Schering Plough Indonesia
Tectonic PGA = 0.10*g •
Nestle Kejayan BO Plan Expansion
PT. Nestle Indonesia
Tectonic PGA = 0.15*g •
Nestle Panjang, Filling Room and Dry Mix Extension
PT. Nestle Indonesia
Tectonic PGA = 0.20*g •
Royal HaskoningDHV
Earthquake Engineering © HaskoningDHV Nederland B.V. 13
Project Client Earthquake characteristics
Late
ral fo
rce m
eth
od
Resp
on
se-s
pectr
um
an
aly
sis
Lin
ear-
ela
sti
c t
ime-h
isto
ry a
naly
sis
No
n-l
inear
ela
sti
c (
hyste
reti
c/d
issip
ati
ve)
tim
e-h
isto
ry a
naly
sis
Art
ific
al ti
me-h
isto
ry g
en
era
tio
n
Pu
sh
-over
an
aly
sis
So
il-s
tru
ctu
re-i
nte
racti
on
an
d liq
uefa
cti
on
an
aly
sis
Dis
pla
cem
en
t b
ased
desig
n
Deta
ilin
g a
cco
rdin
g t
o E
N 1
998
NW380 planned electrical powerline, 2013
TenneT Netherlands
Induced PGA = 0.43*g • •
OTSUKA New SVP Factory Indonesia
PT. Otsuka Indonesia
Tectonic PGA = 0.15*g •
P9 pumping station, pipe works and canal, 2014
Dead Sea Works Tectonic PGA = 0.29*g • • •
Pepsico Suntory Pepsi Viet Nam
Tectonic PGA = 0.11*g •
Poti Tank Storage Space, Georgia, 2002
Üstay Construction INC
Tectonic PGA = 0.40*g • •
Quang Ngai Brewery Sabeco Tectonic PGA = 0.08*g •
Quickscan Chemical plant (pipeline) Delftzijl, 2013
AkzoNobel Netherlands
Induced PGA = 0.43*g •
Quickscan salt pipeline Delfzijl-Midwolda, 2013
AkzoNobel Netherlands
Induced PGA = 0.43*g •
Radar Merauke in Timika, Merauke, Saumlakki
PT. Ebdesk Indonesia
Tectonic PGA = 0.30*g •
Rijeka Container Terminal, 2013-2014
Port of Rijeka Authority
Tectonic PGA = 0.40*g • •
Song Lam Brewery Sabeco Tectonic PGA = 0.11*g •
Vinamilk Dielac II Vinamilk Tectonic PGA = 0.08*g •
Wrigley Wrigley Tectonic PGA = 0.09*g •
Royal HaskoningDHV
Earthquake Engineering © HaskoningDHV Nederland B.V. 14
Project Client Earthquake characteristics
Late
ral fo
rce m
eth
od
Resp
on
se-s
pectr
um
an
aly
sis
Lin
ear-
ela
sti
c t
ime-h
isto
ry a
naly
sis
No
n-l
inear
ela
sti
c (
hyste
reti
c/d
issip
ati
ve)
tim
e-h
isto
ry a
naly
sis
Art
ific
al ti
me-h
isto
ry g
en
era
tio
n
Pu
sh
-over
an
aly
sis
So
il-s
tru
ctu
re-i
nte
racti
on
an
d liq
uefa
cti
on
an
aly
sis
Dis
pla
cem
en
t b
ased
desig
n
Deta
ilin
g a
cco
rdin
g t
o E
N 1
998
Azerbaijan Shah Deniz Project, 2003
Tekfen Construction
Tectonic PGA = 0.40*g •
Fujairah VLCC piping, 2014
Port of Fujairah Tectonic PGA = 0.12*g
•
Bukavu piping project, 2013
Heineken Tectonic PGA = 0.11*g •
Kisangani piping project, 2013
Heineken Tectonic PGA = 0.11*g •
Kigali piping project, 2012
Heineken Tectonic PGA = 0.11*g •
Adana Power Plant, piping, Turkey, 2001
Siemens Tectonic PGA = 0.50*g •
INFRASTRUCTURE
Ankara Pozanti Highway Engineering Structures, 2009
Tekfen Construction
Tectonic PGA = 0.40*g • •
Baku By-pass Highway Slope Stability Rehabilitation, 2008
Makyol-Copli JV Tectonic PGA = 0.40*g • •
Bursaray B line LRTS, Turkey, 2006
Bursa Metropolitian Municipality- Siemens-Tekfen-Tuvasas JV
Tectonic PGA = 0.40*g
• •
Dubai Iconic Bridge, 2008
Nakheel Tectonic PGA = 0.15*g • •
Istanbul Metro System, 90 km, 6 Lines, Turkey, 2009
Istanbul Metropolitian Municipality
Tectonic PGA = 0.40*g •
Royal HaskoningDHV
Earthquake Engineering © HaskoningDHV Nederland B.V. 15
Project Client Earthquake characteristics
Late
ral fo
rce m
eth
od
Resp
on
se-s
pectr
um
an
aly
sis
Lin
ear-
ela
sti
c t
ime-h
isto
ry a
naly
sis
No
n-l
inear
ela
sti
c (
hyste
reti
c/d
issip
ati
ve)
tim
e-h
isto
ry a
naly
sis
Art
ific
al ti
me-h
isto
ry g
en
era
tio
n
Pu
sh
-over
an
aly
sis
So
il-s
tru
ctu
re-i
nte
racti
on
an
d liq
uefa
cti
on
an
aly
sis
Dis
pla
cem
en
t b
ased
desig
n
Deta
ilin
g a
cco
rdin
g t
o E
N 1
998
Sabiha Gokcen International Airport Second Runway, 2011
ARUP Tectonic PGA = 0.40*g • •
The Bosphorus Rail Tube Crossing Istanbul Turkey, 2013
Avrasya Consulting
Tectonic PGA = 0.40*g •
Avcilar-Ambarli Landslide Remediation Project, 2005
Istanbul Metropolitian Municipality
Tectonic PGA = 0.40*g • •
Strait Crossing European Under Pass, 2011
Yapi Merkezi- SKEC JV
Tectonic PGA = 0.40*g • •
MARITIME
Ambon Bay Land Reclamation
PT. Karya Unggulan Gemilang
Tectonic PGA = 0.53*g •
Baku New International Sea Trade Port
Ministry of Transport
Tectonic PGA = 0.22*g • • •
Buyukcekmece Marina, Istanbul Turkey,2010
Marina Istanbul Tectonic PGA = 0.40*g • •
Callao Muelle Norte Port structures, Peru 2012
APMT Tectonic PGA = 0.43*g • • • • •
Candarli Port, Izmir Turkey, 2009
DLH-Altinok Consulting
Tectonic PGA = 0.60*g • • •
Damen Song Cam Shipyard
Damen Song Cam
Tectonic PGA = 0.13*g •
Dubai Palm Deira Marine Waterfront Structures, 2009
Nakheel Tectonic PGA = 0.15*g • • •
Royal HaskoningDHV
Earthquake Engineering © HaskoningDHV Nederland B.V. 16
Project Client Earthquake characteristics
Late
ral fo
rce m
eth
od
Resp
on
se-s
pectr
um
an
aly
sis
Lin
ear-
ela
sti
c t
ime-h
isto
ry a
naly
sis
No
n-l
inear
ela
sti
c (
hyste
reti
c/d
issip
ati
ve)
tim
e-h
isto
ry a
naly
sis
Art
ific
al ti
me-h
isto
ry g
en
era
tio
n
Pu
sh
-over
an
aly
sis
So
il-s
tru
ctu
re-i
nte
racti
on
an
d liq
uefa
cti
on
an
aly
sis
Dis
pla
cem
en
t b
ased
desig
n
Deta
ilin
g a
cco
rdin
g t
o E
N 1
998
GOA Shipyard GOA Shipyard Ltd Tectonic PGA = 0.16*g
•
Kargı Earth Dam Project, 2010, Turkey
Makyol Tectonic PGA = 0.40*g •
Lamongan shipyard 2010 – 2011
Tectonic, PGA = 0.30*g •
Land Reclamation Tanjung Bunga Makassar, Indonesia 2013
PT. Gowa Makassar Tourism Development
Tectonic, PGA = 0.20*g
•
Mersin Port, Turkey 2009
DLH-Altinok Consulting
Tectonic PGA = 0.45 g • •
Pluit City Land Development Project, Indonesia 2013
PT Muara Wisesa Samudra
Tectonic, PGA = 0.30*g •
Ruwals Takreer oil loading jetties, detailed design 2010-2011
GS E&C Corporation
Tectonic PGA = 0.11*g •
Toros Tarim Ceyhan Mobile Erection Area, 2010
Tekfen Construction
Tectonic PGA = 0.40*g • •
Table 2: recent project references of Royal HaskoningDHV with respect to earthquake engineering
Notes: g = gravity acceleration (9.8 m/s2) PGA = peak ground acceleration at surface level ULS = ultimate limit state (near collapse) SLS = serviceability limit state (serious damage) OBE = operation basis earthquake SSE = safe shutdown earthquake