'CAP reform: Impact analyses of the mid-term review July ...
193
European Commission Directorate-General for Agriculture MID-TERM REVIEW OF THE COMMON AGRICULTURAL POLICY JULY 2002 PROPOSALS IMPACT ANALYSES February 2003
Transcript of 'CAP reform: Impact analyses of the mid-term review July ...

European Commission
Directorate-General for Agriculture
MID-TERM REVIEW
OF THE
COMMON AGRICULTURAL POLICY
JULY 2002 PROPOSALS
IMPACT ANALYSES
February 2003

2

Table of contents
3
Table of contents
Foreword 9
List of acronyms and abbreviations 10
Executive summary 11
1. Introduction and summary results 11
2. Modelling framework and analytical approach 13
2.1 Modelling framework 13
2.2 Analytical approach 14
3. Simulation results 16
3.1 Consequences on the agricultural sector of EU-15 16
3.1.1 Arable crop sector 16
3.1.2 Rice 19
3.1.3 Meat production 20
3.1.4 Impact on agricultural income 22
3.1.5 Welfare analysis 23
3.1.6 Impact on environmental indicators 23
3.2 Consequences on the agricultural sector of EU-25 23
3.2.1 Impact of Agenda 2000 on EU-25 23
3.2.2 Impact of the MTR proposals on EU-25 24
Chapter I Impact assessment of the Mid-Term Review proposalson the agricultural markets and farm income in the EU-15,2004-2009 29
1.1 Modelling framework and methodological approach 33
1.2 EU policy scenarios 35
1.2.1 "Market measures" scenario 35
1.2.2 "Modulation" scenario 36
1.2.3 The full Mid-Term Review scenario 36
Table of contents
4
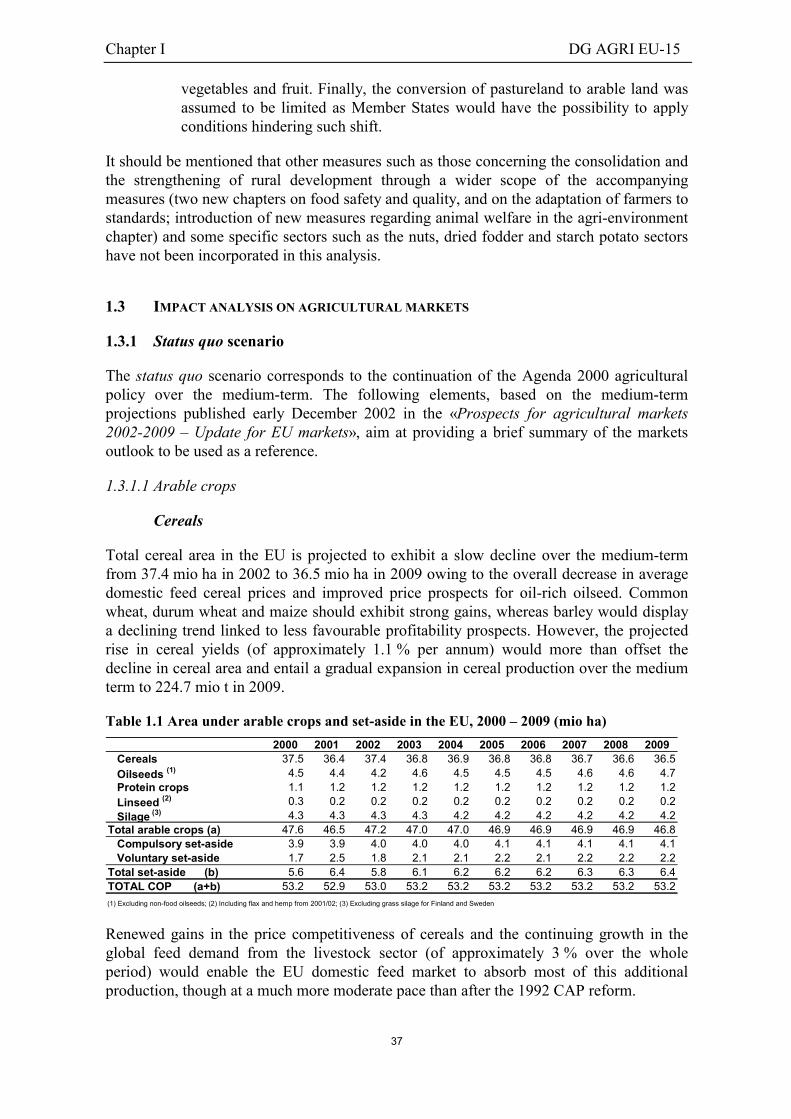
1.3 Impact analysis on agricultural markets 37
1.3.1 Status quo scenario 37
1.3.1.1 Arable crops 37
1.3.1.2 Rice 38
1.3.1.3 Meat and livestock 39
1.3.1.4 Milk and dairy products 40
1.3.2 Market measures scenario (MTR-1) 41
1.3.2.1 Arable crops 41
1.3.2.2 Rice 45
1.3.2.3 Meat and milk production 46
1.3.3 Modulation scenario MTR-2 46
1.3.3.1 Arable crops 46
1.3.3.2 Rice 47
1.3.3.3 Meat and milk production 48
1.3.4 Full Mid-Term Review scenario 48
1.4 Impact analysis on agricultural income 52
1.5 Conclusions 54
Chapter II Impact assessment of the Mid-Term Review proposals foragricultural markets and revenues in the EU-15 and in theEU-25 using the ESIM model 57
2.1 Introduction 62
2.2 Policy scenarios and hypotheses 62
2.3 Methodology 64
2.4 Impact analysis on agricultural markets 64
2.5 The impact of the different scenarios on agricultural revenuesin the EU-15 90

Table of contents
5
Chapter III FAPRI Analysis of the European Commission's Mid-TermReview proposals 93
3.1 Introduction 95
3.2 FAPRI models 96
3.3 Scenario assumptions 98
3.3.1 Cereals and oilseeds 98
3.3.2 Rice 99
3.3.3 Set-aside and energy crops 99
3.3.4 Decoupling and cross-compliance 99
3.3.5 Dynamic modulation 100
3.3.6 Market management 100
3.3.7 World markets 100
3.3.8 EU macroeconomic conditions 101
3.4 Model results 101
3.4.1 Crop production 101
3.4.2 Crop sector stocks 102
3.4.3 Feed use 102
3.4.4 Crop trades and prices 102
3.4.5 Livestock production 103
3.4.6 Beef stocks and use 104
3.4.7 Livestock prices 104
3.5 Concluding comments 105
Chapter IV Mid-Term Review proposal impact analysis withthe CAPRI modelling system 111
4.1 Executive summary 113
4.1.1 Agenda 2000 Policy Scenario 113
4.1.2 Mid-Term Review Proposal 113
4.1.3 Conclusions 114

Table of contents
6
4.2 The CAPRI modelling system 114
4.2.1 History of the model 114
4.2.2 General system layout 115
4.3 The reference run: Agenda 2000 119
4.3.1 Policy representation 120
4.3.2 Main results of the reference run 122
4.3.2.1 Development of crop aggregates 122
4.3.2.2 Development of cereals 123
4.3.2.3 Development of oilseeds 124
4.3.2.4 Developments in the meat, cattle and dairy sector 125
4.3.2.5 Impact analysis on agricultural income andEAGGF budget 127
4.4 Impact analysis of the Mid-Term Review Proposal 127
4.4.1 Introduction 127
4.4.2 Policy implementation in the MTR run 128
4.4.3 Main results of the Mid-Term Review scenario 130
4.4.3.1 Development of crop aggregates 130
4.4.3.2 Development of cereals and oilseeds 131
4.4.3.3 Development of fallow land and set-aside 132
4.4.3.4 Developments in the meat, cattle and dairy sectors 133
4.4.3.5 Impact analysis on agricultural income andEAGGF budget 135
4.4.3.6 Impacts on environmental indicators 136
4.5 Conclusions 137
Chapter V The CAP-reform Proposal of the Mid-term Review:Decoupling with strings attached 141
5.1 Introduction 144
5.2 Decoupling theory 146

Table of contents
7
5.3 Scenarios 148
5.3.1 Assumptions 149
5.3.2 Scenario Outcomes 150
5.3.2.1 Volumes 150
5.3.2.2 Trade 151
5.3.2.3 Agricultural income 153
5.3.2.4 EU-budget 153
5.4 The MTR scenario 154
5.4.1 Scenario implementation 155
5.4.2 Scenario outcomes 157
5.4.2.1 Volumes 157
5.4.2.2 Agricultural income 160
5.4.2.3 Welfare comparison 161
5.5 Conclusion 161
ANNEX I. Models for Decoupling 165
ANNEX II. Decomposition of Equivalent Variation 168
Chapter VI Impact Analysis of the European Commission's proposal underthe Mid-Term Review of the CAP using the CAPSIM model 171
6.1 Introduction 173
6.2 Scenario assumptions 174
6.2.1 Scenario assumptions: reference run 174
6.2.2 Scenario assumptions: MTR run 177
6.3 Simulation results 180
6.3.1 Activity levels 180
6.3.2 Markets 184
6.3.3 Welfare 188
6.4 Concluding remarks 190

8
Foreword
9
Foreword
In its Communication on the Mid-Term Review (MTR) of the Common AgriculturalPolicy (CAP) of July 2002, the European Commission provided an assessment of theevolution of the reform process of the Common Agricultural Policy since 1992. Even ifmuch has been achieved, gaps still exist between the objectives set for the CAP and itscapacity to deliver what the society expects. As a consequence, a set of proposals for theadjustment of the CAP has been put forward.
This publication brings together the findings of a series of impact analyses of these Mid-Term Review proposals for the agricultural markets and income for the European Union.Four of these studies were carried out by independent experts, namely the Unit of theFood and Agricultural Policy Research Institute (FAPRI) at the University of Missouri(USA), the University of Bonn, and the Centre for World Food Studies of the Universityof Amsterdam (CWFS) and the Netherlands Bureau for Economic Policy Analysis (CPB)in The Hague. Two analyses have been conducted by the Commission services(Directorate General for Agriculture - DG AGRI) using the internal tools available forsuch impact assessment.
Although the quantitative results may differ somewhat across these analyses, theygenerally converge in their main findings on the impact of the Commission proposals onagricultural markets and farm income. An overview of the main results of these studies isgiven in the executive summary of this report.

Abbreviations
10
List of acronyms and abbreviations
AWU Annual Work Unitbio billionBSE Bovine Spongiform EncephalopathyCAP Common Agricultural PolicyCAPMAT CAP Modelling and Accounting ToolCEC Commission of the European CommunitiesCEECs Central and Eastern European CountriesCMO Common Market OrganisationCOP Cereals – Oilseeds – PulsesCPI Consumer Price IndexCSE Consumer Support EstimateDG AGRI European Commission, Directorate-General for AgricultureEAA Economic Accounts for AgricultureEAGGF European Agricultural Guidance and Guarantee FundEU European UnionEUR Euro currencyEurostat Statistical Office of the European CommunitiesFADN Farm Accountancy Data NetworkFAO Food and Agriculture Organisation (of the United Nations)FAPRI Food and Agricultural Policy Research InstituteGDP Gross Domestic ProductGVA Gross Value Addedha hectarekg kilogramLFA Less Favoured AreasMFSS Medium-term Forecast and Simulation Systemmio millionMS Member StateNUTS Nomenclature of Statistical Territorial UnitsNVA Net Value AddedOECD Organisation for Economic Co-operation and DevelopmentPSE Producer Support EstimateSMP Skimmed Milk Powder$ US dollart tonneUAA Utilised Agricultural AreaUS United States of AmericaWTO World Trade Organisation
Executive summary
11
EXECUTIVE SUMMARY
1. INTRODUCTION AND SUMMARY RESULTS
The Commission Communication on the Mid-Term Review (MTR) of the CommonAgricultural Policy (CAP) of July 2002 reflected the specific tasks given to the EuropeanCommission by the Berlin Summit to review agricultural policy in the main arable cropand livestock sectors, and the conclusions of the Göteborg Summit to guarantee that EUagricultural policy promotes sustainable development.
The medium-term economic consequences of these July 2002 MTR proposals for theagricultural sector of the European Union have been evaluated in six separate studies. Thefirst two studies have been carried out by the Commission services (Directorate Generalfor Agriculture - DG AGRI) on the basis of two in-house models. The first modelling toolhas been regularly used to produce the medium-term projections of EU-15 agriculturalmarkets, whereas the second model –the ESIM model- has been specifically developed andused to evaluate the impact of the EU enlargement. This second model allows sheddingsome light on the impact of the MTR proposals on the agricultural markets of an enlargedEU.
The four other studies have been carried out by external organisations at the request of theEU Commission. The first external impact assessment study has been conducted by theunit of the Food and Agricultural Policy Research Institute (FAPRI) at the University ofMissouri (USA). The second external study, carried out by the University of Bonn, hasbeen undertaken at regional level based on the CAPRI modelling system.
The Centre for World Food Studies of the University of Amsterdam (CWFS) and theNetherlands Bureau for Economic Policy Analysis (CPB) in The Hague jointly realised thethird analysis using the CAPMAT model of the EU agricultural sector. Finally, a furtherimpact assessment has been provided by the University of Bonn based on the CAPSIMmodel, which operates at national level.
Although the quantitative results for the EU-15 differ somewhat across the impact studies,they generally converge with respect to the overall direction of change resulting from theproposals:
� Even if the level of support to the farm sector is not projected to change significantly,all the analyses show that the proposed orientation towards a more competitive, market-oriented and sustainable agriculture -through the proposed market reforms, an improvedbalance of support and the strengthening of rural development policy, and the movetowards more decoupled, non-commodity specific policy instruments with theintroduction of a single farm payment scheme- should contribute to an improvedallocation of resources and lead to greater income transfer efficiency.
� They also project that the MTR proposals would entail adjustment of production inseveral commodity sectors, notably those where production are strongly influenced bythe level of support and by the coupled instruments in place (beef and sheep sectors)and/or which display unsustainable structural imbalances (rye and rice sectors).
Executive summary
12
� The MTR proposals are also expected to contribute to the improvement of thecompetitiveness of the cereal sector, as lower support price levels should increase theadjustment capacity of the sector to future developments and opportunities on both theinternal and external markets. These adjustments are found to take place with onlylimited production abandonment and to have a rather favourable impact on the incomeof the agricultural sector.
When expressed in terms of deviation from a status quo scenario corresponding to thecontinuation of the Agenda 2000 CAP reform, the main quantitative results from theseimpact analyses on the medium-term developments of agricultural markets and income forEU-15 can be summarised as follows:
� A reduction in total cereal production as cereal area would be constrained by the landallocated to energy crops, the rise in voluntary set-aside and the changes in the supportlevel in this sector. Rye and durum wheat would be the cereals most affected. Part of thenegative impact on total cereal supply of the reduction in cereal area would becompensated by higher projected growth in cereal yields. Total cereal consumptionwould in turn exhibit slower growth in the face of lower availability, sustained pricesand a projected reduction in feed demand from the animal sector (linked to the expectedfall in beef production which would only be partially compensated by the slight increasein white meat production). These developments would also affect the level of net EUcereal exports, which would display a significant, fall. Total cereal stocks would dropsignificantly, with public stocks of cereals becoming non-existent.
� As far as land allocation is concerned, food oilseed area is generally projected to fall,whereas energy crops would develop on around 0.7-0.9 mio ha previously mainlyallocated to cereals. Silage area would be reduced against Agenda 2000 levels in theface of the decline in beef production, greater incentives to shift towards more extensiveanimal production methods and competition from other fodder crops area. Finally,voluntary set-aside (abandonment of production) would rise by 0.4 to 0.7 mio ha assome land is foreseen to be taken out of production owing to low profitability.
� The implementation of the decoupling scheme would have a significant impact on theanimal sector, notably in the beef and sheep sector as it would favour the extensificationof production systems. Combined with a small increase in feed prices, it would entail adecline in beef production, estimated at between 3 % and 8 % by 2009. Sheep outputwould also fall by between 3 % and 6 % over the medium-term. Lower beef and sheepsupply would trigger a rise in EU producer prices of some 6-8 % and 8-12 %respectively by 2009 and would result in a fall in domestic consumption of some 1-3 %and 3 % respectively. Net EU beef exports would show a significant decline.
� Over the medium term, the increase in prices and the fall in consumption expected inthe beef and sheep sectors would favour pig and poultry consumption. This demand sideeffect would outweigh the negative impact of higher feed cereal prices on thecompetitiveness of the latter two sectors, which would display a small expansion inproduction and consumption.
� The MTR proposals would display a rather favourable, though limited impact on theincome of the agricultural sector as compared to the baseline: all the impact studiesshow that the reduction in the level of agricultural production and the implementation ofdynamic modulation would be broadly compensated by the resulting price rises (and the
Executive summary
13
� increase in the level of aids in the arable crops and rice sectors). Given that most of thesavings from modulation (more than 3 bio EUR by 2009) can be assumed to return tothe agricultural sector through the second pillar measures, the overall income of theagricultural sector should rise. However, diverging trends across the various commoditysectors and regions may be expected, with most favourable developments projected inthe animal sector (notably the beef and pork sectors, which should display strong priceincreases).
The MTR proposals are also expected to generate a significant and sustainableimprovement in the medium-term perspectives of the agricultural sector of the EU-25.Decoupling in the EU-25 would produce similar trends to those in the EU-15, asproducers’ decisions would be driven by market considerations rather than by themaximisation of direct payments. The balance of the rye and beef markets in the EU-25would significantly improve. The MTR proposals would enable the significant rise inagricultural income projected in the new Member States after enlargement to be secured.
2. MODELLING FRAMEWORK AND ANALYTICAL APPROACH
2.1. Modelling framework
These impact analyses of the MTR proposals on the agricultural sector rely on a set ofmodelling tools. The first DG AGRI analysis has been undertaken on the basis of a set ofpartial equilibrium, dynamic models covering the most important arable crops, animal anddairy products in the EU. These models are used annually to develop the outlook foragricultural markets and to form the baseline for policy simulations. The second DG AGRIstudy has been conducted with the ESIM model, which is a price driven, world, multi-country non-linear, agricultural sector model, with an extended policy representation.Although originally designed to analyse the impact of EU enlargement to Eastern Europe,it has been further developed and updated to assess the impact of the MTR proposals.
The FAPRI models used in this exercise consist of a set of non-spatial partial equilibriummodels for major agricultural markets used every year to develop projections of worldagricultural markets which form the baseline for policy analysis of the US Congress. Thesemodels estimate production, consumption, stocks, trade and prices of major tradingcountries and agricultural commodities. This specific FAPRI-Missouri study used adetailed EU module which is of a similar general structure to the standard FAPRI modelsand which covers the most important EU policy instruments.
The CAPRI modelling system, whose development has been co-ordinated by theUniversity of Bonn, is designed as a projection and simulation tool for the agriculturalsector based on a physical consistency framework, economic account principles and adetailed policy representation. The model consists of separate supply and market modules,which are interactively coupled and operates at NUTS II level. It allows evaluating theimpact of policy changes on agricultural markets, producers' income, the EAGGF budget,consumer welfare and some environmental indicators.
The CAP Modelling and Accounting Tool (CAPMAT) performs dynamic policysimulations on the basis of an analytical model of the applied general equilibrium type thatgenerates developments in supply, demand and cross-commodity substitution. It

Executive summary
14
incorporates the CAP instruments and farmers’ behavioural responses to policy changesthrough agricultural supply models at national and EU level.
The CAPSIM model is being currently developed by the University of Bonn for Eurostat(the Statistical Office of the European Communities). This partial equilibrium modelallows forecasting and simulating policy changes on area allocation, production,consumption and income variables of the agricultural sector. It consists of a supplycomponent and a demand component dynamically linked in an overall system thatdetermines price formation.
2.2. Analytical approach
In all models, the impact of the MTR proposals is analysed for the year 2009 withreference to a status quo policy situation. The status quo scenario corresponds to thecontinuation of the Agenda 2000 agricultural policy over the medium-term. However,these status quo scenarios vary substantially across studies with regards not only to somekey underlying assumptions concerning the trade policy framework, the macro-economicenvironment (notably GDP growth, inflation and the EUR/$ exchange rate) and themedium-term developments on world agricultural markets, but also to the overall marketdevelopments projected for some specific sectors.
Therefore, for comparative purposes, the simulation results are presented in the form ofdeviations from the status quo scenario. This allows to depict the likely impact of the MTRproposals while reducing (though not avoiding) any potential bias generated by the modelsand their starting point, when both status quo scenario and the MTR proposals situationsare compared in terms of absolute levels. Furthermore, results should not be interpreted aschanges relative to the current situation in 2003.
The policy scenario examined corresponds to the MTR measures proposed in theCommunication of the European Commission published in July 2002. The main measureshave been summarised and presented in annex, showing a comparison with the current(status quo) policy situation.
It should be mentioned that the measures concerning the consolidation and thestrengthening of rural development through a wider scope of the accompanying measures(two new chapters on food safety and quality, and on the adaptation of farmers tostandards; introduction of new measures regarding animal welfare in the agri-environmentchapter) and those relative to some specific sectors such as the nuts, dried fodder andstarch potato sectors have not been incorporated in these analyses.
The impact studies on the agricultural sector focus on the sectors mostly concerned by theMTR proposals, namely the arable crops and meat production sectors, with specificreference to area allocation, the main market variables (production, consumption, externaltrade, stocks and prices) and income changes.
Executive summary
15
The Modelling of Decoupling
The promotion of more market-oriented and sustainable agriculture constitutes one of theobjectives of the Mid-Term Review proposals. It is achieved through the introduction ofthe concept of decoupling which, with the granting of a single income payment per farmreplacing all existing (or newly introduced) direct payments -with the exception of somepremia in some specific sectors- can be expected to have a significant impact onproducers’ behaviour, as the latter would increasingly base their production decisions onmarket signals (i.e. profitability expectations). At the same time, these new decoupledpayments are linked to the respect of statutory environmental, food safety, animal healthand welfare and occupational safety standards (cross-compliance).
These decoupled payments may be expected to generate significant adjustments in theproduction structure of the agricultural sector, although factors such as social andeconomic inertia, the maintenance of some crops for agronomic purposes, the participationin various schemes (e.g. agri-environmental programmes), and the eligibility to LessFavoured Area payments, may mitigate the pace and magnitude of these adjustments.Changes could take place in the production mix, in the production intensity and in farmstructure, and could lead to abandonment of agricultural activities.
In spite of the difficulty to provide a quantitative assessment of the full impact ofdecoupling with the modelling tools currently available, the analytical studies attempted tocapture these elements and quantify their effect on the agricultural sector. Yet, themodelling of this new policy instrument, i.e. the mathematical representation in themodelling tools of the way in which the single farm payment is implemented andinfluences producer decisions, has been carried out in different ways across studies which,to some extent, may have influenced the projected production patterns.
The decoupled payments have been considered in DG AGRI analyses to operate as lumpsum transfers with no impact on production decisions of farmers. However, the cross-compliance requirements, the respect of good agricultural practices, the eligibilityconditions attached to the decoupling scheme as well as agricultural legislation in MemberStates have been assumed to constrain the shift between activities, notably betweengrassland and arable land production and between agricultural activities and abandonmentof production. In the FAPRI study, decoupled payments have been assumed to still retainsome production-inducing effect, assumed at some 30 % of the supply-inducing effect ofthe more coupled payments they replace -that is broadly in line with FAPRI’s assumptionsfor the US farm programme payments.
The impact assessment of CWFS/CPB considered that the decoupled payments wouldoperate as a combination of a lump sum transfer and a (lower) flat area premium onaccount of maintenance requirements, eligibility, cross-compliance and the tight link toland in case of transfer. Finally, the two studies from the University of Bonn have treatedthe single farm payment as a uniform payment at national or regional level, i.e. a uniformnon-crop-specific coupled payment. This could entail a redistribution of support betweencrops and farms, which would overestimate the impact of decoupling on land allocation,notably between activities eligible and those not eligible under present policies.
Executive summary
16
3. SIMULATION RESULTS
3.1. Consequences on the agricultural sector of EU-15
3.1.1. Arable crop sector
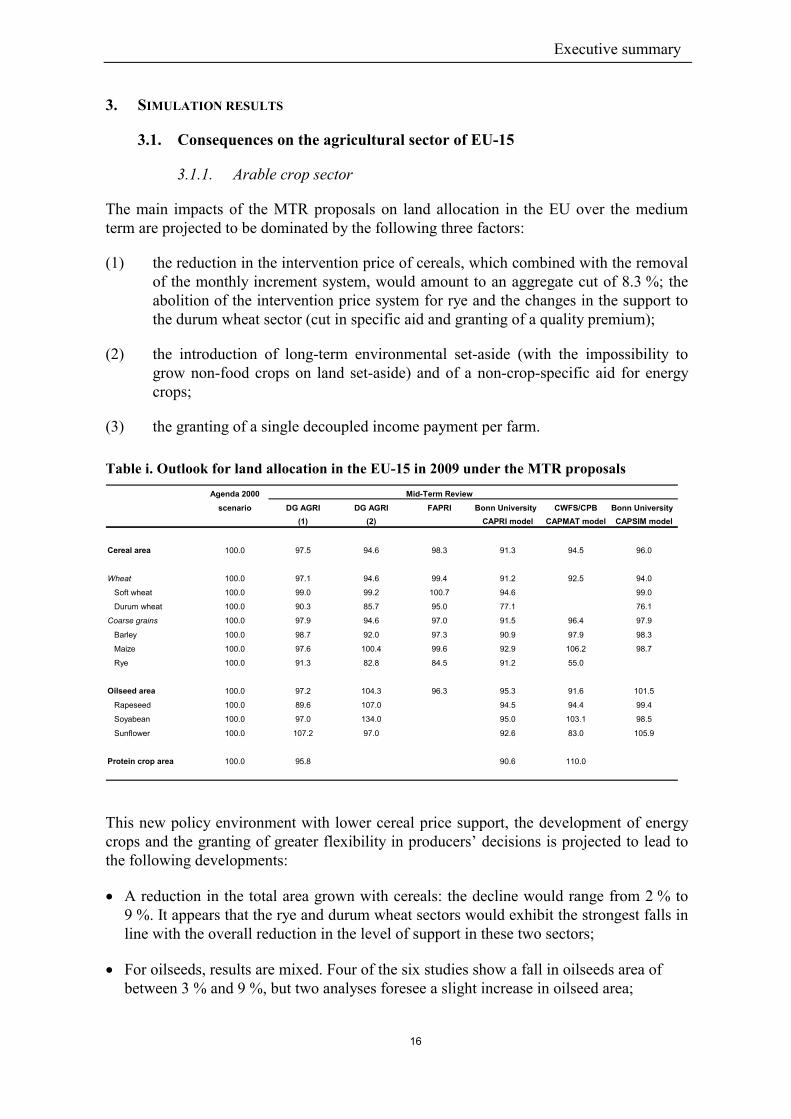
The main impacts of the MTR proposals on land allocation in the EU over the mediumterm are projected to be dominated by the following three factors:
(1) the reduction in the intervention price of cereals, which combined with the removalof the monthly increment system, would amount to an aggregate cut of 8.3 %; theabolition of the intervention price system for rye and the changes in the support tothe durum wheat sector (cut in specific aid and granting of a quality premium);
(2) the introduction of long-term environmental set-aside (with the impossibility togrow non-food crops on land set-aside) and of a non-crop-specific aid for energycrops;
(3) the granting of a single decoupled income payment per farm.
Table i. Outlook for land allocation in the EU-15 in 2009 under the MTR proposalsAgenda 2000 Mid-Term Review
scenario DG AGRI DG AGRI FAPRI Bonn University CWFS/CPB Bonn University(1) (2) CAPRI model CAPMAT model CAPSIM model
Cereal area 100.0 97.5 94.6 98.3 91.3 94.5 96.0
Wheat 100.0 97.1 94.6 99.4 91.2 92.5 94.0
Soft wheat 100.0 99.0 99.2 100.7 94.6 99.0
Durum wheat 100.0 90.3 85.7 95.0 77.1 76.1
Coarse grains 100.0 97.9 94.6 97.0 91.5 96.4 97.9
Barley 100.0 98.7 92.0 97.3 90.9 97.9 98.3
Maize 100.0 97.6 100.4 99.6 92.9 106.2 98.7
Rye 100.0 91.3 82.8 84.5 91.2 55.0
Oilseed area 100.0 97.2 104.3 96.3 95.3 91.6 101.5
Rapeseed 100.0 89.6 107.0 94.5 94.4 99.4
Soyabean 100.0 97.0 134.0 95.0 103.1 98.5
Sunflower 100.0 107.2 97.0 92.6 83.0 105.9
Protein crop area 100.0 95.8 90.6 110.0
This new policy environment with lower cereal price support, the development of energycrops and the granting of greater flexibility in producers’ decisions is projected to lead tothe following developments:
� A reduction in the total area grown with cereals: the decline would range from 2 % to9 %. It appears that the rye and durum wheat sectors would exhibit the strongest falls inline with the overall reduction in the level of support in these two sectors;
� For oilseeds, results are mixed. Four of the six studies show a fall in oilseeds area ofbetween 3 % and 9 %, but two analyses foresee a slight increase in oilseed area;

Executive summary
17
� Energy crops would develop on an area estimated to range between 0.7 and 0.9 mio hapreviously allocated to arable crops (to a large extent cereals)1;
� Silage area is expected to decline by some 5 to 7 % in line with the projected decline inbeef production, greater incentives to shift towards more extensive animal productionmethods and competition from other fodder crops area;
� Voluntary set-aside (i.e. abandonment of land) would increase in all studies. However,this rise in voluntary set-aside would remain limited to approximately 0.4 mio to0.7 mio ha.
The development of energy crops and the rise in voluntary set-aside would result in a fallin total cereal production which would range in most studies at between 1% and 4 % by2009/10 (i.e. between 1 and 9 mio t) as yields would increase on account of the decrease inlow-yielding, marginal land and higher price perspectives, and would thus partiallycompensate the decline in area harvested. Only the CAPRI model shows a morepronounced fall in cereal production.
Table ii. Outlook for cereal production in 2009 under the MTR proposalsAgenda 2000 Mid-Term Review
scenario DG AGRI DG AGRI FAPRI Bonn University CWFS/CPB Bonn University(1) (2) CAPRI model CAPMAT model CAPSIM model
Total cereals 100.0 98.0 99.6 99.1 92.6 95.5 97.1
Wheat 100.0 98.2 99.9 100.2 93.4 92.4 96.8
Soft wheat 100.0 98.9 101.2 100.6 94.5 98.5
Durum wheat 100.0 90.5 84.2 96.2 80.5 81.1
Coarse grains 100.0 97.8 99.2 97.7 91.6 98.9 97.5
Barley 100.0 98.7 97.5 97.6 90.7 97.9 96.6
Maize 100.0 97.7 100.0 99.7 92.8 106.2 98.7
Rye 100.0 91.2 57.7 84.4 92.7 55.0
Rye and durum wheat are found to display the strongest fall in production levels. However,even if all studies agree on the direction of change, they exhibit wide differences regardingthe magnitude of the MTR impact on these sectors2. Less pronounced developmentsprojected for high-yielding cereals, such as soft wheat and maize, would somewhatmitigate the overall decline in cereal production.
Total cereal consumption would in turn decline slightly as most studies expect a falllimited to 1 % (or less than 2 mio t) in the face of lower availability, higher prices and aprojected reduction in feed demand from the animal sector. One analysis (FAPRI) shows asmall increase in cereal consumption linked to the stronger fall in cereal prices projected in
1 These projections for energy crops have been established based on the assumption that the tax incentives
currently existing in EU Member States would prevail over the simulation period.
2 This is notably the case for the CAPSIM and CAPRI model results which modelled decoupled paymentsas a uniform non-crop specific coupled payment, thus overestimating the impact for crops such as durumwheat with a high share of direct payments in income.

Executive summary
18
this analysis, while CAPRI displays a marked drop in cereal consumption (owing to thefall in beef production and greater competition from fodder products).
Table iii. Outlook for cereal consumption in 2009 under the MTR proposalsAgenda 2000 Mid-Term Review
scenario DG AGRI DG AGRI FAPRI Bonn University CWFS/CPB Bonn University(1) (2) CAPRI model CAPMAT model CAPSIM model
Total cereals 100.0 99.5 100.6 99.9 96.7 99.1 98.8
Wheat 100.0 100.1 99.0 99.6 97.5 99.4 98.9
Soft wheat 100.0 100.3 99.8 97.5 99.2
Durum wheat 100.0 99.0 97.9 97.4 96.8
Coarse grains 100.0 98.8 101.9 100.2 95.9 99.0 98.7
Barley 100.0 100.0 104.4 100.2 96.0 98.7
Maize 100.0 97.7 99.6 99.7 95.6 99.1
Rye 100.0 100.9 112.1 105.0 98.1
In spite of a modest recovery on world commodity markets, lower availability andsustained domestic prices would affect the level of EU exports, which would display asignificant decline over the medium term. EU cereal imports would also slightly increaseowing to the reduction in the EU’s border protection linked to the cut in support price3.
Table iv. Outlook for cereal net exports in 2009 under the MTR proposalsAgenda 2000 Mid-Term Review
scenario DG AGRI DG AGRI* FAPRI Bonn University CWFS/CPB* Bonn University*(1) (2) CAPRI model CAPMAT model CAPSIM model
Total cereals 100.0 88.6 89.2 94.1 71.6 74.3 86.3
Wheat 100.0 85.4 105.8 100.6 74.7 74.8 87.9
Soft wheat 100.0 91.2 101.5 82.2 95.6
Coarse grains 100.0 95.6 73.9 64.3 67.9 104.8 82.0
Barley 100.0 95.5 94.4 79.5 71.9 71.3
Maize 100.0 100.0 2865.0 100.0 16.1 93.6
* Exportable surplus
The drop in net cereal exports is estimated to range between 6 % and 14 % in four studies,whereas two analyses display more pronounced falls at slightly more than 25 % (CAPRIand CAPMAT models). These large differences are due to the small absolute level and tothe nature of the underlying variable (some studies forecast net export levels, others theexportable or production surplus). They also reflect the different projections for the EUcereal production pattern and for the world cereal market outlook. In any case, all studiesconverge to show a marked decline in the exportable surplus in the rye and durum wheatsectors.
After an initial fall linked to the existence of large public stocks and to the overallreduction in cereal support price, cereal prices would show a gradual recovery over themedium term supported by the more favourable trends on world cereal markets4 and lower
3 Note that this analysis does not take account of the latest cereal import regime negotiated with Canada
and the US.
4 Lower EU net exports would also contribute to some modest increase in world cereal prices.

Executive summary
19
production levels in the EU. Common wheat and durum wheat are generally found to trendabove status quo levels as these cereals would benefit from slightly lower production in theEU and supportive world market developments.
Table v. Outlook for cereal prices in 2009 under the MTR proposalsAgenda 2000 Mid-Term Review
scenario DG AGRI DG AGRI FAPRI Bonn University CWFS/CPB Bonn University(1) (2) CAPRI model CAPMAT model CAPSIM model
Soft wheat 100.0 100.7 96.1 100.5 102.8 100* 100.1
Barley 100.0 100.9 107.6 99.5 98.9 100.3
Maize 100.0 100.0 83.3 100.8 101.8 99.9
Rye 100.0 98.7 76.3 90.7 99.1
* & ** average price for wheat and for coarse grains respectively.
102.2**
The impact of lower domestic supply is generally found to outweigh the negative effects oflower feed demand from the livestock sector on coarse grain prices, with barley and maizeprices developing slightly above status quo levels by 2009. There again, the magnitude ofchanges are strongly influenced by baseline levels and the projected production patterns.However, the outlook for coarse grain prices would still depend critically on therelationship between domestic and world market prices and on the Commission marketmanagement policy, notably for rye.
After a short-run fall linked to the abolition of the intervention price system and to therelease of public stocks, rye prices would trend upwards over the medium term asproduction would decline and domestic consumption would strongly increase in view of itsimproved price-competitiveness. By 2009 however, rye prices would still develop at levelssignificantly below status quo levels.
The overall reduction in the production level would enable the balance of EU cerealmarkets5 to be restored, with total stocks dropping by some 10 mio t by 2009 and no publicstocks. The EU rye market would display the greatest improvement as lower prices wouldreduce production volume while supporting domestic consumption, thus allowing toabsorb the accumulated surplus of rye in public stocks by 2004 and ensuring balance in themarket.
The reduced area allocated to oilseeds in the EU is found in most studies to outweigh thesmall projected yield increase and a stagnating feed demand to trigger a slight rise inoilseed net imports and a modest rise in EU and world prices.
3.1.2. Rice
Quantitative estimates regarding the impact of the MTR proposals on the EU rice sectordiffer widely in their magnitude. The size of the sector may have affected its coverage in
5 The projected improvement in the overall balance of the EU cereal market remains strongly conditioned
by the existence of a mandatory system of land set-aside, which remains set at a level corresponding tothe current 10 % reference rate. Any changes in this reference rate could significantly modify the overallpicture of the cereal market as given above.

Executive summary
20
the modelling tools currently available6. The reduction of around 50 % in the support pricefor rice is projected to translate into a very sharp fall in EU domestic prices towards worldmarket levels, which would boost EU rice competitiveness while reducing theattractiveness of the EU market as an export market.
The fall in prices is however accompanied by the granting of direct payments, which areforeseen to maintain the production potential of the EU rice sector. Estimates of the drop intotal EU rice production range between 1 % (FAPRI) and 29 % (CAPMAT).
In contrast, the fall in market prices would support rice consumption, which wouldincrease strongly relative to status quo levels. Although lower supply combined with risingdemand could set the stage for a surge in net imports over the short term, the greatercompetitiveness of the EU rice would allow to prevent EU rice imports and public stocksfrom rising to unsustainable levels by 2009, when the EBA agreement is fullyimplemented. By the end of the decade, total EU rice imports would stand at some one-third to one-tenth of the projected level were the current market organisation to becontinued.
Table vi. Outlook for the rice sector in 2009 under the MTR proposalsAgenda 2000 Mid-Term Review
scenario DG AGRI DG AGRI FAPRI Bonn University CWFS/CPB Bonn University(1) (2) CAPRI model CAPMAT model CAPSIM model
Area 100.0 90.3 96.9 74.0
Production 100.0 86.7 98.8 71.0
Consumption 100.0 110.7 104.0
Net imports 100.0 43.2 47.9 154.1
Ending stocks 100.0 9.8 33.3 100.0
Producer prices 100.0 50.0 58.6 50.0
3.1.3. Meat production
The implementation of the decoupling scheme is foreseen to have a significant impact onparts of the livestock sector. Combined with a small increase in feed prices, decouplingwould lead to a decline in beef and sheep production, as it would favour the extensificationof production systems. After a short-run increase resulting from the herd size reductioneffect, beef output would decline progressively to stand some 3 % to 8 % below baselinelevels by 2009.
The suckler cow sector would appear to be the most affected (with a projected fall in herdsize of more than 10 %) as it would display the highest rate of output not covering variablecosts in the beef sector (with the premium playing a major role in determining producer’sbehaviour). Similar trends are foreseen for the sheep sector, where output would drop bybetween 3 % and 6 %.
6 Furthermore, stocks are assumed to remain constant in the CAPMAT study, thus hindering a
comprehensive analysis of the impact of the proposals on the balance of the rice market, notably withrespect to the level of public stocks.

Executive summary
21
Lower beef availability would trigger a rise in EU producer prices of some 6 % to 8 % by20097 and would result in a fall in domestic consumption of between 1 % to 3 %8. Thiswould in turn entail a gradual decline in net EU beef exports: although two studies showthat the EU would remain a net beef exporter, the four other analyses indicate that the EUwould become a net importer of beef9. Sheep consumption is also found to decline in theEU by most of the studies, with producer prices rising between 8 % and 12% by 2009.
Table vii. Outlook for the beef sector in 2009 under the MTR proposalsAgenda 2000 Mid-Term Review
scenario DG AGRI DG AGRI FAPRI Bonn University CWFS/CPB Bonn University(1) (2) CAPRI model CAPMAT model CAPSIM model
Production 100.0 97.2 94.3 96.9 93.6 96.9 92.4
Consumption 100.0 98.1 97.4 98.3 99.2 100.0 97.0
Net exports* 100.0 40.6 0.3** 33.3 (19.1) (184)** (140.8)**
Producer prices 100.0 107.4 106.7 108.1 105.6 100.0 107.7***
* ( ) net imports ; ** Exportable surplus; *** DG AGRI estimate from CAPSIM consumer price projections.
The short run impact in the pig and poultry sectors is expected to be dominated by theeffect of the fall in beef producer prices on the demand side which would more thancompensate the impact of lower cereal feed prices and should maintain these two sectorsunder downwards pressure.
Table viii. Outlook for the pork and poultry sectors in 2009 under the MTR proposalsAgenda 2000 Mid-Term Review
scenario DG AGRI DG AGRI FAPRI Bonn University CWFS/CPB Bonn University(1) (2) CAPRI model CAPMAT model CAPSIM model
Pork Production 100.0 100.3 103.9 100.5 100.1 99.8 100.4
Consumption 100.0 100.3 104.2 100.5 100.1 99.8 100.4
Exports 100.0 99.6 100.0* 99.9 100.7 100.0* 100.0*
Producer prices 100.0 104.5 96.9 101.0 100.6 101.6 101.1**
Poultry Production 100.0 100.4 100.4 100.6 100.2 100.2 100.4
Consumption 100.0 100.4 100.4 100.7 100.3 100.2 100.4
Exports 100.0 100.0 100.0* 99.3 98.0 100.0* 100.0*
Producer prices 100.0 99.8 98.4 101.1 100.6 98.5 101.1**
* Exports correspond to exportable surplus; DG AGRI estimate from CAPSIM consumer price projections
However, over the medium term, the increase in beef prices and the fall in beefconsumption would favour pig and poultry consumption. This demand side effect would 7 Given that a significant part of beef production is produced on farms where market receipts only partially
cover variable costs, the projected rise in market prices contributes to mitigate the negative impact ofdecoupling on the level of production in the beef sector.
8 Results from the CAPMAT model do not capture any demand response from the beef sector as domesticprices are assumed to remain fixed at support level in the CWFS/CPB analysis.
9 The magnitude of the medium-term impact on the beef market depends critically on the Commissionmarket management. If the Commission were to reduce significantly the level of subsidised exports, theincrease in beef prices would be lower, the impact on the pork and poultry mitigated, whereas the fall inbeef output would turn stronger.

Executive summary
22
outweigh the negative impact of higher feed cereal prices on the competitiveness of thetwo sectors, which would display a small expansion in production and consumption.
The MTR proposals are projected to display only a marginal impact on the dairy sectorover the medium term, with a very small impact feeding through from developments on thesheep and goat sector and cereal feed prices. Dairy cow numbers would remain essentiallyunchanged, as the quota would continue to drive milk production and the size of the dairycow herd in the EU.
3.1.4. Impact on agricultural income
All studies display a rather favourable impact of the MTR proposals on the development ofagricultural income. This would result from the combination of the following twodevelopments:
(1) A relative stability in the overall income of the agricultural sector (excluding ruraldevelopment funds coming from the dynamic modulation) as compared to thesituation under Agenda 2000. The reduction in the level of production and theimplementation of dynamic modulation are foreseen to be broadly compensated bythe rise in producer prices for many agricultural products, the increase in the levelof direct payments in the arable crop and rice sectors, and the savings in the level ofinput costs. Estimates of this impact would range from –1.3 % to –0.1 %. The0.8 % increase shown in the CWFS/CPB study includes income generated by non-agricultural activities10;
(2) The savings generated each year by the dynamic modulation would return to a largeextent to the agricultural sector –estimated in DG AGRI analyses at approximately80 %- through the rural development measures (estimated at more than 3 bio EURby 2009).
Graph i. Outlook for agricultural income in the EU-15 in 2009 under the MTR proposals,relative to the status quo scenario
-1 .5 %
-1 .0 %
-0 .5 %
0 .0 %
0 .5 %
1 .0 %
1 .5 %
2 .0 %
D G A G R I(1 )
D G A G R I(2 )
B o n n U n iv e r s i tyC A P R I m o d e l
C W F S /C P BC A P M A T m o d e l
B o n n U n iv e r s i tyC A P S IM m o d e l
E x c lu d in g r u r a l d e v e lo p m e n t fu n d s
In c lu d in g r u r a l d e v e lo p m e n t fu n d s
10 However, this study also assumes that some payments leave the agricultural sector when the land is used
for non-agricultural activity

Executive summary
23
As a result, the overall impact on the income situation of the agricultural sector wouldbecome positive with a rise estimated at between 1.1 % and 1.7 % by 2009 according tothe DG AGRI studies.
Diverging income impacts are projected across the various commodity sectors andproduction regions. Most favourable developments are expected to be found in the animalsector as the projected price increases would trigger a significant rise in market revenues,which would more than compensate the decline in production volumes. By contrast,income development in the cereal sector may reasonably be expected to be affected by thereduction in the production potential and by the implementation of the dynamicmodulation.
3.1.5. Welfare analysis
Three studies performed a welfare analysis based on equivalent variation. They all show anet economic benefit from the MTR proposals estimated at between 0.1 bio EUR and2.2 bio EUR by 2009. They all found that the loss in consumer welfare triggered by the risein consumer prices would be outweighed by the savings in budgetary expenditure, whereasagricultural producer income would remain broadly stable11.
3.1.6. Impact on environmental indicators
According to the CAPRI study, global warming emissions, measured as CO2 equivalentsand linked to mineral fertiliser use, methane emissions from ruminants and carbon dioxidelinked to energy use, are projected to decrease by 5 % in global warming potentialscompared to the continuation of Agenda 2000. This would be due to a reduction in cerealproduction, an increase in set aside and fallow land, and a fall in cattle production (highmethane emissions). Parallel to the drop in greenhouse emissions, the implementation ofthe MTR proposals is also found to entail an average reduction in nitrate surpluses ofslightly more than 3 % in the EU. According to this study, further positive effects may beexpected from the shift from rotational to non-rotational set-aside.
3.2. Consequences on the agricultural sector of EU-25
3.2.1. Impact of Agenda 2000 on EU-25
In 2004, the accession of 10 new Member States (Cyprus, Czech Republic, Estonia,Hungary, Latvia, Lithuania, Malta, Poland, Slovakia, and Slovenia) to the EU is expectedto generate new opportunities in the Single Market for the agriculture and food industriesin the new as well as in the current Member States.
From a sector perspective, the CAP is foreseen to improve the situation of agriculture inthe new Member States as compared to a situation without membership and under thecontinuation of domestic policies. The CAP in combination with the Single Market shouldprovide stable and, on average, higher prices than the domestic policies of these countriescould sustain and secure in terms of WTO and government spending. 11 These calculations do not take into account the transfer of budget savings to the agricultural sector
through rural development funds. However, the overall welfare comparison would remain unchanged ifthey were accounted for, as the budgetary expenditure would decline while agricultural income wouldincrease.

Executive summary
24
The new Member States would add about 38 mio ha of utilised agricultural area to the130 mio ha of the current Member States. However, the resulting increase in theagricultural production of the EU-25 would remain relatively moderate due to the lowerintensity of production in the new Member States. The EU-25 would produce in 2009about 28 % more cereals with 45 % more cereal area, 24 % more oilseeds with 32 % moreoilseed area (excluding non-food production), 10 % more beef, 17 % more pork, and 27 %more poultry than the EU-15. At the same time, domestic use of cereals would increase by27 %, of oilseeds by 6 %, of beef by 9 %, of pork by 23 %, and of poultry by 12%.
The implementation of the Agenda 2000 policy in the new Member States would lead to anincrease in cereal production from 57.6 mio t in 2002 to 64.1 mio t in 2009, demonstratingthe rather moderate impact of the CAP on cereal production in the new Member States.Total EU-25 production would stand at some 293 mio t. Accession and the effects of theSingle Market would entail a redirection of trade according to the relative competitivenessof the Member States. One of the prime shifts in trade concerns cereals, pork, and poultry.Latest data would suggest that the new Member States have improved theircompetitiveness in poultry production thanks mainly to foreign direct investments intoproduction and processing. Upon enlargement an increasing part of poultry production -upto 0.9 mio t- would be directed to the current Member States as it would benefit from acomparative advantage. By contrast, a large part of pork production in the new MemberStates would have a comparative disadvantage with respect to quality, i.e. lean meatcontent, and feed costs. Here the projections suggest that the current Member States wouldtrade between 0.7 mio t and 0.9 mio t of pork to the new Member States.
Generally, only a few sectors –such as the rye and beef sectors- would continue to displaystructural imbalance after the implementation of Agenda 2000 in the new Member States.The annual marketable surplus in rye would increase from 2.6 mio t in the EU-15 to3.6 mio t for the EU-25, making intervention storage an even more important marketinginstrument. Beef prices would also remain under pressure, with these being around100 EUR/t lower in the EU-25 than in the EU-15.
3.2.2. Impact of the MTR proposals on EU-25
The MTR proposals would contribute to smooth the effects of enlargement in comparisonwith our Agenda 2000 scenario. The implementation of decoupling in the EU-25 wouldproduce similar trends to those in the EU-15. Decoupling would lead in the new MemberStates to a different production structure, as producers’ decisions would be driven bymarket considerations rather than by the maximisation of direct payments. The resultingmisallocation of scarce resources into production with limited or declining markets in thenew as well as in the current Member States with Agenda 2000 would then be avoided.The balance of the rye and beef markets in the EU-25 would significantly improve, assustainable supply and demand developments would be achieved. As in the EU-15, wheatand maize production in the new Member States would gain in relative importance fromdecoupling. The barley market would improve significantly after enlargement. The MTRproposals would enable the significant rise in agricultural income projected in the newMember States after enlargement to be secured. More generally, they are expected togenerate a significant and sustainable improvement in the medium-term perspectives of theagricultural sector of the EU-25.
Executive summary
25
Annex
Comparison of the current Agenda 2000 situationand the MTR Communication Proposals (July 2002)
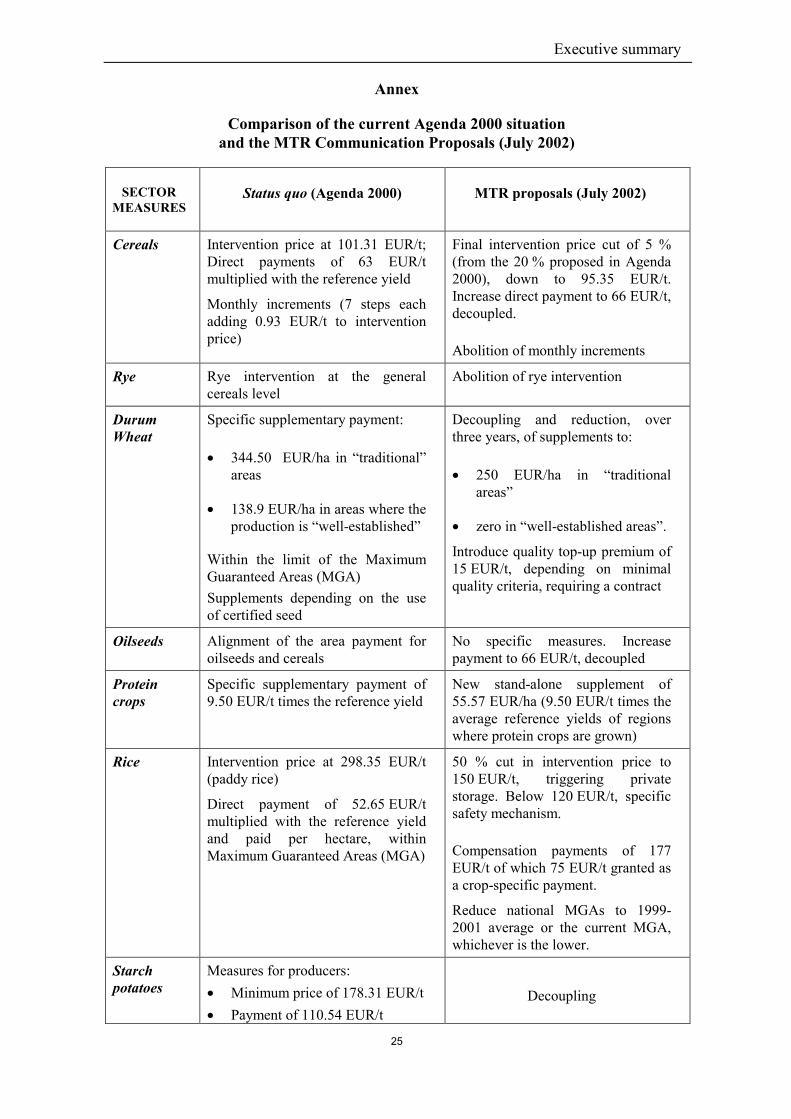
SECTORMEASURES
Status quo (Agenda 2000) MTR proposals (July 2002)
Cereals Intervention price at 101.31 EUR/t;Direct payments of 63 EUR/tmultiplied with the reference yield
Monthly increments (7 steps eachadding 0.93 EUR/t to interventionprice)
Final intervention price cut of 5 %(from the 20 % proposed in Agenda2000), down to 95.35 EUR/t.Increase direct payment to 66 EUR/t,decoupled.
Abolition of monthly increments
Rye Rye intervention at the generalcereals level
Abolition of rye intervention
DurumWheat
Specific supplementary payment:
� 344.50 EUR/ha in “traditional”areas
� 138.9 EUR/ha in areas where theproduction is “well-established”
Within the limit of the MaximumGuaranteed Areas (MGA)Supplements depending on the useof certified seed
Decoupling and reduction, overthree years, of supplements to:
� 250 EUR/ha in “traditionalareas”
� zero in “well-established areas”.
Introduce quality top-up premium of15 EUR/t, depending on minimalquality criteria, requiring a contract
Oilseeds Alignment of the area payment foroilseeds and cereals
No specific measures. Increasepayment to 66 EUR/t, decoupled
Proteincrops
Specific supplementary payment of9.50 EUR/t times the reference yield
New stand-alone supplement of55.57 EUR/ha (9.50 EUR/t times theaverage reference yields of regionswhere protein crops are grown)
Rice Intervention price at 298.35 EUR/t(paddy rice)
Direct payment of 52.65 EUR/tmultiplied with the reference yieldand paid per hectare, withinMaximum Guaranteed Areas (MGA)
50 % cut in intervention price to150 EUR/t, triggering privatestorage. Below 120 EUR/t, specificsafety mechanism.
Compensation payments of 177EUR/t of which 75 EUR/t granted asa crop-specific payment.
Reduce national MGAs to 1999-2001 average or the current MGA,whichever is the lower.
Starchpotatoes
Measures for producers:� Minimum price of 178.31 EUR/t� Payment of 110.54 EUR/t
Decoupling
Executive summary
26
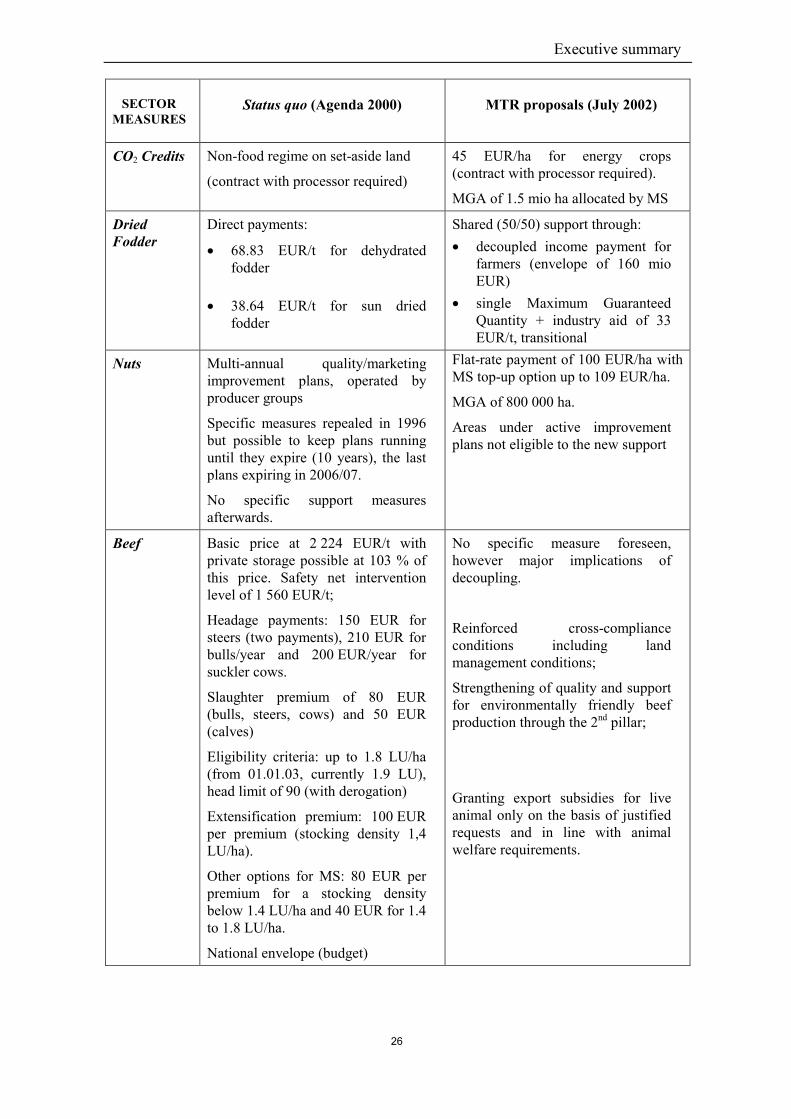
SECTORMEASURES
Status quo (Agenda 2000) MTR proposals (July 2002)
CO2 Credits Non-food regime on set-aside land
(contract with processor required)
45 EUR/ha for energy crops(contract with processor required).
MGA of 1.5 mio ha allocated by MS
DriedFodder
Direct payments:
� 68.83 EUR/t for dehydratedfodder
� 38.64 EUR/t for sun driedfodder
Shared (50/50) support through:� decoupled income payment for
farmers (envelope of 160 mioEUR)
� single Maximum GuaranteedQuantity + industry aid of 33EUR/t, transitional
Nuts Multi-annual quality/marketingimprovement plans, operated byproducer groups
Specific measures repealed in 1996but possible to keep plans runninguntil they expire (10 years), the lastplans expiring in 2006/07.
No specific support measuresafterwards.
Flat-rate payment of 100 EUR/ha withMS top-up option up to 109 EUR/ha.
MGA of 800 000 ha.
Areas under active improvementplans not eligible to the new support
Beef Basic price at 2 224 EUR/t withprivate storage possible at 103 % ofthis price. Safety net interventionlevel of 1 560 EUR/t;
Headage payments: 150 EUR forsteers (two payments), 210 EUR forbulls/year and 200 EUR/year forsuckler cows.
Slaughter premium of 80 EUR(bulls, steers, cows) and 50 EUR(calves)
Eligibility criteria: up to 1.8 LU/ha(from 01.01.03, currently 1.9 LU),head limit of 90 (with derogation)
Extensification premium: 100 EURper premium (stocking density 1,4LU/ha).
Other options for MS: 80 EUR perpremium for a stocking densitybelow 1.4 LU/ha and 40 EUR for 1.4to 1.8 LU/ha.
National envelope (budget)
No specific measure foreseen,however major implications ofdecoupling.
Reinforced cross-complianceconditions including landmanagement conditions;
Strengthening of quality and supportfor environmentally friendly beefproduction through the 2nd pillar;
Granting export subsidies for liveanimal only on the basis of justifiedrequests and in line with animalwelfare requirements.

Executive summary
27
DECOUPLING Status quo MTR proposals (July 2002)
Scope Various arable premialinked to the production ofspecific crops.
Partial decoupling only dueto the alignment of thecereals and oilseedspayments
Animal premia linked tothe requirement ofproducing beef or dairy
Single decoupled farm income paymentcovering:- cereals, oilseeds, protein crops, flax,
hemp, linseed (base aid of 66 EUR/t)- durum wheat supplement (reduced to
250 EUR/t),- starch potatoes, grain legumes,- rice (102 EUR/t),- dried fodder (new)- beef, sheep- milk from 2004/05.
The following payments are not included:- durum wheat quality premium,- protein crop supplement (55.57
EUR/t),- crop-specific payments for rice
(75 EUR/t),- flax, hemp (processors)- potato starch (processors)- dried fodder (processors, 33 EUR/t,
transitional)Fruit and vegetables are excluded
Reference period Not specified
Set-aside For arable crops, 10 % setaside, exempting farmersproducing less thanannually 92 t of cereals(calculated with thereference yields)
Maintenance of individual historical set-aside obligation (based on the 10 % set-aside requirement) but now on a long-term (10 years), non-rotational basis.Abolition of the non-food regime on set-aside land.
Establishmentand transfer ofrights
The single farm payment may be dividedinto entitlement rights to a paymentattached to eligible land. The transfer ofentitlement rights will occur in parallel tothe transfer of land
Options Member States may modulate the level ofaid within certain limits
DYNAMICMODULATION
Optional reduction of directpayments up to 20 %
Unspent money remains inMember State to be spenton accompanying measures
Dynamic modulation of 3 % per year upto a total reduction of 20 %; 5 000 EURfranchise for each farm exempted fromthe cut. Member States may furtherexempt 3 000 EUR for each labour unitabove two.Savings shifted to EU Rural Developmentbudget (any measure). Distribution keybased on agricultural area, farmemployment and prosperity.Capping at 300 000 EUR per farm, withsavings kept in the MS concerned.

Executive summary
28
OTHERMEASURES Status quo MTR proposals (July 2002)
Cross-Compliance
Optional use of reductionsof direct payments forenforcing statuaryenvironmental legislationand so-called specificenvironmental requirement
Compulsory cross-compliance (wholefarm approach) Direct payments forrespect of statuary legal standards(environment, food safety, and animalwelfare) and keeping land in goodagricultural condition.
Farm Audits The establishment (not theoperation) of certificationsystems is an option underthe Rural Developmentpackage
Farm audits compulsory for all farmsreceiving more than 5 000 EURAudits will account for all relevantmaterial flows and on-farm processes.Financial support covering part of thecosts for farmers is eligible under RuralDevelopment
RURALDEVELOPMENT
(In addition to thesimplification of certain
current measures)
Status quo MTR proposals (July 2002)
Food Quality Investment aid in favour offood quality including theestablishment ofcertification systemseligible under ruraldevelopment plans
Promotion of certaincommodities subject to twohorizontal regimes: one forinternal promotion, one forexternal promotion.
Establish a food quality chapter as a new“accompanying measure” including:- Encouragement to farmers to
participate in quality assurance andcertification schemes
- support for producer groups forpromotion in the context of qualityassurance, geographical indicationand organic farming
Target first pillar measures only toexternal promotion
Animal Welfare Only regulatory measures New animal welfare measure alongsideand in the same logic as agri-environmentmeasures (covering cost incurred andincome forgone due to commitmentsbeyond legal standards)
Agri-Environment
Current aid intensity- 75 % in Objective 1
areas- 50 % in others;
Raise the aid-intensity for agri-environmental measures:- 85 % in Objective 1 areas- 60 % in others
MeetingStandards
No incentive measure inplace
Support for farm audits – flat-ratepayments to farmers to cover audit costsTemporary and degressive aid (maximumof 200 EUR/ha) to farmers to help themto implement statuary standards when EUrules have not been transposed intonational legislation. Not applicable wherestandards already transposed into nationallegislation

Chapter I DG AGRI EU-15
29
IMPACT ASSESSMENT
OF THE MID-TERM REVIEW
PROPOSALS
ON THE AGRICULTURAL MARKETS
AND FARM INCOME
IN THE EU-15
2004 – 2009
DG Agriculture
European Commission

30
Chapter I DG AGRI EU-15
31
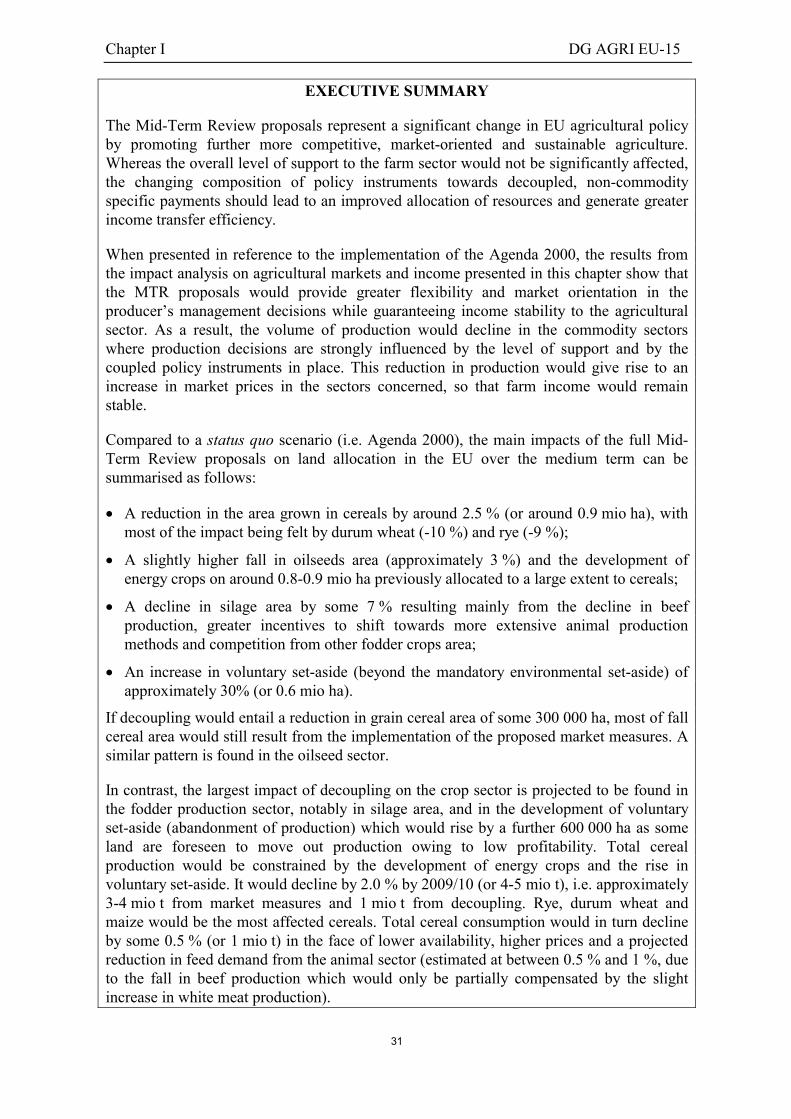
EXECUTIVE SUMMARY
The Mid-Term Review proposals represent a significant change in EU agricultural policyby promoting further more competitive, market-oriented and sustainable agriculture.Whereas the overall level of support to the farm sector would not be significantly affected,the changing composition of policy instruments towards decoupled, non-commodityspecific payments should lead to an improved allocation of resources and generate greaterincome transfer efficiency.
When presented in reference to the implementation of the Agenda 2000, the results fromthe impact analysis on agricultural markets and income presented in this chapter show thatthe MTR proposals would provide greater flexibility and market orientation in theproducer’s management decisions while guaranteeing income stability to the agriculturalsector. As a result, the volume of production would decline in the commodity sectorswhere production decisions are strongly influenced by the level of support and by thecoupled policy instruments in place. This reduction in production would give rise to anincrease in market prices in the sectors concerned, so that farm income would remainstable.
Compared to a status quo scenario (i.e. Agenda 2000), the main impacts of the full Mid-Term Review proposals on land allocation in the EU over the medium term can besummarised as follows:
� A reduction in the area grown in cereals by around 2.5 % (or around 0.9 mio ha), withmost of the impact being felt by durum wheat (-10 %) and rye (-9 %);
� A slightly higher fall in oilseeds area (approximately 3 %) and the development ofenergy crops on around 0.8-0.9 mio ha previously allocated to a large extent to cereals;
� A decline in silage area by some 7 % resulting mainly from the decline in beefproduction, greater incentives to shift towards more extensive animal productionmethods and competition from other fodder crops area;
� An increase in voluntary set-aside (beyond the mandatory environmental set-aside) ofapproximately 30% (or 0.6 mio ha).
If decoupling would entail a reduction in grain cereal area of some 300 000 ha, most of fallcereal area would still result from the implementation of the proposed market measures. Asimilar pattern is found in the oilseed sector.
In contrast, the largest impact of decoupling on the crop sector is projected to be found inthe fodder production sector, notably in silage area, and in the development of voluntaryset-aside (abandonment of production) which would rise by a further 600 000 ha as someland are foreseen to move out production owing to low profitability. Total cerealproduction would be constrained by the development of energy crops and the rise involuntary set-aside. It would decline by 2.0 % by 2009/10 (or 4-5 mio t), i.e. approximately3-4 mio t from market measures and 1 mio t from decoupling. Rye, durum wheat andmaize would be the most affected cereals. Total cereal consumption would in turn declineby some 0.5 % (or 1 mio t) in the face of lower availability, higher prices and a projectedreduction in feed demand from the animal sector (estimated at between 0.5 % and 1 %, dueto the fall in beef production which would only be partially compensated by the slightincrease in white meat production).

Chapter I DG AGRI EU-15
32
Lower production and higher domestic prices would also affect the competitiveness of EUexports which would fall by around 3 %, whereas EU cereal imports would increase owingto the reduction in EU’s border protection (linked to the cut in support price).
Total cereal stocks would drop significantly by 25 % to stabilise at around 27 mio t, withno cereal in public stocks. The EU rye market would display the greatest improvementwith a progressive restoration of market balance. Lower production volume and higherconsumption –supported by lower prices- would allow in the short term to absorb theaccumulated surplus of rye in public stocks by 2004 and to generate a gradual recovery inmarket prices close to pre-Mid-Term Review levels in the later years.
The implementation of the decoupling scheme in the livestock sector –combined with asmall increase in feed prices- would entail a decline in beef production, as it would favourthe extensification of production systems. After a short-term increase linked to higherslaughtering, beef output would decline progressively to stand at around 3 % belowbaseline levels by 2009 (or around 200 000 t).
Lower beef availability would trigger a rise in EU producer prices of some 7 % by 2009and would result in a fall in domestic consumption of 2 % (or 150 000 t). This would inturn entail a decline in EU beef net exports of around 60 %, i.e. 100 000 t, due mainly to afall in EU beef exports. It should be mentioned that, although the sheep sector has not beenfully covered in our modelling exercise, it is expected to display a similar pattern to that ofbeef.
The short run impact in the pig and poultry sectors may be expected to be dominated by theeffect of the fall in beef producer prices on the demand side which would more thancompensate the impact of lower cereal feed prices and should maintain these two sectorsunder pressure. As a consequence, pig and poultry production and consumption wouldexhibit a slight fall ranging between 0 % and 0.5 %. Over the medium term, the increase inbeef prices and the fall in beef consumption would favour pig and poultry consumption.This demand side effect would outweigh the negative impact of higher feed cereal priceson the competitiveness of the two sectors, which would display a small expansion inproduction and consumption.
The MTR proposals would display a rather favourable, though limited, impact on theincome of the agricultural sector as compared to the baseline. The reduction in the level ofagricultural production and the implementation of dynamic modulation are expected to bebroadly compensated for by the resulting price rises and the increase in the level of aids inthe arable crops and rice sectors. However, given that around 80 % of the savings frommodulation can be assumed to return to the agricultural sector through the second pillar,the overall income would rise by some 1.7 % by 2009.
However, diverging trends across the various commodity sectors and regions may beexpected, with most favourable developments projected in the animal sector (notably thebeef and pork sectors, which should display strong price increases). In contrast, incomedevelopment in the cereal sector may reasonably be expected to be affected by thereduction in the production potential and by the implementation of the dynamicmodulation.
Chapter I DG AGRI EU-15
33
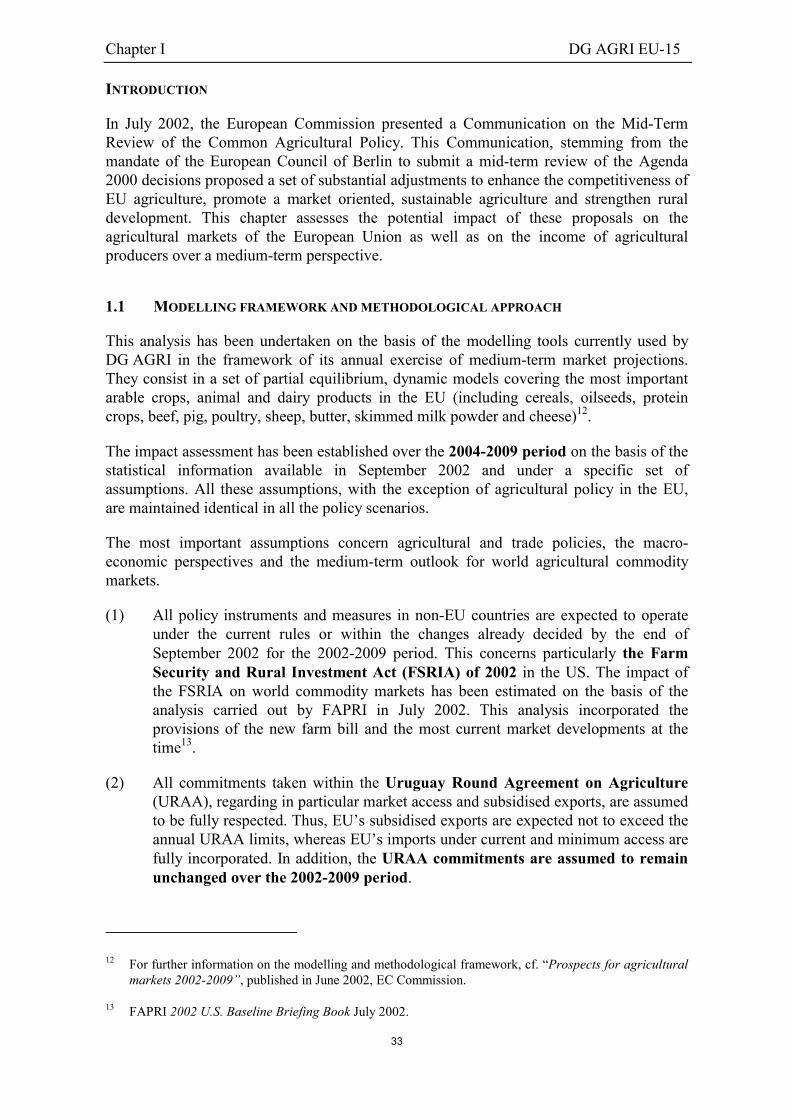
INTRODUCTION
In July 2002, the European Commission presented a Communication on the Mid-TermReview of the Common Agricultural Policy. This Communication, stemming from themandate of the European Council of Berlin to submit a mid-term review of the Agenda2000 decisions proposed a set of substantial adjustments to enhance the competitiveness ofEU agriculture, promote a market oriented, sustainable agriculture and strengthen ruraldevelopment. This chapter assesses the potential impact of these proposals on theagricultural markets of the European Union as well as on the income of agriculturalproducers over a medium-term perspective.
1.1 MODELLING FRAMEWORK AND METHODOLOGICAL APPROACH
This analysis has been undertaken on the basis of the modelling tools currently used byDG AGRI in the framework of its annual exercise of medium-term market projections.They consist in a set of partial equilibrium, dynamic models covering the most importantarable crops, animal and dairy products in the EU (including cereals, oilseeds, proteincrops, beef, pig, poultry, sheep, butter, skimmed milk powder and cheese)12.
The impact assessment has been established over the 2004-2009 period on the basis of thestatistical information available in September 2002 and under a specific set ofassumptions. All these assumptions, with the exception of agricultural policy in the EU,are maintained identical in all the policy scenarios.
The most important assumptions concern agricultural and trade policies, the macro-economic perspectives and the medium-term outlook for world agricultural commoditymarkets.
(1) All policy instruments and measures in non-EU countries are expected to operateunder the current rules or within the changes already decided by the end ofSeptember 2002 for the 2002-2009 period. This concerns particularly the FarmSecurity and Rural Investment Act (FSRIA) of 2002 in the US. The impact ofthe FSRIA on world commodity markets has been estimated on the basis of theanalysis carried out by FAPRI in July 2002. This analysis incorporated theprovisions of the new farm bill and the most current market developments at thetime13.
(2) All commitments taken within the Uruguay Round Agreement on Agriculture(URAA), regarding in particular market access and subsidised exports, are assumedto be fully respected. Thus, EU’s subsidised exports are expected not to exceed theannual URAA limits, whereas EU’s imports under current and minimum access arefully incorporated. In addition, the URAA commitments are assumed to remainunchanged over the 2002-2009 period.
12 For further information on the modelling and methodological framework, cf. “Prospects for agricultural
markets 2002-2009”, published in June 2002, EC Commission.
13 FAPRI 2002 U.S. Baseline Briefing Book July 2002.

Chapter I DG AGRI EU-15
34
(3) The trade agreements that have been concluded by the EU prior to the end ofSeptember 2002, notably with the Least Developed Countries and the candidatecountries from central and eastern Europe have been taken into account, notably themost recent “double-profit” agreements with the candidate countries;
(4) If the short-term perspectives for the EU economy have been assumed to remainrather modest, several factors –including higher private consumption underpinnedby increases in earnings and subdued inflation, investment spending, the rebuildingof inventories and a more supportive international environment- are expected tocontribute to supporting a strengthening of economic growth and provide the basisfor a sustainable expansion of the EU economy over the medium-term. Economicgrowth would average 2.6 % per year, whereas inflation would remain containedat approximately 1.9% per annum. The $/EUR exchange rate is assumed tostabilise around parity from 2003 onwards. Population growth in the EU isprojected to decline slowly from around 0.3 % in 2004 to 0.2 % towards the end ofthe simulation period.
(5) The medium-term outlook for world agricultural markets is foreseen to remainessentially supported by rising food demand driven by an improved macro-economic environment (with more broadly-based and sustainable growth), higherpopulation, urbanisation and changes in dietary patterns, particularly in manyemerging economies. World trade in agricultural commodities is expected todemonstrate sustained growth, as demand for food products should outpaceproduction in many developing countries, while commodity prices are projected toshow only moderate increases over the medium term (cf. graph 1.1)14.
Graph 1.1. Medium-term development in world cereal prices ($/t), 1981/82 – 2009/10
6 0
8 0
1 0 0
1 2 0
1 4 0
1 6 0
1 8 0
2 0 0
2 2 0
8 1 /8 2 8 3 /8 4 8 5 /8 6 8 7 /8 8 8 9 /9 0 9 1 /9 2 9 3 /9 4 9 5 /9 6 9 7 /9 8 9 9 /0 0 0 1 /0 2 0 3 /0 4 0 5 /0 6 0 7 /0 8 0 9 /1 0
W h e a t H R W
M a ize
W h e a t S R W
After a short-term hike, world cereal prices are assumed to trend upwards over themedium term and to reach some 151 EUR/t by 2009/10 for soft wheat (HRW, FOBGulf), 108 EUR/t for maize (US FOB Gulf) and 230 EUR/t for milled regular rice.
14 World agricultural markets have recently displayed significant developments marked by sharp price
increases –mainly driven by unfavourable climatic conditions in North America and Australia. However,these developments are projected to have only a short-term impact on commodity markets.

Chapter I DG AGRI EU-15
35
World prices of oilseeds and oilseed products would also strengthen over the nextseven years fuelled by higher demand, notably for vegetable oil, that shouldtranslate into a strong pattern for oil-rich oilseeds. Sunflower and rapeseed priceswould increase from 2003/04 to 2009/10, rising from 250 to 270 $/t, and from 220to 240 $/t CIF Rotterdam respectively.
1.2 EU POLICY SCENARIOS
The results of the impact analysis are presented in reference to a status quo scenario whichcorresponds to the implementation of the Agenda 2000 as embodied in the medium-termprojections published in December 2002 in the «Prospects for agricultural markets 2002-2009 – Update for EU markets», hereafter the «baseline»15.
The impact assessment is carried out in three progressive steps from 2004/05 onwards inorder to allow a differentiated evaluation of the various MTR proposals.
1.2.1 “Market measures” scenario: The first step (hereafter scenario MTR-1)corresponds to the implementation of the proposed market measures, with theexception of those for the dried fodder and nuts sectors which are not coveredby the model:
� Reduction of the intervention price for cereals from 101.31 EUR/t to95.35 EUR/t (i.e. 6.0 %) from 2004/05 onwards and removal of themonthly increment system (i.e. an aggregate reduction in price support ofmore than 8 %). Compensation for the cut in cereal support price byincreased direct payments on similar terms as in Agenda 2000, i.e. byapproximately 3 EUR/t (of reference yield);
� Removal of the intervention price system for rye. In order to smooth theimpact of the measure on the cereal market, it is assumed that the 6 mio tof rye in public stocks at the end of the 2003/04 marketing year aregradually released over three years as follows: 3 mio t in 2004/05,2 mio t in 2005/06 and 1 mio t in 2006/07;
� Reduction of the specific additional payment in the traditional areas fordurum wheat production from 344.5 EUR/ha to 250 EUR/ha and removalof the special aid in the established areas. These changes are phased inover three years. Introduction of a high quality premium of 15 EUR/tconditional on the respect of quality requirements for all EU durum wheatproducers;
� Replacement of the rotational set-aside by a long-term environmentalset-aside (10 years) on arable land. The production of energy cropswould no longer be allowed on the set-aside land. However, these cropswould benefit from a non-crop specific aid of 45 EUR/ha with a maximumguaranteed area of 1.5 mio ha (“carbon credit”).
15 European Commission, Directorate-General for Agriculture Prospects for Agricultural Markets 2002 –
2009 – Update for EU markets December 2002. Brussels.

Chapter I DG AGRI EU-15
36
� One-step reduction of 50 % of the rice support price to a basic price of150 EUR/t in 2004/05. A private storage is introduced which would betriggered when the market price falls below the basic price. In addition, asafety net is established at 120 EUR/t. This global price reduction iscompensated at a rate of 88 % amounting to 177 EUR/t, with 102 EUR/tas an income payment and 75 EUR/t as a crop specific aid. The maximumguaranteed areas would be reduced to the 1999-2001 average of thecurrent MGA, whichever is lower.
1.2.2 “Modulation” scenario: The second step in the MTR impact analysis(hereafter scenario MTR-2) introduces the system of dynamic modulation, inaddition to the market measures. Under this system, all direct payments –bothcoupled and decoupled payments- would be reduced progressively in arithmeticsteps of 3% per year to reach 20 % at the maximum (18 % in 2009).
� A franchise set at 5 000 EUR would be applied for farms employing up to 2full time annual working units. For each additional employed annualworking unit, the franchise would be increased by some 3 000 EUR. Afterthe application of modulation and the franchise, the payments per farmwould be capped at 300 000 EUR.
� Based on statistics from the Farm Structure Survey and the FarmAccountancy Data Network, it has been estimated that some 64 % of alldirect payments would be affected by modulation. This proportion rangesfrom 59 % in the dairy sector to 67 % in the arable crop and beef sectors.The relevant proportion has been used for the various sectors, when thiswas possible, and implemented progressively over the simulation period.
1.2.3 The full Mid-Term Review scenario: Further to MTR-2, the third step(hereafter scenario MTR-3) introduces the concept of decoupling, with thegranting of a single decoupled income payment per farm. This new paymentwould replace all existing (or newly introduced payments) direct payments,with the exception of the specific quality premium for durum wheat, theprotein crop supplement, the crop specific payment for rice and the areapayment for nuts.
In the modelling framework used in this analysis, the decoupled payments areconsidered to operate as lump sum transfers with no impact on productiondecisions of farmers. However, various requirements attached to thedecoupling scheme such as conditions of eligibility of crops, cross-complianceconditions, and the close link to land of these payments in case of transfer maybe expected to constrain the shift between activities (notably between grasslandand arable land activities);
It has been assumed that the implementation of cross-compliance conditionsrelated to the enforcement of "good farming practices" (maintenance of land ingood agricultural condition and respect of statutory environmental, food safety,animal health and welfare standards) would only have a marginal impact onmarket balances as they are assumed to generate no additional production costsagainst the Agenda 2000 situation. Under the decoupling scheme, producerswould have the flexibility to produce all farm products, with the exception of
Chapter I DG AGRI EU-15
37
vegetables and fruit. Finally, the conversion of pastureland to arable land wasassumed to be limited as Member States would have the possibility to applyconditions hindering such shift.
It should be mentioned that other measures such as those concerning the consolidation andthe strengthening of rural development through a wider scope of the accompanyingmeasures (two new chapters on food safety and quality, and on the adaptation of farmers tostandards; introduction of new measures regarding animal welfare in the agri-environmentchapter) and some specific sectors such as the nuts, dried fodder and starch potato sectorshave not been incorporated in this analysis.
1.3 IMPACT ANALYSIS ON AGRICULTURAL MARKETS
1.3.1 Status quo scenario
The status quo scenario corresponds to the continuation of the Agenda 2000 agriculturalpolicy over the medium-term. The following elements, based on the medium-termprojections published early December 2002 in the «Prospects for agricultural markets2002-2009 – Update for EU markets», aim at providing a brief summary of the marketsoutlook to be used as a reference.
1.3.1.1 Arable crops
Cereals
Total cereal area in the EU is projected to exhibit a slow decline over the medium-termfrom 37.4 mio ha in 2002 to 36.5 mio ha in 2009 owing to the overall decrease in averagedomestic feed cereal prices and improved price prospects for oil-rich oilseed. Commonwheat, durum wheat and maize should exhibit strong gains, whereas barley would displaya declining trend linked to less favourable profitability prospects. However, the projectedrise in cereal yields (of approximately 1.1 % per annum) would more than offset thedecline in cereal area and entail a gradual expansion in cereal production over the mediumterm to 224.7 mio t in 2009.
Table 1.1 Area under arable crops and set-aside in the EU, 2000 – 2009 (mio ha)2000 2001 2002 2003 2004 2005 2006 2007 2008 2009
Cereals 37.5 36.4 37.4 36.8 36.9 36.8 36.8 36.7 36.6 36.5 Oilseeds (1) 4.5 4.4 4.2 4.6 4.5 4.5 4.5 4.6 4.6 4.7 Protein crops 1.1 1.2 1.2 1.2 1.2 1.2 1.2 1.2 1.2 1.2 Linseed (2) 0.3 0.2 0.2 0.2 0.2 0.2 0.2 0.2 0.2 0.2 Silage (3) 4.3 4.3 4.3 4.3 4.2 4.2 4.2 4.2 4.2 4.2Total arable crops (a) 47.6 46.5 47.2 47.0 47.0 46.9 46.9 46.9 46.9 46.8 Compulsory set-aside 3.9 3.9 4.0 4.0 4.0 4.1 4.1 4.1 4.1 4.1 Voluntary set-aside 1.7 2.5 1.8 2.1 2.1 2.2 2.1 2.2 2.2 2.2Total set-aside (b) 5.6 6.4 5.8 6.1 6.2 6.2 6.2 6.3 6.3 6.4TOTAL COP (a+b) 53.2 52.9 53.0 53.2 53.2 53.2 53.2 53.2 53.2 53.2(1) Excluding non-food oilseeds; (2) Including flax and hemp from 2001/02; (3) Excluding grass silage for Finland and Sweden
Renewed gains in the price competitiveness of cereals and the continuing growth in theglobal feed demand from the livestock sector (of approximately 3 % over the wholeperiod) would enable the EU domestic feed market to absorb most of this additionalproduction, though at a much more moderate pace than after the 1992 CAP reform.
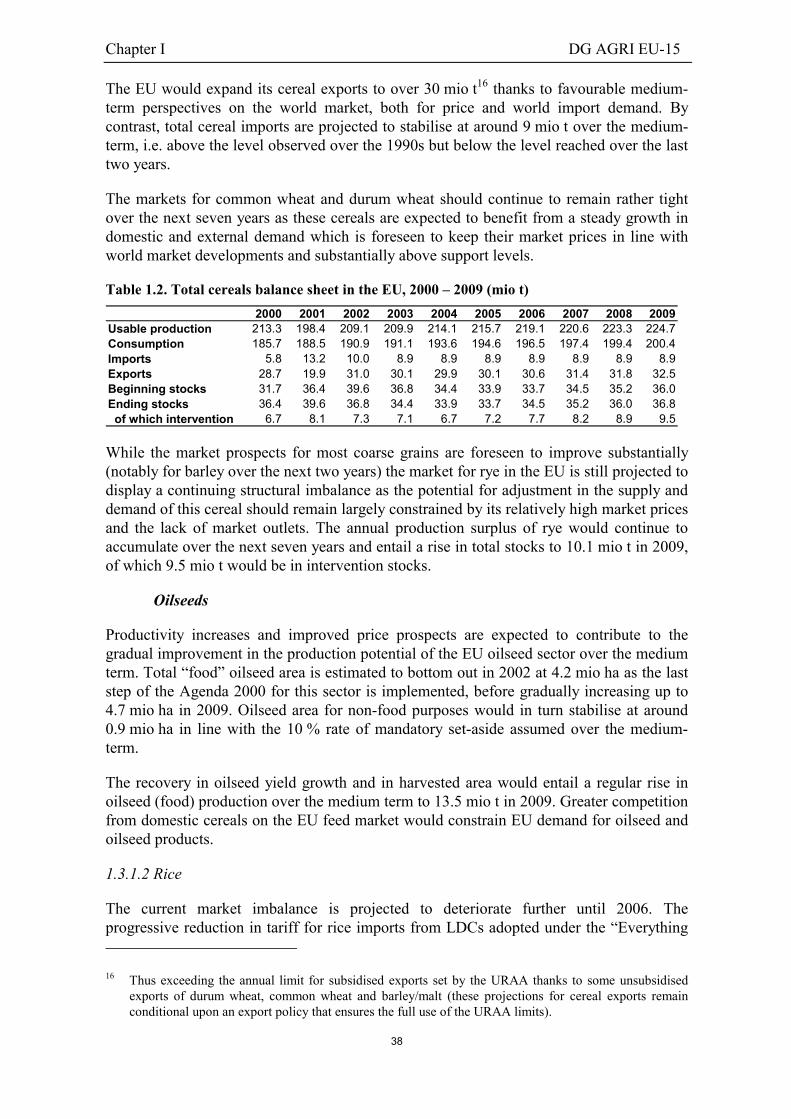
Chapter I DG AGRI EU-15
38
The EU would expand its cereal exports to over 30 mio t16 thanks to favourable medium-term perspectives on the world market, both for price and world import demand. Bycontrast, total cereal imports are projected to stabilise at around 9 mio t over the medium-term, i.e. above the level observed over the 1990s but below the level reached over the lasttwo years.
The markets for common wheat and durum wheat should continue to remain rather tightover the next seven years as these cereals are expected to benefit from a steady growth indomestic and external demand which is foreseen to keep their market prices in line withworld market developments and substantially above support levels.
Table 1.2. Total cereals balance sheet in the EU, 2000 – 2009 (mio t)2000 2001 2002 2003 2004 2005 2006 2007 2008 2009
Usable production 213.3 198.4 209.1 209.9 214.1 215.7 219.1 220.6 223.3 224.7Consumption 185.7 188.5 190.9 191.1 193.6 194.6 196.5 197.4 199.4 200.4Imports 5.8 13.2 10.0 8.9 8.9 8.9 8.9 8.9 8.9 8.9Exports 28.7 19.9 31.0 30.1 29.9 30.1 30.6 31.4 31.8 32.5Beginning stocks 31.7 36.4 39.6 36.8 34.4 33.9 33.7 34.5 35.2 36.0Ending stocks 36.4 39.6 36.8 34.4 33.9 33.7 34.5 35.2 36.0 36.8 of which intervention 6.7 8.1 7.3 7.1 6.7 7.2 7.7 8.2 8.9 9.5
While the market prospects for most coarse grains are foreseen to improve substantially(notably for barley over the next two years) the market for rye in the EU is still projected todisplay a continuing structural imbalance as the potential for adjustment in the supply anddemand of this cereal should remain largely constrained by its relatively high market pricesand the lack of market outlets. The annual production surplus of rye would continue toaccumulate over the next seven years and entail a rise in total stocks to 10.1 mio t in 2009,of which 9.5 mio t would be in intervention stocks.
Oilseeds
Productivity increases and improved price prospects are expected to contribute to thegradual improvement in the production potential of the EU oilseed sector over the mediumterm. Total “food” oilseed area is estimated to bottom out in 2002 at 4.2 mio ha as the laststep of the Agenda 2000 for this sector is implemented, before gradually increasing up to4.7 mio ha in 2009. Oilseed area for non-food purposes would in turn stabilise at around0.9 mio ha in line with the 10 % rate of mandatory set-aside assumed over the medium-term.
The recovery in oilseed yield growth and in harvested area would entail a regular rise inoilseed (food) production over the medium term to 13.5 mio t in 2009. Greater competitionfrom domestic cereals on the EU feed market would constrain EU demand for oilseed andoilseed products.
1.3.1.2 Rice
The current market imbalance is projected to deteriorate further until 2006. Theprogressive reduction in tariff for rice imports from LDCs adopted under the “Everything 16 Thus exceeding the annual limit for subsidised exports set by the URAA thanks to some unsubsidised
exports of durum wheat, common wheat and barley/malt (these projections for cereal exports remainconditional upon an export policy that ensures the full use of the URAA limits).
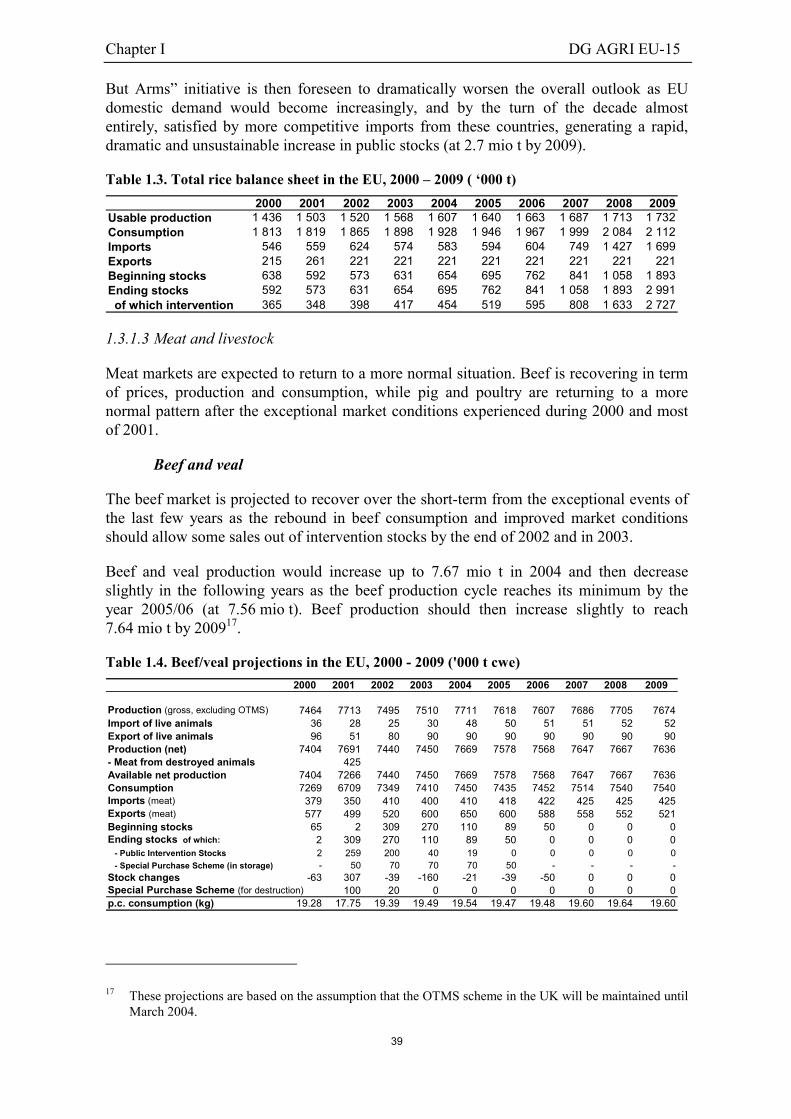
Chapter I DG AGRI EU-15
39
But Arms” initiative is then foreseen to dramatically worsen the overall outlook as EUdomestic demand would become increasingly, and by the turn of the decade almostentirely, satisfied by more competitive imports from these countries, generating a rapid,dramatic and unsustainable increase in public stocks (at 2.7 mio t by 2009).
Table 1.3. Total rice balance sheet in the EU, 2000 – 2009 ( ‘000 t)2000 2001 2002 2003 2004 2005 2006 2007 2008 2009
Usable production 1 436 1 503 1 520 1 568 1 607 1 640 1 663 1 687 1 713 1 732Consumption 1 813 1 819 1 865 1 898 1 928 1 946 1 967 1 999 2 084 2 112Imports 546 559 624 574 583 594 604 749 1 427 1 699Exports 215 261 221 221 221 221 221 221 221 221Beginning stocks 638 592 573 631 654 695 762 841 1 058 1 893Ending stocks 592 573 631 654 695 762 841 1 058 1 893 2 991 of which intervention 365 348 398 417 454 519 595 808 1 633 2 727
1.3.1.3 Meat and livestock
Meat markets are expected to return to a more normal situation. Beef is recovering in termof prices, production and consumption, while pig and poultry are returning to a morenormal pattern after the exceptional market conditions experienced during 2000 and mostof 2001.
Beef and veal
The beef market is projected to recover over the short-term from the exceptional events ofthe last few years as the rebound in beef consumption and improved market conditionsshould allow some sales out of intervention stocks by the end of 2002 and in 2003.
Beef and veal production would increase up to 7.67 mio t in 2004 and then decreaseslightly in the following years as the beef production cycle reaches its minimum by theyear 2005/06 (at 7.56 mio t). Beef production should then increase slightly to reach7.64 mio t by 200917.
Table 1.4. Beef/veal projections in the EU, 2000 - 2009 ('000 t cwe)2000 2001 2002 2003 2004 2005 2006 2007 2008 2009
Production (gross, excluding OTMS) 7464 7713 7495 7510 7711 7618 7607 7686 7705 7674Import of live animals 36 28 25 30 48 50 51 51 52 52Export of live animals 96 51 80 90 90 90 90 90 90 90Production (net) 7404 7691 7440 7450 7669 7578 7568 7647 7667 7636- Meat from destroyed animals 425Available net production 7404 7266 7440 7450 7669 7578 7568 7647 7667 7636Consumption 7269 6709 7349 7410 7450 7435 7452 7514 7540 7540Imports (meat) 379 350 410 400 410 418 422 425 425 425Exports (meat) 577 499 520 600 650 600 588 558 552 521Beginning stocks 65 2 309 270 110 89 50 0 0 0Ending stocks of which: 2 309 270 110 89 50 0 0 0 0 - Public Intervention Stocks 2 259 200 40 19 0 0 0 0 0 - Special Purchase Scheme (in storage) - 50 70 70 70 50 - - - -Stock changes -63 307 -39 -160 -21 -39 -50 0 0 0Special Purchase Scheme (for destruction) 100 20 0 0 0 0 0 0 0p.c. consumption (kg) 19.28 17.75 19.39 19.49 19.54 19.47 19.48 19.60 19.64 19.60
17 These projections are based on the assumption that the OTMS scheme in the UK will be maintained until
March 2004.

Chapter I DG AGRI EU-15
40
A lower production pattern combined with a swift recovery in beef consumption and theimpact of the special measures taken in 2000 and 2001 should contribute to the gradualimprovement in the balance of the EU beef market over the next few years (interventionstocks could be cleared as early as 2005). Variations in exports are expected to besufficient in order to cope with the cyclical ups and downs in production.
Pig meat
Pig meat production is foreseen to increase over the whole period, though at a slower ratethan in the past, reaching around 18.5 mio t by 2009. The medium-term outlook for pigmeat consumption is generally positive since pig meat is likely to continue to be favouredby consumers, although clearly less than poultry. Per capita pork consumption is projectedto increase from 43.6 kg/year in 2001 to around 45 kg/year by 2009.
Table 1.5. Pig meat projections in the EU, 2000 - 2009 ('000 t cwe)2000 2001 2002 2003 2004 2005 2006 2007 2008 2009
Production (gross) 17577 17534 17713 17754 17826 18092 18318 18333 18389 18510Import of live animals 1 1 0 1 1 1 1 1 1 1Export of live animals 1 3 5 5 5 5 5 5 5 5Production (net) 17577 17532 17708 17750 17822 18088 18314 18329 18385 18506Imports 49 52 50 60 69 72 76 80 83 89Exports 1339 1099 1200 1200 1146 1166 1199 1219 1239 1259Stock changes -100 0 0 0 0 0 0 0 0 0Consumption 16386 16486 16558 16610 16745 16995 17192 17190 17230 17336p.c. cons. (kg) 43.47 43.61 43.68 43.70 43.93 44.51 44.94 44.85 44.87 45.06
Poultry
The outlook for EU poultry production is relatively positive, even if it is expected toremain under strong pressure from competitive import flows (+350 000 tons between 1999and 2001) which could clearly constrain the EU production potential. Poultry consumptionshould continue to benefit from competitive prices with respect to other meats and strongconsumer preference. Per capita consumption is projected to increase from 23.4 kg/year in2001 to around 24.5 kg/year by 2009. This trend corresponds with the long-term growth indemand, which has been observed in the past.
Table 1.6. Poultry meat projections in the EU, 2000 - 2009 ('000 t cwe)2000 2001 2002 2003 2004 2005 2006 2007 2008 2009
Production (gross) 8814 9135 9088 9020 9102 9219 9363 9508 9617 9700Import of live animals 1 1 1 1 1 1 1 1 1 1Export of live animals 4 5 5 5 5 5 5 5 5 5Production (net) 8811 9131 9084 9016 9098 9215 9359 9504 9613 9696Imports 557 741 711 722 729 736 741 745 748 750Exports 974 966 1093 1000 1000 1000 1000 1000 1000 1000Stock changes -52 45 0 0 0 0 0 0 0 0Consumption 8446 8861 8702 8738 8827 8951 9100 9249 9361 9446p.c. cons. (kg) 22.40 23.44 22.96 22.99 23.16 23.44 23.79 24.13 24.38 24.55
1.3.1.4 Milk and dairy products
Milk production and deliveries to dairies broadly follow the same development, reflectingthe evolution of the milk reference quantities18. The rise in milk production resulting from 18 On-farm use of milk (which is not governed by quotas) only plays a minor role and continues its
decreasing trend, and direct sales are not concerned by the milk quota increases decided under Agenda2000.
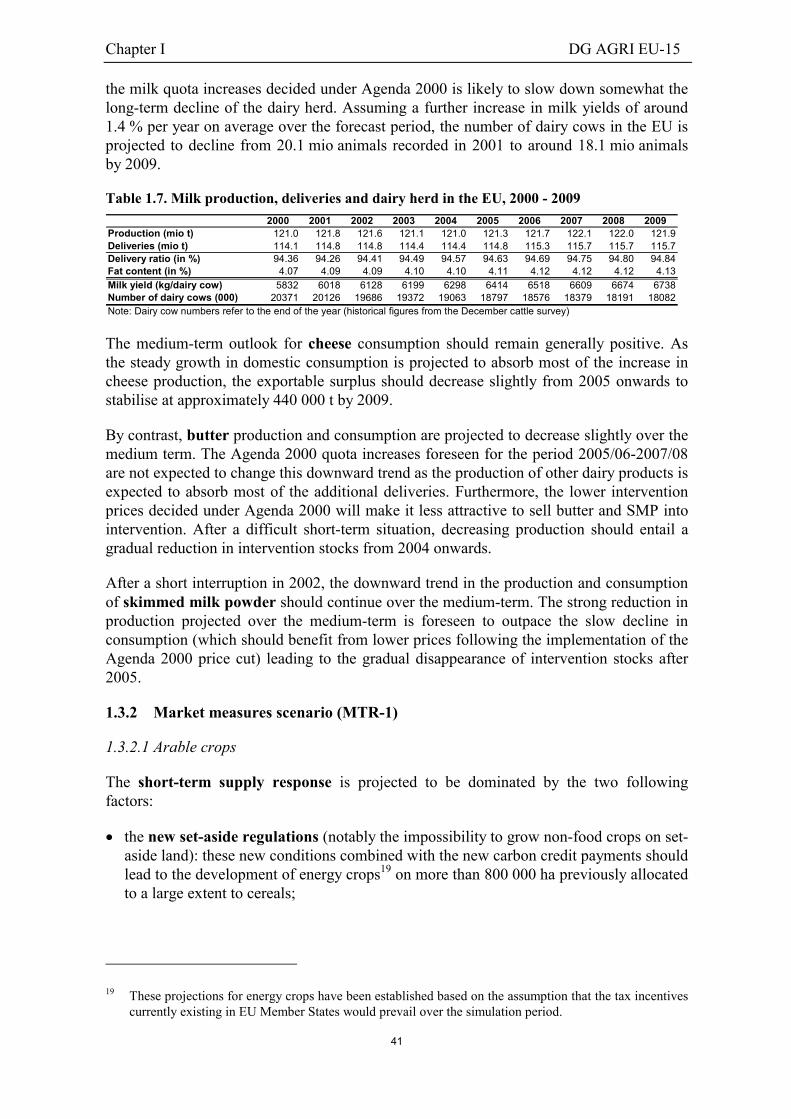
Chapter I DG AGRI EU-15
41
the milk quota increases decided under Agenda 2000 is likely to slow down somewhat thelong-term decline of the dairy herd. Assuming a further increase in milk yields of around1.4 % per year on average over the forecast period, the number of dairy cows in the EU isprojected to decline from 20.1 mio animals recorded in 2001 to around 18.1 mio animalsby 2009.
Table 1.7. Milk production, deliveries and dairy herd in the EU, 2000 - 20092000 2001 2002 2003 2004 2005 2006 2007 2008 2009
Production (mio t) 121.0 121.8 121.6 121.1 121.0 121.3 121.7 122.1 122.0 121.9Deliveries (mio t) 114.1 114.8 114.8 114.4 114.4 114.8 115.3 115.7 115.7 115.7Delivery ratio (in %) 94.36 94.26 94.41 94.49 94.57 94.63 94.69 94.75 94.80 94.84Fat content (in %) 4.07 4.09 4.09 4.10 4.10 4.11 4.12 4.12 4.12 4.13Milk yield (kg/dairy cow) 5832 6018 6128 6199 6298 6414 6518 6609 6674 6738Number of dairy cows (000) 20371 20126 19686 19372 19063 18797 18576 18379 18191 18082Note: Dairy cow numbers refer to the end of the year (historical figures from the December cattle survey)
The medium-term outlook for cheese consumption should remain generally positive. Asthe steady growth in domestic consumption is projected to absorb most of the increase incheese production, the exportable surplus should decrease slightly from 2005 onwards tostabilise at approximately 440 000 t by 2009.
By contrast, butter production and consumption are projected to decrease slightly over themedium term. The Agenda 2000 quota increases foreseen for the period 2005/06-2007/08are not expected to change this downward trend as the production of other dairy products isexpected to absorb most of the additional deliveries. Furthermore, the lower interventionprices decided under Agenda 2000 will make it less attractive to sell butter and SMP intointervention. After a difficult short-term situation, decreasing production should entail agradual reduction in intervention stocks from 2004 onwards.
After a short interruption in 2002, the downward trend in the production and consumptionof skimmed milk powder should continue over the medium-term. The strong reduction inproduction projected over the medium-term is foreseen to outpace the slow decline inconsumption (which should benefit from lower prices following the implementation of theAgenda 2000 price cut) leading to the gradual disappearance of intervention stocks after2005.
1.3.2 Market measures scenario (MTR-1)
1.3.2.1 Arable crops
The short-term supply response is projected to be dominated by the two followingfactors:
� the new set-aside regulations (notably the impossibility to grow non-food crops on set-aside land): these new conditions combined with the new carbon credit payments shouldlead to the development of energy crops19 on more than 800 000 ha previously allocatedto a large extent to cereals;
19 These projections for energy crops have been established based on the assumption that the tax incentives
currently existing in EU Member States would prevail over the simulation period.
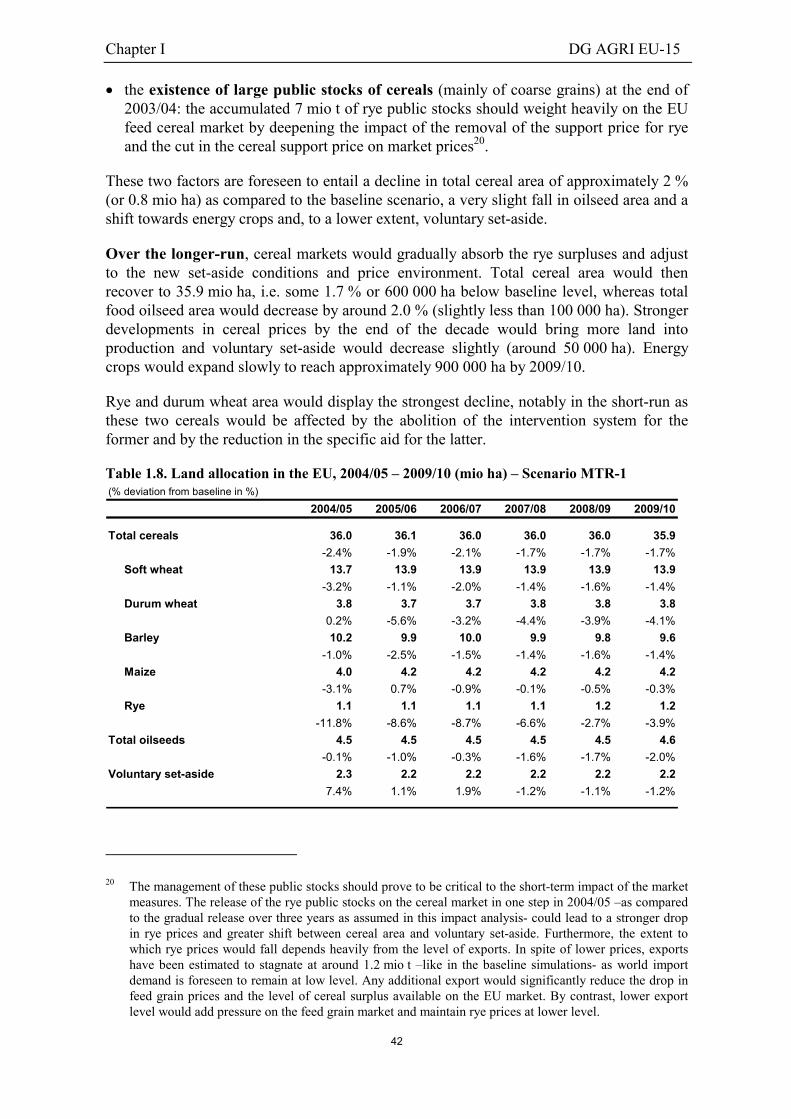
Chapter I DG AGRI EU-15
42
� the existence of large public stocks of cereals (mainly of coarse grains) at the end of2003/04: the accumulated 7 mio t of rye public stocks should weight heavily on the EUfeed cereal market by deepening the impact of the removal of the support price for ryeand the cut in the cereal support price on market prices20.
These two factors are foreseen to entail a decline in total cereal area of approximately 2 %(or 0.8 mio ha) as compared to the baseline scenario, a very slight fall in oilseed area and ashift towards energy crops and, to a lower extent, voluntary set-aside.
Over the longer-run, cereal markets would gradually absorb the rye surpluses and adjustto the new set-aside conditions and price environment. Total cereal area would thenrecover to 35.9 mio ha, i.e. some 1.7 % or 600 000 ha below baseline level, whereas totalfood oilseed area would decrease by around 2.0 % (slightly less than 100 000 ha). Strongerdevelopments in cereal prices by the end of the decade would bring more land intoproduction and voluntary set-aside would decrease slightly (around 50 000 ha). Energycrops would expand slowly to reach approximately 900 000 ha by 2009/10.
Rye and durum wheat area would display the strongest decline, notably in the short-run asthese two cereals would be affected by the abolition of the intervention system for theformer and by the reduction in the specific aid for the latter.
Table 1.8. Land allocation in the EU, 2004/05 – 2009/10 (mio ha) – Scenario MTR-1(% deviation from baseline in %)
2004/05 2005/06 2006/07 2007/08 2008/09 2009/10
Total cereals 36.0 36.1 36.0 36.0 36.0 35.9-2.4% -1.9% -2.1% -1.7% -1.7% -1.7%
Soft wheat 13.7 13.9 13.9 13.9 13.9 13.9-3.2% -1.1% -2.0% -1.4% -1.6% -1.4%
Durum wheat 3.8 3.7 3.7 3.8 3.8 3.80.2% -5.6% -3.2% -4.4% -3.9% -4.1%
Barley 10.2 9.9 10.0 9.9 9.8 9.6-1.0% -2.5% -1.5% -1.4% -1.6% -1.4%
Maize 4.0 4.2 4.2 4.2 4.2 4.2-3.1% 0.7% -0.9% -0.1% -0.5% -0.3%
Rye 1.1 1.1 1.1 1.1 1.2 1.2-11.8% -8.6% -8.7% -6.6% -2.7% -3.9%
Total oilseeds 4.5 4.5 4.5 4.5 4.5 4.6-0.1% -1.0% -0.3% -1.6% -1.7% -2.0%
Voluntary set-aside 2.3 2.2 2.2 2.2 2.2 2.27.4% 1.1% 1.9% -1.2% -1.1% -1.2%
20 The management of these public stocks should prove to be critical to the short-term impact of the market
measures. The release of the rye public stocks on the cereal market in one step in 2004/05 –as comparedto the gradual release over three years as assumed in this impact analysis- could lead to a stronger dropin rye prices and greater shift between cereal area and voluntary set-aside. Furthermore, the extent towhich rye prices would fall depends heavily from the level of exports. In spite of lower prices, exportshave been estimated to stagnate at around 1.2 mio t –like in the baseline simulations- as world importdemand is foreseen to remain at low level. Any additional export would significantly reduce the drop infeed grain prices and the level of cereal surplus available on the EU market. By contrast, lower exportlevel would add pressure on the feed grain market and maintain rye prices at lower level.

Chapter I DG AGRI EU-15
43
Total cereal production would drop by 1.4 % by 2009/10 (i.e. 3 mio t) as yields shouldincrease on account of the decrease in area planted and higher price perspectives, and thuspartially compensate the decline in area harvested. Wheat would exhibit a 2 mio t fall inproduction level (soft wheat falling by 1.4 % and durum wheat by 4.1 %), while coarsegrain production would only decrease by 1.1 % (the significant drop in rye productionbeing cushioned by the milder fall in maize production).
Table 1.9. Total cereals balance sheet in the EU, 2004/05 – 2009/10 (mio t) Scenario MTR-1(deviation from baseline in %)
2004/05f 2005/06f 2006/07f 2007/08f 2008/09f 2009/10fProduction 208.3 212.4 214.6 217.6 220.0 221.7
-2.7% -1.5% -2.1% -1.4% -1.5% -1.4%Consumption 193.8 195.5 196.0 197.1 199.0 200.1
0.1% 0.4% -0.2% -0.2% -0.2% -0.2%Exports 29.5 29.5 29.8 30.7 31.1 31.7
-1.5% -1.9% -2.7% -2.5% -2.3% -2.2%Ending stocks 30.0 27.7 26.7 26.8 27.0 27.1
-11.5% -17.9% -22.8% -23.8% -25.1% -26.2% of which intervention stocks 3.0 1.0 0.0 0.0 0.0 0.0
-54.9% -85.9% -100.0% -100.0% -100.0% -100.0%
The reduction in the cereal support price should affect EU border protection for cereals21
and generate additional imports estimated at approximately 1 mio t for wheat and, to alower extent, barley.
The removal of the intervention price for rye and the reduction in support price for theother cereals would trigger a short-run fall in the market prices of feed cereals in the EUranging between 1 % and 3 %. Lower cereal prices would lead to a small increase in totalcereal consumption, whereas lower availability should constrain cereal exports, inparticular for common wheat and durum wheat.
From 2006/07 onwards -when all public stocks of rye are released on the market- cerealprices would start rising above baseline levels (for around 1%) as cereal area would remainconstrained by the development in energy crop area. As a result, the lower price-competitiveness of EU cereals would affect both domestic consumption and exports whichwould decline by 0.2 % and 2.2 % respectively by 2009/10. The overall reduction in thelevel of cereal price support would enable to restore the balance of EU cereal markets, withstocks dropping swiftly and stabilising at approximately 27 mio t (i.e. some 10 mio t belowbaseline level) and no public stocks.
The projected improvement in the overall balance of the EU cereal market remainsstrongly conditioned by the existence of a mandatory system of land set-aside, whichremains set at the 10 % reference rate. Any changes in this reference rate couldsignificantly modify the overall picture of the cereal market as given above22. 21 Note that this analysis does not take account of the latest cereal import regime negotiated with Canada
and the US.22 In this respect, it is worth noting that a reference rate of 0 % would trigger a significant rise in EU cereal
production (some 4 mio t over baseline level). In spite of higher domestic and external demand, largeravailability on the EU cereal market would lead to much lower cereal prices (more than 10 % belowbaseline levels) and an accumulation of stocks that would develop beyond 40 mio t, of which more than15 mio t of public stocks of barley (a 60 % rise vs. the baseline).

Chapter I DG AGRI EU-15
44
Table 1.10. Rye balance sheet in the EU, 2004/05 – 2009/10 (mio t) – Scenario MTR-1(% deviation from baseline)
2004/05 2005/06 2006/07 2007/08 2008/09 2009/10Production 5.3 5.5 5.5 5.8 6.1 6.2
-11.9% -9.6% -9.5% -6.9% -2.7% -4.0%Consumption 6.6 6.4 5.5 4.7 4.9 5.0
65.1% 45.2% 25.8% 3.5% 11.0% 6.8%Exports 1.2 1.2 1.2 1.2 1.2 1.2
0.0% 0.0% 0.0% 0.0% 0.0% 0.0%Ending stocks 4.0 2.0 0.8 0.7 0.7 0.7
-45.2% -75.0% -90.3% -92.1% -92.4% -92.7% of which intervention stocks 3.0 1.0 0.0 0.0 0.0 0.0
-54.9% -85.9% -100.0% -100.0% -100.0% -100.0%
Unlike barley and maize -that would still benefit from a support price that would help tosustain their market prices- rye prices would drop sharply (-18 % and –14 % in 2004/05and 2005/06) under the assumption of a progressive three-year release of rye public stocks.This fall in prices would entail a sharp reduction in production levels, which would fall byabout 10 % in the short run, whereas domestic consumption would strongly increase inview of its improved price-competitiveness.
Over the medium term, the gradual release of rye public stocks would allow to smooth theadjustment of the sector. Thanks to market prices ranging some 2 % below baseline levels,rye production would decrease by 4 % by 2009/10, whereas rye consumption would rise by7 %.
The cut in the cereal support price is projected to alleviate the impact of the abolition ofrye intervention on the barley market by supporting barley’s competitiveness on the EUdomestic feed market. The short-term fall in barley prices would enable to sustain barleydemand, whereas the decrease in barley area would remain limited (as compared to softwheat) by some shift in production area from rye to barley.
Over the medium term, barley prices would develop some 1 % above baseline levels, withproduction, consumption and export levels down 1.4 %, 0.5 % and 2.2 % respectively.
Table 1.11. Barley balance sheet in the EU, 2004/05 – 2009/10 (mio t) – Scenario MTR-1(% deviation from baseline in %)
2004/05 2005/06 2006/07 2007/08 2008/09 2009/10Production 46.6 45.6 46.4 46.4 46.3 45.8
-1.0% -3.0% -1.6% -1.3% -1.5% -1.4%Consumption 39.7 38.0 38.1 38.0 37.8 37.3
0.1% -3.1% -1.4% -0.4% -0.7% -0.5%Exports 8.6 8.7 8.6 8.8 8.8 8.8
0.0% -0.6% -2.3% -2.8% -2.8% -2.2%Ending stocks 6.5 5.7 5.7 5.7 5.6 5.6
-3.9% -3.9% -1.3% -1.1% -0.9% -1.9% of which intervention stocks 0.0 0.0 0.0 0.0 0.0 0.0
The durum wheat sector would display a small short-term increase in production as theprices of other competing cereals fall and the granting of the quality premium more thancompensates the progressive reduction in the specific payment. As domestic (feed)

Chapter I DG AGRI EU-15
45
consumption would show a slight decline, exports would rise by more than 4 %. Over themedium term, the impact of the full reduction in the specific payment would be partiallyoffset by the quality premium and a lower overshoot of the maximum guaranteed area. Itshould then entail a limited fall in durum wheat production, but a more pronounced fall inexports.
Table 1.12. EU durum wheat balance sheet, 2004/05 – 2009/10 (mio t) – Scenario MTR-1(% deviation from baseline in %)
2004/05 2005/06 2006/07 2007/08 2008/09 2009/10Production 9.8 9.4 9.7 9.8 9.9 10.1
0.2% -5.6% -3.2% -4.4% -3.9% -4.1%Consumption 9.2 9.3 9.4 9.5 9.7 9.8
-0.5% -0.5% -0.3% -0.3% -0.3% -0.3%Exports 1.6 1.1 1.3 1.2 1.2 1.3
4.2% -32.2% -18.6% -25.5% -24.3% -24.1%Ending stocks 0.6 0.6 0.6 0.6 0.6 0.6
0.0% 0.0% 0.0% 0.0% 0.0% 0.0% of which intervention stocks 0.0 0.0 0.0 0.0 0.0 0.0
1.3.2.2 Rice
The reduction of around 50 % in the support price for rice should bring EU domestic pricesto world market levels23 (at around 230 $/t, regular milled indica equivalent, Thailand orig.CIF Rotterdam). Import duties would become very low or even nil for husked rice(depending on the changes in the $/EUR exchange rate). By contrast, import duties formilled rice would remain substantial.
Total EU rice production would only decline by some 12 % - in comparison with baselinelevels - to 1.5 mio t in 2009/10, thus maintaining the production potential of the EU ricesector. This drop would result from a fall in areas (-9 %) and lower yields (-4 % onaverage). As the reduction in market prices would only be partially compensated by thegranting of direct payments, the total rice area would decrease to 391 000 ha in 2009/10,i.e. below the total proposed MGA (392 800 ha).
The increase in direct payments and the fall in prices would combine to entail a markedslowdown in total productivity growth. Like for area developments, indica yields would beslightly more affected than japonica yields.
The fall of about 50 % in market prices would boost rice consumption that wouldincrease by more than 10 % on average to reach 2.3 mio t in 2009/10. This represents agrowth in per capita consumption of approximately 0.6 kg and some 250 000 t per yearover baseline levels from 2004/05 to 2009/10.
Lower supply combined with rising demand would set the stage for a short-term surge innet imports that would rise to 200 000 t over baseline levels by 2005/06. However, thefull implementation of the EBA agreement at the end of the period would not have a
23 Japonica prices have been assumed to trade some 5% above indica prices as was the case on world
markets over the most recent years.

Chapter I DG AGRI EU-15
46
dramatic impact on the market balance and public stocks, as total imports would be limitedto slightly less than 900 000 t (as compared to 1.7 mio t under the status quo scenario).
Table 1.13. Total rice balance sheet in the EU, 2004/05 – 2009/10 (000 t) – Scenario MTR-1(% deviation from baseline in %)
2004/05 2005/06 2006/07 2007/08 2008/09 2009/10Production 1 409 1 441 1 459 1 477 1 496 1 516
-12.3% -12.2% -12.2% -12.5% -12.7% -12.5% Area (000 ha) 375 381 384 386 388 391
-9.0% -8.9% -8.9% -9.0% -9.1% -8.6% Yield (t/ha) 3.8 3.8 3.8 3.8 3.9 3.9
-3.7% -3.6% -3.7% -3.8% -3.9% -4.3%Consumption 2 180 2 205 2 233 2 272 2 307 2 338
13.1% 13.3% 13.5% 13.7% 10.7% 10.7%Exports 29 20 24 30 32 21
-87.1% -90.8% -89.1% -86.3% -85.6% -90.6%Imports 418 788 801 830 847 846
-28.3% 32.6% 32.6% 10.8% -40.7% -50.2%Ending stocks 273 276 279 284 288 292
-60.8% -63.8% -66.8% -73.2% -84.8% -90.2% of which intervention stocks 0 0 0 0 0 0
-100.0% -100.0% -100.0% -100.0% -100.0% -100.0%
Whereas total imports were projected to represent some 30 % of total EU consumption by2008/09 before rising to 80 % under a status quo policy, the substantial drop in internalmarket prices would enable the EU market to lessen its dependency on imported rice. Theimport/consumption ratio would stabilise below 40 % over the whole period thanks to thegreater price competitiveness of EU production and to the EU market becoming lessattractive as an import market, since domestic prices would develop at world marketlevels.
1.3.2.3 Meat and milk production
The impact of the market measures on the animal sector would mainly take place throughthe projected changes in feed prices. Given the low magnitude of feed price changes,negative in the short run and positive but below or at 1 % in the later years, the meat anddairy sectors would show only nil or marginal changes in the main market variables. In theearly part of the 2004-2009 period, pork and poultry production and consumption wouldbenefit from lower feed prices and would display a limited increase of 0.1 %, whereas theirproducer prices would stand between 0.5 % and 1 % below baseline levels. In the latteryears, higher feed prices would entail slightly higher pork and poultry prices and lowerproduction and consumption of white meat. The impact on the beef sector would come notonly from developments on feed prices, but also from competition on the demand side.Beef prices, production and consumption are projected to exhibit a similar pattern to thewhite meat sector, though at a more moderate pace.
1.3.3 Modulation scenario MTR-21.3.3.1 Arable crops
The implementation of a dynamic modulation on all payments would have a limited impacton arable crop markets when compared to the market measures (MTR-1). The progressivedecline in the level of direct payments would slightly affect oilseed area –as these crops are

Chapter I DG AGRI EU-15
47
more sensitive than other arable crops to the level of support- to the benefit of voluntaryset-aside which would develop marginally above the MTR-1 level and, to a lower extent,cereals.Table 1.14. Land allocation in the EU, 2004/05 – 2009/10 (mio ha) – Scenario MTR-2(% deviation from baseline in %)
2004/05 2005/06 2006/07 2007/08 2008/09 2009/10
Total cereals 36.0 36.1 36.0 36.0 36.0 35.9-2.5% -1.9% -2.0% -1.7% -1.7% -1.6%
Total oilseeds 4.5 4.5 4.5 4.5 4.5 4.6-0.1% -1.1% -0.6% -1.8% -2.0% -2.4%
Voluntary set-aside 2.3 2.2 2.2 2.2 2.2 2.29.1% 1.5% 2.1% -0.3% 0.3% -0.1%
The impact of modulation on cereal markets would be marginal when compared to theMTR-1 as shown by the table below.
Table 1.15. EU total cereals balance sheet, 2004/05 – 2009/10 (mio t) – Scenario MTR-2(% deviation from baseline in %)
2004/05 2005/06 2006/07 2007/08 2008/09 2009/10Production 208.0 212.4 214.6 217.5 219.9 221.6
-2.8% -1.5% -2.1% -1.4% -1.5% -1.4%Consumption 193.7 195.4 196.0 197.1 198.8 200.0
0.1% 0.4% -0.3% -0.2% -0.3% -0.2%Exports 29.4 29.5 29.9 30.6 31.0 31.7
-1.8% -1.8% -2.5% -2.7% -2.5% -2.4%Ending stocks 29.9 27.7 26.7 26.8 27.0 27.3
-11.8% -17.9% -22.7% -23.8% -25.0% -25.8% of which intervention stocks 3.0 1.0 0.0 0.0 0.0 0.0
-54.8% -86.1% -100.0% -100.0% -100.0% -100.0%
1.3.3.2 Rice
In a similar way, the developments on the rice market would not be significantly affectedby the dynamic modulation. Only area harvested would display a small decline against thesole implementation of the market measures
Table 1.16. Total rice balance sheet in the EU, 2004/05 – 2009/10 (mio t) – Scenario MTR-2(% deviation from baseline in %)
2004/05 2005/06 2006/07 2007/08 2008/09 2009/10Production 1 406 1 438 1 454 1 469 1 485 1 502
-12.5% -12.3% -12.6% -13.0% -13.3% -13.3% Area (000 ha) 374 380 382 383 385 386
-9.2% -9.1% -9.3% -9.7% -10.0% -9.7% Yield (t/ha) 3.8 3.8 3.8 3.8 3.9 3.9
-3.6% -3.6% -3.6% -3.6% -3.6% -4.0%Consumption 2 180 2 205 2 233 2 272 2 307 2 338
13.1% 13.3% 13.5% 13.7% 10.7% 10.7%Imports 421 791 807 839 858 860
-27.8% 33.1% 33.5% 11.9% -39.9% -49.4%Ending stocks 273 276 279 284 288 292
-60.8% -63.8% -66.8% -73.2% -84.8% -90.2%
Chapter I DG AGRI EU-15
48
1.3.3.3 Meat and milk production
As compared to the impact of market measures mentioned in the previous section, the onlynoticeable impact of dynamic modulation on these sectors concerns the suckler cowactivity which, in the face of the high share of direct payments in the total receipts of thisactivity, would show a decline in the total suckler cow herd of some 1% below baselinelevels.
1.3.4 Full Mid-Term Review scenario
It should be first acknowledged that the quantitative assessment of the impact of thedecoupling of direct payments is in general a difficult analytical task, and in particular withthe modelling tools currently available. Thus caution is deemed necessary when analysingand interpreting the results from this quantitative analysis.
If the support to the agricultural sector becomes decoupled, producers may be expected toincreasingly base their production decisions on market signals (profitability expectations),thus potentially leading to significant changes in the allocation of production. Howeverproducers’ behaviour could also be influenced by other considerations, such as socialinertia (arguably a short-term issue), the maintenance of some crops for agronomicpurposes, the participation in agri-environmental programmes, the need to depreciate long-term investment, the eligibility to Less Favoured Area payments –which requires thecontinuation of production- etc, which could all be expected to mitigate the overall impactof decoupling on the farm sector.
Production may also be expected to adjust when market revenues do not cover variablecost on a structural basis (such as some crop production in marginal areas, in the beef andsheep sectors where the support system may create incentives to base production decisionson the maximisation of subsidy revenues rather than on the basis of what market priceswould normally imply).
This adjustment could take several forms including:
� An adjustment in the production mix (including non-eligible production alternatives):this adjustment may be expected to be constrained between major production sectors -such animal and arable crop sectors- as the conversion of pasture land to arable landcould be limited on a statutory basis. Any significant shift between COP products andfresh fruit and vegetables production may also be reasonably assumed to be limited as amajor increase in land allocation towards fruit and vegetables could create majoreconomic disturbances in these sectors;
� An adjustment in the production intensity, notably in the beef and sheep sectors;
� Abandonment of production: this alternative may be expected to be constrained bycross-compliance conditions for the receipt of the single payment (it may, in somecases, be more profitable for some producers to simply reduce their production intensitythan to stop producing);
� Adjustment in the farm structure with sale or lease of all or part of the land: this lastalternative does not necessarily entail a reduction in the production potential.

Chapter I DG AGRI EU-15
49
The present analytical work attempted to capture these elements and quantify their effecton the agricultural sector. The main impacts of the full Mid-Term Review proposals onland allocation in the EU over the medium term can be summarised as follows:
� A reduction in the area grown in cereals by around 2.5 % (or around 0.9 mio ha), withmost of the impact being felt by durum wheat (-10 %) and rye (-9 %);
� A slightly higher fall in oilseeds area (approximately 3 %);
� The development of energy crops on between 0.8 and 0.9 mio ha previously allocated toa large extent to cereals;
� A decline in silage area by some 7 % resulting mainly from the decline in beefproduction, greater incentives to shift towards more extensive animal productionmethods and competition from other fodder crops area;
� An increase in voluntary set-aside (beyond the mandatory environmental set-aside) ofapproximately 30% (or 0.6 mio ha).
The impact of decoupling alone would thus entail a further reduction in grain cereal area ofsome 300 000 ha as opposed to the sole implementation of market measures andmodulation. A similar pattern is found in the oilseed sector where the introduction of asingle farm income payment would generate a further decline in area cropped of some50 000 ha24. However, these changes may be considered as rather limited when comparedto the effect of the market measures and modulation.
Table 1.17. Land allocation in the EU, 2004/05 – 2009/10 (mio ha) – Scenario MTR-3(% deviation from baseline in %)
2004/05 2005/06 2006/07 2007/08 2008/09 2009/10
Total cereals 35.7 35.7 35.8 35.7 35.7 35.6-3.3% -3.0% -2.7% -2.5% -2.4% -2.5%
Soft wheat 14.0 14.0 14.0 14.0 14.0 14.0-1.4% -0.6% -0.9% -0.9% -0.6% -1.0%
Durum wheat 3.6 3.5 3.5 3.6 3.6 3.6-6.4% -9.9% -8.6% -9.7% -9.7% -9.7%
Barley 10.1 9.9 10.1 9.9 9.9 9.6-1.7% -3.1% -0.1% -1.6% -0.6% -1.3%
Maize 4.0 4.1 4.2 4.1 4.2 4.1-3.8% -2.2% -2.0% -2.2% -1.7% -2.4%
Rye 1.0 1.0 1.0 1.1 1.1 1.1-21.4% -18.1% -18.6% -12.1% -7.8% -8.7%
Total oilseeds 4.3 4.4 4.4 4.5 4.5 4.6-3.6% -2.4% -2.6% -3.1% -3.3% -2.8%
Voluntary set-aside 3.0 2.9 2.8 2.8 2.8 2.838.8% 32.7% 30.5% 28.7% 27.5% 27.4%
24 These results have to be examined in the light of the findings of a micro-economic analysis (based on
simulations using the Farm Accountancy Data Network) which would show that the share of outputgenerated from farms where market revenues would not cover the variable costs could amount toapproximately 20 % in the beef sector, 30% in the sheep sector, 15 % in the cereal sector and 20 % inthe oilseed sector.

Chapter I DG AGRI EU-15
50
In contrast, the largest impact of decoupling on the crop sector is projected to be found inthe fodder production sector, notably in silage area, and in the development of voluntaryset-aside (abandonment of production) which would rise by a further 600 000 ha as someland are foreseen to move out production owing to low profitability.
The overall impact on the overall cereal market would broadly follow the projected impactof the market measures:
� Total cereal production would be constrained by the development of energy crops andthe rise in voluntary set-aside. It would decline by 2.0 % by 2009/10 (or 4-5 mio t), i.e. alimited further decline of 1 mio t from the impact of the market measures. Rye, durumwheat and maize would be the most affected cereals;
� Total cereal consumption would in turn decline by some 0.5 % (or 1 mio t) in the faceof lower availability, higher prices and a projected reduction in feed demand from theanimal sector (estimated at between 0.5 % and 1 %, due to the fall in beef productionwhich would only be partially compensated by the slight increase in white meatproduction);
� Lower production and higher domestic prices would also affect the competitiveness ofEU exports which would fall by approximately 3 %, whereas EU cereal imports wouldincrease owing to the reduction in EU’s border protection (linked to the cut in supportprice);
� Total cereal stocks would drop significantly by 25 % to stabilise at around 27 mio t,with no cereal in public stocks.
Table 1.18. Total cereal balance sheet in the EU, 2004/05 – 2009/10 (mio t) – Scenario MTR-3(% deviation from baseline in %)
2004/05 2005/06 2006/07 2007/08 2008/09 2009/10Production 207.8 210.4 214.3 216.2 219.5 220.2
-3.0% -2.5% -2.2% -2.0% -1.7% -2.0%Consumption 193.6 194.0 195.3 196.2 198.4 199.3
0.0% -0.3% -0.6% -0.6% -0.5% -0.5%Exports 29.4 29.0 30.0 30.2 31.0 31.2
-1.6% -3.4% -2.1% -3.8% -2.7% -3.8%Ending stocks 29.8 27.4 26.6 26.6 27.0 26.9
-12.1% -18.8% -23.1% -24.3% -25.0% -26.7% of which intervention stocks 3.0 1.0 0.0 0.0 0.0 0.0
-55.2% -85.8% -100.0% -100.0% -100.0% -100.0%
The EU rye market would display the greatest improvement with a progressive restorationof market balance. Lower production volume and higher consumption –supported by lowerprices- would allow in the short run to absorb the accumulated surplus of rye in publicstocks by 2004 and to generate a gradual recovery in market prices close to pre-Mid-TermReview levels in the later years.
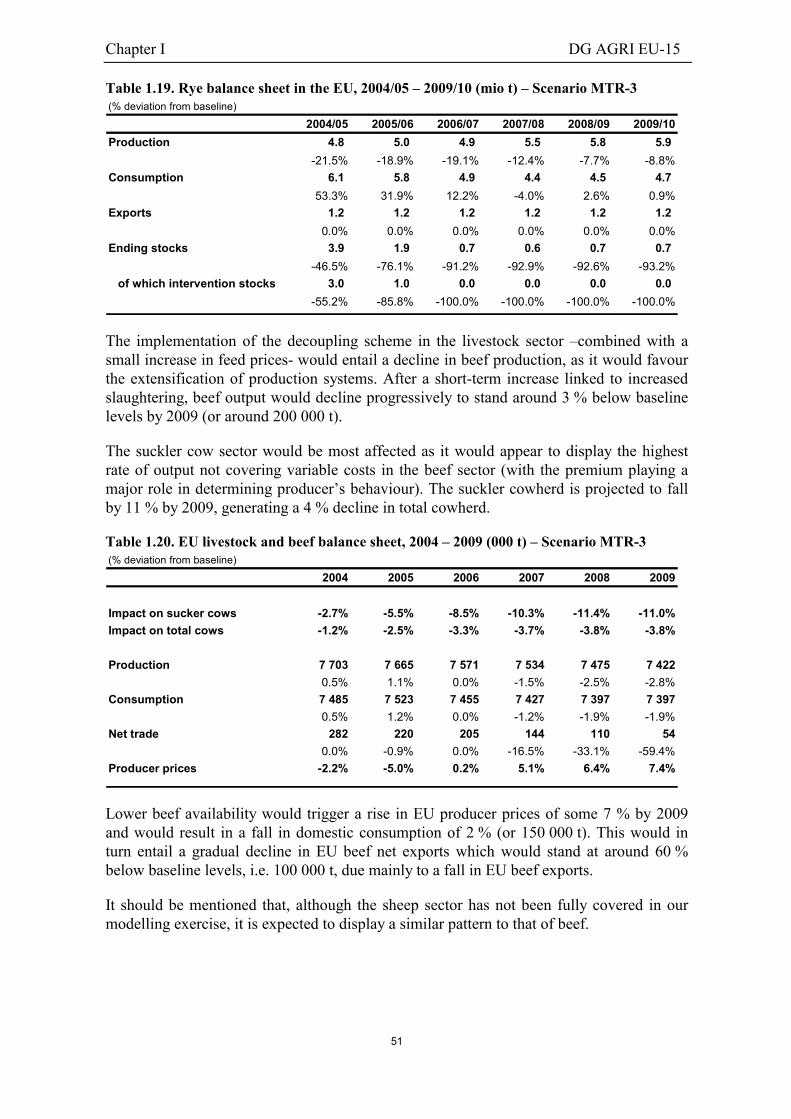
Chapter I DG AGRI EU-15
51
Table 1.19. Rye balance sheet in the EU, 2004/05 – 2009/10 (mio t) – Scenario MTR-3(% deviation from baseline)
2004/05 2005/06 2006/07 2007/08 2008/09 2009/10Production 4.8 5.0 4.9 5.5 5.8 5.9
-21.5% -18.9% -19.1% -12.4% -7.7% -8.8%Consumption 6.1 5.8 4.9 4.4 4.5 4.7
53.3% 31.9% 12.2% -4.0% 2.6% 0.9%Exports 1.2 1.2 1.2 1.2 1.2 1.2
0.0% 0.0% 0.0% 0.0% 0.0% 0.0%Ending stocks 3.9 1.9 0.7 0.6 0.7 0.7
-46.5% -76.1% -91.2% -92.9% -92.6% -93.2% of which intervention stocks 3.0 1.0 0.0 0.0 0.0 0.0
-55.2% -85.8% -100.0% -100.0% -100.0% -100.0%
The implementation of the decoupling scheme in the livestock sector –combined with asmall increase in feed prices- would entail a decline in beef production, as it would favourthe extensification of production systems. After a short-term increase linked to increasedslaughtering, beef output would decline progressively to stand around 3 % below baselinelevels by 2009 (or around 200 000 t).
The suckler cow sector would be most affected as it would appear to display the highestrate of output not covering variable costs in the beef sector (with the premium playing amajor role in determining producer’s behaviour). The suckler cowherd is projected to fallby 11 % by 2009, generating a 4 % decline in total cowherd.
Table 1.20. EU livestock and beef balance sheet, 2004 – 2009 (000 t) – Scenario MTR-3(% deviation from baseline)
2004 2005 2006 2007 2008 2009
Impact on sucker cows -2.7% -5.5% -8.5% -10.3% -11.4% -11.0%Impact on total cows -1.2% -2.5% -3.3% -3.7% -3.8% -3.8%
Production 7 703 7 665 7 571 7 534 7 475 7 4220.5% 1.1% 0.0% -1.5% -2.5% -2.8%
Consumption 7 485 7 523 7 455 7 427 7 397 7 3970.5% 1.2% 0.0% -1.2% -1.9% -1.9%
Net trade 282 220 205 144 110 540.0% -0.9% 0.0% -16.5% -33.1% -59.4%
Producer prices -2.2% -5.0% 0.2% 5.1% 6.4% 7.4%
Lower beef availability would trigger a rise in EU producer prices of some 7 % by 2009and would result in a fall in domestic consumption of 2 % (or 150 000 t). This would inturn entail a gradual decline in EU beef net exports which would stand at around 60 %below baseline levels, i.e. 100 000 t, due mainly to a fall in EU beef exports.
It should be mentioned that, although the sheep sector has not been fully covered in ourmodelling exercise, it is expected to display a similar pattern to that of beef.
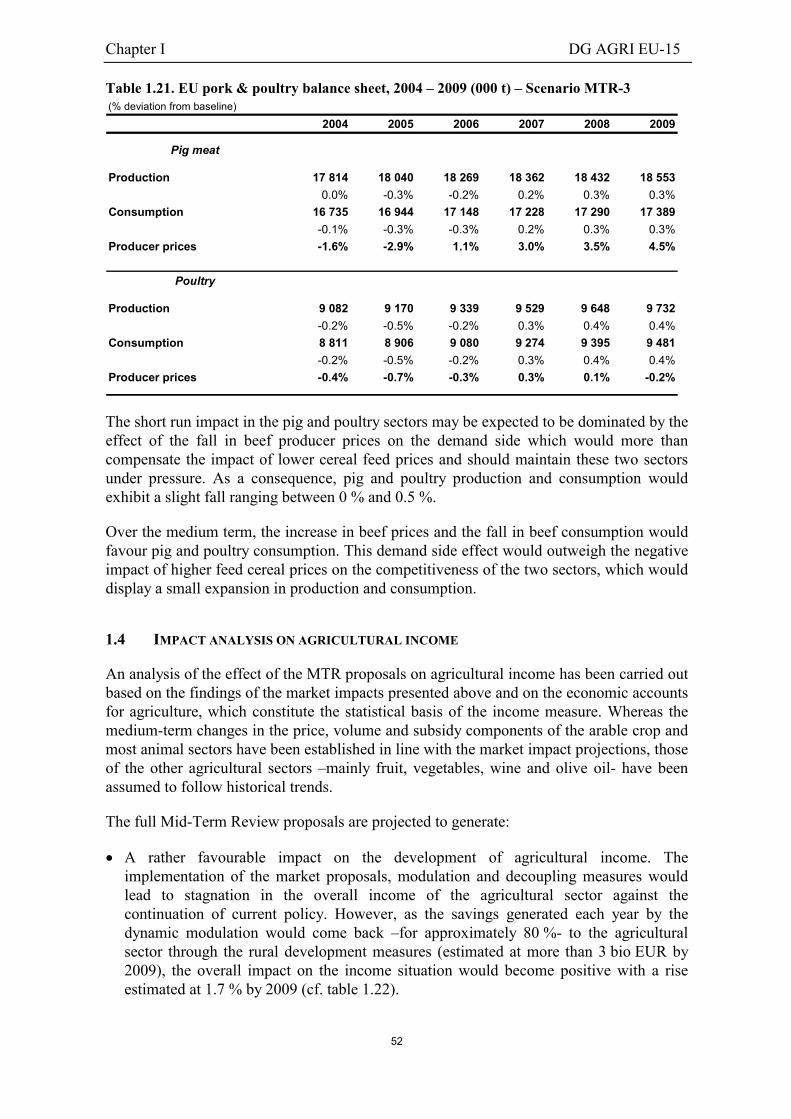
Chapter I DG AGRI EU-15
52
Table 1.21. EU pork & poultry balance sheet, 2004 – 2009 (000 t) – Scenario MTR-3(% deviation from baseline)
2004 2005 2006 2007 2008 2009
Pig meat
Production 17 814 18 040 18 269 18 362 18 432 18 5530.0% -0.3% -0.2% 0.2% 0.3% 0.3%
Consumption 16 735 16 944 17 148 17 228 17 290 17 389-0.1% -0.3% -0.3% 0.2% 0.3% 0.3%
Producer prices -1.6% -2.9% 1.1% 3.0% 3.5% 4.5%
Poultry
Production 9 082 9 170 9 339 9 529 9 648 9 732-0.2% -0.5% -0.2% 0.3% 0.4% 0.4%
Consumption 8 811 8 906 9 080 9 274 9 395 9 481-0.2% -0.5% -0.2% 0.3% 0.4% 0.4%
Producer prices -0.4% -0.7% -0.3% 0.3% 0.1% -0.2%
The short run impact in the pig and poultry sectors may be expected to be dominated by theeffect of the fall in beef producer prices on the demand side which would more thancompensate the impact of lower cereal feed prices and should maintain these two sectorsunder pressure. As a consequence, pig and poultry production and consumption wouldexhibit a slight fall ranging between 0 % and 0.5 %.
Over the medium term, the increase in beef prices and the fall in beef consumption wouldfavour pig and poultry consumption. This demand side effect would outweigh the negativeimpact of higher feed cereal prices on the competitiveness of the two sectors, which woulddisplay a small expansion in production and consumption.
1.4 IMPACT ANALYSIS ON AGRICULTURAL INCOME
An analysis of the effect of the MTR proposals on agricultural income has been carried outbased on the findings of the market impacts presented above and on the economic accountsfor agriculture, which constitute the statistical basis of the income measure. Whereas themedium-term changes in the price, volume and subsidy components of the arable crop andmost animal sectors have been established in line with the market impact projections, thoseof the other agricultural sectors –mainly fruit, vegetables, wine and olive oil- have beenassumed to follow historical trends.
The full Mid-Term Review proposals are projected to generate:
� A rather favourable impact on the development of agricultural income. Theimplementation of the market proposals, modulation and decoupling measures wouldlead to stagnation in the overall income of the agricultural sector against thecontinuation of current policy. However, as the savings generated each year by thedynamic modulation would come back –for approximately 80 %- to the agriculturalsector through the rural development measures (estimated at more than 3 bio EUR by2009), the overall impact on the income situation would become positive with a riseestimated at 1.7 % by 2009 (cf. table 1.22).

Chapter I DG AGRI EU-15
53
Table 1.22. EU agricultural income in 2009 – Scenario MTR-3
(deviation from baseline in %)2001 Status Quo scenario MTR - 3 scenario
Agricultural Output 100 105 98-6.6%
Intermediate Consumption 100 109 109-0.2%
Gross value added 100 101 88-12.7%
Other subsidies on production 100 111 288160.1%
Factor income 100 99 1001.7%
Farm Income / Work Unit* 100 122 1241.7%
* Assuming a constant 2.8 % reduction in agricultural labour input
� A radical change in the structure of agricultural income: if the bulk of direct paymentsare currently accounted for as subsidies on products, i.e. part of the value of output, theywill be recorded as income payments when fully decoupled in the item “other subsidieson production”, thus leading to a fall in the value of output and in the gross value addedat basic price25 of the agricultural sector. However, this changing composition ofsupport to the farm sector should remain income-neutral. As shown in table 1.22, thevalue of output and gross value added would fall in nominal terms by some 7 % and13 % respectively, whereas the level of other subsidies would increase by 160 % thanksto the reclassification of direct payments as income payments.
The value of input costs would display rather limited developments as, after a short-termfall, feed prices would increase in the later years, thus offsetting most of the reduction inthe overall expenditure triggered by the small decrease in the production volumes of beefand arable crops. The major increase in “other subsidies” results from the reclassificationof the current direct payments and from the overall effect of the proposed increase in arablecrop direct payments and the estimated impact of the dynamic modulation system.
The MTR proposals would have diverging income impacts across the various commoditysectors and regions. Most favourable developments are expected to be found in the animalsector. This concerns notably the beef and pork sectors where the projected price increasesare foreseen to trigger a significant rise in market revenues, which should more thancompensate the decline in production volumes. In contrast, income development in thecereal sector may reasonably be expected to be affected by the reduction in the productionpotential and by the implementation of the dynamic modulation.
25 The basic price is the price used to value output in the national accounts. It corresponds to the producer
price –the amount received by the producer from the purchaser for a product- minus any tax on products,and plus any subsidy on products (such as the current direct payments).

Chapter I DG AGRI EU-15
54
1.5 CONCLUSIONS
The MTR proposals represent a significant change in EU agricultural policy by promotingfurther more competitive, market-oriented and sustainable agriculture. Whereas the overalllevel of support to the farm sector would change little, the changing composition of policyinstruments towards decoupled, non-commodity specific payments should lead to animproved allocation of resources and generate greater income transfer efficiency.
When presented in reference to the implementation of Agenda 2000, the results from theimpact analysis on agricultural markets and income show that the MTR proposals wouldprovide greater flexibility and market orientation in the producer’s management decisionswhile guaranteeing income stability to the agricultural sector, as they are projected tosignificantly contribute to:
� A reduction in the production level in several commodity sectors where productiondecisions are strongly influenced by the level of support and by the coupled policyinstruments in place. This concerns in particular the beef, sheep and durum wheatsectors. As a result, net exports of many farm commodities from the EU would decline;
� An improvement in the competitiveness of the cereal sector as lower support pricelevels should increase the adjustment capacity of the sector to future developments andopportunities on both the internal and external markets. If some of the reduction in EUcereal production is expected to result from decoupling, most would be generated by thenew provisions governing the set-aside regime and the support granted to energy crops;
� A significant improvement in the structural imbalance of the rye and rice sectors.
� A small increase in farm income as compared to the baseline: the MTR proposals wouldalso display a rather favourable impact on the income of the agricultural sector. Thereduction in the level of agricultural production and the implementation of dynamicmodulation are expected to be broadly compensated for by the resulting price rises andthe increase in the level of aids in the arable crops and rice sectors. However, given thataround 80 % of the savings from modulation can be assumed to return to theagricultural sector through the second pillar, the overall income would rise by some1.7 % by 2009.

Chapter I DG AGRI EU-15
55
Annex
A. Impact of Market measures (scenario MTR-1)
Table A.1 Total wheat balance sheet in the EU, 2004/05 – 2009/10 (mio t) – MTR-1
(deviation from baseline in %)2004/05f 2005/06f 2006/07f 2007/08f 2008/09f 2009/10f
Production 105.3 107.6 108.8 110.5 112.0 113.3-2.9% -1.5% -2.2% -1.6% -1.8% -1.6%
Consumption 95.3 96.8 97.8 98.7 99.7 100.5-1.3% -0.1% -0.6% -0.1% -0.4% -0.2%
Exports 17.0 17.0 17.4 18.1 18.5 19.1-2.5% -2.9% -3.5% -2.8% -2.5% -2.7%
Ending stocks 12.1 12.3 12.4 12.6 12.7 12.8-1.3% 0.1% -0.7% -0.4% -0.3% -0.3%
of which intervention stocks 0.0 0.0 0.0 0.0 0.0 0.0
Table A.2 Total EU coarse grain balance sheet, 2004/05 – 2009/10 (mio t) – MTR-1
(deviation from baseline in %)2004/05f 2005/06f 2006/07f 2007/08f 2008/09f 2009/10f
Production 103.0 104.8 105.8 107.1 108.1 108.4-2.5% -1.5% -1.9% -1.1% -1.1% -1.1%
Consumption 98.5 98.7 98.3 98.4 99.2 99.61.5% 1.0% 0.1% -0.2% -0.1% -0.2%
Exports 12.4 12.5 12.4 12.6 12.6 12.60.0% -0.4% -1.6% -1.9% -1.9% -1.6%
Ending stocks 17.9 15.3 14.2 14.3 14.3 14.4-17.2% -28.2% -35.3% -36.8% -38.5% -40.0%
of which intervention stocks 3.0 1.0 0.0 0.0 0.0 0.0-54.9% -85.9% -100.0% -100.0% -100.0% -100.0%
B. Impact of Market measures and Modulation (scenario MTR-2)
Table B.1 Total wheat balance sheet in the EU, 2004/05 – 2009/10 (mio t) – MTR-2
(% deviation from baseline in %)2004/05 2005/06 2006/07 2007/08 2008/09 2009/10
Production 105.1 107.6 108.7 110.3 111.7 113.0-3.2% -1.5% -2.3% -1.8% -2.0% -1.9%
Consumption 95.1 96.7 97.7 98.6 99.5 100.2-1.4% -0.2% -0.7% -0.3% -0.6% -0.4%
Exports 16.9 17.0 17.4 18.0 18.5 19.1-3.1% -2.9% -3.3% -3.1% -2.5% -2.7%
Ending stocks 12.1 12.4 12.4 12.5 12.6 12.8-1.6% 0.2% -0.8% -0.6% -0.6% -0.3%
of which intervention stocks 0.0 0.0 0.0 0.0 0.0 0.0

Chapter I DG AGRI EU-15
56
Table B.2 Total EU coarse grains balance sheet, 2004/05 – 2009/10 (mio t) – MTR-2
(% deviation from baseline in %)2004/05 2005/06 2006/07 2007/08 2008/09 2009/10
Production 103.0 104.8 105.9 107.2 108.1 108.6-2.5% -1.5% -1.8% -1.0% -1.1% -0.8%
Consumption 98.6 98.6 98.3 98.5 99.3 99.81.6% 0.9% 0.1% -0.1% -0.1% 0.1%
Exports 12.4 12.5 12.5 12.6 12.5 12.60.0% -0.4% -1.4% -2.1% -2.3% -1.9%
Ending stocks 17.8 15.3 14.3 14.2 14.4 14.5-17.6% -28.3% -35.2% -36.8% -38.2% -39.4%
of which intervention stocks 3.0 1.0 0.0 0.0 0.0 0.0-54.8% -86.1% -100.0% -100.0% -100.0% -100.0%
C. Impact of the full Mid-Term Review (scenario MTR-3)
Table C.1 Total wheat balance sheet in the EU, 2004/05 – 2009/10 (mio t) – MTR-3
(% deviation from baseline in %)
2004/05 2005/06 2006/07 2007/08 2008/09 2009/10Production 106.5 107.6 109.4 110.4 112.4 113.1
-1.8% -1.5% -1.7% -1.7% -1.4% -1.8%Consumption 96.3 97.3 98.3 99.1 100.5 100.8
-0.2% 0.4% 0.0% 0.2% 0.4% 0.1%Exports 17.0 16.7 17.3 17.7 18.1 18.7
-2.8% -5.1% -4.0% -4.9% -4.6% -4.9%Ending stocks 12.3 12.4 12.5 12.6 12.8 12.8
0.0% 0.3% 0.1% -0.1% 0.5% -0.1% of which intervention stocks 0.0 0.0 0.0 0.0 0.0 0.0
Table C.2 Total EU coarse grains balance sheet, 2004/05 – 2009/10 (mio t) – MTR-3
(% deviation from baseline in %)
2004/05 2005/06 2006/07 2007/08 2008/09 2009/10Production 101.3 102.7 104.9 105.8 107.1 107.1
-4.1% -3.4% -2.7% -2.3% -2.0% -2.2%Consumption 97.3 96.7 97.0 97.1 97.9 98.5
0.2% -1.0% -1.2% -1.5% -1.5% -1.2%Exports 12.4 12.4 12.7 12.5 12.8 12.6
0.0% -1.2% 0.8% -2.3% 0.0% -2.2%Ending stocks 17.5 15.0 14.0 14.0 14.2 14.2
-18.9% -29.9% -36.2% -37.8% -38.9% -40.9% of which intervention stocks 3.0 1.0 0.0 0.0 0.0 0.0
-55.2% -85.8% -100.0% -100.0% -100.0% -100.0%

Chapter II DG AGRI EU-15 and EU-25
57
IMPACT ASSESSMENT
OF THE MID-TERM REVIEW
PROPOSALS
FOR AGRICULTURAL MARKETS
AND REVENUES
IN THE EU-15 AND IN THE EU-25
USING THE ESIM MODEL
DG Agriculture
European Commission

58

Chapter II DG AGRI EU-15 and EU-25
59
EXECUTIVE SUMMARY
This chapter presents the main results of the impact analysis of the Midterm Review foragricultural markets and revenues in the EU-15 and in the EU-25. The impact analysison the EU-25 takes into account the specific conditions of entry for the new MemberStates as proposed in the last Common Positions of the EU before the agreement ofCopenhagen. The decisions of the Copenhagen summit might alter some of the results inrespect to the top-up possibilities for direct payments as well as for the level of milkproduced. However, the impact assessment of the different scenarios in comparison withthe reference scenario (i.e. the continuation of Agenda 2000 policies) should not beaffected significantly.
a) The “Market” scenarios simulate the effects of the proposals for market measures andset aside for the EU-15 as well as for the EU-25. Land is set aside on a non-rotational,long-term basis related to historical references (the equivalent resulting from 10% setaside obligation). Contrary to the current regulations energy crops are not allowed to begrown on this area.
b) The scenario “Modul” assesses the MTR proposals on market measures andmodulation for the EU-15 and the EU-25. For accession countries it is assumed thatmodulation would not be implemented during the 10 years phasing-in period. Thisscenario identifies the market effects of modulation with coupled payments: It is assumedthat the direct payments would be coupled to production as currently foreseen in theCAP. In a decoupled system, i.e. where the level of direct payments would not affect theproduction decisions of farmers, modulation would not affect production.
c) Market + dec. simulates market measures and decoupling of direct payments (COP,beef, milk) on production and agricultural markets in the EU-15 and the EU-25. In thisscenario direct payments do not affect the decisions of farmers. In terms of market effectthis scenario could be regarded as the full MTR proposal scenario, because modulationwould have no effects on production once direct payments were decoupled.
Agenda 2000 continuing (baseline)….
Although the development of agricultural markets in the EU-15 appears to be generallypositive, it is accompanied by mounting structural surpluses for rye declining prices forbeef. The income situation develops quite favourably overall.
In the EU-25, the CAP would improve the situation of agriculture in the new MemberStates compared to the situation without membership and under domestic policies. TheCAP in combination with the Single Market provides stable and on average higher pricesthan domestic policies of the Accession Countries can sustain and secure in terms ofWTO and budget for the years to come.
The agricultural prospects of the new Member States develop, therefore, more positivelyafter accession than without accession. Agricultural production after accession modestlyexpands as a response to high and stable prices and good perspectives on the singlemarket. Compared to the EU-15, perspectives in the EU-25 would not be that different.

Chapter II DG AGRI EU-15 and EU-25
60
The Effects of the Market Proposals…..
The proposed MTR measures on EU-15 markets would reduce overall cereal productionin 2006 from 218 mio t in baseline to 210.8 mio t in market. The proposed MTRmeasures, particularly the 10% environmental set aside obligation would restrict thecereal supply.
Rye prices in the EU-15 would be significantly lower, but structural surpluses woulddisappear. Barley prices would be between 95 and 100 EUR/t. Wheat prices are projectedto stay above current intervention price levels. The MTR proposals on markets wouldhave some slight positive side effects for pork and poultry production, because feedgrains would become less expensive.
In the EU-25 similar trends would appear though the structural deficits of rye could notbe reduced after enlargement. This is due to the fact that coupled direct payments wouldattract the conversion of more arable area in the new Member States into cereals andpartly also into rye area. Prices for rye would be therefore lower in the EU-25 than in theEU-15. Exports would reach more than 1 mio. t, the maximum which could be traded onworld rye markets in normal years.
Modulation would only have slight effects on markets….
In the EU-5, the relative small impact of modulation on the use of agricultural area wouldimply only a relatively small effect on the production of cereals. Modulation would putemphasis on the trend to higher yielding crops such as soft wheat and maize, whichexplains the 0.9 mio. t. higher production than without modulation. At the same timedomestic use, particularly feed use, would increase due to favourable price developmentsfor feed grains. From 2006, however, the growth of domestic use would be smaller thanthe growth of production, i.e. marketable surplus would be higher than in the marketscenario.
Modulation would have a larger effect on beef production in the EU-15 especially after2009, because premiums make up a significant part of revenues of production. And thebeef premiums could be considered as being more coupled to production than the areapayments. Production therefore would react negative to the gradual decline of thepremiums. In 2006 production would be about 0.2 mio. t. smaller than in the marketscenario and the declining production would reduce the marketable surplus of beef in theprojected years. However, prices would appear to be slightly higher than in the “market”scenario and in the “baseline”.
Until 2013 - as long as the direct payments would be phased in - it is assumed that directpayments would not be modulated in the new Member States. Therefore, modulationwould have no direct effect on production in the new Member States. The onlyeffect, which could influence production and domestic use in the new Member States,would be spillover effects from markets of the old Member States. Since, however, theprojected effects would be mostly small in the old Member States, the projected effectsare marginal for the new Member States.
Chapter II DG AGRI EU-15 and EU-25
61
The effects of decoupling…..
reduce the area of cereals compared to the “market” scenario. Particularly the lesscompetitive cereals such as rye and hard wheat and partly also barley would be affected.Oilseed area would further increase by 200 000 ha, and set-aside would increase by460 000 ha.
Decoupling would be particularly positive for the beef sector in the EU-15. Althoughproduction would drop by 5.7% compared to the baseline, prices would increase by 6.7%.The negative effect of decoupling on beef supply, therefore, would be offset by therelatively larger increase of prices leading to a small positive overall income effect.
Decoupling in the EU-25 would produce similar trends than in the EU-15. However,decoupling would lead in the new Member States to a different production structure. Inthe “market” scenarios farmers would produce – and invest into new capacities of –those products which is subject to direct payments. This wrong allocation of scarceresources – especially capital – would be avoided in the scenario with decoupledpayments.
For rye, decoupling would lead to an improved situation compared to non-decoupling inthe EU-25 (see “market” and “modulation” scenarios). Decoupling would lead to lessarea flow from other crops and fallow land into arable land in the new Member States.Therefore, less rye would be produced but also more rye from the new Member Stateswould find markets in the old Member States. Prices would be higher than withoutdecoupling. This shows that with decoupling production would evolve better according tothe relative competitiveness of markets in the different Member States.
In the EU-15 in the short-term the impact of market measures on agricultural income,measured in market revenues including and excluding direct payments, is slightlypositive. However, the “market” scenario indicates that this income advantage graduallydeclines and would turn to be negative after 2008 compared to 2002. In 2009 the sectorincome is 2.8% lower than in 2002. One of the prime reasons for this development seemto be the income situation for cereals which appears to be squeezed by the permanent setaside obligation of 10%.
Modulation would produce a positive income effect in the EU-15 compared to the“market” scenario, if the rural development measures are taken into account.
With decoupling income exhibits a short-term decline in the EU-15. However, the moresustainable production in the medium term produces more income than in the scenarioswithout decoupling. In 2009 the income in the EU-15 is 4.2% higher than in the“market” scenario without decoupling and 0.6% lower than in “baseline”. Taking intoaccount the effects of rural development, farm income would be 0.3% higher thanAgenda 2000 policies.
Similar trends would be visible in the scenarios for the EU-25, which show that eachscenario produces significant income gains for the acceding countries.

Chapter II DG AGRI EU-15 and EU-25
62
2.1 INTRODUCTION
This chapter presents the main results of the impact analysis of the Midterm Review foragricultural markets and revenues in the EU-15 and in the EU-25. The assessmentsimulates the proposals the European Commission made in the Communication presentedin July 2002 as well as the entry conditions for the new Member States stated in the latestCommon Position of the European Union before the European Council of Copenhagen.
The impact analysis is carried out on the basis of the ESIM model (European SimulationModel) for the EU-15 alone as well as for the EU-25, i.e. explicitly including the 8CEECs foreseen to become new Member States on May 1, 200426. So far Cyprus andMalta are not covered by ESIM. However, this should not change the magnitude of themain variables examined in this report.
2.2 POLICY SCENARIOS AND HYPOTHESES
Baseline simulates the continuation of Agenda 2000 policies. The key economicassumptions on the development of exchange rates and world market prices are in linewith those retained for the medium-term projections published early December 2002 inthe “Prospects for agricultural markets 2002-2009 – update for EU markets.
Apart from the standard assumptions the Less Favoured Area (LFA) payments have beenadded. Due to the regional nature of LFA payments and the concentration of particularsectors such as milk and beef production in eligible areas, a certain implication forproduction of these commodities could be expected.27
The main assumptions for the impact analyses are:
� all direct payments for COP area, beef cattle, and milk are totally decoupled andgiven to the farmers on an individual farm basis for their utilised agricultural area,fruits, vegetables, and wine. The payment does not include an obligation to producebut an obligation for maintaining the area in good conditions. For methodologicalreasons a differentiation farms has not been taken into account.
� Models like ESIM simulate with their mathematical equations the decision making offarmers. With decoupling the level of direct payments does not play a role for farmersto take production decisions. To model decoupling, direct payments have thereforebeen completely removed from the relevant behavioural equations.
26 These countries are the Czech Republic, Estonia, Hungary, Latvia, Lithuania, Poland, Slovakia, and
Slovenia.
27 The impact, however, is relatively small for the sector on average due to the low average levels ofpayments (e.g. 15 EUR/t for beef on the sector average). It could however be expected that it wouldhave a larger regional implication, where payments reach levels of about 200 EUR/ha includingnational co-financing. This regional aspect could not be included into the simulations.

Chapter II DG AGRI EU-15 and EU-25
63
� The change of the set aside obligation from a rotational concept to a fixed long-termset aside based on historical areas. For the new Member States the area equivalent to10% set aside obligation in 2004 has been put aside in the simulations.
� Non-food production is not allowed on the set aside land.
� The set aside area in 2002 of 3.95 mio ha is permanently removed from cropping in allscenarios except for baseline.
� The decoupled payment applies also to set aside cropland (obligatory and voluntary),for which the average COP payment of 290 EUR/ha under the current systemdecreases to the average hectare premium of 221 EUR/ha under the new system.
� The introduction of a targeted payment for energy plants (carbon credits) of45 EUR/ha for a maximum of 1.5 mio ha.
� The changes in the intervention system for cereals:
� The intervention prices for cereals is lowered by further 6% from the present levelof 101.31 EUR/t to 95.35 EUR/t, and the abolition of monthly increments ofintervention prices.
� The removal of the intervention price system and public intervention for rye.However, for the development of the rye markets in the medium term it isimportant to consider the way of reducing the large accumulated stocks of7.7 mio t. In these simulations it has been assumed that these stocks would bereduced via exports to third markets. Therefore, no further export refunds would beused to support current rye production.
� The impact analysis on the EU-25 takes into account the specific conditions ofentry for the new Member States as proposed in the last Common Positions of theEU before the agreement of Copenhagen. The results of the Copenhagen summitmight alter some of the results in respect to the top-up possibilities for direct paymentsas well as for the level of milk produced. However, the simulation should sufficientlyrank the different variables among the scenarios.
Three main scenarios have been simulated in order to analyse the impact of each of themain proposals of the MTR in respect to the EU-15 and the EU-25. The explicittreatment of the EU-15 alone is meant to allow for a comparison with the analyses of theEU-25 in order to see the different developments in old and new Member Statesafter 2004.
a) The “Market” scenarios simulate the effects of the proposals for market measures andset aside for the EU-15 as well as for the EU-25. Land is set aside on a non-rotational,long-term basis related to historical references (the equivalent resulting from 10% setaside obligation). Contrary to the current regulations energy crops are not allowed to begrown on this area.
b) The scenario “Modul” assesses the MTR proposals on market measures andmodulation for the EU-15 and the EU-25. For accession countries it is assumed thatmodulation would not be implemented during the 10 years phasing-in period. This

Chapter II DG AGRI EU-15 and EU-25
64
scenario identifies the market effects of modulation with coupled payments: It is assumedthat the direct payments would be coupled to production as currently foreseen in theCAP. In a decoupled system, i.e. where the level of direct payments would not affect theproduction decisions of farmers, modulation would not affect production.
c) Market + dec. simulates market measures and decoupling of direct payments (COP,beef, milk) on production and agricultural markets in the EU-15 and the EU-25. In thisscenario direct payments do not affect the decisions of farmers. This scenario aims atidentifying the effects of decoupling in comparison to the other elements of the MTRproposal. In terms of market effect this scenario could be regarded as the full MTRproposal scenario, because modulation would have no effects on production once directpayments were decoupled.
2.3 METHODOLOGY
The sector model ESIM, which is described in detail in European Commission (2002a)and Münch (2002), serves as a tool for the analysis. It is a price driven, world, multi-country, non-linear agricultural sector model, which models agricultural policies in greatdetail. Though originally designed to analyse the impact of CEEC-EU accession, themodel has been further developed and updated to analyse the effects of instrumentsproposed in the MTR. Especially the model covers the aspect of non-food oilseedproduction, silage maize production in respect to changes of cattle herds, the effects ofLFA payments on production, voluntary set aside, and decoupling. The model is solvedfor 2006/07, 2007/08, and 2009/10.
The likely income effects are measured in changes of market revenues between 2002 and2006, 2007, and 2009. The baseline scenarios are used as reference for the EU-15 and forthe EU-25.
2.4 IMPACT ANALYSIS ON AGRICULTURAL MARKETS
The continuation of current policies and its effects on the EU-15…..
The expected developments under Agenda 2000 policies are simulated in “baseline” andsome general trends are identified. This section aims at describing the general underlyingdevelopments until 2009. The “baseline” scenario serves as reference for the assessmentof effects of the MTR proposals.
Oilseed prices are expected to become more favourable relative to coarse grains andpartly also to soft wheat prices of standard European quality. Oilseed area, in particularthat for rapeseed, is expected to expand by 700 000 ha until 2006. This figure includesnon-food oilseeds as well. Since market prospects of these crops depend mainly on therelative competitiveness of biofuel compared to normal fuel, it is assumed that taxpolicies in Member States will continue as presently defined.
The situation of surpluses in the cereal sector would develop positively for wheat asworld markets carry largely the developments. Wheat prices therefore are expected tostay well above the intervention price level of 101.31 EUR/t. These developments take
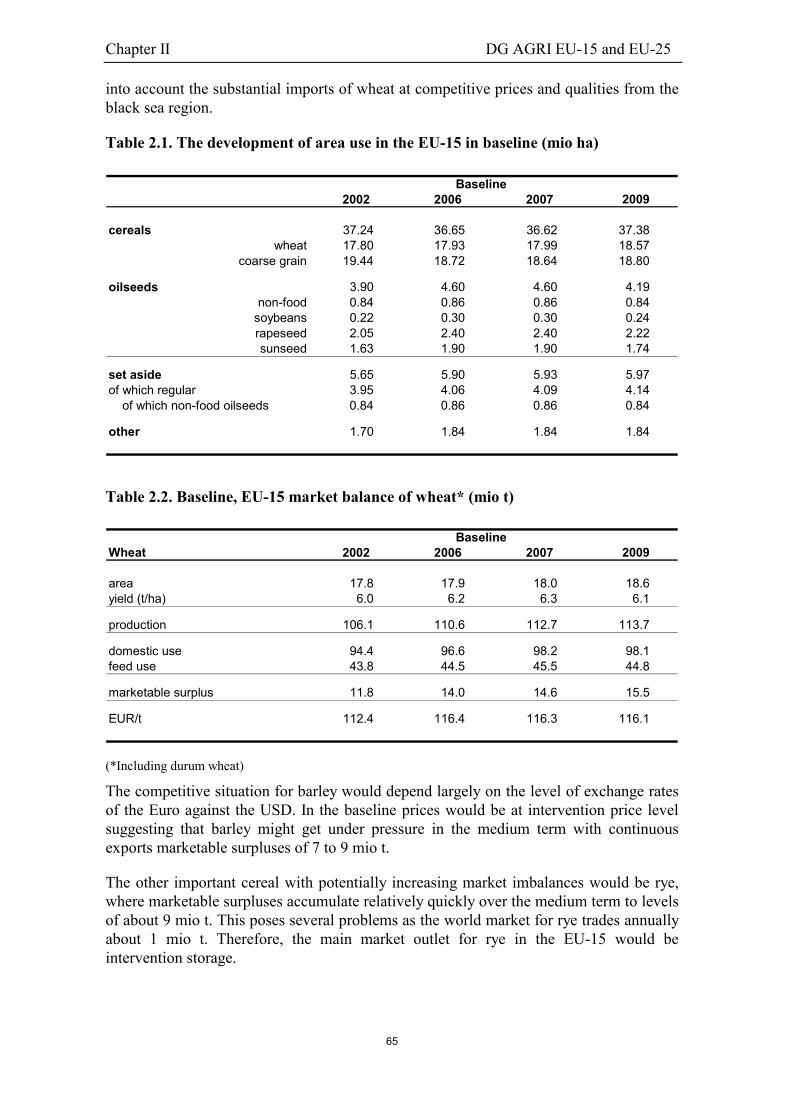
Chapter II DG AGRI EU-15 and EU-25
65
into account the substantial imports of wheat at competitive prices and qualities from theblack sea region.
Table 2.1. The development of area use in the EU-15 in baseline (mio ha)
2009
cereals 37.24 36.65 36.62 37.38wheat 17.80 17.93 17.99 18.57
coarse grain 19.44 18.72 18.64 18.80
oilseeds 3.90 4.60 4.60 4.19non-food 0.84 0.86 0.86 0.84
soybeans 0.22 0.30 0.30 0.24rapeseed 2.05 2.40 2.40 2.22sunseed 1.63 1.90 1.90 1.74
set aside 5.65 5.90 5.93 5.97of which regular 3.95 4.06 4.09 4.14 of which non-food oilseeds 0.84 0.86 0.86 0.84
other 1.70 1.84 1.84 1.84
200720062002Baseline
Table 2.2. Baseline, EU-15 market balance of wheat* (mio t)
Wheat 2009
area 17.8 17.9 18.0 18.6yield (t/ha) 6.0 6.2 6.3 6.1
production 106.1 110.6 112.7 113.7
domestic use 94.4 96.6 98.2 98.1feed use 43.8 44.5 45.5 44.8
marketable surplus 11.8 14.0 14.6 15.5
EUR/t 112.4 116.4 116.3 116.1
Baseline2002 2006 2007
(*Including durum wheat)
The competitive situation for barley would depend largely on the level of exchange ratesof the Euro against the USD. In the baseline prices would be at intervention price levelsuggesting that barley might get under pressure in the medium term with continuousexports marketable surpluses of 7 to 9 mio t.
The other important cereal with potentially increasing market imbalances would be rye,where marketable surpluses accumulate relatively quickly over the medium term to levelsof about 9 mio t. This poses several problems as the world market for rye trades annuallyabout 1 mio t. Therefore, the main market outlet for rye in the EU-15 would beintervention storage.

Chapter II DG AGRI EU-15 and EU-25
66
Table 2.3. Baseline, EU-15 market balance of barley (mio t)
Barley 2009
area 10.6 10.1 9.9 10.2yield (t/ha) 4.5 4.6 4.7 4.6
production 48.3 46.7 46.3 46.4
domestic use 40.4 40.3 38.2 37.5feed use 30.4 30.2 28.1 27.4
marketable surplus 7.9 6.4 8.1 9.0
EUR/t 101.3 101.3 101.3 101.3
Baseline2002 2006 2007
Table 2.4. Baseline, EU-15 market balance for rye (mio t)
Rye 2009
area 1.1 1.3 1.3 1.3yield (t/ha) 4.7 5.1 5.2 5.6
production 5.4 6.4 6.6 7.0
domestic use 3.5 3.8 4.0 3.9feed use 1.7 1.9 2.1 2.1
marketable surplus 1.9 2.6 2.6 3.1
EUR/t 101.3 101.3 101.3 101.3
Baseline2002 2006 2007
Prospects for beef markets would become more favourable after emerging from thefollow up of FMD and BSE. Domestic consumption would recover and increase to7.6 mio. t in 2009. Moreover, stable export possibilities are assumed to open up. Thispositive market stabilisation would be accompanied by constantly decreasing marketprices of about 300 EUR/t between 2002 and 2009, because beef would be still regardedby consumers as relatively inferior compared to poultry and partly pork.
Milk production would not change, though prices for SMP and butter are reducedbeginning in 2006 under Agenda 2000 policies. From a sector point of view this findingsuggests quite some room between milk prices and the relatively low (marginal)production costs of milk.
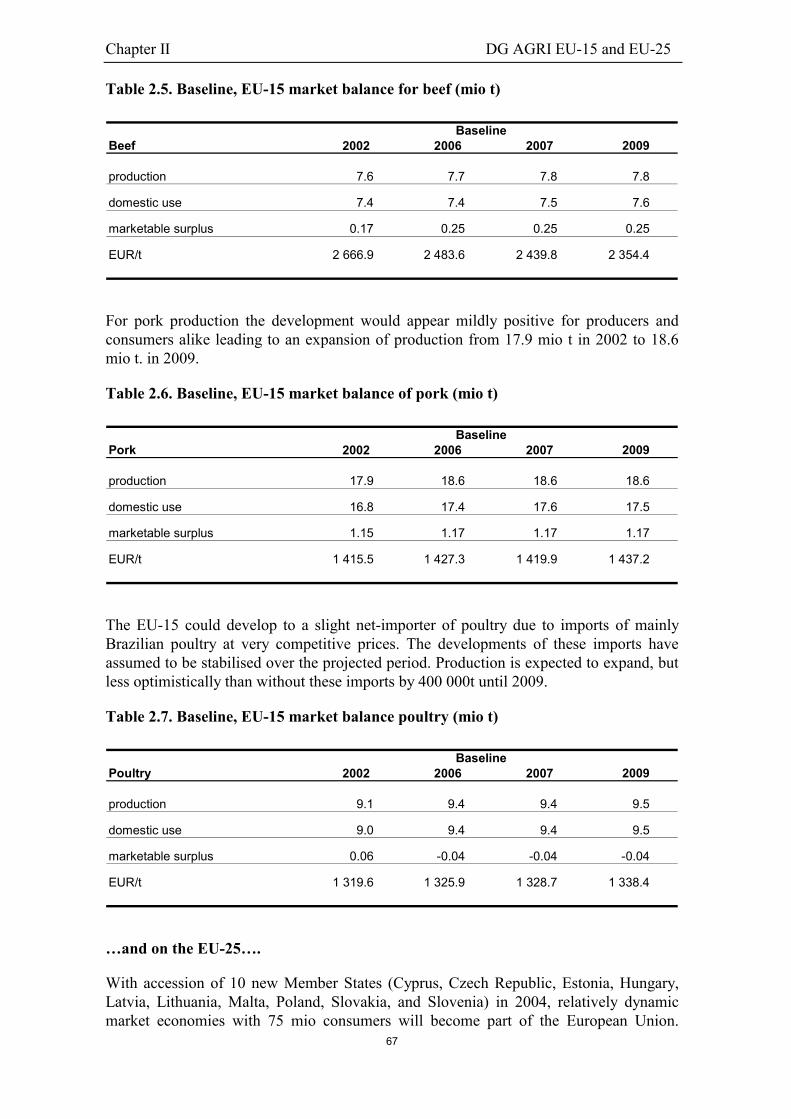
Chapter II DG AGRI EU-15 and EU-25
67
Table 2.5. Baseline, EU-15 market balance for beef (mio t)
Beef 2009
production 7.6 7.7 7.8 7.8
domestic use 7.4 7.4 7.5 7.6
marketable surplus 0.17 0.25 0.25 0.25
EUR/t 2 666.9 2 483.6 2 439.8 2 354.4
Baseline2002 2006 2007
For pork production the development would appear mildly positive for producers andconsumers alike leading to an expansion of production from 17.9 mio t in 2002 to 18.6mio t. in 2009.
Table 2.6. Baseline, EU-15 market balance of pork (mio t)
Pork 2009
production 17.9 18.6 18.6 18.6
domestic use 16.8 17.4 17.6 17.5
marketable surplus 1.15 1.17 1.17 1.17
EUR/t 1 415.5 1 427.3 1 419.9 1 437.2
Baseline2002 2006 2007
The EU-15 could develop to a slight net-importer of poultry due to imports of mainlyBrazilian poultry at very competitive prices. The developments of these imports haveassumed to be stabilised over the projected period. Production is expected to expand, butless optimistically than without these imports by 400 000t until 2009.
Table 2.7. Baseline, EU-15 market balance poultry (mio t)
Poultry 2009
production 9.1 9.4 9.4 9.5
domestic use 9.0 9.4 9.4 9.5
marketable surplus 0.06 -0.04 -0.04 -0.04
EUR/t 1 319.6 1 325.9 1 328.7 1 338.4
Baseline2002 2006 2007
…and on the EU-25….
With accession of 10 new Member States (Cyprus, Czech Republic, Estonia, Hungary,Latvia, Lithuania, Malta, Poland, Slovakia, and Slovenia) in 2004, relatively dynamicmarket economies with 75 mio consumers will become part of the European Union.

Chapter II DG AGRI EU-15 and EU-25
68
Opportunities on the single market will open up for the agriculture and food industries inthe new as well as in the old Member States.
From a sector perspective, the CAP would improve the situation of agriculture in the newMember States compared to the situation without membership and under domesticpolicies. The CAP in combination with the Single Market provides stable and on averagehigher prices than domestic policies of the Accession Countries can sustain and secure interms of WTO and budget for the years to come.
The agricultural prospects of the new Member States develop, therefore, more positivelyafter accession than without accession. Agricultural production after accession modestlyexpands as a response to high and stable prices and good perspectives on the singlemarket.
The new Member States add about 38 mio. ha of Utilised Agricultural Area to the130 mio. ha of the old Member States representing an increase of 30%. Agriculturalproduction of the EU-25 would be moderately larger as in the EU-15 because of lowerintensities of production in the new Member States. The EU-25 would produce in 2006about 30% more cereals with 42% more cereal area, 25% more oilseeds with 37% moreoilseed area (without non-food production), 10% more beef, 18% more pork, and 27%more poultry than the present EU-15. At the same time domestic use of cereals increasesby 23%, of oilseeds by 6%, of beef by 2.5%, of pork by 22%, of poultry by 12%.
The phasing-in of direct payments, even when considering the topping up possibility toincrease payments to 40%, leads to a slower inflow of additional area from fodder crops,potatoes and fallow land and would be balanced in the first years by set aside, and slowsthe conversion of land into arable and particularly into cereal and oilseed area. Thesimulations suggest that set-aside has only a very limited supply control effect in most ofthe new Member States.
In the new Member States, production of cereals would increase from 57.6 mio. t in 2002to 61.5 mio. t in 2006. This demonstrates the positive but moderate effects of the CAP oncereal production in the new Member States. The EU-25 would produce 282 mio. t. Withenlargement the new market dynamics would also increase cereal production of 2 mio. tin the old Member States (220 mio. t with enlargement compared to 218 mio. t withoutenlargement).
The building up of beef herds in the new Member States would take place at a slowerpace than with 100% direct payments. Market prospects indicate that beef production inthe old as well as in the new Member States would remain rather stable. The newMember States would just add 10% more production and equally 10% more consumptionto the EU-15. Accession therefore, would lead only to a decline of average EU prices ofabout 100EUR/t. Agenda 2000 policies give the beef market enough price flexibility suchthat no structural surpluses could be expected.
Accession and the effects of the single markets would lead to a redirection of tradeaccording to the relative competitiveness of the Member States. One of the prime shiftsof trade is concerning cereals, pork, and poultry. New data seems to suggest that the newMember States have gained increasing competitiveness in the area of poultry production

Chapter II DG AGRI EU-15 and EU-25
69
Table 2.8. Baseline, EU-25 balance of cereals (mio t)
Cereals 2009
areaEU-15 37.2 36.6 36.6 37.0
Laeken-10 16.0 15.9 15.9 16.2EU-25 53.3 52.6 52.6 53.2
yieldEU-15 5.7 6.0 6.1 6.2
Laeken-10 3.6 3.9 3.9 4.0EU-25 5.1 5.4 5.4 5.5
productionEU-15 213.7 220.2 223.9 228.5
Laeken-10 57.6 61.5 61.5 64.1EU-25 271.3 281.7 285.4 292.6
domestic useEU-15 191.1 195.8 196.8 199.9
Laeken-10 50.9 54.8 54.8 56.4EU-25 241.9 250.6 251.6 256.3
feed useEU-15 119.3 122.1 122.4 124.3
Laeken-10 33.6 36.6 36.6 37.4EU-25 152.8 158.7 159.0 161.7
marketable surplusEU-15 22.7 24.3 27.0 28.5
Laeken-10 6.7 6.8 6.8 7.8EU-25 29.4 31.1 33.8 36.3
Baseline2002 2006 2007
Table 2.9. Baseline, EU-25 balance of beef (mio t)
Beef 2009
productionEU-15 7.6 7.7 7.8 7.8
Laeken-10 0.7 0.8 0.8 0.7EU-25 8.3 8.5 8.5 8.6
domestic useEU-15 7.4 7.5 7.5 7.6
Laeken-10 0.7 0.7 0.7 0.7EU-25 8.1 8.1 8.2 8.3
marketable surplusEU-15 0.2 0.3 0.3 0.3
Laeken-10 0 0.1 0.1 0EU-25 0.2 0.3 0.3 0.3
EUR/t 2 666.9 2 383.0 2 348.9 2 306.9
Baseline2002 2006 2007
mainly due to foreign direct investments into production and processing. It seems thatupon enlargement an increasing part of poultry production in the new Member States (upto 900 000t) would be directed to the old Member States benefiting from a comparativeadvantage. On the other hand, a large part of the pork production in the new MemberStates would have a comparative disadvantage in respect to quality, i.e. lean meat

Chapter II DG AGRI EU-15 and EU-25
70
content, and feed costs. Here the simulations suggest that the old Member States mighttrade 700 000 t to 900 000 t of pork to the new Member States.
Table 2.10. Baseline, EU-25 market balance for pork (mio t)
Pork 2009
productionEU-15 17.9 19.7 20.0 20.4
Laeken-10 3.5 3.5 3.5 3.7EU-25 21.4 23.3 23.5 24.1
domestic useEU-15 16.8 18.6 17.2 18.4
Laeken-10 3.5 4.2 4.2 4.4EU-25 20.3 22.8 21.4 22.8
marketable surplusEU-15 1.1 1.2 2.7 2.0
Laeken-10 0.0 -0.7 -0.7 -0.8EU-25 1.2 0.5 2.1 1.2
EUR/t 1 415.5 1 245.7 1 238.7 1 226.9
Baseline2002 2006 2007
Table 2.11. Baseline, EU-25 market balance for poultry (mio t)
Poultry 2009
productionEU-15 9.1 8.5 8.6 8.8
Laeken-10 1.7 2.3 2.3 2.3EU-25 10.8 10.8 10.9 11.0
domestic useEU-15 9.0 9.4 9.4 9.7
Laeken-10 1.3 1.2 1.2 1.2EU-25 10.3 10.6 10.5 10.9
marketable surplusEU-15 0.1 -0.9 -0.8 -0.9
Laeken-10 0.4 1.1 1.1 1.1EU-25 0.5 0.2 0.4 0.2
EUR/t 1 319.6 1 275.8 1 275.7 1 276.2
Baseline2002 2006 2007
As a result of these trade shifts the feed use of cereals remains largely balanced betweenthe new and the old Member States. Therefore, the largest part of the additionalproduction would be consumed in the EU-25 itself and only a limited amount would haveto be additionally exported.
From a market perspective, only few areas would remain where enlargement would addto existing problems. One such areas would be rye production, for which marketable
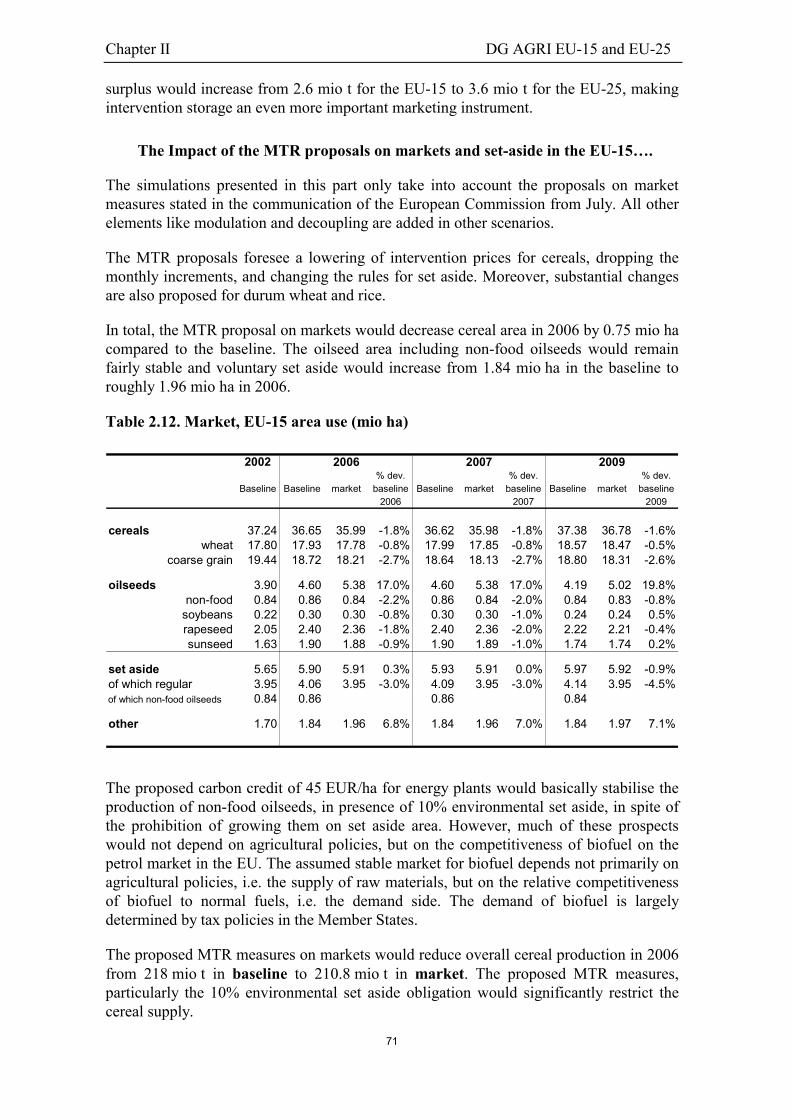
Chapter II DG AGRI EU-15 and EU-25
71
surplus would increase from 2.6 mio t for the EU-15 to 3.6 mio t for the EU-25, makingintervention storage an even more important marketing instrument.
The Impact of the MTR proposals on markets and set-aside in the EU-15….
The simulations presented in this part only take into account the proposals on marketmeasures stated in the communication of the European Commission from July. All otherelements like modulation and decoupling are added in other scenarios.
The MTR proposals foresee a lowering of intervention prices for cereals, dropping themonthly increments, and changing the rules for set aside. Moreover, substantial changesare also proposed for durum wheat and rice.
In total, the MTR proposal on markets would decrease cereal area in 2006 by 0.75 mio hacompared to the baseline. The oilseed area including non-food oilseeds would remainfairly stable and voluntary set aside would increase from 1.84 mio ha in the baseline toroughly 1.96 mio ha in 2006.
Table 2.12. Market, EU-15 area use (mio ha)
2002% dev. % dev. % dev.
Baseline Baseline market baseline Baseline market baseline Baseline market baseline2006 2007 2009
cereals 37.24 36.65 35.99 -1.8% 36.62 35.98 -1.8% 37.38 36.78 -1.6%wheat 17.80 17.93 17.78 -0.8% 17.99 17.85 -0.8% 18.57 18.47 -0.5%
coarse grain 19.44 18.72 18.21 -2.7% 18.64 18.13 -2.7% 18.80 18.31 -2.6%
oilseeds 3.90 4.60 5.38 17.0% 4.60 5.38 17.0% 4.19 5.02 19.8%non-food 0.84 0.86 0.84 -2.2% 0.86 0.84 -2.0% 0.84 0.83 -0.8%
soybeans 0.22 0.30 0.30 -0.8% 0.30 0.30 -1.0% 0.24 0.24 0.5%rapeseed 2.05 2.40 2.36 -1.8% 2.40 2.36 -2.0% 2.22 2.21 -0.4%sunseed 1.63 1.90 1.88 -0.9% 1.90 1.89 -1.0% 1.74 1.74 0.2%
set aside 5.65 5.90 5.91 0.3% 5.93 5.91 0.0% 5.97 5.92 -0.9%of which regular 3.95 4.06 3.95 -3.0% 4.09 3.95 -3.0% 4.14 3.95 -4.5%of which non-food oilseeds 0.84 0.86 0.86 0.84
other 1.70 1.84 1.96 6.8% 1.84 1.96 7.0% 1.84 1.97 7.1%
2006 2007 2009
The proposed carbon credit of 45 EUR/ha for energy plants would basically stabilise theproduction of non-food oilseeds, in presence of 10% environmental set aside, in spite ofthe prohibition of growing them on set aside area. However, much of these prospectswould not depend on agricultural policies, but on the competitiveness of biofuel on thepetrol market in the EU. The assumed stable market for biofuel depends not primarily onagricultural policies, i.e. the supply of raw materials, but on the relative competitivenessof biofuel to normal fuels, i.e. the demand side. The demand of biofuel is largelydetermined by tax policies in the Member States.
The proposed MTR measures on markets would reduce overall cereal production in 2006from 218 mio t in baseline to 210.8 mio t in market. The proposed MTR measures,particularly the 10% environmental set aside obligation would significantly restrict thecereal supply.

Chapter II DG AGRI EU-15 and EU-25
72
Table 2.13. Market, EU-15 cereals balance (mio t)
Cereals 2002% dev. % dev. % dev.
Baseline Baseline market baseline Baseline market baseline Baseline market baseline2006 2007 2009
area 37.2 36.6 36.0 -1.8% 36.6 36.0 -1.8% 37.4 36.8 -1.6%yield (t/ha) 5.7 5.9 5.9 -1.5% 6.0 5.9 -1.8% 6.0 5.9 -1.4%
production 213.7 218.0 210.8 -3.3% 221.4 213.7 -3.5% 222.8 216.2 -3.0%
domestic use 191.1 195.8 197.9 1.1% 196.8 198.6 0.9% 195.8 197.0 0.6%feed use 119.3 122.1 123.1 0.8% 122.4 123.3 0.7% 120.5 121.9 1.1%
marketable surplus 22.7 22.2 12.9 24.6 15.1 27.1 19.2
2006 2007 2009
The reduction of the intervention price for cereals from 101.31 EUR/t to 95.35 EUR/twould largely affect barley and rye. Wheat prices are projected to stay above currentintervention price levels and increase to 116 EUR/t in the market scenario. Maize priceswould continue to remain at levels of 117 EUR/t and slightly decline to 114 EUR/t in2009. In the period between 2004 and 2008 maize prices would be higher than wheatprices. Despite this positive development of prices, production of wheat would be 2 mio.t and production of maize about 0.8 mio t lower than in the baseline.
Table 2.14. Market, EU-15 wheat balance (mio t)
Wheat 2002% dev. % dev. % dev.
Baseline Baseline market baseline Baseline market baseline Baseline market baseline2006 2007 2009
area 17.8 17.9 17.8 -0.8% 18.0 17.8 -0.8% 18.6 18.5 -0.5%yield (t/ha) 6.0 6.2 6.1 -1.0% 6.3 6.2 -1.0% 6.1 6.1 0.0%
production 106.1 110.6 108.6 -1.8% 112.7 110.8 -1.7% 113.7 113.1 -0.5%
domestic use 94.4 96.6 96.8 0.2% 98.2 98.0 -0.1% 98.1 97.3 -0.8%feed use 43.8 44.5 43.8 -1.6% 45.5 44.7 -1.6% 44.8 44.1 -1.7%
marketable surplus 11.8 14.0 11.8 14.6 12.7 15.5 15.8
EUR/t 112.4 116.4 116.5 0.1% 116.3 116.4 0.1% 116.1 116.2 0.1%
2006 2007 2009
Barley production would fall by 2 mio. t in 2006 compared to the baseline, which wouldreduce marketable surplus. Barley prices are projected to remain largely between100 EUR/t and 95 EUR/t. This result would remain fairly sensitive to changes of theexchange rates.
The biggest effect of the proposals for cereals would be on the production of rye, which isproposed to be taken out of intervention. Production would decline initially by 39% or2.5 mio. t, basically removing the annual structural surplus. Production of rye thenincreases again from 3.9 mio t in 2006 to 4.5 mio t in 2009.

Chapter II DG AGRI EU-15 and EU-25
73
Table 2.15. Market, EU-15 barley balance (mio t)
Barley 2002% dev. % dev. % dev.
Baseline Baseline market baseline Baseline market baseline Baseline market baseline2006 2007 2009
area 10.6 10.1 9.9 -1.9% 9.9 9.7 -1.8% 10.2 10.0 -1.5%yield (t/ha) 4.5 4.6 4.5 -2.3% 4.7 4.6 -2.3% 4.6 4.5 -2.3%
production 48.3 46.7 44.8 -4.2% 46.3 44.4 -4.0% 46.4 44.7 -3.7%
domestic use 40.4 40.3 42.4 5.1% 38.2 40.0 4.9% 37.5 39.3 4.8%feed use 30.4 30.2 32.1 6.3% 28.1 29.9 6.1% 27.4 29.1 6.2%
marketable surplus 7.9 6.4 2.4 8.1 4.4 9.0 5.5
EUR/t 101.3 101.3 97.4 -3.9% 101.3 95.4 -5.9% 101.3 99.4 -1.9%
2006 2007 2009
This result depends on the assumptions on how the accumulated stocks of about7.7 mio. t would be reduced. In the simulations it is assumed that they were graduallyreduced and exported at rate of less than 1 mio. t a year. This would be the capacity ofworld markets for rye in normal years. Therefore, no export refunds would be available tosupport the actual rye production.
Table 2.16. Market, EU-15 rye balance (mio t)
Rye 2002% dev. % dev. % dev.
Baseline Baseline market baseline Baseline market baseline Baseline market baseline2006 2007 2009
area 1.1 1.3 1.0 -21.6% 1.3 1.1 -16.0% 1.3 0.9 -24.8%yield (t/ha) 4.7 5.1 3.9 -22.6% 5.2 3.6 -30.5% 5.6 4.8 -13.0%
production 5.4 6.4 3.9 -39.3% 6.6 3.8 -41.6% 7.0 4.6 -34.6%
domestic use 3.5 3.8 4.1 7.6% 4.0 4.3 8.7% 3.9 4.6 18.2%feed use 1.7 1.9 2.2 14.9% 2.1 2.5 16.4% 2.1 2.8 34.4%
marketable surplus 1.9 2.6 -0.2 2.6 -0.5 3.1 -0.1
EUR/t 101.3 101.3 76.5 -24.5% 101.3 74.8 -26.2% 101.3 71.7 -29.2%
2006 2007 2009
The effect of reducing cereal prices benefits pork production, which would be able toexpand production by about 0.1 mio. t to 0.2 mio. t. The poultry industry would only beaffected to a limited extent as prices for feed wheat and maize remain at high levels.
… and the EU-25
In the “market” scenario the general trends described for the baseline on the EU-25remain valid. Barley prices would be 3 to 8 EUR/t higher because of the demand in thenew Member States of about 2 mio. t. Prices would remain above the intervention price.A similar development takes place for maize for which the old Member States wouldhave additional demand, however, average prices would be about 10 EUR/t lower than inthe EU-15 alone. Prices for wheat would also remain slightly lower than in the non-accession scenario as additional marketable surplus of about 3 mio. t has to be exported
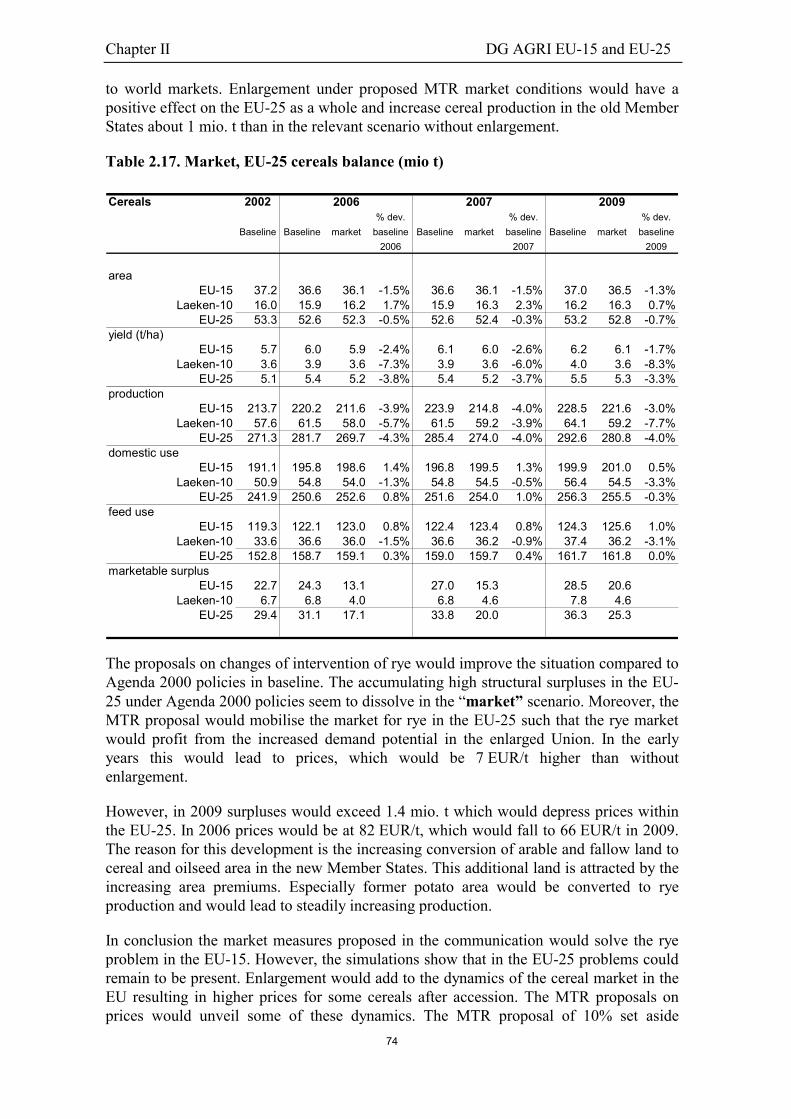
Chapter II DG AGRI EU-15 and EU-25
74
to world markets. Enlargement under proposed MTR market conditions would have apositive effect on the EU-25 as a whole and increase cereal production in the old MemberStates about 1 mio. t than in the relevant scenario without enlargement.
Table 2.17. Market, EU-25 cereals balance (mio t)
Cereals 2002% dev. % dev. % dev.
Baseline Baseline market baseline Baseline market baseline Baseline market baseline2006 2007 2009
areaEU-15 37.2 36.6 36.1 -1.5% 36.6 36.1 -1.5% 37.0 36.5 -1.3%
Laeken-10 16.0 15.9 16.2 1.7% 15.9 16.3 2.3% 16.2 16.3 0.7%EU-25 53.3 52.6 52.3 -0.5% 52.6 52.4 -0.3% 53.2 52.8 -0.7%
yield (t/ha)EU-15 5.7 6.0 5.9 -2.4% 6.1 6.0 -2.6% 6.2 6.1 -1.7%
Laeken-10 3.6 3.9 3.6 -7.3% 3.9 3.6 -6.0% 4.0 3.6 -8.3%EU-25 5.1 5.4 5.2 -3.8% 5.4 5.2 -3.7% 5.5 5.3 -3.3%
productionEU-15 213.7 220.2 211.6 -3.9% 223.9 214.8 -4.0% 228.5 221.6 -3.0%
Laeken-10 57.6 61.5 58.0 -5.7% 61.5 59.2 -3.9% 64.1 59.2 -7.7%EU-25 271.3 281.7 269.7 -4.3% 285.4 274.0 -4.0% 292.6 280.8 -4.0%
domestic useEU-15 191.1 195.8 198.6 1.4% 196.8 199.5 1.3% 199.9 201.0 0.5%
Laeken-10 50.9 54.8 54.0 -1.3% 54.8 54.5 -0.5% 56.4 54.5 -3.3%EU-25 241.9 250.6 252.6 0.8% 251.6 254.0 1.0% 256.3 255.5 -0.3%
feed useEU-15 119.3 122.1 123.0 0.8% 122.4 123.4 0.8% 124.3 125.6 1.0%
Laeken-10 33.6 36.6 36.0 -1.5% 36.6 36.2 -0.9% 37.4 36.2 -3.1%EU-25 152.8 158.7 159.1 0.3% 159.0 159.7 0.4% 161.7 161.8 0.0%
marketable surplusEU-15 22.7 24.3 13.1 27.0 15.3 28.5 20.6
Laeken-10 6.7 6.8 4.0 6.8 4.6 7.8 4.6EU-25 29.4 31.1 17.1 33.8 20.0 36.3 25.3
2006 2007 2009
The proposals on changes of intervention of rye would improve the situation compared toAgenda 2000 policies in baseline. The accumulating high structural surpluses in the EU-25 under Agenda 2000 policies seem to dissolve in the “market” scenario. Moreover, theMTR proposal would mobilise the market for rye in the EU-25 such that the rye marketwould profit from the increased demand potential in the enlarged Union. In the earlyyears this would lead to prices, which would be 7 EUR/t higher than withoutenlargement.
However, in 2009 surpluses would exceed 1.4 mio. t which would depress prices withinthe EU-25. In 2006 prices would be at 82 EUR/t, which would fall to 66 EUR/t in 2009.The reason for this development is the increasing conversion of arable and fallow land tocereal and oilseed area in the new Member States. This additional land is attracted by theincreasing area premiums. Especially former potato area would be converted to ryeproduction and would lead to steadily increasing production.
In conclusion the market measures proposed in the communication would solve the ryeproblem in the EU-15. However, the simulations show that in the EU-25 problems couldremain to be present. Enlargement would add to the dynamics of the cereal market in theEU resulting in higher prices for some cereals after accession. The MTR proposals onprices would unveil some of these dynamics. The MTR proposal of 10% set aside

Chapter II DG AGRI EU-15 and EU-25
75
without the possibility to grow energy crops on the set aside land seem to restrict cerealproduction in the EU.
Table 2.18. Market, EU-25 barley balance (mio t)
Barley 2002% dev. % dev. % dev.
Baseline Baseline market baseline Baseline market baseline Baseline market baseline2006 2007 2009
productionEU-15 48.3 48.9 48.4 -1.0% 48.9 48.4 -0.9% 48.9 48.5 -0.7%
Laeken-10 9.5 9.1 8.4 -7.9% 9.1 8.5 -6.6% 9.4 8.5 -9.7%EU-25 57.9 58.0 56.8 -2.1% 58.0 56.9 -1.8% 58.3 57.0 -2.1%
domestic useEU-15 40.4 40.3 40.3 0.1% 38.2 38.2 0.0% 39.3 39.2 -0.3%
Laeken-10 9.8 11.1 11.0 -1.3% 11.1 11.1 0.0% 11.6 11.1 -3.9%EU-25 50.2 51.4 51.3 -0.2% 49.3 49.3 0.0% 50.9 50.3 -1.2%
feed useEU-15 30.4 30.2 30.1 -0.6% 28.1 28.0 -0.6% 29.1 29.0 -0.5%
Laeken-10 7.2 8.5 8.4 -1.2% 8.5 8.5 0.1% 8.9 8.5 -4.0%EU-25 37.6 38.7 38.5 -0.8% 36.6 36.5 -0.5% 38.0 37.5 -1.3%
marketable surplusEU-15 7.9 8.6 8.1 10.7 10.3 9.5 9.3
Laeken-10 -0.2 -2.0 -2.6 -2.0 -2.6 -2.2 -2.6EU-25 7.7 6.6 5.5 8.7 7.6 7.4 6.7
EUR/t 101.3 106.3 106.5 0.2% 105.2 105.4 0.1% 103.0 103.1 0.1%
2006 2007 2009
Table 2.19. Market, EU-25 rye balance (mio t)
Rye 2002% dev. % dev. % dev.
Baseline Baseline market baseline Baseline market baseline Baseline market baseline2006 2007 2009
productionEU-15 5.4 6.4 4.3 -32.8% 6.6 4.4 -33.7% 7.1 4.6 -34.5%
Laeken-10 6.3 7.7 7.2 -6.2% 7.8 7.5 -3.2% 8.2 8.2 -0.3%EU-25 11.8 14.1 11.5 -18.3% 14.4 11.9 -17.1% 15.3 12.8 -16.1%
domestic useEU-15 3.5 3.8 4.1 7.2% 4.0 4.3 8.2% 4.0 4.4 10.5%
Laeken-10 6.1 6.7 6.7 -0.8% 6.8 6.8 -0.6% 7.0 7.0 -0.5%EU-25 9.6 10.5 10.8 2.1% 10.8 11.1 2.6% 11.0 11.4 3.5%
feed useEU-15 1.7 1.9 2.2 14.1% 2.1 2.4 15.3% 2.1 2.5 19.6%
Laeken-10 2.8 3.2 3.2 -1.5% 3.2 3.2 -0.2% 3.3 3.3 -1.7%EU-25 4.5 5.2 5.4 4.4% 5.3 5.6 6.0% 5.5 5.8 6.5%
marketable surplusEU-15 1.9 2.6 0.2 2.6 0.1 -97.7% 3.1 0.3 -91.9%
Laeken-10 0.2 1.0 0.5 1.0 0.8 -20.9% 1.2 1.2 0.7%EU-25 2.1 3.5 0.7 3.6 0.8 -76.7% 4.3 1.4 -66.3%
EUR/t 101.3 101.3 84.1 -17.0% 101.3 87.9 -13.3% 101.3 77.2 -23.8%
200920072006

Chapter II DG AGRI EU-15 and EU-25
76
Effects of Modulation in the EU-15……
The proposals for modulation in the communication foresees a 20% decrease of directpayments over a number of years for farms receiving more direct payments than thefranchise. Taking into account the franchise and the capping about 67% of the directpayments for cereals, oilseeds and protein crops as well as beef and 56% of directpayments for milk would be affected by modulation. The regional differences of theextent of modulation have not been taken into account. In this scenario direct paymentsare assumed to remain coupled as in the market scenario. If decoupling would accompanymodulation no effect on production could be expected, because the level of directpayments would be left out of consideration in the production decisions of the farmers.
The modulation of the coupled area payments for cereals, oilseeds, and protein cropsforeseen in the communication of the Commission on the MTR proposals would add onlylittle to the impact of market measures. Compared to the “market” scenario the cerealarea would change only very little compared to the simulations of the pure marketproposals. With the implementation of modulation in 2004, the gradual reduction ofpayments would lead in 2006 to shift of 40 000 ha from cereals and silage maize intooilseeds. Wheat area would be reduced by 270 000 ha and coarse grains by 70 000 ha.Voluntary set aside would slightly decrease as well by 80 000 ha, because the reductionof payments would be felt there as well.
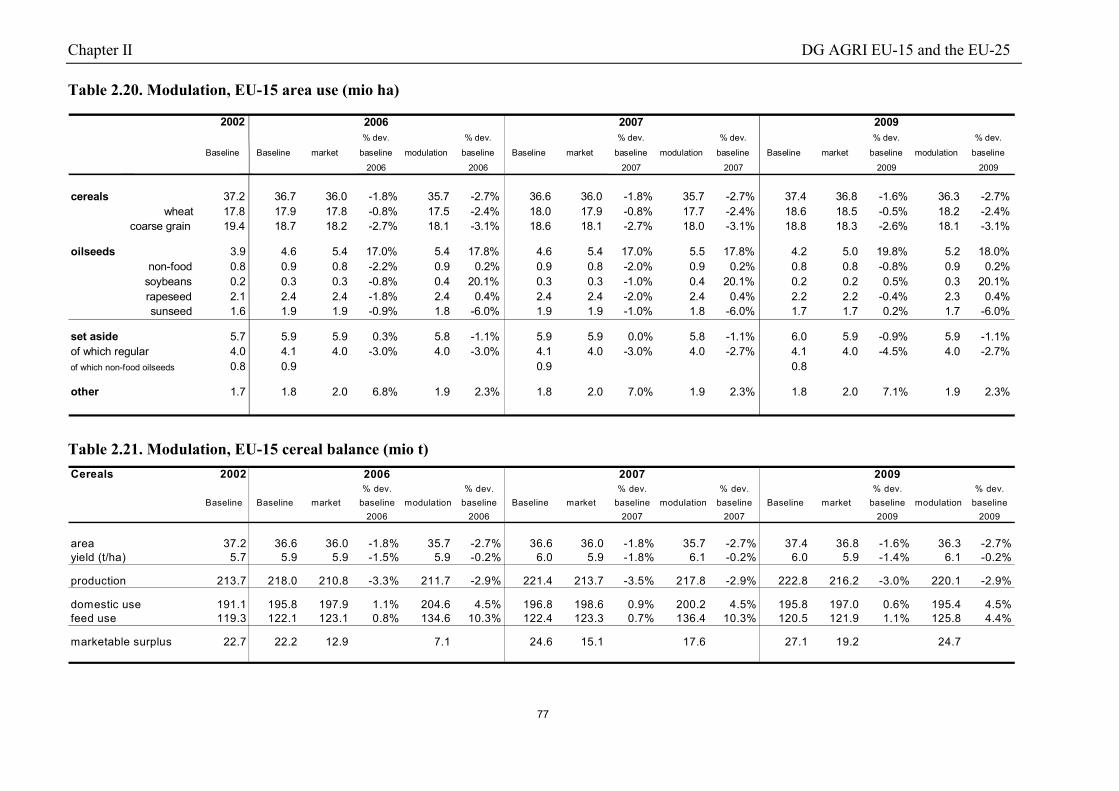
Chapter II DG AGRI EU-15 and the EU-25
77
Table 2.20. Modulation, EU-15 area use (mio ha)
2002% dev. % dev. % dev. % dev. % dev. % dev.
Baseline Baseline market baseline modulation baseline Baseline market baseline modulation baseline Baseline market baseline modulation baseline2006 2006 2007 2007 2009 2009
cereals 37.2 36.7 36.0 -1.8% 35.7 -2.7% 36.6 36.0 -1.8% 35.7 -2.7% 37.4 36.8 -1.6% 36.3 -2.7%wheat 17.8 17.9 17.8 -0.8% 17.5 -2.4% 18.0 17.9 -0.8% 17.7 -2.4% 18.6 18.5 -0.5% 18.2 -2.4%
coarse grain 19.4 18.7 18.2 -2.7% 18.1 -3.1% 18.6 18.1 -2.7% 18.0 -3.1% 18.8 18.3 -2.6% 18.1 -3.1%
oilseeds 3.9 4.6 5.4 17.0% 5.4 17.8% 4.6 5.4 17.0% 5.5 17.8% 4.2 5.0 19.8% 5.2 18.0%non-food 0.8 0.9 0.8 -2.2% 0.9 0.2% 0.9 0.8 -2.0% 0.9 0.2% 0.8 0.8 -0.8% 0.9 0.2%
soybeans 0.2 0.3 0.3 -0.8% 0.4 20.1% 0.3 0.3 -1.0% 0.4 20.1% 0.2 0.2 0.5% 0.3 20.1%rapeseed 2.1 2.4 2.4 -1.8% 2.4 0.4% 2.4 2.4 -2.0% 2.4 0.4% 2.2 2.2 -0.4% 2.3 0.4%sunseed 1.6 1.9 1.9 -0.9% 1.8 -6.0% 1.9 1.9 -1.0% 1.8 -6.0% 1.7 1.7 0.2% 1.7 -6.0%
set aside 5.7 5.9 5.9 0.3% 5.8 -1.1% 5.9 5.9 0.0% 5.8 -1.1% 6.0 5.9 -0.9% 5.9 -1.1%of which regular 4.0 4.1 4.0 -3.0% 4.0 -3.0% 4.1 4.0 -3.0% 4.0 -2.7% 4.1 4.0 -4.5% 4.0 -2.7%of which non-food oilseeds 0.8 0.9 0.9 0.8
other 1.7 1.8 2.0 6.8% 1.9 2.3% 1.8 2.0 7.0% 1.9 2.3% 1.8 2.0 7.1% 1.9 2.3%
20092006 2007
Table 2.21. Modulation, EU-15 cereal balance (mio t)Cereals 2002
% dev. % dev. % dev. % dev. % dev. % dev.Baseline Baseline market baseline modulation baseline Baseline market baseline modulation baseline Baseline market baseline modulation baseline
2006 2006 2007 2007 2009 2009
area 37.2 36.6 36.0 -1.8% 35.7 -2.7% 36.6 36.0 -1.8% 35.7 -2.7% 37.4 36.8 -1.6% 36.3 -2.7%yield (t/ha) 5.7 5.9 5.9 -1.5% 5.9 -0.2% 6.0 5.9 -1.8% 6.1 -0.2% 6.0 5.9 -1.4% 6.1 -0.2%
production 213.7 218.0 210.8 -3.3% 211.7 -2.9% 221.4 213.7 -3.5% 217.8 -2.9% 222.8 216.2 -3.0% 220.1 -2.9%
domestic use 191.1 195.8 197.9 1.1% 204.6 4.5% 196.8 198.6 0.9% 200.2 4.5% 195.8 197.0 0.6% 195.4 4.5%feed use 119.3 122.1 123.1 0.8% 134.6 10.3% 122.4 123.3 0.7% 136.4 10.3% 120.5 121.9 1.1% 125.8 4.4%
marketable surplus 22.7 22.2 12.9 7.1 24.6 15.1 17.6 27.1 19.2 24.7
2006 2007 2009
Chapter II DG AGRI EU-15 and EU-25
78
The relative small impact of modulation on the use of agricultural area would imply onlya relatively small impact on the production of cereals. Modulation would strengthen thetrend to higher yielding crops such as soft wheat and maize, which explains the 3.9mio. t. higher production than without modulation. At the same time domestic use,particularly feed use, would increase due to favourable price developments for feedgrains. From 2006, however, the growth of domestic use would be smaller than thegrowth of production, i.e. marketable surplus would be higher than in the marketscenario. The development in the cereal sector would have positive indirect effects onpork, poultry and egg production, which could slightly expand due to modulation effectsin the cereal and oilseed sector.
Modulation would have a larger effect on beef production especially after 2009, becausepremiums make up a significant part of revenues of production. Since the beef premiumscould be considered as being more coupled to production than the area payments,production would react negatively on the gradual decline of the premiums. In 2006production would be about 0.2 mio. t. lower than in the market scenario and the decliningproduction would reduce the marketable surplus of beef in the projected years. However,prices would appear to be slightly higher than in the “market” scenario and in the“baseline”.
….and in the EU-25.
Until 2013 - as long as the direct payments would be phased in - it is assumed that directpayments would not be modulated in the new Member States. Therefore, modulationwould have no direct effect on production in the new Member States. The only effect,which could influence production and domestic use in the new Member States, would bespillover effects from markets of the old Member States. Since, however, the projectedeffects would be mostly marginal in the old Member States, the projected effects arerelatively small. However, as in the market scenario enlargement would be positive forcereal production in the old Member States. Compared to the market scenario above, theeffects of modulation on cereal production in the EU-25 would be similarly marginalwith enlargement: In 2006 production of cereals would be 0.3 mio. t higher than in themarket scenario. In 2007 and 2009 cereal production would be slightly lower than in themarket scenario.
Similarly as in the EU-15 pork production would be one of the indirect beneficiaries ofmodulation because feed prices of certain feed grains would become more favourable.Pork production would be about 100 000 t higher than without modulation. The slightlylarger production of cereal based livestock contributes to the higher domestic use in theEU-25.
The production of beef would be relatively moderately affected. In the EU-25 somemarketable surplus of beef of around 300 000t to 400 000 t would exist. Prices reactrelatively less than in the EU-15 because consumption in the new Member States reactsmore to price changes than in the old Member States, where the demand is relativelyinelastic. The proposed modulation of 3% per year would have a very limited effect onmarkets. However, it might be possible that those beef production systems which relymostly on the premium for market revenues, e.g. very intensive maize based beef andsuckler cows, might be relatively more affected.

Chapter II DG AGRI EU-15 and EU-25
79
Table 2.22. Modulation, EU-15 pork balance (mio t)
Pork 2002% dev. % dev. % dev. % dev. % dev. % dev.
Baseline Baseline market baseline modulation baseline Baseline market baseline modulation baseline Baseline market baseline modulation baseline2006 2006 2007 2007 2009 2009
production 17.9 18.6 18.7 1.0% 18.7 0.8% 18.6 18.7 0.9% 18.7 0.9% 18.6 18.9 1.2% 18.7 0.2%
domestic use 16.8 17.4 17.6 1.0% 17.5 7.0% 17.4 17.6 9.1% 17.6 7.0% 17.5 17.7 1.3% 17.5 7.0%
marketable surplus 1.15 1.17 1.17 1.17 1.17 1.17 0.00 1.17 1.17 0.1% 1.17
EUR/t 1 415.5 1 427.3 1 405.9 -1.5% 1 385.9 -2.9% 1 419.9 1 400.1 -1.4% 1 390.3 -2.1% 1 437.2 1 410.3 -1.9% 1 399.1 -2.7%
2006 2007 2009
Table 2.23. Modulation, EU-15 beef balance (mio t)
Beef 2002% dev. % dev. % dev. % dev. % dev. % dev.
Baseline Baseline market baseline modulation baseline Baseline market baseline modulation baseline Baseline market baseline modulation baseline2006 2006 2007 2007 2009 2009
production 7.6 7.7 7.7 0.4% 7.6 -1.5% 7.8 7.8 0.5% 7.7 -1.5% 7.8 7.9 0.5% 7.7 -1.5%
domestic use 7.4 7.4 7.5 0.4% 7.3 -1.5% 7.5 7.6 0.5% 7.7 -1.5% 7.6 7.6 0.5% 7.6 -1.5%
marketable surplus 0.17 0.25 0.25 0.25 0.25 0.25 0.25 0.25 0.1
EUR/t 2 666.9 2 483.6 2 480.6 -0.1% 2 436.7 -1.9% 2 439.8 2 433.8 -0.2% 2 411.9 -1.9% 2 354.4 2 348.4 -0.3% 2 370.2 -1.9%
2006 2007 2009
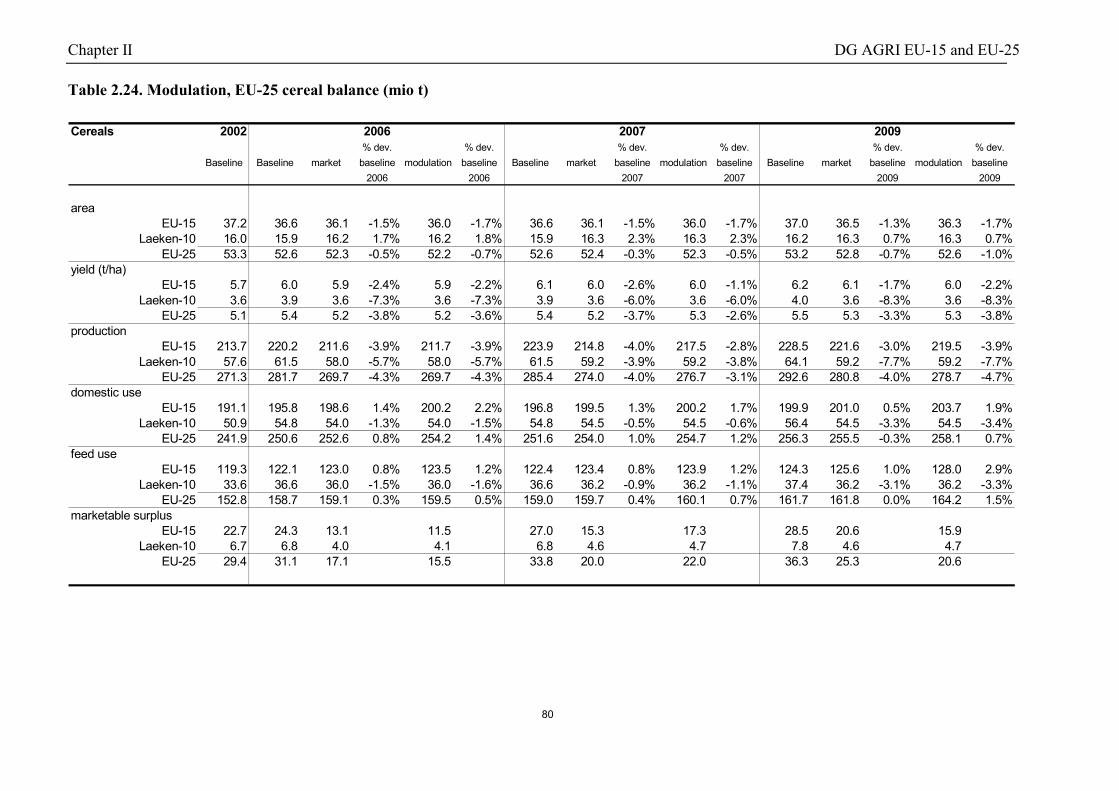
Chapter II DG AGRI EU-15 and EU-25
80
Table 2.24. Modulation, EU-25 cereal balance (mio t)
Cereals 2002% dev. % dev. % dev. % dev. % dev. % dev.
Baseline Baseline market baseline modulation baseline Baseline market baseline modulation baseline Baseline market baseline modulation baseline2006 2006 2007 2007 2009 2009
areaEU-15 37.2 36.6 36.1 -1.5% 36.0 -1.7% 36.6 36.1 -1.5% 36.0 -1.7% 37.0 36.5 -1.3% 36.3 -1.7%
Laeken-10 16.0 15.9 16.2 1.7% 16.2 1.8% 15.9 16.3 2.3% 16.3 2.3% 16.2 16.3 0.7% 16.3 0.7%EU-25 53.3 52.6 52.3 -0.5% 52.2 -0.7% 52.6 52.4 -0.3% 52.3 -0.5% 53.2 52.8 -0.7% 52.6 -1.0%
yield (t/ha)EU-15 5.7 6.0 5.9 -2.4% 5.9 -2.2% 6.1 6.0 -2.6% 6.0 -1.1% 6.2 6.1 -1.7% 6.0 -2.2%
Laeken-10 3.6 3.9 3.6 -7.3% 3.6 -7.3% 3.9 3.6 -6.0% 3.6 -6.0% 4.0 3.6 -8.3% 3.6 -8.3%EU-25 5.1 5.4 5.2 -3.8% 5.2 -3.6% 5.4 5.2 -3.7% 5.3 -2.6% 5.5 5.3 -3.3% 5.3 -3.8%
productionEU-15 213.7 220.2 211.6 -3.9% 211.7 -3.9% 223.9 214.8 -4.0% 217.5 -2.8% 228.5 221.6 -3.0% 219.5 -3.9%
Laeken-10 57.6 61.5 58.0 -5.7% 58.0 -5.7% 61.5 59.2 -3.9% 59.2 -3.8% 64.1 59.2 -7.7% 59.2 -7.7%EU-25 271.3 281.7 269.7 -4.3% 269.7 -4.3% 285.4 274.0 -4.0% 276.7 -3.1% 292.6 280.8 -4.0% 278.7 -4.7%
domestic useEU-15 191.1 195.8 198.6 1.4% 200.2 2.2% 196.8 199.5 1.3% 200.2 1.7% 199.9 201.0 0.5% 203.7 1.9%
Laeken-10 50.9 54.8 54.0 -1.3% 54.0 -1.5% 54.8 54.5 -0.5% 54.5 -0.6% 56.4 54.5 -3.3% 54.5 -3.4%EU-25 241.9 250.6 252.6 0.8% 254.2 1.4% 251.6 254.0 1.0% 254.7 1.2% 256.3 255.5 -0.3% 258.1 0.7%
feed useEU-15 119.3 122.1 123.0 0.8% 123.5 1.2% 122.4 123.4 0.8% 123.9 1.2% 124.3 125.6 1.0% 128.0 2.9%
Laeken-10 33.6 36.6 36.0 -1.5% 36.0 -1.6% 36.6 36.2 -0.9% 36.2 -1.1% 37.4 36.2 -3.1% 36.2 -3.3%EU-25 152.8 158.7 159.1 0.3% 159.5 0.5% 159.0 159.7 0.4% 160.1 0.7% 161.7 161.8 0.0% 164.2 1.5%
marketable surplusEU-15 22.7 24.3 13.1 11.5 27.0 15.3 17.3 28.5 20.6 15.9
Laeken-10 6.7 6.8 4.0 4.1 6.8 4.6 4.7 7.8 4.6 4.7EU-25 29.4 31.1 17.1 15.5 33.8 20.0 22.0 36.3 25.3 20.6
20092006 2007
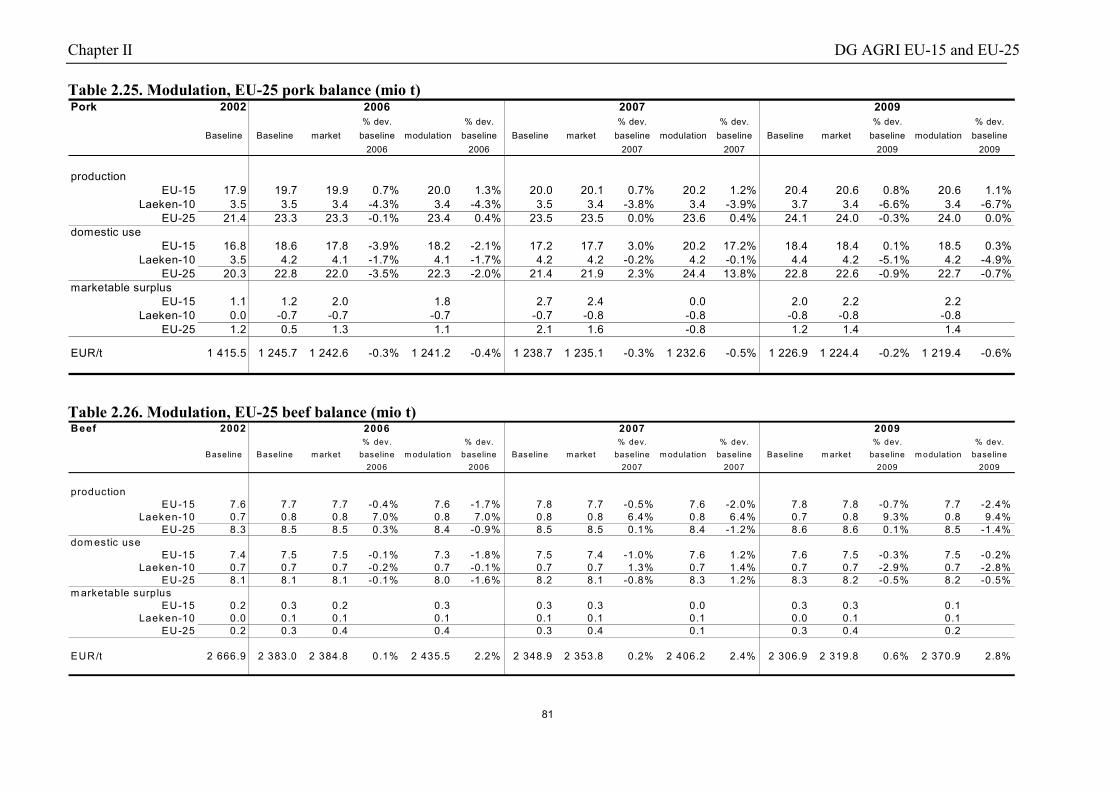
Chapter II DG AGRI EU-15 and EU-25
81
Table 2.25. Modulation, EU-25 pork balance (mio t)Pork 2002
% dev. % dev. % dev. % dev. % dev. % dev.Baseline Baseline market baseline modulation baseline Baseline market baseline modulation baseline Baseline market baseline modulation baseline
2006 2006 2007 2007 2009 2009
productionEU-15 17.9 19.7 19.9 0.7% 20.0 1.3% 20.0 20.1 0.7% 20.2 1.2% 20.4 20.6 0.8% 20.6 1.1%
Laeken-10 3.5 3.5 3.4 -4.3% 3.4 -4.3% 3.5 3.4 -3.8% 3.4 -3.9% 3.7 3.4 -6.6% 3.4 -6.7%EU-25 21.4 23.3 23.3 -0.1% 23.4 0.4% 23.5 23.5 0.0% 23.6 0.4% 24.1 24.0 -0.3% 24.0 0.0%
domestic useEU-15 16.8 18.6 17.8 -3.9% 18.2 -2.1% 17.2 17.7 3.0% 20.2 17.2% 18.4 18.4 0.1% 18.5 0.3%
Laeken-10 3.5 4.2 4.1 -1.7% 4.1 -1.7% 4.2 4.2 -0.2% 4.2 -0.1% 4.4 4.2 -5.1% 4.2 -4.9%EU-25 20.3 22.8 22.0 -3.5% 22.3 -2.0% 21.4 21.9 2.3% 24.4 13.8% 22.8 22.6 -0.9% 22.7 -0.7%
marketable surplusEU-15 1.1 1.2 2.0 1.8 2.7 2.4 0.0 2.0 2.2 2.2
Laeken-10 0.0 -0.7 -0.7 -0.7 -0.7 -0.8 -0.8 -0.8 -0.8 -0.8EU-25 1.2 0.5 1.3 1.1 2.1 1.6 -0.8 1.2 1.4 1.4
EUR/t 1 415.5 1 245.7 1 242.6 -0.3% 1 241.2 -0.4% 1 238.7 1 235.1 -0.3% 1 232.6 -0.5% 1 226.9 1 224.4 -0.2% 1 219.4 -0.6%
2006 2007 2009
Table 2.26. Modulation, EU-25 beef balance (mio t)Beef 2002
% dev. % dev. % dev. % dev. % dev. % dev.Baseline Baseline m arket baseline m odulation baseline Baseline m arket baseline m odulation baseline Baseline m arket baseline m odulation baseline
2006 2006 2007 2007 2009 2009
productionEU-15 7.6 7.7 7.7 -0.4% 7.6 -1.7% 7.8 7.7 -0.5% 7.6 -2.0% 7.8 7.8 -0.7% 7.7 -2.4%
Laeken-10 0.7 0.8 0.8 7.0% 0.8 7.0% 0.8 0.8 6.4% 0.8 6.4% 0.7 0.8 9.3% 0.8 9.4%EU-25 8.3 8.5 8.5 0.3% 8.4 -0.9% 8.5 8.5 0.1% 8.4 -1.2% 8.6 8.6 0.1% 8.5 -1.4%
dom estic useEU-15 7.4 7.5 7.5 -0.1% 7.3 -1.8% 7.5 7.4 -1.0% 7.6 1.2% 7.6 7.5 -0.3% 7.5 -0.2%
Laeken-10 0.7 0.7 0.7 -0.2% 0.7 -0.1% 0.7 0.7 1.3% 0.7 1.4% 0.7 0.7 -2.9% 0.7 -2.8%EU-25 8.1 8.1 8.1 -0.1% 8.0 -1.6% 8.2 8.1 -0.8% 8.3 1.2% 8.3 8.2 -0.5% 8.2 -0.5%
m arketable surplusEU-15 0.2 0.3 0.2 0.3 0.3 0.3 0.0 0.3 0.3 0.1
Laeken-10 0.0 0.1 0.1 0.1 0.1 0.1 0.1 0.0 0.1 0.1EU-25 0.2 0.3 0.4 0.4 0.3 0.4 0.1 0.3 0.4 0.2
EUR/t 2 666.9 2 383.0 2 384.8 0.1% 2 435.5 2.2% 2 348.9 2 353.8 0.2% 2 406.2 2.4% 2 306.9 2 319.8 0.6% 2 370.9 2.8%
2006 2007 2009

Chapter II DG AGRI EU-15 and EU-25
82
The Effects of decoupling on the EU-15….
Decoupling would further reduce the area of cereals compared to the market. Particularly theless competitive cereals such as rye and hard wheat and partly also barley would be affected.Oilseed area would further increase by 200 000 ha, and set-aside would increase by460 000 ha.
The relatively small increase of set aside under the MTR proposal with decoupling would bedue to the average decrease of receipts of set aside from 290 EUR/ha COP payment underAgenda 2000 to an average of 221 EUR/ha. This reduction would, from a sector point ofview, lower the attractiveness of set aside from the receipt side. Another important aspect iscross compliance, which would require farmers to keep the land in a certain condition. Thisinvolves costs of about 60-200 EUR/ha. Therefore, under these conditions set aside wouldbecome less attractive compared to cropping. However, it is important to note that the lowerthe standards of cross compliance would become, the more attractive set aside would becompared to other uses of the land.
With this adjustment soft wheat and maize would gain relative importance in cerealproduction, leaving total production higher than without decoupling. Decoupling will furthercontribute to the stabilisation of prices for barley and rye, both, which would experiencehigher producer prices of 6 to 10 EUR/t, compared to the situation without decoupling.
Decoupling would be particularly positive for beef production, where a production woulddrop by 5.7% compared to the baseline. This drop would be accompanied by price increasesof 6.7%. The negative effect of decoupling on beef supply, therefore, would be offset by therelatively larger increase of prices.
According to FADN about 10% of beef farms in 1999 experience negative margins, i.e. farmsuse the premiums to (partly) cover costs. The reduction of beef production in the scenarioswould be less than could be expected from this statistical information. One of the reasons forthe lower than expected decline would be the positive response of markets. Regarding thecontinuing trends of declining per capita consumption of beef, markets would respond verypositively on lower levels of supply. The relatively inelastic demand of beef would let pricesincrease by levels of 17% to 23%, which also might be an indication of higher quality produceon the markets from less intensive ways of production. In this respect positive income effectsfor beef producers could be expected, if export levels as in baseline could be maintained.
The price increase is sensitive to the future export policies. Lower level of exports as assumedfor the scenarios would then let prices increase only at a lower rate of 5% to 7% compared toAgenda 2000 policies. However, in this case external trade with beef would be balanced.
In this case, the EU-15 would have to export fewer surpluses with decoupling than withoutdecoupling. One should note however that export policies play an important role in thisassessment.

Chapter II DG AGRI EU-15 and EU-25
83
Table 2.27. Decoupling, EU-15 area use (mio ha)
2002% dev. % dev. % dev. % dev. % dev. % dev.
Baseline Baseline market baseline market + baseline Baseline market baseline market + baseline Baseline market baseline market + baseline2006 decoupl. 2006 2007 decoupl. 2007 2009 decoupl. 2009
cereals 37.2 36.7 36.0 -1.8% 34.7 -5.3% 36.6 36.0 -1.8% 34.6 -5.5% 37.4 36.8 -1.6% 35.4 -5.0%wheat 17.8 17.9 17.8 -0.8% 16.9 -5.9% 18.0 17.9 -0.8% 16.9 -5.9% 18.6 18.5 -0.5% 17.6 -5.0%
coarse grain 19.4 18.7 18.2 -2.7% 17.8 -4.8% 18.6 18.1 -2.7% 17.7 -5.1% 18.8 18.3 -2.6% 17.8 -5.0%
oilseeds 3.9 4.6 5.4 17.0% 5.6 21.4% 4.6 5.4 17.0% 5.6 21.8% 4.2 5.0 19.8% 5.3 26.0%non-food 0.8 0.9 0.8 -2.2% 0.9 4.0% 0.9 0.8 -2.0% 0.9 4.5% 0.8 0.8 -0.8% 0.9 5.7%
soybeans 0.2 0.3 0.3 -0.8% 0.4 30.4% 0.3 0.3 -0.7% 0.4 31.2% 0.2 0.2 0.5% 0.3 34.5%rapeseed 2.1 2.4 2.4 -1.8% 2.5 4.2% 2.4 2.4 -1.7% 2.5 4.6% 2.2 2.2 -0.4% 2.4 7.1%sunseed 1.6 1.9 1.9 -0.9% 1.8 -5.5% 1.9 1.9 -0.8% 1.8 -5.1% 1.7 1.7 0.2% 1.7 -3.2%
set aside 5.7 5.9 5.9 0.3% 6.1 4.1% 5.9 5.9 -0.2% 6.1 3.6% 6.0 5.9 -0.9% 6.2 3.2%of which regular 4.0 4.1 4.0 -3.0% 4.0 -3.0% 4.1 4.0 -3.4% 4.0 -3.4% 4.1 4.0 -4.5% 4.0 -4.5%of which non-food oilseeds 0.84 0.86 0.86 0.84
other 1.7 1.8 2.0 6.8% 2.2 18.9% 1.8 2.0 6.8% 2.2 19.2% 1.8 2.0 7.1% 2.2 20.4%
2006 2007 2009
Table 2.28. Decoupling, EU-15 cereal balance (mio t)
Cereals 2002% dev. % dev. % dev. % dev. % dev. % dev.
Baseline Baseline market baseline market + baseline Baseline market baseline market + baseline Baseline market baseline market + baseline2006 decoupl. 2006 2007 decoupl. 2007 2009 decoupl. 2009
area 37.2 36.6 36.0 -1.8% 34.7 -5.3% 36.6 36.0 -1.8% 34.6 -5.5% 37.4 36.8 -1.6% 35.4 -5.4%yield (t/ha) 5.7 5.9 5.9 -1.5% 6.1 2.4% 6.0 5.9 -1.8% 6.2 3.4% 6.0 5.9 -1.4% 6.2 5.2%
production 213.7 218.0 210.8 -3.3% 210.2 -3.1% 221.4 213.7 -3.5% 214.8 -2.3% 222.8 216.2 -3.0% 219.5 -0.4%
domestic use 191.1 195.8 197.9 1.1% 190.7 -2.6% 196.8 198.6 0.9% 194.4 -1.2% 195.8 197.0 0.6% 195.8 6.7%feed use 119.3 122.1 123.1 0.8% 129.2 5.8% 122.4 123.3 0.7% 128.4 4.9% 120.5 121.9 1.1% 139.9 16.1%
marketable surplus 22.7 22.2 12.9 19.6 24.6 15.1 20.4 27.1 19.2 23.7
2006 2007 2009
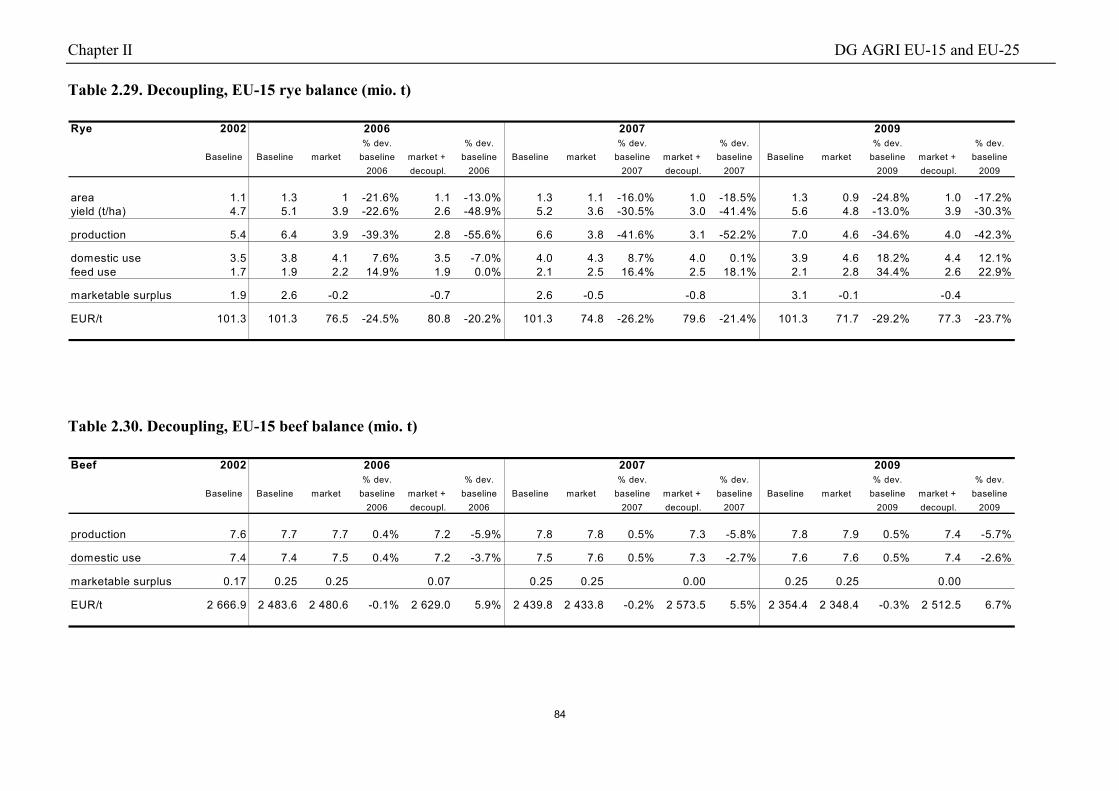
Chapter II DG AGRI EU-15 and EU-25
84
Table 2.29. Decoupling, EU-15 rye balance (mio. t)
Rye 2002% dev. % dev. % dev. % dev. % dev. % dev.
Baseline Baseline market baseline market + baseline Baseline market baseline market + baseline Baseline market baseline market + baseline2006 decoupl. 2006 2007 decoupl. 2007 2009 decoupl. 2009
area 1.1 1.3 1 -21.6% 1.1 -13.0% 1.3 1.1 -16.0% 1.0 -18.5% 1.3 0.9 -24.8% 1.0 -17.2%yield (t/ha) 4.7 5.1 3.9 -22.6% 2.6 -48.9% 5.2 3.6 -30.5% 3.0 -41.4% 5.6 4.8 -13.0% 3.9 -30.3%
production 5.4 6.4 3.9 -39.3% 2.8 -55.6% 6.6 3.8 -41.6% 3.1 -52.2% 7.0 4.6 -34.6% 4.0 -42.3%
domestic use 3.5 3.8 4.1 7.6% 3.5 -7.0% 4.0 4.3 8.7% 4.0 0.1% 3.9 4.6 18.2% 4.4 12.1%feed use 1.7 1.9 2.2 14.9% 1.9 0.0% 2.1 2.5 16.4% 2.5 18.1% 2.1 2.8 34.4% 2.6 22.9%
marketable surplus 1.9 2.6 -0.2 -0.7 2.6 -0.5 -0.8 3.1 -0.1 -0.4
EUR/t 101.3 101.3 76.5 -24.5% 80.8 -20.2% 101.3 74.8 -26.2% 79.6 -21.4% 101.3 71.7 -29.2% 77.3 -23.7%
2006 2007 2009
Table 2.30. Decoupling, EU-15 beef balance (mio. t)
Beef 2002% dev. % dev. % dev. % dev. % dev. % dev.
Baseline Baseline market baseline market + baseline Baseline market baseline market + baseline Baseline market baseline market + baseline2006 decoupl. 2006 2007 decoupl. 2007 2009 decoupl. 2009
production 7.6 7.7 7.7 0.4% 7.2 -5.9% 7.8 7.8 0.5% 7.3 -5.8% 7.8 7.9 0.5% 7.4 -5.7%
domestic use 7.4 7.4 7.5 0.4% 7.2 -3.7% 7.5 7.6 0.5% 7.3 -2.7% 7.6 7.6 0.5% 7.4 -2.6%
marketable surplus 0.17 0.25 0.25 0.07 0.25 0.25 0.00 0.25 0.25 0.00
EUR/t 2 666.9 2 483.6 2 480.6 -0.1% 2 629.0 5.9% 2 439.8 2 433.8 -0.2% 2 573.5 5.5% 2 354.4 2 348.4 -0.3% 2 512.5 6.7%
2006 2007 2009

Chapter II DG AGRI EU-15 and EU-25
85
…. and on the EU-25
Decoupling in the EU-25 would produce similar trends than in the EU-15. However,decoupling would lead in the new Member States to a different production structure. In themarket scenarios farmers would produce – and invest into new capacities – for thoseproduction which is subject to direct payments. Market considerations might play a lower rolefor these decisions. This allocation of scarce resources – especially capital – would be avoidedin the scenario with decoupled payments.
As in the EU-15, wheat and maize production in the new Member States would benefit fromdecoupling and would gain relative importance. In the EU-25, barley production wouldbenefit, because of the better market conditions than without enlargement.
For rye decoupling would lead to an improved situation compared to non-decoupling in theEU-25 (see “market” and “modulation” scenarios). Decoupling would lead to less area flowfrom other crops and fallow land into arable land in the new Member States. Therefore, lessrye would be produced but also more rye from the new Member States would find markets inthe old Member States. Prices would be about higher than without decoupling. This showsthat production would evolve better according to the relative competitiveness of markets inthe different Member States.
For beef a similar positive situation as in the EU-15 could be expected by decoupling directpayments from production. Particularly the farmers in the new Member States would not haveto invest into beef production in order to receive the beef premiums, if market prospectswould not carry it. As in the past, beef consumption in the new Member States would developrelatively weaker despite significant increases in income compared to the old Member States.Therefore, with these underlying market developments less production of beef could berecorded in the old and new Member States than in the scenario with coupled payments.

Chapter II DG AGRI EU-15 and EU-25
86
Table 2.31. Decoupling, EU-25 cereal balance (mio. t)
Cereals 2002% dev. % dev. % dev. % dev. % dev. % dev.
Baseline Baseline market baseline market + baseline Baseline market baseline market + baseline Baseline market baseline market + baseline2006 decoupl. 2006 2007 decoupl. 2007 2009 decoupl. 2009
areaEU-15 37.2 36.6 36.1 -1.5% 34.8 -4.9% 36.6 36.1 -1.5% 34.9 -4.8% 37.0 36.5 -1.3% 35.3 -4.6%
Laeken-10 16.0 15.9 16.2 1.7% 15.9 -0.5% 15.9 16.3 2.3% 15.9 0.0% 16.2 16.3 0.7% 15.9 -1.6%EU-25 53.3 52.6 52.3 -0.5% 50.7 -3.6% 52.6 52.4 -0.3% 50.8 -3.4% 53.2 52.8 -0.7% 51.2 -3.7%
yield (t/ha)EU-15 5.7 6.0 5.9 -2.4% 6.1 1.1% 6.1 6.0 -2.6% 6.2 1.0% 6.2 6.1 -1.7% 6.2 0.9%
Laeken-10 3.6 3.9 3.6 -7.3% 3.8 -0.7% 3.9 3.6 -6.0% 3.9 0.6% 4.0 3.6 -8.3% 3.9 -1.9%EU-25 5.1 5.4 5.2 -3.8% 5.4 0.3% 5.4 5.2 -3.7% 5.5 0.5% 5.5 5.3 -3.3% 5.5 0.0%
productionEU-15 213.7 220.2 211.6 -3.9% 211.7 -3.9% 223.9 214.8 -4.0% 215.3 -3.8% 228.5 221.6 -3.0% 219.8 -3.8%
Laeken-10 57.6 61.5 58.0 -5.7% 60.8 -1.2% 61.5 59.2 -3.9% 61.9 0.6% 64.1 59.2 -7.7% 61.9 -3.4%EU-25 271.3 281.7 269.7 -4.3% 272.5 -3.3% 285.4 274.0 -4.0% 277.2 -2.9% 292.6 280.8 -4.0% 281.7 -3.7%
domestic useEU-15 191.1 195.8 198.6 1.4% 198.6 1.4% 196.8 199.5 1.3% 199.3 1.3% 199.9 201.0 0.5% 202.2 1.1%
Laeken-10 50.9 54.8 54.0 -1.3% 54.7 -0.1% 54.8 54.5 -0.5% 55.2 0.9% 56.4 54.5 -3.3% 55.2 -2.0%EU-25 241.9 250.6 252.6 0.8% 253.3 1.1% 251.6 254.0 1.0% 254.6 1.2% 256.3 255.5 -0.3% 257.4 0.4%
feed useEU-15 119.3 122.1 123.0 0.8% 125.0 2.4% 122.4 123.4 0.8% 125.2 2.2% 124.3 125.6 1.0% 126.7 1.9%
Laeken-10 33.6 36.6 36.0 -1.5% 36.6 0.0% 36.6 36.2 -0.9% 36.8 0.7% 37.4 36.2 -3.1% 36.8 -1.5%EU-25 152.8 158.7 159.1 0.3% 161.6 1.8% 159.0 159.7 0.4% 162.0 1.9% 161.7 161.8 0.0% 163.5 1.1%
marketable surplusEU-15 22.7 24.3 13.1 13.1 27.0 15.3 16.0 28.5 20.6 17.6
Laeken-10 6.7 6.8 4.0 6.1 6.8 4.6 6.7 7.8 4.6 6.7EU-25 29.4 31.1 17.1 19.2 33.8 20.0 22.6 36.3 25.3 24.3
2006 2007 2009

Chapter II DG AGRI EU-15 and EU-25
87
Table 2.32. Decoupling, EU-25 wheat balance (mio. t)
Wheat 2002% dev. % dev. % dev. % dev. % dev. % dev.
Baseline Baseline market baseline market + baseline Baseline market baseline market + baseline Baseline market baseline market + baseline2006 decoupl. 2006 2007 decoupl. 2007 2009 decoupl. 2009
areaEU-15 17.8 17.9 17.7 -1.5% 16.9 -5.7% 18.0 17.7 -1.5% 17.0 -5.6% 18.5 18.3 -1.3% 17.6 -5.2%
Laeken-10 5.9 6.6 6.7 1.5% 5.9 -11.5% 6.6 6.8 1.8% 5.9 -10.9% 6.7 6.8 1.4% 5.9 -11.3%EU-25 23.7 24.6 24.4 -0.7% 22.8 -7.3% 24.6 24.5 -0.6% 22.9 -7.0% 25.2 25 -0.6% 23.5 -6.8%
yield (t/ha)EU-15 6.0 6.2 6.1 -1.1% 6.4 4.2% 6.2 6.2 -1.1% 6.5 4.1% 6.2 6.3 0.9% 6.5 3.8%
Laeken-10 3.9 3.7 3.4 -8.0% 4.2 14.5% 3.7 3.5 -6.5% 4.3 16.2% 3.8 3.5 -8.9% 4.3 13.2%EU-25 5.5 5.5 5.4 -2.7% 5.9 6.6% 5.6 5.4 -2.4% 5.9 6.8% 5.6 5.5 -1.1% 5.9 6.0%
productionEU-15 106.1 110.6 107.7 -2.6% 108.7 -1.8% 112.3 109.5 -2.6% 110.4 -1.7% 115.5 115.1 -0.4% 113.7 -1.6%
Laeken-10 23.3 24.6 22.9 -6.6% 24.9 1.3% 24.6 23.4 -4.9% 25.4 3.5% 25.3 23.4 -7.6% 25.4 0.5%EU-25 129.5 135.2 130.7 -3.4% 133.6 -1.2% 136.9 132.8 -3.0% 135.9 -0.8% 140.8 138.4 -1.7% 139.1 -1.2%
domestic useEU-15 94.4 96.6 97.2 0.6% 96.0 -0.7% 98.2 98.4 0.3% 97.4 -0.7% 100.0 98.8 -1.1% 99.1 -0.8%
Laeken-10 19.3 20.7 20.3 -1.7% 20.7 0.3% 20.7 20.5 -0.8% 20.9 1.3% 21.3 20.5 -3.8% 20.9 -1.7%EU-25 113.7 117.3 117.5 0.2% 116.7 -0.5% 118.8 118.9 0.1% 118.3 -0.4% 121.3 119.3 -1.6% 120.1 -1.0%
feed useEU-15 43.8 44.5 43.5 -2.3% 44.0 -1.1% 45.5 44.4 -2.3% 44.9 -1.3% 46.2 45.1 -2.4% 45.5 -1.5%
Laeken-10 9.2 10.0 9.7 -2.5% 10.1 0.5% 10.0 9.8 -2.3% 10.1 0.9% 10.1 9.8 -3.8% 10.1 -0.6%EU-25 53.0 54.5 53.3 -2.3% 54.1 -0.8% 55.5 54.2 -2.3% 55.0 -0.9% 56.4 54.9 -2.6% 55.6 -1.4%
marketable surplusEU-15 11.8 14.0 10.6 12.7 14.2 11.1 13.0 15.6 16.2 14.6
Laeken-10 4.0 3.9 2.6 4.2 3.9 2.9 4.5 4.0 2.9 4.5EU-25 15.8 17.9 13.2 16.9 18.1 13.9 17.5 19.6 19.1 19.1
EUR/t 112.4 114.3 114.5 0.2% 114.2 0.0% 113.4 113.6 0.1% 113.3 -0.1% 111.7 111.9 0.1% 111.6 -0.1%
2006 2007 2009

Chapter II DG AGRI EU-15 and EU-25
88
Table 2.33. Decoupling, EU-25 rye balance (mio. t)
Rye 2002% dev. % dev. % dev. % dev. % dev. % dev.
Baseline Baseline market baseline market + baseline Baseline market baseline market + baseline Baseline market baseline market + baseline2006 decoupl. 2006 2007 decoupl. 2007 2009 decoupl. 2009
areaEU-15 1.1 1.3 1.2 -3.8% 1.0 -24.2% 1.3 1.2 -3.7% 0.8 -35.4% 1.3 1.2 -3.5% 0.9 -26.1%
Laeken-10 1.6 1.6 1.6 3.3% 1.5 -1.7% 1.6 1.6 3.9% 1.5 -1.6% 1.6 1.6 2.4% 1.5 -3.0%EU-25 2.7 2.8 2.8 0.1% 2.5 -11.8% 2.8 2.8 0.5% 2.3 -16.8% 2.8 2.8 -0.2% 2.5 -13.3%
yield (t/ha)EU-15 4.7 5.1 3.6 -30.1% 3.5 -31.5% 5.2 3.6 -31.1% 4.1 -21.5% 5.6 3.8 -32.1% 3.8 -32.3%
Laeken-10 4.0 4.9 4.5 -9.2% 4.7 -4.5% 5.0 4.7 -6.8% 4.9 -2.6% 5.2 5.0 -2.7% 5.1 -1.5%EU-25 4.3 5.0 4.1 -18.3% 4.2 -15.3% 5.1 4.2 -17.5% 4.6 -9.6% 5.4 4.5 -16.0% 4.6 -14.2%
productionEU-15 5.4 6.4 4.3 -32.8% 3.3 -48.1% 6.6 4.4 -33.7% 3.3 -49.3% 7.1 4.6 -34.5% 3.5 -50.0%
Laeken-10 6.3 7.7 7.2 -6.2% 7.2 -6.2% 7.8 7.5 -3.2% 7.5 -4.2% 8.2 8.2 -0.3% 7.8 -4.4%EU-25 11.8 14.1 11.5 -18.3% 10.5 -25.2% 14.4 11.9 -17.1% 10.8 -24.8% 15.3 12.8 -16.1% 11.4 -25.6%
domestic useEU-15 3.5 3.8 4.1 7.2% 3.8 0.5% 4.0 4.3 8.2% 4.5 13.8% 4.0 4.4 10.5% 4.6 14.6%
Laeken-10 6.1 6.7 6.7 -0.8% 6.6 -1.2% 6.8 6.8 -0.6% 6.7 -1.4% 7.0 7.0 -0.5% 6.9 -1.6%EU-25 9.6 10.5 10.8 2.1% 10.5 -0.6% 10.8 11.1 2.6% 11.2 4.2% 11.0 11.4 3.5% 11.4 4.3%
feed useEU-15 1.7 1.9 2.2 14.1% 1.9 0.0% 2.1 2.4 15.3% 2.6 24.6% 2.1 2.5 19.6% 2.7 27.4%
Laeken-10 2.8 3.2 3.2 -1.5% 3.1 -2.3% 3.2 3.2 -0.2% 3.2 -1.5% 3.3 3.3 -1.7% 3.2 -3.2%EU-25 4.5 5.2 5.4 4.4% 5.1 -1.4% 5.3 5.6 6.0% 5.8 8.9% 5.5 5.8 6.5% 5.9 8.7%
marketable surplusEU-15 1.9 2.6 0.2 -0.5 2.6 0.1 -97.7% -1.2 3.1 0.3 -1.0
Laeken-10 0.2 1.0 0.5 0.6 1.0 0.8 -20.9% 0.7 1.2 1.2 0.9EU-25 2.1 3.5 0.7 0.1 3.6 0.8 -76.7% -0.4 4.3 1.4 -0.1
EUR/t 101.3 101.3 84.1 -17.0% 84.7 -16.4% 101.3 87.9 -13.3% 88.6 -12.6% 101.3 77.2 -23.8% 81.4 -19.7%
2006 2007 2009
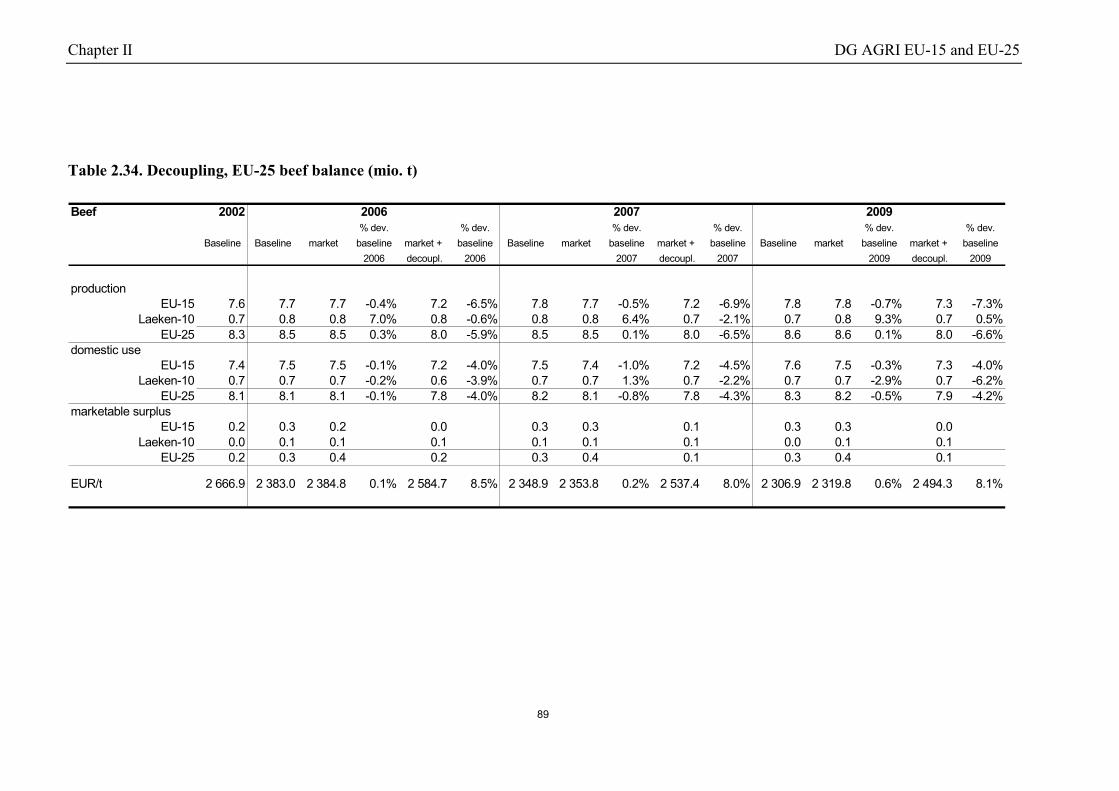
Chapter II DG AGRI EU-15 and EU-25
89
Table 2.34. Decoupling, EU-25 beef balance (mio. t)
Beef 2002% dev. % dev. % dev. % dev. % dev. % dev.
Baseline Baseline market baseline market + baseline Baseline market baseline market + baseline Baseline market baseline market + baseline2006 decoupl. 2006 2007 decoupl. 2007 2009 decoupl. 2009
productionEU-15 7.6 7.7 7.7 -0.4% 7.2 -6.5% 7.8 7.7 -0.5% 7.2 -6.9% 7.8 7.8 -0.7% 7.3 -7.3%
Laeken-10 0.7 0.8 0.8 7.0% 0.8 -0.6% 0.8 0.8 6.4% 0.7 -2.1% 0.7 0.8 9.3% 0.7 0.5%EU-25 8.3 8.5 8.5 0.3% 8.0 -5.9% 8.5 8.5 0.1% 8.0 -6.5% 8.6 8.6 0.1% 8.0 -6.6%
domestic useEU-15 7.4 7.5 7.5 -0.1% 7.2 -4.0% 7.5 7.4 -1.0% 7.2 -4.5% 7.6 7.5 -0.3% 7.3 -4.0%
Laeken-10 0.7 0.7 0.7 -0.2% 0.6 -3.9% 0.7 0.7 1.3% 0.7 -2.2% 0.7 0.7 -2.9% 0.7 -6.2%EU-25 8.1 8.1 8.1 -0.1% 7.8 -4.0% 8.2 8.1 -0.8% 7.8 -4.3% 8.3 8.2 -0.5% 7.9 -4.2%
marketable surplusEU-15 0.2 0.3 0.2 0.0 0.3 0.3 0.1 0.3 0.3 0.0
Laeken-10 0.0 0.1 0.1 0.1 0.1 0.1 0.1 0.0 0.1 0.1EU-25 0.2 0.3 0.4 0.2 0.3 0.4 0.1 0.3 0.4 0.1
EUR/t 2 666.9 2 383.0 2 384.8 0.1% 2 584.7 8.5% 2 348.9 2 353.8 0.2% 2 537.4 8.0% 2 306.9 2 319.8 0.6% 2 494.3 8.1%
2006 2007 2009

Chapter II DG AGRI EU-15 and EU-25
90
2.5 THE IMPACT OF THE DIFFERENT SCENARIOS ON AGRICULTURAL REVENUESIN THE EU-15…..
In the short-term the impact of market measures on agricultural income, measured in marketrevenues including and excluding direct payments, is slightly positive. However, the “market”scenario indicates that this income advantage gradually declines and would turn to be negativeafter 2008 compared to 2002. In 2009 the sector income is 2.8% lower than in 2002. One ofthe prime reasons for this development seems to be the income situation for cereals, whichwould appear to be squeezed by the permanent, set aside obligation of 10%. The competitionwith energy crops, which become eligible for the carbon credit, removes cereal area and cerealproduction, but would not offset the negative income effect of the removal.
Modulation on the other hand would produce only a very slight income effect compared tothe “market” scenario. This income effect would be slightly positive for farms, when theimpact of rural development measures are taken into account.
With decoupling, income initially is lower than without decoupling. However, the moresustainable production in the medium term produces more income than in the scenarioswithout decoupling. In 2009 the income in the EU-15 is about 4.2% higher than in the“market” scenario and 0.6% lower than in “baseline”. Taking into account the effects ofrural development, farm income would be 0.3% higher than in baseline, i.e. than underAgenda 2000 policies.
In conclusion, the MTR proposals would impose only slight effects on income. Especiallydecoupling would be a positive instrument in the medium-term, as both the income situationas well as the market situation would improve compared to Agenda 2000 policies as well as tothe implementation of only parts of the MTR proposals.
…..and in the EU-25
With enlargement market dynamics would change. This would open new opportunities bothfor old and new Member States. These effects are visible in the scenarios. The MTR proposalswill put agricultural policies and agricultural incomes on a more sustainable basis comparedto Agenda 2000 policies.
Also in the EU-25 scenarios, agricultural income develops best in the scenario withdecoupled direct payments, regarding the fact that possible market imbalances wouldnot exist. Table 2.35 also displays the vivid fact that enlargement would have a large positiveincome effect on the new Member States. This effect would even be greater when the effectsof rural and regional development policies are taken into account. Preliminary assessments ofthese measures on farm income for the new Member States would suggest that income couldincrease by additional 6% to 10%. However, this depends very much on the chosen measuresand their implementation.

Chapter II DG AGRI EU-15 and EU-25
91
Table 2.35. EU-15; Agricultural income in different scenarios (2002=100)
2002
Baseline Baseline market market + modul. Baseline market market + modul. Baseline market market + modul.decoupl. decoupl. decoupl.
total agriculture 100 103.3 102.4 100.5 99.5 101.3 100.5 99.4 99.0 102.1 97.2 103.5 98.0
revenues including direct payments 100 102.7 102.8 100.4 102.8 100.4 100.4 99.5 99.4 101.7 97.7 102.9 98.7
of which
cereals 100 103.7 98.4 102.6 98.4 105.1 98.1 104.7 98.5 105.3 99.9 99.7 96.3
oilseeds (incl. non-food) 100 121.4 118.3 138.9 118.3 118.9 117.6 127.1 128.6 116.4 125.4 123.3 132.6
beef 100 94.4 94.7 94.0 91.2 94.2 94.4 93.6 91.9 91.3 91.5 91.8 90.6
set aside revenues 100 104.0 110.0 114.0 101.5 105.0 110.0 114.0 108.3 106.0 110.0 114.0 108.8
2006 2007 2009
Table 2.36. EU-25; Agricultural income in different scenarios (2002=100)
2002
Baseline Baseline market market + modul. Baseline market market + modul. Baseline market market + modul.decoupl. decoupl. decoupl.
market revenues* 100 102.4 100.6 101.5 100.4 101.3 99.4 100.1 99.0 102.0 100.0 100.3 99.5
revenues including direct payments* 100 101.9 100.5 101.2 100.4 101.0 99.5 100.1 99.4 101.4 99.9 100.2 99.6
of which new Member States* 100 124.0 118.8 121.5 118.9 125.1 119.8 122.4 119.9 130.0 124.4 127.3 124.3
2006 2007 2009
* Accession countries valued in EU-15 prices in 2002 ** valued at current prices in 2002
Chapter II DG AGRI EU-15 and EU-25
92
References:
European Commission (2002 a), Analysis of the Impact on Agricultural Markets andIncomes of EU Enlargement to the CEECs. Brussels.
European Commission (2002 b), Prospects for Agricultural Markets 2002-2009. Updatefor EU markets. Brussels.
Münch (2002), Effects of EU Enlargement to the Central European Countries onAgricultural Markets. Peter Lang. Frankfurt.

Chapter III FAPRI
93
FAPRI Analysis of the European Commission's
Mid-Term Review proposals
The Food and Agricultural Policy Research Institute (FAPRI)
at the University of Missouri

94

Chapter III FAPRI
95
EXECUTIVE SUMMARY
In the Mid-Term Review (MTR), the European Commission proposes changes to theCommon Agricultural Policy that would generally reduce the amount of support to EUagriculture that is contingent on agricultural production.
Using a structural model of EU agriculture that can be linked to larger models of worldagricultural markets, the Food and Agricultural Policy Research Institute (FAPRI)estimates potential impacts of the MTR proposals on EU and world agricultural marketsover the period 2004-2009. The estimates are based on a series of assumptions abouthow policies would be implemented and how economic actors are likely to respond tosignificant changes in marginal incentives.
Effects of the MTR proposals are evaluated by comparing estimated outcomes under theproposals to those that would result under a current-policy baseline. Key findings includethe following.
� For most major commodities, the MTR proposals would result in a modestreduction in EU production.
� The total area harvested for nine major crops would be reduced by about 2 percentunder the MTR proposals. The sharpest proportional reduction would be in rye,but the area devoted to durum wheat, oilseeds, rice, and barley would also decline.
� In the livestock sector, sharp reductions in marginal production incentives wouldlead to significant reductions in sheep and beef cattle inventories.
� Major changes in the market regimes for rice and rye lead to large reductions inmarket prices and carryover stocks for those commodities. Reduced interventionprices also lead to a small reduction in EU barley prices.
� For soft wheat, EU domestic prices are supported by world market prices and thusare largely unaffected by the proposed reduction in intervention prices.
� EU prices for beef cattle, sheep, and durum increase in response to the estimatedreduction in production.
� Rice imports increase sharply in the current policy baseline, given planned importliberalisation from least developed countries. Under the MTR proposal, riceimports increase only slightly from current levels.
� After a short transition period, the MTR proposals would reduce EU net exportsof most other commodities. As a consequence, there would be a slight increase inworld market prices for a number of commodities.
3.1. Introduction
The European Commission’s Mid-Term Review (MTR) proposes a number of changes tothe Common Agricultural Policy (CAP).
Chapter III FAPRI
96
In general, these reforms would reduce the amount of support to EU agriculture that iscontingent on agricultural production.
The Food and Agricultural Policy Research Institute (FAPRI)28 conducted an analysis ofthe MTR proposals to assess their potential impacts on EU and world agriculturalmarkets. The analysis reflects information about the proposals provided by theCommission between July and September 2002. The starting point for the analysis is aset of baseline projections for EU agricultural markets that reflects the most recentinformation available in mid-2002.
As this analysis is prepared, a number of questions remain regarding specificimplementation of the reforms if they were adopted as proposed. In some cases, thesequestions have important implications for the analysis. For example, what precisely isrequired of a producer to retain eligibility for “decoupled” payments? Depending on theanswer, the new payment schemes may have significantly greater or smaller effects thanindicated in this analysis.
Another source of uncertainty in the analysis is the outlook for world agriculturalmarkets. Although the baseline used here is relatively recent, there have been a numberof important developments in world markets since mid-2002. Perhaps most important isthe sharp increase in world cereal and oilseed prices that has resulted from weather-induced reductions in 2002 production in the United States, Canada, Australia, and othercountries. These developments have major implications for agricultural markets in 2002and 2003, but it is our judgement that they do not seriously impact projections forsubsequent years. While the baseline may continue to be appropriate to look at reformproposals taking effect in 2004, the experience serves as a reminder that events can causesudden shifts in the market outlook, and all market projections should be treated asprovisional.
3.2. FAPRI models
FAPRI has developed an integrated set of non-spatial partial equilibrium models formajor agricultural markets. Current FAPRI models cover world markets for cereals,oilseeds, meats, dairy products, cotton, and sugar. For each commodity, the largestexporting and importing countries are treated separately, with other countries included inregional groupings or a “rest of world” aggregate. In the case of wheat, for example, the2002 version of the model includes 9 exporting countries, 12 importing countries, 7regional groupings, and a small rest-of-world category. For most countries andcommodities, the model estimates production, consumption, and trade; in many cases themodel also estimates domestic market prices, stocks, and other variables of interest.
Where feasible and appropriate, parameters of the FAPRI model were estimated usingeconometric techniques applied to time series data. In some cases, however, data
28 FAPRI is a joint institute of Iowa State University and the University of Missouri, created to provide
objective, quantitative analysis of issues related to world agriculture. FAPRI collaborates with anumber of other universities, government agencies, and other institutions in the United States, theEuropean Union, and around the world. For each of the past 17 years, FAPRI has developed ten-yearprojections of world agricultural markets. FAPRI analysts use a system of linked models and thejudgement of commodity and country specialists to estimate the supply, demand, and prices of majorcommodities under alternative sets of assumptions.
Chapter III FAPRI
97
limitations, recent structural change, or resource limitations mean that econometrictechniques cannot be used to determine model parameters. In these cases, the model usesassumed parameters that are taken from the literature or that are established based onanalyst judgement and input from market specialists.
The model estimates both the area devoted to a particular crop and the yield per harvestedhectare. Area is generally a function of output and input prices and government policies.Yield equations incorporate technical progress and price responses. For beef and pork,supply equations consider herd dynamics, where the key behavioural equations generallyare those that determine breeding herd inventory, slaughter, and carcass weights. Thesemeat supply equations are functions of livestock prices, feed and other input prices, andgovernment policies. The dairy model estimates both cow numbers and milk yield percow, and the supply equations are functions of milk prices, feed and other input prices,and government policies. In all supply equations, care is taken to ensure that the modelreflects marginal incentives. As a result, a subsidy directly tied to production will have alarger effect on production, all else equals, than a more decoupled subsidy that providesthe same level of producer income support. Because the models attempt to incorporatebiological constraints and other dynamic factors, they are intended to reflect both short-run and long run supply behaviour.
Per capita consumer demand equations for cereals, oils, meats, dairy products, and sugarare a function of the price of the food in question, the prices of other foods, and income.Feed demand for cereals and oilseed meals depends on livestock production and feedprices. Oilseed crush demand is a function of relative oilseed and oilseed product prices.Allocation of milk to production of the various dairy products is a function of relativeprices. End-of-period stocks generally are a function of prices and government policies.
The models close different markets in different ways, depending on the nature of theproduct and policies. In the simplest case, a relatively homogeneous good withoutinsulating policies, domestic prices in each country are directly linked to a world marketprice. Net trade for each country is simply the difference between domestic supply anddemand at this domestic price. The world market price is that which causes total worldexports to equal total world imports, thus balancing global supply and demand.
For more heterogeneous goods (e.g., meats), trade is a function of relative prices andother variables, and domestic market prices are determined by equating total supply(production, changes in stocks, and imports) and demand in domestic markets. Wheretariffs, quotas, support prices, and other government policies determine or influencemarket prices, the models attempt to incorporate these effects.
The EU components of the model explicitly represent important features of EUagricultural policy. Stocks accumulate when market prices fall to intervention levels.Set-aside reduces the amount of land devoted to production of cereals and oilseeds.Quotas limit milk production. Various payment schemes have production impacts thatdiffer depending on the degree to which the payments affect marginal productiondecisions.
This analysis uses a model of EU agricultural markets developed by FAPRI-Missouri forresearch conducted jointly with colleagues at Teagasc in Dublin and Queens University inBelfast. The model provides country-level detail for France, Germany, Ireland, Italy, andthe United Kingdom, while treating the other countries of the European Union as a group.

Chapter III FAPRI
98
Market prices in the various member countries are linked, but domestic supply anddemand conditions affect cross-country price relationships. Net export supply for theEuropean Union is the sum of the net export supplies (production plus beginning stocksminus domestic consumption minus ending stocks) of the member countries at a givenset of prices. Net export demand for the European Union is a behavioural function of EUand world prices that also attempts to incorporate WTO limitations and plausiblebehaviour by the European Commission in establishing export restitutions and othermeasures affecting EU trade and prices. Domestic EU market prices are those that equateEU net export supply and demand.
The basic FAPRI-Missouri model covers EU markets for soft wheat, durum, barley,maize, rapeseed, sunflowers, soybeans, beef, pork, poultry, sheep meat, milk, cheese,butter, skim milk powder, and whole milk powder. Researchers in 14 EU member statesparticipating in the AG-MEMOD partnership are using this basic model as a startingpoint for a larger EU modelling effort. Binfield, et al. report detailed projectionsprepared using the model, based on information available in early 2002. Results of theseearlier projections are generally similar to the baseline projections reported here.
The MTR proposes major changes to EU policies affecting the rice and rye sectors thatcould have important impacts on other commodity markets. To better estimate impactsof the proposal, the basic FAPRI-Missouri model has been expanded to incorporate EUrice and rye markets. The new model components should be seen as provisional andsubject to further elaboration, but they do attempt to reflect important features of CAPpolicies affecting the rice and rye sectors.
3.3. Scenario assumptions
The baseline assumes a continuation of current agricultural policies in the EuropeanUnion and other countries. Agenda 2000 provisions are incorporated, including theplanned 2005-2007 expansion of milk quotas and reduction of dairy intervention prices.Enlargement of the European Union, however, is not reflected in the baseline, as terms ofaccession have not been agreed. The Uruguay Round Agreement on Agriculture isincluded, but there has been no attempt to incorporate changes that might be made as aresult of the ongoing World Trade Organisation negotiations. No resumption in UK cowslaughter for human consumption is assumed.
Assumptions for the MTR scenario are based on the communication from theCommission to the Council and the European Parliament, “Mid-Term Review of theCommon Agricultural Policy.” The document does not comprise legislation and thusthere is scope for different interpretations of some of the proposed changes. Where this isthe case, assumptions have been made that are set out below and summarised in Table3.1.
3.3.1. Cereals and oilseeds
The cereals intervention price is reduced from 101.31 to 95.35 EUR per tonne from2004/05 onwards, and monthly increments in intervention prices are abolished. Thecompensation payment for cereals and oilseeds is increased from 63 to 66 EUR pertonne.
Chapter III FAPRI
99
Intervention is abolished for rye from 2004/05 onwards. Intervention stocks projected toexist at that time are released over a period of five years.
The specific supplement to producers of durum in traditional areas is reduced from 344.5to 250 EUR per hectare over three years from 2004. A quality premium of 15 EUR pertonne is introduced, adjusted in each country to take account of the proportion of thatcountry’s durum production that goes for food rather than feed.
3.3.2. Rice
The safety net level is established at 120 EUR per tonne from 2004/05. Private storagewould be used to reduce price fluctuations, but would not result in stocks being held for ayear or more. Producers would receive an income payment of 102 EUR per tonne and acrop specific payment of 75 EUR per tonne, each multiplied by the reference yield.
Maximum guaranteed areas (MGAs) are set at the minimum of the 1999-2001 averagearea, or current MGA. The result is a net reduction in MGAs of 42 000 ha.
3.3.3. Set-aside and energy crops
Rotational set-aside is replaced with long-term set-aside, and the production of industrialand energy crops on set-aside is prohibited. These two changes may have offsettingimpacts on the production of crops other than industrial and energy crops. On the onehand, long-term set-aside may have a slightly smaller effect on production than would thesame level of rotational set-aside, as producers idle their least productive cropland. Insome cases land idled in the long-term set-aside may be land that would not have beenplanted even in the absence of a set-aside requirement. With a rotational set-aside, it isslightly more likely that the land idled is land that would otherwise have been used forcrop production.
However, prohibiting the planting of crops on set-aside reduces the amount of landavailable for crop production. The analysis assumes this displacement effect ismarginally more important than the effect of shifting to long-term set-aside, and so in themodel it is assumed that approximately 1 percent less land is available for cropproduction in the MTR scenario. The amount actually used for crop production depends,of course, on marginal production incentives.
For energy crops, the proposal provides aid of 45 EUR per ha, with a maximumguaranteed area of 1.5 mio ha. While energy crops are not modelled separately in theFAPRI system, it is assumed that the effects of the prohibition of production on set-asideand the energy crop-specific subsidies will largely offset each other, leaving productionof energy crops near baseline levels.
3.3.4. Decoupling and cross-compliance
Cereal and oilseed compensatory payments, rice income payments, and the paymentscurrently made in the beef and sheep sectors are decoupled from 2004 onward. Paymentsare provided in the form of a single farm payment. However, in the models it is assumedthat the payments still retain some production-influencing effect. Specifically, it isassumed that the new payments will have 30 percent of the supply-inducing effect of the

Chapter III FAPRI
100
more-coupled payments they replace. This is broadly consistent with FAPRI’s treatmentof U.S. farm program payments.
The MTR communication does not contain a great deal of detail regarding farm activityrequired to receive the decoupled payment. It is assumed that additional payments will bemade that cover the cost of meeting food safety, animal welfare, and environmentalrequirements, and that these payments will be non-production distorting.
Most important for the work is the interpretation of “good farming practices.” It has beenassumed here that the land must be used for agricultural production, but that agriculturalproduction is defined broadly enough to include very extensive production systems. It isalso assumed that there cannot be large-scale shifts from pasture into crop production, orvice-versa.
3.3.5. Dynamic modulation
Direct aids are capped at 300 000 EUR per farm.
Starting in 2004, the new per-farm payments, the durum quality payment, and the ricespecific crop payment are reduced by 3 percent a year to a maximum reduction of 20percent (in 2010) for farms larger than a certain size. Adjustments will be made in theindividual countries on the basis of information provided by the Commission.
It is assumed that both the money recouped from capping payments and from dynamicmodulation does not return to the sector in a production-distorting manner.
3.3.6. Market management
It is generally assumed that the Commission will act in ways to avoid stock accumulationwhen possible. While WTO limits place a cap on subsidised exports, estimated exportlevels reflect a balancing of an assumed desire to support market prices and avoid stockaccumulation by disposing of exportable supplies with an assumed desire to limit thebudgetary costs of export restitution. As a result of this balancing assumption, theanalysis indicates that subsidised exports often fall short of the WTO maximum levels,both in the baseline and in the MTR scenario.
Experience since implementation of the Agenda 2000 reforms suggests that market pricesoften fail to change by the same proportion as changes in intervention prices. In themodel, changes in intervention prices have direct impacts on market prices when pricesare at or below intervention levels and intervention is removing commodities from themarket. On the other hand, small changes in intervention prices have little or no impacton market prices when baseline prices are well in excess of intervention levels and nointervention activity is occurring. For example, if world wheat market prices are highenough to support EU wheat markets well above intervention levels, a small change inthe wheat intervention price will have little direct impact on EU market prices.
3.3.7. World markets
The baseline and scenario both assume world market conditions consistent with FAPRIprojections. While the last FAPRI global baseline was prepared in January 2002 (FAPRI2002a), an update for U.S. agricultural markets was prepared in June 2002 thatincorporates effects of the 2002 U.S. Farm Security and Rural Investment Act (the 2002

Chapter III FAPRI
101
U.S. farm bill). For this analysis, baseline world prices are consistent with those reportedin the June 2002 study (FAPRI 2002b).
Given time and resource constraints, the global FAPRI system was not used to conductthe present analysis. Instead, the FAPRI-Missouri EU model utilised incorporatesreduced-form equations that determine changes in world prices from baseline levelsdepending on differences between baseline and scenario levels of EU exports. If EUwheat exports exceed baseline levels, for example, this will slightly depress world marketprices for wheat and other cereals, all else equal. The reduced-form equations areintended to mimic the behaviour of a dynamic global modelling system, but may notalways precisely match results that would have been obtained by solving the full FAPRIsystem.
3.3.8. EU macroeconomic conditions
The baseline incorporates macroeconomic projections obtained from a variety of sourcesin mid 2002. The pace of economic growth is expected to pick up in 2003, with growthin real GDP averaging 2.6 percent per year between 2003 and 2009. Inflation is assumedto remain low, as the GDP deflator increases by less than 2 percent per year.
The euro has strengthened considerably against the dollar in 2002, and furtherstrengthening is assumed for 2003 and 2004. The 2004 exchange rate of $1.03 per EURis assumed to persist in all subsequent years.
3.4. Model results
The decoupling of payments from production levels proposed in the MTR represents amajor departure from current EU agricultural policies. Because the proposals wouldfundamentally change the incentives faced by producers, it is especially difficult toestimate likely consequences of the proposals using models based on historicalrelationships among prices, payments, and production. To obtain the results reportedhere, existing models were adapted using analyst judgement, and reviewer comments onpreliminary results were incorporated in the final analysis.
3.4.1. Crop production
Compared to the current-policy baseline, changes in support prices and the decoupling ofpayments leads to a modest reduction in aggregate EU crop production (Table 3.2). Fornine major crops, the total area harvested under the MTR scenario declines byapproximately 2 percent each year relative to the baseline. Most of the decline is likely tooccur among high-cost producers, particularly in regions where current participation inthe voluntary set-aside program is restricted. The model does not provide explicitestimates of the area enrolled in voluntary set-aside, but the 800 000 ha reduction in areaharvested for major crops implies a significant expansion of voluntary set-aside.
The largest proportional reduction in production occurs in the case of rye, where theelimination of intervention is estimated to result in significantly lower market prices.Area harvested also declines significantly relative to the baseline for durum and rice, asMTR policy changes reduce marginal incentives to produce those crops. Smallerproduction declines occur for oilseeds, barley, and maize. In general, reductions in area

Chapter III FAPRI
102
harvested are partially offset by slight increases in average yields per hectare, givenreduced plantings on low-yielding, marginal land.
Alone among the major crops, soft wheat production actually increases marginallyrelative to the baseline by the end of the evaluation period. EU soft wheat prices aresupported by world market prices and so do not decline as much as do prices of othercereals when intervention prices are reduced. As a result, some producers expand softwheat production at the expense of barley and other crops.
3.4.2. Crop sector stocks
The combination of reduced production and reduced intervention prices leads to lowercereal stocks. In the baseline, rye stocks increased between 2002 and 2009, but with theend of rye intervention in the MTR scenario, total rye stocks in 2009 are approximatelyone-fourth the baseline level. Baseline stocks are far less burdensome for other cereals,as even baseline market prices generally exceed intervention levels, especially for wheat.However, the baseline did reflect some intervention activity for both barley throughoutthe period and soft wheat at the beginning of the period, and so the reduction inintervention prices contributes to lower stock levels.
As with rye, rice stocks are dramatically lower in the MTR scenario than in the baseline.In the baseline, planned reductions in EU import barriers cause sharp increases in EU riceimports by 2009, given EU intervention prices fixed far in excess of world rice prices.As a result, an increasing proportion of EU rice production is added to EU interventionstocks each year in the baseline. The sharp reduction in support prices in the MTRscenario allows EU market prices to fall enough to discourage a large increase in importlevels. As a result, rice stocks are only one-third of baseline levels in 2009.
3.4.3. Feed use
Estimated impacts of the MTR scenario on feed demand are relatively modest. Thereduction in cattle and sheep numbers is partially offset by increased production of hogsand poultry. Sharply lower rye prices (especially in the early years of the analysis) lead toan expansion of rye feeding, but net changes in feed demand for other commodities aremodest. Likewise, given only small changes in market prices for commodities other thanrice and rye, the net effect on food and industrial demand for major field crops is alsoestimated to be relatively small.
3.4.4. Crop trade and prices
Estimated impacts of the MTR scenario on EU crop prices (Table 3.3) depend criticallyon the relationship between EU and world market prices, and on Commission marketmanagement strategies. In the baseline and in the MTR scenario, EU market prices forsoft wheat and oilseeds are largely determined in world markets. In the case of softwheat, reduced intervention prices in the MTR scenario initially lead to lower wheatstocks and greater EU exports, resulting in lower world and EU wheat prices. In lateryears, EU wheat exports continue to marginally exceed baseline levels, but EU exports ofother cereals fall short of baseline levels, resulting in a net positive impact on worldprices for all major cereals.
EU barley prices generally exceed world market levels for comparable products, and somost exports are only possible with the use of export subsidies (excepting times like the

Chapter III FAPRI
103
present when world coarse grain prices are abnormally high). Even with a reduction inintervention prices, there is not a significant increase in commercial barley exports. Totalbarley exports actually fall relative to the baseline, as reduced barley production limitsexportable supplies and as the Commission is assumed to set export refunds at levelsresulting in market prices marginally below baseline levels, but above the newintervention prices.
In the case of maize, it is assumed that the tariff-rate quota largely determines netimports. MTR scenario maize prices are within 1 percent of baseline levels throughoutthe evaluation period, given offsetting effects of marginal reductions in maize productionand substitution effects from lower priced barley and rye.
The reduction in durum production in the MTR scenario results in a significant increasein EU durum prices and a corresponding reduction in net exports. If the estimated effecton EU durum production is correct, it is possible that the change in EU durum tradecould be even larger than estimated, given the estimated growing gap between world andEU durum prices (Canadian durum prices exceed baseline levels by about 1 percent in2009, compared to an 11 percent increase in EU prices in the same year).
In contrast, the MTR scenario results in a sharp decline in rye prices. Only a steep pricedecline is sufficient to induce a sufficient reduction in production and increase indomestic and export demand for EU rye to absorb the intervention stocks that werebuilding in the baseline. As markets adjust and stocks eventually reach more sustainablelevels, rye prices do recover over time, but EU prices remain 9 percent below baselinelevels in 2009.
In the case of rice, the sharp reduction in support levels allows a very large reduction inEU market prices. EU rice prices fall relative to the baseline by more than 41 percent in2009, the year of greatest competition from imported rice. If the MTR policies weresustained beyond 2009, the analysis would show a modest price recovery, although priceswould remain well below baseline levels. Reduced EU rice imports in the MTR scenariorelative to the baseline result in lower world market prices for rice.
For oilseeds, reduced EU production results in an increase in net imports and a modestincrease in EU and world prices. World rapeseed and sunflower market effects areproportionally larger than those for soybeans, given relative EU shares of worldproduction.
3.4.5. Livestock production
In estimating MTR effects on the livestock sector, the biggest question is how muchdecoupling payments will affect production in the cattle and sheep sectors. Farm-levelanalysis suggest that many producers might rationally choose to liquidate herds if theycould qualify for fully decoupled payments without retaining animals. Farm-level datasuggests that variable production costs for cattle and sheep often exceed returns from themarket, implying that under current policies, many producers retain animals only toqualify for payments. Indeed, some of the farm-level analysis suggests that cattle andsheep production effects could be even larger than estimated here.
Two factors contributed to a decision to moderate impacts implied by farm-level analysis.First, in the cattle industry there is evidence that at least some efficient producers find itrational to produce at market prices at the margin. In several countries, suckler cow

Chapter III FAPRI
104
numbers exceed the number of animals eligible for suckler cow payments, implying thatsome producers earn positive net returns excluding suckler cow payments. While thisdoes not consider the impacts of other cattle payments, it does suggest that at least somelower cost producers exist.
Second, a major policy change like the decoupling proposed in the MTR is certain toresult in significant market restructuring. With market prices having a larger effect onproduction decisions, it seems likely that lower-cost producers would take up at least partof the gap left by higher-cost producers who reduce production. While stocking rates arelikely to be reduced in some regions, it seems unlikely that prime grazing land will lieunused.
Given all these considerations, the estimated reduction in suckler cow numbers in theMTR scenario is approximately 5 percent in 2004, growing to almost 12 percent by 2009(Table 3.4). Dairy cow numbers remain essentially unchanged, as it is assumed that thequota will continue to be the overwhelming factor driving milk production and cownumbers, even if payments are decoupled.
In the short run, the reduction in cow numbers means an increase in cow slaughter andreduced heifer retentions, both of which contribute to a temporary increase in cattleslaughter and beef production. In later years, the reduction in cow numbers results infewer calves and fewer animals available for slaughter. By 2009, cattle slaughter is morethan 3 percent lower than baseline levels, and the effect would be even larger insubsequent years if the analysis were extended.
A similar story applies to the sheep industry. In the short run, ewe liquidation results in atemporary increase in sheep meat production, but in the longer run, the decline in sheepnumbers results in lower meat production levels. By 2009, sheep meat production in theMTR scenario is almost 5 percent below baseline levels.
3.4.6. Beef stocks and use
The baseline included no intervention stocks of beef after 2004, so the scenario has noeffect on stock levels after 2004. Thus, the reduction in beef production must translateinto changes in domestic consumption and exports. Given assumed Commissionbehaviour in managing export restitutions, almost half (100 000 tonnes) of the reductionin beef production in 2009 is reflected in reduced EU beef exports. That leavesapproximately 120 000 tonnes of the reduction in 2009 beef production to be absorbed byreduced EU domestic beef consumption.
3.4.7. Livestock prices
The estimated effects of the scenario on EU livestock prices (Table 3.5) can be explainedby the changes in beef and sheep meat production. Prices fall initially given short-termherd liquidation effects. In later years, cattle and sheep prices exceed baseline levelsbecause of reduced production. By 2009, EU cattle prices exceed baseline levels byabout 8 percent, and EU sheep prices exceed baseline levels by almost 12 percent.
With little change in feed prices, estimated changes in the pork and poultry sectors can beexplained by changes in the beef and sheep meat sectors. Initial lower prices for beef andsheep meat result in reduced prices and production for pork and poultry. In the longerrun, however, higher beef and sheep meat prices encourage increased consumption of

Chapter III FAPRI
105
pork and poultry, resulting in marginal increases relative to the baseline in both pricesand production levels for pork and poultry.
If the Commission were to manage beef export restitutions in a different way, scenarioimpacts could be significantly different. Suppose, for example, the Commission madeeven steeper reductions in the quantity of beef exports subsidised. The impact would bea smaller scenario impact on beef prices, and therefore smaller effects on the pork andpoultry sectors as well. At lower prices, fewer producers would find it profitable toproduce beef, and so cattle numbers and beef production would fall relative to theestimates presented here.
3.5. Concluding comments
If adopted, the MTR proposals would represent a significant change in EU agriculturalpolicy. In particular, decoupling payments would result in major changes in the marginalproduction incentives faced by producers.
The MTR is estimated to result in reduced EU production of several agriculturalcommodities. The steepest reductions are likely to occur for commodities that would beunprofitable for many existing producers were it not for current support prices andcoupled payments. For example, production of beef, sheep meat, rye, and durum wouldall be likely to decline significantly if the proposals were adopted.
By reducing market support levels, the MTR proposals would result in steep reductionsin stocks and market prices for rice and rye. Lower intervention prices have a mildnegative effect on estimated EU barley market prices, but EU soft wheat prices aresupported by world markets and differ only marginally from baseline levels. Reducedproduction would result in increased EU market prices for sheep, beef cattle, and durum.
After a transition period, the MTR proposals generally would reduce EU agriculturalexports and/or increase EU imports. The result is estimated to be modest increases inworld prices for most commodities. An important exception is rice, where the MTR isestimated to avert the large increase in imports that was expected to occur under a simplecontinuation of current policies.
The analysis depends on a series of assumptions about how markets are likely to evolvehow policies would be implemented, and how economic actors would respond to changeincentives. Actual outcomes could be very different from those projected here.

Chapter III FAPRI
106
References
Binfield, Julian, Trevor Donnellan, Kevin Hanrahan, Kieran McQuinn, Pat Westhoff, andRobert Young II. 2002. “FAPRI-Ireland 2002 EU Baseline Briefing Book.” FAPRI-UMC Technical Data Report #1-02. Food and Agricultural Policy Research Institute,University of Missouri, Columbia, Missouri, May.
Food and Agricultural Policy Research Institute. 2002a. “FAPRI 2002 WorldAgricultural Outlook.” FAPRI Staff Report #1-02. FAPRI, Iowa State University,Ames, Iowa, January.
Food and Agricultural Policy Research Institute. 2002b. “FAPRI 2002 U.S. BaselineBriefing Book.” FAPRI-UMC Technical Data Report #2-02. Food and AgriculturalPolicy Research Institute, University of Missouri, Columbia, Missouri, July.

Chapter III FAPRI
107
Table 3.1. Policy assumptions
Baseline MTR ScenarioEffective 2004 Onwards
Cereals Intervention price 101.31 EUR/tonne, with 95.35 EUR/tonne, with no
monthly increments monthly increments
Compensation payment 63 EUR/tonne 66 EUR/tonne
Set-aside Predominately rotational Long term
Rye Intervention No intervention
Durum Supplementary payment of Supplementary payment of 344.5 EUR/hectare 250 EUR/hectare*
15 EUR/tonne quality payment
OilseedsCompensation payment 63 EUR/tonne 66 EUR/tonne
RiceIntervention price 298.35 EUR/tonne 120 EUR/tonne safety net
Direct payment 52.65 EUR/tonne 177 EUR/tonne (75 EUR/tonne as crop specific payment)
MGA Current MGA Minimum of current MGA and 1999-2001 area average
Energy crops Currently grown on set aside Cannot be grown on set aside
Decoupling Payments coupled All COP, beef, sheep, and rice payments decoupled from 2004 except rice crop specific and durum quality payment
Payment cap No cap Payment capped at 300,000 EUR
Modulation Voluntary Mandatory, new farm payment and crop specific rice and durum quality payment modulated 3% per year to 2010
* Phased in over three years from 2004

Chapter III FAPRI
108
Table 3.2. Crop sector supply and utilisation results
2004 2004 Change 2009 2009 ChangeBaseline MTR Baseline MTR
Soft wheat Area harvested (mil. ha) 13.69 13.68 -0.1% 14.09 14.18 0.7% Yield (tonne/ha) 7.08 7.09 0.2% 7.63 7.63 -0.1% Production (mil. tonne) 96.92 96.98 0.1% 107.57 108.20 0.6% Domestic use (mil. tonne) 80.34 80.54 0.2% 82.17 82.00 -0.2% Net exports (mil. tonne) 13.85 15.50 11.9% 24.17 24.53 1.5% Ending stocks (mil. tonne) 17.45 15.65 -10.3% 16.86 16.36 -3.0%Barley Area harvested (mil. ha) 10.59 10.48 -1.1% 10.41 10.13 -2.7% Yield (tonne/ha) 4.81 4.82 0.2% 5.07 5.08 0.3% Production (mil. tonne) 50.95 50.47 -1.0% 52.79 51.51 -2.4% Domestic use (mil. tonne) 45.12 45.62 1.1% 46.47 46.56 0.2% Net exports (mil. tonne) 5.49 5.07 -7.7% 6.30 5.00 -20.5% Ending stocks (mil. tonne) 9.95 9.39 -5.7% 10.45 8.74 -16.4%Maize Area harvested (mil. ha) 4.29 4.27 -0.5% 4.22 4.20 -0.4% Yield (tonne/ha) 9.40 9.41 0.1% 9.98 9.99 0.1% Production (mil. tonne) 40.30 40.15 -0.4% 42.11 41.99 -0.3% Domestic use (mil. tonne) 42.34 42.19 -0.3% 44.21 44.10 -0.3% Net imports (mil. tonne) 2.13 2.12 0.1% 2.10 2.10 0.0% Ending stocks (mil. tonne) 4.94 4.93 -0.1% 5.01 4.98 -0.5%Durum Area harvested (mil. ha) 3.76 3.49 -7.2% 3.74 3.55 -5.0% Production (mil. tonne) 9.57 8.98 -6.1% 10.00 9.62 -3.8% Net exports (mil. tonne) 0.35 0.11 -68.8% 0.43 0.21 -51.0% Ending stocks (mil. tonne) 0.83 0.75 -9.7% 0.87 0.77 -11.3%Rye Area harvested (mil. ha) 1.16 1.02 -12.4% 1.10 0.93 -15.5% Production (mil. tonne) 5.61 4.88 -12.9% 5.60 4.72 -15.6% Domestic use (mil. tonne) 4.30 4.89 13.8% 4.28 4.49 5.0% Net exports (mil. tonne) 0.82 1.00 21.9% 1.12 0.52 -53.4% Ending stocks (mil. tonne) 6.82 5.32 -22.0% 8.57 2.28 -73.4%Rice Area harvested (mil. ha) 0.40 0.39 -2.7% 0.40 0.38 -3.1% Production (mil. tonne) 1.74 1.70 -2.5% 1.81 1.79 -1.2% Net imports (mil. tonne) 0.46 0.65 40.8% 1.70 0.81 -52.1% Ending stocks (mil. tonne) 0.65 0.69 6.8% 2.49 0.83 -66.7%Oilseeds Area harvested (mil. ha) 5.63 5.37 -4.7% 5.57 5.36 -3.7% Rapeseed prod. (mil. tonne) 10.47 10.06 -4.0% 10.92 10.61 -2.8% Sunflower prod. (mil. tonne) 3.53 3.35 -5.1% 3.58 3.42 -4.4% Soybean prod. (mil. tonne) 1.11 1.07 -3.2% 1.23 1.19 -3.8%9-crop* area harv. (mil. ha) 39.52 38.67 -2.1% 39.53 38.75 -2.0%
*Soft wheat, barley, maize, durum wheat, rye, rice, rapeseed, sunflowers, and soybeans

Chapter III FAPRI
109
Table 3.3. Crop sector price results (EUR/tonne)
2004 2005 2006 2007 2008 2009
EU soft wheat price Baseline 107.9 109.3 111.4 112.4 113.6 114.8 MTR 106.1 108.5 111.7 112.7 114.2 115.3 Difference -1.7% -0.7% 0.2% 0.3% 0.5% 0.5%U.S. wheat Gulf price Baseline 133.4 134.5 139.0 141.2 144.4 147.0 MTR 131.5 134.6 139.7 141.5 145.0 147.6 Difference -1.4% 0.1% 0.4% 0.2% 0.5% 0.4%EU barley price Baseline 105.1 104.8 105.7 106.1 106.3 106.6 MTR 101.7 101.8 103.1 104.0 104.5 106.0 Difference -3.2% -2.8% -2.5% -2.0% -1.7% -0.5%U.S. barley Portland price Baseline 114.2 117.0 118.5 120.1 121.7 123.8 MTR 115.0 118.6 121.1 123.1 124.9 126.4 Difference 0.7% 1.4% 2.1% 2.5% 2.6% 2.1%EU maize price Baseline 122.5 121.9 123.4 123.5 122.9 122.9 MTR 121.9 121.1 123.1 123.7 123.4 123.8 Difference -0.5% -0.6% -0.2% 0.2% 0.4% 0.8%U.S. maize Gulf price Baseline 96.0 98.0 99.7 101.3 103.1 105.3 MTR 95.8 97.7 99.8 101.5 103.3 105.5 Difference -0.2% -0.3% 0.1% 0.2% 0.2% 0.2%EU durum price Baseline 156.0 157.6 160.0 161.5 162.9 163.9 MTR 182.0 176.2 177.1 177.3 180.9 182.0 Difference 16.7% 11.8% 10.7% 9.8% 11.0% 11.0%EU rye price Baseline 96.9 96.6 96.4 96.3 96.2 96.1 MTR 71.7 76.6 79.2 82.6 82.7 87.2 Difference -26.1% -20.7% -17.9% -14.2% -14.0% -9.3%EU rice price Baseline 285.1 294.8 283.4 279.8 271.3 257.8 MTR 185.1 186.2 190.9 194.5 191.6 151.0 Difference -35.1% -36.9% -32.6% -30.5% -29.4% -41.4%Hamburg rapeseed price Baseline 228.0 230.2 231.8 233.4 233.3 233.6 MTR 236.8 231.8 235.3 237.1 238.6 238.7 Difference 3.8% 0.7% 1.5% 1.6% 2.3% 2.2%Rhine sunflower price Baseline 261.3 262.0 263.2 263.9 264.1 263.8 MTR 265.7 266.0 266.9 267.7 268.4 268.4 Difference 1.7% 1.5% 1.4% 1.4% 1.6% 1.7%

Chapter III FAPRI
110
Table 3.4. Livestock sector supply and utilisation results
2004 2004 Change 2009 2009 ChangeBaseline MTR Baseline MTR
Cattle Suckler cows (mil. head) 12.40 11.82 -4.7% 12.43 10.97 -11.7% Dairy cows (mil. head) 19.44 19.43 0.0% 18.50 18.50 0.0% Slaughter (mil. head) 26.13 26.54 1.6% 25.75 24.93 -3.2%Beef Production (mil. tonnes) 7.29 7.41 1.6% 7.21 6.99 -3.1% Domestic use (mil. tonnes) 7.24 7.28 0.5% 7.06 6.94 -1.7% Imports (mil. tonnes) 0.42 0.42 -0.2% 0.43 0.43 0.4% Exports (mil. tonnes) 0.56 0.64 13.5% 0.58 0.48 -17.4% Interv. stocks (mil. tonnes) 0.01 0.01 12.7% 0.00 0.00 n.a.Pork Production (mil. tonnes) 17.87 17.86 -0.1% 18.23 18.32 0.5% Domestic use (mil. tonnes) 16.54 16.52 -0.1% 16.82 16.92 0.5% Imports (mil. tonnes) 0.06 0.06 0.0% 0.06 0.06 0.0% Exports (mil. tonnes) 1.39 1.39 0.3% 1.47 1.47 -0.1%Poultry Production (mil. tonnes) 8.59 8.57 -0.2% 8.97 9.03 0.6% Domestic use (mil. tonnes) 8.03 8.00 -0.3% 8.40 8.46 0.7% Imports (mil. tonnes) 0.47 0.47 -0.1% 0.50 0.50 0.0% Exports (mil. tonnes) 1.04 1.04 0.6% 1.07 1.06 -0.7%Sheep meat Production (mil. tonnes) 1.06 1.10 3.5% 1.05 1.00 -4.6% Domestic use (mil. tonnes) 1.31 1.34 2.6% 1.31 1.27 -3.3% Imports (mil. tonnes) 0.25 0.25 -1.3% 0.26 0.27 1.8% Exports (mil. tonnes) 0.00 0.00 0.0% 0.00 0.00 0.0%Milk Production (mil. tonnes) 120.13 120.15 0.0% 120.51 120.50 0.0%
Table 3.5. Livestock sector price results (EUR/100 kg)
2004 2005 2006 2007 2008 2009
EU cattle reference Baseline 114.5 118.6 116.4 113.4 111.3 110.9 MTR 110.9 116.9 117.5 116.8 117.0 119.9 Difference -3.2% -1.4% 1.0% 3.0% 5.2% 8.1%EU pork reference Baseline 133.1 135.8 134.3 131.2 131.7 133.2 MTR 131.5 135.7 135.1 131.7 132.3 134.6 Difference -1.2% -0.1% 0.6% 0.4% 0.5% 1.0%EU chicken Baseline 128.5 129.2 128.8 128.2 128.3 128.4 MTR 127.1 128.8 129.2 128.8 129.1 129.9 Difference -1.1% -0.3% 0.3% 0.4% 0.7% 1.1%EU sheep reference Baseline 353.5 352.6 348.9 346.0 347.8 350.2 MTR 326.4 366.8 393.8 388.8 386.2 391.3 Difference -7.7% 4.0% 12.9% 12.4% 11.0% 11.7%EU milk Baseline 29.1 28.5 28.0 27.6 27.7 27.7 MTR 29.1 28.5 28.0 27.6 27.7 27.8 Difference 0.0% -0.1% -0.1% 0.0% 0.0% 0.0%
Chapter IV University of Bonn - CAPRI
111
Mid-Term Review proposal impact analysis
with the
CAPRI modelling system
EuroCARE
University of Bonn
Department for Economics and Agricultural Policy

112
Chapter IV University of Bonn - CAPRI
113
4.1. Executive Summary
4.1.1. Agenda 2000 Policy Scenario
Under the assumption of the continuation of Agenda 2000 developments in the ‘GrandesCultures’ sector are mainly influenced by (1) an increased set-aside obligation comparedto the base period 1997-1999, (2) a slight decrease in premiums for cereals in real terms,and (3) uniform premiums for oilseeds and pulses, coupled with decreases of outputprices for all ‘Grandes Cultures’ in real terms.
Major effects in the crop sector simulated by the CAPRI modelling system are areduction of acreage in ‘Grandes Cultures’ (Cereals –5.1 %, Oilseeds –17.1 %. Otherarable crops -1.9 %), offset by an increase of vegetables and perennials (4.4 %) and set-aside and fallow land (19.4 %), the latter effect partly due to stricter set-aside obligationscompared to the 1997-1999 average used as base year. Net trade surplus in cerealsincreases to 36.3 mio t as demand (7.3 % or 13 mio t) grows less than supply (8.8 % or18.5 mio t), the latter driven by yield increases of 14.6 %. Domestic prices for cereals areclose to intervention levels, and subsidised exports fall both in quantity and value termscompared to the base year with domestic prices nearer to world market ones. Supplydevelopments in pig and poultry markets are lined up with the “Commission ServicesMarket Outlook” by assuming strong technical progress so that supply grows by some7 % for pigs and 8.2 % for poultry, following forecasted increases in per capita meatconsumption. Beef production falls slightly (-3.4 %), mainly due to decreases in thenumber of dairy cows.
Budget outlays – as far as covered by the modelling system – fall slightly in real terms by-2.8 %, resulting from declining costs of market intervention and subsidised exports incombination with an increase in direct payments. Output values for crops (-1.4 %) andanimal products (-12.9 %) decrease, while intermediate input costs are almost stable.Input costs for crops increase by 3.2 % whereas animal specific inputs decrease in valueby -4.3 % due to reduced feed and young animal prices. Higher premiums cannot offsetthe loss in output value combined with increasing cost so that total agricultural incomemeasured as Gross Value Added at Market prices decreases by –12.2 %29 over the wholeperiod. If agricultural labour force continues to decline according to past trends, incomeper AWU would increase in real terms. Consumers benefit from lower prices foragricultural products.
4.1.2. Mid-Term Review Proposal
The “Mid Term Review of the Common Agricultural Policy” proposes to decouplecurrent support measures from production decisions and to decrease intervention pricesfor cereals. Due to a number of exemptions and some remaining coupled premiums, thescheme is however not fully decoupled. Furthermore the MTR package includes amodulation of payments over time in combination with a reallocation between first andsecond pillars of the CAP. The uniform premium increases competitiveness of crops,which were not eligible in Agenda 2000.
29 All percentages shown for monetary values relate to changes in real terms.

Chapter IV University of Bonn - CAPRI
114
Consequently, the simulation analysis with the CAPRI modelling system shows a shift ofland use from cereals (-8.7 %) and oilseeds (–4.8 %) to set-aside and fallow land (5.5 %)and fodder production (4.2 %) compared to the Agenda 2000 reference run. This leads toextensification of fodder production. Set-aside increases (5.5%) as restrictions regardingmaximal percentages on COP area (cereals, oilseeds crops, and protein crops) areremoved.
Supply of cereals (-7.4 %) and oilseeds (-4.5 %) drops stronger than demand (-3.3 % and-0.7 %), reducing the position of the EU as net exporter on world markets. The number ofcattle decreases (-7.3 %), mainly driven by reduced suckler cowherds (-17.5 %), aspremiums are now decoupled from beef production. Poultry and pork meat remain almostunaffected.
Despite reduced budget outlays (-8.9% or –2468 mio EUR) under the first pillar, mainlycaused by premium cuts under “Dynamic Modulation”, agricultural income 30 remainsalmost stable (-0.14% or -200 mio EUR) due to increased allocation efficiency and highermarket prices. The latter reduce somewhat consumers’ welfare (-2139 mio EUR).Overall, results show a slight net benefit for the EU-15 of 129 mio EUR.
Compared to Agenda 2000, output of global warming gases and nutrient surplusesdecline with reduced production of beef and crops with high demand for fertiliser.Further on, set-aside is now completely stationary. Strict control measurements arehowever necessary to ensure that idling land is kept in “good agricultural condition”.
4.1.3. Conclusions
The proposal certainly leads to a higher market orientation of European farmers. Due toless coupled premiums, allocation efficiency increases with farming decisions closerlinked to market prices. Additionally, the proposal reduces scope and frequency ofmarket interventions, as intervention prices are further reduced below expected averageworld market prices. The effect on structural change in the farming sector is however notclear. Whereas increased allocation efficiency could speed up farm size growth, farmspecific premium ceilings and exclusion of small farms from modulation and farm auditsmight counteract. The proposed scheme still deviates from a completely decoupledpayment system: not all crops are eligible for support, and durum wheat, rice, protein andenergy crops still receive additional coupled premiums.
4.2. The CAPRI modelling system
4.2.1. History of the model
The CAPRI modelling system was developed in the context of the Fourth FrameworkProject (FAIR3-CT96-1849, 1997-1999)31, co-ordinated by the Institute for AgriculturalPolicy, University of Bonn, within a network of four main partners and sub-partners inalmost all EU member states.
30 Agricultural income is defined as Gross Value Added at Market Prices according to the definition of
Economic Accounts for Agriculture plus premiums.
31 Final consolidated report with a detailed model description is available on the project web site:http://www.agp.uni-bonn.de/agpo/rsrch/capri/finrep.pdf.

Chapter IV University of Bonn - CAPRI
115
The system was tested on an Agenda 2000 simulation run at the end of 1999, and theconcept and main results were presented to DG AGRI.32
After a phase of consolidation, a new framework project titled CAP-STRAT (QLTR-2000-00394, 2002-2004) was initiated, aiming at a data base update, implementation ofmethodological improvements, a thorough validation of the complete system, andscenario analysis foreseen for 2004. The still intermediate outcome from this projectfeeds directly into this study as well as results obtained from a project for DGEnvironment (01/2001-12/2002).33
4.2.2. General system layout
The CAPRI modelling system is designed as a projection and simulation tool for theagricultural sector based on:
(1) A physical consistency framework, covering balances for agricultural area, younganimals and feed requirements for animals as well as nutrient requirement for crops,realised as constraints in the regional supply models. The market model ensures thatfat and protein comprised in the milk delivered to dairies is equal to the fat andprotein comprised in the processed dairy products.
(2) Economic accounting principles according to the definition of the EconomicAccounts for Agriculture (EAA). The model covers all outputs and inputs included inthe national EAA for the Member States, with revenues and costs broken downconsistently to regions and production activities.
(3) A detailed policy description. The regional supply models capture all relevantpayment schemes with their respective ceilings as well as set-aside obligations andsales quotas. The market side covers tariffs, intervention purchases and subsidisedexports. The policy of non-EU regions is based on OECD PSE/CSE data bank.
(4) Behavioural functions and allocation steering are strictly in line with micro-economic theory. Functional forms are chosen to be globally well behaved, allowingfor a consistent welfare analysis.
The model distinguishes a supply and a market module, interactively coupled.
The supply module consists of aggregate programming models at NUTS II level,working with exogenous prices during each iteration. After being solved, the regionalresults of these NUTS II models – crop areas, herd sizes, input/output coefficients etc. –are aggregated into Member State level models, which are then calibrated to these resultsby using techniques borrowed from Positive Mathematical Programming. Young animal
32 In parallel, the German Agricultural Research Institute (FAL) employed the CAPRI modelling system in
the context of a research project (FAIR-CT96-1794) to analyse the effects of a shift towards organicproduction.
33 A further application of the CAPRI modelling system regarding milk market liberalisation wasundertaken by the Swedish Institute for Food and Agricultural Economics (SLI), whose results werepresented this year at the conference of the European Association of Agricultural Economists(Zaragoza 2002).
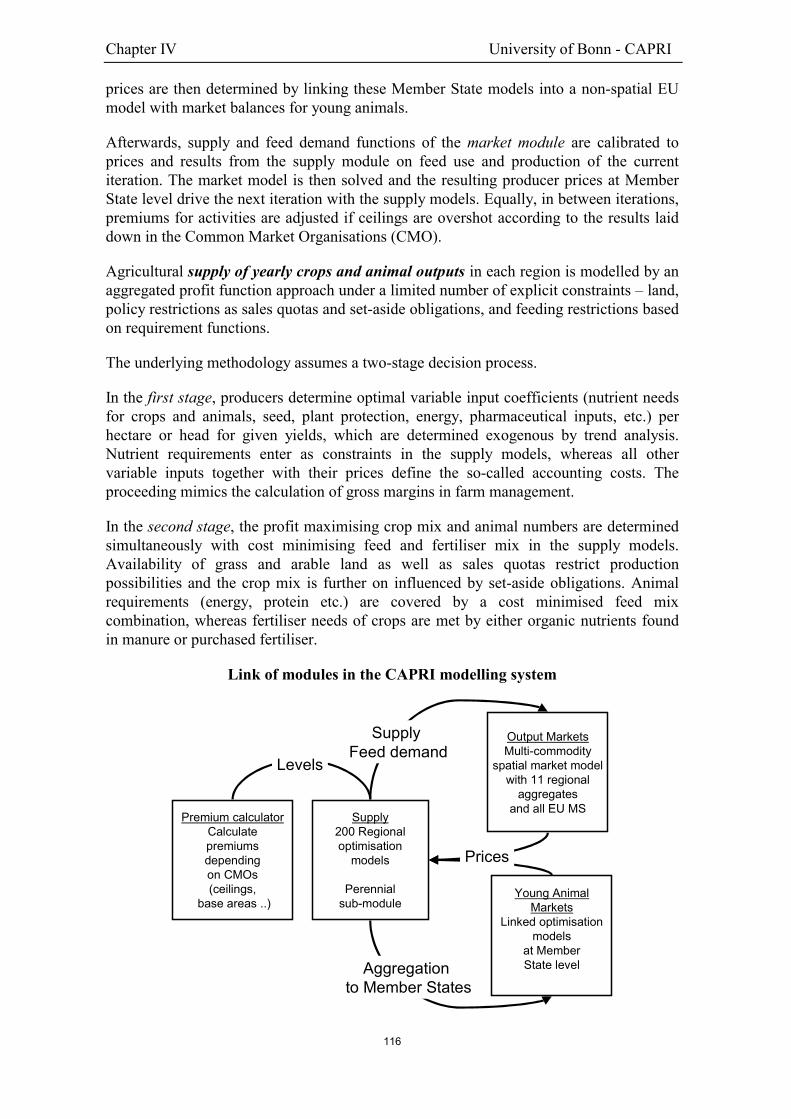
Chapter IV University of Bonn - CAPRI
116
prices are then determined by linking these Member State models into a non-spatial EUmodel with market balances for young animals.
Afterwards, supply and feed demand functions of the market module are calibrated toprices and results from the supply module on feed use and production of the currentiteration. The market model is then solved and the resulting producer prices at MemberState level drive the next iteration with the supply models. Equally, in between iterations,premiums for activities are adjusted if ceilings are overshot according to the results laiddown in the Common Market Organisations (CMO).
Agricultural supply of yearly crops and animal outputs in each region is modelled by anaggregated profit function approach under a limited number of explicit constraints – land,policy restrictions as sales quotas and set-aside obligations, and feeding restrictions basedon requirement functions.
The underlying methodology assumes a two-stage decision process.
In the first stage, producers determine optimal variable input coefficients (nutrient needsfor crops and animals, seed, plant protection, energy, pharmaceutical inputs, etc.) perhectare or head for given yields, which are determined exogenous by trend analysis.Nutrient requirements enter as constraints in the supply models, whereas all othervariable inputs together with their prices define the so-called accounting costs. Theproceeding mimics the calculation of gross margins in farm management.
In the second stage, the profit maximising crop mix and animal numbers are determinedsimultaneously with cost minimising feed and fertiliser mix in the supply models.Availability of grass and arable land as well as sales quotas restrict productionpossibilities and the crop mix is further on influenced by set-aside obligations. Animalrequirements (energy, protein etc.) are covered by a cost minimised feed mixcombination, whereas fertiliser needs of crops are met by either organic nutrients foundin manure or purchased fertiliser.
Link of modules in the CAPRI modelling system
Supply200 Regionaloptimisation
models
Perennialsub-module
Output MarketsMulti-commodity
spatial market modelwith 11 regional
aggregatesand all EU MS
Young AnimalMarkets
Linked optimisationmodels
at MemberState level
Supply Feed demand
Prices
Aggregation to Member States
Premium calculatorCalculatepremiumsdependingon CMOs(ceilings,
base areas ..)
Levels
Chapter IV University of Bonn - CAPRI
117
A cost function covering the effect of all factors not explicitly handled by restriction orthe accounting costs – as additional binding resources or risk - ensures calibration ofactivity levels and feeding habits in the base year and plausible reactions of the system.
These cost function terms are estimated from ex-post data or calibrated to exogenouselasticity. Fodder (grass, straw, fodder maize, root crops, silage, milk from suckler cowsor mother goat and sheep) is assumed to be non-tradable, and hence animal processes arelinked to the crop production and regional land availability. All other outputs and inputscan be sold and purchased at fixed prices. Selling of milk cannot exceed the quota and forsugar production an A,B,C quota system is embedded.
The use of a mathematical programming approach has the advantage to directly embedcompensation payments, set-aside obligations, voluntary set-aside and sales quotas, aswell as to capture important relations between agricultural production activities. Not atleast, environmental indicators as N,P,K balances and output of gases linked to globalwarming are implemented in the system.
The programming models described above are not well suited to handle crops with adifferent planning horizon than ‘Grandes Cultures’ and their competitors. All perennialcrops are linked to long-term investment decisions not suitable within a programmingframework of this type. Equally, some annual crops, as flowers require a completelydifferent marketing and production chain.
For both type of crops a simultaneous econometric estimation of yields, activity levels aswell as market balance positions is included in the analysis, with additional constraintsensuring closed market balances. The results are used unchanged in both the referenceand the MTR run, and hence not further discussed.
The market module breaks down the world into 12 country aggregates34, each aggregatefeaturing system of supply, human consumption, feed and processing functions.
The parameters of these functions are derived from elasticity borrowed from other studiesand modelling systems, and calibrated to projected quantities and prices in the simulationyear, where the choice of the functional form (normalised quadratic for feed and supply,Generalised Leontief Expenditure function for human consumption) and furtherrestrictions (homogeneity of degree zero in prices, symmetry, correct curvature) ensureregularity.
Accordingly, the demand system allows for the calculation of welfare changes for theconsumers. Policy instruments in the market module include (bi-)lateral tariffs andProducer/Consumer Support Estimate price wedges (PSE/CSE). Some important TariffRate Quotas (TRQs) as well as explicit modelling of intervention sales and subsidisedexports under WTO commitment restrictions are implemented for the EU.
34 EU, East European Candidate Countries, Mediterranean countries, U.S., Canada, Australia & New
Zealand, Free trade developing countries, High tariff traders (as Japan), India, China, ACP countries,Rest of the World

Chapter IV University of Bonn - CAPRI
118
Special attention is given to the processing stage of dairy products for the EU Memberstates. First of all, balancing equations for fat and protein ensure that processed productsuse up exactly the amount of fat and protein comprised in the raw milk.
Production of processed dairy products is based on a normalised quadratic functiondriven by the difference between the dairy product’s market price and the value of its fatand protein content. Lastly, prices of raw milk are equal to its fat and protein contentvalued with fat and protein prices.
The Armington assumption drives the composition of demand from domestic sales andthe different import origins depending on price relations and thus determines bilateraltrade streams.
The model comprises a two stage Armington system: on the top level, the composition oftotal demand from imports and domestic sales is determined, whereas the lower stagedetermines the import shares from different origins. The resulting layout of a market for acountry/aggregate in the market module is shown in the following diagram.
Due to the Armington assumption, product markets for different regions are linked byimport streams and import prices when they were observed in the base year. Accordingly,no uniform world market price is found in the system.
Graphic presentation for one region of a spatial market system
ArmingtonStage 2
Aggregate
ArmingtonStage 1
aggregate
Import Streams
Processing Human consumption Feed Use
Supply
Domestic Sales Export streamsIntervention sales
Export subsidies ?
RegionalPrices
and prices
Main results of the system cover acreage and animal numbers at NUTS II level, whichtogether with a set of input/output coefficients and prices allows to define incomeindicators for individual production activities and the region as a whole according toEAA definitions. Aggregation to Member State level reconstruct the EAA.
Chapter IV University of Bonn - CAPRI
119
The derived Agricultural Gross Value Added at market prices plus compensationpayments is the main indicator for agricultural income. The market model deliversbilateral trade streams between the EU and the regional aggregates, producer andconsumer prices at Member State level, and production, human consumption, feed andprocessing quantities at Member State level. It simulates as well intervention sales tostocks and subsidised exports.
The EAGGF budget outlays are estimated from (1) the compensation payments integratedin the regional programming models and (2) the levels of subsidised export quantities andintervention sales simulated for the individual markets in the market module. Costs forintervention purchases per unit are calculated by dividing the outlays in the years 1997-1999 for intervention stocks for a product by the average stock level in these years. Costsfor subsidised exports per unit are determined endogenously from price differencesbetween domestic and export markets.
Consumer welfare is measured as “equivalent variation”, expressing the real incomeeffect equivalent to the utility change provoked by consumer price changes against thereference run. Environmental indicators cover Nitrogen, Potassium and Calcium balancesat regional level (N,P,K), ammonia emissions, output of climate relevant gases (carbondioxide, methane and nitrous oxide) and water balances.
4.3. The reference run: Agenda 2000
The policy for the status quo scenario of the reference run reflects the Agenda 2000policy extended to the year 2009. It is taken as the comparison point for the Mid termReview impact analysis. Therefore, it is necessary to reflect carefully that status quopolicy representation, assumptions and exogenous shifters for this run as well as the mostimportant results for different activity and commodity groups.
The CAPRI modelling system focuses on the EU, for supply even regionalised at NUTSII level. As the demand system is calibrated, not estimated, changes in demand behaviournot linked to income or prices changes have to be based on assumptions. In here, thedemand systems for the EU Member States are calibrated to per capita consumptionchanges, income and population levels, in most cases in line with the data found in DGAGRI’s publication “Prospects for Agricultural Markets 2002-2009”35. Inflation is set to1.9 % p.a. and nominal GDP growth for the EU to 2.7 % p.a. GDP growth is used as aproxy for consumers’ available income. The assumptions for the EU as a whole are takenover to the individual Member States. Population growth at Member States level isborrowed from Eurostat.
Exogenous development of yields are based on trend analysis at EU Member State level,including years 1980-1999. The assumptions are harmonised with the ones used in theCAPSIM modelling system. For cereals, they are taken over from the latest DG AGRI’sMarket Outlook.36 Variable inputs are first shifted proportionally with the yields and then 35 http://europa.eu.int/comm/agriculture/publi/caprep/prospects2002/contents.pdf
36 It should be noted that the DG-AGRI market outlook expect a cut in cereal yield growth rate between2000-2009 of 50 % against the 1993-1999 period. This assumption, taken over in the current analysis,has considerable impacts on the development of cereals markets, as the difference between long termtrends and the ones applied adds up to some 20 Mio t by the end of 2009
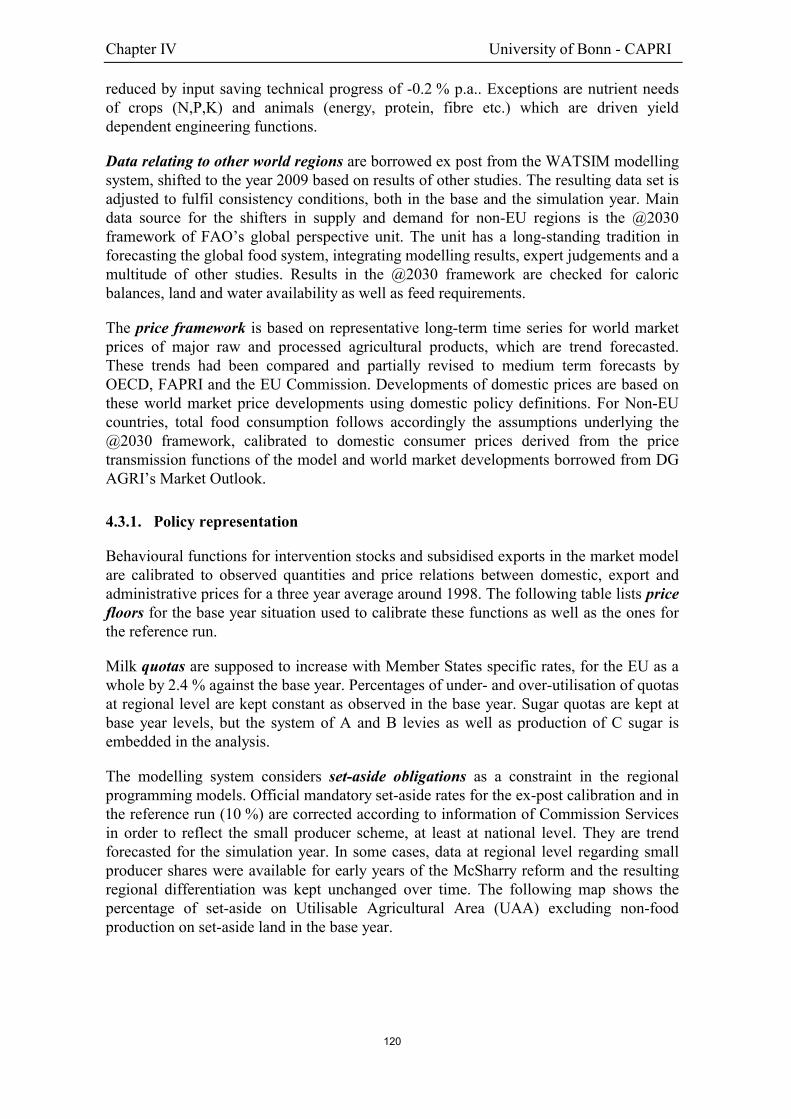
Chapter IV University of Bonn - CAPRI
120
reduced by input saving technical progress of -0.2 % p.a.. Exceptions are nutrient needsof crops (N,P,K) and animals (energy, protein, fibre etc.) which are driven yielddependent engineering functions.
Data relating to other world regions are borrowed ex post from the WATSIM modellingsystem, shifted to the year 2009 based on results of other studies. The resulting data set isadjusted to fulfil consistency conditions, both in the base and the simulation year. Maindata source for the shifters in supply and demand for non-EU regions is the @2030framework of FAO’s global perspective unit. The unit has a long-standing tradition inforecasting the global food system, integrating modelling results, expert judgements and amultitude of other studies. Results in the @2030 framework are checked for caloricbalances, land and water availability as well as feed requirements.
The price framework is based on representative long-term time series for world marketprices of major raw and processed agricultural products, which are trend forecasted.These trends had been compared and partially revised to medium term forecasts byOECD, FAPRI and the EU Commission. Developments of domestic prices are based onthese world market price developments using domestic policy definitions. For Non-EUcountries, total food consumption follows accordingly the assumptions underlying the@2030 framework, calibrated to domestic consumer prices derived from the pricetransmission functions of the model and world market developments borrowed from DGAGRI’s Market Outlook.
4.3.1. Policy representation
Behavioural functions for intervention stocks and subsidised exports in the market modelare calibrated to observed quantities and price relations between domestic, export andadministrative prices for a three year average around 1998. The following table lists pricefloors for the base year situation used to calibrate these functions as well as the ones forthe reference run.
Milk quotas are supposed to increase with Member States specific rates, for the EU as awhole by 2.4 % against the base year. Percentages of under- and over-utilisation of quotasat regional level are kept constant as observed in the base year. Sugar quotas are kept atbase year levels, but the system of A and B levies as well as production of C sugar isembedded in the analysis.
The modelling system considers set-aside obligations as a constraint in the regionalprogramming models. Official mandatory set-aside rates for the ex-post calibration and inthe reference run (10 %) are corrected according to information of Commission Servicesin order to reflect the small producer scheme, at least at national level. They are trendforecasted for the simulation year. In some cases, data at regional level regarding smallproducer shares were available for early years of the McSharry reform and the resultingregional differentiation was kept unchanged over time. The following map shows thepercentage of set-aside on Utilisable Agricultural Area (UAA) excluding non-foodproduction on set-aside land in the base year.
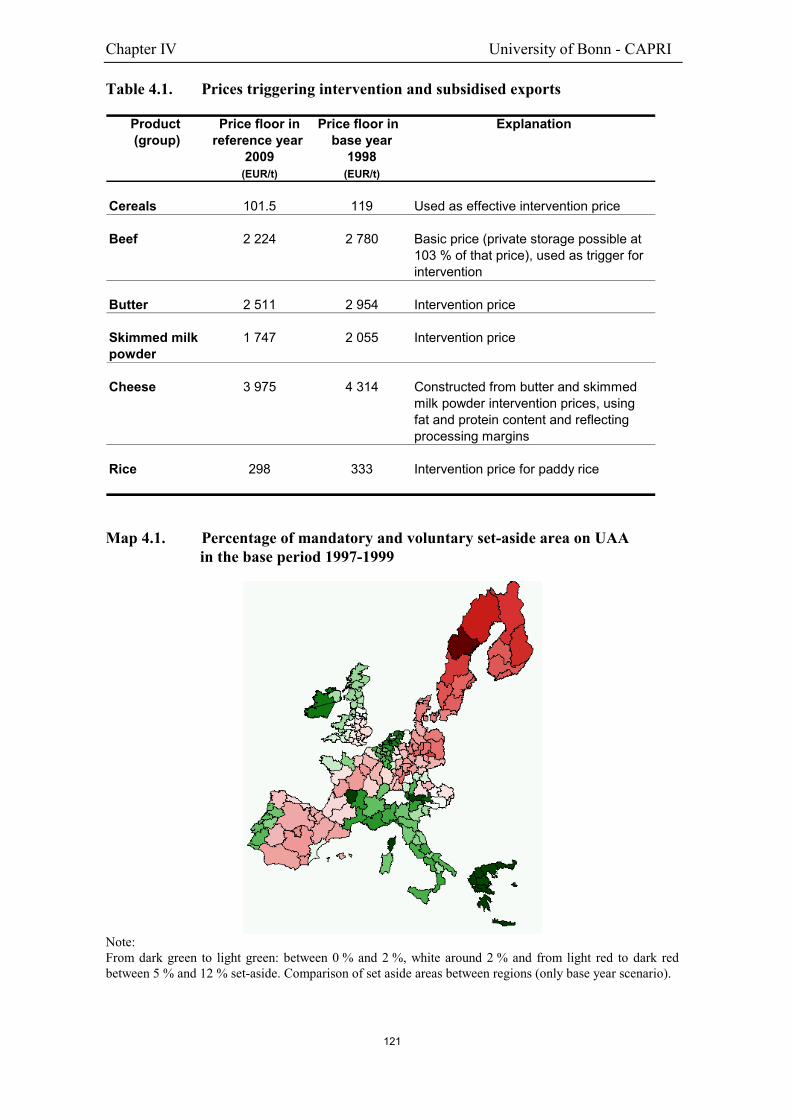
Chapter IV University of Bonn - CAPRI
121
Table 4.1. Prices triggering intervention and subsidised exports
Product Price floor in Price floor in Explanation(group) reference year base year
2009 1998(EUR/t) (EUR/t)
Cereals 101.5 119 Used as effective intervention price
Beef 2 224 2 780 Basic price (private storage possible at 103 % of that price), used as trigger for intervention
Butter 2 511 2 954 Intervention price
Skimmed milk 1 747 2 055 Intervention price powder
Cheese 3 975 4 314 Constructed from butter and skimmed milk powder intervention prices, using fat and protein content and reflecting processing margins
Rice 298 333 Intervention price for paddy rice
Map 4.1. Percentage of mandatory and voluntary set-aside area on UAAin the base period 1997-1999
Note:From dark green to light green: between 0 % and 2 %, white around 2 % and from light red to dark redbetween 5 % and 12 % set-aside. Comparison of set aside areas between regions (only base year scenario).

Chapter IV University of Bonn - CAPRI
122
The programming models are calibrated to observed set-aside hectares, includingvoluntary set-aside, and non-food production on set-aside land is treated as a separateproduction activity. Fallow land not falling into set-aside programs reflects the differencebetween land reported as idling in national statistics and data from commission serviceson actual hectares in set-aside programs.
Due to its activity based layout, the CAPRI supply model is well suited to deal with thecompensation payment scheme. A detailed modelling component, developed in co-operation with Torbjörn Jansson and Anders Bäckstrand - SLI, Lund -, allows for thedefinition of payment schemes linked to outputs (current or historic yields) or activitylevels in combination with ceilings in physical and/or valued terms.
The following payments are included in the reference run: COP premiums for cereals,oilseeds, pulses and energy crops; traditional and established durum wheat premiums;direct income support for dairy cows; direct payments to sheep and goat; nationalenvelopes for dairy cows, sheep & goat and bovine meat cattle; slaughter premiums foradult cattle and calves; and national premiums to dairy cows in northern Sweden andFinland.
Many of the listed premium schemes are restricted by ceilings in value and maximumamount on eligible hectares or heads defined at national or even regional level. Premiumsare therefore cut in the model if these ceilings are exceeded.
4.3.2. Main results of the reference run
4.3.2.1 Development of crop aggregates
The growth in set-aside and fallow land areas reflects partially increased set asideobligations from 6.7 % in average 1997-1999 to 10 % assumed in 2009, combined with adecrease in the small producer share, as well as the loss of profitability of cereals andoilseeds. Prices for cereals are forecasted to remain stable in nominal terms, thusdropping in real terms by -20.7 %, whereas oilseed prices increase slightly in nominalterms (falling by -14.4 % in real terms though). Income losses in oilseed activities perhectares are nevertheless higher than for cereals, as yield growth is smaller and premiumsare cut to cereal levels.
The reduction in hectares for other arable crops is due to: (1) falling sugar beet area withyields increasing by some 12.9 % and unchanged quota quantities, with an increase in “Csugar” production though, (2) drop of potatoes area with increased yields, as marketopportunities are restricted, and (3) a small drop in the area of pulses.
Total cereal production is expected to increase by 8.8 %, as a result of the combinedeffect of yield growth (14.6 %) and a drop in cultivated area of -5.1 % The latter is partlydue to an increase in set aside obligations and partly due to falling domestic prices. Theprice decline is provoked by growing surpluses putting pressure on internal market pricesaccompanied by falling world market prices in real terms. Average cereal prices areexpected to drop from 142 EUR/t to 113 EUR/t in 2009. Net trade increases from26 mio t to about 36 mio t, as demand is simulated to grow by 7.3 %.

Chapter IV University of Bonn - CAPRI
123
Table 4.2. Crop aggregates: premium and income per hectare (nominal EUR2009/ha), acreage (1000 ha), yield (kg/ha) and supply (1000 t)37
Base year 1998 Agenda reference run 2009European Premium Income Hectares Yield Supply Premium Income Hectares Yield Supply
Union per ha per ha per ha per ha
Cereals 345 475 37 694 5 617 211 746 327 306 35 779 6 438 230 338-5.05% -35.55% -5.08% 14.60% 8.78%
Oilseeds 544 573 5 644 3 037 17 137 259 217 4 678 3 356 15 695-52.46% -62.16% -17.12% 10.50% -8.41%
Otherarable 102 2 627 7 970 33 173 264 398 78 2 389 7 818 35 873 280 469crops -23.76% -9.06% -1.90% 8.14% 6.08%Permanentcrops & 4 927 12 873 8 746 112 590 4 966 13 443 8 526 114 619vegetables 0.78% 4.43% -2.52% 1.80%
Fodder 20 30 64 962 8 943 580 973 16 34 65 652 8 863 581 857production -20.48% 11.59% 1.06% -0.90% 0.15%Set aside & fallow 154 162 9 110 322 2 931 153 152 10 882 329 3 583land -0.09% -6.29% 19.45% 2.33% 22.24%
4.3.2.2 Development of cereals
With a net trade of about 19.8 mio t, soft wheat remains the biggest exported crop inEurope – mostly due to yield increases by 18.2 %. Soft wheat producer prices fall with107 EUR/t near to administrative prices at 101 EUR/ton, having the model alreadystarted to defend market prices with a slight amount of intervention purchases (32 000 t).Net exports of barley are forecasted to grow by 1.8 mio t to 11.6 mio t, as yield increasesby 13 % to an average of 5.2 t/ha. Demand and supply increase at rates of 7.2 % and5.4 % each. Again, barley prices in the EU are around intervention price levels, withprices defended by some 147 000 t put into public stocks. The sharpest market pressureoccurs in rye, a product showing a structural imbalance during the last years, withintervention sales at 253 00 t. The model expects the EU to become a net exporter ofgrain maize by 2009, resulting from yield increases and constant acreage. This is mostlydue to higher producer prices compared to the ones for other cereals. Durum wheatshows a smaller yield increase with 7.3 %, and the acreage is simulated to drop by about-4.2 %.
The model predicts subsidised exports for all cereals: around 3.6 mio t for soft wheat,0.3 mio t for durum wheat, 2.4 mio t for barley and 1.0 mio t for other cereals.
The simulated situation depends on the following underlying assumptions: (1) Yieldestimates for rye, barley, other cereals and grain maize had been manually downwardcorrected – if the linear estimated trend from year 1985 onwards had been continued,market pressure would have been even higher, both by increased yields and hectares dueto higher competitiveness. (2) Trends of world market prices and (3) the EUR/ $
37 Note that all monetary values for the base year are inflated to the simulation year 2009 for comparison
purposes.

Chapter IV University of Bonn - CAPRI
124
exchange rate is kept one to one. A stronger European currency or lower world marketprices could require sharp increases in export subsidies paid to agriculture, as well assubstantial interventions purchases to defend administrative prices when subsidisedexports reach WTO limits.
Table 4.3. Product balances for cereals (1000 t)
Base year 1998 Agenda reference run 2009European Supply Intervention Net trade Demand Supply Intervention Net trade Demand
Union purchases purchases
Cereals 211 746 5 454 25 873 180 419 230 338 435 36 307 193 5968.78% -92.03% 40.33% 7.30%
Soft wheat 91 806 1 179 14 694 75 933 102 077 32 19 847 82 19811.19% -97.30% 35.07% 8.25%
Durum 8 441 108 135 8 198 8 678 3 -123 8 799wheat 2.81% -97.51% -191.04% 7.33%
Rye and 6 181 2 097 1 389 2 695 6 482 253 3 211 3 018meslin 4.86% -87.91% 131.08% 11.98%
Barley 52 372 2 069 9 816 40 487 55 189 147 11 639 43 4035.38% -92.90% 18.58% 7.20%
Oats 7 281 895 6 386 7 404 745 6 6591.69% -16.77% 4.28%
Grain 37 644 -615 38 259 41 899 1 492 40 407maize 11.30% 342.74% 5.61%
Other 5 298 -442 5 740 5 685 -505 6 190cereals 7.31% -14.34% 7.85%
Paddy rice 2 722 0 2 722 2 924 1 2 9237.42% 500.81% 7.40%
The average income in cereals per hectare drops by about –35.6 % in real terms. Firstly,market revenues drop by about -8.8 %, a combined results of lower cereal producer prices(in real terms –20,7%) and yield increases (14.6%). Secondly, premiums stay relativelystable in real terms at 327 EUR/t compared to 345 EUR/t in the base year38 and, thirdly,input costs grow in real terms by 11.8 %, following the yield increase.
4.3.2.3 Development of oilseeds
Only minor changes are forecasted for the demand in the oilseed sector (-1.3 %). Supplyhowever drops by -8.4 % resulting from a reduction in acreage by –17.1 % as premiumsare cut. The sharper drop compared to –5.1 % for cereals results from a more pronounceddecrease in profitability, as premiums are cut more than half in real terms for oilseedsfrom 544 EUR/ha to 259 EUR/ha (-52.5 %). Different yield trends shift supply from thelow yield oilseeds sunflower and soya to rapeseed.
38 All base year prices and valued positions had been inflated to Euro 2009.

Chapter IV University of Bonn - CAPRI
125
Table 4.4. Product balances for oilseeds (1000 t)
Base year 1998 Agenda reference run 2009European Supply Intervention Net trade Demand Supply Intervention Net trade Demand
Union purchases purchases
Oilseeds 14 948 -17 459 32 391 13 701 -18 264 31 965-8.34% -4.61% -1.32%
Rape seed 9 919 247 9 669 9 671 507 9 164-2.50% 105.04% -5.22%
Sunflower 3 598 -2 023 5 611 2 936 -2 640 5 576seed -18.40% -30.46% -0.62%
Soya seed 1 430 -15 683 17 112 1 094 -16 131 17 225-23.51% -2.86% 0.66%
4.3.2.4 Developments in the meat, cattle and dairy sector
Mainly by using the assumption of EU Medium Term Prospects regarding thedevelopment of per capita consumption for the different meat products, total meatdemand is forecasted to grow by 6.2 % from 1998 to 2009. The sharpest increase isforecasted for poultry meat with 11.4 %, which combined with a production growing byaround 8.2 % reduces somewhat EU position as a net exporter. The increase inproduction is calibrated to the expectations of DG AGRI by assuming that input savingtechnical progress for capital and labour was –2 % per annum. Growth in pork meat isless pronounced both in human consumption and supply, but leaves the EU with netexports of about 1.26 mio t, not much different from the base year. Again, increase ofsupply with falling output prices and moderately reduced feeding costs is only possiblewhen assuming technical progress reducing labour and capital need with -1.5 % perannum. Net imports for sheep and goat meat are simulated to increase very slightly, asproduction falls by –1.1 %, and demand increases by 0.3 %. Demand for beef drops by-2.7 % reflecting a decrease in per capita consumption of 1 kg, based on own trendanalysis and in line with the latest FAPRI base line, but countervailing EU Prospectswhich forecast stable consumption per capita. Meat supply from cattle decreases by-3.4 %, leaving the EU with net export of 0.4 mio t. The cattle and sheep & goat meatprocesses were assumed to profit from input saving technical progress of -1 % perannum. Human consumption per capita of meat increases from about 87 kg in 1998 to90 kg to 2009, with 45 kg of pork, 23 kg of poultry, 17 kg of beef, 2 kg of veal and 4 kgof sheep and goat meat.
Total cow and buffalo milk output follows the quota expansion of 2.4 to about125 mio t of fresh milk, whereas sheep and goat milk production drops by –2 % or67 000 t. Dairy cow yields for low and high yielding cows are estimated to increase by21.4 % from 1998 to 2009, reflecting technical progress.
The model predicts the process of shifting supply to more efficient cows to slow down –the number of high yield milk cows drops by –18.4 % compared to about –8.9 % for lowyield milk cows. This shift is due to the reduction in milk prices combined with thepressure over the young animal markets. The total dairy cowherd is simulated to decreaseby –13.6 % to an inventory of 18.6 mio dairy cows in 2009. The trend of growing suckler

Chapter IV University of Bonn - CAPRI
126
cowherds observed in the last year continues up to a herd size of 13 mio heads (9.7 %) in2009. The aggregated number of dairy and suckler cows thus decreases, falling calves aswell as the level of raising processes. Income in the cattle fattening processes drops dueto several factors. Prices for beef are forecasted at 2653 EUR/ton, equivalent to a drop inreal terms of –26.4 %. Premiums for male cattle for fattening increase from 137 EUR to261 EUR per head as premium ceilings are overshot. Due to the relative high share ofsilage and grass in the feed menu, falling prices for cereals and cereals substitutes reducefeed cost only by –4.5 % in real terms. The situation in heifers for fattening is evenworse, as they receive only the slaughter premium of 75 EUR per head plus 10 EUR fromnational envelopes. In overall, as total fodder production remains stable and alternativeuses of the factors employed in grassland based farms are restricted, total cattle herdsdrops by –4.8 %. The average slaughter weight is forecasted to increase, reflectingreduced calves availability.
Table 4.5. Product balances for meat (1000 t)
Base year 1998 Agenda reference run 2009European Supply Intervention Net trade Demand Supply Intervention Net trade Demand
Union purchases purchases
Meat 35 011 2 302 32 708 36 577 1 844 34 7324.47% -19.90% 6.19%
Beef 7 020 452 6 568 6 778 389 6 390-3.45% -14.11% -2.72%
Veal 788 59 728 674 -38 712-14.40% -164.05% -2.19%
Pork 17 318 1 335 15 983 18 537 1 256 17 2817.04% -5.91% 8.12%
Sheep&goat 1 138 -255 1 393 1 125 -273 1 398-1.14% -6.89% 0.33%
Poultry 8 746 710 8 036 9 462 510 8 9528.18% -28.19% 11.39%
Will cereal feed use expand?
Compared to the results published in reports by FAPRI39 and Commission Services40 theforecasted increase in demand for cereals based on the CAPRI system seemsconservative. For 2009/2010, FAPRI predicts a feed demand of 113.8 mio t for softwheat, durum wheat, barley and grain maize. This implies 9 mio t more than the actualprojections of CAPRI for these cereals in the reference run. Moreover, CommissionServices forecast for 2009 total feed use of cereals at 124.4 mio , where CAPRI estimatesare at 119 mio t.
39 FAPRI-UMC Technical Data Report 01-02
40 “Prospects for Agricultural Markets 2002-2009, June 2002

Chapter IV University of Bonn - CAPRI
127
The CAPRI projections are based on (1) constant feed efficiency – thus being fairlyconservative in that respect, and (2) requirement functions per animal category for energyand protein, and other further nutrients, balanced with the available energy and protein inthe base year including the fodder. Total feed need increases, mostly due to the increasein cow and buffalo milk production of about 2.6 % following the quota expansion and theincrease in total meat output. However, the following points need to be taken intoaccount.
Firstly, milk yield increase raises the feed efficiency in milk production, as the number ofcalves and heifers for raising can be reduced.
Secondly, the number of animals in fattening activities drops, freeing fodder resourceswhich replace more expensive feeding products as cereals in the fattening processes-average cereal intake per bull and heifer for fattening is projected to fall slightly.
The countervailing force lays in increased cereal needs in pig and poultry, resulting fromlarger herds. Cereal use per head increases by 9.1% for pig fattening and 5.3 % forpoultry, whereas energy rich fodder input drops per head by -35.8 % in pig fattening and-38 % in poultry production. The combined effects decrease average sector wideconversion rates from cereals to meat.
4.3.2.5 Impact analysis on agricultural income and EAGGF budget
As discussed above, almost all prices for agricultural outputs are forecasted to fall in realterms, following long-term trends.
Output value from agricultural production at EU level is forecasted to drop by –7.3 %,whereas input value decrease by –1.3 %, mostly due to falling prices for feeding stuff.Overall, gross value added at basic prices is simulated to be 146.7 bio EUR, a decrease inreal terms of around –12.2 %. Given long term trends in the agricultural labour force,income per agricultural working unit (AWU) in agriculture increases in real terms.
4.4. Impact analysis of the Mid-Term Review Proposal
4.4.1. Introduction
The MTR proposal aims at (1) economic viability, (2) social balance, (3) environmentalintegration and animal health and welfare concerns as well as (4) rural development.
The following quantitative analysis based on the CAPRI modelling system comparesdevelopments of production, land use, demand, agricultural income and someenvironmental indicators projected for 2009 under the policy set of the MTR proposal tothe results of the reference run shown above, which represent the full implementation ofthe Agenda 2000 proposal in the year 2009.
Critical points in the analysis are :
(1) De-coupled direct payments are assumed to be uniform at regional level. Theproposal leaves up to a certain extent open how these payments have to beimplemented by the Member States – uniform at farm – probably the most likelyoption -, regional or Member State level and the exact attachment of the premium to
Chapter IV University of Bonn - CAPRI
128
the production factor. Clearly, a payment scheme deviating from the implementationsystem chosen in the modelling exercise could drive to different results.
(2) The uniform premium was calculated based on historical land use and herd patternsfrom a three year average around 1998. Shifts in production for the reference periodchosen, probably 2001, as historical base would somehow affect premium values.
(3) Dynamic modulation was based on data provided by Commission services on latestavailable Farm Accounting Data Network results. Changes in farm structure andproduction patterns, as well as the introduction of the capping scheme at300 000 EUR would affect the premium levels used in the analysis.
(4) As for the reference run, deviation in income growth, inflation and EUR / $ exchangerate could change results relating to domestic and world market prices and marketinterventions as well as subsidised exports.
(5) Some elements of the proposal, as compulsory farm audits cannot be modelled withthe CAPRI system, but the effect on the results discussed below is deemed neglectful.
(6) The uniform premium scheme leads to more transparency of the CAP and reducesadministrative costs, welfare gains that are not covered by the model.
(7) The analysis for the dairy sector is based on Option 1 of the Commissions proposalregarding possible future avenues for the development of the dairy sector. Hence, acontinuation of the Agenda 2000 policy for the dairy sector is assumed.
4.4.2. Policy implementation in the MTR run
Cereals intervention prices were reduced by 7.5% - the combined effect of a drop by 5%to 95,35 EUR/t and the abolishment monthly reports. Further on, rye intervention wasabolished and rice intervention prices reduced to 150 EUR/ton. In order to calculate theuniform premium, premiums from Agenda 2000 were modified according to the MTRproposal:
(1) an increase by 3 EUR/t of historic yield to 66 EUR/ton for ‘Grandes Cultures’ as a50 % compensation of the cut in cereals intervention prices.
(2) A reduction of the supplementary payment in durum wheat to 250 EUR/ha in“traditional areas” bundled with an abolishment of the supplement in “establishedareas”. Introduction of quality top-up of 15 EUR/t everywhere as a crop specificpremium.
(3) Introduction of a income payment of 102 EUR/t in rice (177 EUR/t – 75 EUR/tremaining as a crop specific premium).
(4) Introduction of a premium of 45 EUR/ha for energy crops (coupled to non-foodproduction activities), under the condition of a contract with a processor.
All other premiums were kept unchanged. Support to Nuts is not included in the runs, aswell as direct payments for dehydrated or sun dried fodder.

Chapter IV University of Bonn - CAPRI
129
Table 4.6. Premium schemes included in the MTR runs
Premium type Status
Direct payment to ‘Grandes Cultures’ (Cereals, Amount of payment revised and decoupledsoya, rape, sunflower seed, pulses, set-aside)
Traditional durum wheat premium Amount of payment revised partly decoupled
Established payment to durum wheat Abolished
Rice premium Amount of payment revised partly decoupled
Suckler cow premium Decoupled
Special premium to bulls and steers where all Decoupledare assumed to be bulls
Direct income support to dairy cows Decoupled
Direct payment for sheep and goat Decoupled
National envelope for sheep and goat Decoupled
National envelope dairy cows Decoupled
National envelope bovine meat cattle Decoupled(cows, bulls and heifers)
Slaughter premium for adult cattle Decoupled(cows, bulls and heifers)
Slaughter premium for calves Decoupled
National premium to dairy cows in northern UnaffectedSweden and Finland
The calculation of the premiums is done as described below:
(1) The partially redefined premiums falling under the new uniform per farm premiumand category labelled “decoupled”, were applied to the three year average 1998 areasor herd sizes, and cut if respective ceilings were overshot.
(2) The premiums were “dynamically modulated” until 2009, i.e. six steps of -3 % cutfrom the original level to a final maximal cut of -18 %. As only payments above acertain ceiling –5 000 EUR per farm plus 3 000 EUR per AWU exceeding twoAWU– are subject to the modulation, smaller reduction were applied for groups ofpayments according to information provided by Commission Services based on theEuropean Farm Accounting Data Network. The data are not available at regional

Chapter IV University of Bonn - CAPRI
130
level, what might not take into account some structural differences41. Further on, theproposed capping at 300 000 EUR per farm considered, error which would mainlyaffect Eastern Germany, some regions in Spain and some farms in the UK42.
(3) Afterwards, the resulting premium sum at regional level is distributed over eligiblehectares and converted into a regional specific uniform premium per ha in the MTRrun. The resulting regional premium sum was introduced as a ceiling in values atregional level, so that regional premium per eligible hectare would be cut if apremium overshot takes place. The following top-up on the uniform premia areadded: durum wheat (15 EUR/t), rice (75 EUR/t), protein (9.5 EUR/t) and energycrops (45 EUR/ha). According to the proposal, vegetable and fruits were not eligible,it was assumed that the same is valid for table olives and olives for oils, nurseries,flowers, vineyards and the so-called “other crops”.
Set-aside obligations are defined as a “continuation of the individual historic set-asideobligation”. That obligation was calculated at NUTS II level based on the regional cropmix in the base year and on an obligatory set-aside rate of 10 %, corrected by national orregional small producer shares. A constraint in the supply models ensured set-aside equalor above these regional ceilings.
The costs of compulsory farm audits on all relevant material flows and on-farmprocesses for all farm receiving more than 5000 EUR are not included in the study. Theerror is deemed not important, especially as financial support covering operation costs iseligible under Rural Development, and the dynamic modulation will increase budgetsavailable under the second pillar. It can be expected that regional government will at leastpartially redirect the budgetary funds into new agri-environmental programs, especiallythe proposed “temporary and decreasing aid (max 200 EUR/ha) to farms to help themimplementing statuary standards”.
4.4.3. Main results of the Mid-Term Review scenario
4.4.3.1 Development of crop aggregates
Cereals (-8.7 %) and oilseeds (-4.7 %) areas are reduced against the reference as theirpremiums decrease by some -30 % and -18 % respectively. Fodder production increasesin hectares by 4.2 %, with supply remaining constant. The model keeps grassland fixed –in line with the assumption that Member State legislation would prevent conversion ofgrass into arable land. In the arable fodder sector, fodder maize (-7.7 %) is replaced byother fodder on arable land (23 %) as it looses relative competitiveness - fodder maizepremiums drop whereas fodder from arable land receives now the uniform regionalpremium. The increase in fodder on arable land with constant output quantities means anextensification of fodder production as shown by a drop in fodder yields by –4 %.
Fallow and set-aside areas increase by 5.5 %. This is under the assumption that all fallowland would be claimed for premiums, as costs of keeping fallow land in “good
41 The error will be especially high in Germany, where the difference in farm structure between East and
West are pronounced.
42 Readers are reminded that budget savings from modulation are proposed to be re-distributed inside thesame region under the second pillar.

Chapter IV University of Bonn - CAPRI
131
agricultural conditions” are far below the uniform premium –in average 50 EUR. Acreageof energy crops drops slightly (-1.8 %). Hectares of perennials and vegetables are fixed tothe results from the reference run.
Table 4.7. Crop aggregates: premium and income per hectare (nominal EUR2009/ha), acreage (1000ha), yield (kg/ha) and supply (1000 t)
Agenda reference run 2009 MTR unchanged dairy policy 2009European Premium Income Hectares Yield Supply Premium Income Hectares Yield Supply
Union per ha per ha per ha per ha
Cereals 327 306 35 779 6 438 230 338 229 216 32 678 6 526 213 244-30.16% -29.52% -8.67% 1.36% -7.42%
Oilseeds 259 217 4 678 3 356 15 695 213 186 4 455 3 392 15 110-17.74% -14.19% -4.75% 1.07% -3.73%
Otherarable 78 2 389 7 818 35 873 280 469 188 2 487 7 798 37 079 289 139crops 141.64% 4.10% -0.26% 3.36% 3.09%Permanentcrops & 4 966 13 443 8 526 114 619 4 966 13 443 8 526 114 619vegetables 0.00% 0.00% 0.00% 0.00%
Fodder 16 34 65 652 8 863 581 857 191 218 68 393 8 506 581 728production 1107.5% 541.69% 4.17% -4.03% -0.02%Set aside & fallow 153 152 10 882 329 3 583 165 143 11 485 332 3 817land 7.81% -5.58% 5.54% 0.93% 6.53%
4.4.3.2 Development of cereals and oilseeds
Supply of cereal decreases by –7.4 %, with the exception of durum wheat falling by –19.5 % as premiums drop by -52 % compared to –30 % in average. The reduction insupply is rather pronounced in regions with very low yields and high share of directpayments in income for the reference run. Income crashes for example in Portugal fordurum wheat by –75.5 %, leading to an acreage change of -60 %. Cereal yields increaseslightly by 1.4 % as areas are reduced mostly for low productive cereals and in lowproductive regions. The abolition of rye intervention – aggregated in the market modelwith oats and other cereals – let prices of theses cereals drop by –0.9 %, contrary to softwheat and grain maize (2.8 % and 1.8 % increase). The weighted producer price forcereals increases by 0.6 %, reflecting the overall decrease in supply.
Whereas human consumption of cereals is unaffected (consumer price changes aredampened by very high margins against the small increase in farm gate prices), feed useis reduced by –4.7 %. The latter reflects solely the reduction in beef meat supply, asnumber of cattle decrease, allowing for a higher share of fodder in the feed mix. Marketinterventions are not longer necessary to defend internal prices. The net trade of 36 mio tin cereals is reduced to 26 mio t, as the reduction in supply is more pronounced than infeed demand. The EU position as a net importer of oilseeds is only slightly affected bythe MTR proposal (0.5 mio t), resulting from reduced oilseed production (-4.6 %) incombination with stable demand (-0.7 %). As for cereals, average oilseed yields increase(1.1 %).

Chapter IV University of Bonn - CAPRI
132
Table 4.8. Product balances for cereals (1000 t)
Agenda reference run 2009 MTR unchanged dairy policy 2009European Supply Intervention Net trade Demand Supply Intervention Net trade Demand
Union purchases purchases
Cereals 230 338 435 36 307 193 596 213 244 9 25 989 187 247-7.42% -97.92% -28.42% -3.28%
Soft wheat 102 077 32 19 847 82 198 96 481 0 16 319 80 162-5.48% -99.38% -17.77% -2.48%
Durum 8 678 3 -123 8 799 6 986 0 -1 586 8 573wheat -19.50% -99.48% -1188.94% -2.57%
Rye and 6 482 253 3 211 3 018 6 006 3 047 2 959meslin -7.34% -100.00% -5.10% -1.94%
Barley 55 189 147 11 639 43 403 50 029 9 8 365 41 655-9.35% -93.97% -28.13% -4.03%
Oats 7 404 745 6 659 6 673 285 6 388-9.87% -61.75% -4.06%
Grain 41 899 1 492 40 407 38 880 241 38 640maize -7.20% -83.86% -4.37%
Other 5 685 -505 6 190 5 262 -684 5 946cereals -7.44% -35.35% -3.95%
Paddy rice 2 924 1 2 923 2 926 2 2 9240.06% 104.67% 0.03%
4.4.3.3 Development of fallow land and set-aside
The modelling system distinguishes set-aside and fallow land, in order to allow formodelling of compulsory set-aside obligations and voluntary set-aside programs. By theintroduction of a uniform premium paid to both activities, the model technically movesareas from set-aside to fallow land. The result for the MTR proposal should hence beinterpreted for the aggregate of both.
The following map shows the change in the aggregate “fallow land and set-aside” in theMTR compared to the reference run. As the map reveals, the overall picture is notdramatically changed by the MTR proposal. On EU level, there is an increase of fallowland plus set-aside of about 5.5 %. Reductions are observed in Southern Sweden andIreland, where idling arable land is now converted into low productive fodder production.Increases occur mostly in Southern Member States, but the absolute share on agriculturalland is increasing by not more than 1-2 %.
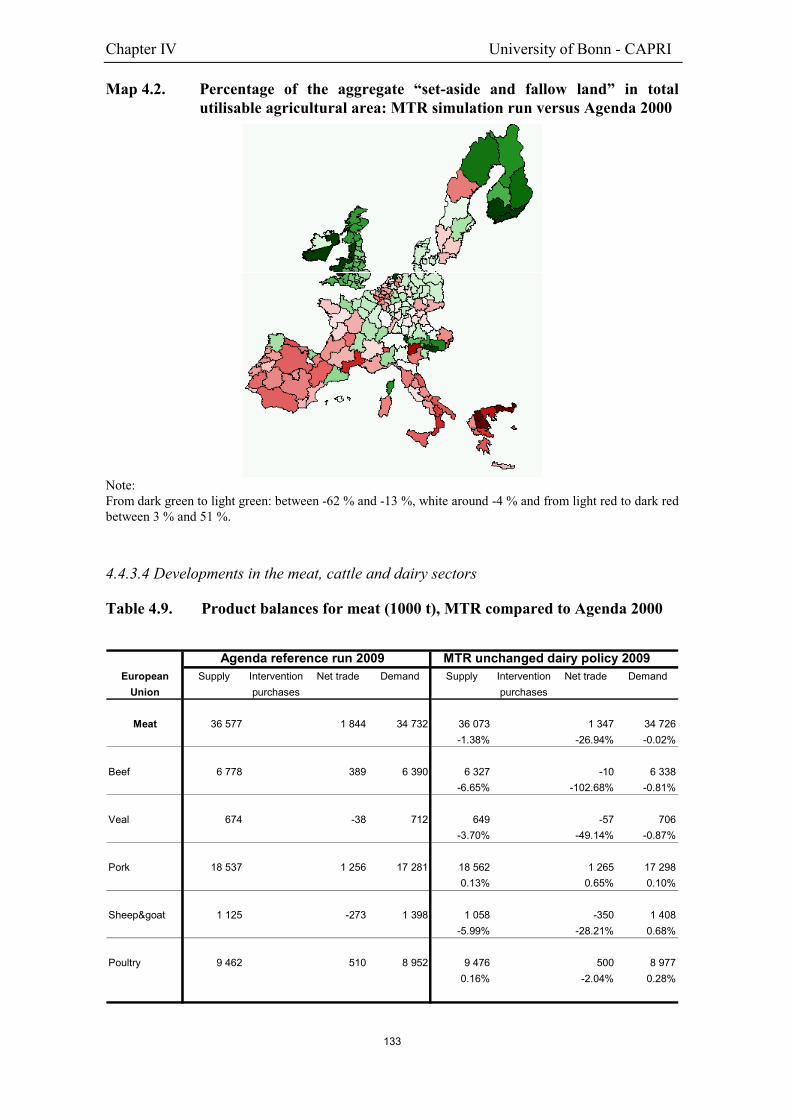
Chapter IV University of Bonn - CAPRI
133
Map 4.2. Percentage of the aggregate “set-aside and fallow land” in totalutilisable agricultural area: MTR simulation run versus Agenda 2000
Note:From dark green to light green: between -62 % and -13 %, white around -4 % and from light red to dark redbetween 3 % and 51 %.
4.4.3.4 Developments in the meat, cattle and dairy sectors
Table 4.9. Product balances for meat (1000 t), MTR compared to Agenda 2000
Agenda reference run 2009 MTR unchanged dairy policy 2009European Supply Intervention Net trade Demand Supply Intervention Net trade Demand
Union purchases purchases
Meat 36 577 1 844 34 732 36 073 1 347 34 726-1.38% -26.94% -0.02%
Beef 6 778 389 6 390 6 327 -10 6 338-6.65% -102.68% -0.81%
Veal 674 -38 712 649 -57 706-3.70% -49.14% -0.87%
Pork 18 537 1 256 17 281 18 562 1 265 17 2980.13% 0.65% 0.10%
Sheep&goat 1 125 -273 1 398 1 058 -350 1 408-5.99% -28.21% 0.68%
Poultry 9 462 510 8 952 9 476 500 8 9770.16% -2.04% 0.28%
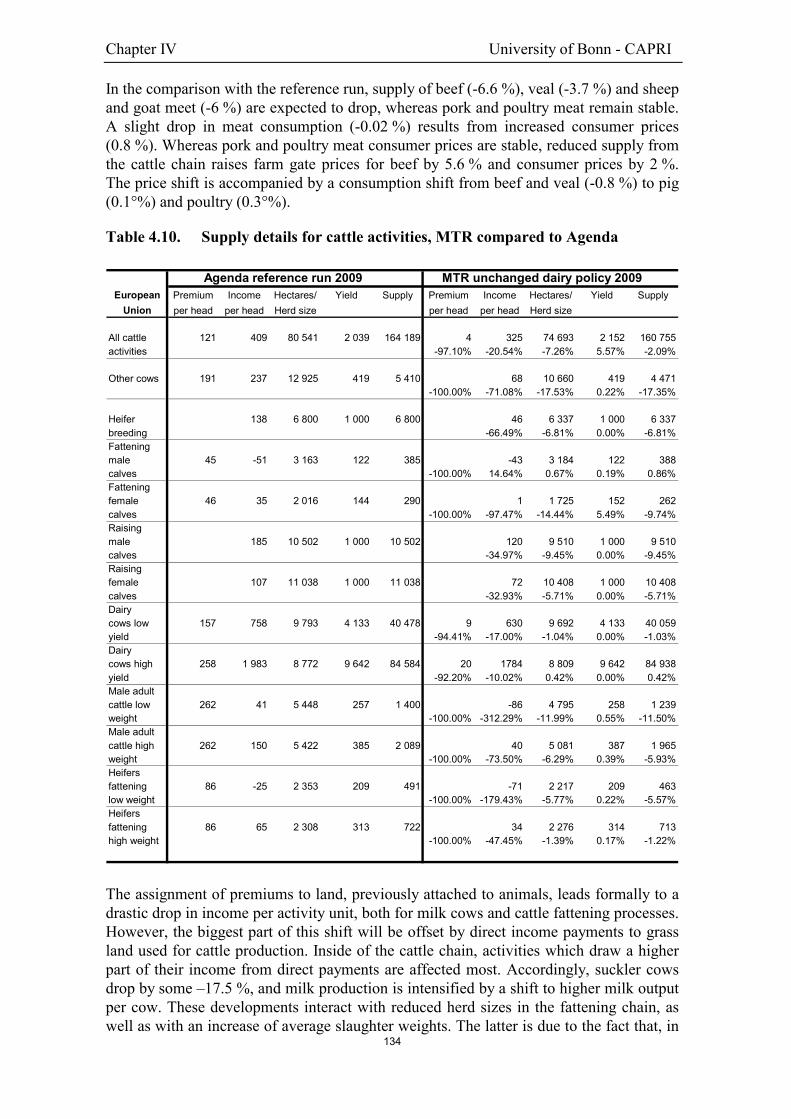
Chapter IV University of Bonn - CAPRI
134
In the comparison with the reference run, supply of beef (-6.6 %), veal (-3.7 %) and sheepand goat meet (-6 %) are expected to drop, whereas pork and poultry meat remain stable.A slight drop in meat consumption (-0.02 %) results from increased consumer prices(0.8 %). Whereas pork and poultry meat consumer prices are stable, reduced supply fromthe cattle chain raises farm gate prices for beef by 5.6 % and consumer prices by 2 %.The price shift is accompanied by a consumption shift from beef and veal (-0.8 %) to pig(0.1°%) and poultry (0.3°%).
Table 4.10. Supply details for cattle activities, MTR compared to Agenda
Agenda reference run 2009 MTR unchanged dairy policy 2009European Premium Income Hectares/ Yield Supply Premium Income Hectares/ Yield Supply
Union per head per head Herd size per head per head Herd size
All cattle 121 409 80 541 2 039 164 189 4 325 74 693 2 152 160 755activities -97.10% -20.54% -7.26% 5.57% -2.09%
Other cows 191 237 12 925 419 5 410 68 10 660 419 4 471-100.00% -71.08% -17.53% 0.22% -17.35%
Heifer 138 6 800 1 000 6 800 46 6 337 1 000 6 337breeding -66.49% -6.81% 0.00% -6.81%Fatteningmale 45 -51 3 163 122 385 -43 3 184 122 388calves -100.00% 14.64% 0.67% 0.19% 0.86%Fatteningfemale 46 35 2 016 144 290 1 1 725 152 262calves -100.00% -97.47% -14.44% 5.49% -9.74%Raisingmale 185 10 502 1 000 10 502 120 9 510 1 000 9 510calves -34.97% -9.45% 0.00% -9.45%Raisingfemale 107 11 038 1 000 11 038 72 10 408 1 000 10 408calves -32.93% -5.71% 0.00% -5.71%Dairycows low 157 758 9 793 4 133 40 478 9 630 9 692 4 133 40 059yield -94.41% -17.00% -1.04% 0.00% -1.03%Dairycows high 258 1 983 8 772 9 642 84 584 20 1784 8 809 9 642 84 938yield -92.20% -10.02% 0.42% 0.00% 0.42%Male adultcattle low 262 41 5 448 257 1 400 -86 4 795 258 1 239weight -100.00% -312.29% -11.99% 0.55% -11.50%Male adultcattle high 262 150 5 422 385 2 089 40 5 081 387 1 965weight -100.00% -73.50% -6.29% 0.39% -5.93%Heifersfattening 86 -25 2 353 209 491 -71 2 217 209 463low weight -100.00% -179.43% -5.77% 0.22% -5.57%Heifersfattening 86 65 2 308 313 722 34 2 276 314 713high weight -100.00% -47.45% -1.39% 0.17% -1.22%
The assignment of premiums to land, previously attached to animals, leads formally to adrastic drop in income per activity unit, both for milk cows and cattle fattening processes.However, the biggest part of this shift will be offset by direct income payments to grassland used for cattle production. Inside of the cattle chain, activities which draw a higherpart of their income from direct payments are affected most. Accordingly, suckler cowsdrop by some –17.5 %, and milk production is intensified by a shift to higher milk outputper cow. These developments interact with reduced herd sizes in the fattening chain, aswell as with an increase of average slaughter weights. The latter is due to the fact that, in

Chapter IV University of Bonn - CAPRI
135
the reference run, animals with low final weights draw a higher percentage of incomefrom direct payments in. The number of cows is reduced by -7.3 %. Farm specificpremiums might change the picture, as probably a higher part of the direct support paid tocattle would be redirected to grass land compared to uniform regional payments atNUTS II level. The results are coupled to the assumption that grassland cannot beconverted to set-aside. Dairy cows are still competitive after removal of direct payments,keeping milk output unchanged at quota levels. A reduction of sheep and goat milk byabout –3.2 % leads to slight changes in output of processed dairy products in the 0.1°%range which are produced both from cow and sheep and goat milk. Slight changes occurfor human consumption as well, partly due to cross price effects from changes in meatand crop prices. Net trade of processed dairy products is slightly reduced.
4.4.3.5 Impact analysis on agricultural income and EAGGF budget
Table 4.11. Economic welfare analysis for EU 15 (mio EUR)
Item Agenda reference MTR Proposalrun 2009 2009
Consumer welfare 1 33 265 31 126(equivalent variation) -6.43%
FEOGA budget outlays 2 27 666 25 198first pillar -8.92%
EAA Output 3=4+5+6 308 466 304 448-1.30%
EAA Output crops 4 159 019 157 971-0.66%
EAA Output animals 5 149 447 146 477-1.99%
EAA Output rest 6
EAA Input 7=8+9+10 189 132 182 997-3.24%
EAA Crop specific inputs 8 35 874 34 651-3.41%
EAA Animal specific inputs 9 101 447 97 333-4.05%
EAA Other inputs 10 51 812 51 013-1.54%
Premiums 11 27 399 25 082-8.46%
Agricultural income 12=3-7+11 146 733 146 533-0.14%
Total 13=1-2+12 152 332 152 4610.08%

Chapter IV University of Bonn - CAPRI
136
The table shows that total premium payments decrease by -8.5°%. Agricultural incomenevertheless stays stable, as input drop some –3.2°% in value whereas output value fallsby –1.3°% only as prices increase.
The decrease of the premium amount results from the combination of increasingpremiums as described above in combination with the degressive modulation system.Compared to the 18°% modulation, the overall cut is smaller as (a) part of the premiumse.g. national envelopes are not included in the modulation and (b) farm specific ceilingsprevent a full cut for included ones. A more detailed view on the EAGGF budgetpositions shows a shift in the compensation payments from cereals and oilseeds to foddercrops on arable land.
The MTR proposal foresees the transfer of budget savings of the modulation from thefirst to the second pillar As far as farmers benefit from increased rural developmentprograms, that could offset income losses from the modulation.
The following map shows the changes in premium payments per hectare at NUTS 2 levelfor the EU. It can be seen that regions with high levels of permanent grass land and cattleproduction achieve higher premium payments per hectare. Past experiences with thecompensation payments indicate increased rent prices, and thus income distributioneffects depending on land ownership.
Map 4.3. Comparison of changes in total premium payments per hectare ofMTR against Agenda 2000
Note:From dark green to light green: between –21°% and -10°%, white around -9°% and from light red to darkred between –2°% and 37°% income per hectare. Percentage changes with respect to Agenda 2000reference run.
4.4.3.6 Impacts on environmental indicators
Global Warming emissions are measured as CO2 equivalents and linked to mineralfertiliser use, methane emissions from ruminants and carbon dioxide linked to energy

Chapter IV University of Bonn - CAPRI
137
use. All these different Gases (methane, carbon dioxide and nitrous oxide) are weightedaccording to its global warming effect in the stratosphere43. The map below shows adecrease in global warming potentials compared to Agenda 2000 of -5%, due to a drop inproduction for cereals coupled with an expansion of set aside and fallow land, andreductions in cattle production (high methane emissions).
Nutrient balances are calculated in the model by considering mineral and organicfertiliser application rates, biophysical data at a regional level on atmospheric depositionof nitrogen, biological fixation of nitrogen (as percentage of crop uptake) and share ofminerals taken up by crop. By aggregating supply of nitrogen in the system and demandfrom crops, nitrate surpluses are calculated at regional level. Parallel to the drop ingreenhouse emissions, the implementation of the MTR Proposal implies an averagereduction of Nitrate Surpluses of -3.4% for the EU.
Map 4.4. Change in Global Warming Emissions of MTR run againstAgenda 2000
Note:From dark green to light green: between –11.72 % and –5 %, white around -4.3 % and from light red todark red between –2.82 % and 0.34 % (percentage changes with respect to reference run).
4.5. Conclusions
The proposal certainly leads to a higher market orientation of European farmers. Due toless coupled premiums, allocation efficiency increases with farming decisions closerlinked to market prices. Additionally, the proposal reduces scope and frequency ofmarket interventions as intervention prices are further reduced below expected averageworld market prices. However, a stronger European currency or temporary imbalances inworld markets could still provoke a built up of intervention stocks.
43 These coefficients are regularly updated by the Intergovernmental Panel on Climate Change (IPCC)
Chapter IV University of Bonn - CAPRI
138
The continuation of the CAP reform path of shifting from price to direct income supportfurther detaches budget outlays from market developments and stabilises the EAGGFbudget as direct support is bounded to value ceilings.
The results show a net economic benefit at EU level of 129 mio EUR compared to theAgenda 2000 reference run with almost stable agricultural income (-0.14% or –200 mio EUR measured as Gross Value Added plus premiums) and reduced budgetoutlays (-8.9% or -2468 EUR) mainly coming from modulation. Consumer welfare (-2139 mio EUR) decreases slightly.
It should be noted that increases in the area of crops now eligible for the uniformpremium, especially potatoes, negatively affect the income of producers specialised inthese crops as the market responds with lower prices. Higher cereal prices in the EUmarkets reduce slightly incomes for pig and poultry fattening farms. Income effects atfarm level depend further on the implementation of the payment scheme. Premiums fixedat farm level would probably lead to a picture quite similar to the one shown in here withuniform premium at regional level in combination with regional models. Uniformpremiums at Member State level would provoke a redistribution from more productiveregions – with higher historic yields and hence higher premiums per hectare - to lessproductive ones. Further on, the number of eligible hectares of arable land exceeds thecurrent area under COP payments. Hence, any scheme where the amount of payments isnot fixed at farm level could re-distribute premiums between farms. This effect becomeseven stronger with an identical premium for grass and arable land. Regional comparisonsshow that regions specialising in beef production often receive higher premiums perhectare of grassland than per hectare of arable land from the COP scheme. In thoseregions, an identical premium shifts support towards arable crops. Experience since theMcSharry reform shows that at least parts of the premiums are transferred into land rents– provoking distribution effects in between farmers, and between farmers and non-agricultural land owners depending on land ownership. An analysis of such incomedistribution effects goes however beyond the scope of the current analysis. Cuttingpayments at certain ceilings could however threaten economic viability of farms wherelarger parts of the current COP premiums cover the cost of land rent contracts.
The effect on structural change in the farming sector is not clear. The decoupling ofpremiums increases allocation efficiency, and hence could speed up farm size growth.However, certain parts of the proposal might countervail: (1) farm specific premiumceilings and (2) the exclusion of small farms from modulation and farm audits. Farm sizegrowth in combination with specialisation in production contributed in the past toincreased competitiveness and higher farm incomes. Farm size specific exemptions andceilings should therefore be considered carefully.
Even if the model does not feature back- and forward linkages with other sectors of theeconomy, it should be noted that both agricultural output in quantities and values as wellas input use are reduced (-3.2 % in value), somewhat affecting rural economic activitieslinked to agriculture, but counteracted by higher budgets for rural development under thesecond pillar resulting from modulation.
Reduced input use and smaller cattle herds contribute to some “greening effects”, asoutput of global warming gases and N,P,K surpluses decrease. Further positive effectscan be expected from mandatory farm audits proposed as part of the MTR package.Benefits for the environment from the simulated increase in idle land (26 %) are coupled

Chapter IV University of Bonn - CAPRI
139
to strict control measures to ensure that the land is indeed kept in “good agriculturalcondition”. The shift from rotational to stationary set-aside should increaseenvironmental viability.
However, the proposed scheme still deviates from a completely decoupled paymentsystem: not all crops are eligible for support, and durum wheat, rice, protein and energycrops still receive additional coupled premiums. Both facts question if the scheme couldbe defended in a new WTO round. Further on, even if administrative costs are clearlyreduced compared to the Agenda 2000 situation, farmers are still required to report yearlytheir crop allocation and even this simplification might be offset by the introduction ofmandatory farm audits.

Chapter IV University of Bonn - CAPRI
140
References
Commission of the European Communities (2002a): Mid-Term Review of the CommonAgricultural Policy, Communication from the Commission to the Council and theEuropean Parliament, 10.7.02, COM(2002) 394, Brussels.
European Commission Directorate for Agriculture (2002): Prospects for AgriculturalMarkets 2002-2009, Luxembourg: Office for Official Publications of the EuropeanCommunities.
European Commission Directorate for Agriculture (2000): Agenda 2000 CAP Reformdecisions - Impact Analyses, Luxembourg: Office for Official Publications of theEuropean Communities.
FAPRI-UMC Technical Data Report 01-02

Chapter V CWFS/CPB - CAPMAT
141
The CAP-reform Proposal
of the Mid-term Review:
Decoupling with strings attached
Centre for World Food Studies, Amsterdam (1) and
The Netherlands Bureau for Economic Policy Analysis, The Hague (2)

142
Chapter V CWFS/CPB - CAPMAT
143
EXECUTIVE SUMMARY
The Mid-term Review (MTR) has evaluated the agricultural policies of Agenda 2000, andproposes a series of adjustments in the commodity regimes. These measures are designed toimprove the competitiveness of cereals, and present a solution to the problems in the rye andrice regimes, where substantial surpluses are currently building up. The MTR also changesthe way in which support is being provided: area and animal premiums are replaced by ahistorical entitlement per farm and given as a transfer, independently from productiondecisions. Moreover, the payment is reduced gradually by a certain percentage, which istransferred to the rural development funds. Thus, the MTR reorients the support away fromproduction incentives to a mode that is compatible with the objectives of the EuropeanModel of Agriculture (EMA), which seek to maintain viability of the countryside, topromote animal welfare, to preserve nature and landscapes, and to enhance food safety andquality.
Yet, despite this decoupling, the support is subject to a variety of constraints andrequirements. First, farmers are only entitled to payments on given eligible land that coversthe major part of the arable crops and grassland. Second, farmers should maintain someform of management of the land that is not used for commercial production. Third, crosscompliance requirements place restrictions on the production method and intensity, to meetenvironmental goals and to enhance animal welfare. Thus, payment rights becomeconditional, and in fact turn into rights to subsidized production, with subsidy rates that areto a large extent harmonized across eligible crops. Fourth, these rights are further tied toland through restrictions on their transfer among farmers, which is only permitted jointlywith the transfer of land property. Finally, other restrictions limit the concentration ofpremium eligibility per hectare, and per farmer, as well as the eligibility of non-farmers. Inshort, the decoupling has many strings attached that re-couple the payments to cultivation.
The paper describes these decoupling and re-coupling mechanisms, and quantifies theireffect through scenario simulations with CAPMAT, a general equilibrium model of EUagriculture designed to evaluate CAP reform. A previous version of the model has been usedfor impact studies of Agenda 2000. The present version comprises supply models at memberstate level that incorporate the various conditions of the MTR-proposal and shows its impacton farm outputs, inputs as well as on the trade and budget of the EU.
The main finding from the scenario assessment is that the re-allocation effects of the reformare mitigated by the condition and the fact that the sugar and the dairy regime remain inplace. The response might, however, become stronger, if the eventual legislative text is moreflexible with respect to the tradability among farmers, and if quotas for sugar and dairy arerelaxed.
Over the years, the CAP has by and large maintained an anchoring on cropping patternsthrough a relatively fixed distribution of net revenues over major agricultural activities, so asto keep production patterns relatively fixed. The quotas on sugar and milk strengthen thisanchoring mechanism, which would be removed altogether under full decoupling. Thiswould increase output and price volatility but also permit faster restructuring. Theconditions of the MTR proposals effectively replace this anchor, and may also be engaged tomeet the objectives of the EMA .

Chapter V CWFS/CPB - CAPMAT
144
5.1. Introduction
In its Agenda 2000, the EU established a new set of policies. For agriculture, the Agendadetermines over a seven-year period of Financial Perspectives the budgetary ceilings ofagricultural policies and continued the earlier reforms. The decisions moved the CommonAgricultural Policy further into the direction of a system of direct support given through areaand head-age payments that gradually replaced the system of price support. Agenda 2000also stipulates that the CAP will be subject to a mid-term review (MTR), and aCommunication to this effect was issued in July 2002 (CEC, 2002). The review aims topresent a broad evaluation of the Agenda 2000, in particular of the progress made inpursuance of the objectives of the European Model of Agriculture (the EMA, see Fischler,2002), and more specifically the working of the major commodity market organizations(CMO). Based on this evaluation, a number of reform measures are put forward.
The MTR proposes various technical adjustments in the commodity regimes. Mostimportant among these are the lowering of the intervention price of cereals, withcompensation via higher area premiums. Rigorous steps are also taken to curb surpluses inrice and rye. The rye intervention regime is to be abolished completely, and the support priceof rice is halved, again with compensation payments, in anticipation of the expected increaseof imports from developing countries after 2005, and in response to the already high andrising stock levels. Payments for durum wheat, nuts, and dried fodder are modified. Optionsfor changing the dairy regime have been analyzed extensively, but substantive measuresmust await the completion of the adjustments under Agenda 2000 that runs until 2007.Similarly, the intervention regime for beef is maintained that now runs with support toprivate storage when the market situation demands it, triggered at the price levels set by theAgenda 2000 decisions.
The proposed adjustments would constitute a fairly normal change in the CMO of the CAPto accommodate market and budgetary pressures, were it not that the MTR comprises thenovel element of decoupling of the direct payments. Through this, the Commission reshapesthe mode of agricultural support much in the spirit of the U.S. with the FAIR Act of 1996.The basic aim is to give agricultural support in a way that does not affect production,primarily to ensure that it does not affect international trade, so as to gain its qualificationunder the Green Box of WTO, as opposed to the Blue Box where it currently resides. Thisclearly is a new and remarkable element of the MTR-proposals, on which this paper willfocus.
Specifically, the MTR proposes to consolidate, per farm, the area and head-age premiums ina certain base year into a single historical entitlement for support. While the current directpayments are linked in all detail to a specific crop or animal type of a certain age and gender,farmers will now enjoy almost unlimited “freedom to farm”, that is freedom to determinetheir preferred production patterns. Only the sugar beet under the subsidized quotas, thedairy cows, for which the quota system is continued, and fruits and vegetables are non-eligible for support. Yet, the proposal imposes further condition on top of these, relativelymild, eligibility constraints. Land should be kept in good agricultural condition(maintenance requirement) and production practices must obey environmental and animalwelfare requirements (cross-compliance requirements). Payment rights are thus tied to landmanagement requirements, and their incidence is still on a per hectare basis. Also, animalpremiums become in fact area premiums. Thus, there will be decoupling but not too much.In fact, full decoupling might be undesirable, as it would conflict with policies that seek to
Chapter V CWFS/CPB - CAPMAT
145
safeguard and promote the objectives of the EMA and typically impose restrictions onproduction methods and intensities.
Furthermore, the proposal recognizes that the historical entitlements can be seen as paymentrights, which might change hands, and can thus accumulate or leave the agricultural sector.It considers this an undesirable outcome, and by linking the payments to land transactions itseeks to avoid extreme concentration or outflow. This is understandable from a politicaleconomy perspective, as some might find it hard to defend a publicly funded buyout systemthat eventually pays a rent to any EU citizen as a sort of interest on treasury bonds, eventhough such buyouts are made every day. Therefore, these conditional payment rightsactually become production rights, which are only tradable jointly with land transactions.Specifically, they are rights to cultivate and sell in accordance with specified standards, upto a given maximum of support. Through the linkage to land, regional agronomic conditionsto a large extent will determine the production patterns. For example, sheep production willcontinue on Northern pastures that would presumably remain fallow if the payment rightswere fully tradable, but are now subject to cross-compliance constraints. Thus, as for almostany other type of support, it is hard to argue that the payments have no impact on productionand international trade.
Apart from the condition, payments are also subject to modulation. They are reduced bythree per cent every year and the proceeds are returned to the agricultural budget, to be usedin particular for rural development. Farmers with less than two workers, in full-timeequivalent, who receive less that 5000 EUR annually, are exempted from this reduction,with an additional franchise for every other worker. The proposal in this way meets one ofthe objections, often raised against the CAP that the bulk of the support is targeted to a smallminority of large farms. Thus, the modulation operation also contributes to the distributiveobjectives of the EMA.
We note that the principle of decoupling has its foundation in the welfare theoretic resultthat lump sum transfers are the best way to achieve distributive objectives without creatingdistortions. As payments that are purely based on past activities fall in this category, theyqualify as non-distortion measure in terms of the Agreement of Agriculture of the WTO. Buttheory also points out that this only holds when all markets are perfectly competitive (no useof entitlement to transfer as collateral for loans), and the new regulation comes by surprise(no announcement effect). Furthermore, the restrictions imposed to fulfill the EMA-objectives have welfare value of their own.
However, until the legislative texts are completed, it remains hazardous to give a preciseinterpretation of the MTR. It is clear that the direct payments become historical paymentsand thus (conditional) payment rights tied to land and although the linkage to (official) landtransactions is most likely, the tradability requirement has not been spelled out in full. Atany rate, the effectuation of this requirement will be problematic because many landtransactions, such as lease, rent, and share cropping contracts, do not pass the notary.
In short, as decoupling comes with many strings attached, and some of these are yet to bedefined, it is hard to predict the combined effect of all regulations. This also makes itdifficult to incorporate the proposals in a simulation model. In this respect, the CAPMAT-model used in our study has the advantage that its agricultural supply module at memberstate level has the form of a mathematical program, with explicit land balances, yields perhectare and animal, feed balances per animal type, including grass land. This makes itpossible to express, say, the conversion of animal premiums into hectare premiums for

Chapter V CWFS/CPB - CAPMAT
146
grassland, and to impose various eligibility and cultivation requirements of the MTR. Yet, asCAPMAT consists of national models and does not distinguish farm types, it can onlyaccommodate trade in land and payment rights in a simplified way.
The remainder of this report proceeds as follows. In section 2, to clarify how the conditioninteracts, and possibly interferes, with decoupling, we represent the regulations within aprogramming model of agricultural supply. Section 3 briefly describes the CAPMAT modeland the outcomes of a reference scenario. Section 4 discusses the implementation of theMTR and compares the outcomes with those of the reference run. Section 5 concludes.
5.2. Decoupling theory
Decoupling in its pure form refers to the idealized situation where support measures do notaffect production. Even a direct payment without condition can create distortions. This mayoccur because it affects the individual decision to stay in agriculture and to continueproducing (Rude, 2000, Benjamin, 1992). There may also be an announcement effectwhereby farmers anticipate on the information about future transfers being contingent onactual cultivation (Young and Westcott, 2000). Finally, the impact on the collateral value ofland (Phimister, 1995), and the income and insurance effects (see Hennessy, 1998) may besignificant. Nonetheless, such effects are seldom recognized as creating importantdistortions on international trade.
While the WTO in its Agreement on Agriculture requires that support should have "no, or atmost minimal, trade-distorting effects or effect on production" (Article 6 of the Agreementof Agriculture, WTO 1995), the agreement is not explicit on the meaning of "minimal".Within the WTO, support through direct transfers that are not linked to specific productstends to meet this requirement and hence to qualify for the Green Box classification.Various attempts have been made to make this concept work further. Cahill (1997) proposesa pragmatic definition that permits to test econometrically how much the support affectsproduction, and computes rates of decoupling for various EU support policies (see alsoOECD 2000) for an alternative definition).
To clarify the notion of decoupling and to introduce some of the complexities of the MTR,we now discuss how the measures enter a static micro-economic model of the farm. Thismodel is cast as a mathematical program that maximizes farm revenue of a single croppingseason, subject to technological and policy constraints. Annex I presents a series of suchprograms in order of increasing complexity.
In the first, most simple case (see also P.1 in Annex I) a farmer can cultivate his landaccording to a given production technology. The land resource is in fixed supply. The farmermay choose to leave it idling but if there is at least one crop with positive net revenue afterdeduction of all variable costs, this will not be optimal. He now chooses the cropping patternthat yields highest revenue. The transfer is fully decoupled: it is given on a per hectare basis,but without any maintenance requirements, hence on the fixed supply of land, be itcultivated or not. Since this is a constant, the payment does not affect the cropping pattern.Similar properties would apply for payments to any fixed factor, for instance also forimmobile labor.
As soon as payment rights become conditional on the fulfillment of specific requirements,they are no longer purely decoupled. Suppose (as in P.2) that a maintenance requirement isimposed. The farmer now faces a conditional payment right as he is only entitled to the
Chapter V CWFS/CPB - CAPMAT
147
payment if he also performs minimal management activities, say, keeping ruminants on apasture. He now has to decide how much land to leave idle and thus faces an additionalconstraint reflecting the maintenance requirement. This creates a rent that will affect the areaallocation if the constraint is binding.
Crop eligibility is the next policy element to be considered (in P.3). The proposal specifiesthat payment rights only hold for eligible crops. In the MTR this is a rather mild condition asmost of the arable crops (sugar beet can only be grown under quotas) and grassland areeligible, but the position of dairy cattle (also under a quota regime but grass-based) and thenon-eligibility of fruits and vegetables (the latter partly in rotation with arable crops) is acomplicating factor. Clearly, the payment subsidizes the other crops to the detriment of thenon-eligible crops, and thus affects the production pattern.
When we also consider the livestock sector (in P.4), the situation becomes morecomplicated, because the MTR converts the current head-age premiums into eligibilityrights on pastures. Since this is done on the basis of past production from ruminants of everyfarm, the hectare premiums may vary significantly among farms. Moreover, the(environmental) requirements on cattle farming translate into livestock density constraintson grassland. Finally, ruminants may serve to fulfil maintenance requirements of grassland,which translates into some sort of technological condition linking eligible croppingactivities, in particular those producing green fodder, to eligible livestock activities, inparticular ruminants, as in P.4. While such a condition lacks a clear interpretation andmaybe also motivation, it definitely does not decouple payments. Again, every suchrequirement creates a new constraint at farm level, that may carry its own rent and makes theallocation less decoupled.
The impact of decoupling is especially ambiguous for grass-based livestock activities. Weelaborate on this by considering a few situations that may be relevant in practice. First,suppose that a farm operates on grazing land that has no alternative agricultural use. In thiscase, the payments already were and remain largely decoupled. Apart from the dynamic(wealth) effects, production will be unaffected. Second, on a farm whose livestockpremiums are at their maximum, livestock ceilings and density requirements are likely toconstrain production in the pre-MTR situation.
After the release of these constraints, the farmer may now decide to expand the scale of hislivestock production, since it has become more attractive to supply green fodder, which nowreceives a production subsidy. This may actually be associated to an increase of the surfacesused for grazing and thus be compatible with extensification. Hence, despite its intention toachieve the opposite effect, the MTR may introduce a change that promotes a shift awayfrom arable crops to the favor of pastures. Clearly, cross-compliance conditions could limitthese effects by re-establishing ceilings on livestock densities, but these are not included sofar. Thirdly, decoupling might also lead to diversification, for instance inducing farmers tocombine extensive ruminant production with other (non-agricultural) activities, which maybecome especially attractive if zoning restrictions are relaxed, and more land is given a non-agricultural vocation. Also, for a farm with a high livestock intensity the area premiumwould be high and the farmer may then opt for renter behavior, cashing the payments whileonly fulfilling the bare maintenance requirements. In this case ruminant production will fall.Therefore, the interactions are complex and the effect on production is ambiguous and hardto predict.

Chapter V CWFS/CPB - CAPMAT
148
In a quantitative analysis at EU-level like the present one, the price effect will be seen todominate the outcomes, but the result could be different in an exercise for a smaller regionthat can account more explicitly for various environmental, demographic and socialcharacteristics of the farms under study.
Furthermore, the MTR introduces cross compliance as a general notion to preservelandscape values, and to meet animal welfare and environmental conditions. This might inpractice lead to a wealth of additional requirements, on top of the restrictions on area sharesand livestock densities. And therefore, the payments those are conditional upon them, andimposed in the implementation of the EMA, operate as subsidies on specified activities, tothe detriment of other practices.
Finally, the tradability of payments rights is an important issue. In the absence of otherconstraints, tradability improves efficiency, and decoupling. By contrast, the MTR linkstrade in payment rights to officially registered land transactions. This is to preventconcentration of rights among farmers as well as among regions and member states. Yet, asmentioned in the introduction, implementation of this rule is problematic because ofinformal transactions and sharecropping agreements. Also, for mixed farms, for grasslandunder "commonage" and for areas with rough grazing, concentration of payment rights on asmall part of the farm could become an attractive option.
We return to this point in the next section when we discuss implementation of the MTR, buthere it is important to note that every farm in the EU will in principle have a differentpayment right per hectare. Hence, the MTR enters uncharted territory, also for modeling asthis, and all the other highly farm-specific restrictions make it difficult to assess theproduction effects at national level, not to mention the difficulties in monitoring thesesubsequently.
5.3. Scenarios
The CAPMAT-model, the CAP Modeling and Accounting Tool that is used here forscenario simulation, incorporates the CAP rules and farmers' behavioral response to policychanges via agricultural supply models for every member state, embedded in a generalequilibrium framework.
This is a Revised Version of the model used earlier for the assessment of Agenda 2000proposals (CEC, 1998) and decisions (CEC, 2000). The major improvement as compared tothe earlier version is that the farm supply model now uses a more flexible specification ofthe mathematical program that can account for the various conditions. Also, unlike theprevious version that still drew on modules of the ECAM-model (Folmer et al., 1995),CAPMAT now operates as a stand alone model with its own modules, which nonetheless,closely follow the ECAM-specification. It covers the full agricultural sector, distinguishing40 activities per Member State, treats the non-agriculture sector in a highly stylized way, andlinks 14 national models (with Belgium-Luxembourg as one unit).
The model focuses on CAP market and price policies, and distinguishes prices at border,producer, market, and consumer level of the raw commodity. Commodities fall in one ofthree market regimes, depending on the applicable CAP regulation.
The first regime is that of strong CAP commodities, whose intra-EU prices followintervention prices, provided storage is possible. For simplicity, stock levels are kept fixed
Chapter V CWFS/CPB - CAPMAT
149
in the scenario simulations and we suppose that the full market surplus is actually exported,with subsidies when necessary.
The second regime is that of pigs and poultry, whose markets are to clear within the EU, forgiven net exports. This implies that supply follows consumption, and the intra EU-priceadjusts. In view of their limited international tradability, potatoes are also taken to fall undersuch a regime. The third is for tradable commodities whose price basically follows the worldmarket price. Permanent crops and oilseeds belong to this category.
5.3.1. Assumptions
The scenarios require assumptions on the growth of production factors in agriculture. Totalavailable agricultural land is taken to fall in accordance with a country-specific historicaltrend of around 0.3 per cent per year on average. Livestock is constrained by the livestockcapacity whose evolution also exhibits a modest decrease but is scenario dependent.
Yields per hectare and production per animal grow at rates that are considered technicallyrealistic and not exceeding current biological ceilings. Fertilizer use per kg and feedrequirements per animal are kept fixed. Hence, any technological progress is assumed to beembodied in the yield increase.
A reference or base scenario, with autonomous developments and unchanged policy, istaken as a reference against which the alternative scenarios that characterize the MTR arecompared. It can be described as follows.
World market prices are exogenous. For the short-term, up to two years, we use projectionsby the AIECE (2001). For the longer term, we make our own projections based on historicaltrends, and force a transition to the long-term trend over a period of 10 years. Theseprojections generally agree rather closely with those of the World Bank (2000), FAPRI(2001) and OECD (2001), which all portray a similar picture: a modest recovery after thehistorical low of around the millennium change. For oilseeds, it is assumed that the worldprice in real terms will in 2009 be higher than in 2003 (almost 6 per cent), which is similarto the difference for wheat (+7 percent). For both commodities, world market pricesdetermine domestic price ratios, and the oilseeds-wheat price ratio, which thus shows littlevariation, determines the ratio of the corresponding areas, which may, therefore, be expectedto be rather stable. However, coarse grains could disturb this picture as its price still isdetermined by the intervention price (falling in real terms, since nominally fixed) or, whenthe market is in autarky, by the domestic clearing price. This autarky regime occurs ifexports vanish, while imports are costly because of import tariffs.
World market prices are usually expressed in US Dollars, and thus the development of theexchange rate between dollar and euro is of importance. The euro has devaluated by some30 per cent since its introduction in 1999. Consequently, prices on the world market,expressed in euro have increased and this had a favorable impact on the EU-budget becauseit reduced the level of export subsidies. We keep the EUR-Dollar exchange rate fixed at onedollar per euro throughout the simulations. One major implication is that the EU wheat priceremains slightly below world market levels in most of the years of the simulation period, inparticular after 2004. This means that the growing exports of wheat can be sold on worldmarkets and that the ensuing downward pressure on world prices is insufficient to stop thecase of unsubsidized wheat exports. In view of the future demand of food and feed (FAO2002; Keyzer et al., 2001), this seems plausible.

Chapter V CWFS/CPB - CAPMAT
150
The development of the general domestic price level in the EU is also an importantdeterminant of agricultural income and EU-budget outlays. Since intervention prices and thepremiums are fixed in nominal terms, inflation means that real incomes deteriorate and thebudget improves. We have specified a modest inflation at a rate of 1.6 per cent per year upto 2005 and 1 per cent afterwards (FAPRI: 1.9 per cent, OECD: 1.8 per cent). Inflation isexpressed via the nominal price level of the non-agricultural commodity.
Current CAP-policies are in place: sugar and dairy quotas, mandatory and voluntary set-aside, and stabilizers on most budgetary outlays. This implies that when a reference area, aceiling on livestock numbers or a maximum guaranteed quantity number is exceeded, theper-unit premium is scaled down proportionally. In addition the scenario incorporates indetail the policies of the Agenda 2000 package on intervention prices, premiums, set-asideand quotas.
5.3.2 Scenario Outcomes
5.3.2.1 Volumes
Table 5.1 presents a summary of the developments of volumes of agricultural products inthe EU-15 as resulting from the reference run, referred to as base run. Starting year for thesimulation is 1999; in the MTR-run the reform measures will be introduced in 2004 and2009 is the last year of the simulation.
For most crops, a modest growth of total production is found with wheat somewhat morebuoyant due to its superior yield growth and better prospects on the world markets. Totalproduction of feed products decreases as the livestock sector as a whole stagnates due toweak consumer demand. Moreover, because of the yield increase per cow, the number ofdairy cows falls (the modest increase of the quotas does not reverse this). Since cows haverelatively high feed requirements for maintaining their metabolism, this reduction innumbers significantly reduces feed demand.
Specifically, milk production increases due to extension of quotas in 2005 by 1.5 per cent,while high relative profitability of milk production ensures that production fills the quotas.Growth in milk yields causes the dairy herd to decline, which has a negative effect on beefproduction because of the natural complementary abilities. In principle this could becompensated by an increase in the numbers of meat cattle, but the beef and veal sector isconfronted with sharp price cuts. The limited substitutability of grassland for other usewithin agriculture prevents strong adjustments in production. In the period 2000-2004 beefproduction declines by 300 thousand t to recover in 2009 to the level of the base year. Thelower prices trigger a modest increase in consumption, which is a break with the decliningtrend of the past years. The growth of consumption of pig meat and poultry is modest aswell, but still stimulated by a real decline in prices of about 1 à 1.5 percent per year.Typically for these products, since the options for trade are limited, production growthequals consumption growth.

Chapter V CWFS/CPB - CAPMAT
151
Table 5.1. Base run: average annual growth of volumes, EU-15, over the period1999-2009 (percentage)
Wheat 1.7 0.7 0.2 of which: durum wheat 0.9
Coarse grains 0.2 0.8 1.4 of which: rye 0.1
Rice 0.7 0.7 -0.4
Vegetable oils and fat 1.0 0.4 -1.2
Protein feed 0.7 -1.7
Carbohydrates -1.1 -3.4
Milk: fat component 0.2 0.7 -1.6
Milk: protein component 0.2 0.8 -1.9
Beef & veal -0.1 0.3
Pig meat 0.6 0.6
Poultry 0.8 0.9
Production Consumption Feed use
Keeping the CAP subsidies fixed in nominal term means that the relative profitability ofcrops can only change little, preventing a substantial reallocation in areas. Table 5.2 showsthe results for the areas of competing crops.
The area under grassland and fodder plants decreases faster than total area, which is in linewith past trends. Furthermore, changes in area allocation are minor, but hide largervariability at member state level. The largest change in area is found for sugar beets, whichis caused by the fact that sugar production is constrained by quota and yields increase.Fallow land, which mainly occurs in Spain and Portugal, refers to fallow land other than theset-aside schemes, and has been "endogenized" to reflect additional land outflow whenprices fall or support is decoupled. Total COP-area decreases at about the same rate as thetotal availability of agricultural land.
5.3.2.2 Trade
Small differences in the developments of domestic use and domestic supply lead to largerdifferences in the volumes of external EU-trade. Table 5.1 already indicates that exports ofwheat will increase and exports of coarse grains will decrease. For most products a decreaseof the volume of net exports is observed. In the case of butter (which can be derived byapplying a fixed transformation coefficient to milk fat), the EU turns into a net importerwhereas it was a modest exporter before. Similarly, exports of cheese and SMP can becomputed, which are then declining but at a slow rate.

Chapter V CWFS/CPB - CAPMAT
152
Table 5.2. Base run: cultivated areas (mio ha) and average annual change,1999-2009 (percentage)
Wheat 17.8 18.3 0.3 of which: durum wheat 3.6 3.8 0.4
Coarse grains 20.9 19.3 -0.8 of which: rye 1.7 1.6 -0.6
Rice 0.4 0.4 0.6
Pulses 2.3 2.6 1.3
Potatoes 1.6 1.6 -0.2
Sugar beets 2.1 1.9 -1.1
Oilseeds 4.9 4.8 -0.1
Grasses and grazings 51.6 49.3 -0.5
Fodder plants 12.6 12.0 -0.5
Mandatory set-aside 3.8 3.8 0.0
Voluntary set-aside * 2.0 2.0 0.0
Fallow land 5.9 6.1 0.4 COP-area 54.2 52.9 -0.3 Total area 148.3 144.3 -0.3
rate1999 2009 Annual growth
* Note: voluntary set aside is specified "exogenously" in the base run.
Table 5.3. Base run: net exportable surplus, EU-15 (mio t) and average annualchange, 1999-2009 (percentage)
Wheat 22.2 37.2 5.3
Coarse grains 8.9 -0.8
Vegetable oils and fat -6.2 -5.8 -0.7
Protein feed -11.7 -9.1 -2.5
Carbohydrates -8.5 -5.0 -5.2
Milk: fat component 0.1 -0.1
Milk: protein component 7.1 6.4 -1.0
Beef & veal 0.2 0.1 -4.4
rate1999 2009 Annual growth
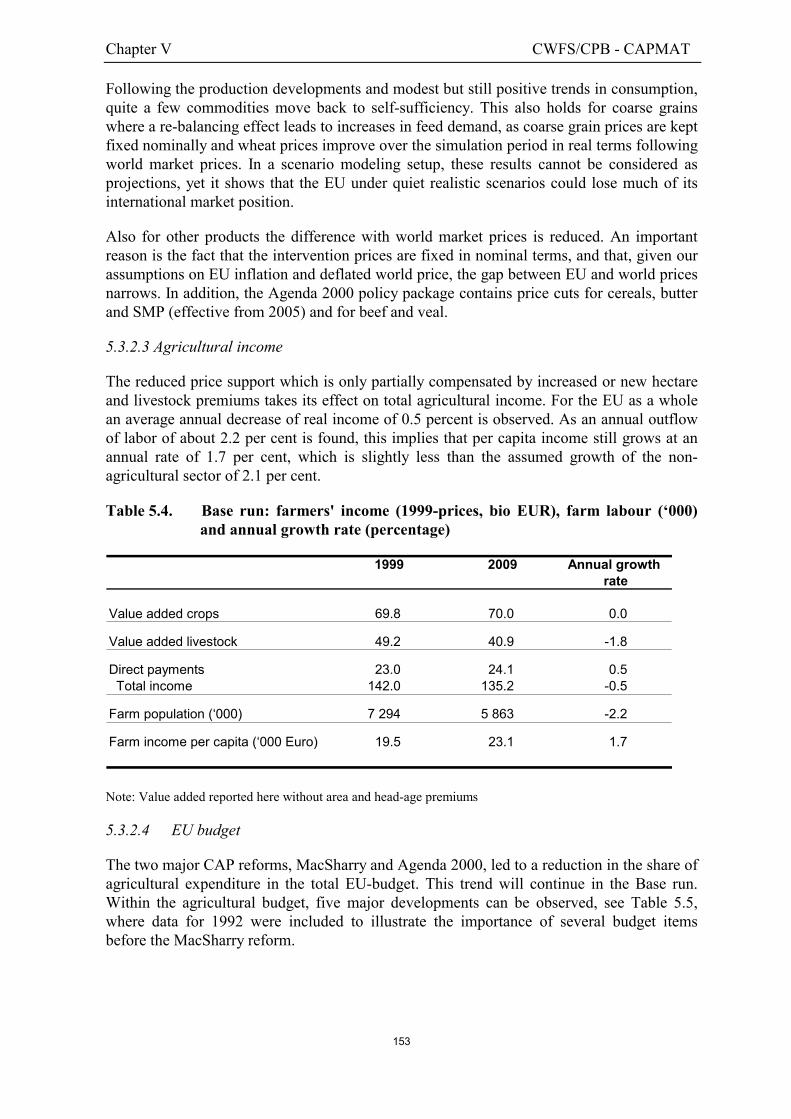
Chapter V CWFS/CPB - CAPMAT
153
Following the production developments and modest but still positive trends in consumption,quite a few commodities move back to self-sufficiency. This also holds for coarse grainswhere a re-balancing effect leads to increases in feed demand, as coarse grain prices are keptfixed nominally and wheat prices improve over the simulation period in real terms followingworld market prices. In a scenario modeling setup, these results cannot be considered asprojections, yet it shows that the EU under quiet realistic scenarios could lose much of itsinternational market position.
Also for other products the difference with world market prices is reduced. An importantreason is the fact that the intervention prices are fixed in nominal terms, and that, given ourassumptions on EU inflation and deflated world price, the gap between EU and world pricesnarrows. In addition, the Agenda 2000 policy package contains price cuts for cereals, butterand SMP (effective from 2005) and for beef and veal.
5.3.2.3 Agricultural income
The reduced price support which is only partially compensated by increased or new hectareand livestock premiums takes its effect on total agricultural income. For the EU as a wholean average annual decrease of real income of 0.5 percent is observed. As an annual outflowof labor of about 2.2 per cent is found, this implies that per capita income still grows at anannual rate of 1.7 per cent, which is slightly less than the assumed growth of the non-agricultural sector of 2.1 per cent.
Table 5.4. Base run: farmers' income (1999-prices, bio EUR), farm labour (‘000)and annual growth rate (percentage)
Value added crops 69.8 70.0 0.0
Value added livestock 49.2 40.9 -1.8
Direct payments 23.0 24.1 0.5 Total income 142.0 135.2 -0.5
Farm population (‘000) 7 294 5 863 -2.2
Farm income per capita (‘000 Euro) 19.5 23.1 1.7
1999 2009 Annual growth rate
Note: Value added reported here without area and head-age premiums
5.3.2.4 EU budget
The two major CAP reforms, MacSharry and Agenda 2000, led to a reduction in the share ofagricultural expenditure in the total EU-budget. This trend will continue in the Base run.Within the agricultural budget, five major developments can be observed, see Table 5.5,where data for 1992 were included to illustrate the importance of several budget itemsbefore the MacSharry reform.

Chapter V CWFS/CPB - CAPMAT
154
Table 5.5. Base run: EU-budget, in nominal prices (bio EUR)
EU-budget 58.9 79.7 116.9
Agriculture 32.1 39.9 44.5
CAP (excl. rural development) 32.1 37.3 39.3
Export refunds 9.5 6.1 2.3
Area and headage premiums 23.0 28.0
Other FEOGA outlays 6.7 7.1
Storage cost 5.3 1.6 1.9
Rural development 0.0 2.6 5.0
1992 1) 1999 2009 2)
1) Budget for EC-12, amounts are in bio ECU.2) EU-budget and rural development based on Financial Perspectives, kept at level of 2006 in real terms.
First, the combination of a falling gap between world market prices and internal EU-pricesand decreased exports makes for a significant fall in export subsidies. The EUR/US Dollarrate shows up as a key element in the price difference. Second, total expenditures on directsupport in 1999 have surged due to the MacSharry reform but the rise of the new premiumsunder Agenda 2000 has only a relatively minor effect. This is essentially because referenceareas, stabilizers and budgetary ceilings are effective means to constrain budget outlays. Ifactivities fall below their maximum, direct payments may even drop. The total of premiumsstill rises between 1999 and 2009 due to the implementation of the Agenda 2000 decisions,to compensate for the price cuts for cereals, beef and dairy. Third, in the early ninetiesintervention purchases were needed for surplus disposal, causing rising storage costs. Sincethe MacSharry reform, the problems with high stocks and the accompanying costs areresolved. We have noted that stocks are kept constant in the simulations, as all surpluses aresupposed to exported within the year, with rice as only exception, where the implication ofthe EBA agreement is taken into account. Fourth, CAP market measures and directs aids in2009 are still below the ceilings set in the Financial Perspectives 2000-2007, but the cost ofpremiums for the new EU members is not considered here. Finally, within the CAP a shiftcan be observed from the traditional market policy to rural development policy. The effectsof this shift of funds towards the second pillar on production, productivity and factor inputare not considered in the model, as there is little evidence on the magnitude of these effects.
5.4. The MTR scenario
Since the MTR links the decoupled premiums to land, the payments still operate as flat areapremiums or a combination of lump sum transfers with a (lower) flat area premium. Thisprinciple provides the basis for the implementation of the MTR-scenario within theCAPMAT-model, and since the producer model in CAPMAT also is a mathematicalprogram, there is in this respect no gap between principles and practice.
However, the producer model in the CAPMAT application is more involved than thetheoretical models for two reasons. First, it considers 14 national farms that produce crops

Chapter V CWFS/CPB - CAPMAT
155
as well as livestock. This introduces various interactions, in particular because under theMTR pasture and roughage land become eligible for premiums, but with a maintenancerequirement for which grazing by ruminants would be the natural mode of operation.
Secondly, the heterogeneity of farmers is to be accounted for, since due to the linkage intrade of payment rights to land transactions, the current vocations will only change slowly.In a national farm model, the replacement of current area premiums by a flat area paymenton eligible crops would amount to assuming immediate adjustment with free, unlinked tradein payment rights. However, as the trade is linked to land transactions, and in practice, lessthan 5 per cent of total land changes hands annually, fast adjustment is excluded.
Specifically, the "degressivity" in payments implies that COP area will fetch a lower areapremium, while grassland that previously only received the premium via the ruminantsgrazing on it now also becomes eligible directly. Yet, for the individual farms with a highdegree of specialization, the changes are far less pronounced. For example, on an arablefarm growing COP crops only, nothing changes in the short run, as the payment rightsremain on the farm and the scope for venturing into new crops is limited. Similarly, thepasture-based sheep or cattle farm will receive the former animal premiums in the form ofarea premiums and has no incentive to change its ways.
The heterogeneity of farms is represented in CAPMAT by insertion of additional constraintsthat limit deviations in the premium payments over the eligible activities. The constraintscan be interpreted as budgetary flexibility constraints, which place bounds on thedistribution of premiums over eligible activities. Such bounds are imposed for COP-cropson the one hand, and grassland on the other, where sheep and cattle must take a specifiedminimal share out of the total grassland payments.
We note the physical aspects of heterogeneity already enter the aggregate model through thelimited substitutability between activities, while the flexibility bounds reflect the specificelements of the non-tradability of payment rights. It would be desirable to validate our farmmodel that is specified at national level on the basis of farm specific information but this isbeyond the scope of our study. Therefore, the tightness of the flexibility constraint had to beestablished on the basis of numerical experimentation, and remains arbitrary to some extent.
5.4.1. Scenario implementation
Once the constraints that reflect the conditions are in place, parameter values can beassigned in the actual implementation of the MTR-scenario, which takes place in a series ofsteps.
Specific adjustments must be made in the CMO. The intervention price of cereals is loweredby 5.88 per cent with a partial compensation in area premiums. The premium is now 63EUR per ton times the regional yields and becomes 66 EUR per tonne. Rye intervention isabolished, the rye prices are taken to fall by some 40 per cent to reach world market level,and the rye area to decline sharply to the benefit of other coarse grains, in particular barleyof the same quality. The intervention price of rice is halved. This will only have a modestproduction effect, since most paddy fields are irrigated or located in swampy deltas and haveno alternative use. The paddy is expected to return to the level of early nineties, when thestrong increase in area planted started.
There are also some minor adjustments in the remuneration for dried fodder and nuts, whichwill not affect area allocations, since ceilings on guaranteed area or quantities are effective.

Chapter V CWFS/CPB - CAPMAT
156
Durum wheat premiums are scaled back to 250 EUR/ha and apply now to the traditionalareas only. A quality premium of 15 EUR/t is added, but ignored in the implementation, asthe precise quality requirements were not stated as yet. Sugar quotas remain in place anddairy quotas follow what has been agreed under Agenda 2000. Payments for dairy cows areunaffected by the MTR.
As discussed earlier, the MTR-decoupling comes with eligibility restrictions and condition,and the decoupled payments can to some extent still be considered to operate as areapremiums.
When implementing the scenario we assign part of the payments as area premiums and partas lump sum transfers. The historical entitlements are based on the base run model resultsfor 2003, after re-computing the new MTR area and head-age premiums while excluding themonthly increments for cereals in both scenarios. The entitlements are divided by theeligible area, which results in an EU-average flat area premium of about 220 EUR perhectare. These flat premiums vary by Member State. They are split according to a singleshare into a flat area premium (with a top up for durum wheat to match the MTR proposal)and lump sum transfers. This division matters for the results and was subject of somesensitivity analysis. Under the MTR conditions, however, through the eligibility conditions,the presence of sugar and dairy quotas, and the fact that COP area premiums were alreadyharmonized over the regions, the outcomes appear to be fairly robust with respect to thisassumption. Hence, we do not present the results from the variants.
The constraints on decoupling are implemented by means of two eligibility constraints, onefor arable crops (excluding the sugar beet under the quotas, fruits and vegetables andpermanent crops) and one for grassland, and two budgetary flexibility constraints. Theeligibility constraints also account for the fact that some farmers do no qualify for supportand that some very large farms with direct payments over 300 000 EUR are capped.
Flexibility constraints ensure that the constraints on individual farms find expression in thenational model. The bounds on the eligible area are initialized at their base year level (minus10 per cent, to reflect that initially the imposed condition cannot be expected to have fullcompliance). Eligibility constraints decrease at the same rate as the total area, while theinitial reduction is eliminated.
Furthermore, the decline in total farm area, which can be seen as outflow to non-agriculturaldestinations must also be taken to apply to the eligible area, since the payments are linked tothe land on which they were given, and we assume that the eligible area falls at the same rateas the total. Consequently, a significant fraction of total payments (some 25 per cent) stillacts as premiums on sheep and goats and non-dairy cattle via the grassland payments.
The modulation and the franchise are derived from FADN data on farm structure. Wecalculate per Member State the share of farm income that is exempted from modulation.This share is kept fixed over the simulation period. Funds that are released by modulationfill the rural development funds, and are taken not to return to farmers, which might not berealistic and cause underestimation of income from farming.
The MTR abolishes the stabilizers of the CAP. This holds for the stabilizer on outlays tobeef and sheep (when animal stocks exceed their ceiling, head-age premiums are scaledback proportionally). It also holds for the reference area of the COP crops.
Chapter V CWFS/CPB - CAPMAT
157
Hence, mandatory set-aside can no longer be maintained. Instead the mandatory set-asidearea is replaced by non-rotational environmental set-aside, which is kept constant over thesimulation period. Also the area for voluntary set-aside is kept constant. Yet, it is expectedthat farmers will still find idling an attractive option, and this is represented by the"endogeneity" of fallow land. Under the MTR scenario, this fallow land increases faster thanunder the base run, due to the decoupling effects, by some 0.5 mio ha in 2009. This can alsobe interpreted as an increase of the voluntary set-aside or as abandonment.
We include the energy crops program, which seems to be an attractive option, phasing it in"exogenously" to reach almost 0.7 mio ha in 2009. This is less than the industrial oilseedsarea since the bonus is lower (45 EUR/ha) and the arrangement requires contracts withprocessors.
Fruits, vegetables and horticulture are not eligible for support both before and after theMTR, and as discussed earlier, this might create some (distortion) incentive to limit theirareas in the pre-MTR situation. However, the MTR is unlikely to generate a significantexpansion, since horticulture is generally not seen as competing with field crops, because ofits higher capital and labor intensity, and the fact that its products tend to be demandconstrained. Permanent crops are not likely to show a pronounced reaction to the short runchanges in the CAP. Yet, some substitution effect is likely to take place in practice, which isneglected in our scenario-run.
Finally, since decoupling is motivated by efficiency considerations, we allow for anexpansion of the scope of farming activities. For this, we assume that the decoupling willpermit more non-agricultural use of agricultural land, through tourism-related activities andpossibly less restrictive zoning rules. This expands agricultural land devoted to theseactivities from 72 thousand ha in the base run to 282 thousand ha in the MTR-scenario.
The MTR scenario operates under an exogenous assumption on livestock capacity and laborproductivity. Partial decoupling leads to diversification of investments and since there are noessential changes in the quotas and set-aside schemes, we may expect agriculturalinvestments to fall, which leaves less capacity for the livestock sector, that consequently hasa lower growth rate in the MTR scenario.
As decoupling also broadens employment opportunities, we also assume an increase in laborproductivity in the MTR scenario, which also amounts to faster labor outflow.
5.4.2. Scenario outcomes
5.4.2.1 Volumes
The MTR scenario shows modest changes in production over the simulation period, seeTable 5.6. Policy effects are mitigated by the eligibility and flexibility constraints and alsobecause a considerable part of the non-eligible crops are permanent or belong tohorticulture, which are treated as non-substitutable with arable crops. The reform causeswheat, coarse grains and oilseeds to lose due to more fallow, energy crops, and the slightsubstitution in favor of grassland. The rye reform is implemented but it hardly has any effecton the total, since rye can be replaced by other low yielding varieties of coarse grains thatare still eligible for intervention.

Chapter V CWFS/CPB - CAPMAT
158
Table 5.6. EU-15 production in 2003 and 2009 (mio t)
Wheat 104.9 121.2 112.0 of which: durum wheat 11.0 11.3 9.8
Coarse grains 113.0 109.4 108.3 of which: rye 9.1 8.4 4.5
Rice 1.6 1.7 1.2
Vegetable oils and fat 7.9 9.3 8.8
Protein feeds 3.1 3.7 3.6
Carbohydrates 12.4 11.4 11.3
Milk: fat component 4.8 4.9 4.9
Milk: protein component 110.1 111.2 111.4
Beef & veal 7.7 8.0 7.5
Pig meat 17.0 17.5 17.5
Poultry 8.5 8.8 8.8
MTRBase2003 2009
It is important to note that the limited effect on coarse grains is due to the fact that thismarket reaches autarky towards the end of the MTR scenario, which causes internal prices torecover, as imports are penalized prohibitively through tariffs. Because of this, the coarsegrains price in 2009 is higher than in the base run, which explains that after the initial dropin 2004 the coarse grains area regains some of its lost area share.
The combination of the adjustment in set-aside area, the introduction of energy crops, theoverall fall in total area, the substitution with grass land, and the autonomous productivitytrends, makes that the crop allocation changes are not easily traced back to simple pricetrends.
In fact, it appears that grassland and fodder plants area gain somewhat at the expense ofCOP-area. The gain is limited but noticeable, nonetheless, and attributable to the premiumon grassland. Total area cultivated also declines more than total area available. The changeis modest, and reflects that with the lowered area premium some land (for instance inFinland) will be left idle. A similar effect is seen through the increase in fallow land, whichexceeds the base run level by 8 per cent in 2009.

Chapter V CWFS/CPB - CAPMAT
159
Table 5.7. Cultivated areas EU-15 in 2003 and 2009 (mio ha)
Difference (%)
Wheat 17.5 18.3 17.0 -8 of which: durum wheat 3.8 3.8 3.3 -4
Coarse grains 21.0 19.3 18.6 -4 of which: rye 1.7 1.6 0.9 -45
Rice 0.4 0.4 0.3 -26
Pulses 3.0 2.6 2.9 10
Potatoes 1.6 1.6 1.6 2
Sugar beets 2.0 1.9 1.9 1
Oilseeds 4.0 4.8 4.4 -8
Grasses and grazings 50.8 49.3 49.7 1
Fodder plants 12.4 12.0 11.8 -1
Mandatory set-side 3.8 3.8
Environmental set-aside 3.8
Voluntary set-aside 2.0 2.0 2.0
Fallow land 5.8 6.1 6.6 8
Energy crops 0.7 COP-area 53.6 53.5 50.9 -4 Total area 146.7 144.3 144.1 0
MTR200920092003
Base
Note: voluntary set aside is specified "exogenously".
In all, changes in the area allocation are minor, which is in part due to the short time horizonof the simulation and also a consequence of the linkage maintained via the variousconditions. As yields are exogenous, and sugar and milk quotas are maintained, this alsoimplies that changes in production are small.
Since only cereal (including rice) prices change significantly, the effects on consumption aresmall and the impacts on trade are minor as well and only wheat shows marked effects, thatdetermined by the committed gross and net trade flows (which apparently add up to -0.8 miotonne). It may be noted that after decoupling the regional reference areas for high-yielding(irrigated) maize may no longer be binding, and that maize production will increase, makingthe EU again net exporter. This has also policy implications, as the policy aims for the maizeregime may be lost under the MTR. Our model with only national reference areas andnationally averaged maize yields does not reflect these aims. Finally, we note that under theMTR the EU becomes a small net importer of beef again, which is fully caused by the dropin production.

Chapter V CWFS/CPB - CAPMAT
160
Table 5.8. Net exportable surplus, EU-15 in 2003 and 2009 (mio t)
Wheat 17.8 34.3 25.7
Coarse grains 8.3 -0.8 -0.8
Vegetable oils and fat -6.9 -5.8 -6.2
Protein feeds -11.0 -9.1 -9.3
Carbohydrates -5.7 -5.0 -5.0
Milk: fat component 0.06 -0.06 -0.06
Milk: protein component 8.1 6.4 6.8
Beef & veal -0.2 0.1 -0.1
Base MTR2003 2009
5.4.2.2 Agricultural income
Table 5.9. Agricultural income EU-15 (1999-prices, bio EUR) and farm labour(‘000)
Difference (%)
Value added crops 68.0 70.0 71.2 1.8
Value added livestock 44.1 40.9 40.9 0.0
Direct payments 24.0 24.1 22.8 -5.2 Total income 136.2 135.2 136.2 0.8
Farm population (‘000) 6 689 5 863 5 720 -2.4
Farm income per capita (‘000 Euro) 20.4 23.1 23.8 3.3
Base MTR2003 2009 2009
Note: Value added reported here without area and head-age premiums
The fact that premium outlays are not being curtailed in the short run implies, jointly withthe small effects on volumes and prices that farm incomes vary little between the base runand the MTR, as shown in Table 5.9. Yet, some efficiency effects can be pointed to,especially in the crop sector where, with slightly less land, income rises with slightly overone bio EUR (1999 prices). This also includes the revenues due to the assumption in theMTR scenario that more freedom for farmers offers them to undertake non-agriculturalactivities such as tourism.
Prices for pig meat and eggs rise somewhat (almost two per cent) but poultry prices fall by asimilar amount, so that the net effect on value added from livestock activities happens to bezero. Finally, total direct payments are seen to decline, due to the modulation from 2004

Chapter V CWFS/CPB - CAPMAT
161
onwards. Another cause is the assumption that payments leave the sector when agriculturalland leaves agriculture.
In sum, the effect is that outlays for direct support decrease by about one percent per year,see Table 5.10.
Table 5.10. Selected FEOGA items, 1999-prices (bio EUR)
Difference (%)
Refunds on trade 3.6 2.0 1.9 -4Direct support 24.0 24.1 22.8 -6
Base MTR2003 2009 2009
5.4.2.3 Welfare comparison
We perform a welfare comparison on the basis of equivalent variation (see Annex II for thedefinition of concepts used). Between the base run and the MTR scenario we have assumedidentical development of non-agricultural value added. Hence, no change in this componentcan be recorded. As can be inferred from Table 5.9, the MTR scenario shows a gain inagricultural income of 1.01 bio EUR, despite a fall in direct support for agriculture of1.24 bio EUR. The latter is a gain for the taxpayers. A further gain for the taxpayers, of30 mio EUR, is due to reduced price subsidies, such as the export refunds. Conversion tobase run prices (the “price effect”) amounts to a small negative correction.
Table 5.11. Welfare comparison EU-15 in 2009, 1999-prices (bio EUR)
MTR welfare gains
Equivalent variation 2.23
Agricultural income 1.01
Reduction tax payments 1.27
Price effect -0.05
5.5. Conclusion
The Communication on the MTR enriched the existing CAP-apparatus with the newelement of decoupled payments under conditions of various sorts. Whereas pure decouplingthrough lump-sum payments is a straightforward concept in theory, in the practice of theCAP its full implementation is problematic because this would cause European agriculture,that was so far firmly anchored through dairy and sugar quotas and harmonized premiums,to break adrift.
We have analyzed the theoretical and numerical implications of the various rules andconditions imposed under the MTR and found that one by one, they create new anchors,some light, other heavier. First, the tying of the trade in payment rights to official landtransactions presumably is the heaviest of all, since in large parts of the EU this effectivelylinks payment rights to specific outputs such as sheep and beef. Second, there is condition

Chapter V CWFS/CPB - CAPMAT
162
via cross compliance; although the specific details have not been published yet, it seemslikely that livestock densities will have to be introduced; animal welfare will constrainfarming practices and limit the transport of live animals. Third, the modulation withfranchise could induce farmers to adjust the scale of their operations in order to remainbelow the thresholds. Finally, there is the condition via the crop eligibility. This is probablythe weakest anchor, as 80 per cent of agricultural land is eligible, but it nonethelesspenalizes the important alternative of cultivating vegetables on arable land.
In this report, we have only studied the effects until 2009, which is far too short to identifythe long-term implications of the proposed reform. Looking farther ahead would be difficult,because the MTR introduces significant changes, especially in the grass-based livestocksector. In the short to medium term, the effects of these changes are mitigated by thecontinued presence of dairy quotas. These capture much rent and keep the number of dairycows on a mildly downward trend in response to increased yields per animal, but otherwisemaintain a relatively stable composition of a large fraction of the cattle herd associated to itthrough livestock demography, and even controls the numbers of other ruminants on thepastures. Especially in regions with mountain farming, rough grazing or less favored areas,where the link between livestock intensity and grassland is hard to establish, the presentMTR regulations might in the long run offer scope for concentration of payment rights,which would be conducive to further intensification. For the crop sector, the exclusion ofhorticulture and permanent crops is bound to have longer term effects, and the same holdsfor the substitution possibilities between starchy (eligible) and consumable (non-eligible)potatoes. Since entitlements are defined on a historical basis and per farm, the premium perhectare will be different between every pair of farms, and over time, after land transactionshave taken place, even within farms. Whether the aims of the EMA will be achieved throughthe MTR very much depends on the details of the legislative texts, especially, on thetightness of the cross-compliance requirements, and the reliability with which theireffectuation will be monitored.
In sum, for the short to medium term the old anchors of stable net revenues are still beingpreserved under the MTR, this time not via administered prices and stock keeping, but viacondition, eligibility, limited tradability of payments rights, and by the decision to postponethe elimination of the considerable quota rents in the sugar and dairy regimes. In the longerterm, policies moving towards a higher degree of decoupling will relax the quotas, andbroaden the eligibility. This will increase the efficiency of agriculture, but possibly alsocreate new output and price volatility. And clearly, the EU enlargement will have an impactthat dominates all others.
Finally, it must be mentioned that the heads of state at their special meeting in Brusselsagreed to freeze the ceiling on expenditures on CAP market measures and direct aids until2007 and to let it increase by 1 per cent until 2013. Since the agreement is made specificallyfor the ceiling on expenditures and not for the actual outlays (which are 2.6 bio lower for thedraft 2002 budget), this creates some room for the phasing in of the direct payments of theCandidate Countries after 2004. The most recent proposal to shift resources from thestructural funds to the additional funding of direct payments would create even more room,and the rationale of such a proposal becomes greater when payments are more decoupled.Yet, new policies that would be necessary to complete the decoupling, in particular for sugarand dairy, and the various other CMO scheduled for review, may also lead to changes thatdraw on the budget. Upcoming international negotiations will also create pressure forchange. Although the progress reported so far on the Doha agenda of the WTO is modest,the incentive to shift as much support as possible to the Green Box seems obvious and
Chapter V CWFS/CPB - CAPMAT
163
decoupling is essential for this. Similarly, and despite its limited impact so far, theEverything-but-Arms agreement could also become instrumental in forcing further accessfor sugar imports, as the least-developed countries have been granted duty-free access ongradually increasing import quotas. Thus, the recent agreement has fixed the budgetary roomfor CAP-reform, which is yet far from complete. The signal to the farm sector is that it willhave to rely on new sources of revenue in the future, in particular by developing itsmultifunctional services and by promoting further product differentiation.

Chapter V CWFS/CPB - CAPMAT
164
ReferencesAIECE (2001), ‘World Commodity Prices 2001 - 2003’, Working Group Report.
Benjamin, D. (1992), ‘Household composition, labor markets and labor demand: testing forseparation in agricultural farm-household models’, Econometrica, 60: 287-322.
Cahill, S.A. (1997), ‘Calculating the rate of decoupling for crops under CAP/oilseedsreform’, Journal of Agricultural Economics, 48: 349-378.
CEC (1998), ‘CAP reform proposals. Impact Analyses’, CAP reports, October 1998, CEC(DG VI), Brussels.
CEC (2000), ‘Agenda 2000. CAP reform decisions. Impact Analyses’, CAP reports,February 2000, CEC (DG Agriculture), Brussels.
CEC (2002), ‘Communication from the Commission to the Council and the EuropeanParliament. Mid-term Review of the Common Agricultural Policy’, COM(2002) 394final, Brussels.
FAO (2002), World agriculture: towards 2015/30. Summary Report. FAO, Rome.
FAPRI (2001), ‘U.S. and World Agricultural Outlook 2001’, CARD, Iowa
Fischler, F. (2002), ‘Sustainable agriculture for Europe’, Speech NFU Annual Conference,London.
Folmer, C., M.A. Keyzer, M.D. Merbis, H.J.J. Stolwijk, & P.J.J. Veenendaal (1994),‘Common agricultural policy reform and its differential impact on member states’,European Economy, 4-1994.
Folmer, C., M.A. Keyzer, M.D. Merbis, H.J.J. Stolwijk, & P.J.J. Veenendaal (1995), TheCommon Agricultural Policy beyond the MacSharry Reform. Amsterdam: North-Holland.
Ginsburgh, V., & M.A. Keyzer (1997/2002), The structure of applied general equilibriummodels. Cambridge MA: MIT Press (2002, pocket edition).
Hennessy, D.A. (1998), ‘The production effects of agricultural income support policiesunder uncertainty’, American Journal of Agricultural Economics, 80: 46-57.
Keyzer, M.A., M.D. Merbis & F. Pavel (2001), ‘Can we feed the animals? Origins andimplications of rising meat demand’, SOW-VU Working Paper 01-05, Centre forWorld Food Studies, Amsterdam.
OECD (2000), Decoupling: a conceptual overview. Paris, OECD.
OECD (2001), Agricultural Outlook 2001 - 2006, Paris, OECD
Phimister, E. (1995) ‘Farm household production in the presence of restrictions on debt:theory and policy implications’, Journal of Agricultural Economics, 46: 371-380.
Rude, J. (2000), ‘An examination of nearly Green programs: case study for Canada’,American Journal of Agricultural Economics, 82: 755-761.
Young, C.E. & P.C. Westcott (2000), ‘How decoupled is the U.S. agricultural support formajor crops?’, American Journal of Agricultural Economics, 82: 762-767.
Varian, H.R. (1984), Microeconomic Analysis, second edition, Norton, New York.
World Bank (2000), ‘Global Commodity Markets’, World Bank, April 2000.
Chapter V CWFS/CPB - CAPMAT
165
ANNEX I. Models for Decoupling
Some notation is needed. For expositional reasons, only a crop allocation model isconsidered, where it is assumed that capital and labor are un-constraining (explained outsidethe allocation) and that agricultural land is the fixed resource.
K capital
L labor
A agricultural land resource, in fixed supply
A agricultural land prepared for cultivation
ha cultivated land under crop h
a crop vector )a,...,a( n1
h� net revenues per hectare of crop h
F(.;.) transformation function specifying the technology by which resources K, Land A are used as inputs for the cropping pattern )a,...,a( n1
� area premium per hectare
P1. Freedom to farm (or not)
The farmer has a fixed resource of non-cultivated agricultural land for which he receives afixed premium, without any further conditions. He can decide whether to use this forfarming or otherwise. In farming he prepares his land for cultivation, and decides whichcropping pattern yields highest revenue. This can be represented as follows (shadow pricesin parentheses)
0A,akmax �
Aah hh �� ��
subject to
0)A,L,K;a(F ����
AA � .
Irrespective of whether land will be brought into cultivation or not, the premium is given onthe fixed resource A . Since the amount paid is constant, it cancels from the first-orderconditions. Support is entirely decoupled and can be seen as lump sum transfer.
P2. Maintenance requirements
Farmers receive payments under the condition that they prepare their land for cultivation ormaintain it as such. This means that the payments rights become conditional on a specificrequirement. As it is natural to assume that land prepared for cultivation will indeed be used

Chapter V CWFS/CPB - CAPMAT
166
for some purpose, the sum of cropped area can be taken equal to the prepared area. Thus, wehave
0A,akmax �
Aah hh �� ��
subject to
0)A,L,K;a(F ����
AA �
� �h h Aa .
If the farmer decides to abstain from any maintenance activity he receives no transfer (�A =0). If he farms all his land, he receives his full historical entitlement. The requirement thatland must be maintained carries a rent that affects the area allocation and the transfer maybecome effectively coupled.
P2. Maintenance requirements
In the MTR not all crops are eligible for payments. This could be part of a transitory regimeor reflect structural aspects such as the occurrence of permanent crops. We thereforedistinguish between eligible crops and non-eligible crops. Policy determines which crops areeligible, a pure subset of {1,..,n}, and which is the total (reference) amount of eligible land.
Notation
eha cropping activity h eligible for payments, eIh�
eA total land eligible for payments
eI index set of eligible crops
The supply model can be extended to accommodate this, as follows
0A,a,a ehh
max�
���
� eIhehh hh aa ��
subject to
0)A,L,K;a(F ����
AA �
� �h h Aa .
��
�eIhee
h Aa
heh aa � , eIh�
Chapter V CWFS/CPB - CAPMAT
167
If an eligible crop is grown, it fetches eligibility rent which is equal for all active eligiblecrops to the area premium minus the rent of total eligible area. This rent affects the areaallocation: additional condition reduces decoupling.
P4. Crop livestock model with livestock maintenance requirements
Notation
ch� net revenues per hectare of crop h
ll� net revenues per animals for livestock activity l
ls animal stocks of livestock activity l (head)
els eligible livestock activity
hl� livestock maintenance coefficient (ha/head)
rI index set for ruminants that fulfill the maintenance requirements
Note that in P4 the transformation function F is understood to produce both cropping andlivestock activities.
0A,s,s,a,a ell
ehh
max�
llllIh
ehh h
ch saa e ��� ��
���� s.t. 0)A,L,K;s,a(F ����
AA �
� �h h Aa .
��
�eIhee
h Aa
heh aa � ,
eIh�
lel ss � , rIl �
elhl
eh sa �� , re Il,Ih ��
The relation between eligible crops (green fodder crops) and eligible livestock activities(ruminants) reflects the maintenance requirements, which is in fact a technological conditionthat couples areas to livestock. Clearly, farmers can resort to mechanical ways to resolve themaintenance requirements, but this is either more expensive, or not feasible due to soilconditions or steep slopes.

Chapter V CWFS/CPB - CAPMAT
168
ANNEX II. Decomposition of Equivalent Variation
Since consumer demand in the model is derived from explicit utility maximisation, and themodel covers the accounting of the entire economy, utility-based welfare measures can beconstructed that assess the overall impact of the change. We evaluate the EquivalentVariation measure that can be constructed at member state level and is expressed in valueterms and hence can be aggregated to EU-15 level. The measure compares a referencesituation (the base run) and an alternative situation (the MTR-scenario) that has differentprices and utility levels. Equivalent Variation is the minimal change in income, at the pricesof the reference situation, that would make the consumer just as well off (i.e. equivalent) asin the alternative situation. This measure expresses the change in utility that results from theMTR-scenario, in monetary terms, using the common base run prices for comparison. Hencea positive value of the measure implies a welfare gain. The mirror image of EquivalentVariation is Compensating Variation, which uses the prices of the alternative situation, andwe also refer to this measure (see for instance Varian, 1984).
Let e(p,u) denote the minimal consumer expenditure required to achieve utility u at prices p.When utility u and prices p correspond to the same situation, this minimal expenditure isequal to the actual expenditure h of that situation. Actual expenditure h equals incomeminus savings minus taxes. Using superscripts 0 for the reference, and 1 for the alternativesituation, we can define the two concepts as follows.
EV = e(p0,u1) - e(p0,u0), CV = e(p1,u1) - e(p1,u0), or
EV = e(p0,u1) - h0, CV = h1 - e(p1,u0)
The tabular presentation below will decompose the EV welfare measure so as to attribute thechange to underlying changes in income and changes in prices. For this, we rewrite itsexpression as:
EV = { h1 - h0 } + { e(p0,u1) - h1 }, implying
EV = { h1 - h0 } + { e(p0,u1) - e(p1,u1) }
The first term in brackets is the difference in income between the alternative and thereference scenario, the second is the minimal change in income to achieve the utility of thealternative situation at the two different price vectors. The latter term is a measure of the re-allocation effect. Thus the welfare measure has an income part and a re-allocation part thatapplies a correction for the change in prices.
The welfare measure can be broken down further by using the budget equation, which givesthe different sources of income. We identify three sources. First, there is the value ofendowments (p�), which in our model only applies for non-agriculture. Second, there isprofit income (�); in our model represented by agricultural income. And finally there are taxpayments (T), since the consumers are taxed to finance the government budget.
h = p� + � - T
In sum, we distinguish four components of welfare change.
EV = p1�
1 - p0�
0 : change in non-agricultural income
Chapter V CWFS/CPB - CAPMAT
169
+ �1 - �0 : change in agricultural income
- T1 + T0 : change in tax payments
+ e(p0,u1) - e(p1,u1) : price effect

170

Chapter VI University of Bonn - CAPSIM
171
Impact Analysis
of the European Commission's proposal
under the Mid-Term Review of the CAP
using the CAPSIM model
EuroCARE
University of Bonn

172
Chapter VI University of Bonn - CAPSIM
173
EXECUTIVE SUMMARY
In Mid 2002 the EU Commission published the “Mid Term Review of the CommonAgricultural Policy” which includes a proposal to decouple current support measuresfrom production decisions in view of increased economic efficiency. However, this basicidea has been watered down to some extent by a number of exceptions and specificstipulations in view of perceived disadvantages of the pure decoupling strategy.Furthermore the MTR package includes a modulation of payments aiming at areallocation between first and second pillars of the CAP. This rather complex reformproposal has been analysed with the modelling system CAPSIM.
In the crop sector we observe that the package of certain market measures and,presumably most important, decoupling removes the former distortion of incentives infavour of particular crops (cereal area: -4%, especially for durum wheat) which benefitsthose receiving little or no support in the reference run (arable fodder production +6%).The proposals greatly reduce the direct support for beef production in general, butespecially so for male adult cattle and suckler cows. Consequently beef supply decreases(-9%) but the decline is moderate in magnitude, partly due to increasing beef prices,which are predicted for all meat markets. These price increases may be influenced bymarket management with deliberate steering of the level of subsidised exports.
Increasing meat prices also limit the decrease in agricultural net value added at factorcosts to -0.9% or 1164 mio EUR in nominal terms against the Agenda 2000 referencesituation in the year 2009 or even less (138 mio EUR) with higher subsidised exports. Asecond contribution to rising incomes comes from increased efficiency: producers canreallocate the product mix and save costs without loosing premium entitlements, whichare reduced to some extent (-8.2%) in favour of the second pillar of the CAP.
The cut in premiums stemming from dynamic modulation would imply savings forEAGGF of 6.5% or 2765 mio EUR, but these savings would disappear to the extent thatmodulated funds are transferred into the second pillar. This crucial component of theMTR is beyond the scope of our current analysis, however. Increasing prices on meatmarkets would reduce consumer welfare (- 479 mio EUR), but the overall balanceappears to be clearly beneficial for the EU-15 with an overall welfare gain of1123 mio EUR if the EU largely abandons subsidised exports of beef. Higher subsidisedexports would increase losses to consumers (- 1535 mio EUR) and decrease first pillarCAP expenditure savings (2572 mio EUR) and reduce the overall gain to 899 mio EUR.
As usual, the above quantitative results rest on a number of quantitative assumptions andchoices in model specification, which are explained in some detail in the study. Mostimportant is certainly that the area voluntarily set aside would increase only by about500 000 ha on the EU level after the implementation of the MTR proposals, anassumption appearing reasonable but which could not be verified within the model used.
6.1. Introduction
In Mid 2002 the EU Commission launched the “Mid Term Review of the CommonAgricultural Policy” (EU Commission 2002a) into the political arena. This Mid-TermReview (MTR) includes a proposal to decouple current support measures fromproduction decisions in view of increased economic efficiency. Given this main thread it

Chapter VI University of Bonn - CAPSIM
174
may be expected that activities heavily supported in the Agenda 2000 framework willloose in profitability against formerly less supported activities which will expand againstthe former in turn. However, this idea has been watered down (or amended) to someextent by a number of exceptions and specific stipulations in view of perceiveddisadvantages of the pure decoupling strategy. Furthermore the MTR package includes amodulation of payments aiming at a reallocation between first and second pillars of theCAP.
Overall the proposals are sufficiently complex and potentially effective to requirequantitative modelling for an impact assessment, especially when the political balancehinges critically not only on signs of impacts but also on their magnitude.
This report gives an analysis of the Mid-Term Review of the Common AgriculturalPolicy (MTR) based on the modelling system CAPSIM. CAPSIM is a straightforwardpartial equilibrium-modelling tool with behavioural functions for activity levels, inputdemand, consumer demand and processing. Together with an assumption of exogenousyields they result in a complete set of market balances for 31 agricultural raw productscovering the complete Economic Accounts for Agriculture (EAA). Currently either tradeprices or quantities are considered exogenous. In terms of policy representation thesystem incorporates both border measures (tariffs, flexible levies/export subsidies, WTOconstraints) as well as domestic support measures for agriculture (payments per ha orhead, public intervention) and associated quantity restrictions (milk quota, sugar marketregime, ceilings on payments).
The system was designed in view of later use by Commission services44 such that, apartfrom methodological quality, transparency, flexibility, coverage and user-friendliness hadto be taken into account as well which tend to suggest pragmatic solutions. CAPSIM isdeveloped on behalf of the EU Commission in a contract with Eurostat, but thedevelopment is not yet finalised such that the version used for these simulations is anintermediate version (see Appendix 1).
The first main section explains in detail the assumptions underlying the analysis. Thesecond main part includes the modelling results on the EU level. In our presentation wewill focus on activity levels, market impact, income, budget and consumer welfareeffects.
6.2. Scenario assumptions
6.2.1. Scenario assumptions: reference run
The reference situation is based on the full implementation of the Agenda 2000 package,which is not yet implemented in our base period 1997/99. The most crucial policyparameters are reproduced in table 6.1 below. In more detail this involves the following:
44 However it should be noted that the system is still developed and operated under the sole responsibility
of the model builders who seized the opportunity to use the system in a policy relevant application.Consequently the views and interpretations expressed as well as assumptions made are those ofEuroCARE and rely on communication with Commission services only where indicated in the text.
Chapter VI University of Bonn - CAPSIM
175
���� Administered prices for cereals, beef 45 and milk products fall in accordance with theBerlin decisions by 15%, 20% and 15% respectively.
���� Per-hectare premiums for cereals increase to compensate for the decline in pricesupport, with no change on the durum wheat premium. Special increases in Finland,Spain and Italy are also taken into account (see European Commission 2000, pp 33).Premiums for pulses and oilseeds are declining due to the partial or completeunification with the cereal sector. The special male premium and the suckler cowpremiums are increased in line with the Berlin summit decisions. National envelopesare topping up the slaughter premium. A dairy premium is introduced. Table 6.4below reproduces the total increase in premiums per head for the cattle sector.
���� The obligatory set-aside rate for professional producers is set to 10 %.
���� Milk quotas increase in line with the Berlin decisions for the EU by 2.7% against ourbase period46. The increase is in most countries 1.5% and higher in four of them (EL,IT, IR, ES).
Yields are projected in an econometric estimation preventing predicted yield growth tobecome negative and to deviate between Member States by more than one percentagepoint. In the following table we reproduce the trends for selected crops which have beenused in this study.
It has to be mentioned that the trends of cereal yields resulting from our standardestimation routine would have been stronger in general47. To achieve some consistencywith our use of other exogenous information from the DG AGRI “Prospects forAgricultural markets 2002-2009” (European Commission Directorate for Agriculture2002) we adjusted our early estimates of yield growth for cereals to that source. Theassumed yield growth is evidently crucial for the magnitude of net exports of cereals inthe reference run.
For world market prices we assumed the changes of Table 6.2, mainly in view ofFAPRI projections if these were available. The above projections imply a constantEUR/Dollar exchange rate. Administrative prices, international prices and EU marketprices have been expressed for a uniform quality and may be compared directly therefore.For cereals, beef, and skimmed milk powder, for example, we can read off immediatelythat the gap between EU prices and international prices has disappeared (for soft wheat,barley, maize) or narrowed down considerably (for beef, skimmed milk powder and othercereals) according to these projections which might be considered somewhat optimistictherefore. For the aggregate other cereals (including oats, rye, other cereals and paddy)we have to acknowledge furthermore that the current problems with supply control on therye and rice market cannot be analysed appropriately at the current level of dis-aggregation in CAPSIM.
45 For beef this is the change from the pre Agenda intervention price to the basic price in the Agenda
2000 setting.46 Only 2.4% are due to the Agenda 2000 decision, the rest is due to small increases before the year 2000.47 For example, our first estimates in terms of growth rates were 1.7% for soft wheat, 1.1% for barley,
and 1.7% for maize.
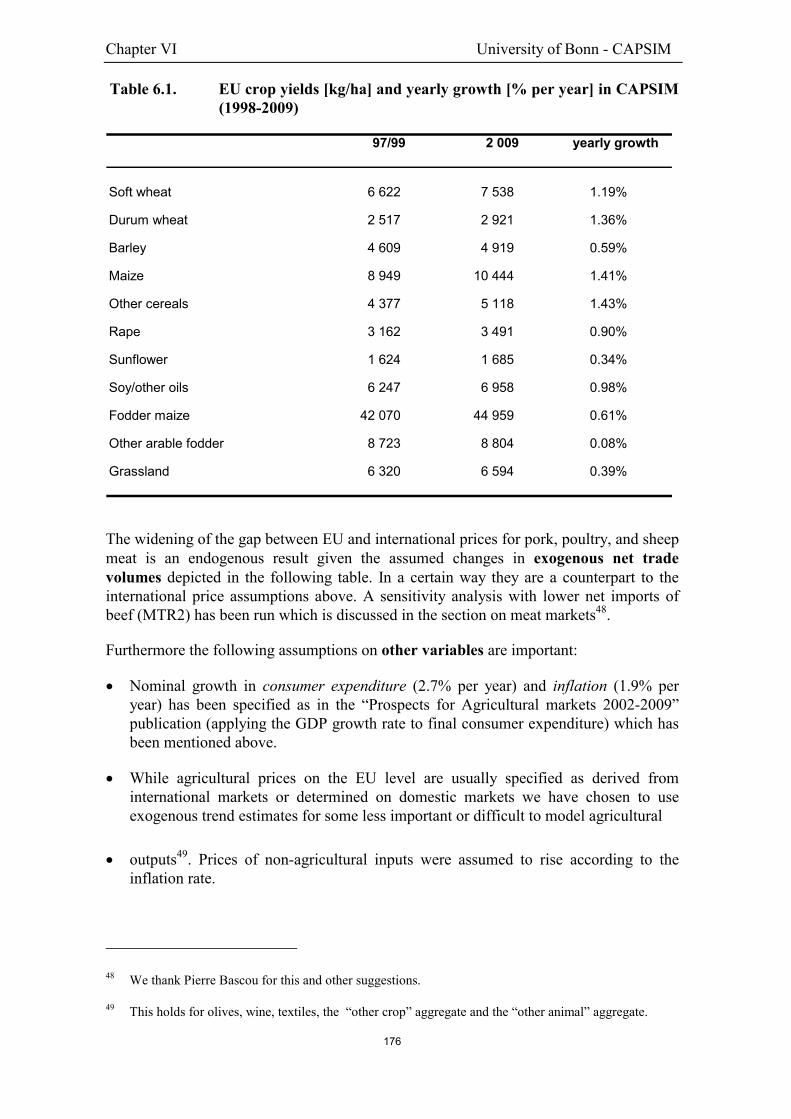
Chapter VI University of Bonn - CAPSIM
176
Table 6.1. EU crop yields [kg/ha] and yearly growth [% per year] in CAPSIM(1998-2009)
Soft wheat 6 622 7 538 1.19%
Durum wheat 2 517 2 921 1.36%
Barley 4 609 4 919 0.59%
Maize 8 949 10 444 1.41%
Other cereals 4 377 5 118 1.43%
Rape 3 162 3 491 0.90%
Sunflower 1 624 1 685 0.34%
Soy/other oils 6 247 6 958 0.98%
Fodder maize 42 070 44 959 0.61%
Other arable fodder 8 723 8 804 0.08%
Grassland 6 320 6 594 0.39%
97/99 2 009 yearly growth
The widening of the gap between EU and international prices for pork, poultry, and sheepmeat is an endogenous result given the assumed changes in exogenous net tradevolumes depicted in the following table. In a certain way they are a counterpart to theinternational price assumptions above. A sensitivity analysis with lower net imports ofbeef (MTR2) has been run which is discussed in the section on meat markets48.
Furthermore the following assumptions on other variables are important:
� Nominal growth in consumer expenditure (2.7% per year) and inflation (1.9% peryear) has been specified as in the “Prospects for Agricultural markets 2002-2009”publication (applying the GDP growth rate to final consumer expenditure) which hasbeen mentioned above.
� While agricultural prices on the EU level are usually specified as derived frominternational markets or determined on domestic markets we have chosen to useexogenous trend estimates for some less important or difficult to model agricultural
� outputs49. Prices of non-agricultural inputs were assumed to rise according to theinflation rate.
48 We thank Pierre Bascou for this and other suggestions.
49 This holds for olives, wine, textiles, the “other crop” aggregate and the “other animal” aggregate.

Chapter VI University of Bonn - CAPSIM
177
Table 6.2. Selected EU prices and world market prices in the base year and inthe reference situation in CAPSIM [EUR/t]
World Administered EU World Administered EUmarket market market market
Soft wheat 101 114 114 112 97 112
Barley 90 110 110 103 94 103
Maize 107 121 121 118 103 118
Other cereals 97 130 130 109 110 110
Rape 194 194 195 195
Sunflower 209 209 225 225
Soy/other oils 77 77 78 78
Beef 2 019 2 929 2 929 2 321 2 343 2 343
Pork 1 197 1 272 1 392 1 633
Sheep meat 3 252 3 963 3 252 4 897
Poultry meat 989 1 224 1 089 1 527
Butter 2 040 3 758 3 758 2 445 3 194 3 194
Skimmed milk powder 1 524 2 092 2 092 1 753 1 935 1 935
Cheese 2 430 4 710 2 908 4 557
97/99 2009
� The demand component industrial use is developing according to trends estimated onthe CAPSIM database.
� Population growth is proceeding according to trend estimates for EU Member States,on the EU average by 0.34% per year. Given rather small income elasticity this is anon-negligible demand shifter.
� Total area and exogenous areas such as grassland have been partly specifiedaccording to trend estimates in the reference run (total area, grassland, olives, wine,textiles, other crops) and partly based on deliberate assumptions for the scenarios (setaside, fallow land, non food), which will be addressed in more detail in section 4.
6.2.2. Scenario assumptions: MTR run
As mentioned in the introduction the main thrust of the MTR proposals is aboutdecoupling support from production decisions. Because the implementation of this policyin the model is crucial for the results we will explain the specification of premiums insome detail:
1. The premiums for arable crops in the Agenda 2000 run have been aggregated withthose for cattle and sheep to a total available premium volume

Chapter VI University of Bonn - CAPSIM
178
Table 6.3. Selected exogenous EU net trade volumes [1000 t] in the base year andin 2009
Base Reference MTR MTR21997-1999 run 2009 run 2009 run 2009
Other cereals* 1 843 1 210 1 000 1 000
Beef* 512 155 -400 -200
Veal 74 -7 -7 -7
Pork 1 341 1 176 1 176 1 176
Poultry meat 736 -42 -42 -42
Sheep meat -234 -292 -292 -292
Cheese 256 0 0 0
Other milk products 1 021 0 0 0
* Net trade is an exogenous estimate only in the two MTR runs
2. This premium volume has been increased to reflect the 50% compensation for theprice cut in cereals (-7.5% including the value of abolished monthly increments).Subsequently it has been decreased according to the drop in the durum wheatpremium for traditional areas to 250 EUR/ha.
3. The premiums of different types (arable, beef, dairy, and sheep) have been reducedaccording to the modulation proposal by 18% for that part of the premium volume,which is affected by modulation. This part has been estimated in the Commissionbased on FADN data and is on average about 66% such that the premiums have beenreduced by about 12% due to modulation.
4. This reduced premium volume has been converted into a uniform premium foreligible “MTR crops” which are all crops with a number of exceptions: Fruit andvegetable areas have been explicitly classified to be not eligible for the new“decoupled” premiums, and we assumed the same for olives, wine and “other crops”including nurseries.
5. Due to the latter exceptions farmers would loose entitlements if they grew morevegetables, for example. Therefore the uniform premiums are not decoupled in thestrictest sense. On the other hand, historically based entitlements cannot be increasedby reducing vegetables in favour of cereals, for example. Therefore we put theeligible area under a ceiling, comparable to the Agenda 2000 “base area” for cereals,oilseeds and protein crops.
6. The importance of cross compliance requirements is difficult to assess. However, weassumed that it would prevent the conversion of former grassland into fallow land orset aside such that the grassland area has been taken to be unaffected by the MTRproposals.
Our procedure implies that the decoupling content of the MTR proposals is notintroduced beforehand, for example by adding the MTR premiums after the model run to
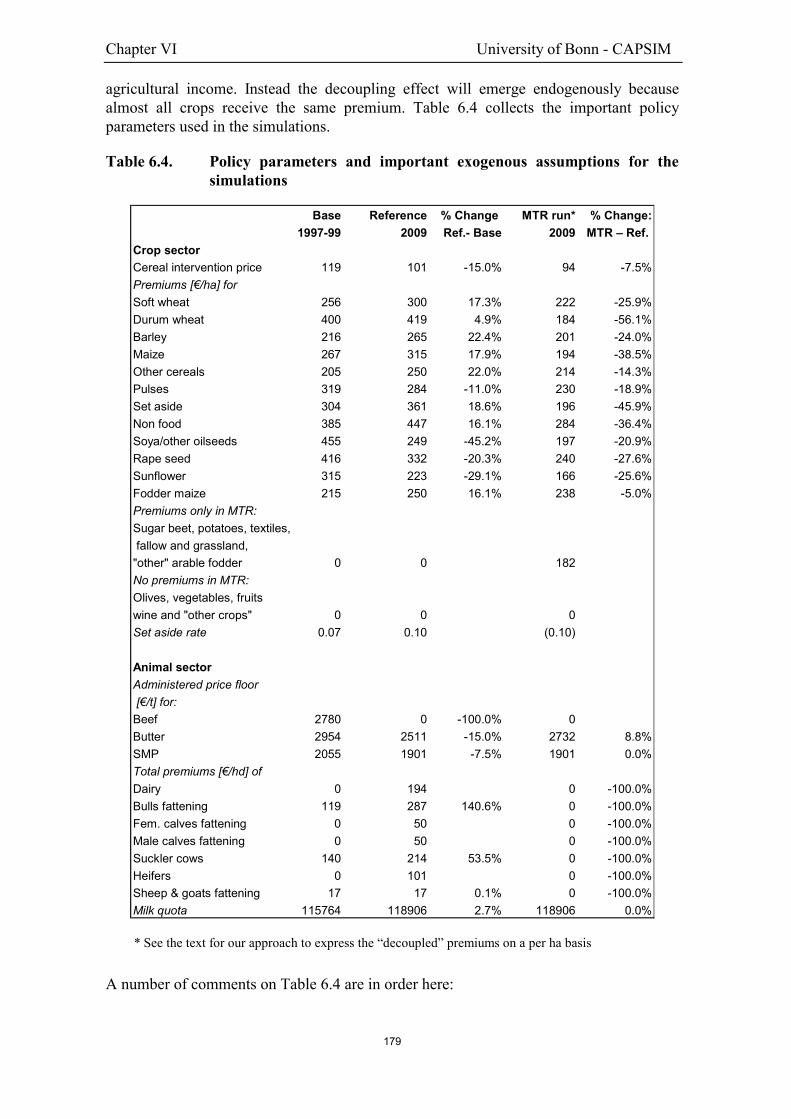
Chapter VI University of Bonn - CAPSIM
179
agricultural income. Instead the decoupling effect will emerge endogenously becausealmost all crops receive the same premium. Table 6.4 collects the important policyparameters used in the simulations.
Table 6.4. Policy parameters and important exogenous assumptions for thesimulations
Base Reference % Change MTR run* % Change:1997-99 2009 Ref.- Base 2009 MTR – Ref.
Crop sectorCereal intervention price 119 101 -15.0% 94 -7.5%Premiums [€/ha] for Soft wheat 256 300 17.3% 222 -25.9%Durum wheat 400 419 4.9% 184 -56.1%Barley 216 265 22.4% 201 -24.0%Maize 267 315 17.9% 194 -38.5%Other cereals 205 250 22.0% 214 -14.3%Pulses 319 284 -11.0% 230 -18.9%Set aside 304 361 18.6% 196 -45.9%Non food 385 447 16.1% 284 -36.4%Soya/other oilseeds 455 249 -45.2% 197 -20.9%Rape seed 416 332 -20.3% 240 -27.6%Sunflower 315 223 -29.1% 166 -25.6%Fodder maize 215 250 16.1% 238 -5.0%Premiums only in MTR: Sugar beet, potatoes, textiles, fallow and grassland, "other" arable fodder 0 0 182No premiums in MTR:Olives, vegetables, fruitswine and "other crops" 0 0 0Set aside rate 0.07 0.10 (0.10)
Animal sector Administered price floor [€/t] for:Beef 2780 0 -100.0% 0Butter 2954 2511 -15.0% 2732 8.8%SMP 2055 1901 -7.5% 1901 0.0%Total premiums [€/hd] ofDairy 0 194 0 -100.0%Bulls fattening 119 287 140.6% 0 -100.0%Fem. calves fattening 0 50 0 -100.0%Male calves fattening 0 50 0 -100.0%Suckler cows 140 214 53.5% 0 -100.0%Heifers 0 101 0 -100.0%Sheep & goats fattening 17 17 0.1% 0 -100.0%Milk quota 115764 118906 2.7% 118906 0.0%
* See the text for our approach to express the “decoupled” premiums on a per ha basis
A number of comments on Table 6.4 are in order here:
Chapter VI University of Bonn - CAPSIM
180
� The premiums are given per ha or head before any scaling due to the ceilings.
� Most of the differences between premiums for different crops are caused by cropspecific weights of the Member States. While the “decoupled” premiums differbetween Member States (depending on earlier specialisation) all crops receive thesame premium within Member States except for
� Non food oilseeds which benefit from energy credits of 45 EUR/ha,
� Protein crops which retain their preferential premiums,
� Durum wheat which receives a quality premium of 15 EUR/t, assumed to apply to alldurum wheat50.
On administered prices note that
� they are reproduced before any scaling due to quality differences, in contrast to Table6.2,
� the cereal price drop has been increased to 7.5 % to reflect the abolition of monthlyincrements,
� the effective support price for skimmed milk powder is assumed to decline only by7.5% (rather than the 15% drop of intervention prices) because demand growth formilk products is projected to convert the EU to an important net importer (see below).Export subsidies would become irrelevant then and the EU could support pricessimply by restricting imports. This would imply that the drop in intervention priceswill not be fully effective for skimmed milk powder.
6.3. Simulation results
This section explains the simulation results both in the reference run as well as in theMTR run for a number of key items on the EU level.
6.3.1. Activity levels
Crop Sector
The development of areas is driven by the development of revenues per ha and inputprices. Revenues in turn are mainly influenced by:
� the exogenous yield growth (Table 6.1),
� international prices (Table 6.2), and
� policy variables, most importantly the premiums (Table 6.4 ). 50 In the latter case, though, the preferential premiums are not as visible in the EU average as those are for
non-food oilseeds because the main durum producers receive a decoupled premium below the EUaverage, given their historical product mix.
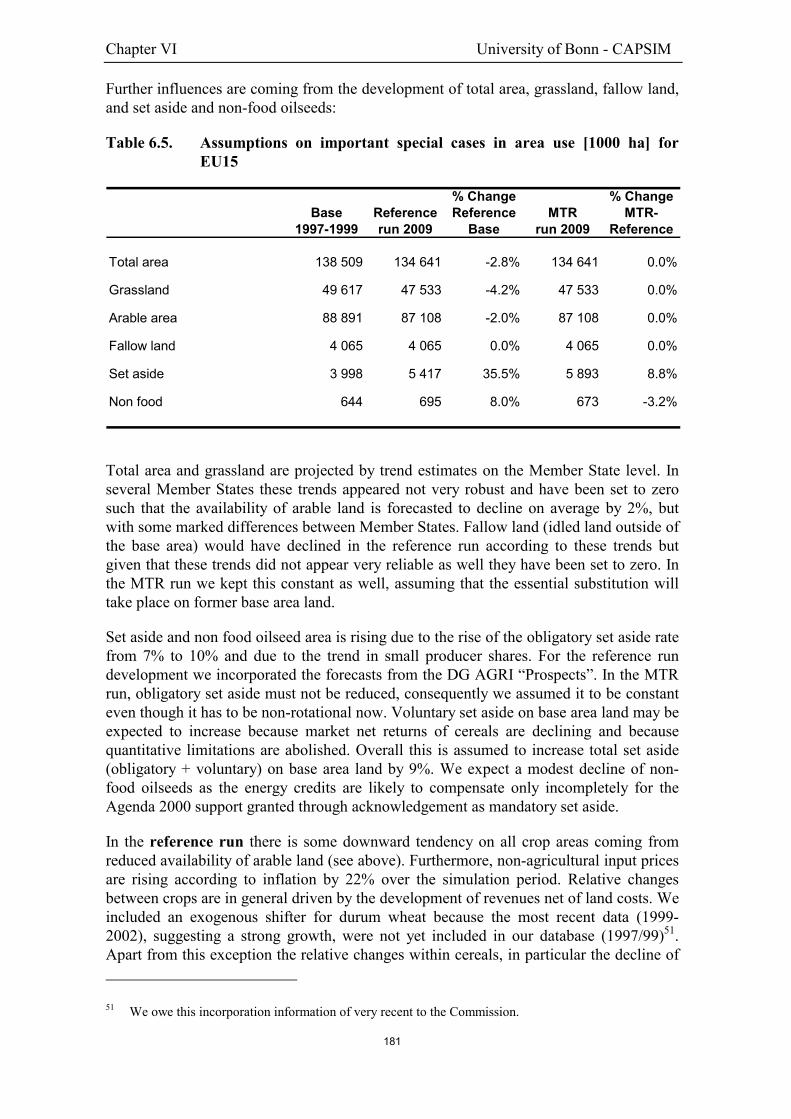
Chapter VI University of Bonn - CAPSIM
181
Further influences are coming from the development of total area, grassland, fallow land,and set aside and non-food oilseeds:
Table 6.5. Assumptions on important special cases in area use [1000 ha] forEU15
% Change % ChangeBase Reference Reference MTR MTR-
1997-1999 run 2009 Base run 2009 Reference
Total area 138 509 134 641 -2.8% 134 641 0.0%
Grassland 49 617 47 533 -4.2% 47 533 0.0%
Arable area 88 891 87 108 -2.0% 87 108 0.0%
Fallow land 4 065 4 065 0.0% 4 065 0.0%
Set aside 3 998 5 417 35.5% 5 893 8.8%
Non food 644 695 8.0% 673 -3.2%
Total area and grassland are projected by trend estimates on the Member State level. Inseveral Member States these trends appeared not very robust and have been set to zerosuch that the availability of arable land is forecasted to decline on average by 2%, butwith some marked differences between Member States. Fallow land (idled land outside ofthe base area) would have declined in the reference run according to these trends butgiven that these trends did not appear very reliable as well they have been set to zero. Inthe MTR run we kept this constant as well, assuming that the essential substitution willtake place on former base area land.
Set aside and non food oilseed area is rising due to the rise of the obligatory set aside ratefrom 7% to 10% and due to the trend in small producer shares. For the reference rundevelopment we incorporated the forecasts from the DG AGRI “Prospects”. In the MTRrun, obligatory set aside must not be reduced, consequently we assumed it to be constanteven though it has to be non-rotational now. Voluntary set aside on base area land may beexpected to increase because market net returns of cereals are declining and becausequantitative limitations are abolished. Overall this is assumed to increase total set aside(obligatory + voluntary) on base area land by 9%. We expect a modest decline of non-food oilseeds as the energy credits are likely to compensate only incompletely for theAgenda 2000 support granted through acknowledgement as mandatory set aside.
In the reference run there is some downward tendency on all crop areas coming fromreduced availability of arable land (see above). Furthermore, non-agricultural input pricesare rising according to inflation by 22% over the simulation period. Relative changesbetween crops are in general driven by the development of revenues net of land costs. Weincluded an exogenous shifter for durum wheat because the most recent data (1999-2002), suggesting a strong growth, were not yet included in our database (1997/99)51.Apart from this exception the relative changes within cereals, in particular the decline of 51 We owe this incorporation information of very recent to the Commission.
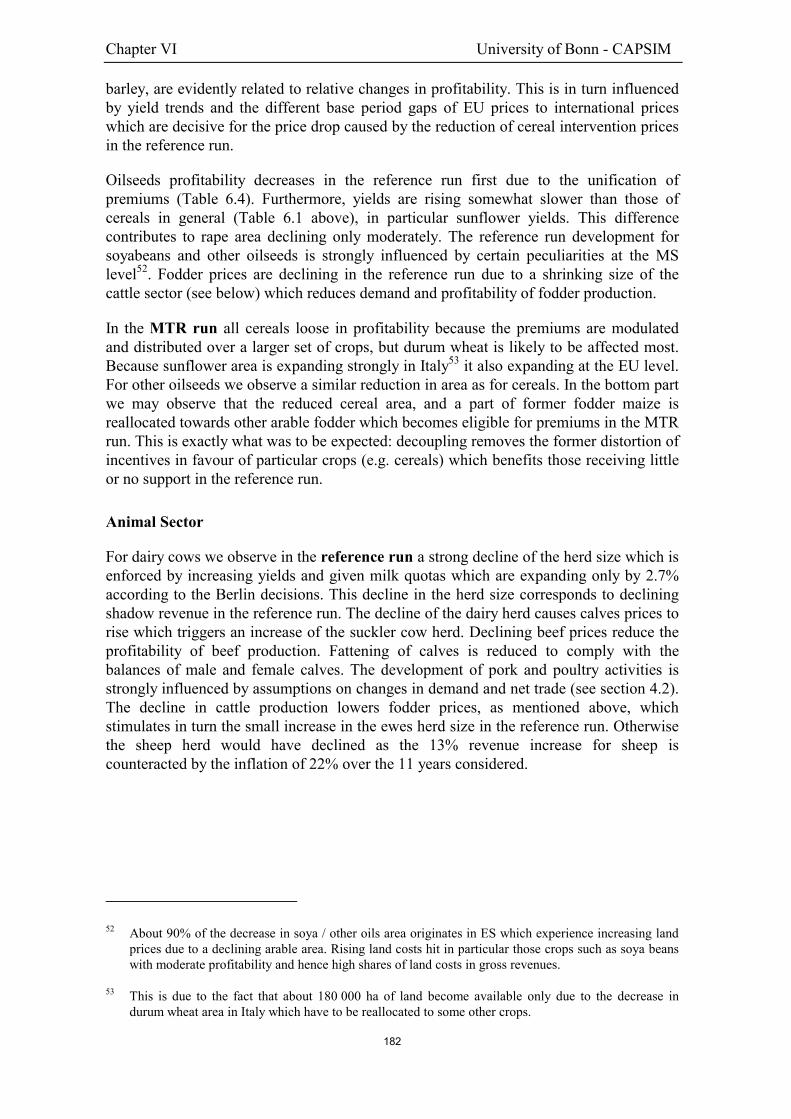
Chapter VI University of Bonn - CAPSIM
182
barley, are evidently related to relative changes in profitability. This is in turn influencedby yield trends and the different base period gaps of EU prices to international priceswhich are decisive for the price drop caused by the reduction of cereal intervention pricesin the reference run.
Oilseeds profitability decreases in the reference run first due to the unification ofpremiums (Table 6.4). Furthermore, yields are rising somewhat slower than those ofcereals in general (Table 6.1 above), in particular sunflower yields. This differencecontributes to rape area declining only moderately. The reference run development forsoyabeans and other oilseeds is strongly influenced by certain peculiarities at the MSlevel52. Fodder prices are declining in the reference run due to a shrinking size of thecattle sector (see below) which reduces demand and profitability of fodder production.
In the MTR run all cereals loose in profitability because the premiums are modulatedand distributed over a larger set of crops, but durum wheat is likely to be affected most.Because sunflower area is expanding strongly in Italy53 it also expanding at the EU level.For other oilseeds we observe a similar reduction in area as for cereals. In the bottom partwe may observe that the reduced cereal area, and a part of former fodder maize isreallocated towards other arable fodder which becomes eligible for premiums in the MTRrun. This is exactly what was to be expected: decoupling removes the former distortion ofincentives in favour of particular crops (e.g. cereals) which benefits those receiving littleor no support in the reference run.
Animal Sector
For dairy cows we observe in the reference run a strong decline of the herd size which isenforced by increasing yields and given milk quotas which are expanding only by 2.7%according to the Berlin decisions. This decline in the herd size corresponds to decliningshadow revenue in the reference run. The decline of the dairy herd causes calves prices torise which triggers an increase of the suckler cow herd. Declining beef prices reduce theprofitability of beef production. Fattening of calves is reduced to comply with thebalances of male and female calves. The development of pork and poultry activities isstrongly influenced by assumptions on changes in demand and net trade (see section 4.2).The decline in cattle production lowers fodder prices, as mentioned above, whichstimulates in turn the small increase in the ewes herd size in the reference run. Otherwisethe sheep herd would have declined as the 13% revenue increase for sheep iscounteracted by the inflation of 22% over the 11 years considered.
52 About 90% of the decrease in soya / other oils area originates in ES which experience increasing land
prices due to a declining arable area. Rising land costs hit in particular those crops such as soya beanswith moderate profitability and hence high shares of land costs in gross revenues.
53 This is due to the fact that about 180 000 ha of land become available only due to the decrease indurum wheat area in Italy which have to be reallocated to some other crops.
Chapter VI University of Bonn - CAPSIM
183
Table 6.6. Simulation results on activity levels [1000 ha] and revenues [EUR/ha]for selected crops for EU-15
Base 1997-1999
Reference run 2009
% Change Reference-
BaseMTR run
2009
% Change MTR-
Reference
Cereals area 37694 35614 -5.5% 34198 -4.0%
Wheat area 17217 17095 -0.7% 16069 -6.0%
Soft wheat net revenue 553 598 8.2% 558 -6.7%
Soft Wheat area 13864 13374 -3.5% 13238 -1.0%
Durum wheat net revenue 394 393 0.0% 280 -28.7%
Durum wheat area 3354 3721 11.0% 2831 -23.9%
Coarse grains area 20477 18519 -9.6% 18129 -2.1%
Barley net revenue 400 364 -8.9% 334 -8.3%
Barley area 11362 9945 -12.5% 9776 -1.7%
Maize net revenue 701 775 10.6% 727 -6.1%
Maize area 4206 4131 -1.8% 4078 -1.3%
Oilseeds area 5553 4935 -11.1% 5010 1.5%
Rape seed net revenue 572 487 -14.9% 440 -9.7%
Rape seed area 2687 2549 -5.2% 2533 -0.6%
Sunflower net revenue 321 158 -50.6% 152 -4.3%
Sunflower area 2019 1704 -15.6% 1805 5.9%
Soya/other net revenue 472 313 -33.6% 318 1.4%
Soya/other area 847 683 -19.4% 672 -1.5%
Arable fodder area 15765 15223 -3.4% 16092 5.7%
Fodder maize net revenue 546 417 -23.7% 395 -5.1%
Fodder maize area 3843 3655 -4.9% 3461 -5.3%
Other arable fodder net revenue 219 173 -20.8% 280 61.8%
Other arable fodder area 11922 11568 -3.0% 12631 9.2%
The MTR proposals greatly reduce the direct support for beef production in general, butthe decoupling of premiums is particularly effective on the male adult cattle size and thesuckler cowherd. Fattening of heifers is less affected because the earlier support (onlyslaughter premium) was moderate. MTR impacts on pork and poultry are rather small,being channelled mainly through the demand side (see below). Sheep loose theirpremiums but the decline in fodder prices partly compensates for this and limits thedecline to 3.1%.
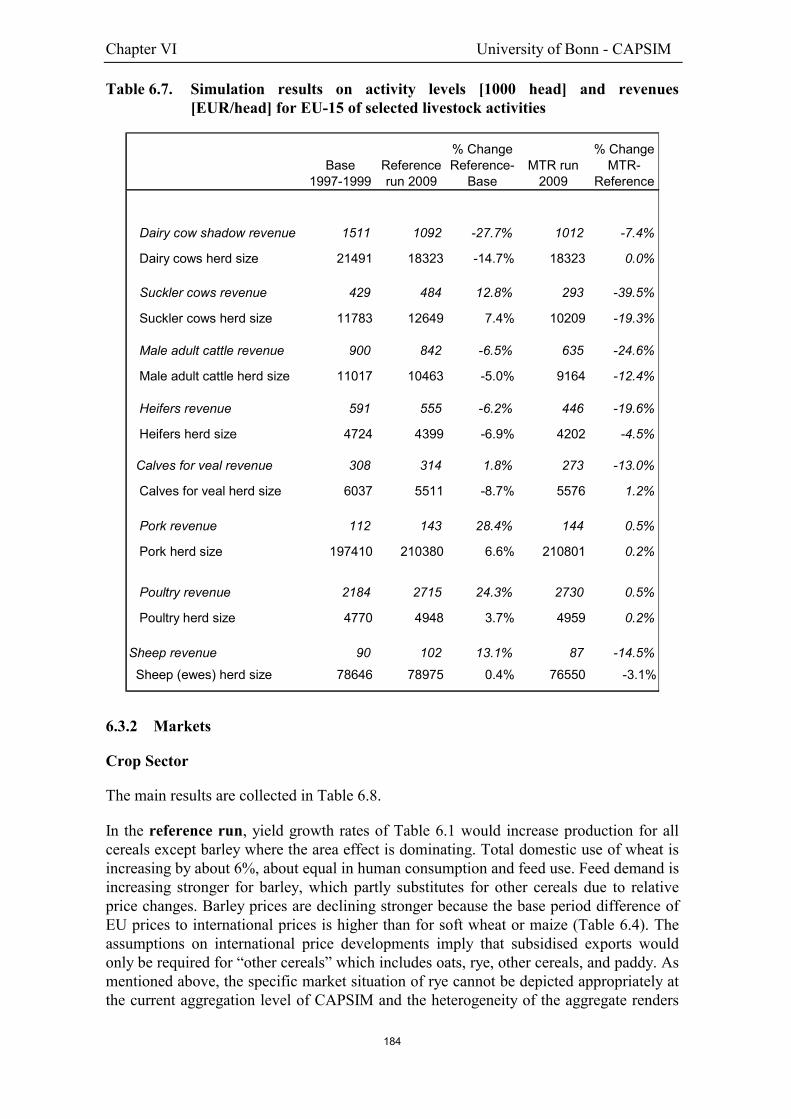
Chapter VI University of Bonn - CAPSIM
184
Table 6.7. Simulation results on activity levels [1000 head] and revenues[EUR/head] for EU-15 of selected livestock activities
Base 1997-1999
Reference run 2009
% Change Reference-
BaseMTR run
2009
% Change MTR-
Reference
Dairy cow shadow revenue 1511 1092 -27.7% 1012 -7.4%
Dairy cows herd size 21491 18323 -14.7% 18323 0.0%
Suckler cows revenue 429 484 12.8% 293 -39.5%
Suckler cows herd size 11783 12649 7.4% 10209 -19.3%
Male adult cattle revenue 900 842 -6.5% 635 -24.6%
Male adult cattle herd size 11017 10463 -5.0% 9164 -12.4%
Heifers revenue 591 555 -6.2% 446 -19.6%
Heifers herd size 4724 4399 -6.9% 4202 -4.5%
Calves for veal revenue 308 314 1.8% 273 -13.0%
Calves for veal herd size 6037 5511 -8.7% 5576 1.2%
Pork revenue 112 143 28.4% 144 0.5%
Pork herd size 197410 210380 6.6% 210801 0.2%
Poultry revenue 2184 2715 24.3% 2730 0.5%
Poultry herd size 4770 4948 3.7% 4959 0.2%
Sheep revenue 90 102 13.1% 87 -14.5% Sheep (ewes) herd size 78646 78975 0.4% 76550 -3.1%
6.3.2 Markets
Crop Sector
The main results are collected in Table 6.8.
In the reference run, yield growth rates of Table 6.1 would increase production for allcereals except barley where the area effect is dominating. Total domestic use of wheat isincreasing by about 6%, about equal in human consumption and feed use. Feed demand isincreasing stronger for barley, which partly substitutes for other cereals due to relativeprice changes. Barley prices are declining stronger because the base period difference ofEU prices to international prices is higher than for soft wheat or maize (Table 6.4). Theassumptions on international price developments imply that subsidised exports wouldonly be required for “other cereals” which includes oats, rye, other cereals, and paddy. Asmentioned above, the specific market situation of rye cannot be depicted appropriately atthe current aggregation level of CAPSIM and the heterogeneity of the aggregate renders
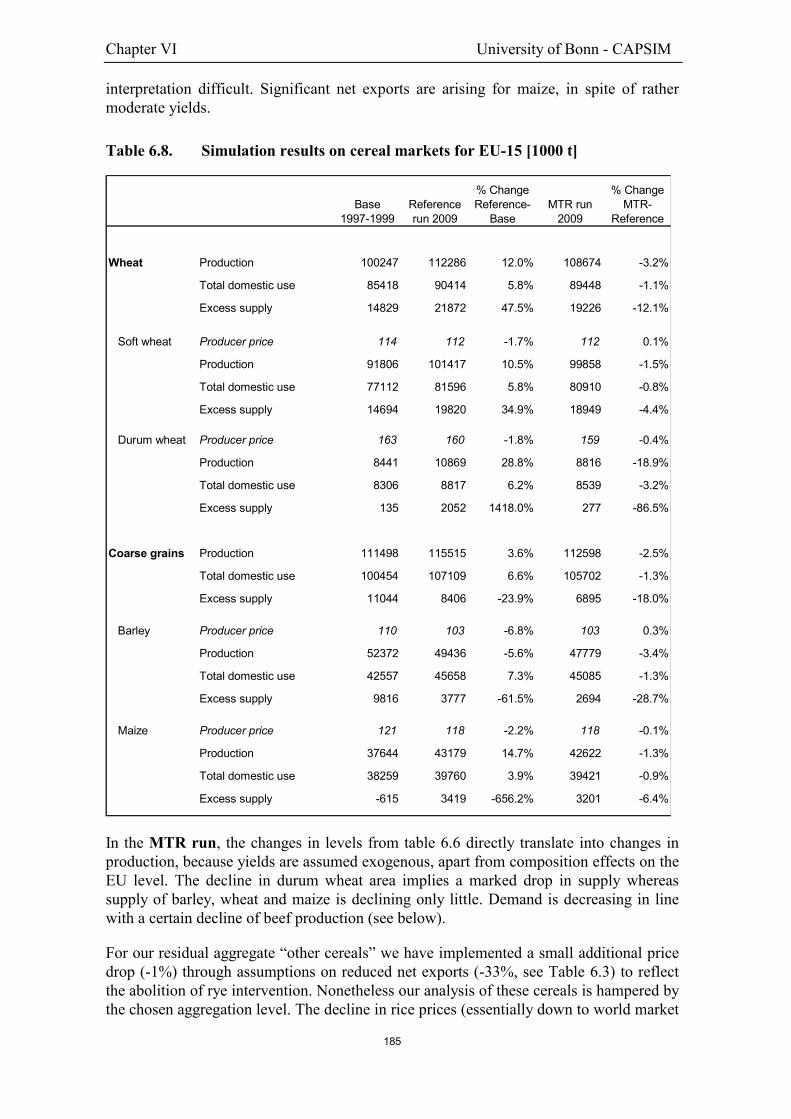
Chapter VI University of Bonn - CAPSIM
185
interpretation difficult. Significant net exports are arising for maize, in spite of rathermoderate yields.
Table 6.8. Simulation results on cereal markets for EU-15 [1000 t]
Base 1997-1999
Reference run 2009
% Change Reference-
BaseMTR run
2009
% Change MTR-
Reference
Wheat Production 100247 112286 12.0% 108674 -3.2%
Total domestic use 85418 90414 5.8% 89448 -1.1%
Excess supply 14829 21872 47.5% 19226 -12.1%
Soft wheat Producer price 114 112 -1.7% 112 0.1%
Production 91806 101417 10.5% 99858 -1.5%
Total domestic use 77112 81596 5.8% 80910 -0.8%
Excess supply 14694 19820 34.9% 18949 -4.4%
Durum wheat Producer price 163 160 -1.8% 159 -0.4%
Production 8441 10869 28.8% 8816 -18.9%
Total domestic use 8306 8817 6.2% 8539 -3.2%
Excess supply 135 2052 1418.0% 277 -86.5%
Coarse grains Production 111498 115515 3.6% 112598 -2.5%
Total domestic use 100454 107109 6.6% 105702 -1.3%
Excess supply 11044 8406 -23.9% 6895 -18.0%
Barley Producer price 110 103 -6.8% 103 0.3%
Production 52372 49436 -5.6% 47779 -3.4%
Total domestic use 42557 45658 7.3% 45085 -1.3%
Excess supply 9816 3777 -61.5% 2694 -28.7%
Maize Producer price 121 118 -2.2% 118 -0.1%
Production 37644 43179 14.7% 42622 -1.3%
Total domestic use 38259 39760 3.9% 39421 -0.9%
Excess supply -615 3419 -656.2% 3201 -6.4%
In the MTR run, the changes in levels from table 6.6 directly translate into changes inproduction, because yields are assumed exogenous, apart from composition effects on theEU level. The decline in durum wheat area implies a marked drop in supply whereassupply of barley, wheat and maize is declining only little. Demand is decreasing in linewith a certain decline of beef production (see below).
For our residual aggregate “other cereals” we have implemented a small additional pricedrop (-1%) through assumptions on reduced net exports (-33%, see Table 6.3) to reflectthe abolition of rye intervention. Nonetheless our analysis of these cereals is hampered bythe chosen aggregation level. The decline in rice prices (essentially down to world market

Chapter VI University of Bonn - CAPSIM
186
level) spurs human consumption (+ 23%) but paddy production is unfortunately includedin the “other cereals” aggregate such that the rice market cannot be analysedappropriately.
Meat markets
For beef, the reference run reflects the decline in activity levels shown in Table 6.7above on the supply side. Demand growth has been aligned with the DG AGRI“Prospects”54. Given these projections the net exports of beef from the EU woulddecrease from about 500 000 t to 150 000 t.
The veal market is modelled with net trade volume set to –7 000 t. Based on thisassumption veal prices are almost constant in nominal terms. Pork, poultry and sheepmeat are technically treated as veal: net trade is "exogenously" specified and prices areadjusting correspondingly. The development of human consumption and net trade hasbeen forecasted approximately as in the DG AGRI “Prospects”. This results in consumerprices, which are developing quite similarly and lag somewhat behind general inflation(22% over the period).
MTR impacts are especially important for the beef market. If EU authorities let themarket price fall as the drop in support price might suggest, the EU would turn into asignificant net importer of beef, with no exports and imports even beyond existing marketaccess commitments. However, as has been argued for skimmed milk powder, it is verylikely that EU prices will be held above administrative prices as soon as support does notrequire export subsidies anymore. Consequently net exports have been fixed"exogenously" at a level of �400 000 t assuming that additional imports beyond thosecovered by existing market access commitments would be blocked off at EU borders. Inthis case the EU beef market would clear at a price somewhat above the basic price level(see Table 6.2). This price increase compared to the reference run will also stabilises beefsupply, yielding an equilibrium supply reduction of 9%. The same effect operates on theveal and sheep meat markets where decoupling reduces supply, which increases marketprices. Pork and poultry prices rise because consumers will partly switch to these meats.
The left part of the table shows the sensitivity of results to the assumed net exports. Ifsome subsidised exports were maintained55 such that net imports were only 200 000 t(hence the acronym MTR2 in the table), consumer prices would increase by 1.7percentage points, while consumer demand would decrease. These price increases wouldspread to other meat markets (Table 6.9), with minor effects also on milk and cerealmarkets (not shown). Different price changes would also result if market managementmaintained the same level of net exports, but demand growth in the reference run wouldhave been slightly higher or lower than assumed in the table. These different price
54 More precisely we adopted the average yearly growth rate of human consumption. Technically this was
implemented by a residual specification of a corresponding taste shifter which has been fixed in thesubsequent MTR simulation. This procedure has been chosen because the demand system in CAPSIMis not yet estimated on the basis of time series data and may fail to capture the influence of other timevarying factors beyond prices and income.
55 Net exports of about �200 000 t would result for example with subsidised exports of 200 000 t andimports remaining at 400 000 t, given existing commitments.

Chapter VI University of Bonn - CAPSIM
187
developments have predictable consequences for producer and consumer welfare (seeTable 6.11 below).
Table 6.9. Simulation results on meat markets for EU-15 [1000t or EUR/t]
Base 1997-1999
Reference run 2009
% Change Reference-
BaseMTR run
2009
% Change MTR-
ReferenceMTR2 run
2009
% Change MTR2-
Reference
Beef Consumer price 5773 5425 -6.0% 5486 1.1% 5576 2.8%
Production 7020 6872 -2.1% 6236 -9.3% 6305 -8.2%
Total domestic use 6508 6718 3.2% 6636 -1.2% 6505 -3.2%
Excess supply 512 154 -69.9% -400 -359.5% -200 -229.8%
Veal Consumer price 6078 6154 1.2% 6211 0.9% 6259 1.7%
Production 788 728 -7.6% 722 -0.8% 717 -1.5%
Total domestic use 713 735 3.1% 729 -0.8% 725 -1.4%
Excess supply 74 -7 -110.0% -7 0.0% -7 0.0%
Pork Consumer price 3942 4712 19.5% 4719 0.2% 4728 0.4%
Production 17318 18478 6.7% 18516 0.2% 18555 0.4%
Total domestic use 15977 17303 8.3% 17340 0.2% 17380 0.4%
Excess supply 1341 1175 -12.3% 1176 0.0% 1175 0.0%
Poultry Consumer price 3821 4489 17.5% 4497 0.2% 4505 0.3%
Production 8746 9063 3.6% 9083 0.2% 9097 0.4%
Total domestic use 8010 9105 13.7% 9125 0.2% 9139 0.4%
Excess supply 736 -42 -105.7% -42 0.0% -42 0.0%
Sheep meat Consumer price 6251 7542 20.7% 7743 2.7% 7765 3.0%
Production 1138 1167 2.5% 1131 -3.1% 1131 -3.1%
Total domestic use 1381 1459 5.7% 1423 -2.5% 1424 -2.5%
Excess supply -243 -292 20.3% -292 0.0% -292 0.0%
Milk products
Reference run results on markets for milk products are first determined by the quotaincrease which determines a small aggregate increase in production of milk products.Which milk products are increasing is determined by demand growth and assumptions onnet trade in CAPSIM. Regarding human demand growth we specified growth rates forskimmed milk powder, butter and cheese approximately as in the DG AGRI “Prospects”and assumed a medium yearly growth rate (0.5%) for the residual “other milk products”.Because demand for cheese and other milk products is projected to rise strongly in thisway the increasing production of cheese and other milk products causes some scarcity offat and protein which is resolved by a matching decline of butter and skimmed milkpowder production. In spite of declining supply the EU is likely to remain in the netexport position for butter, in contrast to skimmed milk powder where we should see netimports. Precisely because we predict that the EU would become an important netimporter of skimmed milk products we have assumed that the Agenda 2000 drop inintervention prices (-15%) would not become fully effective for skimmed milk powder.

Chapter VI University of Bonn - CAPSIM
188
Therefore consumer prices are declining only by about 6% here. Furthermore we assumethat net exports of cheese and other milk products vanish, otherwise the projected declinein skimmed milk powder production would have been stronger. Higher exports for cheeseand other milk products would have implied higher EU market prices, which wasconsidered unlikely.
Table 6.10. Simulation results on milk markets for EU-15 [1000t or EUR/t]
Base 1997-1999
Reference run 2009
% Change Reference-
BaseMTR run
2009
% Change MTR-
Reference
Cow milk Consumer price 395 344 -13.0% 344 0.2%
Production 121941 125371 2.8% 125371 0.0%
Total domestic use 121941 125371 2.8% 125371 0.0%
Excess supply 0 0 0
Butter Consumer price 4689 4180 -10.9% 4180 0.0%
Production 1888 1888 0.0% 1883 -0.3%
Total domestic use 1884 1846 -2.0% 1848 0.1%
Excess supply 4 43 36 -16.5%
Skimmed milk powder Consumer price 2610 2463 -5.6% 2463 0.0%
Production 1109 924 -16.7% 914 -1.1%
Total domestic use 1021 981 -3.9% 976 -0.5%
Excess supply 89 -57 -62 9.0%
Cheese Consumer price 6549 6479 -1.1% 6486 0.1%
Production 6635 6939 4.6% 6943 0.1%
Total domestic use 6379 6939 8.8% 6943 0.1%
Excess supply 256 0 0 0.0%
Other milk products Consumer price 1025 1013 -1.2% 1013 0.1%
Production 43686 45065 3.2% 45103 0.1%
Total domestic use 42666 45065 5.6% 45103 0.1%
Excess supply 1021 0 0 0.0%
The MTR package has little only moderate effects on milk markets, which feed inmainly through the demand side.
6.3.3 Welfare
The next table summarises the MTR impacts on major determinants of welfare, that isagricultural income, consumer welfare and the EU agricultural budget (EAGGF), moreprecisely the first pillar expenditure. Results for the base year are reproduced only for thesake of completeness. The evaluation of differences to the base year would require some

Chapter VI University of Bonn - CAPSIM
189
discussion of inflation, labour outflow and non-agricultural incomes which is omittedhere in favour of the MTR impacts. For these impacts the alternative scenario (“MTR2”in the table) differs from the basic MTR scenario in that it assumes lower net imports ofbeef (see Table 6.9 above), for example due to differing EU market management.
Table 6.11. Simulation results on welfare effects for EU-15 (mio EUR)
Base Reference MTR MTR- MTR2 MTR2-1997-1999 run 2009 run 2009 Reference run 2009 Reference
Agriculture 250 589 276 911 273 768 -1.1% 275 134 -0.6%
Total output 130 822 143 483 138 748 -3.3% 139 090 -3.1%
Total intermediate input 119 767 133 428 135 020 1.2% 136 044 2.0%
Gross value added 25 792 33 666 30 911 -8.2% 30 911 -8.2%
Subsidies allocated to products 10 957 10 957 10 957 0.0% 10 957 0.0%
Subsidies other 3 931 3 931 3 931 0.0% 3 931 0.0%
Taxes 12 831 14 977 14 977 0.0% 14 977 0.0%
Depreciation 117 518 135 228 134 065 -0.9% 135 089 -0.1%
Net value added at factor costs -1 163 -138
NVAF, absolute difference
Consumers
Food expenditure 509 076 612 728 613 107 0.1% 613 959 0.2%
Equivalent variation -479 -1 535
Budget
FEOGA expenditure 39 033 42 788 40 023 -6.5% 40 216 -6.0%
absolute difference -2 765 -2 572
Welfare 1 123 899
In terms of market income (GVA) the MTR proposals turn out to be quite favourable foragriculture (+1.2%) in our basic MTR simulation. This result follows partly from thesmall predicted price increases on meat markets which can be traced back to ourassumption that net imports will be constrained by EU border protection, once the EU hasarrived at a level of 400 000 t of net imports. Furthermore there are cost savings onintermediate inputs reflecting the fact that production was distorted towards supportedactivities. Abandoning expensive activities without loosing premium entitlements willincrease efficiency and income. However, subsidies (premiums) are declining strongly (-8.2%), because the effect of dynamic modulation more than offsets the 50%compensation for the final 5% drop in administered cereal prices. At the bottom line thereis a small decrease in net value added at factor costs (-0.9%). The left part of the tableshows that even these losses could be eliminated if EU authorities maintained moresubsidised exports and consequently lower net imports and higher prices. Note that bothMTR scenarios do not yet reflect the income generating effects of modulation funds oncethey will be channelled back to rural development over the second pillar of the CAP.

Chapter VI University of Bonn - CAPSIM
190
Consumers would loose according to our simulations because the drop in rice prices ismore than compensated by the increase in meat and milk product prices, giver theirimportance in food expenditure. It may be read off from the left part of Table 6.11 thatthe quantity of net imports entering the EU would be a crucial determinant for theselosses56, putting a lot of decision power on the redistribution from consumers toproducers in the hands of market management authorities.
The savings for EAGGF given in Table 6.11 correspond with declining premiums foragriculture from dynamic modulation. Again it has to be kept in mind that they aresavings only in terms of expenditure on first pillar instruments because it is foreseen toredirect these funds to rural development and environmental measures. However becausethe benefits of these measures are difficult to asses we prefer to stop in the welfareanalysis before considering the alternative uses of modulation funds. The left part of thetable shows that first pillar EAGGF savings would decrease only moderately with moresubsidised exports of beef, given our assumed international beef price of 2300 EUR/t.
We are refraining from any consideration of environmental impacts or administrative costhere. Confining our assessment therefore to the “orthodox” welfare impacts we may readoff from table 6.11 that the proposals are very likely to be beneficial for EU-15 as awhole. Furthermore we see that a more open stance of market management towards netimports of beef would tend to increase these gains (1123 mio EUR or only 899 mioEUR).
6.4. Concluding remarks
For a full assessment of the MTR proposals we would have to take the quantitativewelfare gain of the previous section as a starting point and address at least in a qualitativemanner the issues left out so far. In the scope of this study this cannot be accomplished ina thorough way but we like to mention at least those points deserving additionalconsideration:
� Environmental impacts are likely to be positive for different reasons. Support forintensive production is reduced in several cases (bulls and steers, fodder maize).Cross compliance obligations may provide further benefits to the environment, butthese obligations and their costs have been neglected in our analysis.
� Administrative burden may have been released in some respect but the full benefits ofsimplification will only be felt when the last exceptions are abolished (pulses, fruitsand vegetables…). In addition the planned farm audits for larger farms wouldincrease the administrative burden.
� Equity within the farming community is likely to be improved but modulation and thecapping of premiums at 300 000 EUR57 will discriminate against larger farms, callinginto question the long run benefits of the proposals in terms of economic efficiency.
56 In both MTR scenarios the price increases would be somewhat smaller if CAPSIM allowed for a more
flexible modelling of trade than in the current version.
57 Note that the proposed capping has not been implemented in the quantitative analysis.
Chapter VI University of Bonn - CAPSIM
191
� Food quality may be improved if the announced amendments will be made to EUregulations, but it is beyond the scope of our analysis to assess these impacts or theirpractical effectiveness.
� The transfer of modulated premiums will strengthen the second pillar but it will alsoimply some redistribution between Member States, which are difficult to assess,however.
� Finally there are important benefits of the MTR proposals for the negotiating positionof the EU in the current Doha round.
Chapter VI University of Bonn - CAPSIM
192
References
Commission of the European Communities (2002a): Mid-Term Review of the CommonAgricultural Policy, Communication from the Commission to the Council and theEuropean Parliament, 10.7.02, COM(2002) 394, Brussels.
European Commission Directorate for Agriculture (2002): Prospects for AgriculturalMarkets 2002 - 2009, Luxembourg: Office for Official Publications of theEuropean Communities.
European Commission Directorate for Agriculture (2000): Agenda 2000 CAP Reformdecisions - Impact Analyses, Luxembourg: Office for Official Publications of theEuropean Communities.
Witzke, H.P. (2002): CAPSIM intermediate version - Methodology, Working Paper,Eurocare, Bonn.

Chapter VI University of Bonn - CAPSIM
193
Appendix
Basic information on CAPSIM
ObjectiveImpact analyses for CAP scenarios on agriculture (area allocation, market balances, income),consumers in EU Member States and on the EU BudgetMethodology
� Partial equilibrium model� Supply side:� Based on behavioural functions for activity levels (yields are assumed exogenous)
and input demands� Currently: Generalized Leontief profit function (globally well behaved)� Activity levels comply with balances on land, male and female calves� Demand: Generalised Leontief indirect utility function (globally well behaved)� Processing: Behavioural functions based on prespecified parameters. Special
solutions for sugar and milk.� Trade: Currently either exogenous trade volumes or exogenous international prices.
Incorporation of a revised trade component (net trade functions mimicking theWATSIM) foreseen.
Policy instruments� Border measures: Tariffs (specific or ad valorem), flexible levies / variable export
restitutions, WTO constraints on subsidized exports� Domestic market support: Intervention will be triggered (up to a prespecified upper
bound) if there is a support price but WTO constraints are binding. Subsidies per unit ofcurrent output are possible but irrelevant in the CAP
� Payments: Different premia (grand cultures, durum wheat, suckler cows, special male,slaughter) are implemented. Ceilings are met, if necessary, by proportional scaling ofpayments per activity.
� Set aside is implemented based on an elasticity of the effective set aside with respect tothe obligatory set aside rate.
� Quotas� For milk implemented as a quota on total sales .� For sugar implemented with an incentive revenue function which depends on A, B, C
revenues and on the A and B quotasData sources� Eurostat gives data on market balances (ZPA1), economic accounts values (COSA) and a
number of EU producer prices (PRAG), if they cannot be derived as unit values.� Completeness and consistency of these series is the result of a major modelling effort on
its own (COCO module) by a joint effort with the CAPRI team� International prices are derived from the FAO, FAPRI and WATSIM data� Supplementary information on missing variables is coming from different sources (DG
Agri, FAO, USDA, ILO, national statistical agencies)Results� Activity levels, market balances and income (NVAF) in agriculture per EU Member State,
per capita and per ha� Consumer welfare: given as equivalent variation.