CAP 770 No-frills Carriers: Revolution or Evolution? - Civil Aviation
98
No-Frills Carriers: Revolution or Evolution? A Study by the Civil Aviation Authority CAP 770
Transcript of CAP 770 No-frills Carriers: Revolution or Evolution? - Civil Aviation
No-Frills Carriers: Revolution or Evolution?A Study by the Civil Aviation Authority
CAP 770


No-frills Carriers:
Revolution or Evolution?A Study by the Civil Aviation Authority
CAP 770
© Civil Aviation Authority 2006
All rights reserved. Copies of this publication may be reproduced for personal use, or for use within a company or organisation, but may not otherwise be reproduced for publication.
To use or reference a CAA publication for any other purpose, for example within training material for students, please contact the CAA at the address below for formal agreement.
ISBN-10 011790 701 4ISBN-13 978 011790 701 0
15 November 2006
Enquiries regarding the content of this publication should be addressed to:
Economic Regulation Group, International Aviation Policy, CAA House, 45-59 Kingsway, London WC2B 6TE
The latest version of this publication is available in electronic format at www.caa.co.uk/publications, where you may also register for e-mail notifi cation of amendments.
Published by TSO (The Stationery Offi ce) on behalf of the Civil Aviation Authority.
Printed copy available from: TSO, PO Box 29, Norwich, NR3 1GN www.tso.co.uk/bookshop Telephone orders/General enquiries: 0870 600 5522 E-mail: [email protected] Fax orders: 0870 600 5533 Textphone: 0870 240 3701
CAP 770No-frills Carriers: Revolution or Evolution?
A Study by the Civil Aviation Authority
1
Contents
Contents 1
Executive Summary
1 Context and Background
The airline market before the advent of no-frills carriers 1
What is a no-frills carrier? 4
No-frills carriers – the main innovations 5
Why did no-frills carriers not emerge in Europe before the 1990s? 9
Conclusions 10
2 The Growth of No-frills Carriers and their Impact
on Total Traffi c Growth
Background 1
Setting the no-frills growth in context: the aggregate data 7
Traffi c generation and substitution 11
Analysis at the broader market level 13
Route level analysis 20
Conclusions 25
3 The Impact of No-frills Carriers on the Aviation
Market
How no-frills carriers have changed the airline market 1
How incumbent airlines have responded to no-frills competition 3
Airports 4
Conclusions 6
CAP 770No-frills Carriers: Revolution or Evolution?A Study by the Civil Aviation Authority
2
4 Impact on Passengers – who uses No-frills Carriers?
No-frills carriers: passenger profi le 1
No-frills passengers: purpose of travel 3
Conclusions 14
5 Impact on society: Have No-frills Carriers
Democratised Air Travel?
Passenger income 1
Social Group 9
Length of trips 14
Group size 16
Flexible destination choice 18
The fl ow of labour 19
Regional differences 22
Summary socio-economic data 23
Impact on society: conclusions 26
Appendix
Executive Summary Page 1
Executive Summary
The growth of the “low-cost” or “no-frills” airline sector has been one of the most signifi cant developments in the UK travel sector over the last decade. No-frills carriers have had a signifi cant impact on the aviation industry and are perceived as having revolutionised the way people travel.
Much has already been written about no-frills carriers, and this paper does not attempt to provide a defi nitive description of what they are, how they operate or their history. Rather, it aims to set the “no-frills revolution” in context, to understand better the impacts it has had on the sector, on infrastructure and on the public, and to refl ect on those issues that seem most relevant to the current state of the UK aviation sector and likely future trends.
This approach is in line with the CAA’s role in supporting the long-term sustainability of the industry: seeking to understand trends in the market, how these may drive change, and publishing its views from time to time on such matters to help inform the industry and policymakers. The CAA has an extensive database of information on airlines and airports, as well as passenger survey information. This paper draws heavily on these sources to try to understand more clearly the impact of the rapid rise of no-frills carriers.
It seems an appropriate time, over a decade since the deregulation of the airline industry in Europe, to examine how no-frills carriers have affected the aviation industry in the UK, and perhaps more importantly, the fl ying habits of society at large. The general perception of no-frills carriers is that they have revolutionised air travel, both in terms of how they operate, and their effect on traffi c growth, on passengers and society more generally. This paper explores the extent to which this perception of “revolution” is borne out by the available evidence on the UK market.
The impact on air travel
Undoubtedly, the UK airline market looks radically different today to that of the early 1990s. Many no-frills carriers have proven to be very successful businesses, combining a number of factors to take advantage of new opportunities and exploiting them very effectively. As a result, they have taken a large share of passenger traffi c from their competitors.
Many of the aspects of the no-frills operating model are not however in themselves new. There has, for example, been no technological break-through such as a new type of aircraft that has allowed these airlines to fl ourish — no-frills carriers use the same aircraft that are available to other carriers, and face the same fuel costs. And it has long been known that high
Executive Summary Page 2
CAP 770No-frills Carriers: Revolution or Evolution?A Study by the Civil Aviation Authority
utilisation and simplifi ed fl eets reduce costs. Indeed, charter carriers have traditionally achieved very high rates of utilisation (and still do).
But the no-frills carriers’ rigorous focus on reducing costs and simplifying operations has resulted in a changed approach to issues such as fl eet operation and renewal, airport operations, and sales techniques. No-frills carriers have combined these various factors into a business model that is radically different from that of traditional scheduled airlines.
The paper notes, however, the increasing convergence between business models. The “no-frills carrier” tag may no longer be a relevant way of describing a particular type of airline, as many of their characteristics have been copied by other airlines operating short-haul services. Perhaps in the future the key distinction will be between airlines only offering point-to-point services as opposed to those offering a wider choice of destinations through an interconnecting network. This may lead to increasing numbers of passengers “self-interlining” (buying separate tickets for two legs of a journey and making the connection themselves).
The impact of no-frills carriers on airports and in the UK regions
No-frills carriers have signifi cantly changed where passengers fl y from. There has been a steady shift towards the UK regions, with many more passengers travelling from their local airports, resulting in a dramatic increase in the range and number of scheduled routes available from UK regional airports. The arrival of a no-frills carrier may often transform the fortunes of that airport, creating more opportunities for those living near the airport, and bringing attendant benefi ts to the local and regional economy.
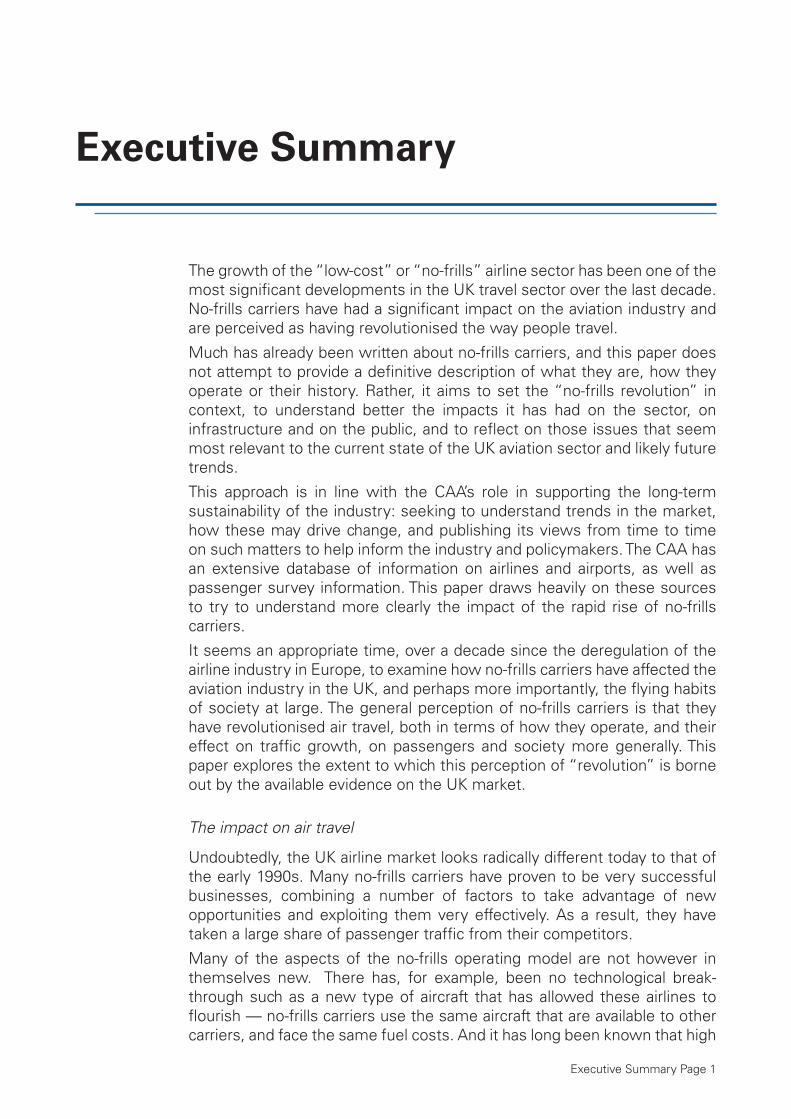
The way that such airports interact with their airline customers has also changed, driven largely by the different business proposition that no-frills carriers have presented, particularly to airports that have been historically underused. Such airports are increasingly competing to win business from airlines, vying to offer commercially attractive propositions in order to attract them and thus benefi t from the aeronautical revenues and, crucially, the non-aeronautical (including retail) revenues that can be captured through increased passenger throughput. Whilst airports in the South-East of England such as Stansted and Luton were the fi rst to see a major increase in no-frills carrier activity, the growth in UK regional air services has been very fast over recent years, as Figure 1 shows, with the expansion of no-frills carriers at certain regional airports being a particular driver of that growth.
Executive Summary Page 3
CAP 770No-frills Carriers: Revolution or Evolution?
A Study by the Civil Aviation Authority
Figure 1 International no-frills traffi c from London and UK Regional airports, 1996-
2005
Source: CAA Airport Statistics
The impact of no-frills carriers on the airline market and on traffi c growth
No-frills carriers have also innovated on fares, and so radically altered how the airline market works. They have changed both the structure and the level of fares for short-haul travel, not just in terms of their own offering, but also refl ected in the subsequent response from incumbent airlines. Saturday-night stay rules are now a thing of the past, and the “book early – get it cheaper” philosophy extends across the sector.
It is unarguable that there is now a far more competitive environment in the UK for short-haul air travel than before liberalisation of the EU aviation market, and that no-frills carriers have been a very signifi cant factor in enhancing that competition. Their focus on reducing costs and fares, and achieving high levels of effi ciency and productivity, has forced other airlines to change the way they operate and seek out similar effi ciencies, so as to be able to compete. All short-haul airlines in the UK now operate in a market where consumers expect low fares for European and domestic travel.
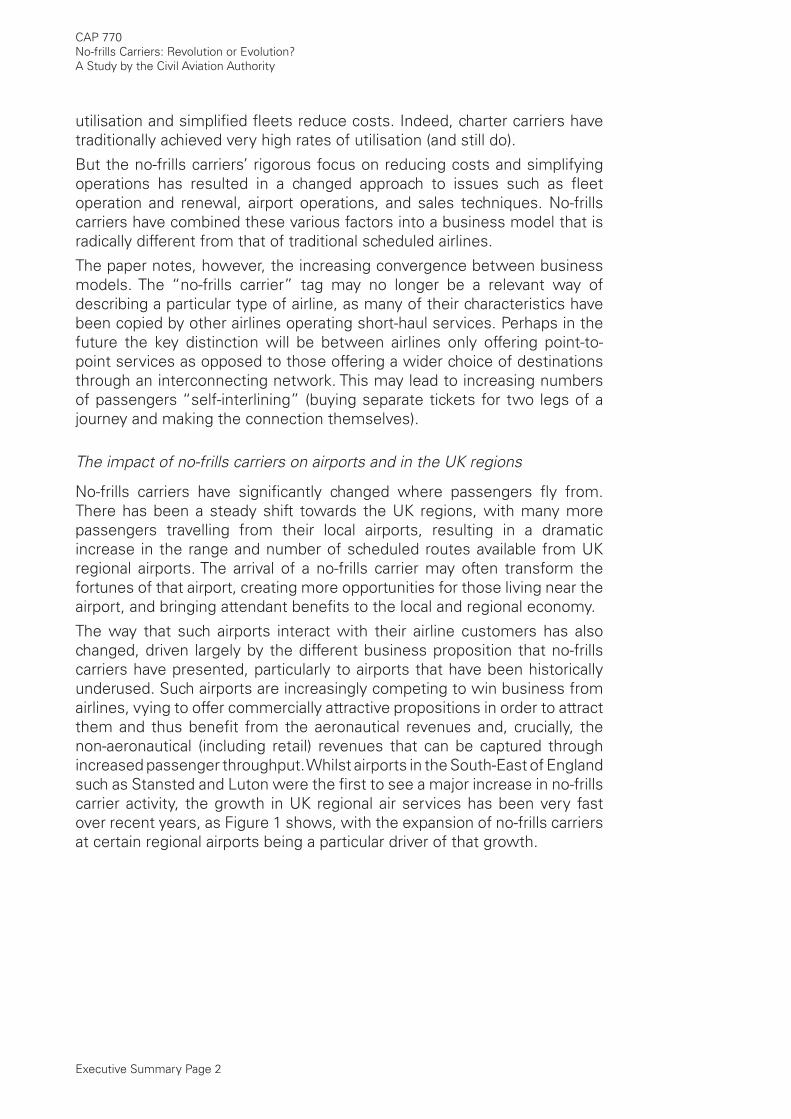
But it is less clear that the growth of the no-frills sector has signifi cantly affected overall rates of traffi c growth. There is an apparent conundrum here. Despite the spectacular growth of no-frills carriers in the UK, and the perceptions about the impact they have had on travel habits, there has been little change in long-term aggregate passenger traffi c growth rates, as Figure 2 shows. Since 1996, annual growth rates have averaged around 5 to 6 per cent — strong growth, but not very different to the rates achieved in previous decades. Growth might have been lower had no-frills carriers not
Executive Summary Page 4
CAP 770No-frills Carriers: Revolution or Evolution?A Study by the Civil Aviation Authority
entered the market. But the CAA’s analysis, including of some individual routes, suggests that, in fact, much of their growth seems to have been at the expense of full-service scheduled carriers, and, even more so, charter carriers.
Whilst on particular routes there appears to be considerable stimulation of new traffi c, this is not uniform and whilst stimulation will be contributing to the annual growth fi gure, it is harder to discern a change in the rate of growth at the level of the market overall.
Figure 2 UK to EU and UK domestic traffi c – combined growth between 1976-2005.
-10%
-5%
0%
5%
10%
15%
20%
1976
1978
1980
1982
1984
1986
1988
1990
1992
1994
1996
1998
2000
2002
2004
0%
5%
10%
15%
20%
25%
30%
35%
40%
45%
50%
Annual growthrates (left-handscale)
Share of no-frills intotal (right-handscale)
10 per. Mov. Avg.(Annual growthrates (left-handscale))
Source: CAA Airport Statistics
Figure 2 also suggests that aggregate growth in traffi c may have become less volatile over time. Part of this may be due to a more stable macroeconomic environment. However, it may also be attributable to no-frills carriers’ tendency to adjust their fares to maintain high load factors on their aircraft, compared with the previous practice of fares remaining relatively fi xed, and passenger traffi c varying with economic circumstances. Volatility in demand may have been replaced to some extent by greater variance in price.
Socio-economic effects
This paper also examines the social and economic impacts of the growth of the no-frills sector in the UK over the last decade.
One question is how far the availability of fl ights on no-frills carriers has resulted in people from lower income groups or socio-economic classifi cations being able to fl y more often. The perception is that this has been one of the major changes fl owing from the entry of no-frills
Executive Summary Page 5
CAP 770No-frills Carriers: Revolution or Evolution?
A Study by the Civil Aviation Authority
carriers, and that lower air fares have led to a change in the income profi le of passengers.
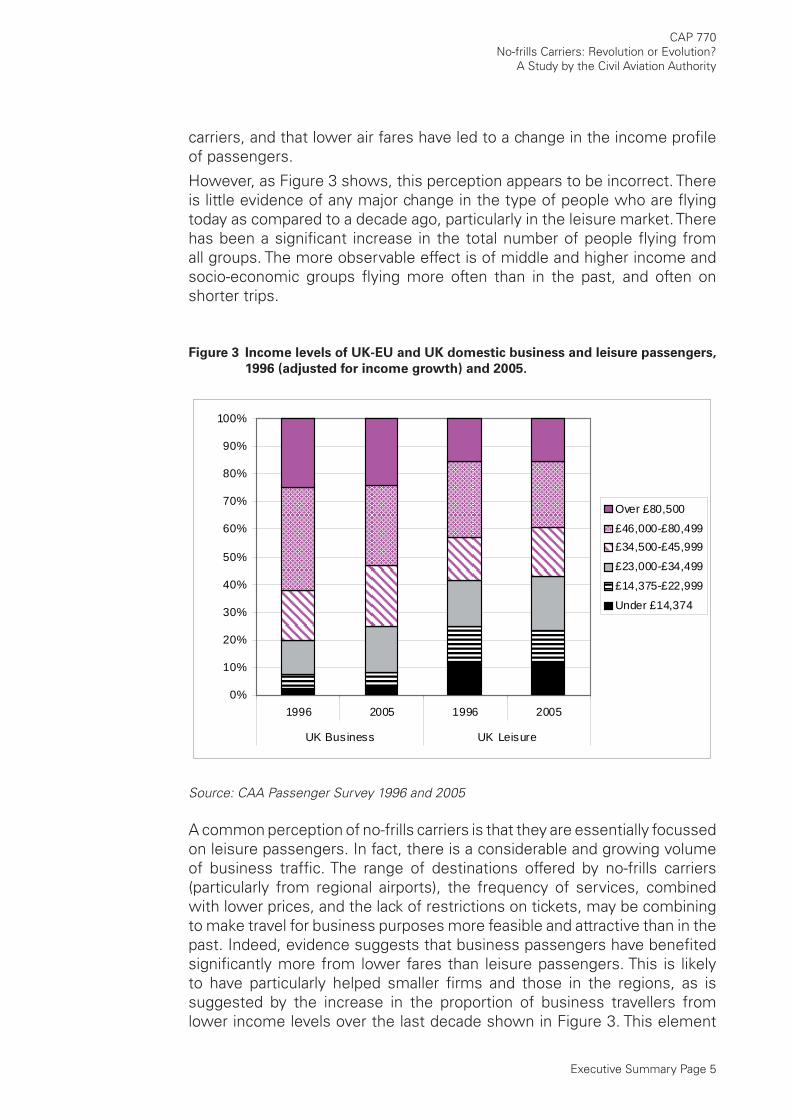
However, as Figure 3 shows, this perception appears to be incorrect. There is little evidence of any major change in the type of people who are fl ying today as compared to a decade ago, particularly in the leisure market. There has been a signifi cant increase in the total number of people fl ying from all groups. The more observable effect is of middle and higher income and socio-economic groups fl ying more often than in the past, and often on shorter trips.
Figure 3 Income levels of UK-EU and UK domestic business and leisure passengers,
1996 (adjusted for income growth) and 2005.
0%
10%
20%
30%
40%
50%
60%
70%
80%
90%
100%
1996 2005 1996 2005
UK Business UK Leisure
Over £80,500
£46,000-£80,499£34,500-£45,999
£23,000-£34,499
£14,375-£22,999
Under £14,374
Source: CAA Passenger Survey 1996 and 2005
A common perception of no-frills carriers is that they are essentially focussed on leisure passengers. In fact, there is a considerable and growing volume of business traffi c. The range of destinations offered by no-frills carriers (particularly from regional airports), the frequency of services, combined with lower prices, and the lack of restrictions on tickets, may be combining to make travel for business purposes more feasible and attractive than in the past. Indeed, evidence suggests that business passengers have benefi ted signifi cantly more from lower fares than leisure passengers. This is likely to have particularly helped smaller fi rms and those in the regions, as is suggested by the increase in the proportion of business travellers from lower income levels over the last decade shown in Figure 3. This element

Executive Summary Page 6
CAP 770No-frills Carriers: Revolution or Evolution?A Study by the Civil Aviation Authority
of no-frills carriers’ business could expand, as they seek to compete more directly with full-service carriers on the ‘thicker’ routes between major EU cities.
The increased number of destinations available from no-frills carriers, particularly to Eastern Europe, may also be facilitating wider social and economic changes. Throughout most of the 1990s the amount of inbound traffi c to the UK on no-frills airlines was relatively small; their main impact was on the choices and fares available to UK residents travelling to Europe. But this has changed in the last few years. Inbound traffi c on no-frills carriers has increased signifi cantly, particularly with the opening of routes to Eastern Europe, most notably Poland. This has coincided with an increase in the numbers of Eastern Europeans taking up job opportunities in the UK following the enlargement of the European Union.
Although migration itself is small as a proportion of total traffi c, it creates follow-on growth in “visiting friends and relatives” (VFR) traffi c as migrants receive visits from friends and relatives and travel back to their countries of origin. These trends are illustrated in the table below, which shows the composition of inbound traffi c at Luton and Stansted between 2000 and 2005. During that same period, inbound traffi c grew from around 24% to around 36% of total traffi c.
Table 1 Change in the composition of inbound passengers (EU – UK) at Luton and
Stansted.
Passengers
2000
Passengers
2005
2000
to 2005
change
Percentage
of total in
2000
Percentage
of total in
2005
Business 0.9m 1.8m 98% 22% 17%
Leisure 1.6m 4.0m 150% 39% 38%
VFR 1.6m 4.8m 198% 39% 45%
Source: CAA Passenger Survey 2000 and 2005
VFR traffi c has been the fastest growing segment of inbound traffi c at Stansted and Luton in recent years. Between 2000 and 2005 it increased by 198%, and is now the largest single component of total inbound traffi c, accounting for almost half of all inbound trips at these two airports.
Conclusions
No-frills carriers have undoubtedly revolutionised the way the short-haul airline market operates. The most marked effect has perhaps been in relation to the availability of low and unrestricted fares, and the considerable increase in the choice of destinations and airports available to passengers.
No-frills carriers have brought a very different philosophy and business model into the European airline sector that has forced existing airlines to
Executive Summary Page 7
CAP 770No-frills Carriers: Revolution or Evolution?
A Study by the Civil Aviation Authority
change their own business and offering in response.
However, in relation to their impact on aggregate traffi c growth, and the profi le of the fl ying public, the effect appears to be more evolutionary, with growth rates staying at broadly similar levels to those achieved before the advent of no-frills carriers, and the passenger mix remaining broadly constant over time.
Acknowledgements
The CAA would like to thank all those who contributed to the discussions that helped inform the development of this study.
Outline of the paper
The paper is structured as follows:
Chapter One briefl y describes the background and context for the advent of no-frills carriers, and sets out the main innovations in the no-frills model, as well as discussing why they only began to make an appearance in the 1990s.
Chapter Two examines the empirical evidence to draw conclusions about the impact of no-frills carriers on total traffi c growth, and the extent to which traffi c is stimulated or substituted.
Chapter Three considers the extent to which no-frills carriers have changed the aviation market, both in relation to how airlines as a whole have responded to the no-frills innovations, and also how airports have changed the way they do business.
Chapter Four looks at the split between leisure and business passengers using no-frills, full-service scheduled and charter carriers, and offers some observations about how this has changed over time.
Finally, Chapter Five assesses the impact of no-frills carriers on society more widely, examining the extent to which lower income groups are using no-frills carriers and discussing a number of other social impacts.
•
•
•
•
•

INTENTIONALLY LEFT BLANK
Chapter 1 Page 1
1 Context and Background
The airline market before the advent of no-frills carriers
1.1 It is sometimes easy to forget how much the short-haul airline sector has changed over recent years, as the ability to fl y from a range of destinations, with a choice of airlines, and often at relatively low cost has become accepted as the norm.
1.2 Before the emergence and development of no-frills carriers, which in the EU resulted from the signifi cant liberalisation of the market in the early 1990s, the airline sector was dominated by two basic types of airlines; traditional scheduled carriers and charter carriers. Those wishing to travel by air faced a more restricted set of options in almost every area of their travelling experience.
1.3 The traditional scheduled carrier would usually offer services with fi xed (“scheduled”) departure times which would be operated across an entire traffi c season. They often faced little competition on the routes they operated, and there was no tradition of vigorous cost cutting. Scheduled airlines usually provided more than one class of service, and offered the full range of services associated at that time with fl ying (free drinks and food; single ticket connections; the possibility of interlining with other carriers). They also tended to operate only to recognised primary airports, and the process of booking a fl ight would invariably involve using a travel agent as an intermediary, who would book fl ights through global and highly complex reservation systems.
1.4 Charter carriers, by contrast, usually served the inclusive tour market. Package holiday companies would have arrangements with a charter airline to take their holidaymakers from their home country to their holiday destination and back. For the customer, this arrangement was invisible as the fl ight came with the holiday. The airlines did not sell tickets to individuals, but took large-scale bookings from the holiday companies. Over time, these arrangements often developed into the airline becoming part of a vertically integrated operation, owned by the holiday company. As part of the price conscious leisure market, charter carriers focused on reducing their costs, with cheaper operations and higher density seating, and achieved higher load factors than scheduled carriers. Charter carriers historically laid claim to being the fi rst “low-cost carriers”.
1.5 While there were some examples of airlines that did not conform to this scheduled/charter carrier characterisation, they tended to operate in specialised niche markets and were often short-lived.
Chapter 1 Page 2
CAP 770No-frills Carriers: Revolution or Evolution?A Study by the Civil Aviation Authority
The regulatory framework
1.6 The airline industry has historically been characterised by very high levels of government interference, with the international airline market in particular typifi ed by a high degree of constraint on airlines’ economic freedom. International fl ights (including those between two European countries) tended in the past to be tightly constrained through bilateral agreements between the relevant countries, which would, inter alia, specify which carriers could operate, between which airports, and how often. In some cases, the agreement extended to pooling the revenue earned by the two national carriers on a route. In addition, almost all scheduled carriers were members of the International Air Transport Association (IATA), which provided a further set of restrictions, including a system whereby airlines would agree tariffs between them at IATA tariff conferences. In 1992, with the exception of the UK, every Government in the then EU had a fi nancial stake in its major scheduled airline, most with a majority stake or total ownership.
1.7 Charter carriers operated under a more relaxed regulatory regime. They were usually allowed to provide services conditional on the fl ights being part of an inclusive tour holiday. This meant that they were not generally subject to the same bilateral limits that applied to scheduled carriers, and were not constrained in the fares that they could offer, as the IATA tariff conferences only covered scheduled airlines. There could however be Government restrictions, e.g. limiting the number of fl ights. Charter carriers could not typically offer fares direct to individual passengers, but only through contracts with the holiday companies.
1.8 Over time, there was some relaxation in the restrictions contained in bilateral agreements, as Governments at varying paces began to move towards more liberal arrangements. New scheduled carriers emerged in the 1970s and 1980s, particularly in the UK, and the market experienced strong traffi c growth. These airlines still faced limits on the extent to which they could compete on price, frequency and destination, although a wider range of fares aimed at the growing leisure market developed alongside the existing ‘full’ fares. In addition, the substantial charter market began to change, as holiday companies sold some of the seats they had purchased from the charter carriers directly to the public, known as “seat-only” sales. However, these seat-only tickets were not widely available, nor were they offered on a stable on-going basis. They had little of the fl exibility that no-frills carriers offer today – not least as they operated a charter timetable, which meant that they did not match the levels of frequency and consistency throughout a traffi c season, that a scheduled service would offer.
1.9 This sharp distinction between charter carriers and scheduled carriers was reduced (at least for services within the EU) once the EU market was substantially liberalised in 1992. From this point on, it
Chapter 1 Page 3
CAP 770No-frills Carriers: Revolution or Evolution?
A Study by the Civil Aviation Authority
made little difference in terms of regulatory treatment as to whether a fl ight was classifi ed as scheduled or chartered. Restrictions on seat-only fl ights were removed, and there was some move towards this model of selling by the holiday companies and charter carriers themselves. However, more importantly, the opening up of the EU airline market created new opportunities that could be exploited by new entrant airlines, as is discussed in the next section.
The development of the no-frills model
1.10 A 1998 study conducted by the UK CAA1 described the emergence of no-frills carriers as a ‘third way’ in European aviation. The study argued that no-frills carriers brought together costs at the levels associated with charter carriers with the convenience, if not the comfort, of full-service scheduled carriers. Since then several books have been written on the subject, including that by Calder2, which charts the history of no-frills carriers starting with Freddie Laker, and describes the different strategies and tactics with which they compete against each other and against full-service and charter carriers during what he calls “the low-cost revolution in the skies”.
1.11 This report does not aim to provide a defi nitive account of all aspects of no-frills carriers. Rather, it seeks to provide a brief and generalised overview of their model, before going on to look at some of the more interesting issues arising from an analysis of the data available to the CAA, and what this suggests about the impact of the growth of no-frills carriers.
1.12 It is generally agreed that the development of no-frills carriers in Europe can be traced back to the emergence of Ryanair and easyJet. Ryanair, an Irish carrier, was the fi rst no-frills carrier to appear in Europe, when it restructured its existing operations in 1991 and adopted the no-frills model, borrowing heavily from the template provided by the US no-frills carrier, Southwest Airlines (which had been in existence since 1971). Ryanair began by selling seats on fl ights between Ireland and the UK, initially focussed on Luton and some regional UK airports. easyJet, a UK carrier, began operations in 1995 with two aircraft, offering fl ights between Luton and Scotland.
1.13 It is important to note that these new no-frills carriers were offering “scheduled” services; they were not a variant of the charter model. Seats were sold direct to the public and services were operated throughout a traffi c season, and with suffi cient frequency to allow for varying lengths of trip by the passenger.
1.14 In 1998, BA responded to these developments in the shape of a no-frills Stansted-based subsidiary, Go, which was eventually purchased in 2002 by easyJet. The increasingly competitive market also led
1 The Single European Aviation Market: the First Five Years (CAP 685), CAA June 1998.2 Calder, S. No-Frills: the Truth behind the Low-cost Revolution in the Skies, Virgin Books, 2002.
Chapter 1 Page 4
CAP 770No-frills Carriers: Revolution or Evolution?A Study by the Civil Aviation Authority
KLM UK to change their business model to a no-frills approach and to rebrand as buzz, which was launched in 2000, and then purchased by Ryanair in 2003. British European also re-launched itself as a no-frills carrier, fl ybe, in 2002, and acquired the majority of BA Connect in November 2006. In the last few years, several holiday companies and charter carriers have launched scheduled no-frills subsidiaries, such as Monarch and Thomsonfl y.
1.15 Both Ryanair and easyJet grew rapidly in the late 1990s, with a strong focus on lowering their costs and offering cheaper tickets. Both are still growing rapidly, extending their operations beyond their original markets to encompass routes across Europe, with bases in many European countries. There has also been an increase in the total number of scheduled carriers active in European short-haul markets (around 96 active scheduled carriers in 2006 compared to about 70 in 1992), with almost all the new entrants operating the no-frills model. There has, of course, also been considerable churn in the market, with many companies exiting as well as entering.
What is a no-frills carrier?
1.16 This paper uses the term “no-frills carrier” instead of “low-cost carrier” (another commonly used label) not least to avoid the confusion with charter carriers which have always considered themselves to be low cost operations. The comparative lack of frills on board compared to traditional carriers has been seen, at least in the past, as one of the defi ning characteristics of this airline type, along with the low fares they offer. Judging whether an airline has high or low costs is both more complicated than assessing its on-board services, and also potentially less relevant (if, say, an airline is pursuing a high fare market).
1.17 There is no exact defi nition of a no-frills carrier. Instead there is a general understanding in the sector, in the media and among the general public of what they are, and what they are not. This tends to revolve around their operating model on one hand and the services they offer (the ‘consumer product’) on the other. Lawton (2000) describes in detail the different models adopted by no-frills carriers3. The brief description offered here merely attempts a summary overview, and the paper identifi es no-frills carriers based primarily on whether they have a single class of travel, offer frills on board and are not connected to the international reservations systems4.
1.18 Although there are variants, the typical no-frills consumer product is built around only offering a single class of service on-board, high density seating, with few or no frills, such as free food and drinks. There also tends to be no differentiation of service on the
3 Lawton, C. Cleared for Take-Off: Structure and strategy in European low fare business, Ashgate, (2000)
4 The Appendix to this document contains a list of the no-frills carriers used for this study – for some carriers an element of subjective judgement was applied.
Chapter 1 Page 5
CAP 770No-frills Carriers: Revolution or Evolution?
A Study by the Civil Aviation Authority
ground, i.e. no business class lounges or fast track check-in lines. No-frills carriers generally do not offer frequent fl yer programmes. All these aspects of the model are focussed on reducing costs and simplifying the consumer product, with, for example, high density seating leading to a higher number of seats on an aircraft than a full-service carrier would have, reducing the cost per seat.
1.19 The no-frills operating model is typically seen as having several elements, all of which help reduce operating costs5. The fi rst is a simplifi ed fl eet structure (often with only a single aircraft type), which reduces maintenance and pilot costs, and makes scheduling aircraft easier. The second is quick turnaround times, which increases aircraft utilisation and therefore the productive fl ying time of the aircraft. The third (and less universal across various no-frills carriers) is the greater use of secondary airports, which are generally cheaper, and also emptier, allowing quicker operations than the main hub airports. The fourth is that they focus on shorter routes, allowing them to maximise the number of trips made by each aircraft. Fifthly, ticket sales are carried out directly by the airline, reducing the costs of sales. And fi nally, and perhaps most importantly in terms of what truly differentiates them from network operators, fl ights are normally only available on a point-to-point basis, with the carriers not providing for connecting services.
1.20 The traditional scheduled carriers are now often referred to as full-service carriers, to differentiate them from no-frills carriers. However, these airlines have changed their own operations in response to the growth of no-frills carriers, so the degree of difference may be less than in the past. Many charter carriers have also responded to changed market circumstances, for example by beginning to offer seat-only tickets, or setting up subsidiaries which operate as scheduled no-frills carriers (and are classed as such in this paper).
1.21 All of this serves to blur the once-sharp distinction between the various airline types operating in the market. It is becoming harder to draw fi rm lines between the different types and it is questionable how far the no-frills/full-service distinction remains pertinent today.
No-frills carriers – the main innovations
1.22 No-frills carriers have brought a number of innovations to the airline sector, perhaps most obviously in relation to simplifying the consumer product, offering fewer frills on-board in return for a lower fare. But this is only one part of the story, and the following paragraphs briefl y consider some of the elements common to the no-frills business model. This is not intended to be an exhaustive analysis, not least because the existing literature already covers the ground fully.
5 The Cranfi eld University, Air Transport Group, Market Analysis of Europe’s Low Cost Airlines, pro-vides an ongoing review of the economics and operating model of charter and no-frills airlines
Chapter 1 Page 6
CAP 770No-frills Carriers: Revolution or Evolution?A Study by the Civil Aviation Authority
Fares innovations
1.23 No-frills carriers introduced new, simpler fare models built around pricing one-way trips. Their focus on pricing each leg of a journey was combined with elimination of the complex ticket restrictions that tended to be part of the return fares available on traditional carriers. For example, return fares used to be much cheaper if they encompassed a Saturday night stay, whereas same day returns were often the most expensive of all.
1.24 The no-frills carriers also introduced yield management systems where fares are released in fare ‘buckets’, with the price increasing as the buckets are emptied. This means that the cheapest fares are those available in advance, with the price generally rising as the departure date approaches. This was different from the approach of traditional airlines, which would sell seats at a variety of fares simultaneously, with the fare being dependent on the conditions attached to the type of ticket purchased.
Direct sales
1.25 No-frills carriers’ use of direct ticket sales, and the exclusion of their fl ights from the traditional reservations systems, considerably lowered their sales costs. A high proportion of the costs of traditional legacy carriers (typically around 15%) were comprised of distribution costs – in particular linked to the use of travel agents. No-frills carriers eliminated much of these costs.
1.26 Originally, no-frills carriers used telephone call centres for much of their sales, a radical and cost-saving innovation at the time. No-frills carriers were also among the prime movers towards using the internet as the point of sale. This helped drive a wholesale change in how people booked their travel, and the simplicity of web sales initially provided no-frills carriers with a competitive advantage. Now all major airlines make extensive use of internet sales. But no-frills carriers have been particularly successful in ensuring that the vast majority of their sales are through their websites, so driving a continuing cost advantage.
Point-to-point services
1.27 No-frills carriers generally offer point-to-point services. This means that passengers are not explicitly provided with the opportunity of connecting between fl ights on the same carrier, or interlining with other carriers (although the data shows that a small percentage of passengers are “self-interlining” using no-frills carriers, by purchasing two separate tickets). This move away from the concept of facilitated connections and networks offered by the traditional full-service carriers has reduced costs and allowed for simplifi ed fare structures, including the development of one-way ticket pricing.
Chapter 1 Page 7
CAP 770No-frills Carriers: Revolution or Evolution?
A Study by the Civil Aviation Authority
1.28 The rejection of a network model in favour of point-to-point services was a key element in the success of no-frills carriers simplifying their operations. Providing scheduled services, but without offering connections, was a revolutionary move away from how airlines traditionally operated, and facilitated other parts of the no-frills model.
Using regional/secondary airports and achieving high utilisation of aircraft
1.29 The use of previously under-used airports brought both operational savings from quick turnarounds of aircraft (allowing a higher number of rotations per day) and direct cost savings through lower airport charges, as these airports are generally cheaper than the busier, established airports and hubs. No-frills carriers usually achieve very high rates of aircraft utilisation, although this is also (and has traditionally been) a feature of charter carrier operations too.
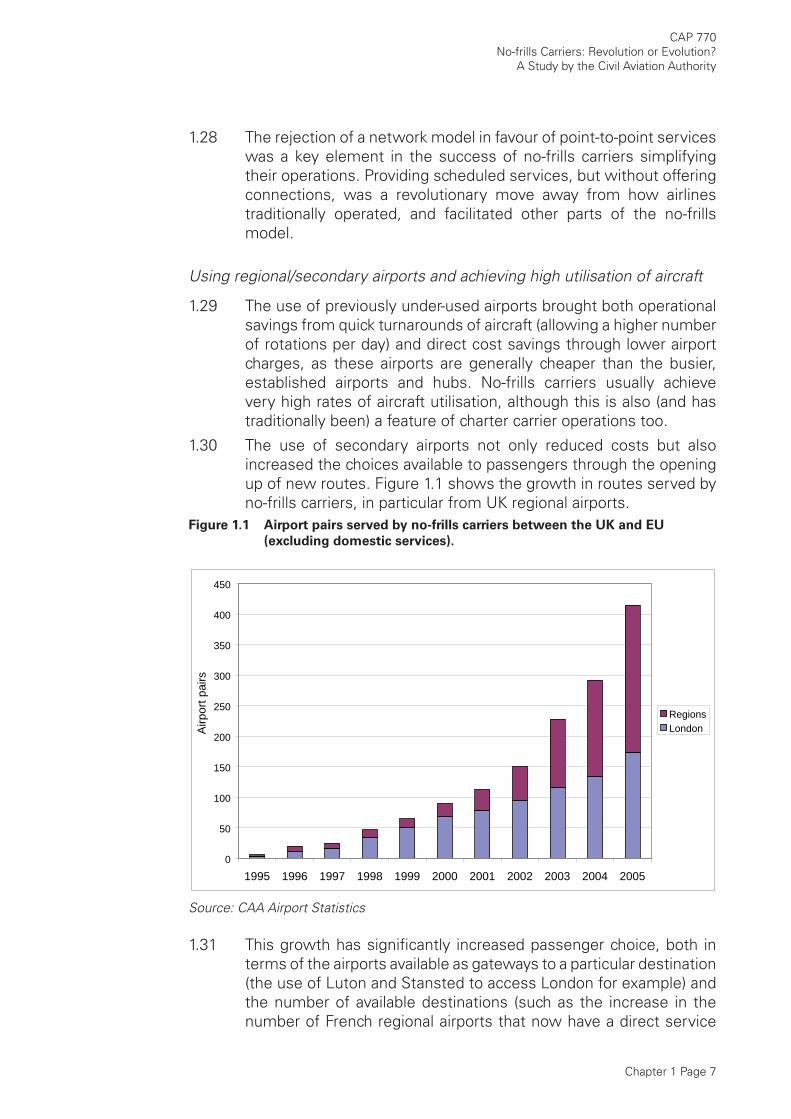
1.30 The use of secondary airports not only reduced costs but also increased the choices available to passengers through the opening up of new routes. Figure 1.1 shows the growth in routes served by no-frills carriers, in particular from UK regional airports.
Figure 1.1 Airport pairs served by no-frills carriers between the UK and EU
(excluding domestic services).
0
50
100
150
200
250
300
350
400
450
1995 1996 1997 1998 1999 2000 2001 2002 2003 2004 2005
Airp
ort p
airs
RegionsLondon
Source: CAA Airport Statistics
1.31 This growth has signifi cantly increased passenger choice, both in terms of the airports available as gateways to a particular destination (the use of Luton and Stansted to access London for example) and the number of available destinations (such as the increase in the number of French regional airports that now have a direct service
Chapter 1 Page 8
CAP 770No-frills Carriers: Revolution or Evolution?A Study by the Civil Aviation Authority
from London airports).
1.32 Increased route choice, brought about by no-frills carriers, has been particularly noticeable at UK regional airports. As the CAA’s 2005 study into regional air services6 showed, there has been a huge increase in the use of UK regional airports and the destinations available from them. Between 1995 and 2005 the total traffi c at UK regional airports grew from 46.6m to 94.7m, an average annual growth rate of 7.3%.
Single aircraft type with single cabin class
1.33 Another feature common to most no-frills carriers is that they often operate a fl eet comprised wholly or primarily of a small number of aircraft types (such as the Boeing 737 or Airbus A319/320). These aircraft are also confi gured in a single cabin class, rather than having a business/economy split, and generally with a higher seating density than on full-service carriers.
1.34 This allows the airline to maximise capacity, simplify its operations and minimise costs of staff training. It can also help to reduce lease or purchase costs through enhanced bargaining power with manufacturers/lessors.
Lower labour costs and high staff productivity
1.35 No-frills carriers have also made effi cient use of labour, both by increasing the productivity of their workforce compared to full-service carriers, and also, by dint of being new entrants, avoiding some of the legacy costs that longer-established carriers have had to cope with, such as heavy pensions liabilities.
Focus on cost
1.36 But the main innovation of no-frills carriers has perhaps been to develop businesses where, having ensured safe operations, the main focus has been to reduce cost as a means of driving profi t (as opposed to the traditional focus on maximising revenues), and increasing ancillary revenues.
1.37 In this way, no-frills carriers have brought the airline business much closer to other industries, where cost tends to be one of the key drivers of strategy and marketing. This is not to say that the traditional airlines ignored costs, but rather that government regulation and control of the airline sector and other restrictions on competition created distortions that may have meant that airlines either did not have to compete so hard to win business, or tended to compete more on service quality than cost.
6 UK Regional Air Services - A study by the Civil Aviation Authority, CAP 754, 2005.
Chapter 1 Page 9
CAP 770No-frills Carriers: Revolution or Evolution?
A Study by the Civil Aviation Authority
Why did no-frills carriers not emerge in Europe before the 1990s?
1.38 Given the discussion above, the success of no-frills carriers seems to be attributable less to some technological invention, and more to the very successful adoption of many elements of the Southwest Airlines model, and the application of known operational concepts in a comprehensive and innovative way, aligned with the adoption of a rigorous and previously unseen (in Europe at least) focus on costs.
1.39 Why, therefore, did no-frills carriers not emerge earlier in Europe? And why has their growth been strongest in the UK? In essence, this is linked to the timing of the deregulation of the EU airline market, which created the business opportunities (previously denied) for new entrant airlines to exploit.
1.40 Whilst the high-profi le individuals associated with airlines such as easyJet and Ryanair have undoubtedly played an important, and essentially unquantifi able, part in driving the success of their companies, it is regulatory reform that provided the essential conditions to allow them to do so. The deregulation of the airline market in Europe in the 1990s is therefore key to understanding why the development of the no-frills carriers happened when it did.
1.41 The “third package” of airline market deregulation in the European Union was completed in 1992. This allowed carriers from any Member State to fl y any route throughout the EU. This was critical to the success of the no-frills carriers as not only did it remove frequency limits on routes, and from where airlines could operate, it also liberalised air fares, allowing the no-frills carriers to offer cheap fares.
1.42 Other airlines had tried to break into the European scheduled market before the arrival of no-frills carriers. Even before 1992, the UK had several airlines independent of British Airways (BA), offering competing services on domestic UK and European routes. However, these were usually run on a similar basis to the traditional scheduled carriers, offered a similar product, and were relatively small scale operations, certainly compared to BA. But, perhaps more importantly, the extent to which they could compete was limited by bilateral agreements and the IATA tariff-setting system.
1.43 The UK moved towards deregulation in its domestic market and on a bilateral basis in some EU markets (starting with the UK-Netherlands agreement in 1984) before EU-wide liberalisation was progressed. The UK/Ireland market was also deregulated in 1986, and it was in that market that Ryanair fi rst started offering lower fares, before transforming itself into a no-frills carrier.
1.44 The earlier deregulation of elements of the airline market in the UK (and, a little later, in Ireland), and the longer tradition of having a
Chapter 1 Page 10
CAP 770No-frills Carriers: Revolution or Evolution?A Study by the Civil Aviation Authority
number of competing full-service carriers, may be one reason why the no-frills carrier explosion in Europe happened earlier in the UK and Ireland than in other Member States. The fact that both countries are islands also helps to stimulate the attractiveness of air travel over surface transport modes, with the UK population traditionally exhibiting one of the highest propensities to fl y in Europe. These factors, set alongside growing incomes in both countries, may have combined to help easyJet and Ryanair to make the most of the new opportunities they could offer passengers, and to become by far the most successful no-frills carriers in Europe, spreading beyond their original UK and Irish markets to set up new routes and bases across the continent.
1.45 The activities of no-frills carriers, like all airlines, create environmental costs. The CAA believes that aviation should meet its full costs, including those imposed on the environment, is supportive of efforts to include aviation within the European Emissions Trading Scheme and has worked actively with Government to that end. This paper does not attempt to address the environmental issue, but it is hoped that the information provided about the effect that no-frills carriers have had on the aviation market will contribute to a more informed debate on this and other policy questions.
Conclusions
1.46 This chapter has suggested that the growth of no-frills carriers was a product of the successful application of an innovative business model, taking advantage of opportunities which were made possible by the deregulation of the aviation market in Europe, and in particular in the UK and Ireland. This is not to underestimate the achievements in developing these airlines, and the impact they have had, but to note that the market opportunities needed to be created by deregulation before they could be taken up. The following chapters now turn to assessing the impact that the growth of the no-frills carriers has had on the aviation industry, on passengers, and on society more broadly.
Chapter 2 Page 1
2 The Growth of No-frills
Carriers and their Impact on
Total Traffi c Growth
Background
2.1 The no-frills model has proved very successful in the UK. Before the 1990s, no-frills carriers were absent from the European market1. Just ten years ago, there were only four no-frills carriers, operating from ten UK airports to just twelve destinations in seven European countries. Today, there are 22 no-frills carriers operating from about 35 airports in the UK to more than 150 international destinations.
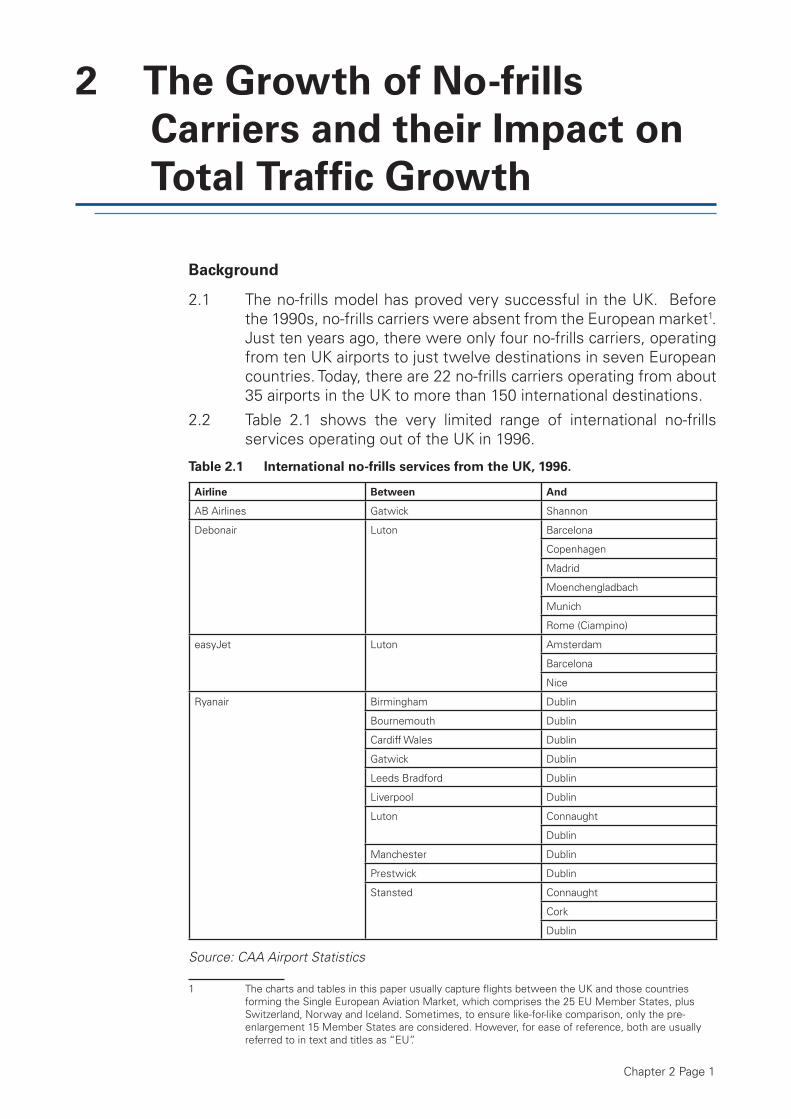
2.2 Table 2.1 shows the very limited range of international no-frills services operating out of the UK in 1996.
Table 2.1 International no-frills services from the UK, 1996.
Airline Between And
AB Airlines Gatwick Shannon
Debonair
Luton
Barcelona
Copenhagen
Madrid
Moenchengladbach
Munich
Rome (Ciampino)
easyJet
Luton
Amsterdam
Barcelona
Nice
Ryanair
Birmingham Dublin
Bournemouth Dublin
Cardiff Wales Dublin
Gatwick Dublin
Leeds Bradford Dublin
Liverpool Dublin
Luton
Connaught
Dublin
Manchester Dublin
Prestwick Dublin
Stansted
Connaught
Cork
Dublin
Source: CAA Airport Statistics
1 The charts and tables in this paper usually capture fl ights between the UK and those countries forming the Single European Aviation Market, which comprises the 25 EU Member States, plus Switzerland, Norway and Iceland. Sometimes, to ensure like-for-like comparison, only the pre-enlargement 15 Member States are considered. However, for ease of reference, both are usually referred to in text and titles as “EU”.
Chapter 2 Page 2
CAP 770No-frills Carriers: Revolution or Evolution?A Study by the Civil Aviation Authority
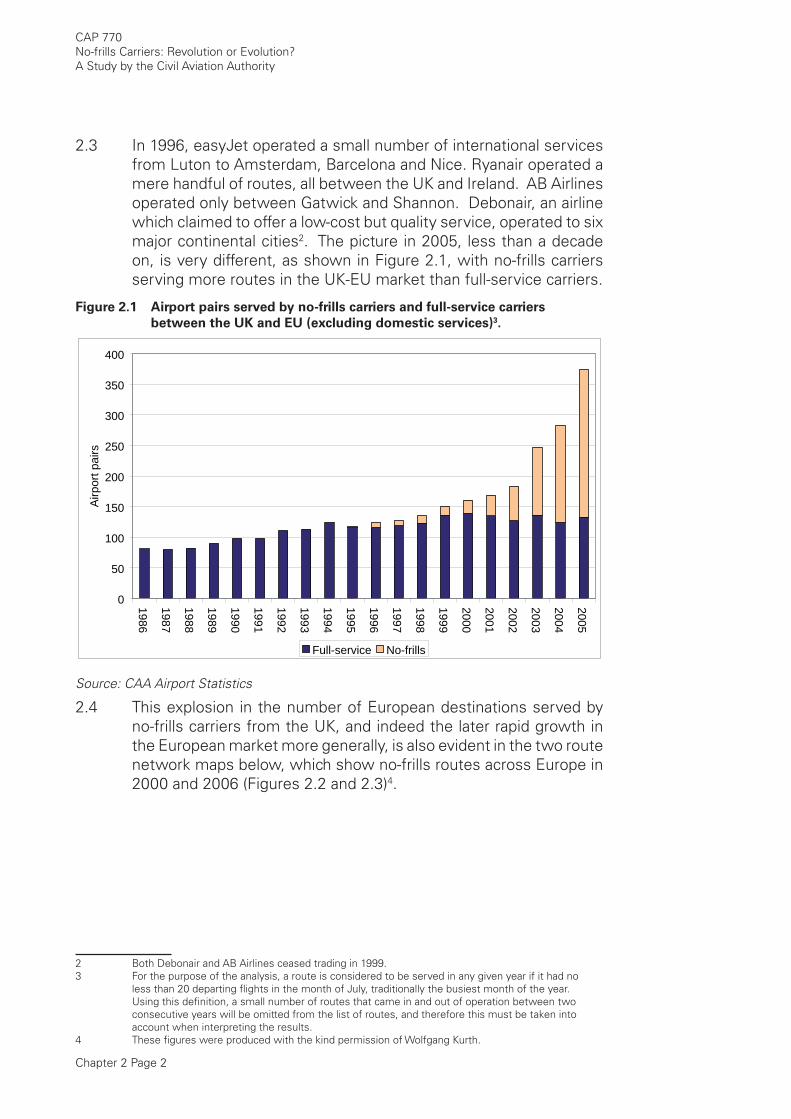
2.3 In 1996, easyJet operated a small number of international services from Luton to Amsterdam, Barcelona and Nice. Ryanair operated a mere handful of routes, all between the UK and Ireland. AB Airlines operated only between Gatwick and Shannon. Debonair, an airline which claimed to offer a low-cost but quality service, operated to six major continental cities2. The picture in 2005, less than a decade on, is very different, as shown in Figure 2.1, with no-frills carriers serving more routes in the UK-EU market than full-service carriers.
Figure 2.1 Airport pairs served by no-frills carriers and full-service carriers
between the UK and EU (excluding domestic services)3.
0
50
100
150
200
250
300
350
400
1986
1987
1988
1989
1990
1991
1992
1993
1994
1995
1996
1997
1998
1999
2000
2001
2002
2003
2004
2005
Airp
ort p
airs
Full-service No-frills
Source: CAA Airport Statistics
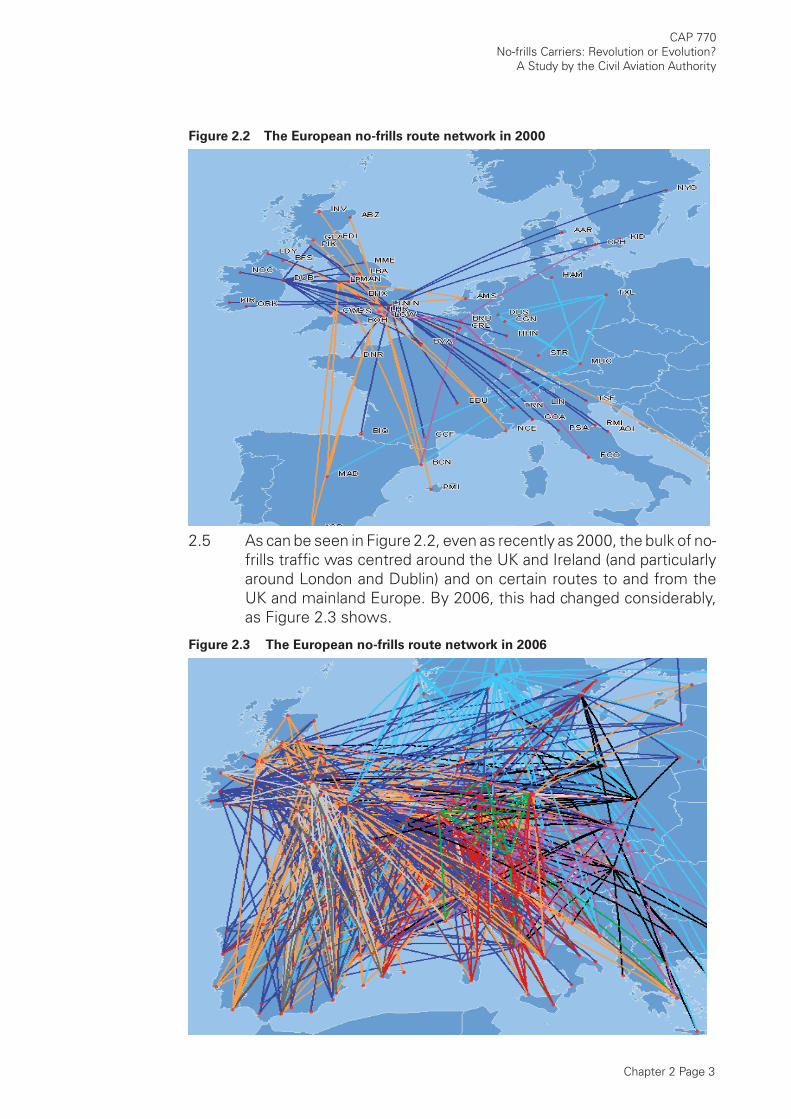
2.4 This explosion in the number of European destinations served by no-frills carriers from the UK, and indeed the later rapid growth in the European market more generally, is also evident in the two route network maps below, which show no-frills routes across Europe in 2000 and 2006 (Figures 2.2 and 2.3)4.
2 Both Debonair and AB Airlines ceased trading in 1999.3 For the purpose of the analysis, a route is considered to be served in any given year if it had no
less than 20 departing fl ights in the month of July, traditionally the busiest month of the year. Using this defi nition, a small number of routes that came in and out of operation between two consecutive years will be omitted from the list of routes, and therefore this must be taken into account when interpreting the results.
4 These fi gures were produced with the kind permission of Wolfgang Kurth.
Chapter 2 Page 3
CAP 770No-frills Carriers: Revolution or Evolution?
A Study by the Civil Aviation Authority
Figure 2.2 The European no-frills route network in 2000
2.5 As can be seen in Figure 2.2, even as recently as 2000, the bulk of no-frills traffi c was centred around the UK and Ireland (and particularly around London and Dublin) and on certain routes to and from the UK and mainland Europe. By 2006, this had changed considerably, as Figure 2.3 shows.
Figure 2.3 The European no-frills route network in 2006
Chapter 2 Page 4
CAP 770No-frills Carriers: Revolution or Evolution?A Study by the Civil Aviation Authority
2.6 Today, no-frills carriers operate from many UK airports to a wide array of destinations across the EU, and also operate services from bases in other EU countries. More recently, no-frills carriers have started services between the UK and North Africa and Turkey, in the search for further growth opportunities in these mid-haul markets that are still within the range of the typical no-frills aircraft type.
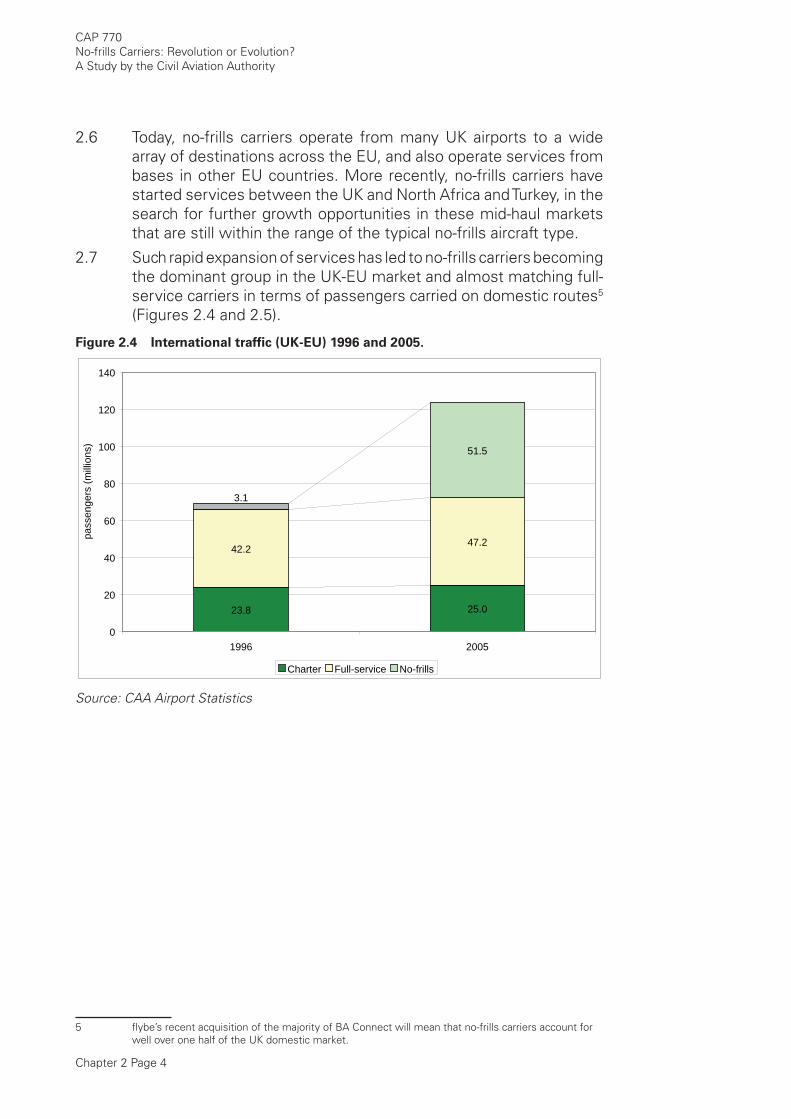
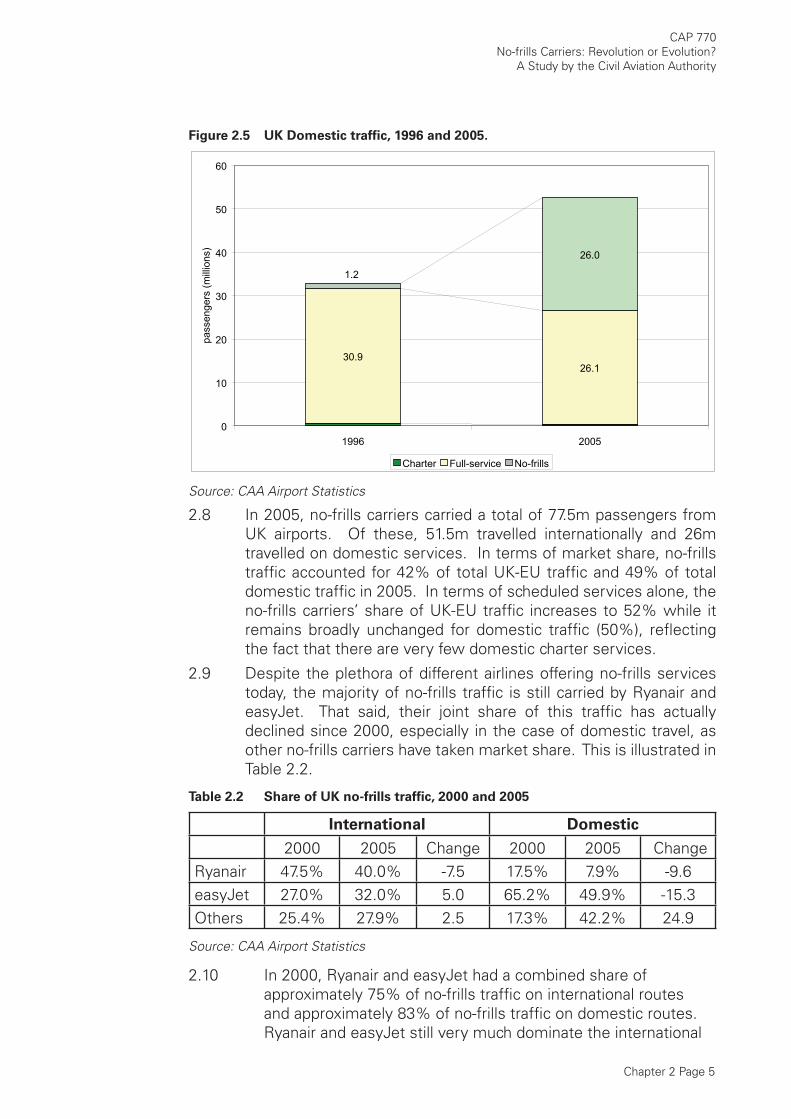
2.7 Such rapid expansion of services has led to no-frills carriers becoming the dominant group in the UK-EU market and almost matching full-service carriers in terms of passengers carried on domestic routes5 (Figures 2.4 and 2.5).
Figure 2.4 International traffi c (UK-EU) 1996 and 2005.
23.8 25.0
42.247.2
51.5
3.1
0
20
40
60
80
100
120
140
1996 2005
pass
enge
rs (m
illio
ns)
Charter Full-service No-frills
Source: CAA Airport Statistics
5 fl ybe’s recent acquisition of the majority of BA Connect will mean that no-frills carriers account for well over one half of the UK domestic market.
Chapter 2 Page 5
CAP 770No-frills Carriers: Revolution or Evolution?
A Study by the Civil Aviation Authority
Figure 2.5 UK Domestic traffi c, 1996 and 2005.
26.1
26.0
30.9
1.2
0
10
20
30
40
50
60
1996 2005
pass
enge
rs (m
illio
ns)
Charter Full-service No-frills
Source: CAA Airport Statistics
2.8 In 2005, no-frills carriers carried a total of 77.5m passengers from UK airports. Of these, 51.5m travelled internationally and 26m travelled on domestic services. In terms of market share, no-frills traffi c accounted for 42% of total UK-EU traffi c and 49% of total domestic traffi c in 2005. In terms of scheduled services alone, the no-frills carriers’ share of UK-EU traffi c increases to 52% while it remains broadly unchanged for domestic traffi c (50%), refl ecting the fact that there are very few domestic charter services.
2.9 Despite the plethora of different airlines offering no-frills services today, the majority of no-frills traffi c is still carried by Ryanair and easyJet. That said, their joint share of this traffi c has actually declined since 2000, especially in the case of domestic travel, as other no-frills carriers have taken market share. This is illustrated in Table 2.2.
Table 2.2 Share of UK no-frills traffi c, 2000 and 2005
International Domestic
2000 2005 Change 2000 2005 Change Ryanair 47.5% 40.0% -7.5 17.5% 7.9% -9.6easyJet 27.0% 32.0% 5.0 65.2% 49.9% -15.3Others 25.4% 27.9% 2.5 17.3% 42.2% 24.9
Source: CAA Airport Statistics
2.10 In 2000, Ryanair and easyJet had a combined share of approximately 75% of no-frills traffi c on international routes and approximately 83% of no-frills traffi c on domestic routes. Ryanair and easyJet still very much dominate the international
Chapter 2 Page 6
CAP 770No-frills Carriers: Revolution or Evolution?A Study by the Civil Aviation Authority
combined share in excess of two-thirds of the total traffi c in 2005. However, their combined share of the growing domestic market shrunk between 2000 and 2005 by 25 percentage points to under 60% of the total.
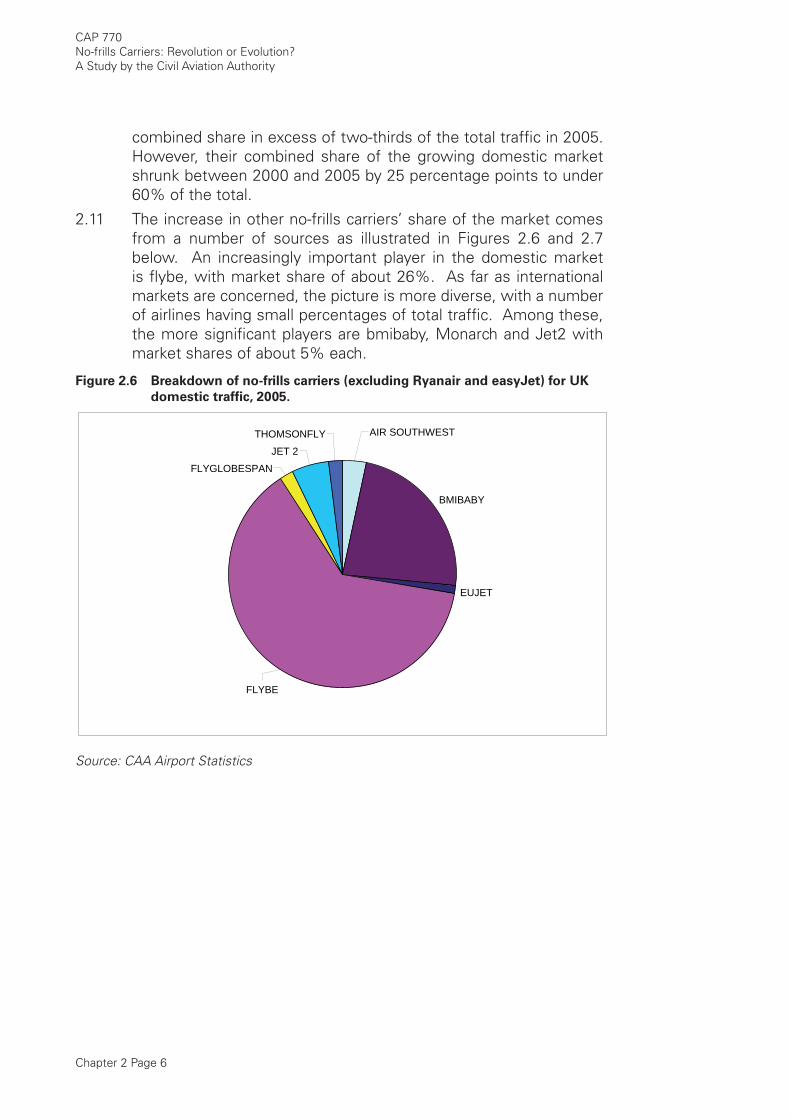
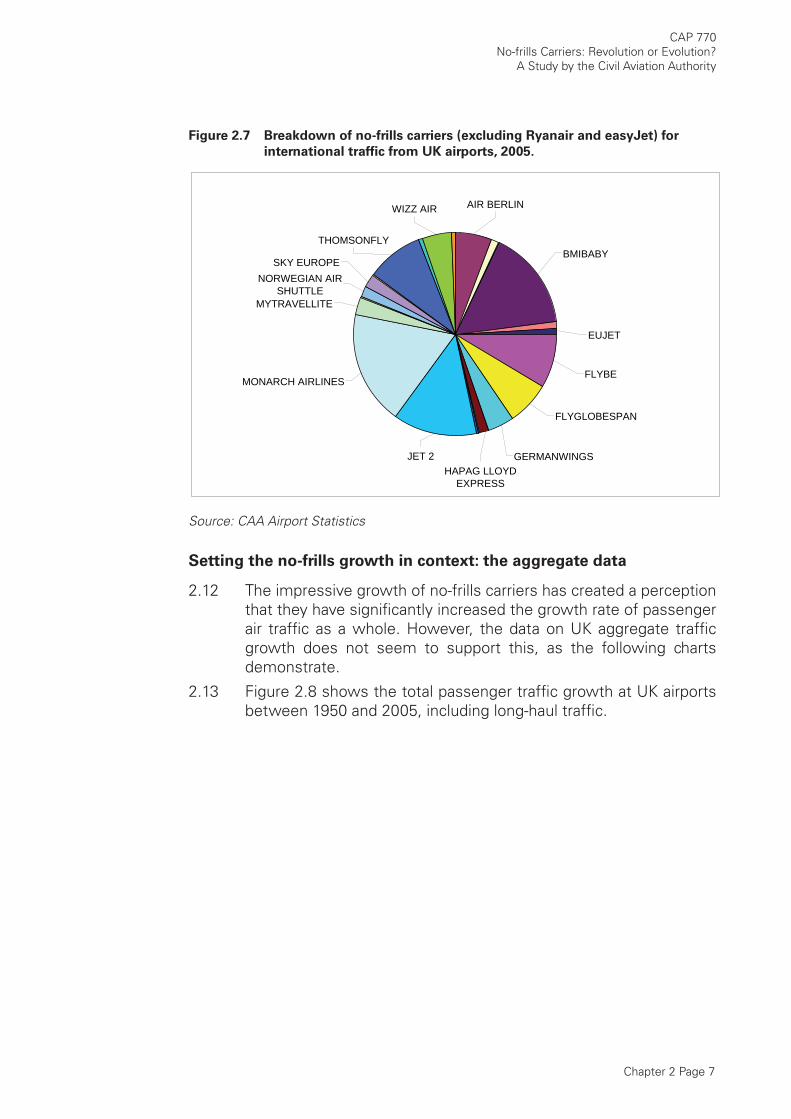
2.11 The increase in other no-frills carriers’ share of the market comes from a number of sources as illustrated in Figures 2.6 and 2.7 below. An increasingly important player in the domestic market is fl ybe, with market share of about 26%. As far as international markets are concerned, the picture is more diverse, with a number of airlines having small percentages of total traffi c. Among these, the more signifi cant players are bmibaby, Monarch and Jet2 with market shares of about 5% each.
Figure 2.6 Breakdown of no-frills carriers (excluding Ryanair and easyJet) for UK
domestic traffi c, 2005.
EUJET
FLYGLOBESPAN
THOMSONFLY AIR SOUTHWEST
JET 2
FLYBE
BMIBABY
Source: CAA Airport Statistics
Chapter 2 Page 7
CAP 770No-frills Carriers: Revolution or Evolution?
A Study by the Civil Aviation Authority
Figure 2.7 Breakdown of no-frills carriers (excluding Ryanair and easyJet) for
international traffi c from UK airports, 2005.
HAPAG LLOYD EXPRESS
NORWEGIAN AIR SHUTTLE
SKY EUROPE
GERMANWINGS
MYTRAVELLITE
WIZZ AIR AIR BERLIN
MONARCH AIRLINES
EUJET
FLYGLOBESPAN
THOMSONFLY
JET 2
FLYBE
BMIBABY
Source: CAA Airport Statistics
Setting the no-frills growth in context: the aggregate data
2.12 The impressive growth of no-frills carriers has created a perception that they have signifi cantly increased the growth rate of passenger air traffi c as a whole. However, the data on UK aggregate traffi c growth does not seem to support this, as the following charts demonstrate.
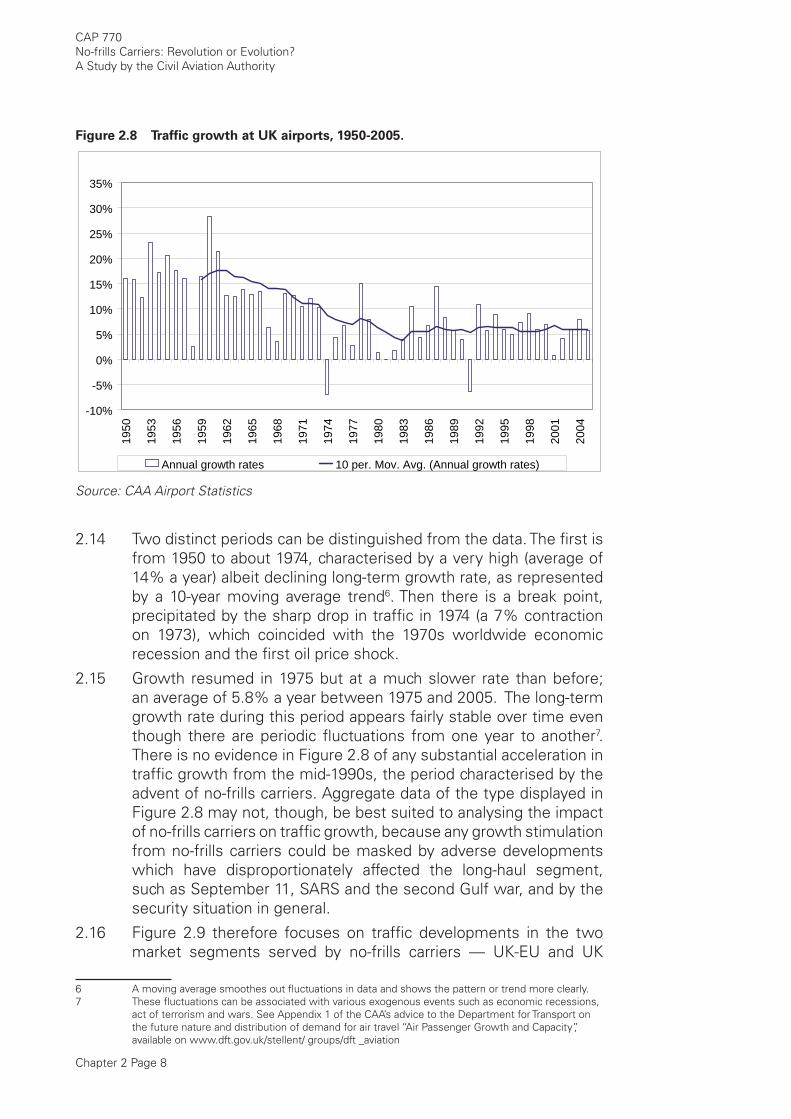
2.13 Figure 2.8 shows the total passenger traffi c growth at UK airports between 1950 and 2005, including long-haul traffi c.
Chapter 2 Page 8
CAP 770No-frills Carriers: Revolution or Evolution?A Study by the Civil Aviation Authority
Figure 2.8 Traffi c growth at UK airports, 1950-2005.
-10%
-5%
0%
5%
10%
15%
20%
25%
30%
35%
1950
1953
1956
1959
1962
1965
1968
1971
1974
1977
1980
1983
1986
1989
1992
1995
1998
2001
2004
Annual growth rates 10 per. Mov. Avg. (Annual growth rates)
Source: CAA Airport Statistics
2.14 Two distinct periods can be distinguished from the data. The fi rst is from 1950 to about 1974, characterised by a very high (average of 14% a year) albeit declining long-term growth rate, as represented by a 10-year moving average trend6. Then there is a break point, precipitated by the sharp drop in traffi c in 1974 (a 7% contraction on 1973), which coincided with the 1970s worldwide economic recession and the fi rst oil price shock.
2.15 Growth resumed in 1975 but at a much slower rate than before; an average of 5.8% a year between 1975 and 2005. The long-term growth rate during this period appears fairly stable over time even though there are periodic fl uctuations from one year to another7. There is no evidence in Figure 2.8 of any substantial acceleration in traffi c growth from the mid-1990s, the period characterised by the advent of no-frills carriers. Aggregate data of the type displayed in Figure 2.8 may not, though, be best suited to analysing the impact of no-frills carriers on traffi c growth, because any growth stimulation from no-frills carriers could be masked by adverse developments which have disproportionately affected the long-haul segment, such as September 11, SARS and the second Gulf war, and by the security situation in general.
2.16 Figure 2.9 therefore focuses on traffi c developments in the two market segments served by no-frills carriers — UK-EU and UK
6 A moving average smoothes out fl uctuations in data and shows the pattern or trend more clearly.7 These fl uctuations can be associated with various exogenous events such as economic recessions,
act of terrorism and wars. See Appendix 1 of the CAA’s advice to the Department for Transport on the future nature and distribution of demand for air travel “Air Passenger Growth and Capacity”, available on www.dft.gov.uk/stellent/ groups/dft _aviation
Chapter 2 Page 9
CAP 770No-frills Carriers: Revolution or Evolution?
A Study by the Civil Aviation Authority
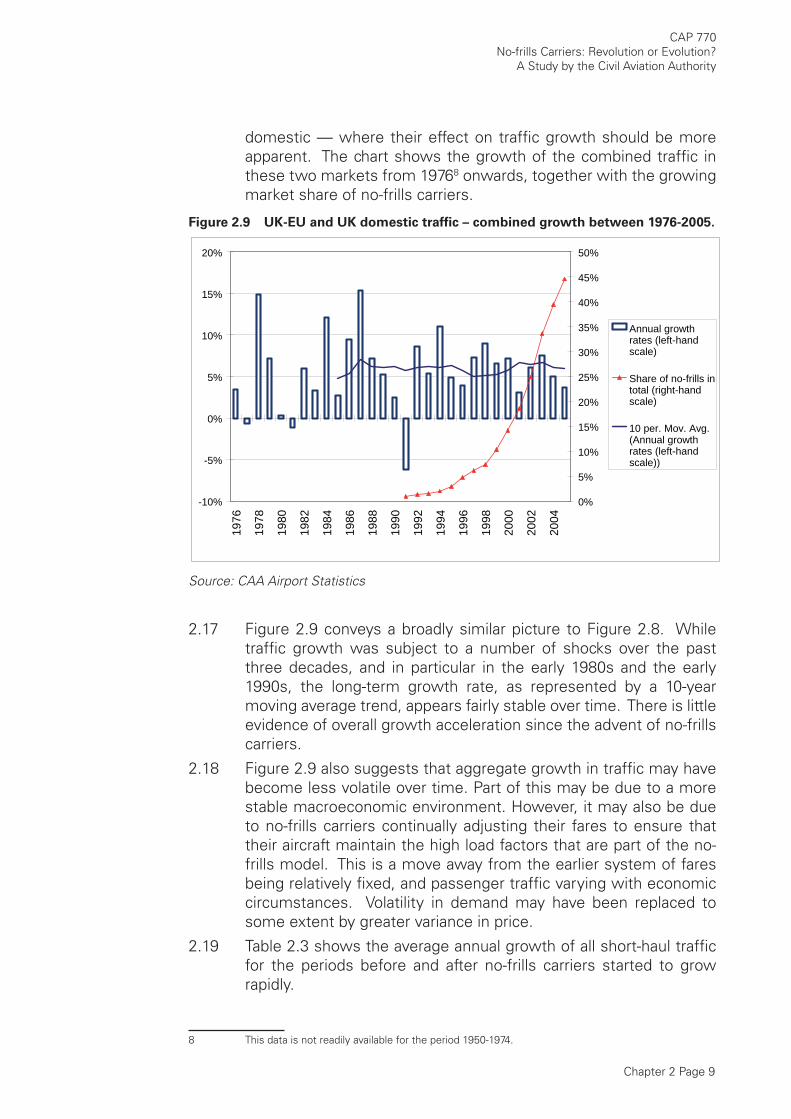
domestic — where their effect on traffi c growth should be more apparent. The chart shows the growth of the combined traffi c in these two markets from 19768 onwards, together with the growing market share of no-frills carriers.
Figure 2.9 UK-EU and UK domestic traffi c – combined growth between 1976-2005.
-10%
-5%
0%
5%
10%
15%
20%19
76
1978
1980
1982
1984
1986
1988
1990
1992
1994
1996
1998
2000
2002
2004
0%
5%
10%
15%
20%
25%
30%
35%
40%
45%
50%
Annual growthrates (left-handscale)
Share of no-frills intotal (right-handscale)
10 per. Mov. Avg.(Annual growthrates (left-handscale))
Source: CAA Airport Statistics
2.17 Figure 2.9 conveys a broadly similar picture to Figure 2.8. While traffi c growth was subject to a number of shocks over the past three decades, and in particular in the early 1980s and the early 1990s, the long-term growth rate, as represented by a 10-year moving average trend, appears fairly stable over time. There is little evidence of overall growth acceleration since the advent of no-frills carriers.
2.18 Figure 2.9 also suggests that aggregate growth in traffi c may have become less volatile over time. Part of this may be due to a more stable macroeconomic environment. However, it may also be due to no-frills carriers continually adjusting their fares to ensure that their aircraft maintain the high load factors that are part of the no-frills model. This is a move away from the earlier system of fares being relatively fi xed, and passenger traffi c varying with economic circumstances. Volatility in demand may have been replaced to some extent by greater variance in price.
2.19 Table 2.3 shows the average annual growth of all short-haul traffi c for the periods before and after no-frills carriers started to grow rapidly.
8 This data is not readily available for the period 1950-1974.
Chapter 2 Page 10
CAP 770No-frills Carriers: Revolution or Evolution?A Study by the Civil Aviation Authority
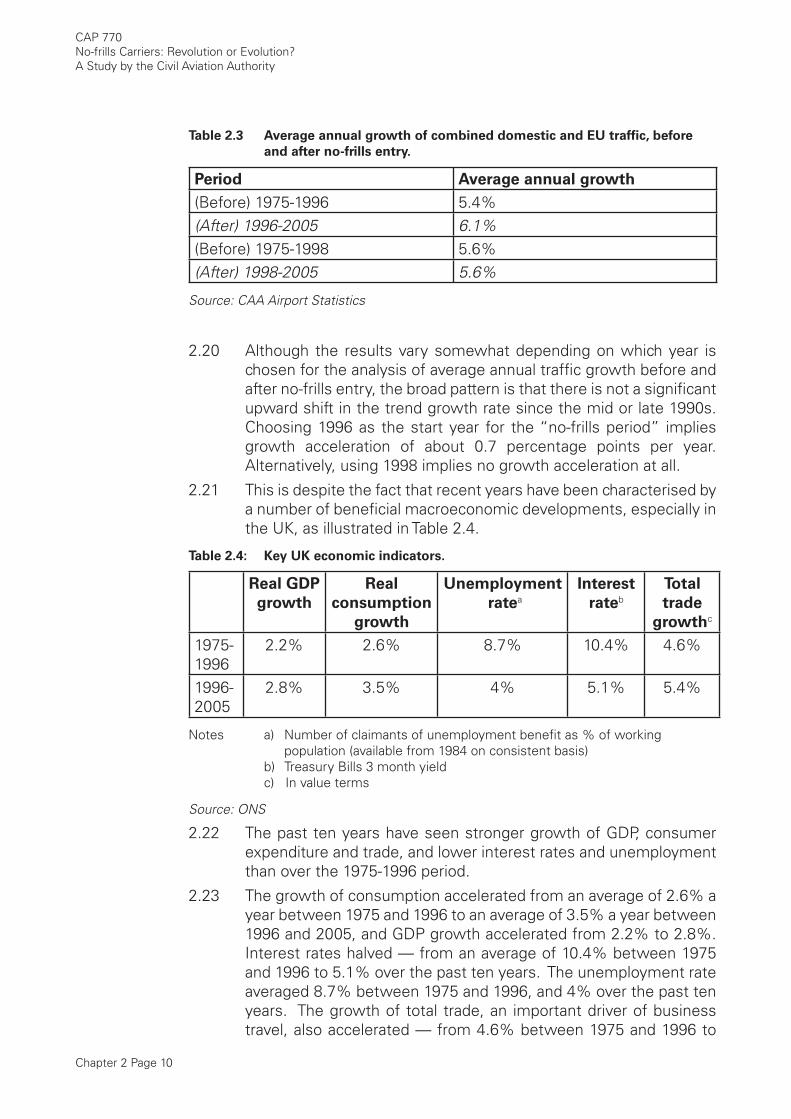
Table 2.3 Average annual growth of combined domestic and EU traffi c, before
and after no-frills entry.
Period Average annual growth
(Before) 1975-1996 5.4%(After) 1996-2005 6.1%(Before) 1975-1998 5.6%(After) 1998-2005 5.6%
Source: CAA Airport Statistics
2.20 Although the results vary somewhat depending on which year is chosen for the analysis of average annual traffi c growth before and after no-frills entry, the broad pattern is that there is not a signifi cant upward shift in the trend growth rate since the mid or late 1990s. Choosing 1996 as the start year for the “no-frills period” implies growth acceleration of about 0.7 percentage points per year. Alternatively, using 1998 implies no growth acceleration at all.
2.21 This is despite the fact that recent years have been characterised by a number of benefi cial macroeconomic developments, especially in the UK, as illustrated in Table 2.4.
Table 2.4: Key UK economic indicators.
Real GDP
growth
Real
consumption
growth
Unemployment
rateaInterest
ratebTotal
trade
growthc
1975-1996
2.2% 2.6% 8.7% 10.4% 4.6%
1996-2005
2.8% 3.5% 4% 5.1% 5.4%
Notes a) Number of claimants of unemployment benefi t as % of working population (available from 1984 on consistent basis)b) Treasury Bills 3 month yieldc) In value terms
Source: ONS
2.22 The past ten years have seen stronger growth of GDP, consumer expenditure and trade, and lower interest rates and unemployment than over the 1975-1996 period.
2.23 The growth of consumption accelerated from an average of 2.6% a year between 1975 and 1996 to an average of 3.5% a year between 1996 and 2005, and GDP growth accelerated from 2.2% to 2.8%. Interest rates halved — from an average of 10.4% between 1975 and 1996 to 5.1% over the past ten years. The unemployment rate averaged 8.7% between 1975 and 1996, and 4% over the past ten years. The growth of total trade, an important driver of business travel, also accelerated — from 4.6% between 1975 and 1996 to
Chapter 2 Page 11
CAP 770No-frills Carriers: Revolution or Evolution?
A Study by the Civil Aviation Authority
5.4% between 1996 and 2005.
Traffi c generation and substitution
Review of available estimates
2.24 There are two main dynamics behind the growth of no-frills carriers. They may attract traffi c that would otherwise travel by other modes, if at all. This is termed “traffi c generation” or “traffi c stimulation”. No-frills carriers may also attract traffi c which otherwise would have travelled on other airlines. This is known as “traffi c substitution” or “traffi c abstraction”. Importantly, traffi c substitution changes market shares without having an impact on the overall level of demand9.
2.25 There are only a few estimates of the stimulatory effect of no-frills carriers on traffi c growth. In its 2000 air traffi c forecasts for the UK, the Department of the Environment, Transport and the Regions (DETR)10 made the assumption that 30% of the passengers carried by no-frills carriers would be diverted from existing airlines and 70% would be stimulated. A survey carried out in 2002 on behalf of the European Low Fares Airline Association (ELFAA)11 came up with broadly similar estimates: 60% generation and 40% substitution.
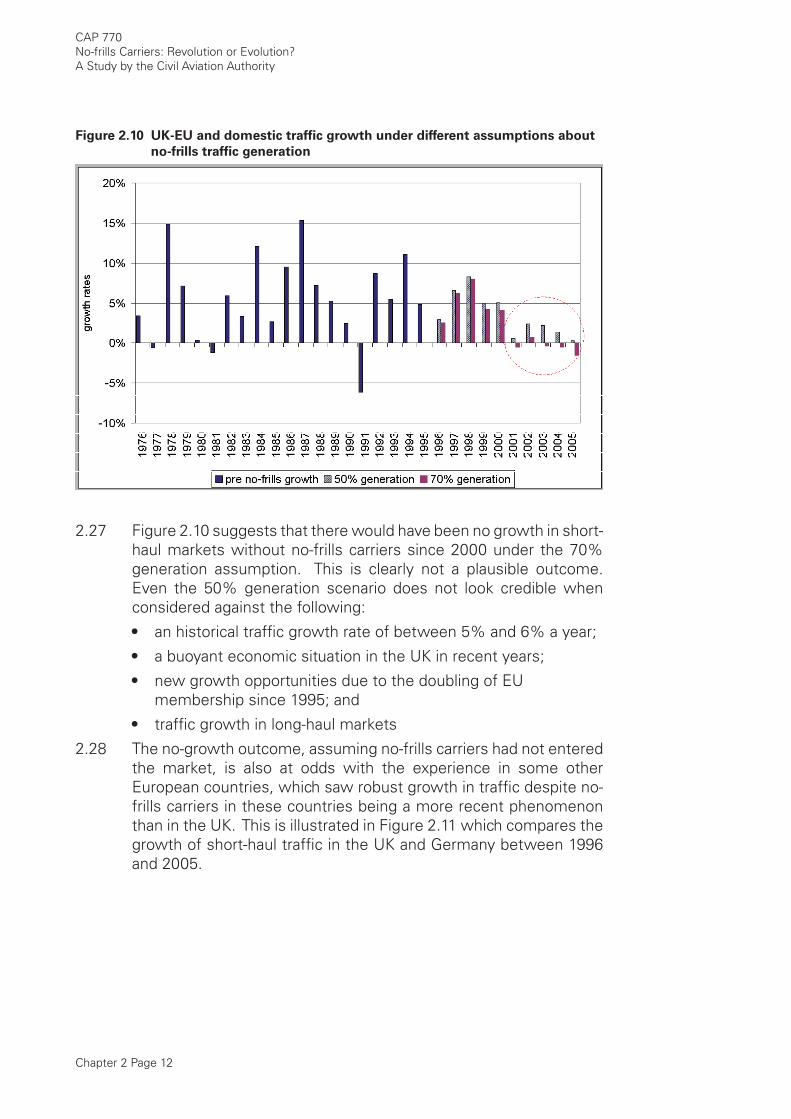
2.26 The above estimates of the stimulatory effect, particularly the DETR 2000 estimate, were produced at an early stage of no-frills development and are unlikely to capture the current market dynamics. This is illustrated in Figure 2.10 which shows how short-haul traffi c (EU + domestic) would have grown without no-frills carriers under different assumptions about no-frills traffi c generation, including the assumption which was used in DETR’s analysis that 70% of no-frills traffi c was stimulated (i.e. assuming that 70% of no-frills traffi c would not have travelled if no-frills services were not available), and a 50% stimulation scenario.
9 A similar effect (i.e. change in market share without change in overall growth) occurs through re-branding, whereby an established full-service carrier adopts a no-frills model (e.g. British European re-branding as fl ybe).
10 DETR (2000): Air Traffi c Forecasts for the United Kingdom 2000, Department of the Environment, Transport and the Regions. London: HMSO.
11 ELFAA (2002) Liberalisation of European Air Transport: The Benefi ts of Low Fares Airlines to Consumers, Airports, Regions and the Environment.
Chapter 2 Page 12
CAP 770No-frills Carriers: Revolution or Evolution?A Study by the Civil Aviation Authority
Figure 2.10 UK-EU and domestic traffi c growth under different assumptions about
no-frills traffi c generation
2.27 Figure 2.10 suggests that there would have been no growth in short-haul markets without no-frills carriers since 2000 under the 70% generation assumption. This is clearly not a plausible outcome. Even the 50% generation scenario does not look credible when considered against the following:
an historical traffi c growth rate of between 5% and 6% a year;
a buoyant economic situation in the UK in recent years;
new growth opportunities due to the doubling of EU membership since 1995; and
traffi c growth in long-haul markets
2.28 The no-growth outcome, assuming no-frills carriers had not entered the market, is also at odds with the experience in some other European countries, which saw robust growth in traffi c despite no-frills carriers in these countries being a more recent phenomenon than in the UK. This is illustrated in Figure 2.11 which compares the growth of short-haul traffi c in the UK and Germany between 1996 and 2005.
•
•
•
•
Chapter 2 Page 13
CAP 770No-frills Carriers: Revolution or Evolution?
A Study by the Civil Aviation Authority
Figure 2.11 Growth rates of short-haul traffi c in the UK and Germany, 1996-2005.
-10%
-5%
0%
5%
10%
15%
20%
1996 1997 1998 1999 2000 2001 2002 2003 2004 2005
grow
th ra
tes
GermanyUK
Source: CAA Airport Statistics and Eurostat
2.29 The UK saw much stronger no-frills activity than Germany between 1996 and 2000 and yet traffi c in the two countries grew at a broadly similar rate during this period. Germany experienced a sharp drop in traffi c in 2001 and 2002 coinciding with the September 11 attacks, but traffi c recovered strongly in 2004 and 2005 to catch up with the UK.
Analysis at the broader market level
2.30 The data presented in Figures 2.12 and 2.13 offer an insight into the dynamics of generation and substitution at the broader market level. Figure 2.12 illustrates traffi c development in the UK-EU market.
Chapter 2 Page 14
CAP 770No-frills Carriers: Revolution or Evolution?A Study by the Civil Aviation Authority
Figure 2.12 UK-EU passenger traffi c by carrier type, 1986 to 2005.
0
20
40
60
80
100
120
140
1986
1987
1988
1989
1990
1991
1992
1993
1994
1995
1996
1997
1998
1999
2000
2001
2002
2003
2004
2005
pass
enge
rs (m
)
Full-service Charter No-frills
Source: CAA Airport Statistics
2.31 All three market segments — full-service scheduled, charter and no-frills — were expanding until about 2000. Between 1993 and 2000 full-service scheduled traffi c and charter traffi c grew at average annual rates of 6% and 4.4%, respectively. No-frills traffi c expanded at a much faster rate during the same period, albeit from a very low base. The combined traffi c grew at a rate of 7.2% a year.
2.32 From 2000 onwards, combined growth slowed down to 5.1%, in part due to a series of adverse developments, including the September 11 terrorist attacks and the second Gulf war. However, a much more striking development since 2000 has been the clear change in the growth dynamics of individual market segments. Both full-service scheduled and charter traffi c have generally been in decline since 2000 and, at present, they are broadly at the levels they were some ten years ago. On the other hand, no-frills traffi c has continued to expand at an exceptionally fast rate — an average of 32.5% a year between 2000 and 2005.
2.33 Charter carriers in particular appear to have lost out to no-frills carriers. Between 2000 and 2005, UK to EU charter traffi c declined at an average annual rate of 4.1% while full-service scheduled traffi c contracted at a rate of 2.2% a year. And while full-service scheduled traffi c expanded in 2005, albeit at a minimal rate (0.6% on 2004), charter traffi c shows no signs of recovery, having contracted by 13% in 2005 alone.
2.34 Table 2.5 shows traffi c developments on the 15 densest European charter routes (including Turkey) from London, classifi ed into two
Chapter 2 Page 15
CAP 770No-frills Carriers: Revolution or Evolution?
A Study by the Civil Aviation Authority
groups according to whether they are served by both charter carriers and no-frills carriers, or charter carriers alone (the comparison group). In 2005 these routes accounted for just over 60% of the total European charter market from London.
Table 2.5 Impact of no-frills entry on charter routes from London.
Charter passengers (000s)
Destination Country 2000 2005 Change
Served by both no-frills carriers and charter carriers
Palma de Mallorca Spain (Balearics) 969 632 -34.8%
Malaga Spain (Mainland) 802 288 -64.1%
Mahon Spain (Balearics) 486 287 -41.0%
Faro Portugal (Mainland) 618 274 -55.6%
Ibiza Spain (Balearics) 437 222 -49.2%
Alicante Spain (Mainland) 564 213 -62.2% TOTAL 3876 1916 -50.6%
Served by charter carriers alone
Tenerife Spain (Canaries) 916 682 -25.5%
Arrecife Spain (Canaries) 487 464 -4.7%
Dalaman Turkey 227 441 94.7%
Paphos Cyprus 341 336 -1.4%
Las Palmas Spain (Canaries) 520 320 -38.4%
Corfu Greece 372 293 -21.1%
Fuerteventura Spain (Canaries) 260 249 -4.1%
Heraklion Greece 281 247 -12.0%
Zakinthos Greece 216 206 -4.7%
TOTAL 3619 3239 -10.5%
Source CAA Airport Statistics
2.35 It is apparent from the table above that the number of charter passengers on routes where charter carriers face competition from no-frills carriers declined between 2000 and 2005, and in the majority of cases by substantial percentages. Charter patronage on routes to Malaga, Alicante and Faro more than halved during the period in question, while the routes overall lost about 50% of their traffi c.
2.36 Charter traffi c to destinations where there was no competition from no-frills carriers also contracted between 2000 and 2005, with the exception of Dalaman, but on a much smaller scale than traffi c on routes where charter carriers faced competition from no-frills carriers. As a group, these destinations lost 11% of their charter traffi c in the six years since 2000.
2.37 Taken together, these trends suggest that there has been a considerable diversion of traffi c from charter carriers to no-frills carriers on routes where the two compete head-to-head
Chapter 2 Page 16
CAP 770No-frills Carriers: Revolution or Evolution?A Study by the Civil Aviation Authority
on destinations, but that there is also a more general effect of substitution in favour of no-frills carriers due to the changing preferences of UK holidaymakers, with more passengers wanting fl exibility and being prepared to use the internet to make their own travel arrangements.
2.38 Figure 2.13 shows traffi c development in the UK domestic market.
Figure 2.13 UK domestic traffi c by carrier type, 1986 to 2005.
0
10
20
30
40
50
60
1986
1987
1988
1989
1990
1991
1992
1993
1994
1995
1996
1997
1998
1999
2000
2001
2002
2003
2004
2005
pass
enge
rs (m
)
Full-service Charter No-frills
Source: CAA Airport Statistics
2.39 Charter traffi c represents only a negligible proportion of total domestic traffi c, but otherwise, Figure 2.13 paints a broadly similar picture to Figure 2.12. Between 1993 and 2000, full-service scheduled traffi c grew at an average annual rate of 4%. From 2000 onwards, it contracted at a rate of 4.8% a year and, at present, it is just below the level it was in 1994. No-frills traffi c, on the other hand, expanded at an average rate of 35% a year since 2000.
2.40 Recent years have been characterised by a number of benefi cial economy-wide developments, as illustrated earlier, and yet as Figures 2.12 and 2.13 show, the passenger numbers on full-service carriers and charter carriers in the UK-EU market and in the UK domestic market contracted markedly. This is in contrast to traffi c developments in long-haul markets where both full-service carriers and charter carriers have increased their passengers in recent years, even though these markets have been much more exposed to recent adverse security and geo-political developments than short-haul markets.
2.41 Figure 2.14 below shows the growth of the combined charter and full-service traffi c by geographical region since the end of the fi rst Gulf war and the concurrent economic recession.
Chapter 2 Page 17
CAP 770No-frills Carriers: Revolution or Evolution?
A Study by the Civil Aviation Authority
Figure 2.14 Combined full-service and charter traffi c by geographical region.
0
20
40
60
80
100
120
140
160
180
1993 1994 1995 1996 1997 1998 1999 2000 2001 2002 2003 2004 2005
Inde
x (1
993=
100)
EU Long haul Domestic
Source: CAA Airport Statistics
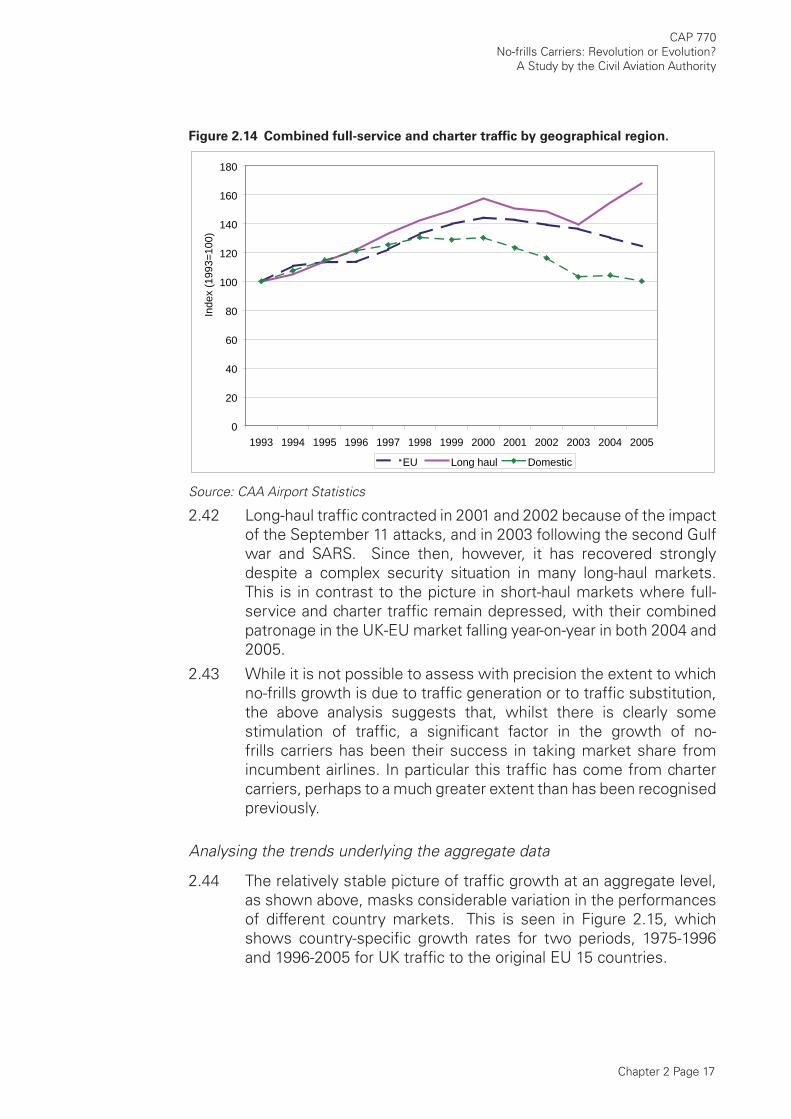
2.42 Long-haul traffi c contracted in 2001 and 2002 because of the impact of the September 11 attacks, and in 2003 following the second Gulf war and SARS. Since then, however, it has recovered strongly despite a complex security situation in many long-haul markets. This is in contrast to the picture in short-haul markets where full-service and charter traffi c remain depressed, with their combined patronage in the UK-EU market falling year-on-year in both 2004 and 2005.
2.43 While it is not possible to assess with precision the extent to which no-frills growth is due to traffi c generation or to traffi c substitution, the above analysis suggests that, whilst there is clearly some stimulation of traffi c, a signifi cant factor in the growth of no-frills carriers has been their success in taking market share from incumbent airlines. In particular this traffi c has come from charter carriers, perhaps to a much greater extent than has been recognised previously.
Analysing the trends underlying the aggregate data
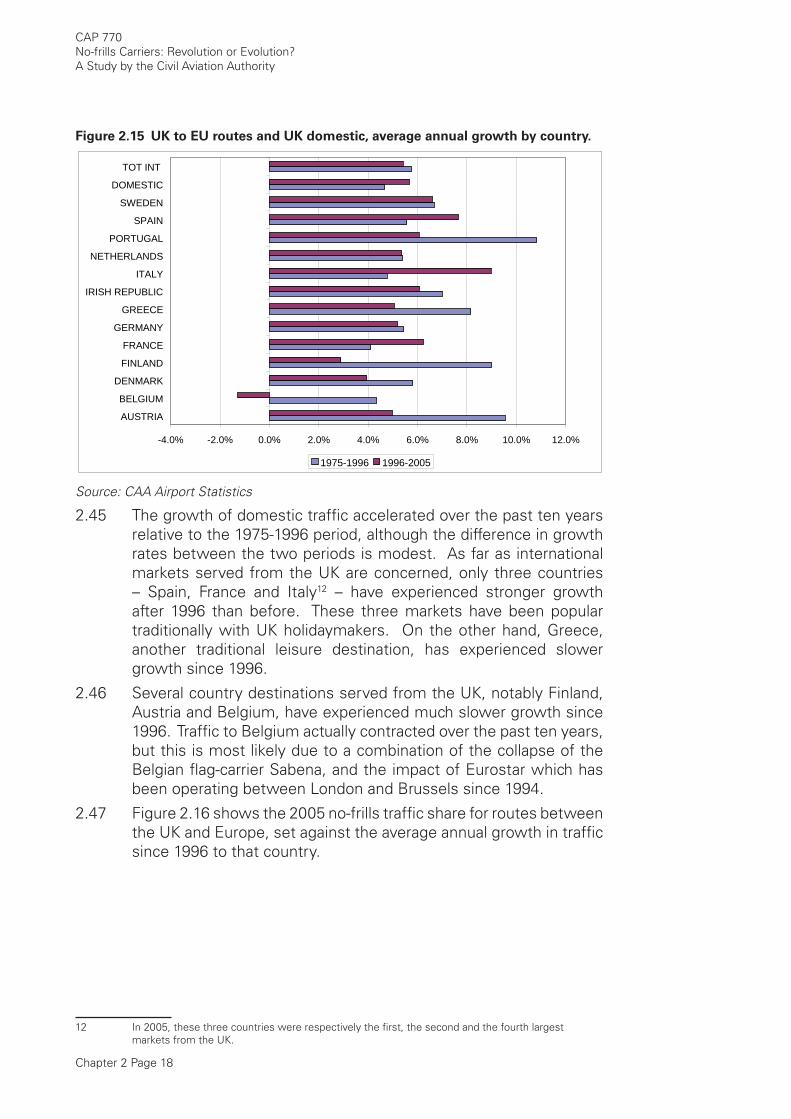
2.44 The relatively stable picture of traffi c growth at an aggregate level, as shown above, masks considerable variation in the performances of different country markets. This is seen in Figure 2.15, which shows country-specifi c growth rates for two periods, 1975-1996 and 1996-2005 for UK traffi c to the original EU 15 countries.
Chapter 2 Page 18
CAP 770No-frills Carriers: Revolution or Evolution?A Study by the Civil Aviation Authority
Figure 2.15 UK to EU routes and UK domestic, average annual growth by country.
-4.0% -2.0% 0.0% 2.0% 4.0% 6.0% 8.0% 10.0% 12.0%
AUSTRIA
BELGIUM
DENMARK
FINLAND
FRANCE
GERMANY
GREECE
IRISH REPUBLIC
ITALY
NETHERLANDS
PORTUGAL
SPAIN
SWEDEN
DOMESTIC
TOT INT
1975-1996 1996-2005
Source: CAA Airport Statistics
2.45 The growth of domestic traffi c accelerated over the past ten years relative to the 1975-1996 period, although the difference in growth rates between the two periods is modest. As far as international markets served from the UK are concerned, only three countries – Spain, France and Italy12 – have experienced stronger growth after 1996 than before. These three markets have been popular traditionally with UK holidaymakers. On the other hand, Greece, another traditional leisure destination, has experienced slower growth since 1996.
2.46 Several country destinations served from the UK, notably Finland, Austria and Belgium, have experienced much slower growth since 1996. Traffi c to Belgium actually contracted over the past ten years, but this is most likely due to a combination of the collapse of the Belgian fl ag-carrier Sabena, and the impact of Eurostar which has been operating between London and Brussels since 1994.
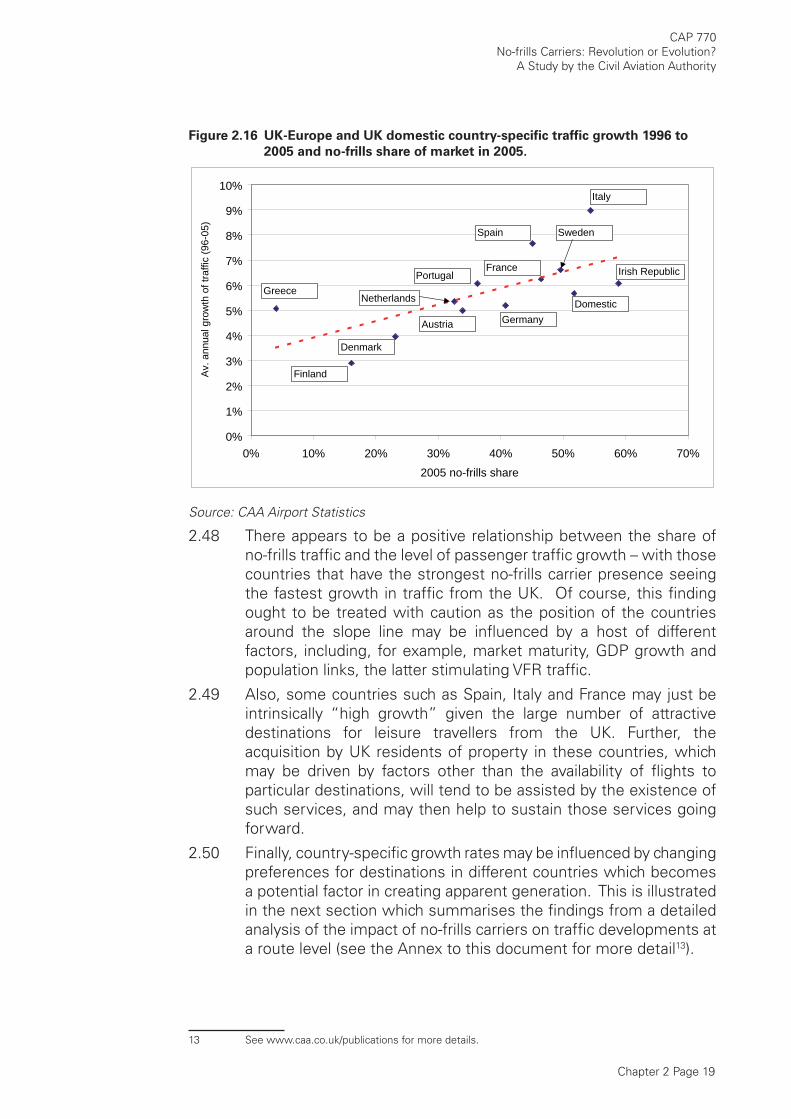
2.47 Figure 2.16 shows the 2005 no-frills traffi c share for routes between the UK and Europe, set against the average annual growth in traffi c since 1996 to that country.
12 In 2005, these three countries were respectively the fi rst, the second and the fourth largest markets from the UK.
Chapter 2 Page 19
CAP 770No-frills Carriers: Revolution or Evolution?
A Study by the Civil Aviation Authority
Figure 2.16 UK-Europe and UK domestic country-specifi c traffi c growth 1996 to
2005 and no-frills share of market in 2005.
0%
1%
2%
3%
4%
5%
6%
7%
8%
9%
10%
0% 10% 20% 30% 40% 50% 60% 70%2005 no-frills share
Av.
ann
ual g
row
th o
f tra
ffic
(96-
05)
Greece
Denmark
Spain
Finland
Portugal
Italy
Netherlands Domestic
Sweden
France
Germany
Irish Republic
Austria
Source: CAA Airport Statistics
2.48 There appears to be a positive relationship between the share of no-frills traffi c and the level of passenger traffi c growth – with those countries that have the strongest no-frills carrier presence seeing the fastest growth in traffi c from the UK. Of course, this fi nding ought to be treated with caution as the position of the countries around the slope line may be infl uenced by a host of different factors, including, for example, market maturity, GDP growth and population links, the latter stimulating VFR traffi c.
2.49 Also, some countries such as Spain, Italy and France may just be intrinsically “high growth” given the large number of attractive destinations for leisure travellers from the UK. Further, the acquisition by UK residents of property in these countries, which may be driven by factors other than the availability of fl ights to particular destinations, will tend to be assisted by the existence of such services, and may then help to sustain those services going forward.
2.50 Finally, country-specifi c growth rates may be infl uenced by changing preferences for destinations in different countries which becomes a potential factor in creating apparent generation. This is illustrated in the next section which summarises the fi ndings from a detailed analysis of the impact of no-frills carriers on traffi c developments at a route level (see the Annex to this document for more detail13).
13 See www.caa.co.uk/publications for more details.
Chapter 2 Page 20
CAP 770No-frills Carriers: Revolution or Evolution?A Study by the Civil Aviation Authority
Route level analysis
2.51 The analysis in this section is intended to complement the broader market-level analysis by illustrating, through examples, the way in which substitution and generation take place in practice. Looking at individual routes brings out how the sub-markets that make up the aggregate picture are performing in different ways. On individual routes the substitution and generation effects are often ‘magnifi ed’, as well as being affected by underlying trends in traffi c growth and the airline choice available on the route, they also refl ect changing preferences for destinations.
2.52 Although the picture emerging from this analysis is complex and varies from route to route, several broader results can be established. Traffi c stimulation is stronger when the no-frills share is quite low – few routes exhibit strong growth after no-frills have captured a signifi cant share of the total traffi c on the route. The related result is that traffi c substitution tends to be stronger in London than in the regions, refl ecting the fact that there are many more well established and dense routes from London.
2.53 Behind these broader trends, subtler patterns can be identifi ed. On some routes, no-frills carriers have succeeded in stimulating traffi c over the long term with relatively little adverse impact on incumbents’ traffi c, as illustrated with two examples in Figure 2.17. These tend to be what some analysts term “somewhere to somewhere” routes, such as a regional city linking to another regional city, which were relatively underserved by full-service carriers before no-frills entry.
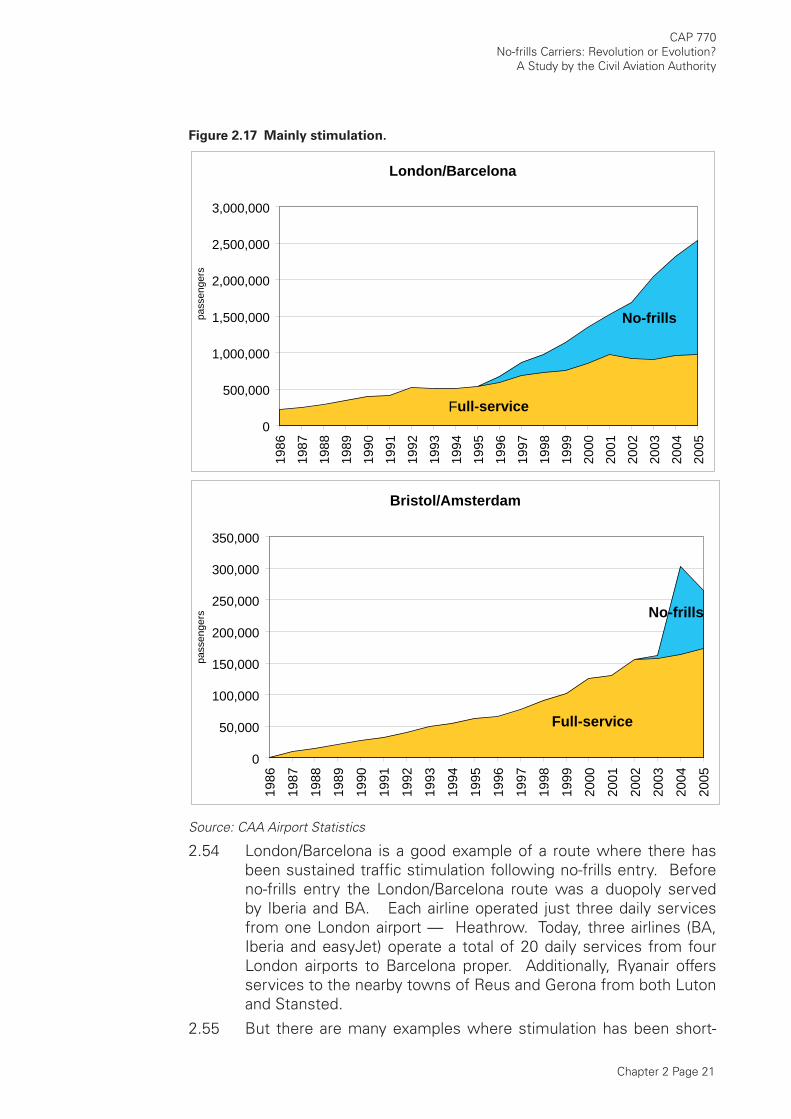
Chapter 2 Page 21
CAP 770No-frills Carriers: Revolution or Evolution?
A Study by the Civil Aviation Authority
Figure 2.17 Mainly stimulation.
London/Barcelona
Full-service
No-frills
0
500,000
1,000,000
1,500,000
2,000,000
2,500,000
3,000,000
1986
1987
1988
1989
1990
1991
1992
1993
1994
1995
1996
1997
1998
1999
2000
2001
2002
2003
2004
2005
pass
enge
rs
Bristol/Amsterdam
Full-service
No-frills
0
50,000
100,000
150,000
200,000
250,000
300,000
350,000
1986
1987
1988
1989
1990
1991
1992
1993
1994
1995
1996
1997
1998
1999
2000
2001
2002
2003
2004
2005
pass
enge
rs
Source: CAA Airport Statistics
2.54 London/Barcelona is a good example of a route where there has been sustained traffi c stimulation following no-frills entry. Before no-frills entry the London/Barcelona route was a duopoly served by Iberia and BA. Each airline operated just three daily services from one London airport — Heathrow. Today, three airlines (BA, Iberia and easyJet) operate a total of 20 daily services from four London airports to Barcelona proper. Additionally, Ryanair offers services to the nearby towns of Reus and Gerona from both Luton and Stansted.
2.55 But there are many examples where stimulation has been short-
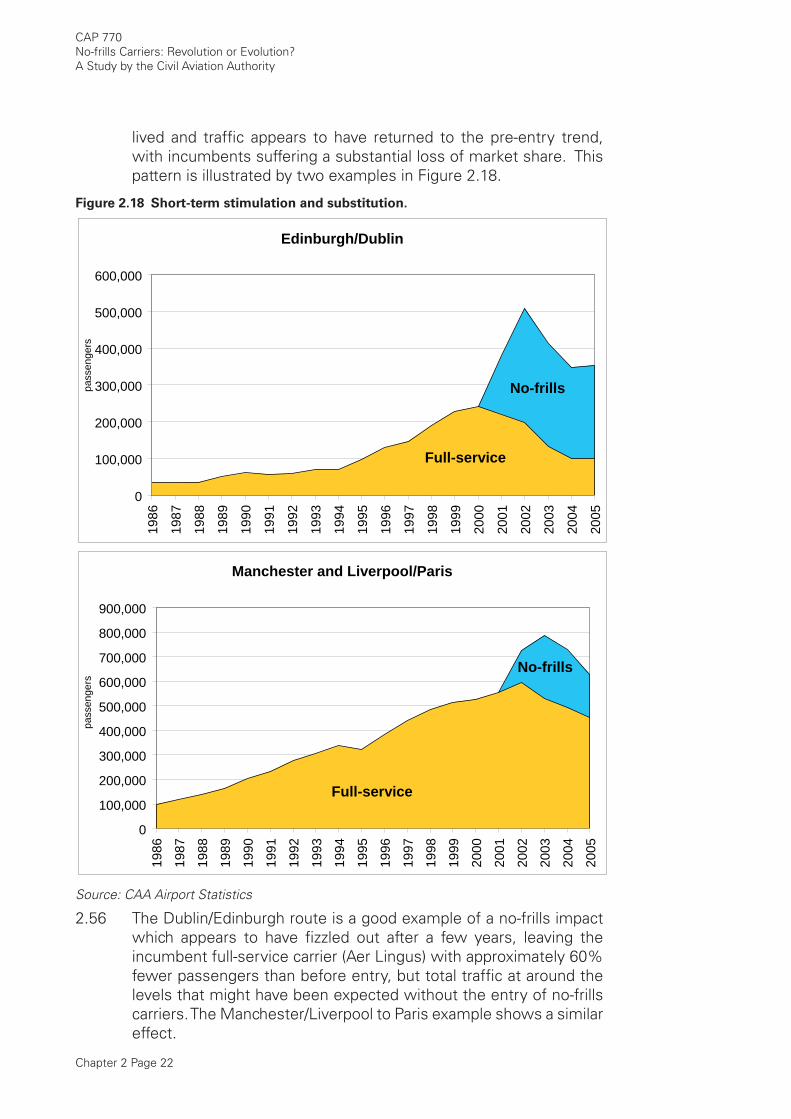
Chapter 2 Page 22
CAP 770No-frills Carriers: Revolution or Evolution?A Study by the Civil Aviation Authority
lived and traffi c appears to have returned to the pre-entry trend, with incumbents suffering a substantial loss of market share. This pattern is illustrated by two examples in Figure 2.18.
Figure 2.18 Short-term stimulation and substitution.
Edinburgh/Dublin
Full-service
No-frills
0
100,000
200,000
300,000
400,000
500,000
600,000
1986
1987
1988
1989
1990
1991
1992
1993
1994
1995
1996
1997
1998
1999
2000
2001
2002
2003
2004
2005
pass
enge
rs
Manchester and Liverpool/Paris
Full-service
No-frills
0
100,000
200,000
300,000
400,000
500,000
600,000
700,000
800,000
900,000
1986
1987
1988
1989
1990
1991
1992
1993
1994
1995
1996
1997
1998
1999
2000
2001
2002
2003
2004
2005
pass
enge
rs
Source: CAA Airport Statistics
2.56 The Dublin/Edinburgh route is a good example of a no-frills impact which appears to have fi zzled out after a few years, leaving the incumbent full-service carrier (Aer Lingus) with approximately 60% fewer passengers than before entry, but total traffi c at around the levels that might have been expected without the entry of no-frills carriers. The Manchester/Liverpool to Paris example shows a similar effect.
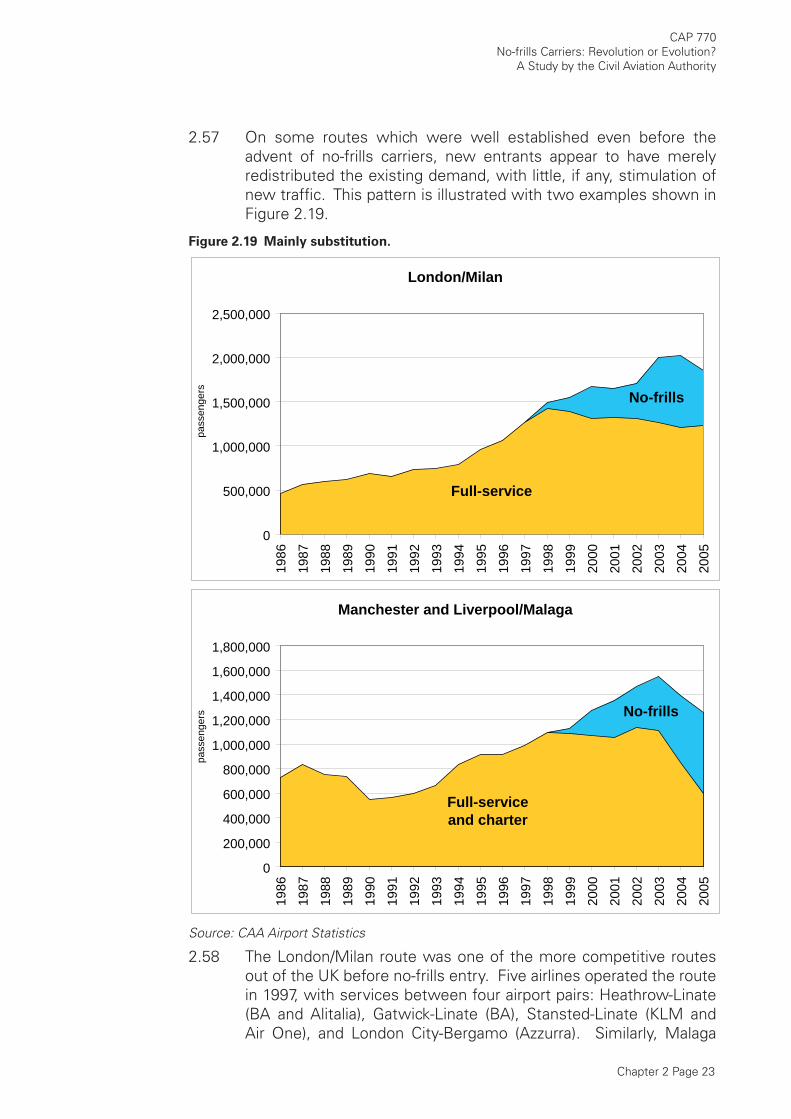
Chapter 2 Page 23
CAP 770No-frills Carriers: Revolution or Evolution?
A Study by the Civil Aviation Authority
2.57 On some routes which were well established even before the advent of no-frills carriers, new entrants appear to have merely redistributed the existing demand, with little, if any, stimulation of new traffi c. This pattern is illustrated with two examples shown in Figure 2.19.
Figure 2.19 Mainly substitution.
London/Milan
Full-service
No-frills
0
500,000
1,000,000
1,500,000
2,000,000
2,500,000
1986
1987
1988
1989
1990
1991
1992
1993
1994
1995
1996
1997
1998
1999
2000
2001
2002
2003
2004
2005
pass
enge
rs
Manchester and Liverpool/Malaga
Full-service and charter
No-frills
0
200,000
400,000
600,000
800,000
1,000,000
1,200,000
1,400,000
1,600,000
1,800,000
1986
1987
1988
1989
1990
1991
1992
1993
1994
1995
1996
1997
1998
1999
2000
2001
2002
2003
2004
2005
pass
enge
rs
Source: CAA Airport Statistics
2.58 The London/Milan route was one of the more competitive routes out of the UK before no-frills entry. Five airlines operated the route in 1997, with services between four airport pairs: Heathrow-Linate (BA and Alitalia), Gatwick-Linate (BA), Stansted-Linate (KLM and Air One), and London City-Bergamo (Azzurra). Similarly, Malaga
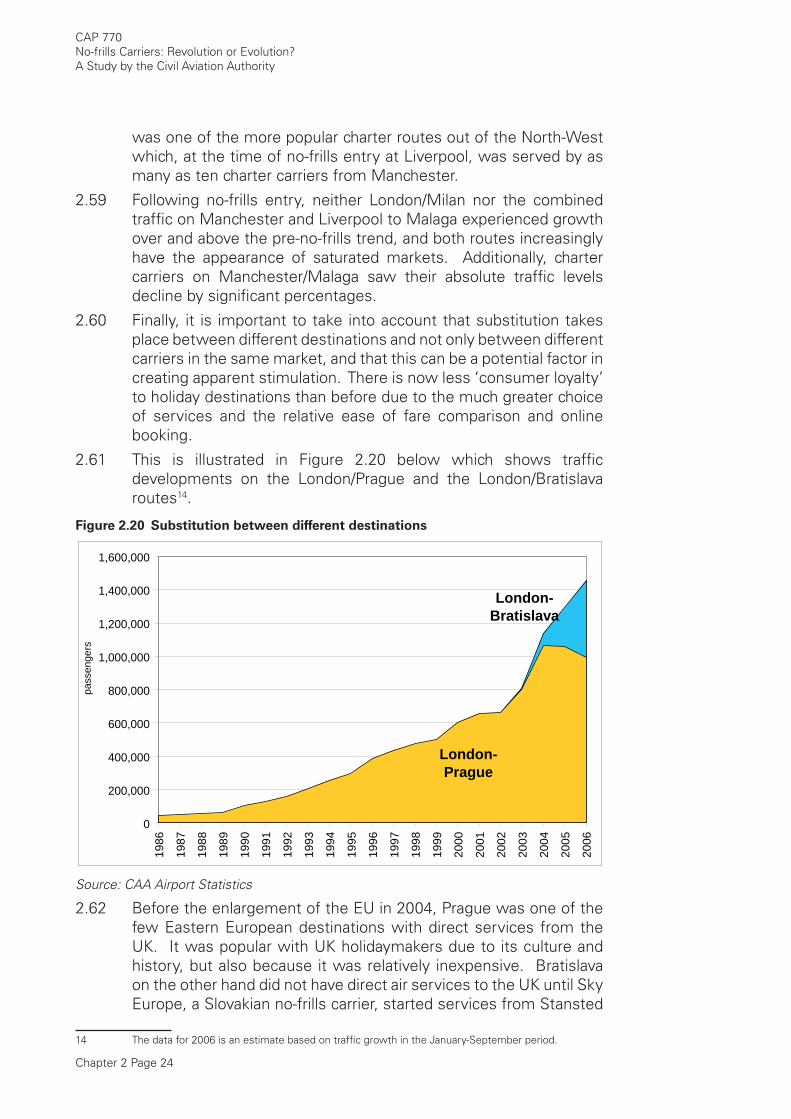
Chapter 2 Page 24
CAP 770No-frills Carriers: Revolution or Evolution?A Study by the Civil Aviation Authority
was one of the more popular charter routes out of the North-West which, at the time of no-frills entry at Liverpool, was served by as many as ten charter carriers from Manchester.
2.59 Following no-frills entry, neither London/Milan nor the combined traffi c on Manchester and Liverpool to Malaga experienced growth over and above the pre-no-frills trend, and both routes increasingly have the appearance of saturated markets. Additionally, charter carriers on Manchester/Malaga saw their absolute traffi c levels decline by signifi cant percentages.
2.60 Finally, it is important to take into account that substitution takes place between different destinations and not only between different carriers in the same market, and that this can be a potential factor in creating apparent stimulation. There is now less ‘consumer loyalty’ to holiday destinations than before due to the much greater choice of services and the relative ease of fare comparison and online booking.
2.61 This is illustrated in Figure 2.20 below which shows traffi c developments on the London/Prague and the London/Bratislava routes14.
Figure 2.20 Substitution between different destinations
London-Prague
London-Bratislava
0
200,000
400,000
600,000
800,000
1,000,000
1,200,000
1,400,000
1,600,000
1986
1987
1988
1989
1990
1991
1992
1993
1994
1995
1996
1997
1998
1999
2000
2001
2002
2003
2004
2005
2006
pass
enge
rs
Source: CAA Airport Statistics
2.62 Before the enlargement of the EU in 2004, Prague was one of the few Eastern European destinations with direct services from the UK. It was popular with UK holidaymakers due to its culture and history, but also because it was relatively inexpensive. Bratislava on the other hand did not have direct air services to the UK until Sky Europe, a Slovakian no-frills carrier, started services from Stansted
14 The data for 2006 is an estimate based on traffi c growth in the January-September period.
Chapter 2 Page 25
CAP 770No-frills Carriers: Revolution or Evolution?
A Study by the Civil Aviation Authority
in July 2003. Sky Europe was followed by easyJet which started services from Luton in December 2004 and Ryanair with services from Stansted in October 2005.
2.63 Coinciding with the start of services between London and Bratislava there has been an abrupt change in traffi c growth levels on the London/Prague route where, after years of strong growth, total traffi c appears to be in decline. This suggests that the fast growth of traffi c on London/Bratislava may have been to some extent a result of diversion from the established London/Prague route.
Conclusions
2.64 The growth of air passenger traffi c at UK airports has been fairly stable when examined over the long term. Furthermore, there is little, if any, evidence of growth acceleration in the UK-EU and UK domestic markets coinciding with the advent of no-frills carriers, despite the fact that the UK has experienced a buoyant economic environment in the last ten years.
2.65 The analysis of broader market-level data suggests that a signifi cant factor in the growth of no-frills carriers from 2000 onwards has been their success in taking market share, in a growing market, from incumbent airlines, particularly from charter carriers, and perhaps to a much greater extent than has been recognised previously.
2.66 Turning to the route-level evidence, the picture is complex and varies from route to route. On some routes, no-frills carriers have succeeded in stimulating traffi c over the long-term with relatively little adverse impact on the traffi c of incumbents. But there are examples where stimulation has been short-lived, or where new entrants appear to have merely redistributed the existing demand, with little, if any, stimulation of new traffi c.
2.67 More recently, substitution appears also to be taking place between different destinations and not only between different carriers in the same market. There is now less ‘consumer loyalty’ to holiday destinations than before, due to the much greater choice of services and the relative ease of fare comparison and online booking.

INTENTIONALLY LEFT BLANK
Chapter 3 Page 1
3 The Impact of No-frills
Carriers on the Aviation
Market
How no-frills carriers have changed the airline market
3.1 No-frills carriers have unambiguously increased the level of competition in the industry1. They have done this in three main ways; fi rstly by reducing the level – and changing the structure – of fares; secondly by offering new destinations, or operating to alternative airports that serve the same ultimate destination already served by existing carriers; and thirdly (a later development) by offering high levels of frequency on the denser routes. This has affected different airlines in different ways, and led to varying responses.
Fares
3.2 It is perhaps low fares that are most closely associated with no-frills carriers. What no-frills carriers have been able to do, by concentrating on reducing operating costs, is to offer highly competitive fares whilst still remaining profi table. Full-service carriers have found it diffi cult to respond. Such carriers had traditionally operated with much higher costs in almost all areas of their business, and had tended to focus more on quality of service than price.
3.3 The service quality offering was not simply related to on-board services to customers, but also to network strength and connection possibilities. The focus on quality over price may be partly explained by the constraints under which the airline market operated, including bilateral restrictions2 and the IATA tariff agreement model, which limited and constrained price competition. As a result, when the no-frills carriers began offering low fares to passengers, the full-service carriers could not profi tably compete on fares alone.
3.4 Price competition extended to the structure of fares as well. No-frills carriers now generally price their fares by fl ight segment, with a return fare being the sum of the two one-way fares. By changing the fare structure, in particular by eliminating the Saturday night rule, no-frills carriers offered much cheaper fares for tickets returning either the same day or during the working week.
3.5 Charter carriers have been less affected by competition on price from no-frills carriers, as they have traditionally had relatively low costs. Furthermore, given their business model of mainly selling capacity as part of inclusive tour packages, they are less affected
1 NERA (2001) The Competitive Impact of Low-Cost Airlines.2 Air travel between countries has traditionally been governed by bilateral Air Services Agreements
(‘bilaterals’) that set out in a treaty which airlines could operate to which points and how often.

Chapter 3 Page 2
CAP 770No-frills Carriers: Revolution or Evolution?A Study by the Civil Aviation Authority
by fare competition alone than the changing market for package holidays as a whole.
Destinations
3.6 However, charter carriers have been signifi cantly affected by no-frills competition on destinations. No-frills carriers did not simply replicate the route structure of the traditional scheduled carriers. Instead, they offered a more diverse range of destinations, from a broader range of airports in the UK. This, along with a shift in package holiday preferences, has particularly affected charter carriers, as no-frills carriers have increasingly offered routes to holiday destinations, few of which were available before on a scheduled basis.
3.7 The entry of no-frills carriers into traditional “holiday” markets meant that people could purchase fl ights on scheduled services, generally offered at signifi cantly greater frequency than, but at prices likely to be similar to, the charter carriers’ offering (either directly when selling seats only, or indirectly when packaged in a holiday). This provided more fl exibility as to when people could travel to holiday destinations, and for how long, thus allowing them to create their own holidays, instead of relying on those offered by the package tour companies.
3.8 The move away from package holidays within Europe has been one of the main features of the holiday market over recent years, facilitated by the growth of the internet. No-frills carriers have both played a key part in this shift, and have benefi ted from it. By contrast, charter carriers have lost signifi cant traffi c.
3.9 There is no simple way to measure the growth of independently booked holidays. However, the proportion of people taking leisure trips which have ATOL3 cover is an indicator. CAA data4 shows that in 1997, 98% of leisure trips had ATOL cover, falling to 60% in 2006. While not all leisure trips with ATOL cover are package holidays, the decline in the proportion of trips with ATOL cover suggests that much of the continued growth in leisure travel has come from independently booked holidays.
3.10 Full-service carriers have also been affected by route competition. The expansion in the number of destinations with direct fl ights from the UK has reduced the need for passengers to fl y via connecting hub airports to reach a specifi c destination. Where the new destination is served by a no-frills carrier alone, many passengers are likely to choose a direct fl ight on a no-frills carrier over two connecting fl ights on a full-service carrier, whatever their airline preferences. No-frills carriers have also led a very signifi cant expansion in fl ights from UK regional airports, again reducing the need to connect through hub
3 Air Travel Organisers Licensing scheme, which provides protection to people against their holiday provider going insolvent, independently booked holidays do not normally fall under ATOL
4 CAA: Financial Protection for Air Travellers and Holiday Makers in the Future, CAA, CAP 759, 2005 and CAA: ATOL Business, Issue 28 - Winter 2005/06, CAA, 2006.
Chapter 3 Page 3
CAP 770No-frills Carriers: Revolution or Evolution?
A Study by the Civil Aviation Authority
airports and their associated airlines5.
Frequency
3.11 The provision of frequent scheduled fl ights to holiday destinations by no-frills carriers particularly affected charter carriers initially. More recently, no-frills carriers have also been able to compete with full-service carriers on frequency. The point-to-point operating model, the use of less congested airports, and the consequent high number of rotations that can be achieved, all serve to allow no-frills carriers to offer a wide range of choices to the passenger in terms of when they can fl y to the more popular destinations. Indeed, recent easyJet advertisements have drawn attention more to the frequency of its operations than to its low price.
Overall effect on competition
3.12 The effect of competition from no-frills carriers has been dramatic at the level of the market as a whole, not just on individual routes. This is because the availability of low fares has led consumers to expect short-haul travel to be cheap, at least if booked in advance (fares closer to the date of departure on both no-frills and full-service carriers are often signifi cantly higher than the lowest advertised fares). All airlines have had to respond to this changed expectation. In addition, the traditional business/leisure class split has become far less common in short-haul travel, with business travellers becoming increasingly cost-conscious.
How incumbent airlines have responded to no-frills competition
3.13 As shown in the previous chapter, no-frills carriers have dramatically increased their share of the short-haul international and UK domestic markets over the past decade. They have taken passengers away from both full-service and charter carriers, through successfully competing on fares, destinations offered, and frequency. Since 2000, both charter and full-service carriers have seen fl at or declining traffi c levels but have sought to respond to this competition.
The response from full-service carriers
3.14 Full-service carriers have responded primarily by cutting their costs, thereby increasing their ability to compete on price. Most full-service carriers cut operating costs signifi cantly, partly by adopting some of the same methods of operation developed by no-frills carriers, such as stripping out costs attached to sales and moving more to an internet-based ticketing operation. Many have also reduced their workforce considerably. BA’s Future Size and Shape Programme was
5 The Route Development Company, Low Cost Monitor, provides an annual list of all the no-frills routes in Europe, and shows the very rapid growth in routes
Chapter 3 Page 4
CAP 770No-frills Carriers: Revolution or Evolution?A Study by the Civil Aviation Authority
one example of an incumbent airline responding to the challenge of the no-frills carriers’ success.
3.15 Another response has been to limit or reduce capacity, in an attempt to match it more closely to demand. This has involved both limiting the growth in fl eets, and in some cases cutting less profi table routes.
3.16 Full-service carriers have also changed their fare structures, and generally adopted the no-frills carriers’ fare structures, both in terms of the use of one-way segment pricing and releasing fares in a step-by-step fare bucket approach. This has been accompanied by a greater focus on achieving high load factors, with pricing designed to increase the number of passengers carried.
3.17 Finally, the general approach to full-service carriers’ marketing of their short-haul services now stresses their ability to compete on price, alongside drawing attention to the quality of service they offer.
3.18 In some cases, airlines have changed their whole business model. Several airlines across Europe have set up no-frills subsidiaries, including bmi and British Airways (which subsequently sold it off). Some have also changed their product offering. On several routes, including some from Heathrow, bmi has eliminated business class and now charges for food and drink. BA also restructured and re-branded its regional carrier as BA Connect, which has recently been acquired by fl ybe.
The response from charter carriers
3.19 Charter carriers have seen a greater diminution of traffi c than full-service carriers, and have therefore had to take stronger measures in response. The competitive threat to charter carriers has mainly been on destinations, frequency and fl exibility, rather than price, meaning that their response has primarily involved cutting capacity or looking for new market opportunities.
3.20 This has been achieved both by moving aircraft to routes where no-frills competition is absent (in particular moving to longer routes), but also by creating subsidiary airlines, which have operated as no-frills scheduled carriers. The latter point is perhaps particularly important, and is an example of where no-frills carriers have not only changed the distribution of market share, but have also changed the structure of the leisure market itself.
Airports
3.21 One considerable change within the UK aviation market over the last decade has been the growth in importance of regional airports, and indeed of the historically smaller airports in the London area such as Stansted, Luton and London City.
Chapter 3 Page 5
CAP 770No-frills Carriers: Revolution or Evolution?
A Study by the Civil Aviation Authority
3.22 In the past, many airports may have adopted a somewhat passive role, seeing themselves as not particularly dynamic providers of infrastructure. They would accept those airlines that wished to operate to them, but did not perhaps actively seek to attract more airlines, or believe that it would be feasible to generate large passenger numbers, given the prevailing belief that only the major airports could sustain signifi cant international services.
3.23 However, as passenger numbers have built up, and new business opportunities have presented themselves, often in the shape of no-frills carriers launching services, so UK airports (and particularly regional airports) have changed the way they view themselves, and how they conduct their business, often coinciding with a move from public to private ownership.
3.24 This issue was examined in some detail in the CAA’s February 2005 document on Regional Air Services. Among the key conclusions from this paper were:
liberalisation of the EU aviation market has allowed airlines (and no-frills carriers in particular) to exploit new business opportunities, including realising the potential for sustaining direct services from UK regional airports, often at lower prices than previously available;
as these new services became established, they began to unlock latent demand for direct air travel from the UK regions to Europe (as a more attractive proposition than travelling via London);
as demand began to increase, so did the realisation of the possibilities of low-cost travel, for passengers, airports, and for the cities and regions they served. Propensity to fl y increased, as did the profi le of the airlines and the airports they were operating from;
airports began to change the way they viewed their operations, sometimes spurred by a move from public to private sector, but even where still in public ownership, taking a more commercial approach, pricing competitively and more actively seeking out new air services – thus creating a “virtuous circle” (see Figure 3.1 below);
all of these changes have served to increase levels of competition in the airport market, both between UK airports, but also increasingly between UK airports and airports in other parts of Europe, as different airports vie with each other to offer a suffi ciently attractive package to secure an airline placing its new routes;
competition has been further sharpened by the no-frills carriers being more “footloose” than traditional airlines, and so more able to switch (or credibly threaten to switch) services between
•
•
•
•
•
•
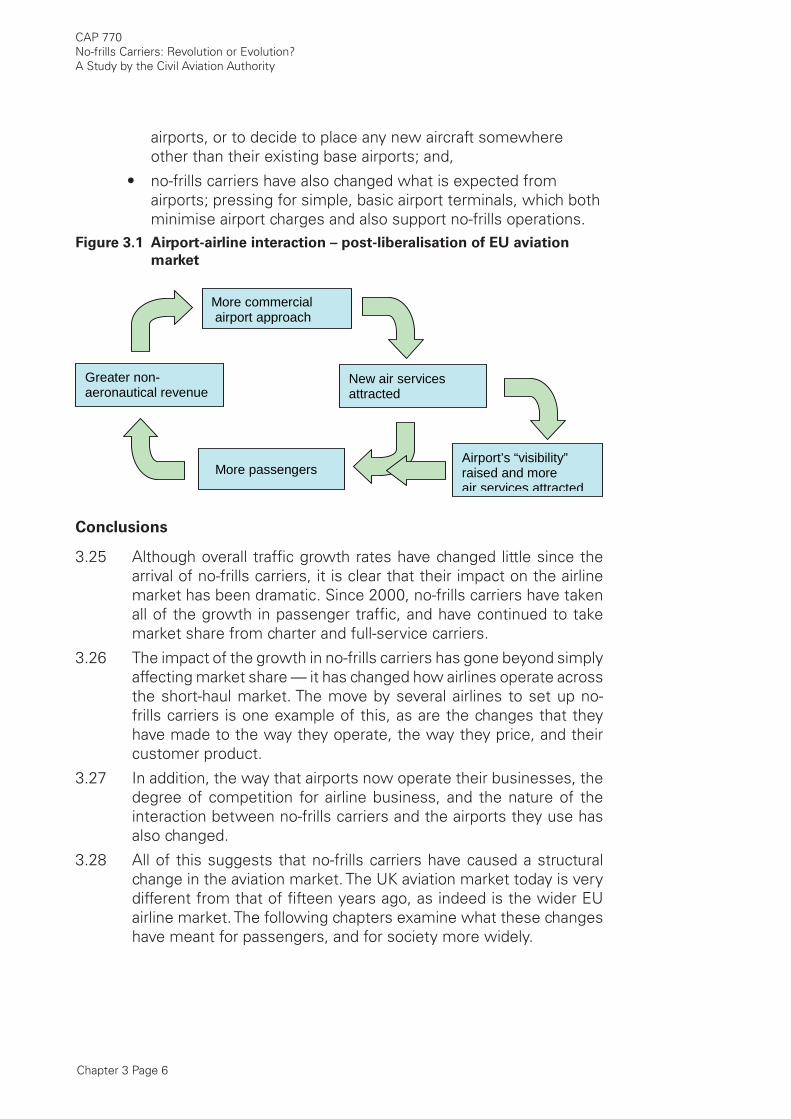
Chapter 3 Page 6
CAP 770No-frills Carriers: Revolution or Evolution?A Study by the Civil Aviation Authority
airports, or to decide to place any new aircraft somewhere other than their existing base airports; and,
no-frills carriers have also changed what is expected from airports; pressing for simple, basic airport terminals, which both minimise airport charges and also support no-frills operations.
Figure 3.1 Airport-airline interaction – post-liberalisation of EU aviation
market
Greater non-aeronautical revenue
More commercial airport approach
New air services attracted
Airport’s “visibility” raised and more air services attracted
More passengers
Conclusions
3.25 Although overall traffi c growth rates have changed little since the arrival of no-frills carriers, it is clear that their impact on the airline market has been dramatic. Since 2000, no-frills carriers have taken all of the growth in passenger traffi c, and have continued to take market share from charter and full-service carriers.
3.26 The impact of the growth in no-frills carriers has gone beyond simply affecting market share — it has changed how airlines operate across the short-haul market. The move by several airlines to set up no-frills carriers is one example of this, as are the changes that they have made to the way they operate, the way they price, and their customer product.
3.27 In addition, the way that airports now operate their businesses, the degree of competition for airline business, and the nature of the interaction between no-frills carriers and the airports they use has also changed.
3.28 All of this suggests that no-frills carriers have caused a structural change in the aviation market. The UK aviation market today is very different from that of fi fteen years ago, as indeed is the wider EU airline market. The following chapters examine what these changes have meant for passengers, and for society more widely.
•
Chapter 4 Page 1
4 Impact on Passengers – who
uses No-frills Carriers?
4.1 Chapter 2 discussed the limited impact of no-frills carriers on total passenger traffi c. The next two chapters look at the impact no-frills carriers have had on passengers. They examine purpose of travel, the differences between those fl ying on no-frills carriers and other airline types and the extent to which this passenger profi le has changed over time. All this is used to build up a picture of the impact that no-frills carriers have had on passengers.
4.2 These sections rely primarily on survey data collected by the CAA. The survey is a valuable source of data on passengers, and has a very large sample size. The survey does not cover every airport in the UK every year. This paper uses the most recent survey, 2005, which covered 14 airports, representing 81% of UK passenger traffi c. Unless stated otherwise the data reported is for the four main London airports (Heathrow, Gatwick, Stansted and Luton) and Manchester. These airports cover a wide range of airline operations, and are surveyed every year by the CAA, so offer robust data for comparisons over time. In addition, the London airports collectively provide passengers with the widest range of choice of airlines in the UK, so allowing for better comparisons between no-frills and full-service carriers.
4.3 Most of the data separates out Ryanair and easyJet from the remaining no-frills carriers, due to their size, and separates British Airways from the other full-service carriers for the same reason.
No-frills carriers: passenger profi le
4.4 As the previous sections have shown, no-frills carriers now have a signifi cant share of the short-haul market. Figure 4.1 sets out the share of total passenger traffi c between the UK and EU countries, including domestic traffi c within the UK.
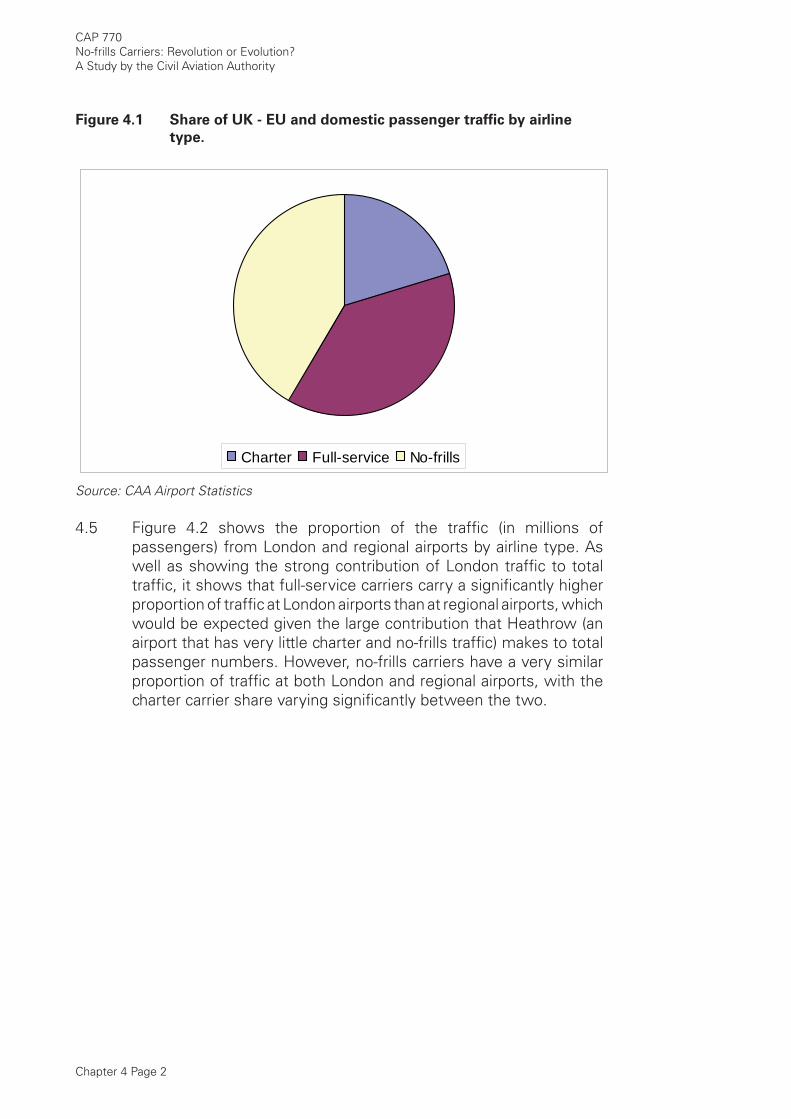
Chapter 4 Page 2
CAP 770No-frills Carriers: Revolution or Evolution?A Study by the Civil Aviation Authority
Figure 4.1 Share of UK - EU and domestic passenger traffi c by airline
type.
Charter Full-service No-frills
Source: CAA Airport Statistics
4.5 Figure 4.2 shows the proportion of the traffi c (in millions of passengers) from London and regional airports by airline type. As well as showing the strong contribution of London traffi c to total traffi c, it shows that full-service carriers carry a signifi cantly higher proportion of traffi c at London airports than at regional airports, which would be expected given the large contribution that Heathrow (an airport that has very little charter and no-frills traffi c) makes to total passenger numbers. However, no-frills carriers have a very similar proportion of traffi c at both London and regional airports, with the charter carrier share varying signifi cantly between the two.
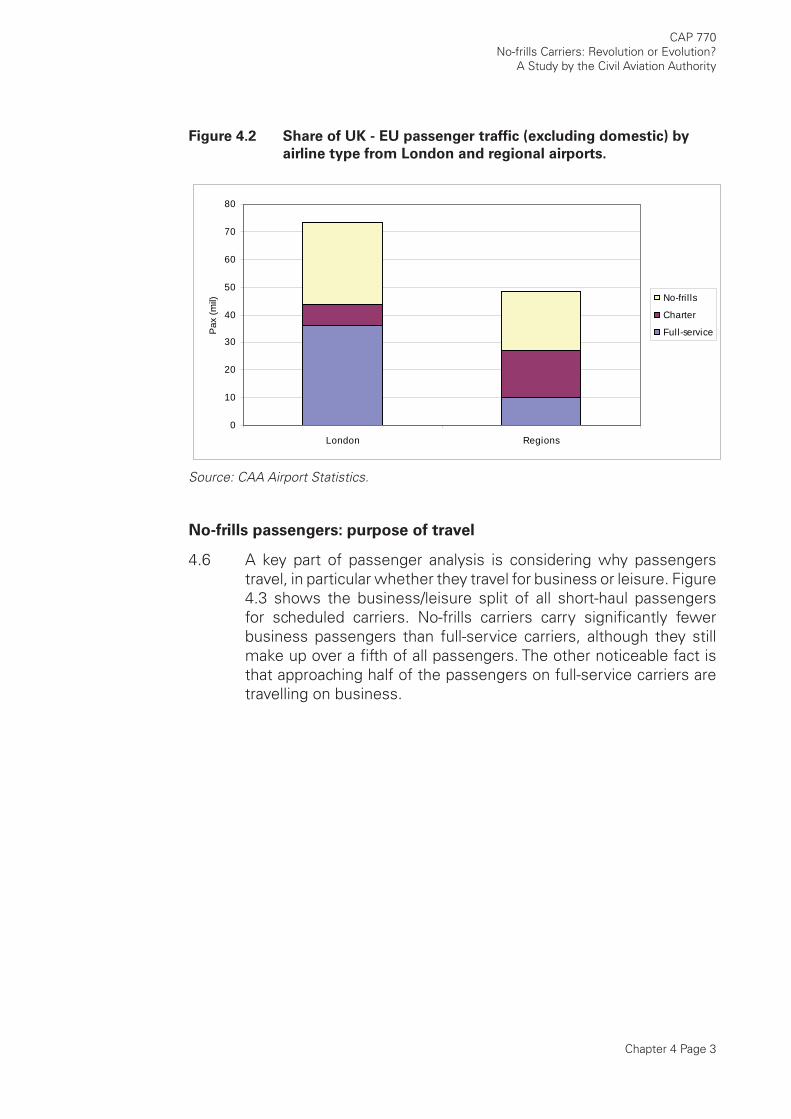
Chapter 4 Page 3
CAP 770No-frills Carriers: Revolution or Evolution?
A Study by the Civil Aviation Authority
Figure 4.2 Share of UK - EU passenger traffi c (excluding domestic) by
airline type from London and regional airports.
0
10
20
30
40
50
60
70
80
London Regions
Pax
(mil) No-fri l ls
Charter
Full-service
Source: CAA Airport Statistics.
No-frills passengers: purpose of travel
4.6 A key part of passenger analysis is considering why passengers travel, in particular whether they travel for business or leisure. Figure 4.3 shows the business/leisure split of all short-haul passengers for scheduled carriers. No-frills carriers carry signifi cantly fewer business passengers than full-service carriers, although they still make up over a fi fth of all passengers. The other noticeable fact is that approaching half of the passengers on full-service carriers are travelling on business.
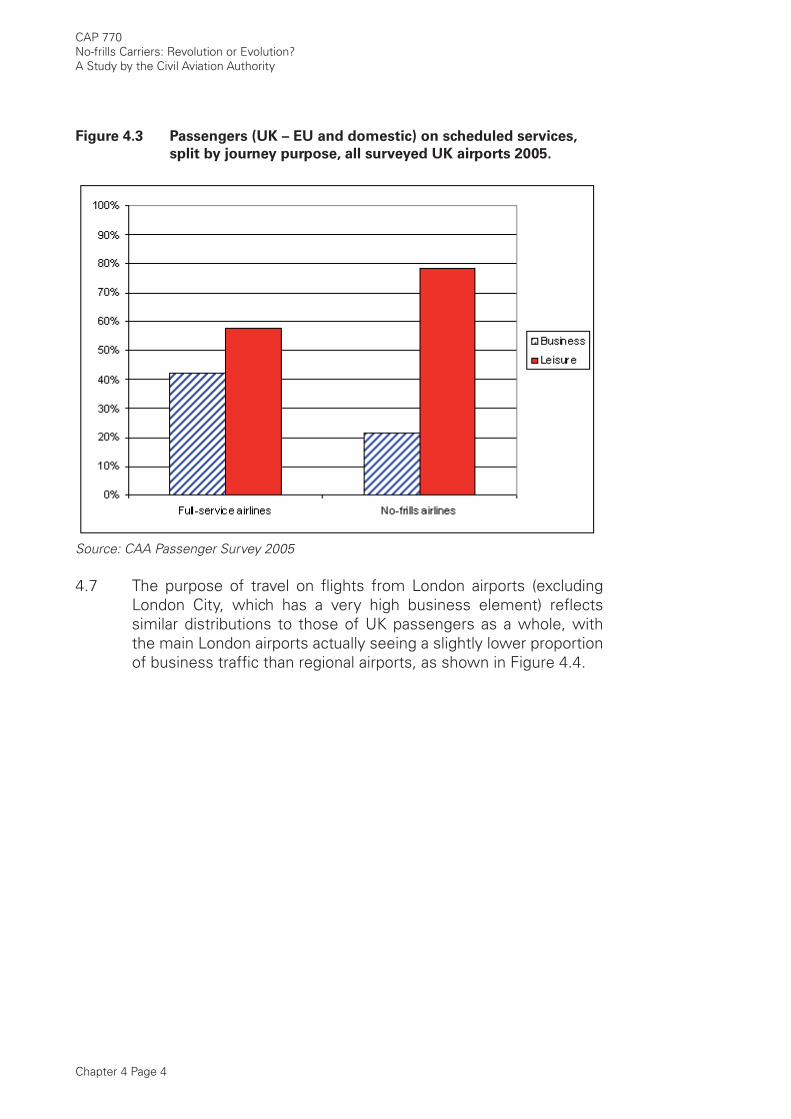
Chapter 4 Page 4
CAP 770No-frills Carriers: Revolution or Evolution?A Study by the Civil Aviation Authority
Figure 4.3 Passengers (UK – EU and domestic) on scheduled services,
split by journey purpose, all surveyed UK airports 2005.
Source: CAA Passenger Survey 2005
4.7 The purpose of travel on fl ights from London airports (excluding London City, which has a very high business element) refl ects similar distributions to those of UK passengers as a whole, with the main London airports actually seeing a slightly lower proportion of business traffi c than regional airports, as shown in Figure 4.4.
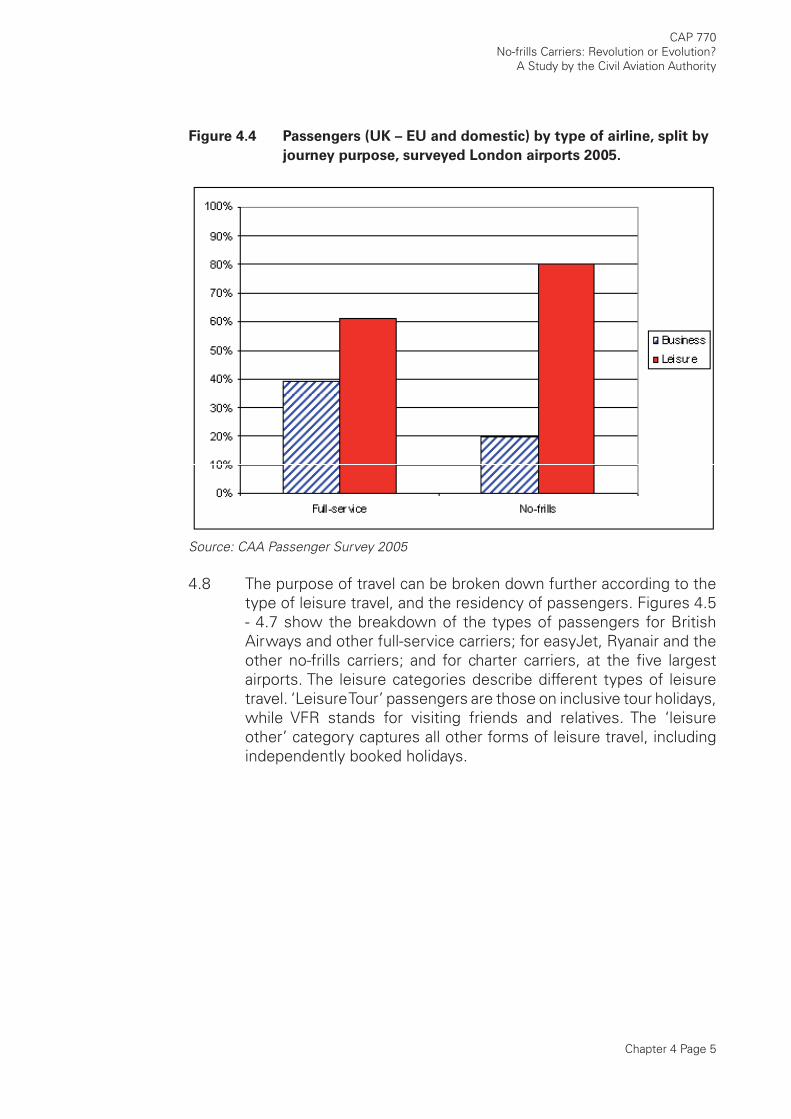
Chapter 4 Page 5
CAP 770No-frills Carriers: Revolution or Evolution?
A Study by the Civil Aviation Authority
Figure 4.4 Passengers (UK – EU and domestic) by type of airline, split by
journey purpose, surveyed London airports 2005.
Source: CAA Passenger Survey 2005
4.8 The purpose of travel can be broken down further according to the type of leisure travel, and the residency of passengers. Figures 4.5 - 4.7 show the breakdown of the types of passengers for British Airways and other full-service carriers; for easyJet, Ryanair and the other no-frills carriers; and for charter carriers, at the fi ve largest airports. The leisure categories describe different types of leisure travel. ‘Leisure Tour’ passengers are those on inclusive tour holidays, while VFR stands for visiting friends and relatives. The ‘leisure other’ category captures all other forms of leisure travel, including independently booked holidays.
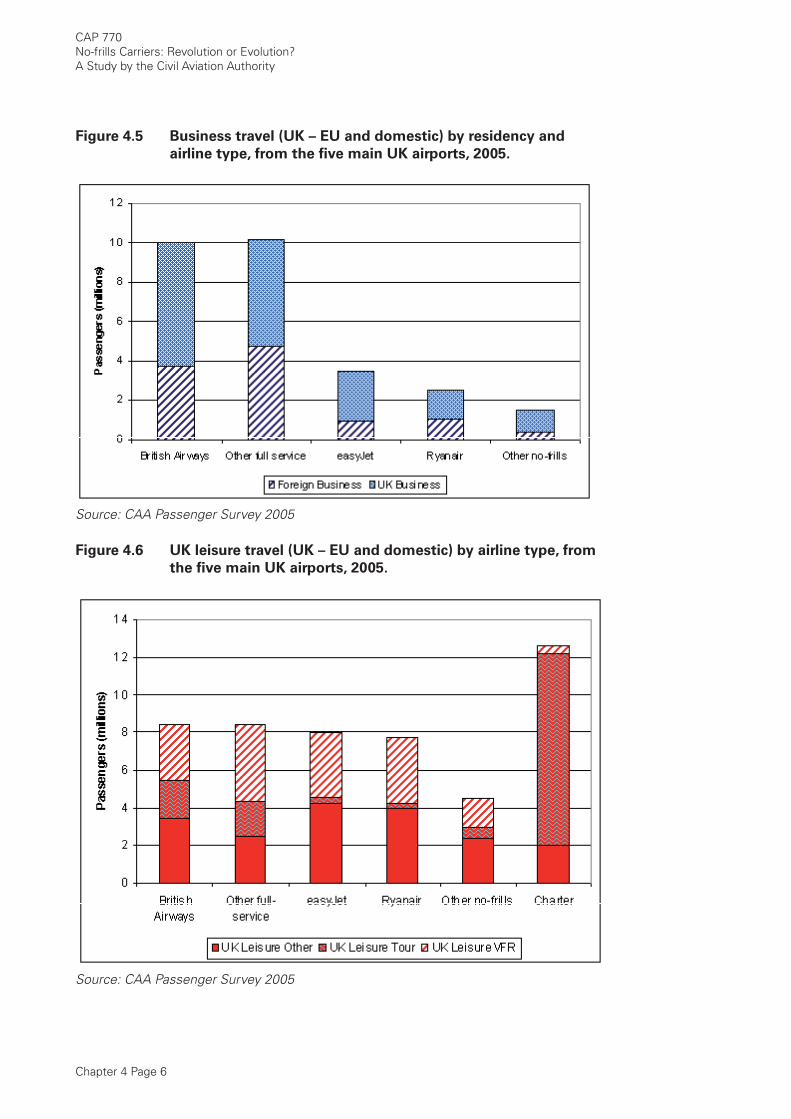
Chapter 4 Page 6
CAP 770No-frills Carriers: Revolution or Evolution?A Study by the Civil Aviation Authority
Figure 4.5 Business travel (UK – EU and domestic) by residency and
airline type, from the fi ve main UK airports, 2005.
Source: CAA Passenger Survey 2005
Figure 4.6 UK leisure travel (UK – EU and domestic) by airline type, from
the fi ve main UK airports, 2005.
Source: CAA Passenger Survey 2005
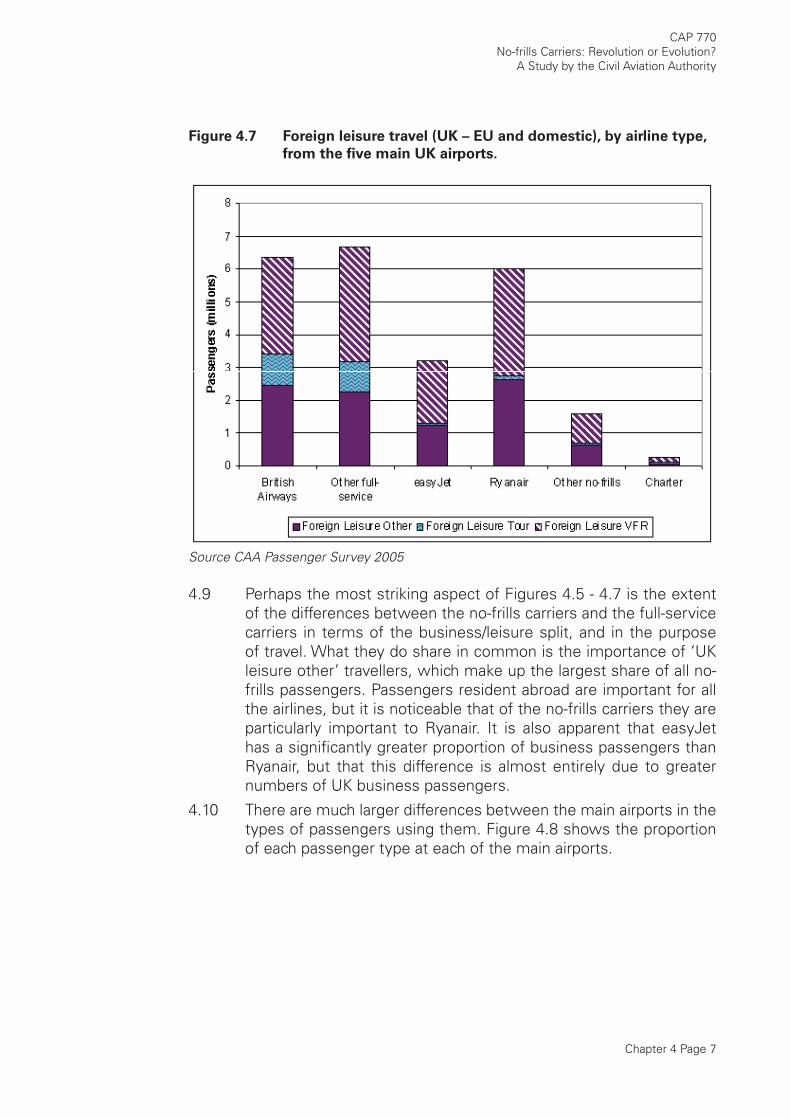
Chapter 4 Page 7
CAP 770No-frills Carriers: Revolution or Evolution?
A Study by the Civil Aviation Authority
Figure 4.7 Foreign leisure travel (UK – EU and domestic), by airline type,
from the fi ve main UK airports.
Source CAA Passenger Survey 2005
4.9 Perhaps the most striking aspect of Figures 4.5 - 4.7 is the extent of the differences between the no-frills carriers and the full-service carriers in terms of the business/leisure split, and in the purpose of travel. What they do share in common is the importance of ‘UK leisure other’ travellers, which make up the largest share of all no-frills passengers. Passengers resident abroad are important for all the airlines, but it is noticeable that of the no-frills carriers they are particularly important to Ryanair. It is also apparent that easyJet has a signifi cantly greater proportion of business passengers than Ryanair, but that this difference is almost entirely due to greater numbers of UK business passengers.
4.10 There are much larger differences between the main airports in the types of passengers using them. Figure 4.8 shows the proportion of each passenger type at each of the main airports.
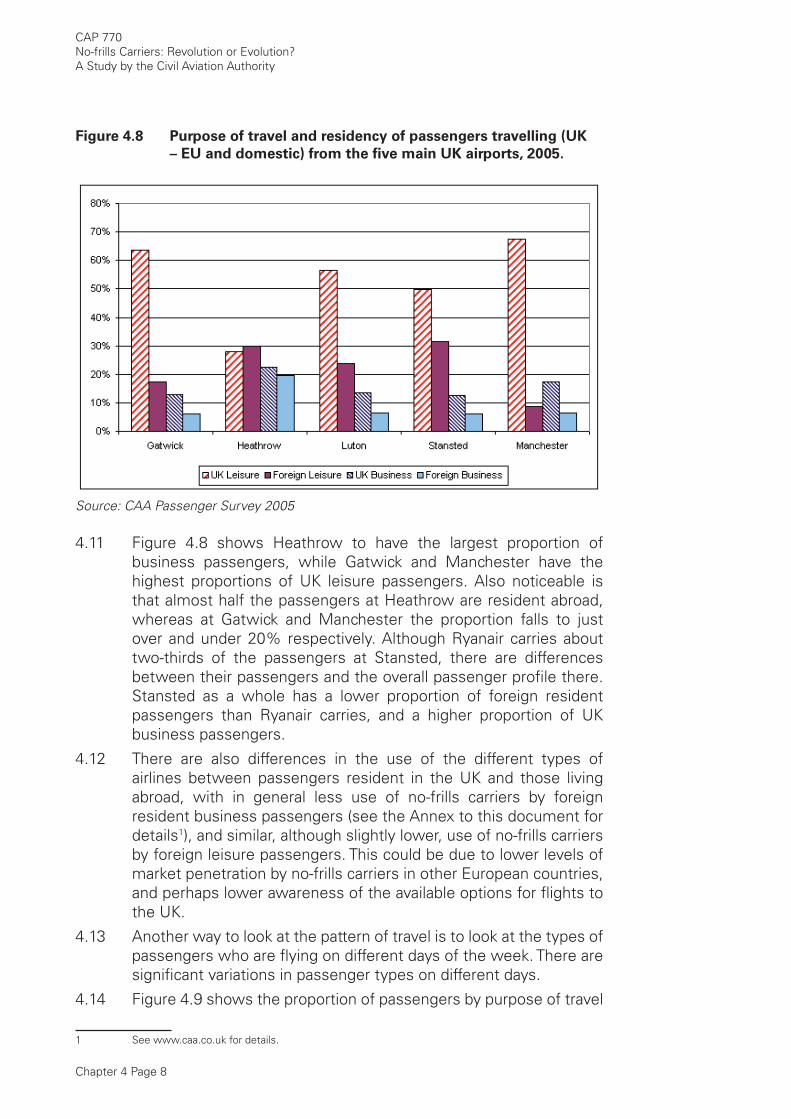
Chapter 4 Page 8
CAP 770No-frills Carriers: Revolution or Evolution?A Study by the Civil Aviation Authority
Figure 4.8 Purpose of travel and residency of passengers travelling (UK
– EU and domestic) from the fi ve main UK airports, 2005.
Source: CAA Passenger Survey 2005
4.11 Figure 4.8 shows Heathrow to have the largest proportion of business passengers, while Gatwick and Manchester have the highest proportions of UK leisure passengers. Also noticeable is that almost half the passengers at Heathrow are resident abroad, whereas at Gatwick and Manchester the proportion falls to just over and under 20% respectively. Although Ryanair carries about two-thirds of the passengers at Stansted, there are differences between their passengers and the overall passenger profi le there. Stansted as a whole has a lower proportion of foreign resident passengers than Ryanair carries, and a higher proportion of UK business passengers.
4.12 There are also differences in the use of the different types of airlines between passengers resident in the UK and those living abroad, with in general less use of no-frills carriers by foreign resident business passengers (see the Annex to this document for details1), and similar, although slightly lower, use of no-frills carriers by foreign leisure passengers. This could be due to lower levels of market penetration by no-frills carriers in other European countries, and perhaps lower awareness of the available options for fl ights to the UK.
4.13 Another way to look at the pattern of travel is to look at the types of passengers who are fl ying on different days of the week. There are signifi cant variations in passenger types on different days.
4.14 Figure 4.9 shows the proportion of passengers by purpose of travel
1 See www.caa.co.uk for details.
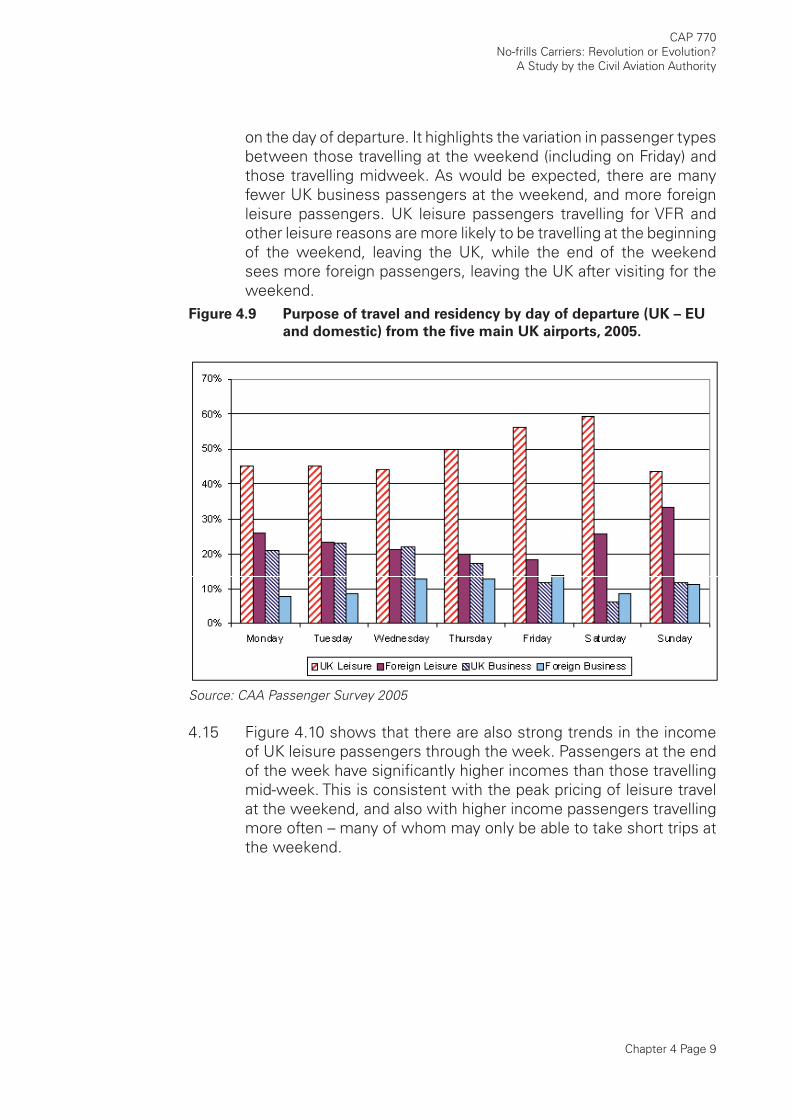
Chapter 4 Page 9
CAP 770No-frills Carriers: Revolution or Evolution?
A Study by the Civil Aviation Authority
on the day of departure. It highlights the variation in passenger types between those travelling at the weekend (including on Friday) and those travelling midweek. As would be expected, there are many fewer UK business passengers at the weekend, and more foreign leisure passengers. UK leisure passengers travelling for VFR and other leisure reasons are more likely to be travelling at the beginning of the weekend, leaving the UK, while the end of the weekend sees more foreign passengers, leaving the UK after visiting for the weekend.
Figure 4.9 Purpose of travel and residency by day of departure (UK – EU
and domestic) from the fi ve main UK airports, 2005.
Source: CAA Passenger Survey 2005
4.15 Figure 4.10 shows that there are also strong trends in the income of UK leisure passengers through the week. Passengers at the end of the week have signifi cantly higher incomes than those travelling mid-week. This is consistent with the peak pricing of leisure travel at the weekend, and also with higher income passengers travelling more often – many of whom may only be able to take short trips at the weekend.
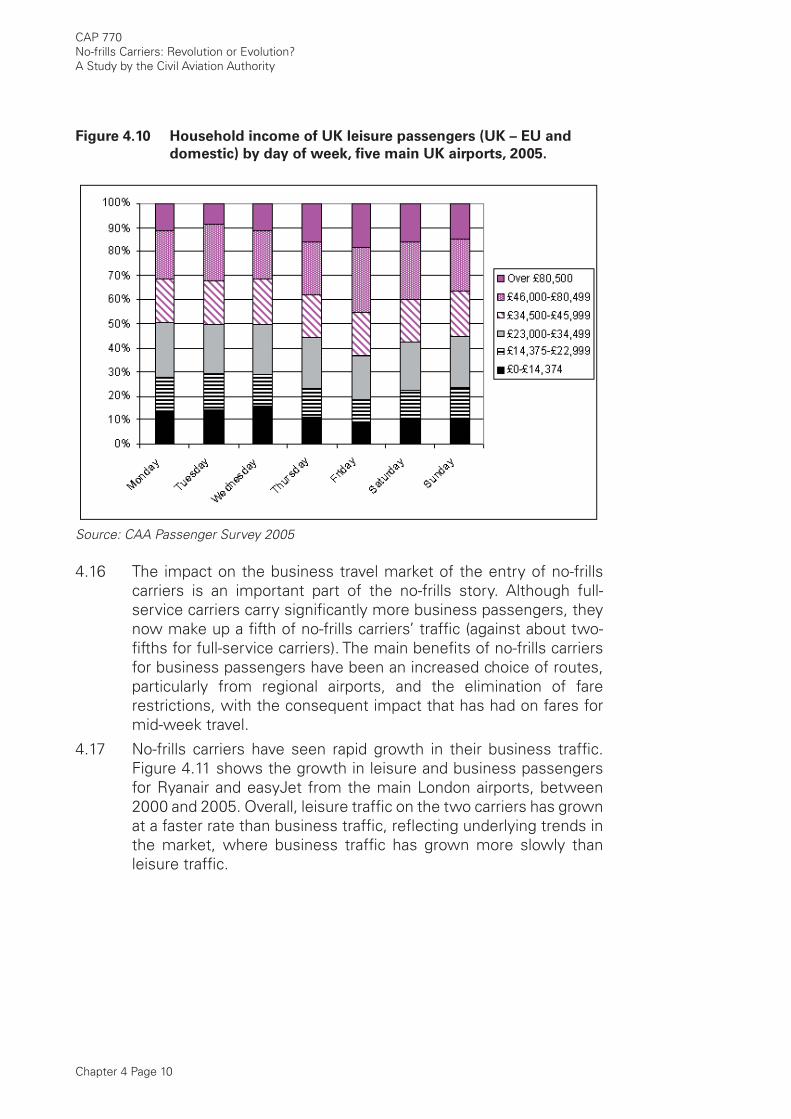
Chapter 4 Page 10
CAP 770No-frills Carriers: Revolution or Evolution?A Study by the Civil Aviation Authority
Figure 4.10 Household income of UK leisure passengers (UK – EU and
domestic) by day of week, fi ve main UK airports, 2005.
Source: CAA Passenger Survey 2005
4.16 The impact on the business travel market of the entry of no-frills carriers is an important part of the no-frills story. Although full-service carriers carry signifi cantly more business passengers, they now make up a fi fth of no-frills carriers’ traffi c (against about two-fi fths for full-service carriers). The main benefi ts of no-frills carriers for business passengers have been an increased choice of routes, particularly from regional airports, and the elimination of fare restrictions, with the consequent impact that has had on fares for mid-week travel.
4.17 No-frills carriers have seen rapid growth in their business traffi c. Figure 4.11 shows the growth in leisure and business passengers for Ryanair and easyJet from the main London airports, between 2000 and 2005. Overall, leisure traffi c on the two carriers has grown at a faster rate than business traffi c, refl ecting underlying trends in the market, where business traffi c has grown more slowly than leisure traffi c.
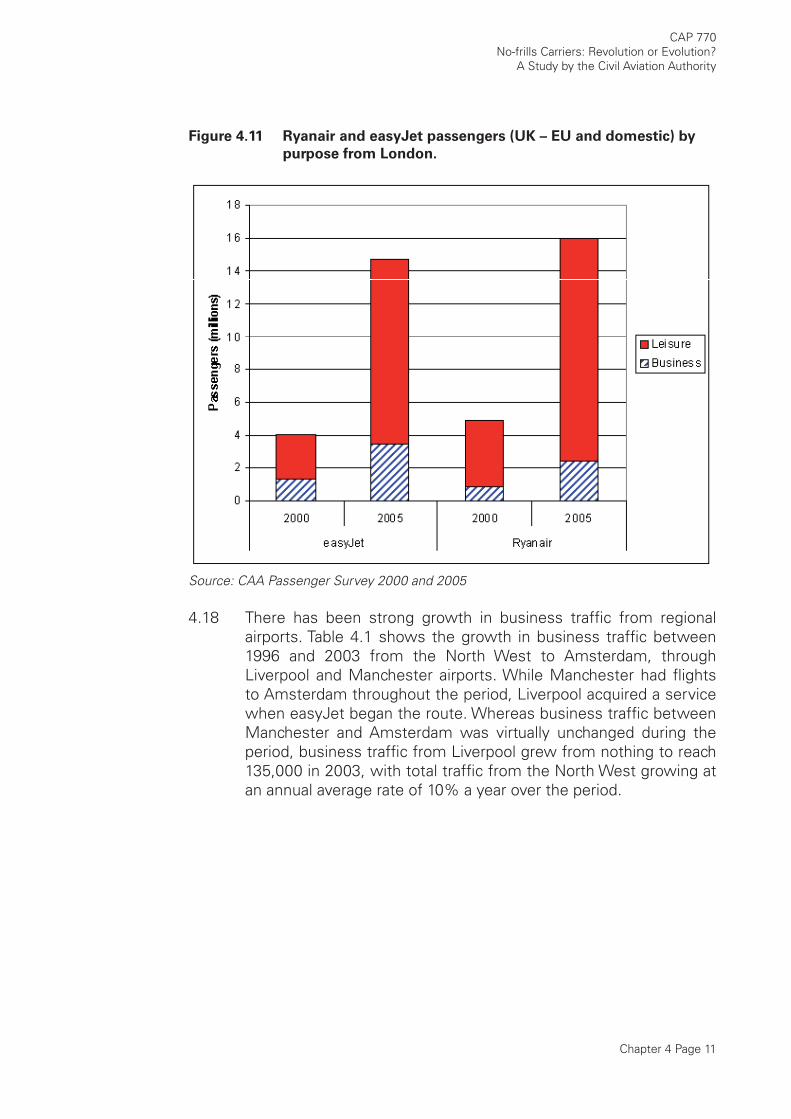
Chapter 4 Page 11
CAP 770No-frills Carriers: Revolution or Evolution?
A Study by the Civil Aviation Authority
Figure 4.11 Ryanair and easyJet passengers (UK – EU and domestic) by
purpose from London.
Source: CAA Passenger Survey 2000 and 2005
4.18 There has been strong growth in business traffi c from regional airports. Table 4.1 shows the growth in business traffi c between 1996 and 2003 from the North West to Amsterdam, through Liverpool and Manchester airports. While Manchester had fl ights to Amsterdam throughout the period, Liverpool acquired a service when easyJet began the route. Whereas business traffi c between Manchester and Amsterdam was virtually unchanged during the period, business traffi c from Liverpool grew from nothing to reach 135,000 in 2003, with total traffi c from the North West growing at an annual average rate of 10% a year over the period.
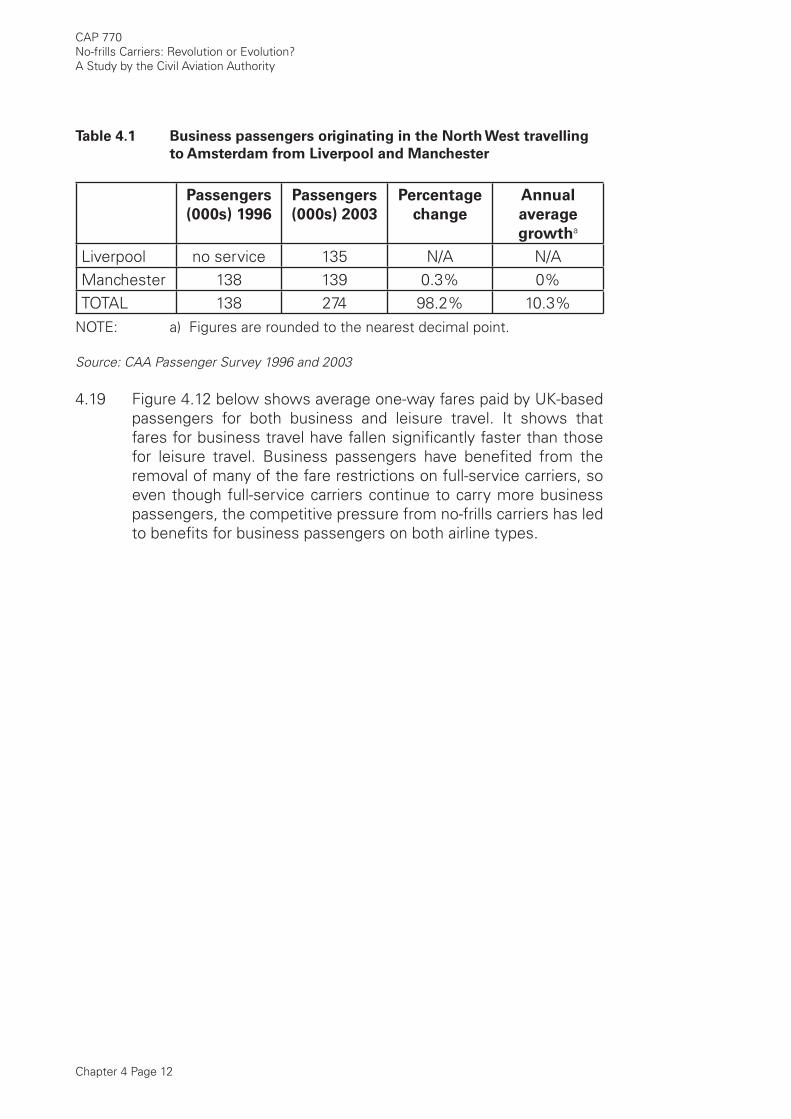
Chapter 4 Page 12
CAP 770No-frills Carriers: Revolution or Evolution?A Study by the Civil Aviation Authority
Table 4.1 Business passengers originating in the North West travelling
to Amsterdam from Liverpool and Manchester
Passengers
(000s) 1996
Passengers
(000s) 2003
Percentage
change
Annual
average
growtha
Liverpool no service 135 N/A N/AManchester 138 139 0.3% 0%TOTAL 138 274 98.2% 10.3%
NOTE: a) Figures are rounded to the nearest decimal point.
Source: CAA Passenger Survey 1996 and 2003
4.19 Figure 4.12 below shows average one-way fares paid by UK-based passengers for both business and leisure travel. It shows that fares for business travel have fallen signifi cantly faster than those for leisure travel. Business passengers have benefi ted from the removal of many of the fare restrictions on full-service carriers, so even though full-service carriers continue to carry more business passengers, the competitive pressure from no-frills carriers has led to benefi ts for business passengers on both airline types.
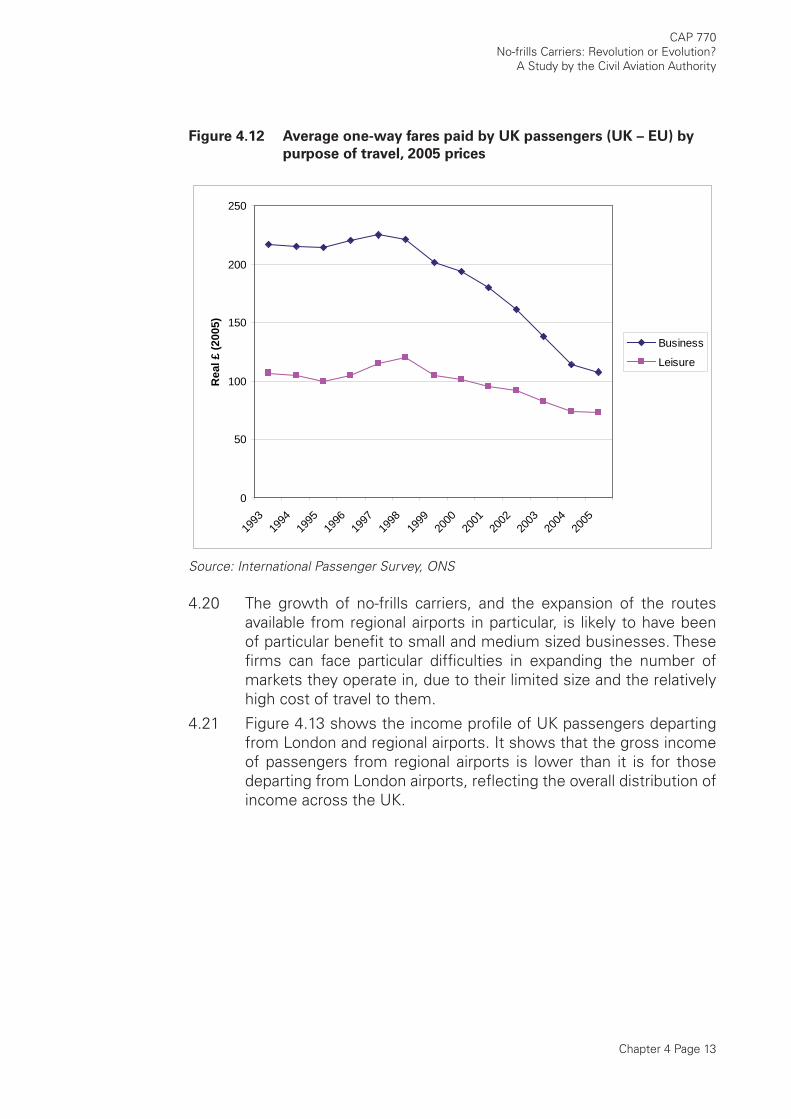
Chapter 4 Page 13
CAP 770No-frills Carriers: Revolution or Evolution?
A Study by the Civil Aviation Authority
Figure 4.12 Average one-way fares paid by UK passengers (UK – EU) by
purpose of travel, 2005 prices
0
50
100
150
200
250
1993
1994
1995
1996
1997
1998
1999
2000
2001
2002
2003
2004
2005
Rea
l £ (2
005)
Business
Leisure
Source: International Passenger Survey, ONS
4.20 The growth of no-frills carriers, and the expansion of the routes available from regional airports in particular, is likely to have been of particular benefi t to small and medium sized businesses. These fi rms can face particular diffi culties in expanding the number of markets they operate in, due to their limited size and the relatively high cost of travel to them.
4.21 Figure 4.13 shows the income profi le of UK passengers departing from London and regional airports. It shows that the gross income of passengers from regional airports is lower than it is for those departing from London airports, refl ecting the overall distribution of income across the UK.
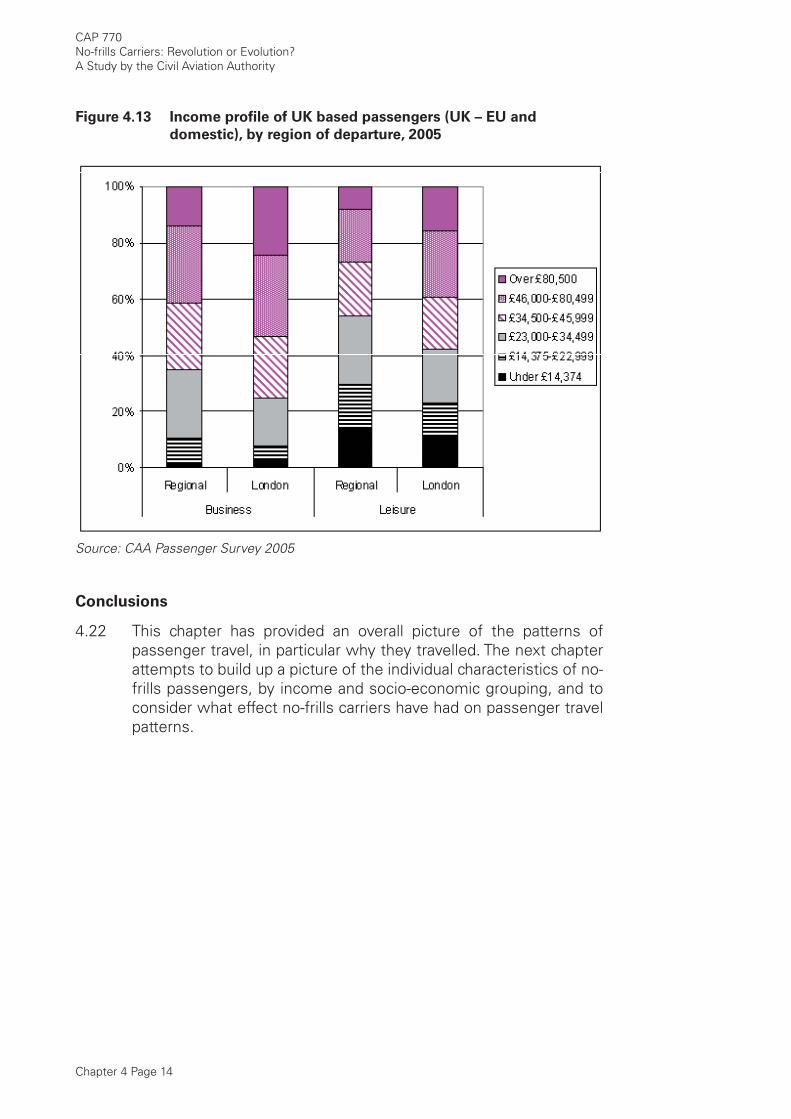
Chapter 4 Page 14
CAP 770No-frills Carriers: Revolution or Evolution?A Study by the Civil Aviation Authority
Figure 4.13 Income profi le of UK based passengers (UK – EU and
domestic), by region of departure, 2005
Source: CAA Passenger Survey 2005
Conclusions
4.22 This chapter has provided an overall picture of the patterns of passenger travel, in particular why they travelled. The next chapter attempts to build up a picture of the individual characteristics of no-frills passengers, by income and socio-economic grouping, and to consider what effect no-frills carriers have had on passenger travel patterns.
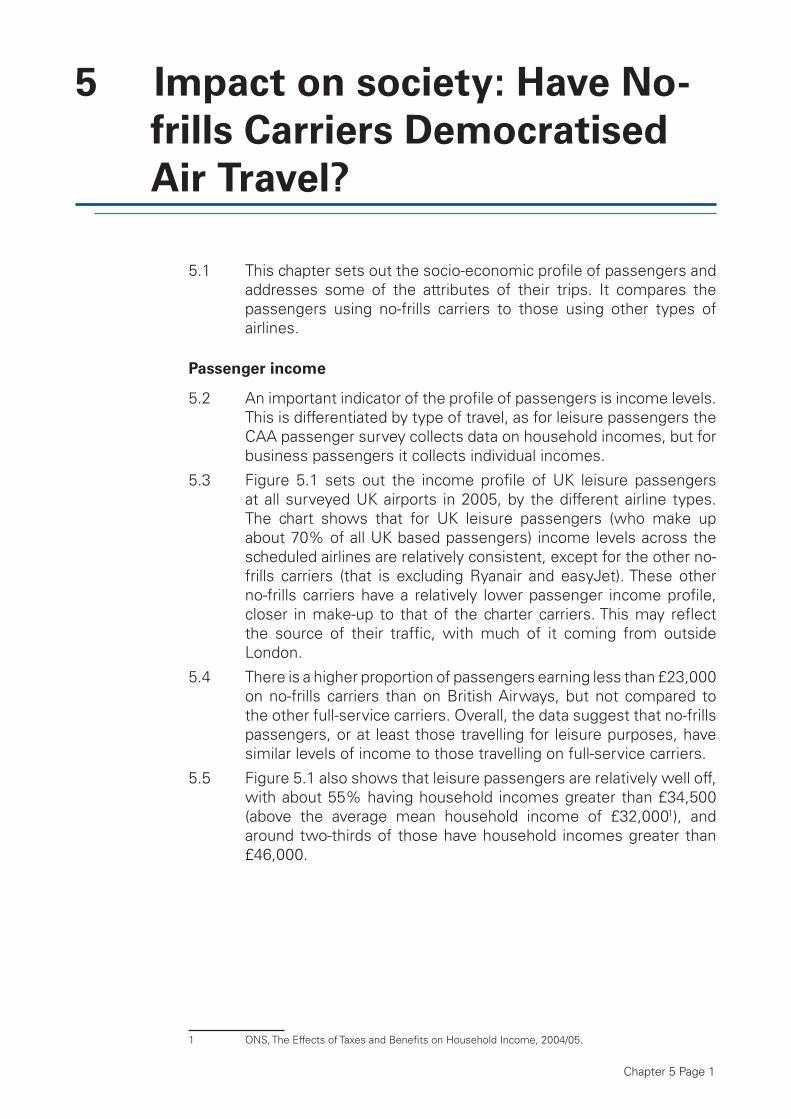
Chapter 5 Page 1
5 Impact on society: Have No-
frills Carriers Democratised
Air Travel?
5.1 This chapter sets out the socio-economic profi le of passengers and addresses some of the attributes of their trips. It compares the passengers using no-frills carriers to those using other types of airlines.
Passenger income
5.2 An important indicator of the profi le of passengers is income levels. This is differentiated by type of travel, as for leisure passengers the CAA passenger survey collects data on household incomes, but for business passengers it collects individual incomes.
5.3 Figure 5.1 sets out the income profi le of UK leisure passengers at all surveyed UK airports in 2005, by the different airline types. The chart shows that for UK leisure passengers (who make up about 70% of all UK based passengers) income levels across the scheduled airlines are relatively consistent, except for the other no-frills carriers (that is excluding Ryanair and easyJet). These other no-frills carriers have a relatively lower passenger income profi le, closer in make-up to that of the charter carriers. This may refl ect the source of their traffi c, with much of it coming from outside London.
5.4 There is a higher proportion of passengers earning less than £23,000 on no-frills carriers than on British Airways, but not compared to the other full-service carriers. Overall, the data suggest that no-frills passengers, or at least those travelling for leisure purposes, have similar levels of income to those travelling on full-service carriers.
5.5 Figure 5.1 also shows that leisure passengers are relatively well off, with about 55% having household incomes greater than £34,500 (above the average mean household income of £32,0001), and around two-thirds of those have household incomes greater than £46,000.
1 ONS, The Effects of Taxes and Benefi ts on Household Income, 2004/05.
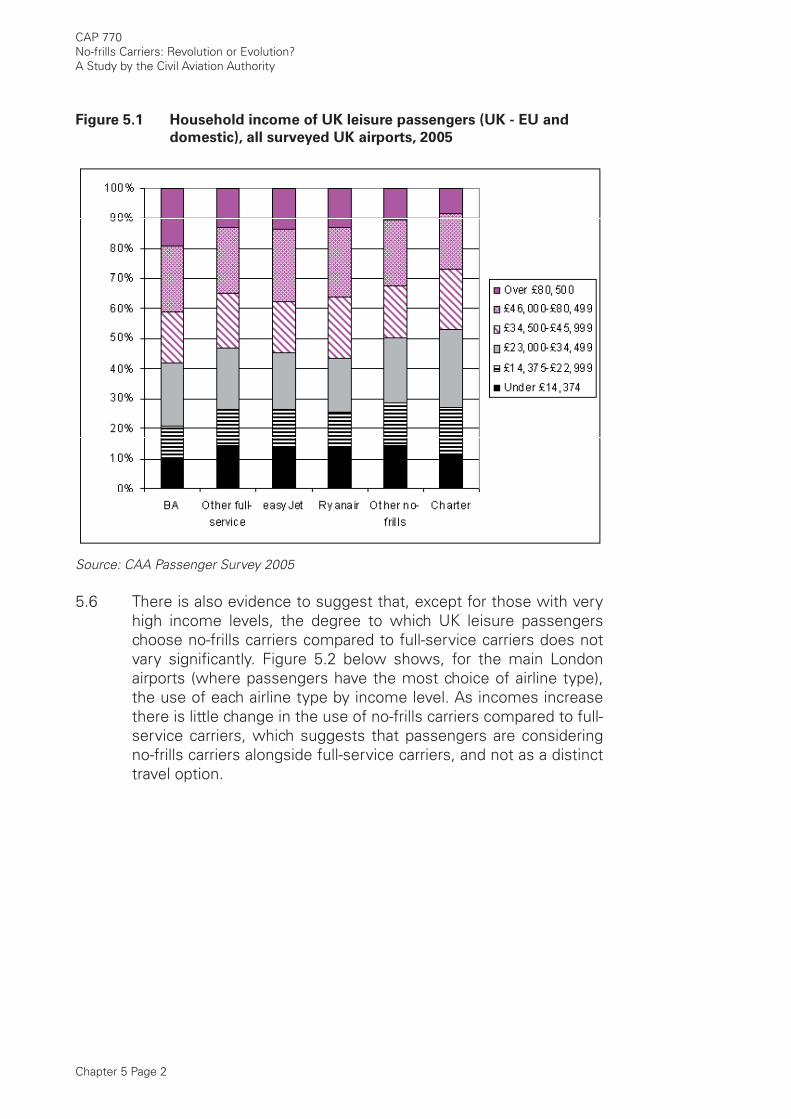
Chapter 5 Page 2
CAP 770No-frills Carriers: Revolution or Evolution?A Study by the Civil Aviation Authority
Figure 5.1 Household income of UK leisure passengers (UK - EU and
domestic), all surveyed UK airports, 2005
Source: CAA Passenger Survey 2005
5.6 There is also evidence to suggest that, except for those with very high income levels, the degree to which UK leisure passengers choose no-frills carriers compared to full-service carriers does not vary signifi cantly. Figure 5.2 below shows, for the main London airports (where passengers have the most choice of airline type), the use of each airline type by income level. As incomes increase there is little change in the use of no-frills carriers compared to full-service carriers, which suggests that passengers are considering no-frills carriers alongside full-service carriers, and not as a distinct travel option.
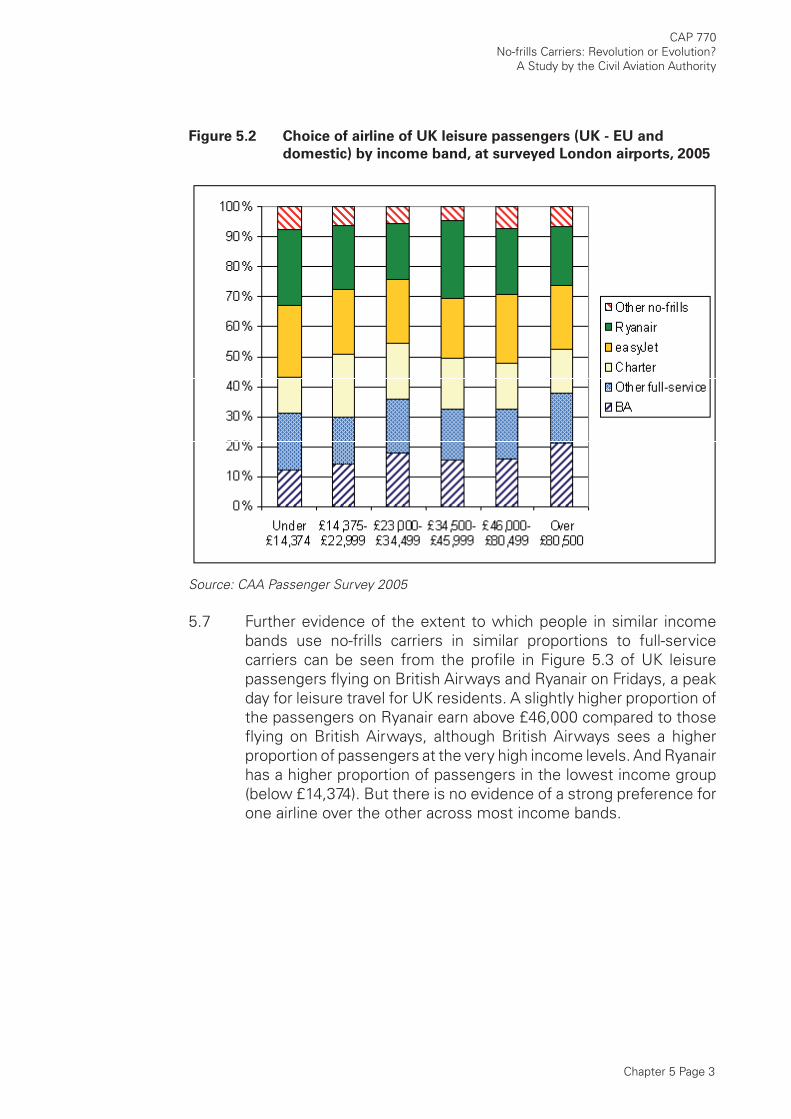
Chapter 5 Page 3
CAP 770No-frills Carriers: Revolution or Evolution?
A Study by the Civil Aviation Authority
Figure 5.2 Choice of airline of UK leisure passengers (UK - EU and
domestic) by income band, at surveyed London airports, 2005
Source: CAA Passenger Survey 2005
5.7 Further evidence of the extent to which people in similar income bands use no-frills carriers in similar proportions to full-service carriers can be seen from the profi le in Figure 5.3 of UK leisure passengers fl ying on British Airways and Ryanair on Fridays, a peak day for leisure travel for UK residents. A slightly higher proportion of the passengers on Ryanair earn above £46,000 compared to those fl ying on British Airways, although British Airways sees a higher proportion of passengers at the very high income levels. And Ryanair has a higher proportion of passengers in the lowest income group (below £14,374). But there is no evidence of a strong preference for one airline over the other across most income bands.
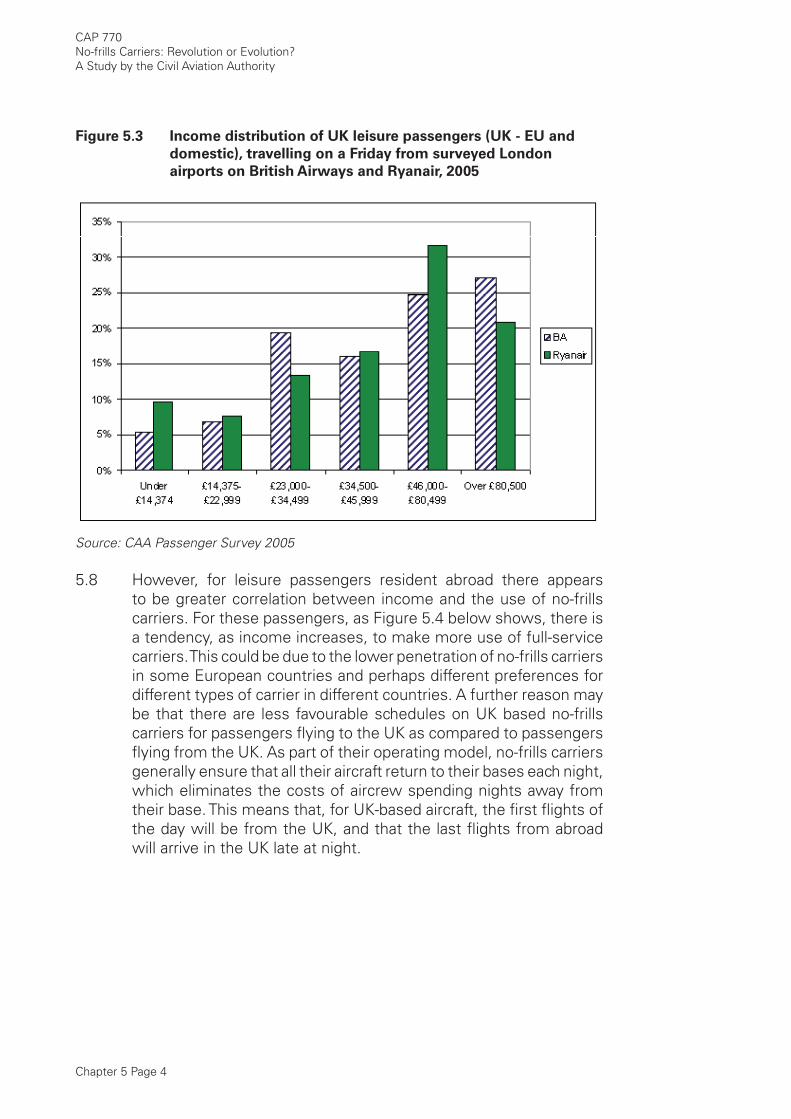
Chapter 5 Page 4
CAP 770No-frills Carriers: Revolution or Evolution?A Study by the Civil Aviation Authority
Figure 5.3 Income distribution of UK leisure passengers (UK - EU and
domestic), travelling on a Friday from surveyed London
airports on British Airways and Ryanair, 2005
Source: CAA Passenger Survey 2005
5.8 However, for leisure passengers resident abroad there appears to be greater correlation between income and the use of no-frills carriers. For these passengers, as Figure 5.4 below shows, there is a tendency, as income increases, to make more use of full-service carriers. This could be due to the lower penetration of no-frills carriers in some European countries and perhaps different preferences for different types of carrier in different countries. A further reason may be that there are less favourable schedules on UK based no-frills carriers for passengers fl ying to the UK as compared to passengers fl ying from the UK. As part of their operating model, no-frills carriers generally ensure that all their aircraft return to their bases each night, which eliminates the costs of aircrew spending nights away from their base. This means that, for UK-based aircraft, the fi rst fl ights of the day will be from the UK, and that the last fl ights from abroad will arrive in the UK late at night.

Chapter 5 Page 5
CAP 770No-frills Carriers: Revolution or Evolution?
A Study by the Civil Aviation Authority
Figure 5.4 Foreign leisure (UK - EU and domestic) passengers’ choice
of airline by household income band, at surveyed London
airports, 2005
Source: CAA Passenger Survey 2005
5.9 The similarities in household income levels of UK leisure passengers across airlines are repeated for the main airports. Figure 5.5 sets out the income levels of UK leisure passengers for these airports. It shows that at the London airports there are similar proportions of UK leisure passengers from the main income categories. Passengers at Manchester Airport have noticeably lower income levels, in part refl ecting the high level of charter operations at Manchester and the generally lower level of household incomes in the rest of the country compared to London and the South-East.
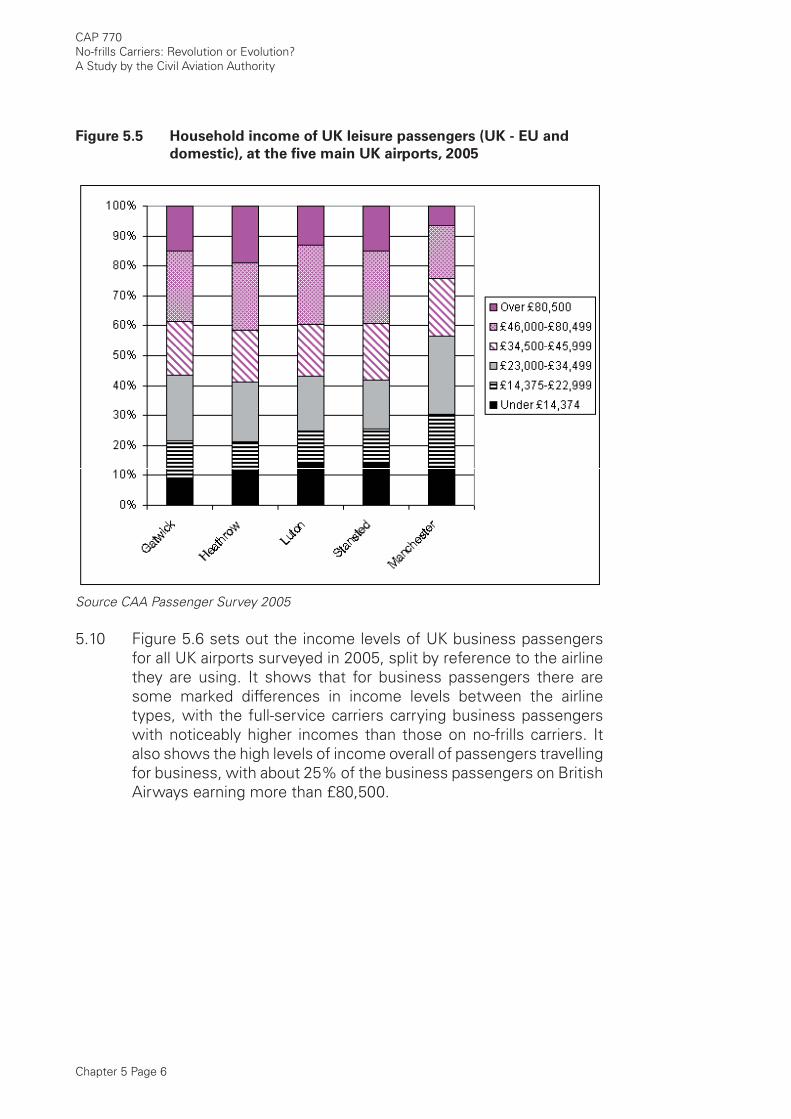
Chapter 5 Page 6
CAP 770No-frills Carriers: Revolution or Evolution?A Study by the Civil Aviation Authority
Figure 5.5 Household income of UK leisure passengers (UK - EU and
domestic), at the fi ve main UK airports, 2005
Source CAA Passenger Survey 2005
5.10 Figure 5.6 sets out the income levels of UK business passengers for all UK airports surveyed in 2005, split by reference to the airline they are using. It shows that for business passengers there are some marked differences in income levels between the airline types, with the full-service carriers carrying business passengers with noticeably higher incomes than those on no-frills carriers. It also shows the high levels of income overall of passengers travelling for business, with about 25% of the business passengers on British Airways earning more than £80,500.
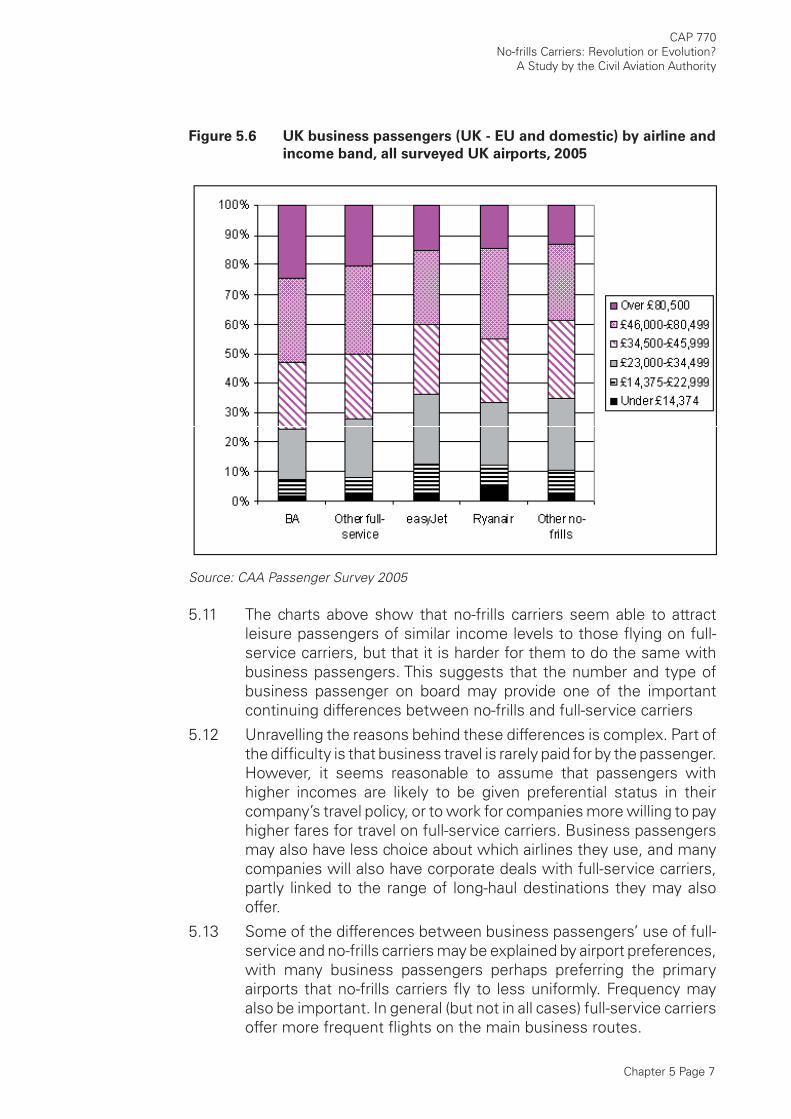
Chapter 5 Page 7
CAP 770No-frills Carriers: Revolution or Evolution?
A Study by the Civil Aviation Authority
Figure 5.6 UK business passengers (UK - EU and domestic) by airline and
income band, all surveyed UK airports, 2005
Source: CAA Passenger Survey 2005
5.11 The charts above show that no-frills carriers seem able to attract leisure passengers of similar income levels to those fl ying on full-service carriers, but that it is harder for them to do the same with business passengers. This suggests that the number and type of business passenger on board may provide one of the important continuing differences between no-frills and full-service carriers
5.12 Unravelling the reasons behind these differences is complex. Part of the diffi culty is that business travel is rarely paid for by the passenger. However, it seems reasonable to assume that passengers with higher incomes are likely to be given preferential status in their company’s travel policy, or to work for companies more willing to pay higher fares for travel on full-service carriers. Business passengers may also have less choice about which airlines they use, and many companies will also have corporate deals with full-service carriers, partly linked to the range of long-haul destinations they may also offer.
5.13 Some of the differences between business passengers’ use of full-service and no-frills carriers may be explained by airport preferences, with many business passengers perhaps preferring the primary airports that no-frills carriers fl y to less uniformly. Frequency may also be important. In general (but not in all cases) full-service carriers offer more frequent fl ights on the main business routes.

Chapter 5 Page 8
CAP 770No-frills Carriers: Revolution or Evolution?A Study by the Civil Aviation Authority
5.14 Another factor may be the availability of frequent fl yer programmes on full-service carriers. Business passengers may prefer airlines with frequent fl yer programmes, and as higher income business passengers tend to fl y more frequently than others, so they are more likely to choose full-service carriers.
5.15 Finally, it may also be that, for business passengers, the ability of no-frills carriers to compete on routes is less relevant than it is for leisure passengers. For many leisure destinations a no-frills carrier may provide the only service, and by operating to a range of airports, no-frills carriers can reduce travel times to fi nal destinations that are away from the major European cities. However, business passengers are more likely to want to travel to the centre of larger cities, for which there is also more likely to be a choice of airline, and where secondary airports, if further from the city they want to travel to, may be a less attractive alternative.
5.16 The differences between business and leisure passengers emerge even more when considering the relationship between income and choice of airline. For UK leisure passengers fl ying from London, the data suggest that there is little correlation between income levels and the choice of airline type. However, for UK business passengers there appears to be a strong correlation between income and airline choice. Figure 5.7 shows that for business passengers, as income rises, increasing use is made of full-service carriers (particularly British Airways).
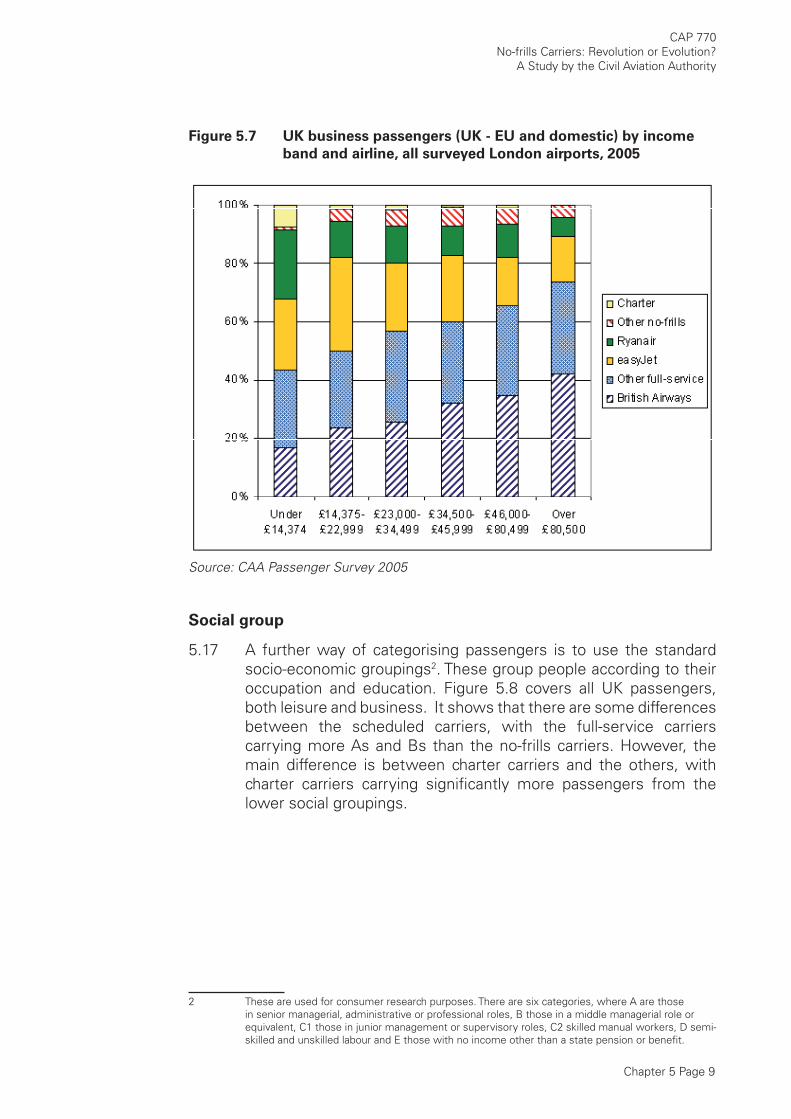
Chapter 5 Page 9
CAP 770No-frills Carriers: Revolution or Evolution?
A Study by the Civil Aviation Authority
Figure 5.7 UK business passengers (UK - EU and domestic) by income
band and airline, all surveyed London airports, 2005
Source: CAA Passenger Survey 2005
Social group
5.17 A further way of categorising passengers is to use the standard socio-economic groupings2. These group people according to their occupation and education. Figure 5.8 covers all UK passengers, both leisure and business. It shows that there are some differences between the scheduled carriers, with the full-service carriers carrying more As and Bs than the no-frills carriers. However, the main difference is between charter carriers and the others, with charter carriers carrying signifi cantly more passengers from the lower social groupings.
2 These are used for consumer research purposes. There are six categories, where A are those in senior managerial, administrative or professional roles, B those in a middle managerial role or equivalent, C1 those in junior management or supervisory roles, C2 skilled manual workers, D semi-skilled and unskilled labour and E those with no income other than a state pension or benefi t.
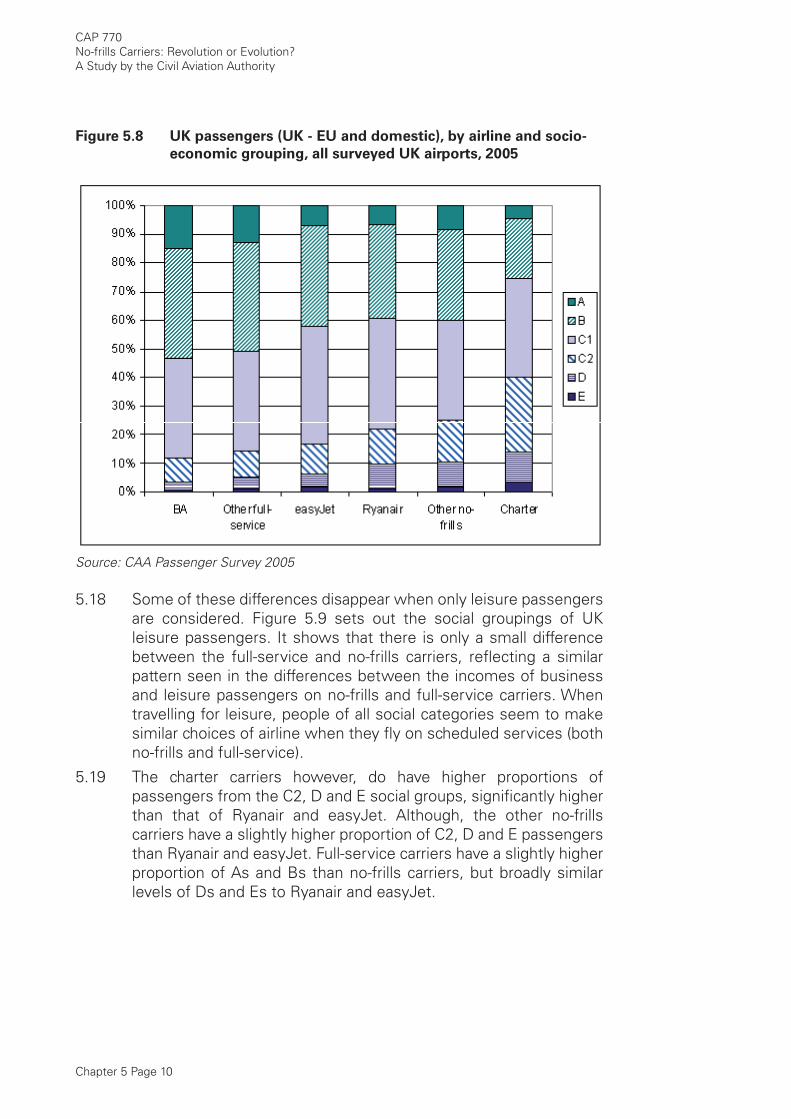
Chapter 5 Page 10
CAP 770No-frills Carriers: Revolution or Evolution?A Study by the Civil Aviation Authority
Figure 5.8 UK passengers (UK - EU and domestic), by airline and socio-
economic grouping, all surveyed UK airports, 2005
Source: CAA Passenger Survey 2005
5.18 Some of these differences disappear when only leisure passengers are considered. Figure 5.9 sets out the social groupings of UK leisure passengers. It shows that there is only a small difference between the full-service and no-frills carriers, refl ecting a similar pattern seen in the differences between the incomes of business and leisure passengers on no-frills and full-service carriers. When travelling for leisure, people of all social categories seem to make similar choices of airline when they fl y on scheduled services (both no-frills and full-service).
5.19 The charter carriers however, do have higher proportions of passengers from the C2, D and E social groups, signifi cantly higher than that of Ryanair and easyJet. Although, the other no-frills carriers have a slightly higher proportion of C2, D and E passengers than Ryanair and easyJet. Full-service carriers have a slightly higher proportion of As and Bs than no-frills carriers, but broadly similar levels of Ds and Es to Ryanair and easyJet.
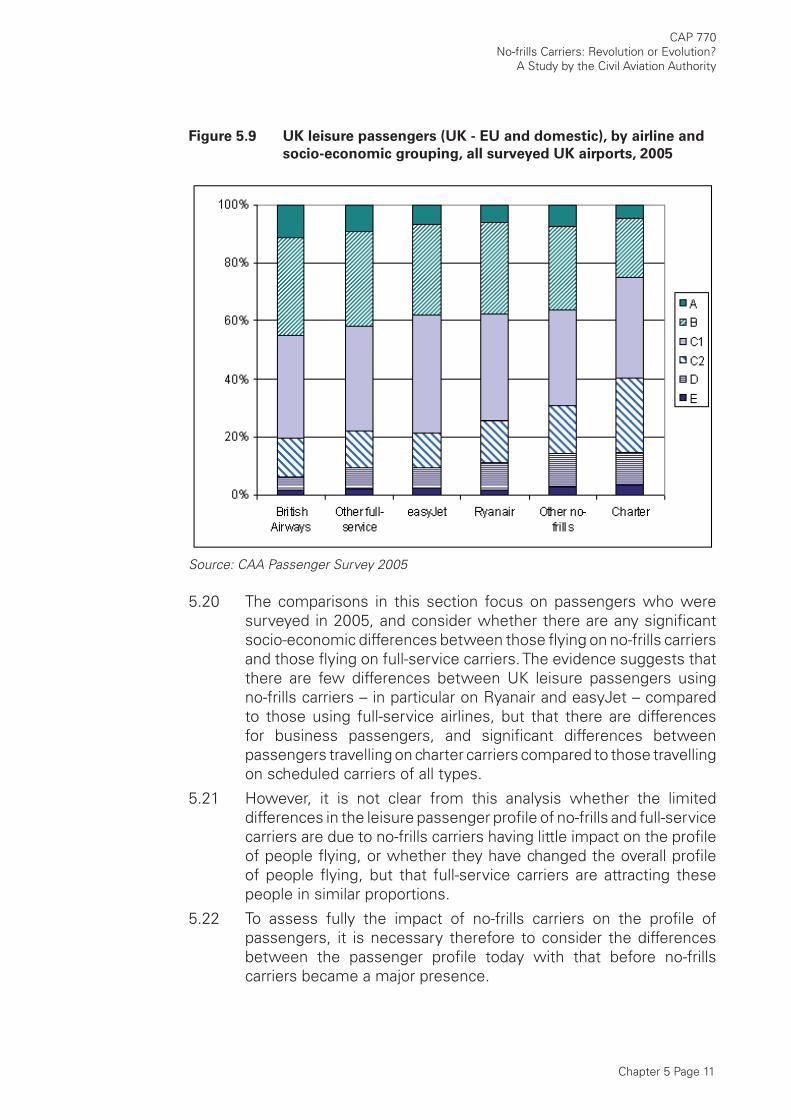
Chapter 5 Page 11
CAP 770No-frills Carriers: Revolution or Evolution?
A Study by the Civil Aviation Authority
Figure 5.9 UK leisure passengers (UK - EU and domestic), by airline and
socio-economic grouping, all surveyed UK airports, 2005
Source: CAA Passenger Survey 2005
5.20 The comparisons in this section focus on passengers who were surveyed in 2005, and consider whether there are any signifi cant socio-economic differences between those fl ying on no-frills carriers and those fl ying on full-service carriers. The evidence suggests that there are few differences between UK leisure passengers using no-frills carriers – in particular on Ryanair and easyJet – compared to those using full-service airlines, but that there are differences for business passengers, and signifi cant differences between passengers travelling on charter carriers compared to those travelling on scheduled carriers of all types.
5.21 However, it is not clear from this analysis whether the limited differences in the leisure passenger profi le of no-frills and full-service carriers are due to no-frills carriers having little impact on the profi le of people fl ying, or whether they have changed the overall profi le of people fl ying, but that full-service carriers are attracting these people in similar proportions.
5.22 To assess fully the impact of no-frills carriers on the profi le of passengers, it is necessary therefore to consider the differences between the passenger profi le today with that before no-frills carriers became a major presence.
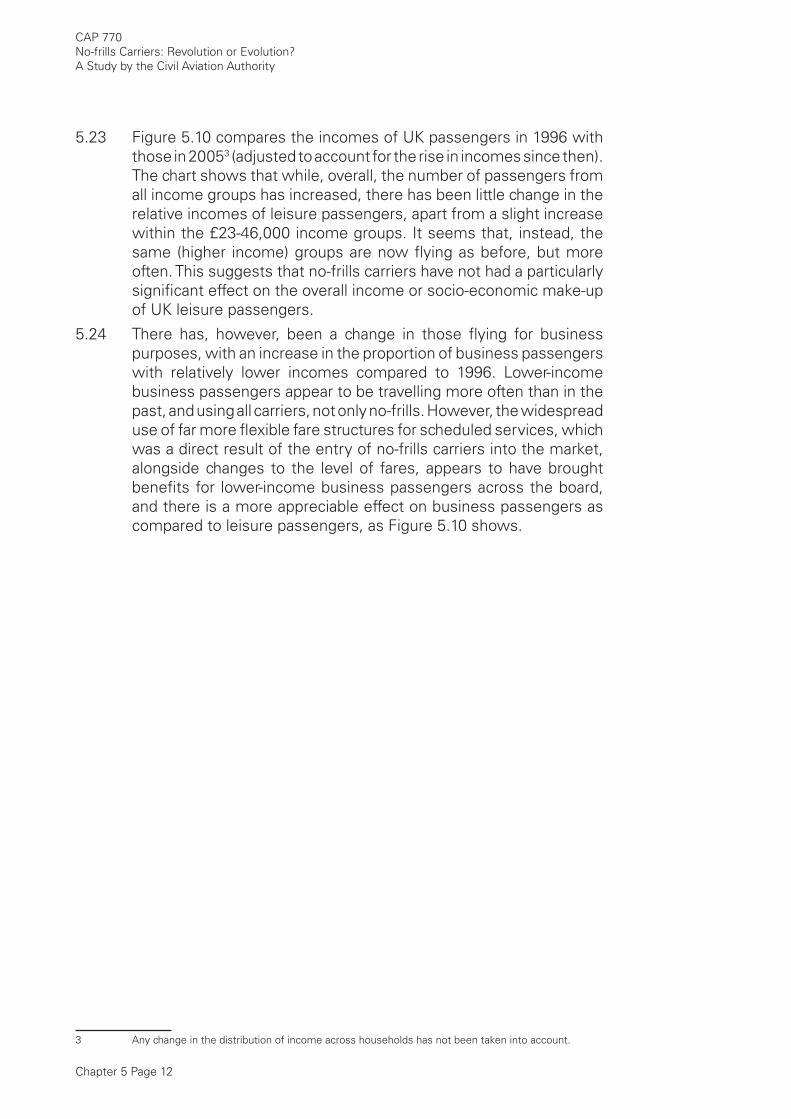
Chapter 5 Page 12
CAP 770No-frills Carriers: Revolution or Evolution?A Study by the Civil Aviation Authority
5.23 Figure 5.10 compares the incomes of UK passengers in 1996 with those in 20053 (adjusted to account for the rise in incomes since then). The chart shows that while, overall, the number of passengers from all income groups has increased, there has been little change in the relative incomes of leisure passengers, apart from a slight increase within the £23-46,000 income groups. It seems that, instead, the same (higher income) groups are now fl ying as before, but more often. This suggests that no-frills carriers have not had a particularly signifi cant effect on the overall income or socio-economic make-up of UK leisure passengers.
5.24 There has, however, been a change in those fl ying for business purposes, with an increase in the proportion of business passengers with relatively lower incomes compared to 1996. Lower-income business passengers appear to be travelling more often than in the past, and using all carriers, not only no-frills. However, the widespread use of far more fl exible fare structures for scheduled services, which was a direct result of the entry of no-frills carriers into the market, alongside changes to the level of fares, appears to have brought benefi ts for lower-income business passengers across the board, and there is a more appreciable effect on business passengers as compared to leisure passengers, as Figure 5.10 shows.
3 Any change in the distribution of income across households has not been taken into account.
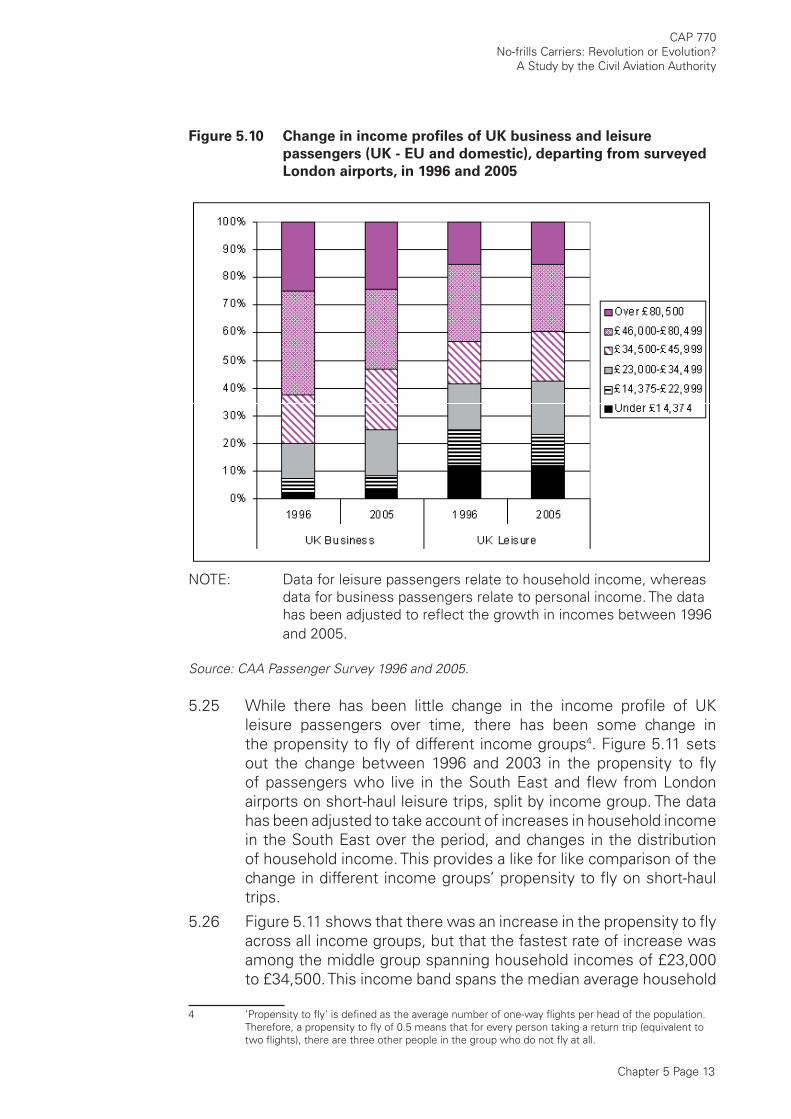
Chapter 5 Page 13
CAP 770No-frills Carriers: Revolution or Evolution?
A Study by the Civil Aviation Authority
Figure 5.10 Change in income profi les of UK business and leisure
passengers (UK - EU and domestic), departing from surveyed
London airports, in 1996 and 2005
NOTE: Data for leisure passengers relate to household income, whereas data for business passengers relate to personal income. The data has been adjusted to refl ect the growth in incomes between 1996 and 2005.
Source: CAA Passenger Survey 1996 and 2005.
5.25 While there has been little change in the income profi le of UK leisure passengers over time, there has been some change in the propensity to fl y of different income groups4. Figure 5.11 sets out the change between 1996 and 2003 in the propensity to fl y of passengers who live in the South East and fl ew from London airports on short-haul leisure trips, split by income group. The data has been adjusted to take account of increases in household income in the South East over the period, and changes in the distribution of household income. This provides a like for like comparison of the change in different income groups’ propensity to fl y on short-haul trips.
5.26 Figure 5.11 shows that there was an increase in the propensity to fl y across all income groups, but that the fastest rate of increase was among the middle group spanning household incomes of £23,000 to £34,500. This income band spans the median average household
4 ‘Propensity to fl y’ is defi ned as the average number of one-way fl ights per head of the population. Therefore, a propensity to fl y of 0.5 means that for every person taking a return trip (equivalent to two fl ights), there are three other people in the group who do not fl y at all.
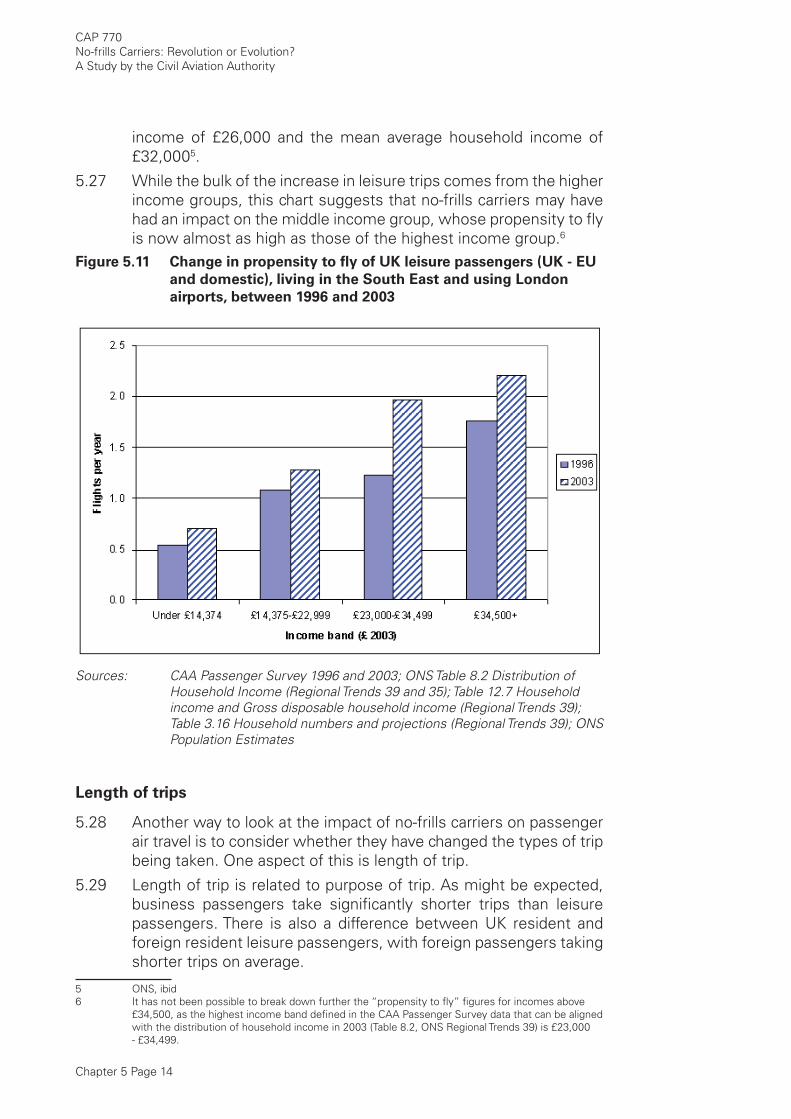
Chapter 5 Page 14
CAP 770No-frills Carriers: Revolution or Evolution?A Study by the Civil Aviation Authority
income of £26,000 and the mean average household income of £32,0005.
5.27 While the bulk of the increase in leisure trips comes from the higher income groups, this chart suggests that no-frills carriers may have had an impact on the middle income group, whose propensity to fl y is now almost as high as those of the highest income group.6
Figure 5.11 Change in propensity to fl y of UK leisure passengers (UK - EU
and domestic), living in the South East and using London
airports, between 1996 and 2003
Sources: CAA Passenger Survey 1996 and 2003; ONS Table 8.2 Distribution of
Household Income (Regional Trends 39 and 35); Table 12.7 Household income and Gross disposable household income (Regional Trends 39); Table 3.16 Household numbers and projections (Regional Trends 39); ONS Population Estimates
Length of trips
5.28 Another way to look at the impact of no-frills carriers on passenger air travel is to consider whether they have changed the types of trip being taken. One aspect of this is length of trip.
5.29 Length of trip is related to purpose of trip. As might be expected, business passengers take signifi cantly shorter trips than leisure passengers. There is also a difference between UK resident and foreign resident leisure passengers, with foreign passengers taking shorter trips on average.
5 ONS, ibid6 It has not been possible to break down further the “propensity to fl y” fi gures for incomes above
£34,500, as the highest income band defi ned in the CAA Passenger Survey data that can be aligned with the distribution of household income in 2003 (Table 8.2, ONS Regional Trends 39) is £23,000 - £34,499.
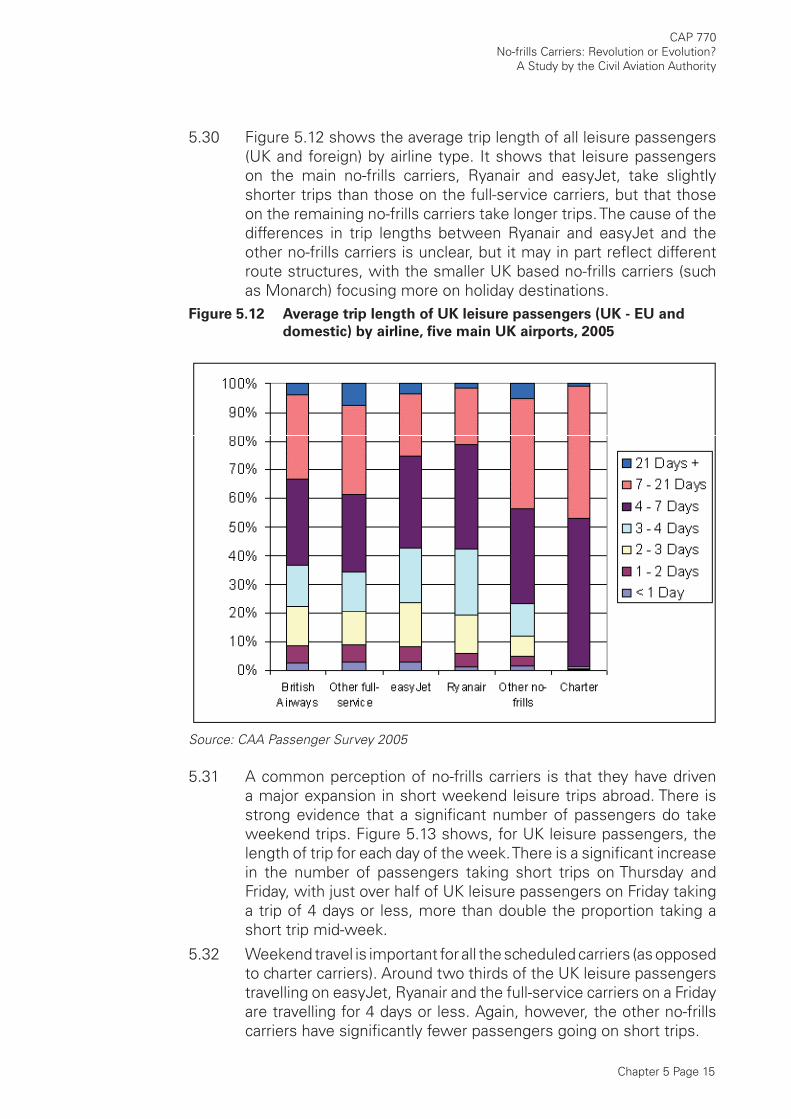
Chapter 5 Page 15
CAP 770No-frills Carriers: Revolution or Evolution?
A Study by the Civil Aviation Authority
5.30 Figure 5.12 shows the average trip length of all leisure passengers (UK and foreign) by airline type. It shows that leisure passengers on the main no-frills carriers, Ryanair and easyJet, take slightly shorter trips than those on the full-service carriers, but that those on the remaining no-frills carriers take longer trips. The cause of the differences in trip lengths between Ryanair and easyJet and the other no-frills carriers is unclear, but it may in part refl ect different route structures, with the smaller UK based no-frills carriers (such as Monarch) focusing more on holiday destinations.
Figure 5.12 Average trip length of UK leisure passengers (UK - EU and
domestic) by airline, fi ve main UK airports, 2005
Source: CAA Passenger Survey 2005
5.31 A common perception of no-frills carriers is that they have driven a major expansion in short weekend leisure trips abroad. There is strong evidence that a signifi cant number of passengers do take weekend trips. Figure 5.13 shows, for UK leisure passengers, the length of trip for each day of the week. There is a signifi cant increase in the number of passengers taking short trips on Thursday and Friday, with just over half of UK leisure passengers on Friday taking a trip of 4 days or less, more than double the proportion taking a short trip mid-week.
5.32 Weekend travel is important for all the scheduled carriers (as opposed to charter carriers). Around two thirds of the UK leisure passengers travelling on easyJet, Ryanair and the full-service carriers on a Friday are travelling for 4 days or less. Again, however, the other no-frills carriers have signifi cantly fewer passengers going on short trips.
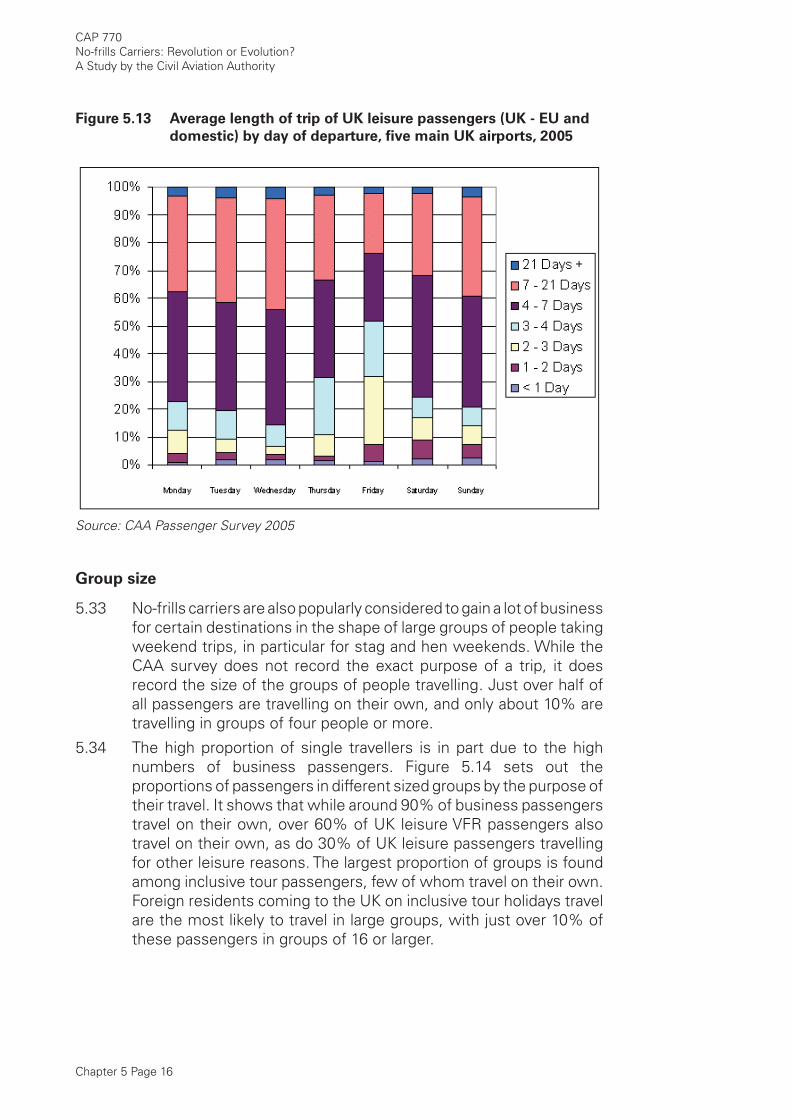
Chapter 5 Page 16
CAP 770No-frills Carriers: Revolution or Evolution?A Study by the Civil Aviation Authority
Figure 5.13 Average length of trip of UK leisure passengers (UK - EU and
domestic) by day of departure, fi ve main UK airports, 2005
Source: CAA Passenger Survey 2005
Group size
5.33 No-frills carriers are also popularly considered to gain a lot of business for certain destinations in the shape of large groups of people taking weekend trips, in particular for stag and hen weekends. While the CAA survey does not record the exact purpose of a trip, it does record the size of the groups of people travelling. Just over half of all passengers are travelling on their own, and only about 10% are travelling in groups of four people or more.
5.34 The high proportion of single travellers is in part due to the high numbers of business passengers. Figure 5.14 sets out the proportions of passengers in different sized groups by the purpose of their travel. It shows that while around 90% of business passengers travel on their own, over 60% of UK leisure VFR passengers also travel on their own, as do 30% of UK leisure passengers travelling for other leisure reasons. The largest proportion of groups is found among inclusive tour passengers, few of whom travel on their own. Foreign residents coming to the UK on inclusive tour holidays travel are the most likely to travel in large groups, with just over 10% of these passengers in groups of 16 or larger.
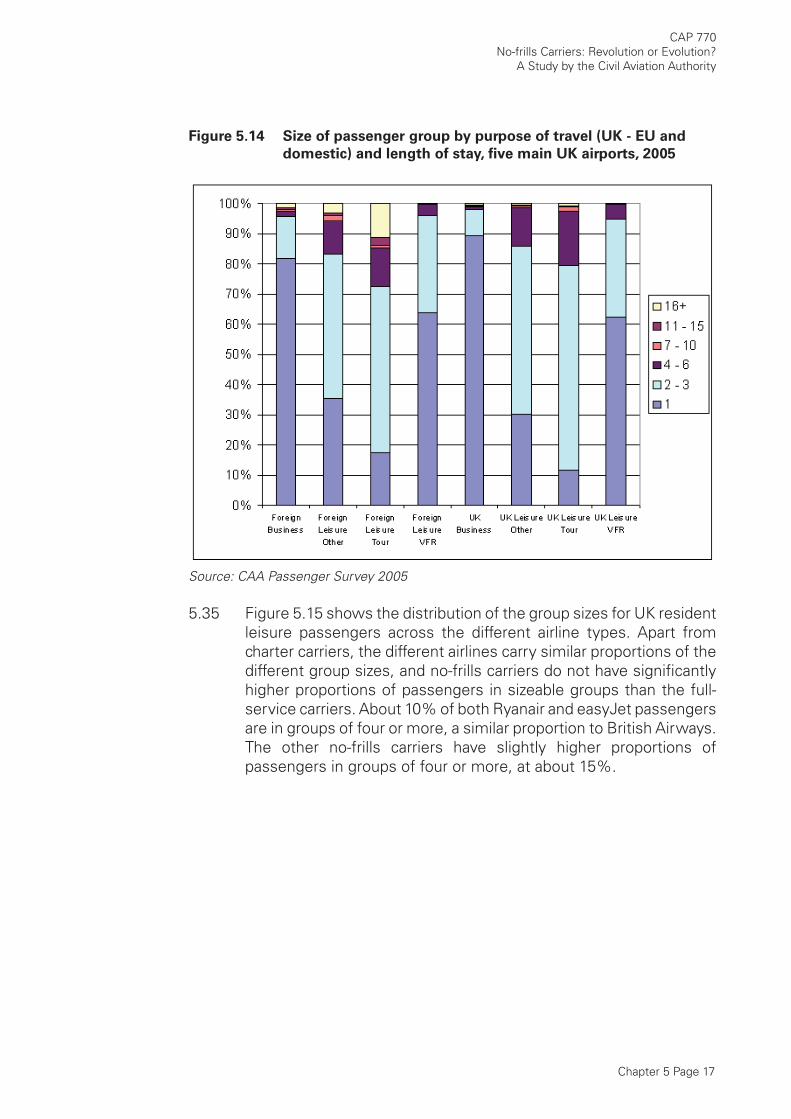
Chapter 5 Page 17
CAP 770No-frills Carriers: Revolution or Evolution?
A Study by the Civil Aviation Authority
Figure 5.14 Size of passenger group by purpose of travel (UK - EU and
domestic) and length of stay, fi ve main UK airports, 2005
Source: CAA Passenger Survey 2005
5.35 Figure 5.15 shows the distribution of the group sizes for UK resident leisure passengers across the different airline types. Apart from charter carriers, the different airlines carry similar proportions of the different group sizes, and no-frills carriers do not have signifi cantly higher proportions of passengers in sizeable groups than the full-service carriers. About 10% of both Ryanair and easyJet passengers are in groups of four or more, a similar proportion to British Airways. The other no-frills carriers have slightly higher proportions of passengers in groups of four or more, at about 15%.
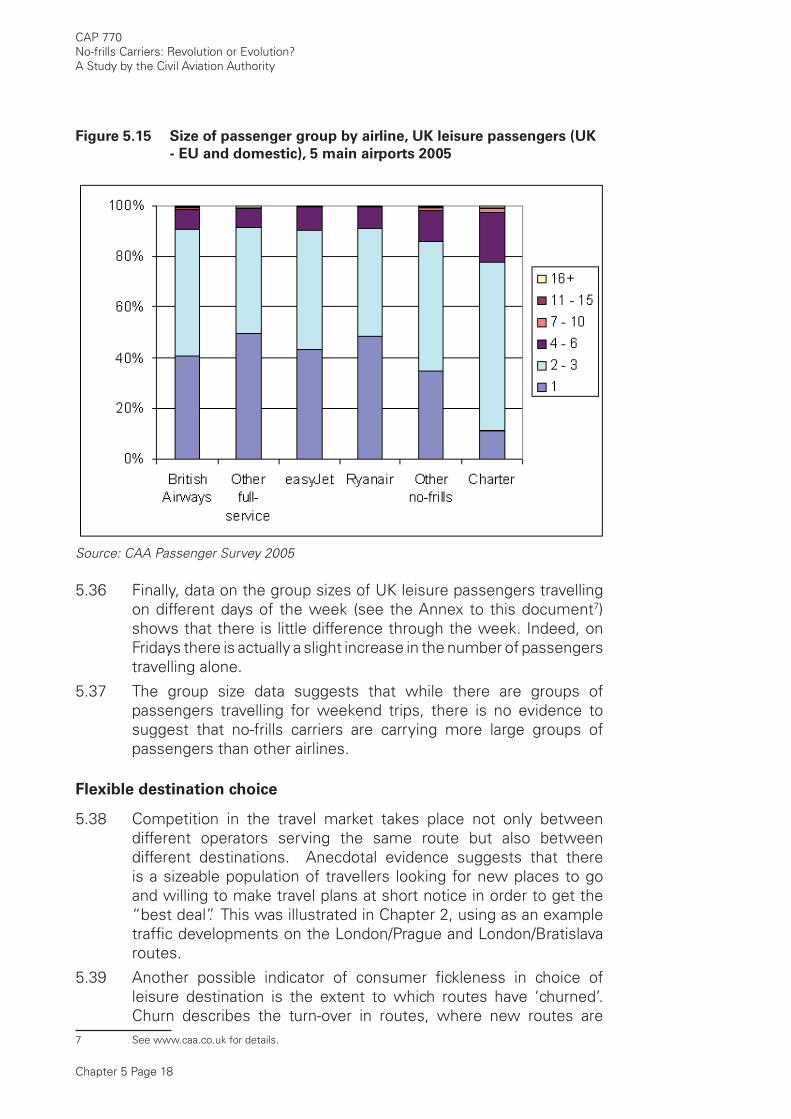
Chapter 5 Page 18
CAP 770No-frills Carriers: Revolution or Evolution?A Study by the Civil Aviation Authority
Figure 5.15 Size of passenger group by airline, UK leisure passengers (UK
- EU and domestic), 5 main airports 2005
Source: CAA Passenger Survey 2005
5.36 Finally, data on the group sizes of UK leisure passengers travelling on different days of the week (see the Annex to this document7) shows that there is little difference through the week. Indeed, on Fridays there is actually a slight increase in the number of passengers travelling alone.
5.37 The group size data suggests that while there are groups of passengers travelling for weekend trips, there is no evidence to suggest that no-frills carriers are carrying more large groups of passengers than other airlines.
Flexible destination choice
5.38 Competition in the travel market takes place not only between different operators serving the same route but also between different destinations. Anecdotal evidence suggests that there is a sizeable population of travellers looking for new places to go and willing to make travel plans at short notice in order to get the “best deal”. This was illustrated in Chapter 2, using as an example traffi c developments on the London/Prague and London/Bratislava routes.
5.39 Another possible indicator of consumer fi ckleness in choice of leisure destination is the extent to which routes have ‘churned’. Churn describes the turn-over in routes, where new routes are
7 See www.caa.co.uk for details.
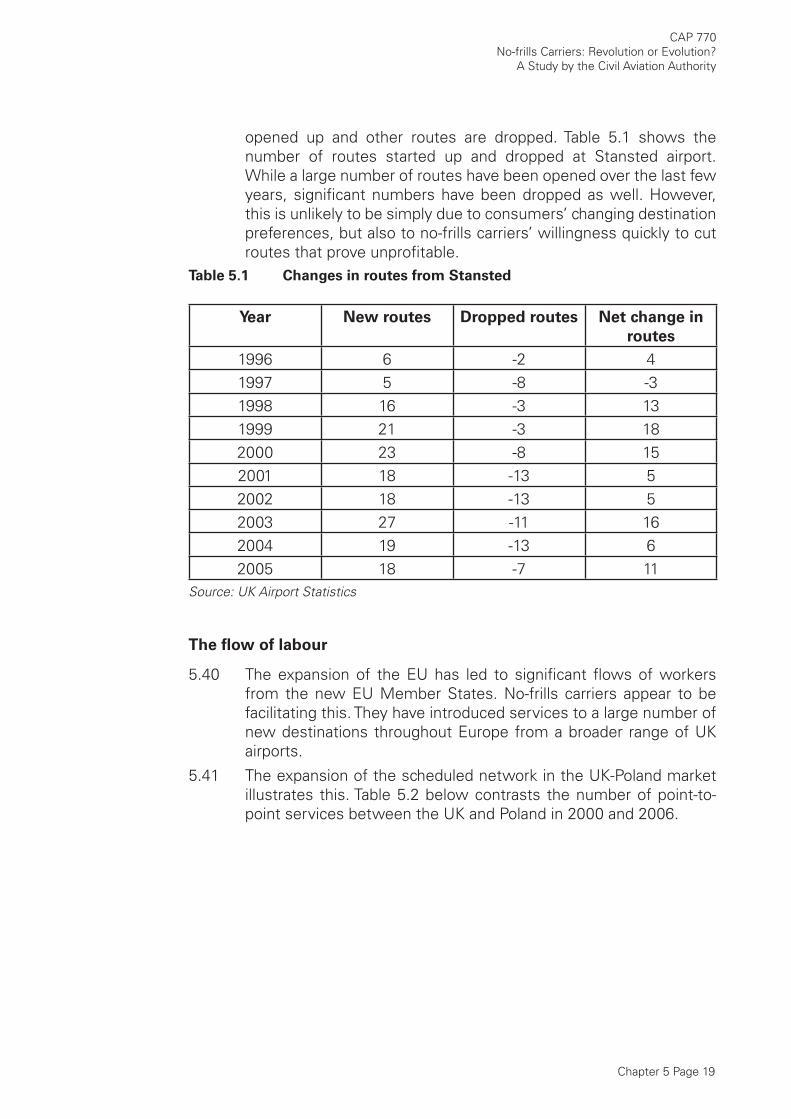
Chapter 5 Page 19
CAP 770No-frills Carriers: Revolution or Evolution?
A Study by the Civil Aviation Authority
opened up and other routes are dropped. Table 5.1 shows the number of routes started up and dropped at Stansted airport. While a large number of routes have been opened over the last few years, signifi cant numbers have been dropped as well. However, this is unlikely to be simply due to consumers’ changing destination preferences, but also to no-frills carriers’ willingness quickly to cut routes that prove unprofi table.
Table 5.1 Changes in routes from Stansted
Year New routes Dropped routes Net change in
routes
1996 6 -2 41997 5 -8 -31998 16 -3 131999 21 -3 182000 23 -8 152001 18 -13 52002 18 -13 52003 27 -11 162004 19 -13 62005 18 -7 11
Source: UK Airport Statistics
The fl ow of labour
5.40 The expansion of the EU has led to signifi cant fl ows of workers from the new EU Member States. No-frills carriers appear to be facilitating this. They have introduced services to a large number of new destinations throughout Europe from a broader range of UK airports.
5.41 The expansion of the scheduled network in the UK-Poland market illustrates this. Table 5.2 below contrasts the number of point-to-point services between the UK and Poland in 2000 and 2006.
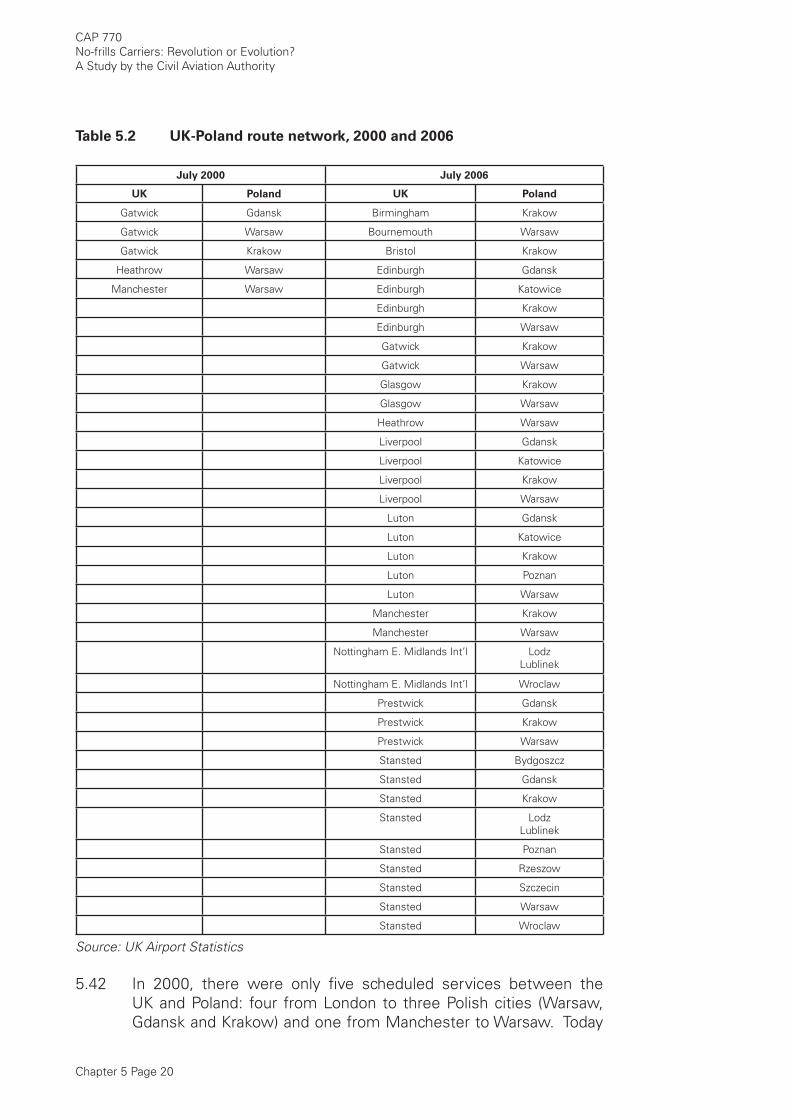
Chapter 5 Page 20
CAP 770No-frills Carriers: Revolution or Evolution?A Study by the Civil Aviation Authority
Table 5.2 UK-Poland route network, 2000 and 2006
July 2000 July 2006
UK Poland UK Poland
Gatwick Gdansk Birmingham Krakow
Gatwick Warsaw Bournemouth Warsaw
Gatwick Krakow Bristol Krakow
Heathrow Warsaw Edinburgh Gdansk
Manchester Warsaw Edinburgh Katowice
Edinburgh Krakow
Edinburgh Warsaw
Gatwick Krakow
Gatwick Warsaw
Glasgow Krakow
Glasgow Warsaw
Heathrow Warsaw
Liverpool Gdansk
Liverpool Katowice
Liverpool Krakow
Liverpool Warsaw
Luton Gdansk
Luton Katowice
Luton Krakow
Luton Poznan
Luton Warsaw
Manchester Krakow
Manchester Warsaw
Nottingham E. Midlands Int’l LodzLublinek
Nottingham E. Midlands Int’l Wroclaw
Prestwick Gdansk
Prestwick Krakow
Prestwick Warsaw
Stansted Bydgoszcz
Stansted Gdansk
Stansted Krakow
Stansted Lodz Lublinek
Stansted Poznan
Stansted Rzeszow
Stansted Szczecin
Stansted Warsaw
Stansted Wroclaw
Source: UK Airport Statistics
5.42 In 2000, there were only fi ve scheduled services between the UK and Poland: four from London to three Polish cities (Warsaw, Gdansk and Krakow) and one from Manchester to Warsaw. Today
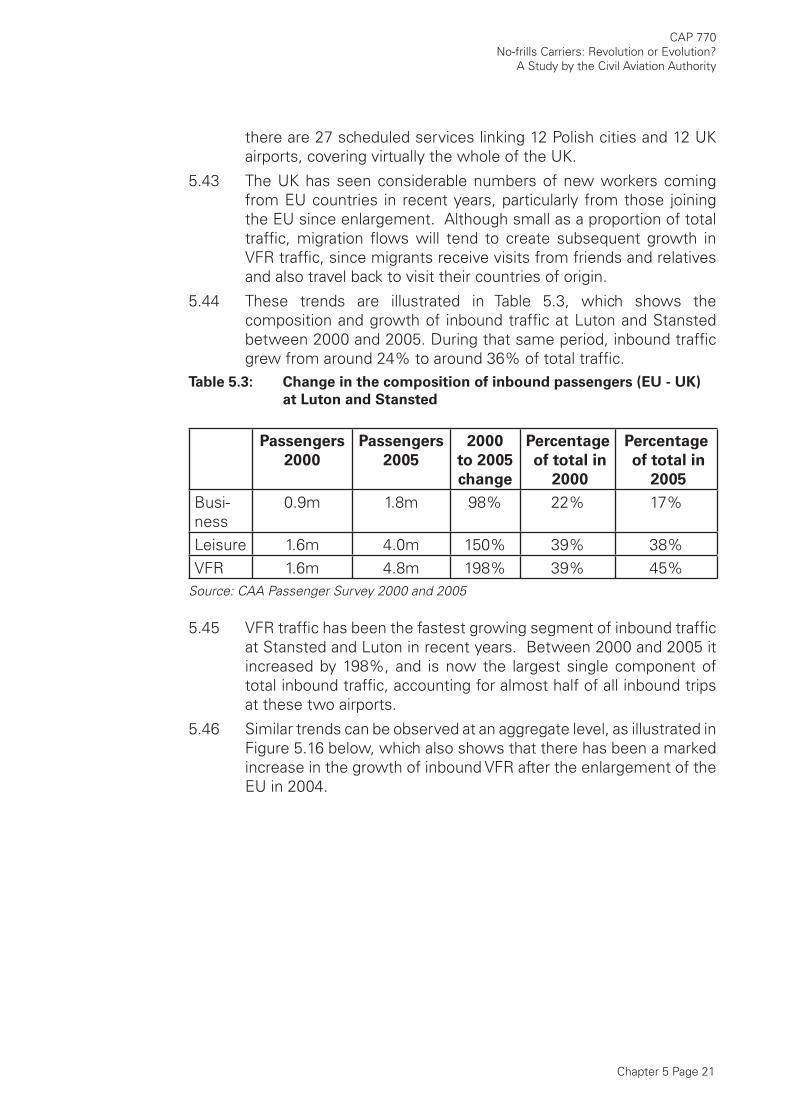
Chapter 5 Page 21
CAP 770No-frills Carriers: Revolution or Evolution?
A Study by the Civil Aviation Authority
there are 27 scheduled services linking 12 Polish cities and 12 UK airports, covering virtually the whole of the UK.
5.43 The UK has seen considerable numbers of new workers coming from EU countries in recent years, particularly from those joining the EU since enlargement. Although small as a proportion of total traffi c, migration fl ows will tend to create subsequent growth in VFR traffi c, since migrants receive visits from friends and relatives and also travel back to visit their countries of origin.
5.44 These trends are illustrated in Table 5.3, which shows the composition and growth of inbound traffi c at Luton and Stansted between 2000 and 2005. During that same period, inbound traffi c grew from around 24% to around 36% of total traffi c.
Table 5.3: Change in the composition of inbound passengers (EU - UK)
at Luton and Stansted
Passengers
2000
Passengers
2005
2000
to 2005
change
Percentage
of total in
2000
Percentage
of total in
2005
Busi-ness
0.9m 1.8m 98% 22% 17%
Leisure 1.6m 4.0m 150% 39% 38%VFR 1.6m 4.8m 198% 39% 45%
Source: CAA Passenger Survey 2000 and 2005
5.45 VFR traffi c has been the fastest growing segment of inbound traffi c at Stansted and Luton in recent years. Between 2000 and 2005 it increased by 198%, and is now the largest single component of total inbound traffi c, accounting for almost half of all inbound trips at these two airports.
5.46 Similar trends can be observed at an aggregate level, as illustrated in Figure 5.16 below, which also shows that there has been a marked increase in the growth of inbound VFR after the enlargement of the EU in 2004.
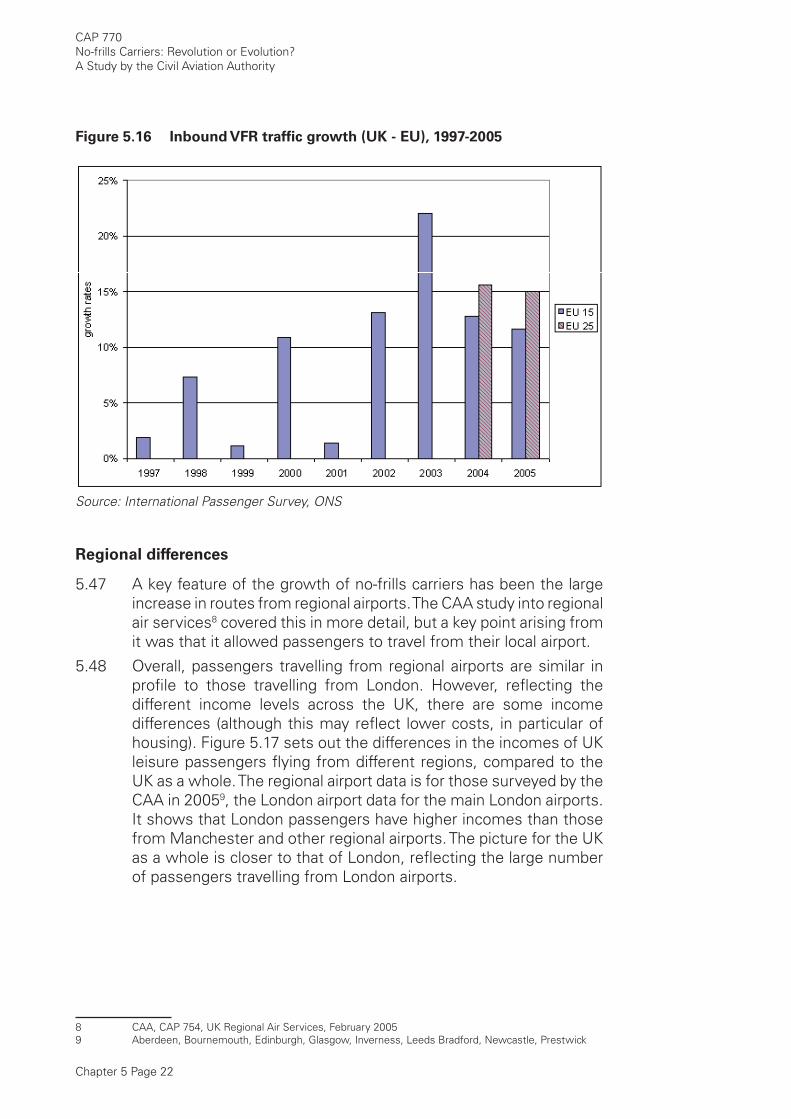
Chapter 5 Page 22
CAP 770No-frills Carriers: Revolution or Evolution?A Study by the Civil Aviation Authority
Figure 5.16 Inbound VFR traffi c growth (UK - EU), 1997-2005
Source: International Passenger Survey, ONS
Regional differences
5.47 A key feature of the growth of no-frills carriers has been the large increase in routes from regional airports. The CAA study into regional air services8 covered this in more detail, but a key point arising from it was that it allowed passengers to travel from their local airport.
5.48 Overall, passengers travelling from regional airports are similar in profi le to those travelling from London. However, refl ecting the different income levels across the UK, there are some income differences (although this may refl ect lower costs, in particular of housing). Figure 5.17 sets out the differences in the incomes of UK leisure passengers fl ying from different regions, compared to the UK as a whole. The regional airport data is for those surveyed by the CAA in 20059, the London airport data for the main London airports. It shows that London passengers have higher incomes than those from Manchester and other regional airports. The picture for the UK as a whole is closer to that of London, refl ecting the large number of passengers travelling from London airports.
8 CAA, CAP 754, UK Regional Air Services, February 20059 Aberdeen, Bournemouth, Edinburgh, Glasgow, Inverness, Leeds Bradford, Newcastle, Prestwick
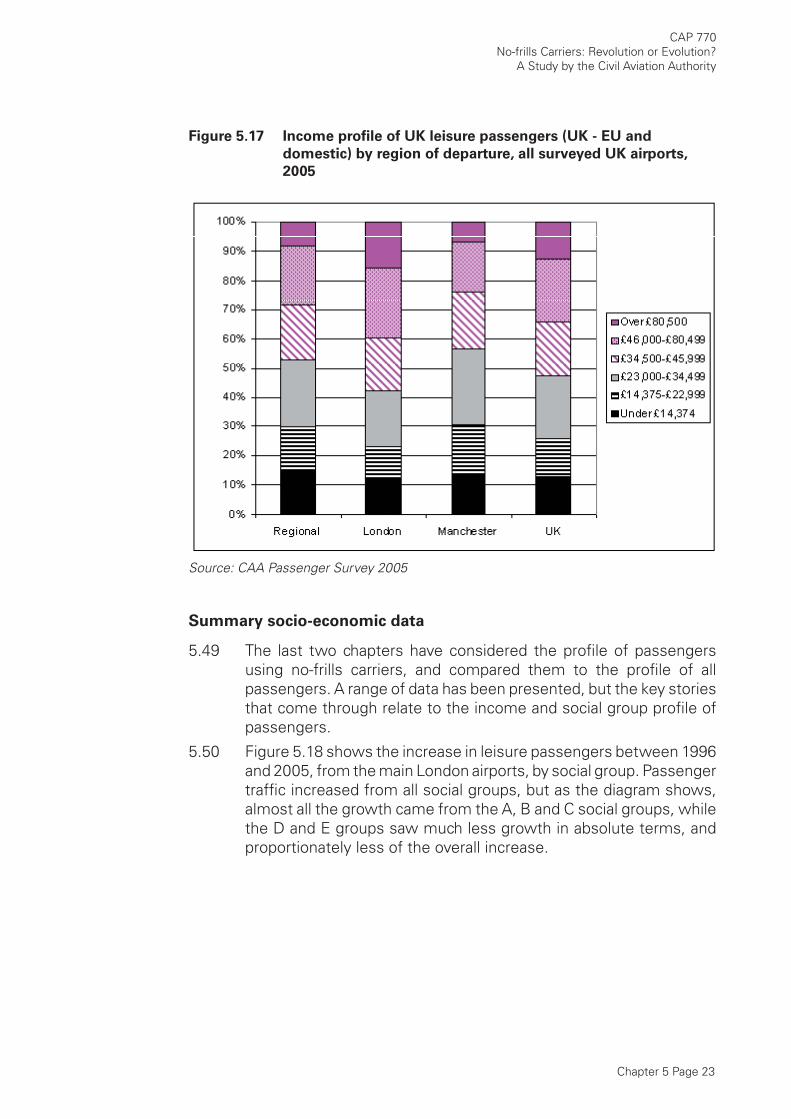
Chapter 5 Page 23
CAP 770No-frills Carriers: Revolution or Evolution?
A Study by the Civil Aviation Authority
Figure 5.17 Income profi le of UK leisure passengers (UK - EU and
domestic) by region of departure, all surveyed UK airports,
2005
Source: CAA Passenger Survey 2005
Summary socio-economic data
5.49 The last two chapters have considered the profi le of passengers using no-frills carriers, and compared them to the profi le of all passengers. A range of data has been presented, but the key stories that come through relate to the income and social group profi le of passengers.
5.50 Figure 5.18 shows the increase in leisure passengers between 1996 and 2005, from the main London airports, by social group. Passenger traffi c increased from all social groups, but as the diagram shows, almost all the growth came from the A, B and C social groups, while the D and E groups saw much less growth in absolute terms, and proportionately less of the overall increase.
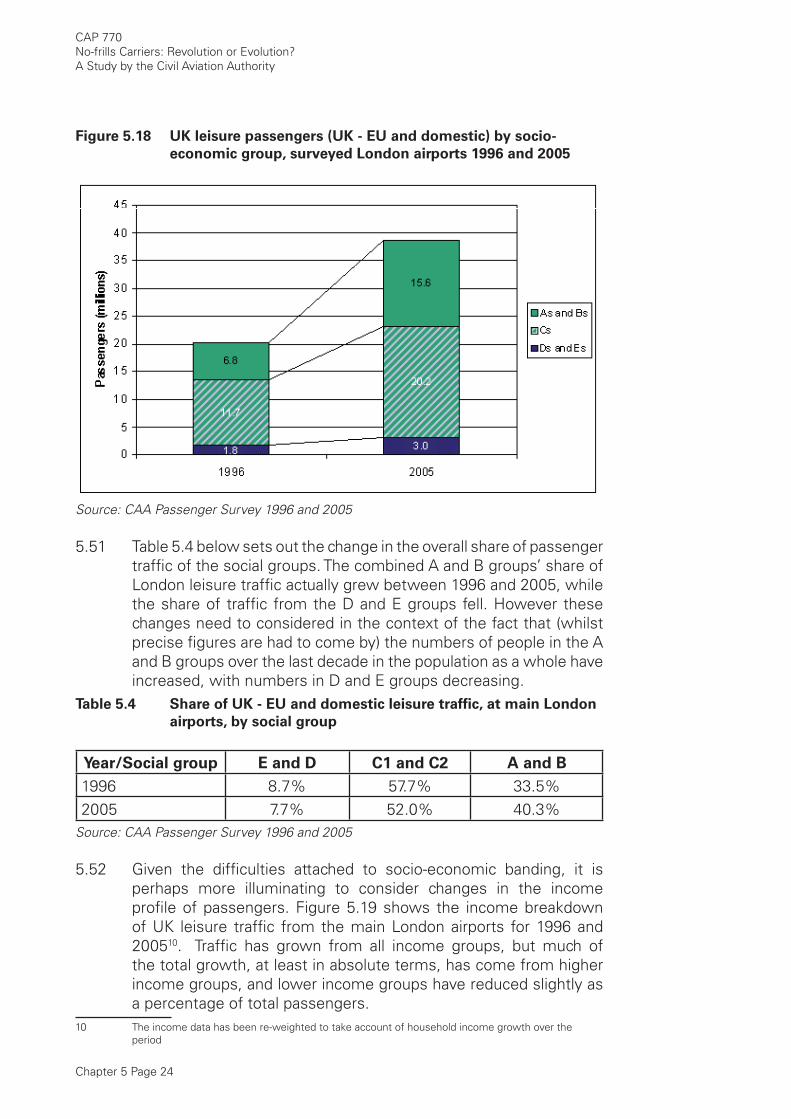
Chapter 5 Page 24
CAP 770No-frills Carriers: Revolution or Evolution?A Study by the Civil Aviation Authority
Figure 5.18 UK leisure passengers (UK - EU and domestic) by socio-
economic group, surveyed London airports 1996 and 2005
Source: CAA Passenger Survey 1996 and 2005
5.51 Table 5.4 below sets out the change in the overall share of passenger traffi c of the social groups. The combined A and B groups’ share of London leisure traffi c actually grew between 1996 and 2005, while the share of traffi c from the D and E groups fell. However these changes need to considered in the context of the fact that (whilst precise fi gures are had to come by) the numbers of people in the A and B groups over the last decade in the population as a whole have increased, with numbers in D and E groups decreasing.
Table 5.4 Share of UK - EU and domestic leisure traffi c, at main London
airports, by social group
Year/Social group E and D C1 and C2 A and B
1996 8.7% 57.7% 33.5%2005 7.7% 52.0% 40.3%
Source: CAA Passenger Survey 1996 and 2005
5.52 Given the diffi culties attached to socio-economic banding, it is perhaps more illuminating to consider changes in the income profi le of passengers. Figure 5.19 shows the income breakdown of UK leisure traffi c from the main London airports for 1996 and 200510. Traffi c has grown from all income groups, but much of the total growth, at least in absolute terms, has come from higher income groups, and lower income groups have reduced slightly as a percentage of total passengers.
10 The income data has been re-weighted to take account of household income growth over the period
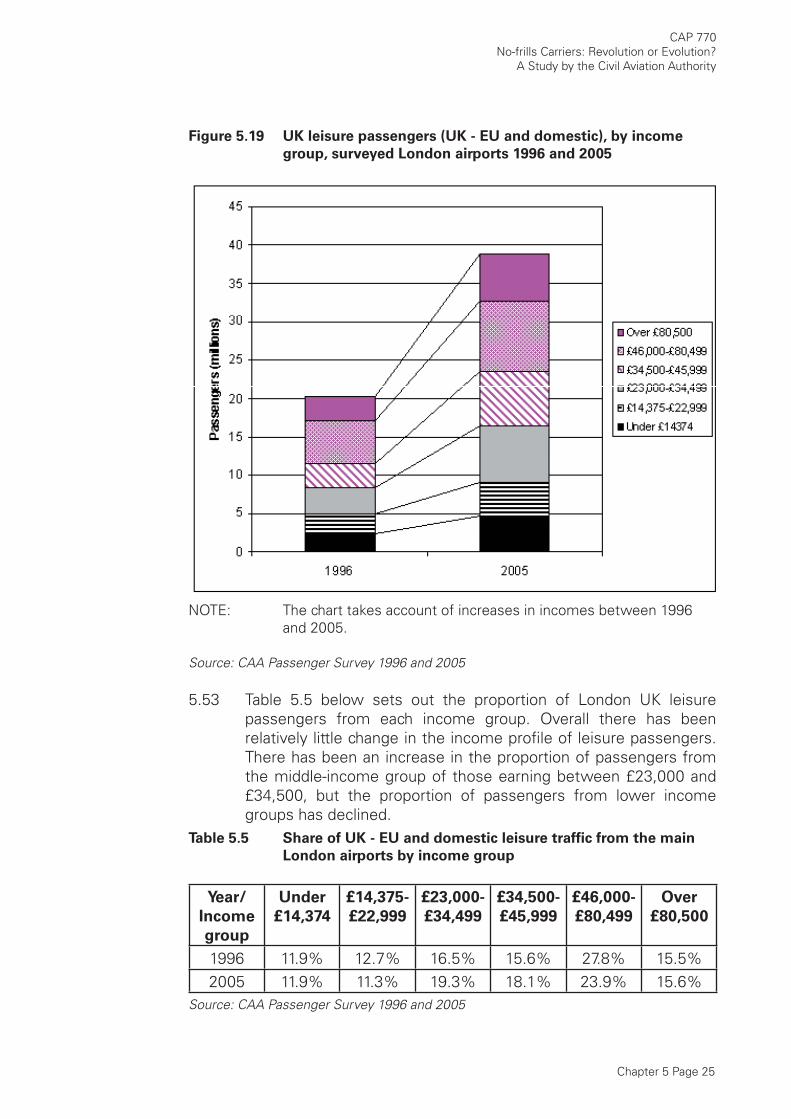
Chapter 5 Page 25
CAP 770No-frills Carriers: Revolution or Evolution?
A Study by the Civil Aviation Authority
Figure 5.19 UK leisure passengers (UK - EU and domestic), by income
group, surveyed London airports 1996 and 2005
NOTE: The chart takes account of increases in incomes between 1996 and 2005.
Source: CAA Passenger Survey 1996 and 2005
5.53 Table 5.5 below sets out the proportion of London UK leisure passengers from each income group. Overall there has been relatively little change in the income profi le of leisure passengers. There has been an increase in the proportion of passengers from the middle-income group of those earning between £23,000 and £34,500, but the proportion of passengers from lower income groups has declined.
Table 5.5 Share of UK - EU and domestic leisure traffi c from the main
London airports by income group
Year/
Income
group
Under
£14,374
£14,375-
£22,999
£23,000-
£34,499
£34,500-
£45,999
£46,000-
£80,499
Over
£80,500
1996 11.9% 12.7% 16.5% 15.6% 27.8% 15.5%2005 11.9% 11.3% 19.3% 18.1% 23.9% 15.6%
Source: CAA Passenger Survey 1996 and 2005
Chapter 5 Page 26
CAP 770No-frills Carriers: Revolution or Evolution?A Study by the Civil Aviation Authority
Impact on society: conclusions
5.54 The earlier chapters of this report considered the issue of whether the rapid growth in no-frills carriers has affected the overall rate of growth in passenger traffi c, and suggested that the impact of no-frills carriers on total passenger growth rates may not be as pronounced as commonly thought. The last two chapters, examining the characteristics of no-frills passengers have addressed the issue of whether no-frills carriers have had a signifi cant impact on the profi le of passengers.
5.55 Two main conclusions emerge from this analysis. The fi rst is that, in relation to the leisure market, the advent of no-frills carriers does not appear to have had a notable impact in terms of the income profi le of passengers. In fact, the profi le of UK leisure passengers is similar between no-frills carriers and full-service carriers, and has changed little over the last decade, and although numbers of leisure passengers from all income groups has increased, the majority of the absolute increase has come from those in higher and middle income and socio-economic groups.
5.56 The second main conclusion is that no-frills carriers have had a noticeable impact on the profi le of business passengers. Passengers travelling on business have lower incomes overall now than ten years ago, and this is true across all airline types. This suggests that no-frills carriers have had a benefi cial effect here, as the factors that have made trips more viable for lower income business passengers, in particular the removal of fare restrictions and the availability of lower fares to and from more destinations, particularly from the UK regions, have resulted directly from the entry of no-frills carriers.
5.57 In addition, the growth of the no-frills sector may be contributing to other elements of change in society. Statistics show that there has been an increase in inbound traffi c on no-frills carriers to the UK, especially of late. This suggests that air travel is playing a role in facilitating the increased fl ows of workers coming into the UK from other EU countries in recent years, particularly from those countries joining the EU since enlargement. And, as more people move and settle in the UK from other parts of Europe, so there is likely to be an increase in the “visting friends and relatives” traffi c to and from those countries.
5.58 Finally, for the UK regions, there has been a marked change in the availability of fl ights for leisure and business purposes. This is again a consequence of deregulation, but it is primarily the no-frills carriers that recognised that there was signifi cant demand for travel from regional airports, and exploited these opportunities, creating benefi ts for passengers in the regions, for the airports in question, and for the regional economy.
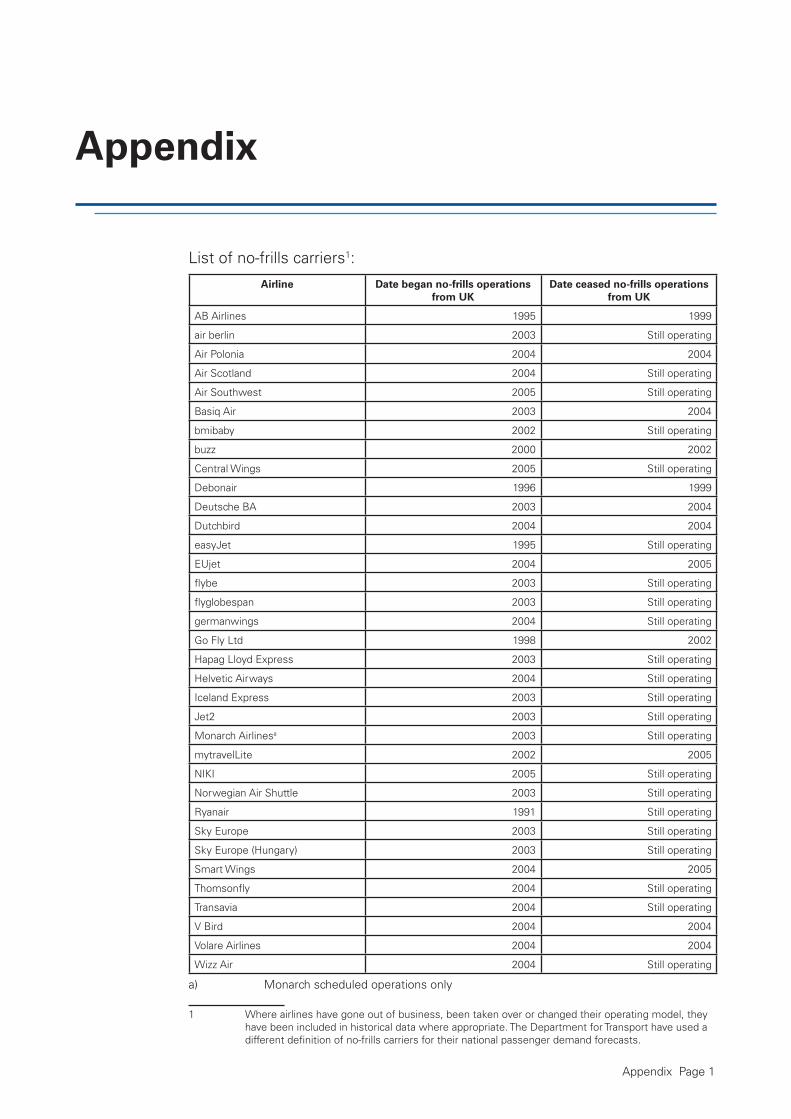
Appendix Page 1
Appendix
List of no-frills carriers1:
Airline Date began no-frills operations
from UK
Date ceased no-frills operations
from UK
AB Airlines 1995 1999
air berlin 2003 Still operating
Air Polonia 2004 2004
Air Scotland 2004 Still operating
Air Southwest 2005 Still operating
Basiq Air 2003 2004
bmibaby 2002 Still operating
buzz 2000 2002
Central Wings 2005 Still operating
Debonair 1996 1999
Deutsche BA 2003 2004
Dutchbird 2004 2004
easyJet 1995 Still operating
EUjet 2004 2005
fl ybe 2003 Still operating
fl yglobespan 2003 Still operating
germanwings 2004 Still operating
Go Fly Ltd 1998 2002
Hapag Lloyd Express 2003 Still operating
Helvetic Airways 2004 Still operating
Iceland Express 2003 Still operating
Jet2 2003 Still operating
Monarch Airlinesa 2003 Still operating
mytravelLite 2002 2005
NIKI 2005 Still operating
Norwegian Air Shuttle 2003 Still operating
Ryanair 1991 Still operating
Sky Europe 2003 Still operating
Sky Europe (Hungary) 2003 Still operating
Smart Wings 2004 2005
Thomsonfl y 2004 Still operating
Transavia 2004 Still operating
V Bird 2004 2004
Volare Airlines 2004 2004
Wizz Air 2004 Still operating
a) Monarch scheduled operations only
1 Where airlines have gone out of business, been taken over or changed their operating model, they have been included in historical data where appropriate. The Department for Transport have used a different defi nition of no-frills carriers for their national passenger demand forecasts.

INTENTIONALLY LEFT BLANK