
Cantor Fitzgerald 2017 Global Healthcare...
36
Cantor Fitzgerald 2017 Global Healthcare Conference September 26, 2017
Transcript of Cantor Fitzgerald 2017 Global Healthcare...

Cantor Fitzgerald 2017 Global Healthcare Conference
September 26, 2017
2
This presentation contains forward-looking statements, including statements regarding future growth, plans and performance. All forward-looking statements contained in this presentation involve risks and uncertainties. The Company’s actual results and outcomes could differ materially from those anticipated in these forward-looking statements as a result of various factors, including the factors set forth under the heading “Risk Factors” in its Annual Report on Form 10-K for the year ended December 31, 2016, filed with the SEC on March 1, 2017. The words “strive,” “objective,” “anticipates,” “believes,” “estimates,” “expects,” “intends,” “may,” “plans,” “projects,” “vision,” “would,” “guidance,” and similar expressions are intended to identify forward-looking statements, although not all forward-looking statements contain these identifying words. The Company has based these forward-looking statements on its current expectations and projections about future events. Although the Company believes that the expectations underlying any of its forward-looking statements are reasonable, these expectations may prove to be incorrect and all of these statements are subject to risks and uncertainties. Should one or more of these risks and uncertainties materialize, or should underlying assumptions, projections, or expectations prove incorrect, actual results, performance, financial condition, or events may vary materially and adversely from those anticipated, estimated, or expected.
All forward-looking statements included in this presentation are expressly qualified in their entirety by these cautionary statements. The Company cautions readers not to place undue reliance on any forward-looking statement that speaks only as of the date made and to recognize that forward-looking statements are predictions of future results, which may not occur as anticipated. Actual results could differ materially from those anticipated in the forward-looking statements and from historical results, due to the uncertainties and factors described above, as well as others that the Company may consider immaterial or does not anticipate at this time. Although the Company believes that the expectations reflected in its forward-looking statements are reasonable, the Company does not know whether its expectations may prove correct. The Company’s expectations reflected in its forward-looking statements can be affected by inaccurate assumptions it might make or by known or unknown uncertainties and factors, including those described above. The risks and uncertainties described above are not exclusive, and further information concerning the Company and its business, including factors that potentially could materially affect its financial results or condition or relationships with customers and potential customers, may emerge from time to time. The Company assumes no, and it specifically disclaims any, obligation to update, amend, or clarify forward-looking statements to reflect actual results or changes in factors or assumptions affecting such forward-looking statements. The Company advises investors, however, to consult any further disclosures it makes on related subjects in our periodic reports that it files with or furnishes to the SEC.
This presentation includes the following non-GAAP financial measures on a projected basis: Gross Cash Generated from Customer Contracting Activities, Adjusted EBITDA and Free Cash Flow. Please refer to the supplemental information located at the end of this presentation for a reconciliation of these projected non-GAAP financial measures to the most directly comparable projected GAAP financial measures and other important information.
Forward-Looking Statements and Non-GAAP Financial Measures

3
T H E N E W R 1
Healthcare RCM Pure Play. Significant Growth Trajectory
Robust, Proven
OPERATING MODEL
From
$425-450M to
~$800M
From $0-5M to
~$120M
Acute Care Hospital Market
$52B
Projected Revenue and Adjusted EBITDA growth through 2020 from existing contracts
DIFFERENTIATED VALUE
PROPOSITION
REVENUE GROWTH
2017-2020
Adj. EBITDA GROWTH
2017-2020
LARGE TARGET MARKET

4
W H A T W E D O
We Drive Financial Improvement and a Better Patient Experience for Integrated Health Systems
OPERATING MODEL
Proprietary technology + Experienced Talent + Analytics + Global Shared Services
Lower costs, faster collections and higher revenue
Growing pressure to run revenue cycle more efficiently
NEED RESULT
We plug into health providers’ existing IT systems
VALUE ADD

5
We manage revenue cycle needs across care settings and payment models
Revenue Cycle Phases
Order to Intake Care to Claim Claim to Payment
Care Setting
Physician Acute
Payment Models
Payor-based – Fee for Service, Risk-based
Patient-based – Insured/uninsured
W H A T W E D O
Comprehensive Coverage of Provider Requirements

6
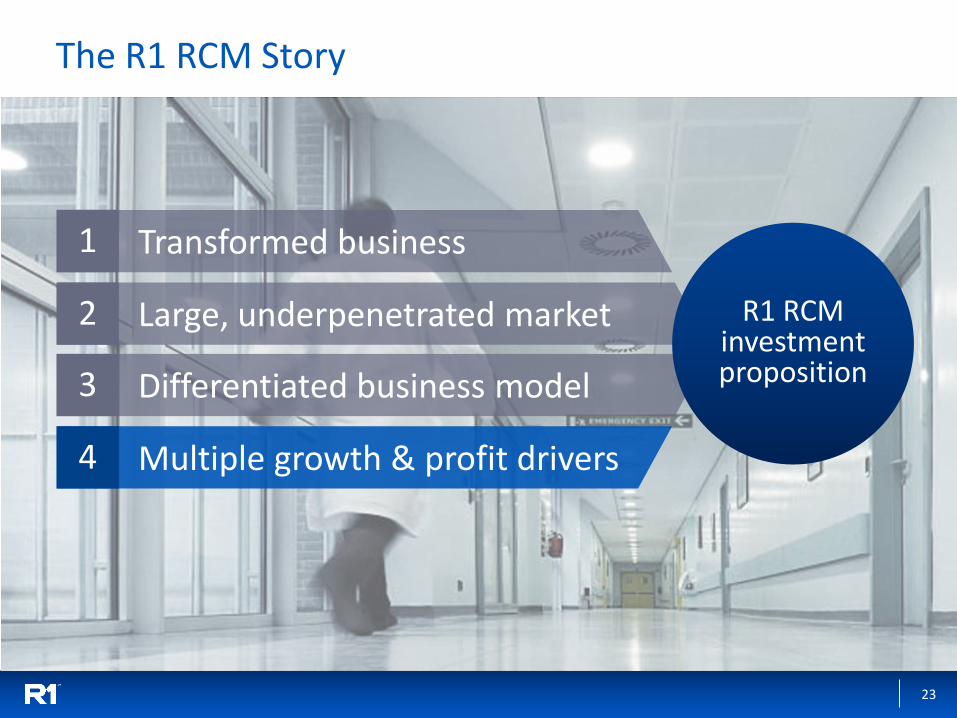
The R1 RCM Story
Large, underpenetrated market
Transformed business
Differentiated business model
Multiple growth & profit drivers
1
2
3
4
R1 RCM investment proposition

7
A T A G L A N C E
Building on a Solid Base1
Note1: All numbers as of Q2 2017 Note 2: Includes preferred convertible shares on an as-converted basis to common shares
$425-450M
8k
139 / 17
FY 2017E Revenue
Employees
Contracted RCM Hospitals/ states
$134M / Zero Cash / debt
~$700M Market cap2

8
At an Inflection Point, Entering a New Growth Era
2013 - 2016 2017+ 2003 - 2012
• Pioneered end-to-end revenue cycle outsourcing
Foundation Restatement/ Restructuring
New Growth Era
• Revamped financial reporting and processes
• Built best-in-class technology and operations platform
• Relaunched Company
• $9.5B in new NPR
• Expand capabilities –integrated physician-acute RCM

9
Demonstrated Revenue Momentum
Quarterly Revenue1
$38M
$60M $70M
$87M
$99M
Q2'16 Q3'16 Q4'16 Q1'17 Q2 '17
Note1: 2016 Quarterly Revenue data reflects Gross Cash Generated from Customer Contracting Activities, a non-GAAP metric utilized by the Company prior to the adoption of ASC606 on January 1, 2017

10
-$27M
$0-5M
2016 2017 Guidance
2020 Contracted Business
Adjusted EBITDA Turns Positive, then Ramps Up
Adjusted EBITDA
~$120M

11
Improved Shared Services, created operating framework
Invested in new platform, doubled IT investment spend
Demonstrable improvement in customers’ balance sheet and income statement metrics
Overhauled organization, addressed internal controls
Simplified pricing model
Major Repositioning Last 3 Years
Pricing
Operations
Technology
Metrics
Compliance

12
Landmark Partnership Deal with Ascension/TowerBrook
• $200M cash investment
• R1 exclusive provider of RCM services and PAS to fully-owned Ascension hospitals for 10-year term
• +$9.5B in new net patient revenue (NPR) from Ascension over a three-year period
Benefits to R1
Interests of all parties aligned building shareholder value
The Partnership
Ascension
• Largest Catholic not-for-profit health system in the U.S.
• Oldest and largest customer of R1 RCM
TowerBrook Capital Partners
• Extensive healthcare investment experience
The Investment
• $200M cash investment
• Hold 46% ownership in R1

13
Large, underpenetrated market
Transformed business
Differentiated business model
Multiple growth & profit drivers
1
2
3
4
R1 RCM investment proposition
The R1 RCM Story
14
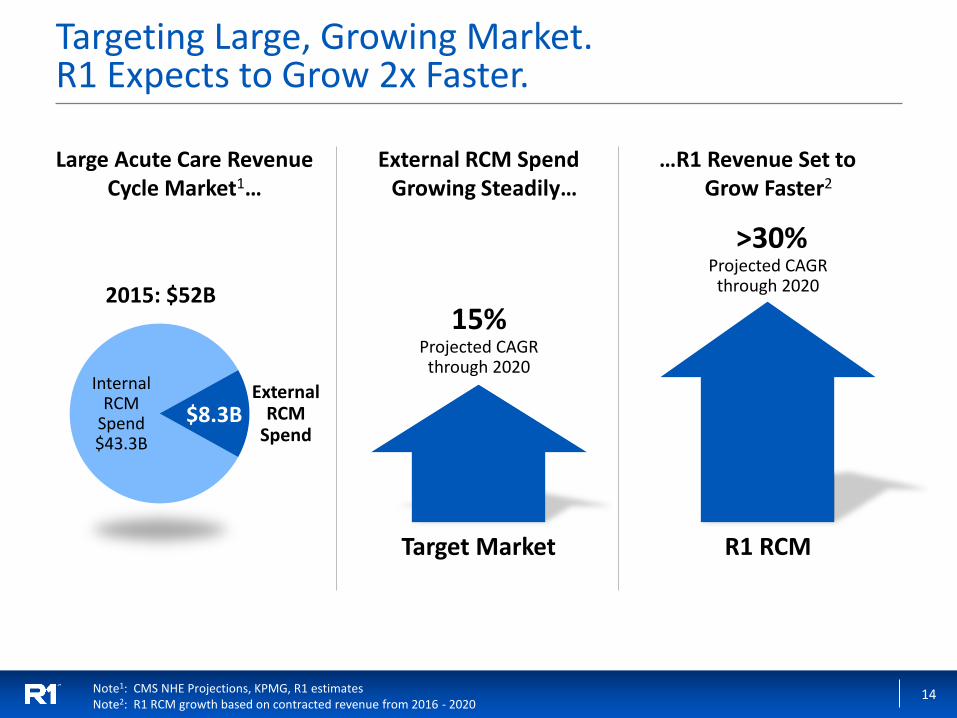
Targeting Large, Growing Market. R1 Expects to Grow 2x Faster.
Note1: CMS NHE Projections, KPMG, R1 estimates Note2: R1 RCM growth based on contracted revenue from 2016 - 2020
External RCM Spend Growing Steadily…
R1 RCM
External RCM
Spend $8.3B
15% Projected CAGR
through 2020
Target Market
…R1 Revenue Set to Grow Faster2
Large Acute Care Revenue Cycle Market1…
>30% Projected CAGR
through 2020 2015: $52B
Internal RCM
Spend $43.3B

15
Market Dynamics Play to Our Strengths
Best value proposition
=
• Sub-optimal collections rate
• Infrastructure not delivering scale advantages
• Falling behind in technology
Hospital Market Dynamics
Implication for Hospitals
• Weakening margins
• Transform from a wholesale to retail mindset
Need for sustainable solutions
• Financial pressures
• Increasing complexity
• Capital constraints
• Industry consolidation
• Consumer demands

16
Differentiated Player in the Industry Sc
alab
ility
Revenue Cycle Capabilities
Scalable infrastructure, broadest capabilities
Major end-to-end Competitors
Niche Competitors
Single-focus End-to-End
Low
High

17
The R1 RCM Story
Large, underpenetrated market
Transformed business
Differentiated business model
Multiple growth & profit drivers
1
2
3
4
R1 RCM investment proposition

18
Robust and proven operating model
Flexible deployment models
Ability to scale
Integrated physician-acute offering, across payment models
Differentiated Capabilities

19
Robust and Proven Operating Model
PERFORMANCE STACKSM
5% 20% 30%
increase in net revenue
reduction in A/R days
reduction in cost to collect
UP TO
Demonstrable Results
Improved Healthcare Provider Economics
EXPERIENCED TALENT
PROVEN PROCESS
PROPRIETARY TECHNOLOGIES
ANALYTICS & ACCOUNTABILITY
DIMENSIONAL VISIBILITY
ASSURED STANDARDIZATION
COMPREHENSIVE GAINS

20
R1 Performance: 17% reduction in AR days
Superior Performance Versus Competitors
Comparison of $10B+ systems that are served by mature End-to-End RCM Providers
Source: Definitive Healthcare Note1: Gross Accounts Receivable divided by average daily Gross Revenue
-20%
-10%
0%
10%
20%
30%
40%
% Change – Decrease is Favorable
- 17% R1 RCM
Competitor 1 + 26%
Competitor 2 + 23%
Competitor 3 + 10%
AR Days1 Performance
2011 2012
2013 2014
2015

21
Three Flexible Engagement Models
• Full, risk-sharing infrastructure partners
OPERATING PARTNER
• Embedded managers, processes & technologies in the organization
CO-MANAGED
• Leverage specific R1 strengths and capabilities
MODULAR
End-to-end solution
Specific components of revenue cycle
Customer Need
22
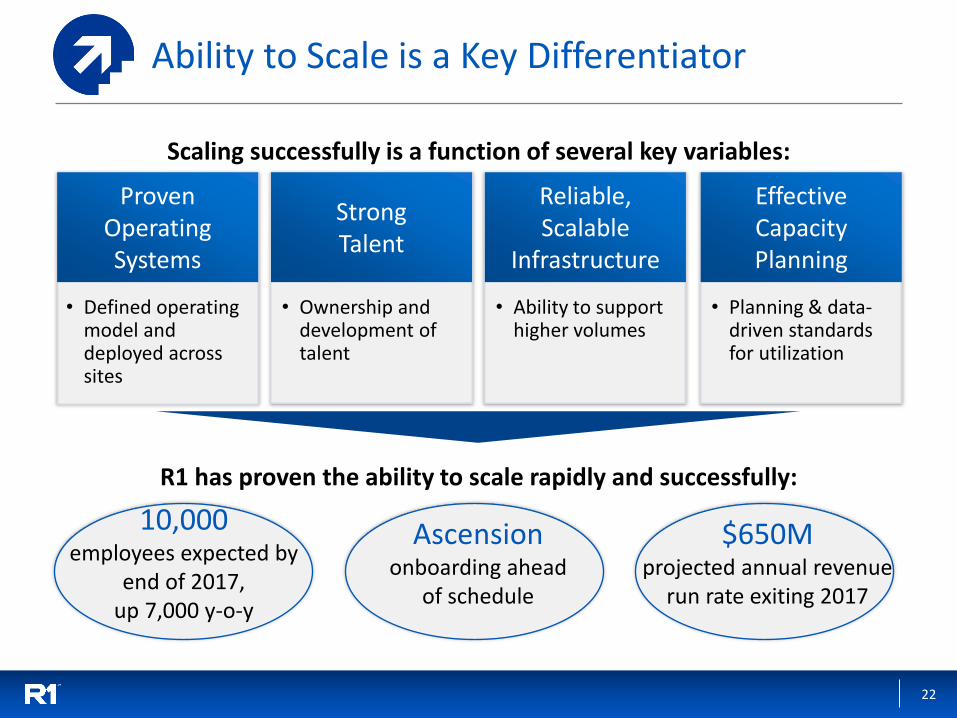
Ability to Scale is a Key Differentiator
Scaling successfully is a function of several key variables:
• Ownership and development of talent
Strong Talent
Reliable, Scalable
Infrastructure
• Ability to support higher volumes
Effective Capacity Planning
• Planning & data-driven standards for utilization
Proven Operating Systems
• Defined operating model and deployed across sites
R1 has proven the ability to scale rapidly and successfully:
10,000 employees expected by
end of 2017, up 7,000 y-o-y
Ascension onboarding ahead
of schedule
$650M projected annual revenue
run rate exiting 2017
23
The R1 RCM Story
Large, underpenetrated market
Transformed business
Differentiated business model
Multiple growth & profit drivers
1
2
3
4
R1 RCM investment proposition
24
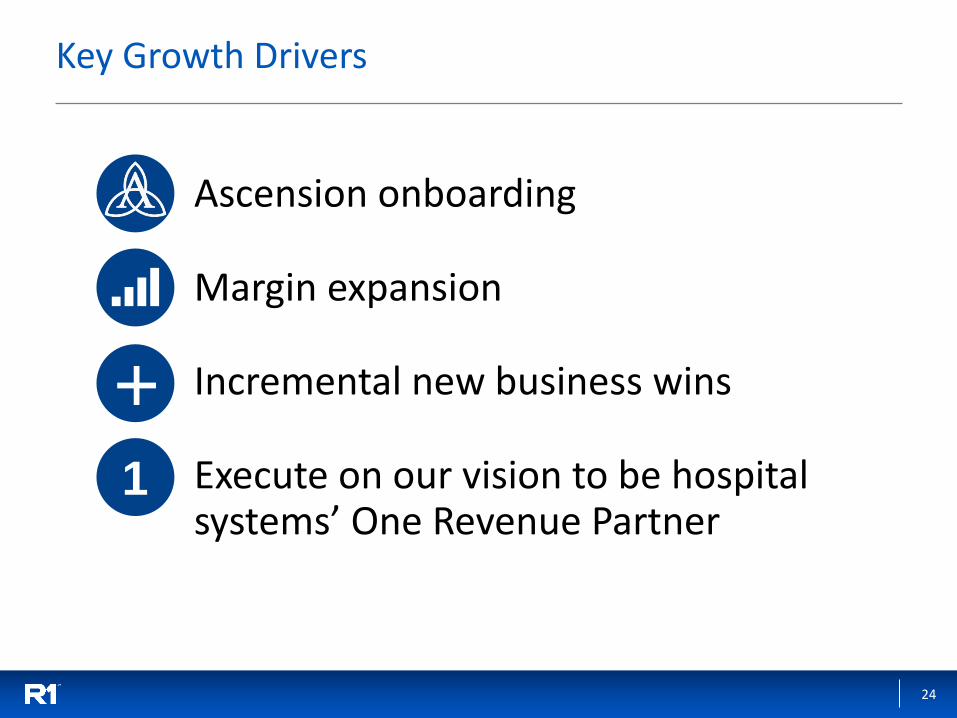
Key Growth Drivers
Ascension onboarding
Margin expansion
Incremental new business wins
Execute on our vision to be hospital systems’ One Revenue Partner
1
+

25
Ascension: Accelerated and Expanded Onboarding of New Business
$6B
Each $1B in NPR under management adds $40-50M to R1 revenue
$15.5B
+$9.5B
2016 2018 2017
Under management pre-2016
New NPR added in 2017 (includes $500M from physician RCM services)
2016 PLAN
Accelerated onboarding of
$700M NPR
$6B
$8B new NPR
$1.5B new NPR
$700M

26
Margins to Expand as Onboarding Completed
~15%
~1%
14+ percentage points in 3 years
2017 2020
Move work to shared services
centers
Rationalize vendor spend
Revenue lift from
performance improvement
Technology-driven
productivity enhancement
Expected Adjusted EBITDA %

27
+ Multi-faceted Approach to Growth
Multiple levers to drive long-term growth
Ascension Rollout
New Business Wins
Expansion of Capabilities
Productivity Enhancements
New end-to-end wins
Onboarding roadmap provides growth through 2020
New modular wins
Cross-sell into existing base
Selectively pursue acquisitions and fund internal initiatives
Margin expansion through scaling benefits and automation
Included in growth projections
Not included in growth projections

28
Phased Approach to Execute on our Vision to be hospital systems’ “One Revenue Partner”
Enterprise Value
Complete In-progress
Relaunch
Effective re-launch of company
Solidify acute care lead
Strengthen leading acute care position
via Ascension deployment
Extend integrated solution
Further build out integrated revenue
cycle (acute + physician) across payment models
Phase #3
Phase #2
Phase #1
1
29
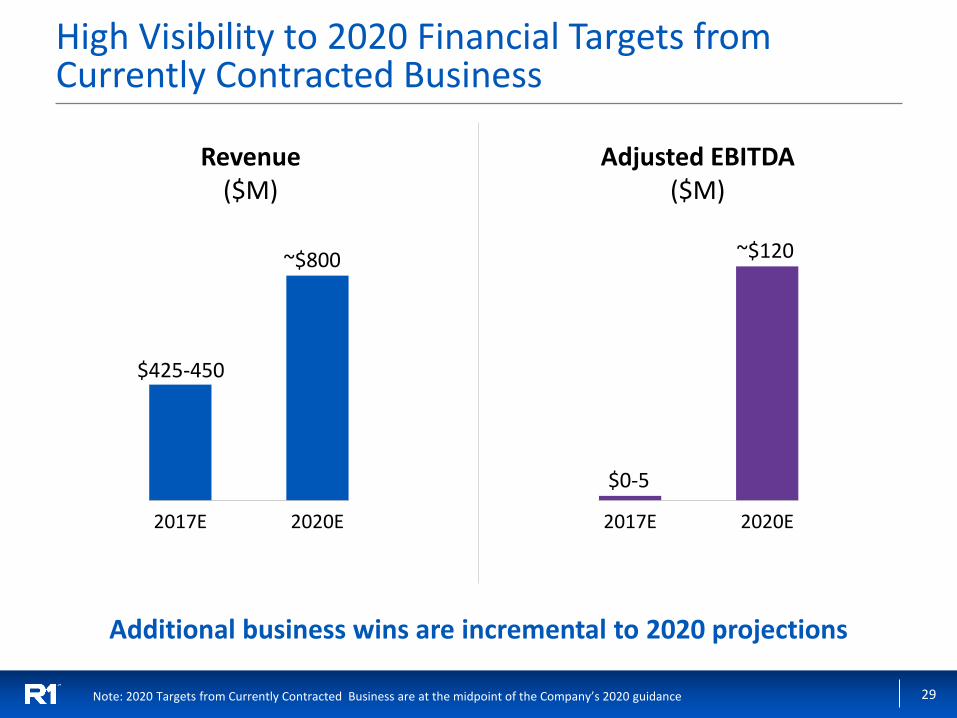
High Visibility to 2020 Financial Targets from Currently Contracted Business
2017E 2020E
Revenue ($M)
2017E 2020E
Adjusted EBITDA ($M)
$425-450
~$800 ~$120
$0-5
Additional business wins are incremental to 2020 projections
Note: 2020 Targets from Currently Contracted Business are at the midpoint of the Company’s 2020 guidance

30
Key 2017 Targets
• Complete successful relaunch – rebrand, relist
• Expanded Ascension Scope, added WI Physician RCM business
• Launch Modular RCM offerings
• Hire Chief Commercial Officer
• Launch front-end transformation pilot sites
• Positive free cash flow and adjusted EBITDA in 2H’17
• Deliver on full year 2017 guidance
On track to deliver on key milestones

31
The R1 RCM Story
Large, underpenetrated market – R1 growing faster than market
Transformed business – Solid foundation for accelerated growth
Differentiated business model – Strong competitive advantages, scalable
Multiple growth & profit drivers – Strong growth trajectory with high visibility
1
2
3
4
R1 RCM investment proposition

Appendix

33
Use of Non-GAAP Financial Measures
In order to provide a more comprehensive understanding of the information used by R1’s management team in financial and operational decision making, the Company supplements its GAAP consolidated financial statements with certain non-GAAP financial measures, which are included in this presentation on a projected basis. These include Gross Cash Generated from Customer Contracting Activities, Free Cash Flow, and adjusted EBITDA. Our Board and management team use these non-GAAP measures as (i) one of the primary methods for planning and forecasting overall expectations and for evaluating actual results against such expectations; and (ii) a performance evaluation metric in determining achievement of certain executive incentive compensation programs, as well as for incentive compensation plans for employees.
Gross Cash Generated from Customer Contracting Activities is defined as GAAP net services revenue, plus the change in deferred customer billings. Accordingly, Gross Cash Generated from Customer Contracting Activities is the sum of (i) invoiced or accrued net operating fees, (ii) cash collections on incentive fees and (iii) other services fees. The Company does not report Gross Cash Generated from Customer Contracting Activities following the adoption of the new revenue recognition accounting standard in 2017 (ASC 606). Deferred customer billings include the portion of both (i) invoiced or accrued net operating fees and (ii) cash collections of incentive fees, in each case, that have not met our revenue recognition criteria. Deferred customer billings are included in the detail of customer liabilities balance in the consolidated balance sheet available in the Company’s Annual Report on Form 10-K for the year ended December 31, 2016.
Adjusted EBITDA is defined as net income before net interest income (expense), income tax provision, depreciation and amortization expense, share-based compensation, transaction-related expenses, reorganization-related expenses and certain other items.
Free Cash Flow is defined as cash flow from operations, less capital expenditures. For 2017 and 2020 the Company expects Free Cash Flow to be approximately equal to GAAP Operating Income.
These adjusted measures are non-GAAP and should be considered in addition to, but not as a substitute for, the information prepared in accordance with GAAP.

34
Reconciliation of GAAP to Non-GAAP Financials
2017 2020
GAAP Operating Income Guidance ($25) - ($30) $75 - $105
Plus:
Depreciation and amortization expense ~$13 $10- $15
Share-based compensation expense ~$13 $10- $15
Severance and other costs ~$5 ~$5
Adjusted EBITDA guidance $0 - $5 $105 - $135
$ in millions
Reconciliation of GAAP Operating Income Guidance to Non-GAAP Adjusted EBITDA Guidance
Reconciliation of 2016 GAAP Revenue to Non-GAAP Gross Cash Generated from Customer Contracting Activities
$ in millions
Q2'16 Q3'16 Q4'16
GAAP Revenue 8.7 125.5 106.2
Change in deferred customer billings 29.6 (65.8) (36.3)
Gross cash generated from customer contracting activities $38.3 $59.7 $69.8

35
Cash
No debt
105 million shares outstanding
• Equivalent to 87.5 million common shares
• 200,000 shares issued in Feb. 2016 (equivalent to 80 million common shares)
• 8% annual dividend payable in kind on a quarterly basis for 7 years, and cash or kind thereafter
• Ascension/TowerBrook investment vehicle has warrants to acquire 60 million common shares at $3.50 per share
• Can be exercised on a cash or cashless basis
$134 million in cash and equivalents
Capital Structure (as of 6/30/17)
Debt
Common Stock
Convertible Preferred Stock
Warrants

36
Possible Share Count Scenarios by 2020 Effect of preferred convertible securities and warrants on diluted share count
Shares in M, Dec. 2020
Scenario 1: $5.00 Common Stock Price
Scenario 2: $7.50 Common Stock Price
Common Stock Outstanding
• 105M as of 6/30/17 105 105 • Potential dilution from employee equity awards 10 10
Preferred Convertible Shares
• 80M issued plus 8% annual dividend in kind for 7 years 115 115
Warrants
• Treasury method used to calculate dilution
– Scenario 1: $5.00 common stock price 18 – Scenario 2: $7.50 common stock price 32
Fully Diluted Share Count ~248 ~262

![0809.2135v1[1] Cantor Paradox](https://static.fdocuments.us/doc/165x107/5478db70b4af9fce158b4652/08092135v11-cantor-paradox.jpg)


![From: Alderucci, Dean - Cantor Fitzgerald [mailto:DAlderucci@cantor… · 2019-02-07 · From: Alderucci, Dean - Cantor Fitzgerald [mailto:DAlderucci@cantor.com] Sent: Wednesday,](https://static.fdocuments.us/doc/165x107/5f7ae1df7225817acd095b1d/from-alderucci-dean-cantor-fitzgerald-mailtodalderuccicantor-2019-02-07.jpg)