Canopy openness and leaf area in chronosequences of...
18
Canopy openness and leaf area in chronosequences of coastal temperate rainforests Gordon W. Frazer, J.A. Trofymow, and Kenneth P. Lertzman Abstract: We examined spatial and temporal differences in canopy openness and effective leaf area (L e ) in a series of eight forest chronosequences located on southern Vancouver Island, British Columbia. Structural attributes were mea- sured on the west and east side of the island in immature, mature, and old-growth stands using hemispherical photogra- phy and the LAI-2000 plant canopy analyzer (PCA). Old-growth forest canopies were distinct from those of younger stands: they were more open, more heterogeneous in their openness, and maintained a lower stand L e . Although the overall developmental trajectories of forests were similar across the study sites, site-to-site differences in the rate and magnitude of these temporal changes indicated that site-specific factors also play a significant role in determining the character of forest canopies and their development. The most significant changes in canopy structure did not emerge until the later stages of stand development (150–200 years). Douglas-fir (Pseudotsuga menziesii (Mirb.) Franco) domi- nated east-side forests were, on average, more open, more heterogeneous, and had a lower stand L e than the stands dominated by western hemlock (Tsuga heterophylla (Raf.) Sarg.) and western redcedar (Thuja plicata Donn.) forming the west-side chronosequences. Shoot clumping, along with other evidence, suggested that species-related differences in leaf display and the geometry of branching structure might have contributed significantly to these regional patterns. Résumé : Les auteurs ont examiné les différences spatiales et temporelles dans l’ouverture de la canopée, ainsi que la surface foliaire effective (L e ) dans une série de huit chronoséquences forestières situées dans le sud de l’île de Vancou- ver, en Colombie-Britannique. Les attributs structuraux ont été mesurés sur les côtés ouest et est de l’île dans des peu- plements immatures, matures et vieux, en utilisant la photographie hémisphérique et le LAI-2000 PCA (plant canopy analyzer). Les canopées des vieilles forêts sont différentes de celles des jeunes peuplements. Elles sont plus ouvertes, plus hétérogènes quant à leur ouverture et ont conservé une valeur de L e plus faible. Bien que le sens général du déve- loppement des forêts soit similaire à travers les sites étudiés, les différences entre les sites situés côte-à-côte, dans le taux et l’amplitude de ces changements temporels, indiquent que des facteurs spécifiques au site jouent également un rôle important dans la détermination du caractère des canopées forestières et de leur développement. Les changements les plus importants dans la structure de la canopée ne sont pas apparus avant les derniers stades de développement du peuplement (150–200 ans). Les forêts dominées par le Douglas vert (Pseudotsuga menziesii (Mirb.) Franco) sur la côte est de l’île sont, en moyenne, plus ouvertes, plus hétérogènes et ont un L e du peuplement plus faible que les peuple- ments dominés par la pruche de l’Ouest (Tsuga heterophylla (Raf.) Sarg.) et le thuya géant (Thuja plicata Donn.) qui forment les chronoséquences sur la côte ouest de l’île. Les bouquets de rejets, ensemble avec d’autres indices, suggè- rent que les différences liées aux espèces dans la disposition des feuilles et la géométrie de la structure de la ramifica- tion contribuent, de façon importante, à la formation de ces patrons régionaux. [Traduit par la Rédaction] Frazer et al. 256 Introduction Population, community, and ecosystem characteristics all undergo a sequence of characteristic kinds of change as a forest establishes and develops after a disturbance (e.g., Oli- ver 1981; West et al. 1981; Huff 1995). Collectively, these features are reflected in the structural attributes of a forest stand. Structural attributes, such as the amount and distribu- tion of coarse woody debris; leaf area; or the density, mass, and size distribution of live trees, tend to follow patterns through stand development that are general among forest types and culminate in the stage known as “old growth” (Franklin and Spies 1991a; Tyrrell and Crow 1994; Wells 1996; Wells et al. 1998). These patterns, however, are best documented for young to mature stands, and variability in structural attributes tends to increase with forest age (Arsenault and Bradfield 1995). Furthermore, comprehen- sive data sets exist for only a few forest types. In the forests of northwestern North America, forest structure has become a key focus for research because of its significance for biodiversity and ecosystem function (e.g., Harmon et al. 1986; Franklin 1988; Hansen et al. 1991; Franklin and Spies 1991a). Forest structure can be more directly addressed by silvicultural prescriptions and regulatory policies than other aspects of stand ecology, and thus has become a manage- ment focus as well (e.g., Forest Ecosystem Management As- sessment Team 1993; McComb et al. 1993; B.C. Ministry of Can. J. For. Res. 30: 239–256 (2000) © 2000 NRC Canada 239 Received February 9, 1999. Accepted October 4, 1999. G.W. Frazer 1 and K.P. Lertzman. School of Resource and Environmental Management, Simon Fraser University, 8888 University Drive, Burnaby, BC V5A 1S6, Canada. J.A. Trofymow. Pacific Forestry Centre, Canadian Forestry Service, Natural Resources Canada, 506 West Burnside Road, Victoria, BC V8Z 1M5, Canada. 1 Corresponding author. e-mail: [email protected]
Transcript of Canopy openness and leaf area in chronosequences of...

Canopy openness and leaf area inchronosequences of coastal temperate rainforests
Gordon W. Frazer, J.A. Trofymow, and Kenneth P. Lertzman
Abstract: We examined spatial and temporal differences in canopy openness and effective leaf area (Le) in a series ofeight forest chronosequences located on southern Vancouver Island, British Columbia. Structural attributes were mea-sured on the west and east side of the island in immature, mature, and old-growth stands using hemispherical photogra-phy and the LAI-2000 plant canopy analyzer (PCA). Old-growth forest canopies were distinct from those of youngerstands: they were more open, more heterogeneous in their openness, and maintained a lower standLe. Although theoverall developmental trajectories of forests were similar across the study sites, site-to-site differences in the rate andmagnitude of these temporal changes indicated that site-specific factors also play a significant role in determining thecharacter of forest canopies and their development. The most significant changes in canopy structure did not emergeuntil the later stages of stand development (150–200 years). Douglas-fir (Pseudotsuga menziesii(Mirb.) Franco) domi-nated east-side forests were, on average, more open, more heterogeneous, and had a lower standLe than the standsdominated by western hemlock (Tsuga heterophylla(Raf.) Sarg.) and western redcedar (Thuja plicataDonn.) formingthe west-side chronosequences. Shoot clumping, along with other evidence, suggested that species-related differences inleaf display and the geometry of branching structure might have contributed significantly to these regional patterns.
Résumé: Les auteurs ont examiné les différences spatiales et temporelles dans l’ouverture de la canopée, ainsi que lasurface foliaire effective (Le) dans une série de huit chronoséquences forestières situées dans le sud de l’île de Vancou-ver, en Colombie-Britannique. Les attributs structuraux ont été mesurés sur les côtés ouest et est de l’île dans des peu-plements immatures, matures et vieux, en utilisant la photographie hémisphérique et le LAI-2000 PCA (plant canopyanalyzer). Les canopées des vieilles forêts sont différentes de celles des jeunes peuplements. Elles sont plus ouvertes,plus hétérogènes quant à leur ouverture et ont conservé une valeur deLe plus faible. Bien que le sens général du déve-loppement des forêts soit similaire à travers les sites étudiés, les différences entre les sites situés côte-à-côte, dans letaux et l’amplitude de ces changements temporels, indiquent que des facteurs spécifiques au site jouent également unrôle important dans la détermination du caractère des canopées forestières et de leur développement. Les changementsles plus importants dans la structure de la canopée ne sont pas apparus avant les derniers stades de développement dupeuplement (150–200 ans). Les forêts dominées par le Douglas vert (Pseudotsuga menziesii(Mirb.) Franco) sur la côteest de l’île sont, en moyenne, plus ouvertes, plus hétérogènes et ont unLe du peuplement plus faible que les peuple-ments dominés par la pruche de l’Ouest (Tsuga heterophylla(Raf.) Sarg.) et le thuya géant (Thuja plicataDonn.) quiforment les chronoséquences sur la côte ouest de l’île. Les bouquets de rejets, ensemble avec d’autres indices, suggè-rent que les différences liées aux espèces dans la disposition des feuilles et la géométrie de la structure de la ramifica-tion contribuent, de façon importante, à la formation de ces patrons régionaux.
[Traduit par la Rédaction] Frazer et al. 256
Introduction
Population, community, and ecosystem characteristics allundergo a sequence of characteristic kinds of change as aforest establishes and develops after a disturbance (e.g., Oli-ver 1981; West et al. 1981; Huff 1995). Collectively, thesefeatures are reflected in the structural attributes of a foreststand. Structural attributes, such as the amount and distribu-tion of coarse woody debris; leaf area; or the density, mass,
and size distribution of live trees, tend to follow patternsthrough stand development that are general among foresttypes and culminate in the stage known as “old growth”(Franklin and Spies 1991a; Tyrrell and Crow 1994; Wells1996; Wells et al. 1998). These patterns, however, are bestdocumented for young to mature stands, and variability instructural attributes tends to increase with forest age(Arsenault and Bradfield 1995). Furthermore, comprehen-sive data sets exist for only a few forest types. In the forestsof northwestern North America, forest structure has becomea key focus for research because of its significance forbiodiversity and ecosystem function (e.g., Harmon et al.1986; Franklin 1988; Hansen et al. 1991; Franklin and Spies1991a). Forest structure can be more directly addressed bysilvicultural prescriptions and regulatory policies than otheraspects of stand ecology, and thus has become a manage-ment focus as well (e.g., Forest Ecosystem Management As-sessment Team 1993; McComb et al. 1993; B.C. Ministry of
Can. J. For. Res.30: 239–256 (2000) © 2000 NRC Canada
239
Received February 9, 1999. Accepted October 4, 1999.
G.W. Frazer1 and K.P. Lertzman. School of Resource andEnvironmental Management, Simon Fraser University, 8888University Drive, Burnaby, BC V5A 1S6, Canada.J.A. Trofymow. Pacific Forestry Centre, Canadian ForestryService, Natural Resources Canada, 506 West Burnside Road,Victoria, BC V8Z 1M5, Canada.
1Corresponding author. e-mail: [email protected]
I:\cjfr\cjfr30\cjfr-02\X99-201.vpThursday, February 24, 2000 4:25:57 PM
Color profile: DisabledComposite Default screen

Forests 1995; Scientific Panel for Sustainable Forest Prac-tices in Clayoquot Sound 1995; Franklin et al. 1997).
The temporal dynamics of forest canopies are one of theleast understood components of forest ecosystems. Thestructure and function of forest canopies is relatively wellknown in younger managed stands (e.g., Waring and Run-ning 1998), but the ecologically diverse and spatially hetero-geneous canopies of older forests remain mostly unstudied(Schowalter et al. 1981; Brown and Parker 1994; Lowmanand Nadkarni 1995). The developmental trajectories throughwhich young forest canopies become old forest canopies areeven less well known. We expect, however, that the pro-cesses implicit in models of stand development based onother attributes of forest structure will apply to forest cano-pies as well. The key process distinguishing old growth fromearlier stages of stand development is the mortality of can-opy dominants. The structural consequences of this mortalityare the characteristics used to define, classify, and identifyold-growth stands (Franklin and Spies 1991a, 1991b;Hansen et al. 1991; Wells et al. 1998). We thus expect thatthe spatial heterogeneity associated with developmental can-opy gaps (Lertzman et al. 1996) will be one of the key fea-tures distinguishing old-growth canopies from youngercanopies.
Heterogeneity of forest canopies is a major source of vari-ation in the character of understory light environments. Het-erogeneity thus plays a critical role in determining thepatterns of tree regeneration and the composition and pro-ductivity of understory plant communities (Canham et al.1990, 1994). Interest in documenting relationships betweenforest structure and the understory light regime has con-verged on a few methodological approaches from two dis-tinct lines of research. On the one hand, community andpopulation ecologists studying successional processes asso-ciated with canopy gaps formed by patchy tree mortalityneeded to quantify the environmental conditions associatedwith those gaps (Rich et al. 1993; Canham et al. 1994;Easter and Spies 1994). On the other, microclimatologistsand production ecologists required easily replicated and non-destructive methods for quantifying the leaf area borne byforest stands (Runyon et al. 1994; Mencuccini and Grace1996; Chen et al. 1997; Fassnacht and Gower 1997). In bothcases, the challenges and constraints of direct measurementof the variables of interest (for instance, multiple light sen-sors running over several seasons or direct destructive sam-pling of tree crowns) led to the development of faster, lessdirect methods that lend themselves more easily to spatialand temporal replication (Norman and Campbell 1989;Welles and Cohen 1996).
In 1991, a large, integrative project established a series of10 forest chronosequences on southern Vancouver Island,British Columbia, Canada (Trofymow et al. 1997). A forestchronosequence is a series of stands increasing in age butwith similar histories and growing conditions (Oliver 1981).These chronosequences provided us with the opportunity tostudy structural differences in early- to late-successionalcoastal western hemlock (Tsuga heterophylla((Raf.) Sarg.)and Douglas-fir (Pseudotsuga menziesii(Mirb.) Franco) for-ests. We utilized two different optical methods, hemispheri-cal photography and the LAI-2000 plant canopy analyzer(PCA), to estimate canopy openness and leaf area within 8
of the 10 individual chronosequences each representing im-mature, mature, and old-growth stands. In this paper we will(i) present canopy openness and leaf area for the 24 individ-ual stands, (ii ) examine trends in these attributes across seralstages and regionally, and (iii ) compare the results obtainedfrom each of the two optical methods.
We expect that the spatial heterogeneity associated withdevelopmental canopy gaps (Lertzman et al. 1996; Nicotraet al. 1999) will be one of the key features distinguishingold-growth canopies from younger canopies. This suggestsboth greater mean openness, or lower leaf area, and greatervariability in openness. We also expected, a priori, muchless change in the magnitude and variance of canopy open-ness before stands reached maturity than after, because gap-forming mortality becomes increasingly important duringthe transition from maturity to old growth. Finally, we antic-ipate that each optical method will produce somewhat differ-ent quantitative measures of openness and leaf area becauseof the distinct way in which they estimate gap fractions. Wedo, however, expect qualitative agreement between the tech-niques in their assessment of changes in canopy structureover time and space.
Materials and methods
Study area descriptionAll study sites lie between 48°33′N and 49°03′N and from
123°38′W to 124°50′W within the Coastal Western Hemlock(CWH) biogeoclimatic zone of southern Vancouver Island, BritishColumbia, Canada. The CWH biogeoclimatic zone is characterizedby relatively cool summers and mild winters (mean annual temper-ature is 8.8°C), and experiences the greatest amount of rainfall ofall biogeoclimatic zones in British Columbia (mean annual precipi-tation is 2228 mm; Pojar et al. 1991, Green and Klinka 1994). Fourof the eight individual chronosequences (Fig. 1; Renfrew (REN),Red/Granite Creek (RGC), Nitinat (NIT), and Klanawa (KLA)) aresituated on the cooler and wetter west side of southern VancouverIsland within the Very Wet Maritime (CWHvm) subzone, while theremaining sites (Victoria Watershed South (VWS), Victoria Water-shed North (VWN), Koksilah (KOK), and Nanaimo River (NAN))are found on the opposing east side of the island in the Very DryMaritime (CWHxm) subzone.
Potential chronosequence sites were located through interviewswith area foresters, computer searches of digital forest cover infor-mation, and visual inspection of 1 : 20 000forest cover maps. Fi-nal site selection came after field inspection of 31 possible sites(Trofymow et al. 1997). Each chronosequence was containedwithin a 5 km × 5 km or smallerarea and composed of stands rep-resenting three distinct seral stages: immature (32–43 years), ma-ture (66–92 years), and old growth (176–435 years). Onepermanently marked plot measuring 80 m in diameter was estab-lished in each of the different-aged stands. The plot centres werelocated at least 100 m (in most cases 200 m) from the stand edge.All plots were uniformly distributed with respect to aspect, andtheir slopes and elevations averaged 15.8 ± 8.7° and 305 ± 178 masl, respectively (Table 1). The majority of immature and maturestands originated after harvesting followed by burning. Two maturestands (i.e., KOK, KLA) were in areas that established after wild-fire. In both cases, to be comparable to the other sites, plots weresited in stands devoid of veterans (canopy trees surviving the fire).Stand ages were determined using increment cores from five or sixdominant trees or ring counts on stumps in adjacent clearcuts(Trofymow et al. 1997).
© 2000 NRC Canada
240 Can. J. For. Res. Vol. 30, 2000
I:\cjfr\cjfr30\cjfr-02\X99-201.vpThursday, February 24, 2000 4:25:58 PM
Color profile: DisabledComposite Default screen

©2
00
0N
RC
Ca
na
da
Frazeret
al.241
Fig. 1. Location of the 10 coastal forest chronosequences on southern Vancouver Island, British Columbia (from Trofymow et al. 1997).
I:\cjfr\cjfr30\cjfr-02\X99-201.vp
Thursday, February 24, 2000 4:26:04 PM
Color profile: Disabled
Composite Default screen

©2
00
0N
RC
Ca
na
da
242C
an.J.
For.R
es.Vol.
30,2000
Biogeoclimaticsubzone Chronosequence site
PlotNo.
Latitude(N)
Longitude(W)
Elevation(m)
Slope(degrees)
Aspect(degrees)
Seralclassa
Age(years)
CWHxm Victoria Watershed South (VWS) 2 48°33′51′′ 123°38′55′′ 305 22 20 I 325 48°33′47′′ 123°39′45′′ 240 6 315 M 996 48°33′44′′ 123°38′53′′ 390 22 30 O 245
Victoria Watershed North(VWN)
12 48°38′08′′ 123°42′40′′ 355 3 360 I 42
13 48°38′19′′ 123°44′09′′ 260 9 55 M 9915 48°36′59′′ 123°43′17′′ 465 22 250 O 316
Koksilah (KOK) 22 48°39′30′′ 123°46′10′′ 710 9 170 I 4323 48°39′20′′ 123°44′50′′ 590 19 210 M 7724 48°39′30′′ 123°45′50′′ 630 9 180 O 288
Nanaimo River (NAN) 33 49°03′10′′ 124°09′45′′ 430 11 180 M 6634 49°02′50′′ 124°10′40′′ 430 14 220 O 33035 49°02′55′′ 124°10′20′′ 440 11 138 I 39
CWHvm Renfrew (REN) 52 48°33′28′′ 124°22′22′′ 135 24 350 I 4253 48°33′21′′ 124°23′26′′ 130 14 340 M 6654 48°32′50′′ 124°23′21′′ 320 19 270 O 255
Red/Granite Creek (RGC) 62 48°34′14′′ 124°17′43′′ 130 19 360 I 4363 48°36′75′′ 124°17′20′′ 80 6 85 M 7664 48°34′35′′ 124°13′07′′ 180 45 360 O 176
Nitinat (NIT) 72 48°50′42′′ 124°38′10′′ 185 24 225 I 3973 48°50′16′′ 124°38′39′′ 85 17 280 M 7574 48°50′03′′ 124°38′22′′ 325 12 245 O 270
Klanawa (KLA) 82 48°51′45′′ 124°50′09′′ 230 19 135 I 3283 48°49′22′′ 124°50′27′′ 120 9 330 M 6984 48°49′22′′ 124°50′27′′ 150 15 340 O 435
Table 1. Chronosequence locations, ages, and topographical characteristics.
I:\cjfr\cjfr30\cjfr-02\X99-201.vp
Thursday, February 24, 2000 4:26:05 PM
Color profile: Disabled
Composite Default screen

The west-side chronosequences (CWHvm) are dominated bywestern hemlock with secondary components ofAbies amabilis((Dougl.) Forbes (amabilis fir),Thuja plicata Donn. (westernredcedar), and Douglas-fir (Trofymow et al. 1997). In contrast,Douglas-fir is the dominant canopy species at the east-side sites(CWHxm) with a smaller component of western hemlock andwestern redcedar.Alnus rubra Bong. (red alder) andAcermacrophyllumPursh (bigleaf maple) are of minor importance inthe immature and mature stands of both west- and east-side sites.Patterns of species dominance in the forest canopy, however, variesmarkedly with stand age and location. Overall, mean stem densi-ties decline significantly from a maximum of 2111 stems/ha in theimmature stands to 603 stems/ha in old-growth plots. Immatureand mature east-side sites maintain higher mean stand densities(2323 stems/ha) than west-side forests of similar age (1294stems/ha). The decrease in stem densities between the mature andold-growth stages is significantly more abrupt within east-sidechronosequences. East- and west-side, old-growth plots haveequivalent stem densities (603 stems/ha).
Sampling designWe sampled a total of 24 permanent plots (i.e., one in each of
three seral stages in eight chronosequences) between August 8 andSeptember 12, 1995, for canopy openness and leaf area usinghemispherical photography and the LAI-2000 PCA. Both opticaltechniques were used concurrently to sample each plot, so thatunderstory light and sky conditions would be the same for eachmethod at the time of sampling. In each plot, we placed seven sub-plot markers: one was located at the plot centre, while the otherswere positioned 30 m away and separated by 60° of arc (Fig. 2). Asampling grid composed of five additional stations was locatedwithin each subplot (each station was separated by 7.5 m and thelong axis of the grid was aligned east–west). We took hemispheri-cal photographs and LAI-2000 PCA measurements at each of thesubplot markers. An additional five LAI-2000 PCA readings, how-ever, were made at each of the temporary stations within a subplotto help compensate for the instrument’s limited field of view. Wethus used seven hemispherical photographs and 42 LAI-2000 PCAmeasurements to characterize each plot. In total, we collected167 photographs and 1002 light readings from the eightchronosequences.
Optical techniques
Hemispherical photographyHemispherical (fisheye) photographic lenses, which have a 180°
field of view, are commonly used to capture and record the struc-ture of forest canopies (Rich 1990). Photographs are taken skywardfrom the forest floor, digitized, and then processed using special-ized imaging software (e.g., Canham 1995; ter Steege 1996; Frazeret al. 1999). To obtain hemispherical photographs for analysis, weused a Nikon F 35-mm camera and Nikkor 8-mm f/2.8 180°fisheye (equiangular) lens shooting black and white Kodak Tri-XPan 400-ASA film. The camera was mounted on a tripod with thefilm plane leveled normal to the local zenith. The tripod was posi-tioned over the centre point of each subplot marker unless therewas undue interference from the boles of large trees (>30 cmDBH). In such cases, we offset the tripod from the subplot markerby no more than 3 m. The camera height was set to 1.3 m abovethe ground, and any understory vegetation that might have ob-scured the lens was pushed aside before exposure. Four or five rep-licate photos were obtained at each subplot using a fixed apertureof f/8 and various shutter speeds between 1/1000 and 1/60 s. Eachplot was photographed at a different time of the day and under avariety of sky conditions ranging from clear to overcast. On cleardays, pictures were taken early or late in the day when the view ofthe solar disk was blocked by the surrounding topography. On
cloudy days with sunny breaks, pictures were taken while passingclouds eclipsed the sun.
Photographic negatives were digitized using a 35-mm film scan-ner at an image resolution of a 1000 dots per inch and 8-bit (256gray-scale shades) colour depth. Of the four or five photographstaken at each subplot, only one was chosen for analysis. The selec-tion process was entirely subjective and involved two steps. First,all film negatives from a single subplot were placed on a light ta-ble to identify the image with the best colour contrast between fo-liage elements and canopy gaps. Second, the selected image plusthe two exposures taken at a speed above and below were digitizedand compared once more. The best exposures were the ones thathad a very high degree of colour contrast, yet still preserved thesmaller gaps found closer to the horizon. A custom software appli-cation developed by Frazer et al. (1997) was utilized to analyzeeach of the hemispherical images for canopy openness and leafarea.
LAI-2000 plant canopy analyzer (PCA)The LAI-2000 PCA is a commercial instrument (LI-COR, Inc.,
Lincoln, Neb.) that uses fisheye optics and five concentric silicondetector rings to measure the amount of diffuse solar radiationtransmitted by a forest canopy at multiple view angles (0–74°).Each detector ring has an angular response of approximately 15° ofzenith. A light filter (<490 nm) positioned between the optical lensand silicon detector helps to minimize the contribution of solar ra-diation transmitted and scattered by the foliage. A control box –data logger (LAI-2070 control unit) connected to the hand-heldsensor is used to measure, record, and compute final results.
We used two intercalibrated LAI-2000 PCA sensors, both outfit-ted with 45° view caps, to measure the instantaneous diffuse solarradiation above and within each of the 24 stands. A remote refer-ence instrument programmed to store above-canopy readings every60 s was positioned in a clearing adjacent to each plot, while a sec-ond hand-held instrument was used to take below-canopy measure-ments at each of the predetermined subplots and stations. Our
© 2000 NRC Canada
Frazer et al. 243
Fig. 2. Sampling layout for optical measurements. A total of 7photographs and 42 LAI-2000 PCA measurements were used tocharacterize each plot.
I:\cjfr\cjfr30\cjfr-02\X99-201.vpThursday, February 24, 2000 4:26:06 PM
Color profile: DisabledComposite Default screen

primary reason for installing the view caps was to avoid the poten-tial inaccuracies (underestimates) that occur when a single sensorring attempts to average two very different skylight intensities, i.e.,when the optical sensor is looking at a large gap in one directionand dense foliage in another (Welles and Norman 1991).
The sensors were calibrated prior to, and after, each plot wassampled using the methods proposed in the LI-COR, Inc. PCA In-struction Manual (LI-COR, Inc. 1992). During times of measure-ment, both instruments were leveled at height approximately 1.3 mabove the ground, with the sensor heads directed towards geo-graphic north. The instruments’ field of view was therefore re-stricted to 22.5° on either side of geographic north. Slightadjustments in the horizontal (<3 m) and vertical (<1 m) positionof the below-canopy instrument were required to avoid the shad-owing produced by understory vegetation and tree boles of signifi-cant diameter (>30 cm DBH).
Canopy openness and leaf area indexCanopy openness refers to the relative amount of sky that is vis-
ible from a point beneath the forest canopy. We used the percentopen sky derived from hemispherical photographs and diffuse non-interceptance (DIFN) produced by the LAI-2000 PCA as measuresof canopy openness. These measures, however, are not exactlycomparable, largely because the LAI-2000 PCA optical sensor hasa more limited field of view and uses slightly different sineweightings.
Percent open sky was measured by (i) partitioning the hemi-spherical image into six concentric rings each corresponding to a15° interval of zenith angle from 0° (zenith) to 90° (horizon),(ii ) subjectively applying a single threshold value that separatedthe hemispherical image into sky (white) and nonsky (black) pix-els, and (iii ) calculating the fraction of sky (white) pixels to totalnumber of pixels contained in each ring (gap fraction). Percentopen sky was calculated using the following formula:
[1] Sky(%) ({[cos( ) cos( )] } )= − ×=∑ θ θ1
1
6
2 100r
rT
where the subscriptr represents the concentric ring number rang-ing from 1 to 6,θ1 andθ2 are, respectively, the smallest and largestangles of zenith that define the lower and upper bounds of eachconcentric ring (e.g.,θ1 = 0° andθ2 = 15° for ring 1), andTr is theestimated gap fraction for ringr.
DIFN was estimated using similar intervals (≅15°) of sky view;however, the geometry of the LAI-2000 PCA optical sensor waslimited to only five rings (0–74°) and 45° of azimuth. DIFN wascalculated with the LI-COR C2000 software using the formula:
[2] DIFN ==∑ T Wrr
r1
5
whereTr is the gap fraction (measured as the ratio of diffuse sky-light below to the diffuse skylight above the canopy) for ringr, andWr is the normalized weighting value for ringr (i.e., ring 1 =0.066, ring 2 = 0.189, ring 3 = 0.247, ring 4 = 0.249, and ring 5 =0.249) (LI-COR, Inc. 1992).
Hemispherical photography and the LAI-2000 PCA are consid-ered to measure only an “effective” leaf area index (LAI), because(i) neither technique is directly able to compensate for the clump-ing of foliage elements within the canopy, and (ii ) gap fractions area consequence of the shading effects produced by all plant ele-ments (e.g., branches, boles, cones, etc.) and not just leaves (Chenet al. 1997). The definition of LAI used in this study is equivalentto the one proposed by Chen and Black (1992a), i.e., one half thetotal effective leaf area per unit ground surface area (Le), or moreprecisely, per unit slope surface area, since the instrument was held
normal to the local zenith. We used the gap fractions obtainedfrom each of the two optical techniques and the five-ring (zenithangles 0–75°) numerical integration presented by Welles and Nor-man (1991) to compute the standLe for each plot. Our measure ofstand Le, however, purposely omits the leaf area contributed byunderstory plants.
Within-shoot clumping factorShoots from branches collected as part of a foliar nutrient sam-
pling study (Trofymow et al. 1997) in the autumn of 1995 wereused to estimate within-shoot clumping factors following the meth-ods of Gower and Norman (1991). Entire branches from the sixthto eighth whorl (counting from the top of the tree) were sampledfrom three trees of each species found in each of the 24 plots. Inthe laboratory, three shoots representing current growth were se-lected from each branch. The projected area of shoots, needles, andleaves was measured using a Delta-T area meter (Decagon Devices1989). Shoots were oriented with their central axis parallel to themeter’s scan axis, measured, the shoot turned over, remeasured,and the shoot area values averaged (SA). A subsample of 40 nee-dles or four or five leaves were removed from each shoot, sepa-rated on a glass plate aligned perpendicular to the meter’s scanaxis and the area measured (LA40). The needle or leaf subsamplewas dried at 70°C overnight and weighed (LM40). The balance ofthe needles or leaves from each shoot were also removed, dried,and weighed (LMB). The shoot-level clumping factor (CF) wasthen calculated as
[3] CFLA LM LM LMB
SA= +( / )( )40 40 40
Although most plots were dominated by one tree species, othertree species contributed to the total stand basal area. Basal areaproportions for each species were calculated for each plot based onall live trees 3 m orgreater in height in the three subplots forwhich mensurational data had been gathered (Trofymow et al.1997). Proportional basal areas were used as a weighting term tocalculate a weighted, shoot-clumping factor (WCF) for each plot.
Statistical analysesStand estimates (plot means and interquartile ranges) of percent
open sky, DIFN, andLe were stratified into distinct groups accord-ing to geographic location and age-class factors. Two-way analysisof variance (ANOVA) and Tukey post-hoc tests of pairwise differ-ences (Tukey HSD) were used to test for statistically significantdifferences between these groupings. Two distinct ANOVA modelswere constructed to look at locational and stand-age differences incanopy structure across differing scales of the landscape: the firstmodel looked at the main effects and interaction of biogeoclimaticsubzone and seral stage on the canopy openness andLe in all CWHforests, while the second model focused specifically on the maineffects of site location and seral stage within each of the twobiogeoclimatic subzones. Similarly, two-way ANOVA and TukeyHSD procedures were used to identify significant differences inshoot-level clumping factors between species, subzones, sites, andseral stages. Prior to running the ANOVA and Tukey HSD tests, allattribute data were tested for normality using a normal-probabilityplot and linear best-fit line. Non-normal data were transformed us-ing either a logarithmic or square root transformation. Linear andnonlinear regressions were used to investigate the correlation be-tween structural estimates produced by hemispherical photographyand the LAI-2000 PCA. All statistical analyses were performed us-ing SYSTAT for Windows, version 5.05 (Wilkinson et al. 1992).
© 2000 NRC Canada
244 Can. J. For. Res. Vol. 30, 2000
I:\cjfr\cjfr30\cjfr-02\X99-201.vpThursday, February 24, 2000 4:26:07 PM
Color profile: DisabledComposite Default screen

Results
Overall patternsCanopy openness (percent open sky and DIFN) andLe
varied considerably within and among individual plots andamong chronosequences, indicating significant heterogeneityin canopy structure in both time and space (Fig. 3). The tem-poral change in canopy openness andLe was significant,whereby openness increased andLe decreased during forestsuccession. Changes in canopy structure, however, were lessapparent during the earlier phases (immature to mature) ofstand development as compared with the transition from ma-ture to old growth. Old-growth canopies were noticeablymore heterogeneous in their openness than younger agedforests. On the drier, east side of southern Vancouver Island,Douglas-fir dominated forests (CWHxm) had overstoriesthat were more open and heterogeneous and had a lowerLethan the western hemlock forests (CWHvm) occupying thewest side. Both optical methods identified trends that weresimilar despite quantitative differences. Finally, within-shootclumping varied considerably amongst individual species,and species-specific clumping factors varied by age-classand site location.
Magnitude and range of canopy openness andLeBoth optical techniques produced similar plot averages
and ranges in canopy openness. DIFN estimates derivedfrom the LAI-2000 PCA extended from a low of 0.01 (1%)at the Klanawa immature plot to a maximum of 0.152(15.2%) within the Koksilah old-growth plot. These plotsalso represented the minimum and maximum limits in therange of percent open sky determined by hemispherical pho-tographs (2.2–14.1%). TheLe estimates derived using theLAI-2000 PCA ranged from a maximum of 5.44 m2/m2 atthe Klanawa immature plot to a low of 2.26 m2/m2 withinthe Nanaimo old-growth plot. TheLe data extracted fromhemispherical photographs were somewhat more limited inrange and magnitude; they ranged from a maximum of4.25 m2/m2 at the Klanawa immature plot to a minimum of2.04 m2/m2 in the Koksilah old-growth plot.
We used the interquartile range of within-plot canopyopenness as an indicator of the degree of structural heteroge-neity occurring within the finest spatial scales of this study.Both age- and site-related patterns of heterogeneity emerged.West-side, immature and mature stands were the least heter-ogeneous, whereas east-side, old-growth stands were themost heterogeneous (Fig. 4). Geographic variation however,leads to broad overlap in the openness and heterogeneityamong seral stages when data were lumped across space.
Factors influencing the variation in canopy opennessand Le
Biogeoclimatic subzone and stand age effects within CWHforests
Significant mean differences (p < 0.01) in the magnitudeof canopy openness andLe (derived using either opticaltechnique) were present among age-classes as well as be-tween east- (CWHxm) and west-side (CWHvm) sites (seeANOVA results for ungrouped data, Table 2). Irrespective ofbiogeoclimatic subzone, mean canopy openness increased
and Le declined as forests matured. Mean DIFN increasedfrom 0.03 (3%) in immature to 0.044 (4.4%) in mature (p =0.12) and to 0.077 (7.7%) at old growth (p = 0.04). Simi-larly, mean percent open sky increased from a low of 5.69%in immature to 6.98% in mature (p = 0.402) and finally to amaximum of 9.99% at old growth (p = 0.016). On average,there was approximately twice the fraction of sky visible be-neath old-growth overstories compared with young forests.Mean interquartile ranges of canopy openness also increasedsignificantly throughout forest succession. No significant(p > 0.62) mean differences occurred between immature andmature seral stages; however, significant (p < 0.01) in-creases in mean interquartile ranges of openness were evi-dent as stands shifted in age-class from mature to oldgrowth. LAI-2000 PCA estimates of mean standLe showeda significant (p = 0.001) decline of 25.1% between immature(4.42 m2/m2) and old-growth (3.31 m2/m2) stages, whilephotographic estimates indicated a somewhat smaller rela-tive decline (p = 0.01) in mean standLe of 21.2% betweenimmature (3.39 m2/m2) and old growth (2.67 m2/m2).
Both optical methods also identified similar regional dif-ferences in mean canopy openness and standLe. Mean can-opy openness in CWHxm forests was approximately 1.9times (p = 0.001, LAI-2000 PCA), and 1.5 times (p = 0.001,PHOTO) higher than CWHvm stands. Mean interquartileranges of canopy openness were also significantly (p < 0.01)larger in CWHxm forests. CWHvm stands, however, exhib-ited a significantly higher (p < 0.01) meanLe (4.31 m2/m2,LAI-2000 and 3.28 m2/m2, PHOTO) compared withCWHxm forests (3.48 m2/m2, LAI-2000 and 2.82 m2/m2,PHOTO) despite the fact that younger CWHxm forestsmaintained higher mean stand densities overall.
Site location and stand age effects within CWHvm forestsContrary to the gap fraction estimates produced by the
LAI-2000 PCA, photographic results indicated that therewas some significant site-to-site variation in the magnitudeof mean canopy openness andLe within CWHvm forests(see CWHvm grouped data; Table 2, Fig. 5). Significantmean differences in percent open sky (p = 0.05) andLe (p =0.02) derived from photographs only occurred between theKlanawa and Renfrew chronosequences. Mean percent opensky and Le were approximately 2.2 times higher and 1.4times lower, respectively, at the Renfrew site compared withthe Klanawa chronosequence site.
Both optical methods identified similar trends in the tem-poral development of canopy openness andLe in CWHvmforests (Fig. 6). Mean percent open sky increased by 1.8times (p = 0.03), and DIFN increased by 3.4 times (p =0.01) as CWHvm forests developed from immature to oldgrowth. Adjacent age-classes were not statistically different,although thep value for the difference between mature andold-growth stands was much smaller than for the differencebetween immature and mature stands (immature vs. mature:p > 0.3; mature vs. old growth:p < 0.09). Mean within-plotvariability (i.e., interquartile ranges) of DIFN and percentopen sky also increased as forests matured (Fig. 4).
Mean Le declined significantly during forest succession(Fig. 6). The overall decrease in meanLe from immaturethrough to old growth was, respectively, 17.3 and 27.5% ac-cording to each of the optical methods. The mean difference
© 2000 NRC Canada
Frazer et al. 245
I:\cjfr\cjfr30\cjfr-02\X99-201.vpThursday, February 24, 2000 4:26:08 PM
Color profile: DisabledComposite Default screen

in Le between mature and old growth was only moderatelysignificant (i.e., p = 0.12, PHOTO;p = 0.06, LAI-2000PCA), while no significant (p > 0.44) difference existed be-tween immature- and mature-aged stands.
Site location and stand age effects within CWHxm forestsWe found no significant differences (p > 0.44) in mean
DIFN, percent open sky, orLe among the four CWHxmchronosequences (Table 2, Fig. 5). Photographic estimates ofmean canopy openness andLe showed significant differ-
ences (p < 0.01) among seral stages of stand development,while no significant (p > 0.15) stand-age differences wereevident within the LAI-2000 PCA data set. Both opticalmethods, however, exhibited similar temporal trends in can-opy openness andLe despite the lack of statistical signifi-cance within the LAI-2000 PCA data. Both data setsindicated that canopy openness increased andLe decreasedduring forest succession (Fig. 6).
Mean percent open sky was 1.7 times (p = 0.01) greaterin old-growth than in immature-aged stands, and mature
© 2000 NRC Canada
246 Can. J. For. Res. Vol. 30, 2000
Fig. 3. Box-and-whisker plots summarizing the distribution of (A) canopy openness and (B) effective leaf area index (Le) obtainedfrom each plot using both optical techniques. The horizontal line contained with the box is the median, the box endpoints (hinges) sig-nify the 25th and 75th percentiles (interquartile range), the whiskers define the largest and smallest observed values within 1.5 boxlengths, and the asterisks and circles are measurements (outliers) falling outside and far outside the whiskers, respectively (Wilkinsonet al. 1992).
I:\cjfr\cjfr30\cjfr-02\X99-201.vpThursday, February 24, 2000 4:26:23 PM
Color profile: DisabledComposite Default screen

forests, on average, were 1.3 times (p = 0.24) more openthan immature stands. The average overall decline inLefrom immature (3.95 m2/m2) to old growth (3.07 m2/m2) was22.3% (p = 0.134) according to data produced by the LAI-2000 PCA. These differences were slightly more substantialfor photographic data, whereLe declined (p = 0.01) by ap-proximately 25% from a maximum of 3.25 m2/m2 in imma-ture forests to a low of 2.43 m2/m2 in old-growth stands.Similar to the patterns shown in CWHvm forests, the meaninterquartile ranges of DIFN and percent open sky increased
(p < 0.08) as CWHxm forests advanced from immature toold growth. Mean interquartile ranges of percent open skyand DIFN within old growth were, respectively, 2 and 3.5times greater than immature stands (p < 0.084).
Within-shoot clumping factorsShoot-level clumping factors varied significantly among
species within both west- (F = 41.74,p < 0.0001) and east-side forests (F = 103.83, p < 0.0001). By rank, westernwhite pine (Pinus monticolaDougl.) had, on average, the
© 2000 NRC Canada
Frazer et al. 247
Fig. 3 (concluded).
I:\cjfr\cjfr30\cjfr-02\X99-201.vpThursday, February 24, 2000 4:26:37 PM
Color profile: DisabledComposite Default screen

largest projected needle-to-shoot area ratio (3.40) followedby amabilis fir (2.35), Douglas-fir (2.16), western hemlock(1.38), and western redcedar (1.01). Significant and moder-ately significant mean differences in shoot clumping werefound among age-classes for Douglas-fir and westernredcedar, respectively; however, the magnitude of these dif-ferences also varied with biogeoclimatic subzone. Meanwithin-shoot clumping increased (F = 9.85,p < 0.0001) withage-class for Douglas-fir in CHWxm chronosequences (e.g.,1.87 in immature, 2.24 in mature, and 2.47 by old growth),while no such trend was found in CWHvm plots because ofthe absence of this species in mature and old-growth stands.Clumping factors for western redcedar also increased (F =3.45, p = 0.069) with seral stage in the CWHvm chrono-sequences but varied little (F = 0.18, p = 0.682) withinCWHxm chronosequences. Significant (F = 3.01, p <0.0001) site-to-site differences in Douglas-fir clumping fac-tors were noted in CWHxm chronosequences, with the larg-est within-shoot clumping occurring at the Koksilah site(2.34), followed by Victoria Watershed North (2.109), Vic-toria Watershed South (2.06), and Nanaimo River (1.96).
We used the weighted within-shoot clumping factors mul-tiplied by a shape factor for flat needles (1.18) to correct theLAI-2000 PCA Le estimates for each plot (Table 3). MeancorrectedLe was significantly higher in the Douglas-fir-dominated east-side chronosequences (8.60 m2/m2) than onthe west-side of the island where western redcedar and west-ern hemlock were the dominant canopy species (7.27 m2/m2).Only a moderately significant (F = 2.51,p = 0.11) mean dif-ference in correctedLe occurred between each of the age-classes: mean correctedLe was lowest in old growth(6.90 m2/m2) and highest in the immature (8.56 m2/m2), andmature (8.34 m2/m2) age-classes. Within the east-sidechronosequences, mean correctedLe was stable across allage-classes (ranging from 8.53 to 8.69 m2/m2), while on the
island’s west side a significant decline (F = 6.68,p = 0.02)in mean correctedLe occurred as stand age increased.
Comparison of results obtained from hemisphericalphotography and LAI-2000 PCA
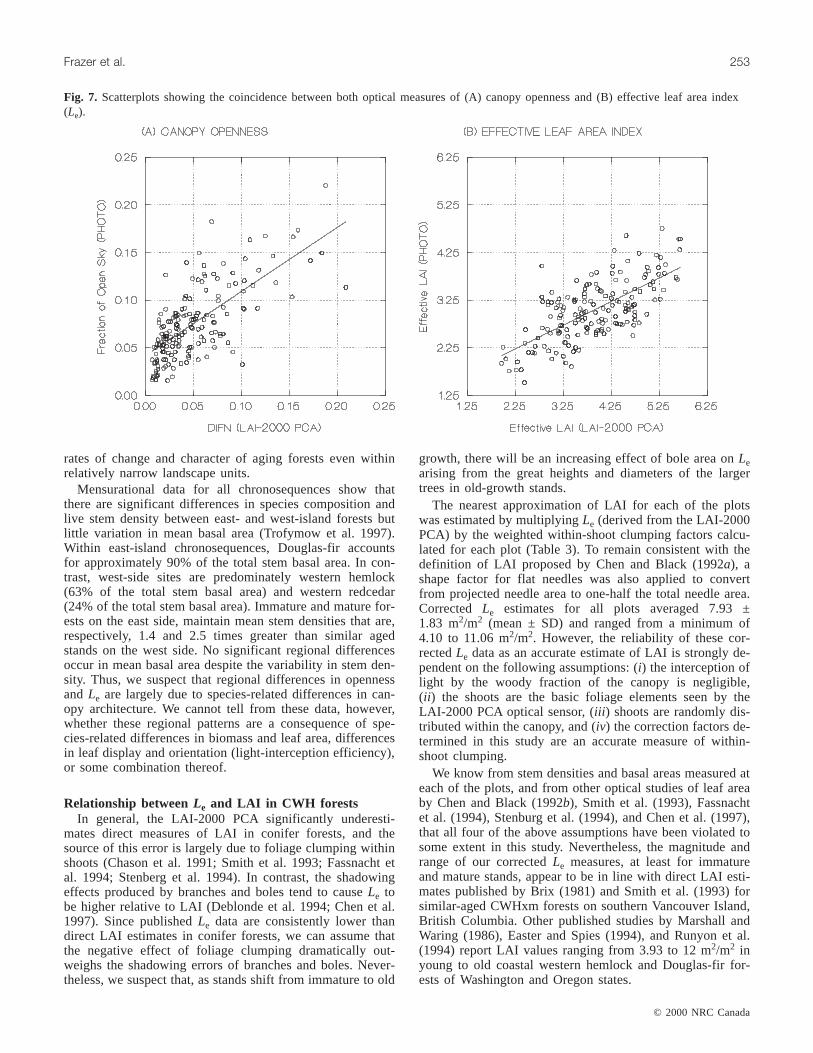
Surprisingly, there was only a moderate, positive relation-ship between the measurements produced by the two opticalmethods we used: for canopy openness,R2 = 0.49, p <0.0001, and forLe, R2 = 0.47, p < 0.0001 (Fig. 7). Hemi-spherical photography produced canopy openness estimatesthat exceeded LAI-2000 PCA measures of DIFN in 140 of167 subplots. On average, photographic measures of canopyopenness were 52% larger than estimates derived using theLAI-2000 PCA. In 154 of 167 subplots, the LAI-2000 PCAgeneratedLe estimates that, on average, exceeded photo-graphic measures by 22%.
Mean gap fractions measured using either techniqueshowed a steady decline with increasing zenith angle, whileweighted-openness distributions were generally bell shapedand at their maxima between zenith angles 25 and 35°. Thegap fractions extracted from hemispherical photographs av-eraged 2.3 times those estimated using the LAI-2000 PCA.This disparity, however, decreased with increasing zenith an-gle and the distribution curves often converged at zenith an-gles greater than 60°. The LAI-2000 PCA produced gapfraction distributions that were occasionally flat or rising be-tween zenith angles 53° (ring 4) and 68° (ring 5), while allgap fractions extracted from photographs were monotonic intheir decline towards the horizon.
Discussion
We found that canopy openness andLe are highly variablewithin and among plots, sites, subzones, and seral stages.Forest canopies are strongly heterogeneous at a variety of
© 2000 NRC Canada
248 Can. J. For. Res. Vol. 30, 2000
Fig. 4. Scatterplots showing the relationship between the mean and interquartile range of canopy openness in immature (I), mature(M), and old-growth (O) stands. Data point symbols identify the biogeoclimatic subzone of the plot.
I:\cjfr\cjfr30\cjfr-02\X99-201.vpThursday, February 24, 2000 4:26:50 PM
Color profile: DisabledComposite Default screen
©2
00
0N
RC
Ca
na
da
Frazeret
al.249
Groupedby
Descriptivestatistic
PHOTO (%sky) LAI-2000 (DIFN) PHOTO (Le) LAI-2000(Le)
Source (effect) df MS F Pa MS F Pa MS F Pa MS F Pa
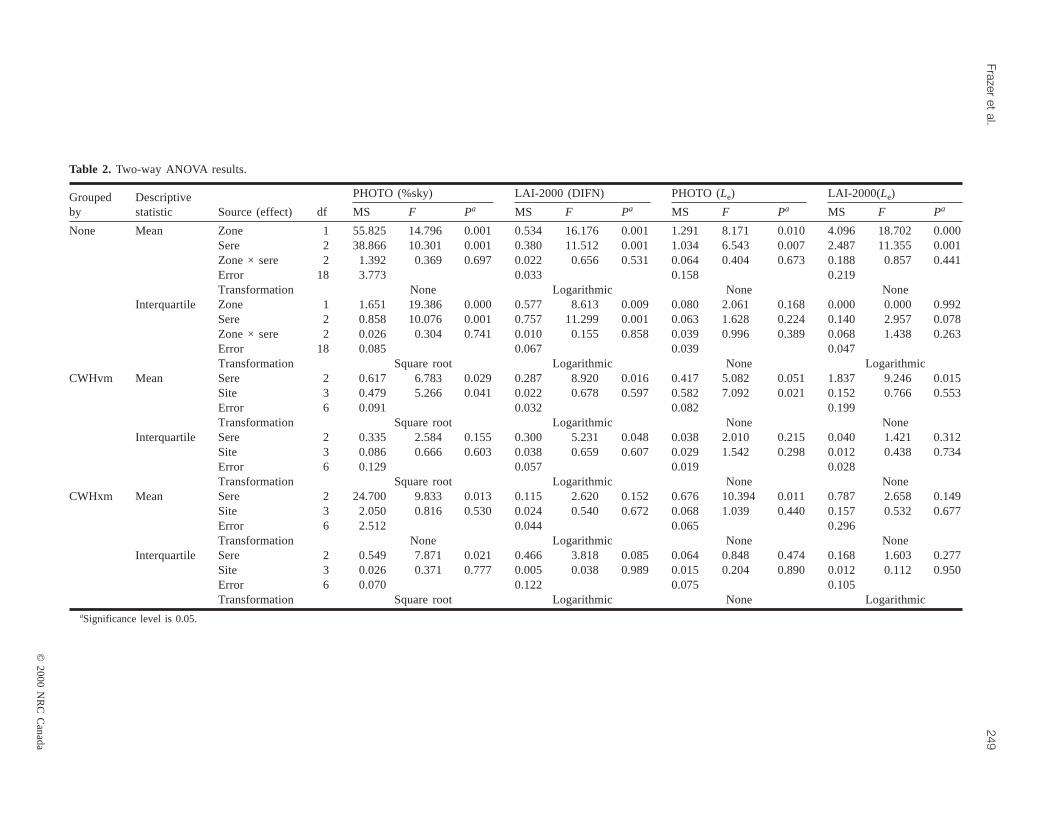
None Mean Zone 1 55.825 14.796 0.001 0.534 16.176 0.001 1.291 8.171 0.010 4.096 18.702 0.000Sere 2 38.866 10.301 0.001 0.380 11.512 0.001 1.034 6.543 0.007 2.487 11.355 0.001Zone × sere 2 1.392 0.369 0.697 0.022 0.656 0.531 0.064 0.404 0.673 0.188 0.857 0.441Error 18 3.773 0.033 0.158 0.219Transformation None Logarithmic None None
Interquartile Zone 1 1.651 19.386 0.000 0.577 8.613 0.009 0.080 2.061 0.168 0.000 0.000 0.992Sere 2 0.858 10.076 0.001 0.757 11.299 0.001 0.063 1.628 0.224 0.140 2.957 0.078Zone × sere 2 0.026 0.304 0.741 0.010 0.155 0.858 0.039 0.996 0.389 0.068 1.438 0.263Error 18 0.085 0.067 0.039 0.047Transformation Square root Logarithmic None Logarithmic
CWHvm Mean Sere 2 0.617 6.783 0.029 0.287 8.920 0.016 0.417 5.082 0.051 1.837 9.246 0.015Site 3 0.479 5.266 0.041 0.022 0.678 0.597 0.582 7.092 0.021 0.152 0.766 0.553Error 6 0.091 0.032 0.082 0.199Transformation Square root Logarithmic None None
Interquartile Sere 2 0.335 2.584 0.155 0.300 5.231 0.048 0.038 2.010 0.215 0.040 1.421 0.312Site 3 0.086 0.666 0.603 0.038 0.659 0.607 0.029 1.542 0.298 0.012 0.438 0.734Error 6 0.129 0.057 0.019 0.028Transformation Square root Logarithmic None None
CWHxm Mean Sere 2 24.700 9.833 0.013 0.115 2.620 0.152 0.676 10.394 0.011 0.787 2.658 0.149Site 3 2.050 0.816 0.530 0.024 0.540 0.672 0.068 1.039 0.440 0.157 0.532 0.677Error 6 2.512 0.044 0.065 0.296Transformation None Logarithmic None None
Interquartile Sere 2 0.549 7.871 0.021 0.466 3.818 0.085 0.064 0.848 0.474 0.168 1.603 0.277Site 3 0.026 0.371 0.777 0.005 0.038 0.989 0.015 0.204 0.890 0.012 0.112 0.950Error 6 0.070 0.122 0.075 0.105Transformation Square root Logarithmic None Logarithmic
aSignificance level is 0.05.
Table 2. Two-way ANOVA results.
I:\cjfr\cjfr30\cjfr-02\X99-201.vp
Thursday, February 24, 2000 4:26:51 PM
Color profile: Disabled
Composite Default screen
scales over the landscape and through time. A significantportion of this structural variability is influenced by standage and site location. Stand means and interquartile rangesof canopy openness increase dramatically as forests mature.The most significant developmental changes in canopystructure, however, do not occur until the later stages ofstand development. The increase in canopy openness withforest age is associated with a decline inLe as gap-formingprocesses become more prevalent. Site-to-site and east–westregional differences in the temporal rates of change andstructure of forest canopies suggest that site-specific envi-ronmental factors may exert a significant influence on thedevelopmental trajectories of forests. The use of chrono-sequences to document changes during succession, however,can be complicated by variation among sites in soil, slope,aspect, vegetation, and disturbance history. Although carefulsite selection can minimize these variations, they cannot beeliminated. Hence, the differences noted between youngerand older stands may not be entirely the result of changeswith succession, but may also represent differences in standhistory.
Successional changes in canopy structureGap fraction data provide limited information about the
size, shape, and distribution of canopy gaps. However, thesample distributions derived from multiple measurementsfrom within a single plot do offer insight into both the char-acter and spatial arrangement of openings in the canopy. Im-mature stands are characterized by small, relatively evenlyspaced canopy openings and exhibit little spatial variation inthese characteristics. Old stands, on the other hand, are char-acterized by larger, relatively unevenly spaced canopy open-ings and exhibit substantial spatial variation in thesecharacteristics. This is consistent with the notion that theoverstories of immature stands can be described as dense“monolayers” supported by numerous, relatively short anduniformly distributed stems, whereas old-growth forests aretall, multistoried, and have a more clumped distribution ofstems (e.g., Parker 1995). In our data, mature forest canopiesare in between immature and old growth stands in characterbut more similar to younger stands than older ones.
Spies et al. (1990) also observed significant differences inthe gap-size distributions of mature (100–150 years) andold-growth (>200 years) western hemlock and Douglas-firforests of Washington and Oregon. The median area of can-opy gaps was approximately 4.5 times larger in old-growthcompared with mature stands, and this difference was due tothe irregular height of canopy trees and the larger numberand size of gapmakers present in old growth stands. In con-trast, Lertzman et al. (1996) found that mature (100–250years) CWHvm stands on the southwestern side of Vancou-ver Island had more area in gaps than old growth (>250years) even though the old growth had a higher density ofgapmakers. Lertzman et al. (1996), however, suggested thatthe different aged stands they had sampled may not have
© 2000 NRC Canada
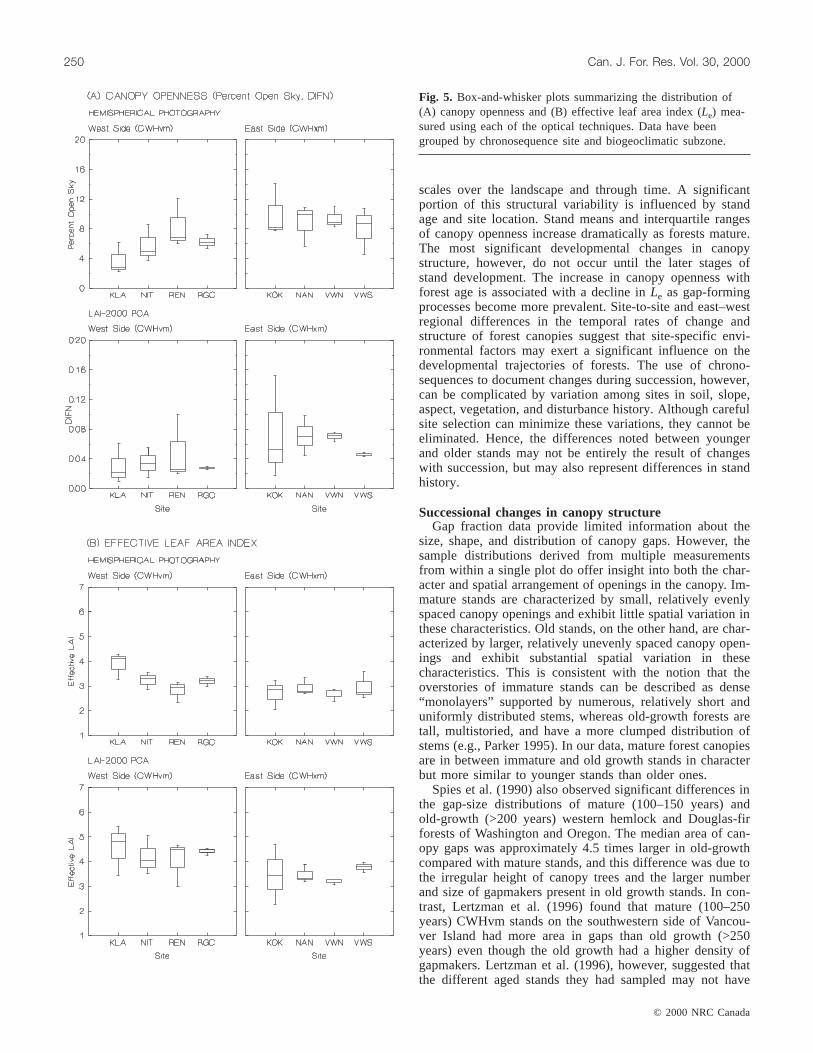
250 Can. J. For. Res. Vol. 30, 2000
Fig. 5. Box-and-whisker plots summarizing the distribution of(A) canopy openness and (B) effective leaf area index (Le) mea-sured using each of the optical techniques. Data have beengrouped by chronosequence site and biogeoclimatic subzone.
I:\cjfr\cjfr30\cjfr-02\X99-201.vpThursday, February 24, 2000 4:27:07 PM
Color profile: DisabledComposite Default screen
been on the same developmental trajectory and, therefore,may not have represented a chronosequence.
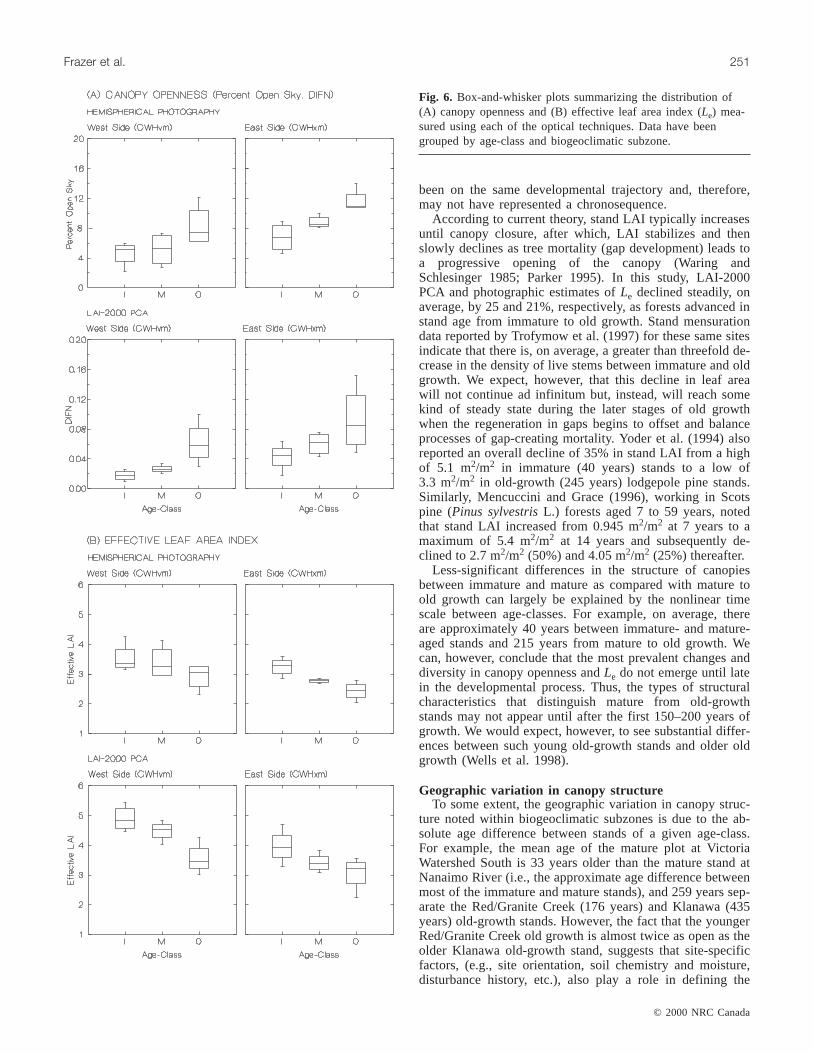
According to current theory, stand LAI typically increasesuntil canopy closure, after which, LAI stabilizes and thenslowly declines as tree mortality (gap development) leads toa progressive opening of the canopy (Waring andSchlesinger 1985; Parker 1995). In this study, LAI-2000PCA and photographic estimates ofLe declined steadily, onaverage, by 25 and 21%, respectively, as forests advanced instand age from immature to old growth. Stand mensurationdata reported by Trofymow et al. (1997) for these same sitesindicate that there is, on average, a greater than threefold de-crease in the density of live stems between immature and oldgrowth. We expect, however, that this decline in leaf areawill not continue ad infinitum but, instead, will reach somekind of steady state during the later stages of old growthwhen the regeneration in gaps begins to offset and balanceprocesses of gap-creating mortality. Yoder et al. (1994) alsoreported an overall decline of 35% in stand LAI from a highof 5.1 m2/m2 in immature (40 years) stands to a low of3.3 m2/m2 in old-growth (245 years) lodgepole pine stands.Similarly, Mencuccini and Grace (1996), working in Scotspine (Pinus sylvestrisL.) forests aged 7 to 59 years, notedthat stand LAI increased from 0.945 m2/m2 at 7 years to amaximum of 5.4 m2/m2 at 14 years and subsequently de-clined to 2.7 m2/m2 (50%) and 4.05 m2/m2 (25%) thereafter.
Less-significant differences in the structure of canopiesbetween immature and mature as compared with mature toold growth can largely be explained by the nonlinear timescale between age-classes. For example, on average, thereare approximately 40 years between immature- and mature-aged stands and 215 years from mature to old growth. Wecan, however, conclude that the most prevalent changes anddiversity in canopy openness andLe do not emerge until latein the developmental process. Thus, the types of structuralcharacteristics that distinguish mature from old-growthstands may not appear until after the first 150–200 years ofgrowth. We would expect, however, to see substantial differ-ences between such young old-growth stands and older oldgrowth (Wells et al. 1998).
Geographic variation in canopy structureTo some extent, the geographic variation in canopy struc-
ture noted within biogeoclimatic subzones is due to the ab-solute age difference between stands of a given age-class.For example, the mean age of the mature plot at VictoriaWatershed South is 33 years older than the mature stand atNanaimo River (i.e., the approximate age difference betweenmost of the immature and mature stands), and 259 years sep-arate the Red/Granite Creek (176 years) and Klanawa (435years) old-growth stands. However, the fact that the youngerRed/Granite Creek old growth is almost twice as open as theolder Klanawa old-growth stand, suggests that site-specificfactors, (e.g., site orientation, soil chemistry and moisture,disturbance history, etc.), also play a role in defining the
© 2000 NRC Canada
Frazer et al. 251
Fig. 6. Box-and-whisker plots summarizing the distribution of(A) canopy openness and (B) effective leaf area index (Le) mea-sured using each of the optical techniques. Data have beengrouped by age-class and biogeoclimatic subzone.
I:\cjfr\cjfr30\cjfr-02\X99-201.vpThursday, February 24, 2000 4:27:20 PM
Color profile: DisabledComposite Default screen

©2
00
0N
RC
Ca
na
da
252C
an.J.
For.R
es.Vol.
30,2000
Basal area proportions by speciescProjected needle/shoot area ratio byspeciesc Plot
WCF
LAI-2000Le
CorrectedLAI-2000Le
dSubzone Serea Siteb Plot BA CW DR FD HW PW BA CW DR FD HW PW
CWHxm I VWS 2 —e — — 0.748 0.252 — — — — 1.873 1.312 — 1.732 3.94 8.05VWN 12 — — — 1.000 — — — — — 1.660 — — 1.660 3.27 6.41KOK 22 — 0.068 — 0.882 0.050 — — 1.009 — 2.101 1.526 — 1.998 4.69 11.06NAN 35 — — — 1.000 — — — — — 1.910 — — 1.910 3.90 8.79
M VWS 5 — 0.054 0.016 0.923 0.006 0.001 — 1.009 1.000 2.196 1.312 3.401 2.109 3.81 9.48VWN 13 — 0.024 — 0.976 — — — 1.009 — 2.002 — — 1.978 3.07 7.17KOK 23 — — — 1.000 — — — — — 2.637 — — 2.637 3.45 10.74NAN 33 — 0.012 — 0.702 0.286 — — 1.009 — 2.115 1.337 3.401 1.879 3.33 7.38
O VWS 6 — 0.035 0.011 0.885 0.069 — — 1.009 1.000 2.240 1.312 — 2.119 3.56 8.90VWN 15 — 0.061 — 0.905 0.034 — — 1.009 — 2.789 1.374 — 2.632 3.29 10.22KOK 24 — — — 0.994 0.006 — — — — 2.714 1.526 — 2.707 2.26 7.22NAN 34 — 0.020 — 0.914 0.065 0.001 — 1.009 — 2.142 1.337 3.401 2.068 3.19 7.79
CWHvm I REN 52 0.089 0.066 — — 0.845 — 2.352 0.972 — — 1.388 — 1.446 4.64 7.92RGC 62 — 0.052 0.534 0.103 0.311 — — 0.972 1.000 1.932 1.388 — 1.215 4.47 6.41NIT 72 — 0.069 0.008 0.647 0.276 — — 0.972 1.000 1.932 1.388 — 1.708 5.03 10.14KLA 82 0.134 0.004 — — 0.862 — 2.352 0.972 — — 1.388 — 1.516 5.44 9.73
M REN 53 0.205 0.008 — — 0.787 — 2.352 1.007 — — 1.388 — 1.583 4.50 8.40RGC 63 — — — — 1.000 — — — — — 1.388 — 1.388 4.55 7.45NIT 73 — — — — 1.000 — — — — — 1.388 — 1.388 4.03 6.60KLA 83 0.297 — — — 0.703 — 2.352 — — — 1.388 — 1.674 4.82 9.52
O REN 54 0.009 0.749 — — 0.242 — 2.352 1.068 — — 1.388 — 1.157 3.00 4.10RGC 64 — 0.394 — — 0.606 — — 1.068 — — 1.388 — 1.262 4.26 6.34NIT 74 0.085 0.233 — — 0.682 — 2.352 1.068 — — 1.388 — 1.395 3.52 5.80REN 84 0.035 0.705 — — 0.260 — 2.352 1.068 — — 1.388 — 1.196 3.42 4.83
aI, immature; M, mature; O, old growth.bSee Table 1 for site abbreviations.cBA, amabilis fir; CW, western redcedar; DR, red alder; FD, Douglas-fir; HW, western hemlock.dCorrectedLe = leaf shape factor × weighted clumping factor (WCF) ×Le.eSpecies was not present on the sample plot.
Table 3. Weighted shoot clumping factors and correctedLe estimates.
I:\cjfr\cjfr30\cjfr-02\X99-201.vp
Thursday, February 24, 2000 4:27:22 PM
Color profile: Disabled
Composite Default screen
rates of change and character of aging forests even withinrelatively narrow landscape units.
Mensurational data for all chronosequences show thatthere are significant differences in species composition andlive stem density between east- and west-island forests butlittle variation in mean basal area (Trofymow et al. 1997).Within east-island chronosequences, Douglas-fir accountsfor approximately 90% of the total stem basal area. In con-trast, west-side sites are predominately western hemlock(63% of the total stem basal area) and western redcedar(24% of the total stem basal area). Immature and mature for-ests on the east side, maintain mean stem densities that are,respectively, 1.4 and 2.5 times greater than similar agedstands on the west side. No significant regional differencesoccur in mean basal area despite the variability in stem den-sity. Thus, we suspect that regional differences in opennessand Le are largely due to species-related differences in can-opy architecture. We cannot tell from these data, however,whether these regional patterns are a consequence of spe-cies-related differences in biomass and leaf area, differencesin leaf display and orientation (light-interception efficiency),or some combination thereof.
Relationship betweenLe and LAI in CWH forestsIn general, the LAI-2000 PCA significantly underesti-
mates direct measures of LAI in conifer forests, and thesource of this error is largely due to foliage clumping withinshoots (Chason et al. 1991; Smith et al. 1993; Fassnacht etal. 1994; Stenberg et al. 1994). In contrast, the shadowingeffects produced by branches and boles tend to causeLe tobe higher relative to LAI (Deblonde et al. 1994; Chen et al.1997). Since publishedLe data are consistently lower thandirect LAI estimates in conifer forests, we can assume thatthe negative effect of foliage clumping dramatically out-weighs the shadowing errors of branches and boles. Never-theless, we suspect that, as stands shift from immature to old
growth, there will be an increasing effect of bole area onLearising from the great heights and diameters of the largertrees in old-growth stands.
The nearest approximation of LAI for each of the plotswas estimated by multiplyingLe (derived from the LAI-2000PCA) by the weighted within-shoot clumping factors calcu-lated for each plot (Table 3). To remain consistent with thedefinition of LAI proposed by Chen and Black (1992a), ashape factor for flat needles was also applied to convertfrom projected needle area to one-half the total needle area.Corrected Le estimates for all plots averaged 7.93 ±1.83 m2/m2 (mean ± SD) and ranged from a minimum of4.10 to 11.06 m2/m2. However, the reliability of these cor-rectedLe data as an accurate estimate of LAI is strongly de-pendent on the following assumptions: (i) the interception oflight by the woody fraction of the canopy is negligible,(ii ) the shoots are the basic foliage elements seen by theLAI-2000 PCA optical sensor, (iii ) shoots are randomly dis-tributed within the canopy, and (iv) the correction factors de-termined in this study are an accurate measure of within-shoot clumping.
We know from stem densities and basal areas measured ateach of the plots, and from other optical studies of leaf areaby Chen and Black (1992b), Smith et al. (1993), Fassnachtet al. (1994), Stenburg et al. (1994), and Chen et al. (1997),that all four of the above assumptions have been violated tosome extent in this study. Nevertheless, the magnitude andrange of our correctedLe measures, at least for immatureand mature stands, appear to be in line with direct LAI esti-mates published by Brix (1981) and Smith et al. (1993) forsimilar-aged CWHxm forests on southern Vancouver Island,British Columbia. Other published studies by Marshall andWaring (1986), Easter and Spies (1994), and Runyon et al.(1994) report LAI values ranging from 3.93 to 12 m2/m2 inyoung to old coastal western hemlock and Douglas-fir for-ests of Washington and Oregon states.
© 2000 NRC Canada
Frazer et al. 253
Fig. 7. Scatterplots showing the coincidence between both optical measures of (A) canopy openness and (B) effective leaf area index(Le).
I:\cjfr\cjfr30\cjfr-02\X99-201.vpThursday, February 24, 2000 4:28:34 PM
Color profile: DisabledComposite Default screen

Successional and regional patterns in correctedLeBoth the successional and regional patterns exhibited by
the correctedLe data differ from those in theLe data set intwo ways. First, the mean correctedLe of CWHxm forests(8.60 m2/m2) exceeds CWHvm forests (7.27 m2/m2) by 1.2times (F = 4.564,p = 0.047) even though CWHxm forestsare twice as open. Second, correctedLe still declines (F =6.67,p = 0.02) with increasing stand age in CWHvm forests,but in CWHxm forests it remains stable from immature(8.58 m2/m2) through to old growth (8.53 m2/m2).
We expect that the regional variation in species composi-tion and canopy architecture will explain both the above dif-ferences. For example, in the CHWxm plots, the dominantcanopy species, Douglas-fir, is characterized by foliageshoots, which are twice as clumped as those of westernredcedar or western hemlock, and a horizontal branch struc-ture that allows a significant amount of skylight to penetrateat large zenith angles (Black et al. 1991). Since opticalmethods are insensitive to the surface area of individual nee-dles, and the theoretical value ofLe is heavily weighted (ap-proximately 70%) upon the gap fractions from 45 to 74°, itis reasonable to assume that the higher canopy openness andlower Le in CWHxm forests are in fact a response to differ-ences in light-interception efficiency rather than to real dif-ferences in leaf area.
The stability of correctedLe in young to old CWHxm for-ests is due to the age-related increases in shoot clumpingthat was found in the east-side Douglas-fir stands; however,we are still unsure whether other factors have contributed tothis result. For example, it may be that the seral effect on fo-liage clumping was largely an artifact of our sampling tech-nique, since specific leaf area is known to vary with crownheight (Chen and Black 1992b). If this is not the case, thenwe might conclude that the LAI of aging Douglas-fir standsinstead reaches some type of a steady state after canopy clo-sure (Marshall and Waring 1986). We still would, however,expect to see an overall decline in LAI once the contributionof woody biomass was factored into the computations.
Differences between the LAI-2000 PCA andhemispherical photography
We believe three main factors have contributed to the sig-nificant unexplained variance between estimates producedby hemispherical photography and the LAI-2000 PCA. First,both instruments did not view identical portions of astrongly heterogeneous canopy because of the limited viewof the LAI-2000 PCA optical sensor. Second, each techniqueused a different method to estimate gap fractions. Third,each technique was subject to unique measurement and ana-lytical biases that were minimized under different canopy ar-chitectures and sky conditions.
Light transmission versus gap sizeA comparison of the frequency distributions of openness
data derived from both optical methods indicates that thereare marked differences between gap fractions based on lighttransmission and those based on the size of canopy open-ings. Frequency distributions of DIFN estimates are notice-ably more (positively) skewed and leptokurtic thanphotographic measures of percent open sky. This suggeststhat either the relationship between diffuse light transmis-
sion and gap size is nonlinear and (or) that there are inherentinaccuracies or biases associated with measuring gap frac-tions using either technique. It is well documented in the lit-erature that the LAI-2000 PCA optical sensor is sensitive tothe presence of scattered radiation (320–490 nm) at large ze-nith angles (45–74°) (Welles and Norman 1991). As well,canopy openings may be poorly defined and considerablyoverestimated by photographs at small zenith angles, be-cause of the scattering and diffraction of light around theedges of individual shoots, branches, and large canopy gaps(Chen et al. 1991). Both problems were evident in the gapfractions collected in this study.
Measurement and analytical biasesAlthough the scattering of solar radiation negatively af-
fects both optical methods, each technique will attain opti-mum performance under certain environmental settings.Because we have no independent baseline data for opennessor LAI at these sites, we cannot tell under which conditionsthe performance of one instrument might exceed the other.We did, however, use regression to compare the LAI-2000PCA and photographic results, grouped by stand age and skyconditions at the time of sampling, to identify the kinds ofcanopy characteristics and field conditions under whichthese techniques show the greatest or least agreement. Boththe slopes and the coefficients of determination for these se-lect data groupings fluctuate significantly from the regres-sion parameters calculated for ungrouped data. In general,measures of canopy openness produced by the LAI-2000PCA and hemispherical photography were most alike inCWHvm chronosequences (R2 = 0.52,β1 = 0.77,p < 0.001),old-growth stands (R2 = 0.51,β1 = 0.6,p < 0.001), and underclear-sky conditions (R2 = 0.72,β1 = 0.81, p < 0.001). Theleast agreement between the techniques was in east-side im-mature stands (R2 = 0.001,β1 = 0.03, p = 0.9) and underovercast skies (R2 = 0.39,β1 = 0.75,p > 0.001).
The differences in the regression parameters between east-and west-side stands may be related to the distinct way inwhich each of the optical techniques responds to the charac-teristic horizontal branching noted by Black et al. (1991) inDouglas-fir stands. In east-side stands, a rise in gap fractionbetween rings 4 and 5 in the LAI-2000 PCA was more com-mon, indicating the presence of reflected light at large zenithangles. This problem is unique to the LAI-2000 PCA, andno evidence of similar problems were found in west-sidestands. The decline inR2 with decreasing stand age is likelyrelated to the differences in the gap-size distributions repre-senting each of the seral stands and the inability of photo-graphs to sometimes accurately define or record exceedinglysmall gaps. A large part of this problem is that most image-analysis software uses a single threshold value to classifypixel spectra into sky and nonsky, when in fact a number ofthresholds should be applied to compensate for the increasedscattering and diffraction of light at small zenith angles. Asingle threshold value will cause gaps to be over- and under-estimated at large and small zenith angles, respectively. Inimmature stands, gaps are generally smaller, more frequent,and characterized by large perimeter-to-total area ratios ascompared with mature or old-growth forests. Consequently,overestimation due to the scattering of light around smallopenings becomes cumulative and disproportionately large
© 2000 NRC Canada
254 Can. J. For. Res. Vol. 30, 2000
I:\cjfr\cjfr30\cjfr-02\X99-201.vpThursday, February 24, 2000 4:28:35 PM
Color profile: DisabledComposite Default screen

© 2000 NRC Canada
Frazer et al. 255
relative to the total amount of open sky found in immaturestands.
The fact that the LAI-2000 PCA and photographic resultsare most alike under clear-sky conditions is unusual, espe-cially since data averaged for these conditions are signifi-cantly lower than the ungrouped means. Frequency countsindicate that all three sky conditions are somewhat evenlydistributed across all subzones and age-classes; however,this still does not preclude the possibility of confoundingsky-condition with stand-structure effects. Assuming thatthese differences are due to sky conditions only, then theonly conclusion that can be made is that clear skies mayhave had an equally debilitating effect on both optical tech-niques, while overcast skies may have significantly reducedthe amount of blue light scattered at large zenith angles, thusimproving the LAI-2000 PCA results relative to the photo-graphic ones.
Although both optical techniques have identified similarqualitative changes in canopy openness andLe, quantitativedifferences in the leaf area at these sites are still not well un-derstood. Other alternative methods (e.g., Chen et al. 1997)designed to measure the shadowing effects of branches andboles, and the foliage clumping occurring at all scales, mustbe used to properly characterize the spatial and successionalchanges in leaf area. Without these additional data,Le resultsfrom either of these two techniques can be somewhat mis-leading, particularly in ecological applications that demandaccurate estimates of leaf area.
Acknowledgements
This work was supported by the Federal Panel on EnergyResearch and Development (PERD) through the ENFOR(ENergy from the FORest) program of Canadian Forest Ser-vice (Project P-453), and Forest Renewal BC (ProjectsHQ96247 and PA97735-ORE). We thank the Greater Victo-ria Water District, MacMillan Bloedel, and Timber West fortheir cooperation and assistance in providing site access.B. Rowswell helped collected the LAI-2000 PCA fieldmeasurements, and R. Leach prepared the LAI-2000 data.We thank Dr. Richard Waring for guidance with some ofour preliminary leaf area index results, and both refereesfor their helpful review of an earlier draft of the manuscript.
References
Arsenault, A., and Bradfield, G.E. 1995. Structural–compositionalvariation in three age-classes of temperate rainforests in south-ern coastal British Columbia. Can. J. Bot.73: 54–64.
Black, T.A., Chen, J.M., Lee, X., and Sagar, R.M. 1991. Character-istics of shortwave and longwave irradiances under a Douglas-fir forest stand. Can. J. For. Res.21: 1020–1028.
British Columbia Ministry of Forests. 1995. Biodiversity guide-book. Forest Practices Code of British Columbia. B.C. Ministryof Forests, Victoria.
Brix, H. 1981. Effects of thinning and nitrogen fertilization onbranch and foliage production in Douglas-fir. Can. J. For. Res.11: 502–511.
Brown, M.J., and Parker, G.C. 1994. Canopy light transmittance ina chronosequence of mixed-species deciduous forests. Can. J.For. Res.24: 1694–1703.
Canham, C.D. 1995. GLI/C: software for calculation of light trans-
mission through forest canopies using color fisheyephotography. Institute of Ecosystem Studies, Millbrook, N.Y.
Canham, C.D., Denslow, J.S., Platt, W.J., Runkle, J.R., Spies, T.A.,and White, P.S. 1990. Light regimes beneath closed canopiesand tree-fall gaps in temperate and tropical forests. Can. J. For.Res.20: 620–631.
Canham, C.D., Finzi, A.C., Pacala, S.W., and Burbank, D.H. 1994.Causes and consequences of resource heterogeneity in forests:interspecific variation in light transmission by canopy trees.Can. J. For. Res.24: 337–349.
Chason, J.W., Baldocchi, D.D., and Huston, M.A. 1991. A compar-ison of direct and indirect methods for estimating forest canopyleaf area. Agric. For. Meteorol.57: 107–128.
Chen, J.M., and Black, T.A. 1991. Measuring leaf area index ofplant canopies with branch architecture. Agric. For. Meteorol.57: 1–12.
Chen, J.M., and Black, T.A. 1992a. Defining leaf area index fornon-flat leaves. Plant Cell Environ.15: 421–429.
Chen, J.M., and Black, T.A. 1992b. Foliage area and the architec-ture of plant canopies from sunfleck size distributions. Agric.For. Meteorol.60: 135–163.
Chen, J.M., Black, T.A., and Adams, R.S. 1991. Evaluation ofhemispherical photography for determining plant area index andgeometry of a forest stand. Agric. For. Meteorol.56: 129–143.
Chen, J.M., Rich, P.M., Gower, S.T., Norman, J.M., and Plummer,S. 1997. Leaf area index of boreal forests: theory, techniques,and measurements. J. Geophys. Res.102(D24): 29 429 –29 443.
Deblonde, G., Penner, M., and Royer, A. 1994. Measuring leafarea index with the LI-COR LAI-2000 in pine stands. Ecology,75: 1507–1511.
Decagon Devices. 1989. DIAS II user’s manual. Decagon Devices,Pullman, Wash.
Easter, M.J., and Spies, T.A. 1994. Using hemispherical photogra-phy for estimating photosynthetic photon flux density undercanopies and in gaps in Douglas-fir forests of the Pacific North-west. Can. J. For. Res.24: 2050–2058.
Fassnacht, K.S., and Gower, S.T. 1997. Interrelationships amongthe edaphic and stand characteristics, leaf area index, andaboveground net primary production of upland forest ecosys-tems in north central Wisconsin. Can. J. For. Res.27: 1058–1067.
Fassnacht, K.S., Gower, S.T., Norman, J.M., and McMurtrie, R.E.1994. A comparison of optical and direct methods for estimatingfoliage surface area index in forests. Agric. For. Meteorol.71:183–207.
Forest Ecosystem Management Assessment Team. 1993. Forestecosystem management: an ecological, economic, and social as-sessment. U.S. Departments of Agriculture, Commerce, and theInterior, and the Environmental Protection Agency, Washington,D.C.
Franklin, J.F. 1988. Structural and functional diversity in temperateforests.In Biodiversity. Edited byE.O. Wilson. National Acad-emy Press, Washington, D.C. pp. 166–175.
Franklin, J.F., and Spies, T.A. 1991a. Composition, function, andstructure of old-growth Douglas-fir forests.In Wildlife and veg-etation of unmanaged Douglas-fir forests.Technical coordina-tors: L.F. Ruggiero, K.B. Aubry, A.B. Carey, and M.H. Huff.USDA For. Serv. Gen. Tech. Rep. No. PNW-285. pp. 71–80.
Franklin, J.F., and Spies, T.A. 1991b. Ecological definitions of old-growth Douglas-fir forests.In Wildlife and vegetation ofunmanaged Douglas-fir forests.Technical coordinators:L.F.Ruggiero, K.B. Aubry, A.B. Carey, and M.H. Huff. USDA For.Serv. Gen. Tech. Rep. No. PNW-285. pp. 61–69.
I:\cjfr\cjfr30\cjfr-02\X99-201.vpThursday, February 24, 2000 4:28:36 PM
Color profile: DisabledComposite Default screen

Franklin, J.F., Berg, D.R., Thornburgh, D.A., and Tappeiner, J.C.1997. Alternative silvicultural approaches to timber harvesting:variable retention harvest systems.In Creating a forestry for the21st century.Edited by K.A. Kohm and J.F. Franklin. IslandPress, Washington, D.C. pp. 111–139.
Frazer, G.W., Trofymow, J.A., and Lertzman, K.P. 1997. A methodfor estimating canopy openness, effective leaf area index, andphotosynthetically active photon flux density using hemispheri-cal photography and computerized image analysis techniques.Can. For. Serv. Pac. For. Cent. Inf. Rep. No. BC-X-373.
Frazer, G.W., Canham, C.D., and Lertzman, K.P. 1999. Gap lightanalyzer (GLA), version 2.0: imaging software to extract can-opy structure and gap light indices from true-colour fisheyephotographs. Simon Fraser University, Burnaby, B.C., and theInstitute of Ecosystem Studies, Millbrook, N.Y.
Gower, S.T., and Norman, J.M. 1991. Rapid estimation of leaf areaindex in conifer and broad-leaf plantations. Ecology,72: 1896–1900.
Green, R.N., and Klinka, K. 1994. A field guide to site identifica-tion and interpretation for the Vancouver Forest Region. B.C.Ministry of Forests, Victoria. Land Manage. Handb. No. 28.
Hansen, A.J., Spies, T.A., Swanson, F.J., and Ohmann, J.L. 1991.Conserving biodiversity in managed forests: lessons from natu-ral forests. BioScience,41: 382–393.
Harmon, M.E., Franklin, J.F., Swanson, F.J., Sollins, P., Gregory,S.V., Lattin, J.D., Anderson, N.H., Cline, S.P., Aumen, N.G.,Sedell, J.R., Lienkaemper, G.W., Cromack, K., Jr., andCummins, K.W. 1986. Ecology of coarse woody debris in tem-perate ecosystems. Adv. Ecol. Res. No. 15. pp. 133–302.
Huff, M.H. 1995. Forest age structure and development followingwildfires in the western Olympic Mountains, Washington. Ecol.Appl. 5: 471–483.
Lertzman, K.P., Sutherland, G.D., Inselberg, A., and Saunders,S.C. 1996. Canopy gaps and the landscape mosaic in a coastaltemperate rain forest. Ecology,77: 1254–1270.
LI-COR, Inc. 1992. LAI-2000 plant canopy analyzer: operatingmanual, April 1992. LI-COR Inc., Lincoln, Neb.
Lowman, M.D., and Nadkarni, N.M. 1995. Forest canopies. Aca-demic Press, Orlando, Fla.
Marshall, J.D., and Waring, R.H. 1986. Comparison of methods ofestimating leaf-area index in old-growth Douglas-fir. Ecology,67: 975–979.
McComb, W.C., Spies, T.A., and Emmingham, W.H. 1993.Douglas-fir forests: managing for timber and mature-forest habi-tat. J. For.91: 31–42.
Mencuccini, M., and Grace, J. 1996. Hydraulic conductance, lightinterception and needle nutrient concentration in Scots pinestands and their relations with net primary productivity. TreePhysiol.16: 459–468.
Nicotra, A.B., Chazdon, R.L., and Iriarte, S. 1999. Spatial hetero-geneity of light and woody seedling regeneration in tropical wetforests. Ecology,80: 1908–1926.
Norman, J.M., and Campbell, G.S. 1989. Canopy structure.InPlant physiological ecology: field methods and instrumentation.Edited byR.W. Pearcy, J. Ehleringer, H.A. Mooney, and P.W.Rundel. Chapman & Hall, New York. pp. 301–325.
Oliver, C.D. 1981. Forest development in North America followingmajor disturbances. For. Ecol. Manage.3: 153–168.
Parker, G.G. 1995. Structure and microclimate of forest canopies.In Forest canopies.Edited by M.D. Lowman and N.M.Nadkarni. Academic Press, Orlando, Fla. pp. 73–98.
Pojar, J., Klinka, K., and Demarchi, D.A. 1991. Coastal westernhemlock zone. Ch. 6.In Ecosystems of British Columbia.Edited
by D. Meidinger and J. Pojar. B.C. Ministry of Forests, Victoria.Spec. Rep. Ser. No. 6. pp. 95–112.
Rich, P.M. 1990. Characterizing plant canopies with hemisphericalphotographs. Remote Sens. Rev.5: 13–29.
Rich, P.M., Clark, D.B., Clark, D.A., and Oberbauer, S.F. 1993.Long-term study of solar radiation regimes in a tropical wet for-est using quantum sensors and hemispherical photography.Agric. For. Meteorol.65: 107–127.
Runyon, J., Waring, R.H., Goward, S.N., and Welles, J.M. 1994.Environmental limits on net primary production and light-useefficiency across the Oregon transect. Ecol. Appl.4: 226–237.
Scientific Panel for Sustainable Forest Practices in ClayoquotSound. 1995. Report 5: sustainable ecosystem management inClayoquot Sound: planning and practices. B.C. Ministry of For-ests, Victoria.
Schowalter, T.D., Webb, J.W., and Crossley, D.A. 1981. Commu-nity structure and nutrient content of canopy arthropods inclearcut and uncut forest ecosystems. Ecology,62: 1010–1019.
Smith, N.J., Chen, J.M., and Black, T.A. 1993. Effects of clumpingon estimates of stand leaf area index using the LI-COR LAI-2000. Can. J. For. Res.23: 1940–1943.
Spies, T.A., Franklin, J.F., and Klopsch, M. 1990. Canopy gaps inDouglas-fir forests of the Cascade Mountains. Can. J. For. Res.20: 649–658.
Stenberg, P., Linder, S., Smolander, H., and Flower-Ellis, J. 1994.Performance of the LAI-2000 plant canopy analyzer in estimat-ing leaf area index of some Scots pine stands. Tree Physiol.14:981–995.
ter Steege, H. 1996. WINPHOT, a Windows 3.1 programme toanalyse vegetation indices, light and light quality from hemi-spherical photoraphs. Tropenbos-Guyana Programme, George-town, Guyana. Tropenbos-Guyana, Rep. No. 97-3.
Trofymow, J.A., Blackwell, B.A., Porter, G.L., Marshall, V.,Arskey, R., and Pollard, D. 1997. An establishment report onchronosequences selected for research into the effects of con-verting coastal British Columbia old-growth forests to managedforests. Can. For. Serv. Pac. For. Cent. Inf. Rep. No. BC-X-374.
Tyrrell, L.E., and Crow, T.R. 1994. Structural characteristic of old-growth hemlock–hardwood forests in relation to age. Ecology,72: 370–386.
Waring, R.H., and Schlesinger, W.H. 1985. Forest ecosystems:concepts and management. Academic Press, Orlando, Fla.
Waring, R.H., and S.W. Running. 1998. Forest ecosystems: analy-sis at multiple scales. 2nd ed. Academic Press, San Diego, Calif.
Welles, J.M., and Cohen, S. 1996. Canopy structure measurementby gap fraction analysis using commercial instrumentation. J.Exp. Bot. 47: 1335–1342.
Welles, J.M., and Norman, J.M. 1991. Instrument for indirect mea-surement of canopy architecture. Agron. J.83: 818–825.
Wells, R.W. 1996. Developmental trends of stand structure and treemortality in Coastal Western Hemlock forests. Master of NaturalResource Management Report. Simon Fraser University,Burnaby, B.C.
Wells, R.W., Lertzman, K.P., and Saunders, S.C. 1998. Old-growthdefinitions for the forests of British Columbia. Nat. Areas J.18: 280–294.
West, D.C., Shugart, H.H., and Botkin, D.B. 1981. Forest succes-sion: concepts and application. Springer-Verlag, New York.
Wilkinson, L., Hill, M., Welna, J.P., and Birkenbeuel, G.K. 1992.SYSTAT for Windows: statistics, version 5 edition. SYSTATInc., Evanston, Ill.
Yoder, B.J., Ryan, M.G., Waring, R.H., Schoettle, A.W., andKaufmann, M.R. 1994. Evidence of reduced photosyntheticrates in old trees. For. Sci.40: 513–527.
© 2000 NRC Canada
256 Can. J. For. Res. Vol. 30, 2000
I:\cjfr\cjfr30\cjfr-02\X99-201.vpThursday, February 24, 2000 4:28:37 PM
Color profile: DisabledComposite Default screen