Cancer Report 2 English
95
Cancer IN NEW BRUNSWICK COMMUNITIES Investigating the environmental connection Inka Milewski and Lily Liu Fourteen Urban and Rural Areas (1989-2005) PART 2
-
Upload
nicklogan9361 -
Category
Documents
-
view
565 -
download
0
description
A study released by the Conservation Council of New Brunswick looks at cancer records around the province has now been published in the scientific journal, New Solutions.The study focused on communities and the kinds of cancer reported.
Transcript of Cancer Report 2 English
CancerIN NEW BRUNSWICK COMMUNITIES
Investigating the environmental connection
Inka Milewski and Lily Liu
Fourteen Urban and Rural Areas (1989-2005)P A R T 2

Cancer in New Brunswick Communities:Investigating the environmental connectionPart 2: Fourteen Urban and Rural Areas (1989-2005)
Inka Milewski and Lily Liu
AcknowledgmentsThe authors would like to thank the New Brunswick Department ofHealth and the New Brunswick Cancer Network, especially Bin Zhang,Mallory Fowler and Suzanne Leonfellner, for providing cancer countsfrom the NB Provincial Cancer Registry Database.We would like to thankPatricia Griffith and Jackson McGaw from Statistics Canada (Halifax)for providing current and historic community profile census data. Weare also grateful to our colleagues at the Conservation Council and toDr. Paula Tippett, former Medical Officer of Health for Health Region 2(Saint John area) and long-time Conservation Council Board member, fortheir professional advice, review and support throughout this researchproject.
This publication was translated by André Laurion.
Report Design: Imprint Communications
Financial support for the Conservation Council’s Health WatchProgram and this research was generously provided by the EJLBFoundation and the Salamander Foundation.
Conservation Council of New Brunswick Inc.180 St. John StreetFredericton, NB E3B 4A9Tel (506) 458-8747Fax (506) 458-1047E-mail: [email protected]
Copyright © 2009 Conservation Council of New Brunswick Inc.

Cancer in New Brunswick Communities: Investigating the environmental connection Part 2 i
Executive Summary
Introduction
Study Methods
Economic and environmental overview of study areas
Cancer incidence rates and their major risk factors
Lung (and bronchus) Cancer
Colorectal Cancer
Breast Cancer
Ovarian Cancer
Thyroid Cancer
Prostate Cancer
Bladder Cancer
Kidney Cancer
Pancreatic Cancer
Non-Hodgkin’s Lymphoma
Hodgkin’s Disease
Leukemia
Brain (and other central nervous system) Cancer
Bone (and joints) Cancer
Overall Cancer Incidence
Overall Risk Factors
Conclusions
Recommendations
References
Appendices
Appendix A – Social and economic profiles for 14 urban and rural areas inNew Brunswick for 1991, 1996, 2001 and 2006.
Appendix B – Cancer counts and unadjusted (crude) incidence rates per100,000 population for males and females in 14 urban and rural areas inNew Brunswick (1989-2005).
1
5
6
10
15
15
24
27
30
32
34
36
39
41
43
46
48
50
52
54
56
60
62
63
85
85
88
Contents

Cancer in New Brunswick Communities: Investigating the environmental connection Part 2ii

Executive SummaryIncidence rates (1989-2005) of fourteen primarymalignant or invasive cancers (lung, colorectal,breast, prostate, non-Hodgkin’s lymphoma, kidney,bladder, pancreatic, brain/central nervous system,thyroid, leukemia, ovarian, bone/joints andHodgkin’s disease) were calculated for each studyarea. Rates were calculated based on cancer countsprovided by the New Brunswick Cancer RegistryDatabase and reported as unadjusted (crude)incidence rates per 100,000 population. These rateswere compared with provincial rates for the sametime period.
One limitation of this study was that data were notavailable to calculate cancer incidence rates for allcancer types in all study areas. Where data wereavailable, the communities studies were ranked byeach cancer type for males and females. They werealso ranked overall based on four major cancer typesfor males and three major cancer types for females.
The results of this study confirm the findings of theConservation Council’s first cancer report. Cancerstatistics, when reported for large geographic areas,tend to obscure important community-level healthinformation and fail to identify or call attention tospecific communities that are clearly experiencingunusually high rates of certain types of cancer.
Major findings of this study include:
• For males, Dalhousie ranked highest among the14 communities studied based on four majorcancer types (lung, prostate, colorectal andbladder); the Minto and Harvey areas rankedsecond and third, and Saint John ranked fourth;
Health Watch, a program of the ConservationCouncil of New Brunswick, undertook a two-year study to examine cancer rates and their
risk factors among communities in New Brunswickbetween 1989 and 2005. The program’s first report(Cancer in New Brunswick Communities:Investigating the environmental connection, Part 1.Moncton Saint John and Fredericton) examined theincidence rates (1991-2005) of four major cancertypes in the province’s three largest cities (SaintJohn, Moncton and Fredericton) and compared themwith rates at the national, provincial and healthregion level. The study found that lung cancerincidence rates among males and females in SaintJohn, one of the province’s most industrialcommunities, were significantly higher than ratesreported for Fredericton and Moncton as well ratesreported for Saint John’s health region (HealthRegion 2), the province and Canada. The study alsofound that occupation and air pollution were likelymore significant risk factors for lung cancer in SaintJohn than smoking.
The first step in the development of effectivecommunity health promotion and cancer preventionprograms is understanding disease patterns and riskfactors at the community level. This second reportprovides never-before-published rates of cancer foreight urban (Bathurst, Caraquet, Dalhousie,Edmundston, Fredericton, Miramichi, Moncton andSaint John) and six rural areas (Base Gagetown,Belledune, Drummond-Denmark, Harvey, Minto andUpper Miramichi) in New Brunswick.
Cancer in New Brunswick Communities: Investigating the environmental connection Part 2 1

• For females, the Minto area ranked highestamong the 14 communities studied based onthree major cancer types (lung, breast, andcolorectal); Dalhousie and Bathurst rankedsecond, and Saint John and the Upper Miramichiarea both ranked third;
• In general, males and females in Caraquet andthe Drummond-Denmark and Base Gagetownareas had the lowest cancer incidence ratesamong the 14 communities studied with twoexceptions: males in Caraquet had the highestrate of pancreatic cancer and women in the BaseGagetown area had the highest rate of braincancer, along with women in the UpperMiramichi area;
• Several of the 14 communities studied hadcancer rates that were double the provincialrates for these cancers (e.g. pancreatic canceramong males in Caraquet, non-Hodgkin’slymphoma among males in Dalhousie, and lungand colorectal cancers among females in Minto).And the rate of ovarian cancer in Dalhousie wastriple the reported provincial rate for this cancer.
The consensus among the majority of cancerresearchers is that most cancers are not inheritedbut acquired over the course of a lifetime and thatthe majority of cancers are preventable. One key tounderstanding the incidence of cancers, even infamilies with a history of a particular cancer type, isto examine shared family lifestyles factors (e.g.smoking, alcohol consumption, diet, level ofphysical activity), as well as occupational andenvironmental exposures to pollutants.
This study assembled and examined data andinformation on key risk factors for each cancer typeand each community studied. Data on key lifestylerisk factors at the community level were notavailable. This type of data is available only at theprovincial or health region level. Published data oncancer incidence in various occupational setting
were also unavailable. Industrial pollutant releasesand air quality data were available, but only forsome communities.
Information on environmental contaminants incommunities was limited and, where available, itwas based on studies and monitoring reportsprepared by federal and provincial agencies and/orindustry. In view of the absence of provincial dataon lifestyle, occupational and environmental riskfactors, peer-reviewed scientific publicationsexamining the role of these factors in relation to theoccurrence of specific types of cancer were reviewed.
In general, this study found that communities thathave higher overall rates of cancer such asDalhousie, Minto, Saint John and Belledune seem tohave more industrial activity and/or potential forenvironmental contamination than those that havelower rates of cancer such as Caraquet and the BaseGagetown and Drummond-Denmark areas.
In addition, some of the communities that werestudied shared high rates of specific cancers andcertain occupational and environmental risk factorslinked to those cancer types. For example, lungcancer rates among males and females in the Mintoarea, Dalhousie and Saint John were found to be thehighest among the 14 communities studied. Thesecommunities are also known to have been subjectedto substantial, long term releases of industrialpollutants including fine particulates andcarcinogens, as well as with occupations known tobe significant risk factors for lung cancer (e.g. coalmining, petroleum refining, pulp and paperproduction).
Similarly, males and females in the Minto area andDalhousie all shared high rates of bladder cancer aswell as probable environmental exposure to arsenic,which is known to be a key risk factor for bladdercancer.
Cancer in New Brunswick Communities: Investigating the environmental connection Part 22

Cancer in New Brunswick Communities: Investigating the environmental connection Part 2 3
Base Gagetown Area
Bathurst
Belledune Area
Caraquet
Dalhousie
Drummond-Denmark Area
Edmundston
Fredericton
Harvey Area
Miramichi
Minto Area
Moncton
Saint John
Upper Miramichi Area
Lung Colorectal Prostate
Non-Hodgkin’s
Lymphoma
Individual Cancers
Bladder Kidney Pancreas Brain Thyroid1Hodgkin’sDisease1
OverallRank2Leukemia1Urban/Rural Area
11 13 12 13 7 12 7 * * * * 11
6 6 5 4 6 6 6 3 * * * 5
4 10 1 * 11 1 * * * * * 7
14 12 13 9 13 8 1 * * * * 12
2 1 2 1 1 2 3 * * * * 1
12 14 14 11 14 11 8 * * * * 13
5 4 10 7 12 10 9 5 1 * 1 8
13 9 8 8 8 9 10 1 4 3 4 9
8 3 3 2 3 * * * * * * 3
9 8 11 10 10 5 11 7 2 1 * 9
1 2 4 3 2 * 2 * * * * 2
10 11 9 6 9 7 4 4 5 2 3 10
3 5 6 5 5 4 5 6 3 4 2 4
7 7 7 12 4 3 * 2 * * * 6
25-49% above provincial rate
50-74% above provincial rate
75-99% above provincial rate
100 +% above provincial rate
Male cancer rankings among 14 urban and rural areas in New Brunswick (1989-2005)
Base Gagetown Area
Bathurst
Belledune Area
Caraquet
Dalhousie
Drummond-Denmark Area
Edmundston
Fredericton
Harvey Area
Miramichi
Minto Area
Moncton
Saint John
Upper Miramichi Area
Lung Colorectal Breast
Non-Hodgkin’s
Lymphoma
Individual CancersBladder Kidney Pancreas Brain Thyroid1
Hodgkin’sDisease1
OverallRank3Leukemia1
Urban/Rural Area
Female cancer rankings among 14 urban and rural areas in New Brunswick (1989-2005)
1 Insufficient data to calculate provincial rates for the same time period.2 Ranking based on lung, colorectal, prostate and bladder cancer ratesonly.3 Ranking based on lung, colorectal and breast cancer rates only.* Insufficient data to calculate incidence rates
Ovary
12 14 13 * 8 * 9 1 * 4 * * 9
5 3 5 7 9 2 1 6 8 2 * * 2
8 4 11 * * * * * * * * * 6
13 12 12 4 * * 3 * * * * * 8
2 7 4 2 1 1 2 * 1 * * * 2
14 13 14 10 5 5 8 * * * * * 10
7 11 9 11 7 8 10 7 7 1 1 * 7
10 8 1 9 10 7 11 2 4 6 * 2 7
9 5 3 * * * * * * * * * 4
4 10 7 5 6 3 4 3 3 3 * * 5
1 1 10 3 2 * * * * * * * 1
6 9 8 6 4 6 7 4 6 7 2 1 6
3 6 6 8 3 4 5 5 5 5 3 3 3
11 2 2 1 * * 6 1 2 * * * 3

A copy of the full 91-page report can be
downloaded from the Conservation
Council of New Brunswick website
www.conservationcouncil.ca or
purchased from the office by calling
(506) 458-8747.
carcinogens from their operations;
• Direct the New Brunswick Cancer Network toexpand cancer prevention outreach andeducational programs to include occupationaland environmental risk factors such as exposureto pesticides, household and industrialchemicals, and air and water pollution; and
• Enlist the assistance of government and non-government agencies and academic institutionsto effectively address the questions raised inthis report.
The Minister of Health will need to assign a highpriority to an integrated program of epidemiologicalstudies and public policy changes in order to addressthe findings and questions raised by this study. Newfinancial commitments should not be required.Rather, the Minister should reorder some of thedepartment’s priorities and reallocate certain of itshuman and financial resources.
There are certain cancers (some rare) where theevidence that a specific contaminant is linked to aspecific cancer type is strong or sufficient to make apositive association (e.g asbestos exposure andmesothelioma of the thoracic cavity, occupationalexposure to wood dust and sino-nasal cancer, andspecific classes of pesticides such as chlorophenoxyand hexachlorobenzene herbicides with laryngeal,multiple myeloma and testicular cancer). Theincidence rate of these cancer were not examined inthis study.
The findings of this study raise several questionsthat strongly suggest the need for more detailed,community-focused epidemiological studies ofcancer and other chronic disease rates.
Communities are where people live and work, whereoccupational and environmental exposures occur,and where industrial emissions often tend to beconcentrated. Cancer (and other health) statisticsreported at the health region or provincial level failto identify communities at-risk and delay researchthat could lead to the development andimplementation of appropriate risk reduction andcancer prevention programs in those communities.Better community-focused health data, like thatassembled in this report, could help identifycommunities at-risk and enable early interventionthat could prevent cancer, reduce health care costs,and save lives.
Based on the results of this study, the ConservationCouncil of New Brunswick is recommending that theMinister of Health:
• Direct the New Brunswick Cancer Network tobegin public reporting of cancer rates at thecommunity level;
• Work with the Minister of Environment toimprove air and water quality standards andrequire industries to eliminate releases of
Cancer in New Brunswick Communities: Investigating the environmental connection Part 24

Introductioncommunity health promotion and cancer preventionprograms is understanding disease patterns and riskfactors at the community level. This report builds onthe findings of the first report and examines thecancer incidence rates of fourteen major cancertypes in fourteen urban and rural areas for malesand females in New Brunswick between 1989 and2005. Community-level rates were compared toprovincial rates for the same time period where datawere available. Lifestyle, environmental andoccupational risk factors for each cancer type werealso examined.
Currently most health statistics, includingcancer rates, are reported by large geographicareas. This type of reporting offers no insight
into cancer and other disease conditions at thecommunity level where people live and work, andwhere environmental exposures and industrialemissions are concentrated. It fails to identifycancer hotspots and their key risk factors and delaysthe development and implementation of appropriaterisk intervention programs that could preventadditional cancers.
In 2007 Health Watch, a program of theConservation Council of New Brunswick, undertook atwo-year study to examine cancer rates and theirrisk factors among communities in New Brunswickbetween 1989 and 2005. The program’s first report(Cancer in New Brunswick Communities:Investigating the environmental connection, Part 1.Moncton Saint John and Fredericton) demonstratedthat cancer rates reported by large geographic areas(e.g. health region or province) obscures importantinformation about the health of New Brunswickers atthe community level.1 The study found that lungcancer incidence rates among males and females inSaint John, one of the province’s most industrialcommunities, were significantly and consistentlyhigher than rates reported for Fredericton andMoncton as well as rates reported for Saint John’shealth region (Health Region 2), the province andfor Canada. The study also found that occupationand air pollution were likely more significant riskfactors for lung cancer in Saint John than smoking.
The first step in the development of effective
Cancer in New Brunswick Communities: Investigating the environmental connection Part 2 5

Canadian population age structure. The effect ofage-standardization is to adjust (increase ordecrease) cancer rates depending on how much thepopulation age-structure in a community varies fromthe 1991 standard Canadian population.Standardization allows populations with differentage demographics to be more accurately compared.Factors that could change the age structure in acommunity include large increases in immigrantpopulations, large-scale emigration and largeincreases/decreases in birth and or death rates.None of these major changes have occurred in thecommunities in this study (Appendix A) or in NewBrunswick in general.2
New Brunswick’s information privacy policy restrictswhat cancer (or other health) data are released. Anydata which could potentially lead to theidentification of an individual are withheld. In thisstudy, if the number of new cases of a specificcancer type was less than six counts in a particularyear or time period for a particular community orarea, the New Brunswick Department of Healthwithheld the data. For example, if there were fewerthan six cases of bladder cancer in Caraquet between1989 and 2005, the data would be withheld.
Given the province’s privacy policy, age-standardization of incidence rates was not possiblefor all the urban and rural areas in this study. Allcancer rates in this study are reported as unadjusted(crude) incidence rates per 100,000 populationunless otherwise indicated.
Male and females cancer counts for 14 cancer types
Each new case of cancer is recorded with theNew Brunswick Cancer Registry Database bysex, age, year of diagnosis, type of cancer and
geographic location. This data is shared with theNational Cancer Registry. The geographic location ofeach cancer diagnosed is recorded using StatisticsCanada’s census subdivision (CSD) codes and not thelocation where the cancer diagnosis or treatmentoccurred. For example, if a cancer diagnosis occurredin the city of Miramichi (CSD code 09 050) but thepatient lived in the village of Blackville (CSD code09 019) or the parish of Blackville (CSD code 09018), the cancer incidence or death would berecorded using the CSD code for the town ofBlackville or Blackville Parish.
Cancer types are classified according to theSurveillance, Epidemiology and end Results (SEER)Groups for Primary Site which is based on aninternational cancer classification system. This studyfocused on the incidence of fourteen primarymalignant or invasive cancers in fourteen urban andrural areas in New Brunswick. The cancer types were:lung (and bronchus); colorectal, breast, prostate,non-Hodgkin’s lymphoma (NHL), kidney, bladder,pancreas, brain/central nervous system, thyroid,leukemia, ovary, Hodgkin’s and bone/joints.
Cancer incidence rates are generally reported asunadjusted (crude) or age-standardized incidencerates (ASIR) per 100,000 population. Unadjusted orcrude rates are not age standardized. Age-standardization involves adjusting the populationage structure of a province, health region orcommunity to the age structure of the 1991
Cancer in New Brunswick Communities: Investigating the environmental connection Part 26
StudyMethods

pollutants were obtained from Environment Canada’sNational Pollutant Release Inventory and fromsummaries prepared by PollutionWatch which isunder the auspices of Environmental Defense andthe Canadian Environmental Law Association(Appendix A). Information on air quality wasobtained from the province’s annual air qualitymonitoring reports.
Study AreasFourteen urban and rural areas were selected for thisstudy. They include the cities of Saint John (01006), Moncton (07 022), Fredericton (10 032),Miramichi (09 050), Bathurst, C (15 011) andEdmundston, C (13 027) and the towns of Caraquet(15 028) and Dalhousie (14 017). (The number inbrackets indicates Statistic Canada’s CDS code for thecommunity/area.) The city of Miramichi was createdin 1992 when the towns and/or villages of Chatham(1309008), Loggieville (1309007), Nelson-Miramichi(1309015), Newcastle (1309032) and Douglastown(1309033) were amalgamated. In 1998, Edmundstonbecame a city when it amalgamated with thevillages of Verret (1313030), Saint-Jacques(1313026) and Saint-Basile (1313019). The cancercounts obtained for this study (1989-2005) includethe counts for the town and villages added to theamalgamated cities.
Each of the six rural areas in this study encompassesseveral villages and parishes. These are: Drummond-Denmark area (Drummond parish 12 021, Drummondvillage 12 023, Denmark parish 12 014 and GrandFalls parish 12 016); Minto area (Canning parish 04021 and the village of Minto 04 022); BaseGagetown area which excludes the town of Oromocto(Gagetown village 04 005, Gagetown parish 04 004,Burton parish 03 011, Blissville parish 03 001;Petersville parish 04 001, Hampstead parish 04 006);Upper Miramichi area (Blackville village 09 018,Blackville parish 09 019, Blissfield parish 09 021,
between 1989 and 2005 were obtained from the NewBrunswick Cancer Registry Database for 14 urban andrural areas. The average population for four censusperiods (1991, 1996, 2001 and 2005) in each of the14 study areas was used to calculate cancerincidence rates per 100,000 population (1989-2005). The population in each of the 14 study areasvaried an average of ± 6% over a 17-year period. Itwas not possible to calculate incidence rates for all14 cancer types for all study areas due to low cancercounts for some cancers types (e.g. less than sixrecorded between 1989 and 2005). Provincial cancercounts for the same cancer types and time periodwere obtained from the NB Cancer Registry Databaseand the Statistics Canada Cancer Registry Database.
Across Canada, lifestyle factors (e.g. smoking,alcohol consumption, physical inactivity, diet, etc)associated with some diseases and cancer types arenot reported at the community level or censussubdivision level, with one exception. StatisticsCanada does report some risk factor data for selectedcensus metropolitan areas (CMAs) in Canada. Somerisk factor data are reported at the health regionlevel within provinces as well as at the provinciallevel.
The lack of data at the community-level made itimpossible to assess the role smoking and otherlifestyle risk factors may have played in cancerincidence rates for each study area. Scientific studieson lifestyle and other risk factors linked to eachcancer type in this study were reviewed.
A wide range of social and economic indicators (e.g.population, income, unemployment rates, education,composition of the labour force) were compiled foreach study area for 1991, 1996, 2001 and 2006(Appendix A). The source of the data was StatisticsCanada’s community profile database.
Data on the source and release of industrial
Cancer in New Brunswick Communities: Investigating the environmental connection Part 2 7

Doaktown village 09 022 and Ludlow parish 09 024),the Harvey area (Harvey village 10 005 and MannersSettlement parish 10 004) and the Belledune area(Belledune 14 025 and Pointe-Verte village 15 013).Belledune (14 025) is the result of an amalgamationthat took place in 1995 when the village of JacquetRiver (14002) and surrounding local service districtswere amalgamated with what was then the village ofBelledune (15034). The cancer counts for theBelledune area included cancer counts for bothvillages, as well as the village of Pointe-Verte. A mapof the study areas appears on page 9.
Cancer in New Brunswick Communities: Investigating the environmental connection Part 28

Cancer in New Brunswick Communities: Investigating the environmental connection Part 2 9
HarveyArea
Bathurst
Caraquet
Edmundston
BelleduneArea
Dalhousie
Base Gagetown Area
Miramichi
MintoArea
Moncton
Fredericton
Saint John
Upper Miramichi Area
DrummondDenmark Area
Statistics Canada’s Census Subdivisions for New Brunswick:FourteenUrban and Rural Study Areas

Economic and Environmental Overview of Study Areasmined from Brunswick No.12 since the early 1960s.Zinc ore concentrates were shipped via rail toDalhousie and stored in open piles on the townwharf. The concentrates, which also containedarsenic, lead and cadmium, were shipped to Belgiumfor smelting. The practice of transporting andstoring zinc concentrates at Dalhousie ceased in1997. Lead, a significant component of the oremined in Brunswick No.12 was sent to Belledune forsmelting. The Belledune smelter began operating in1967. Shortly thereafter, acid, fertilizer and gypsumplants were added to the smelter complex. Ten yearsago the smelter added a battery recycling operation.The acid, fertilizer and gypsum plants closed inrecent years and recycling has become a moresignificant component of the smelter’s operation. Bythe 1980s, New Brunswick’s northern shore, betweenBathurst and Dalhousie, would be identified as oneof the most contaminated areas in Atlantic Canada.4
Over the past 40 years, hundreds of federal andprovincial government reports, studies andenvironmental assessments have documentedcontamination of air, water, soil, fish, wildlifeand/or vegetation in Saint John, Belledune,Miramichi, Bathurst and Dalhousie.5 Human healthrisk assessments have been done in severalcommunities over the past 10 years as part ofproposed industrial expansion, development orremediation projects. They concluded that currentlevels of benzene and aldehydes in Saint John,arsenic in Dalhousie and lead, benzo-a-pyrene,cadmium and arsenic levels in Belledune posedcancer and non-cancer health risks to residents
Historically, and to this day, agriculture andnatural resource extraction - forestry, miningand fishing - have been the staples of New
Brunswick’s economic development. Secondaryindustries have developed from these activitiesincluding pulp and paper production, base-metalsmelting and seafood and food processing. Tertiaryindustries that provide services (e.g. powergeneration, transportation, port development) to thesecondary industries have also evolved over time.Table 1 is a summary of the major economicactivities (1989-2005) in the 14 urban and ruralareas in this study.
Until recently, Dalhousie, Edmundston, Saint John,Bathurst and Miramichi had pulp and/or paper millsand other wood-products manufacturing operations.The Miramichi kraft paper mill was the largest mill ofits kind in Canada. Beginning in 2006, pulp and papermills in Dalhousie, Miramichi and Bathurst began toclose. Sawmills still operate in some of thesecommunities and only the pulp and paper mills inEdmundston and Saint John are still in operation.
Dalhousie was also the site of a chlor-alkali chemicalmanufacturing plant. It produced chlorine andcaustic soda for the pulp and paper industry using amercury-based process. Between 1973 and 1989,total mercury emissions (to air and water) werereduced from 2,100 kilograms per year (kg/yr) to40 kg/yr.3 It was the last facility of its kind inCanada and it closed in 2008.
One of the world’s largest deposit of zinc is located21 kilometres southwest of Bathurst. It has been
10 Cancer in New Brunswick Communities: Investigating the environmental connection Part 2

Fishin
g and fish
proces
sing
Transp
ortati
on
Manufa
cturin
g
Pulp
and/o
r pap
er
produ
ction
Metalm
ining
Urban/Rural Area
Table 1. Major economic activities in 14 urban and rural areas in New Brunswick (1989-2005)1
Wood pro
ducts
manufa
cturin
g
(plyw
ood,s
trand
board
, lumbe
r)
Oilref
ining
and
associ
ated ind
ustrie
s
Sawmills
/
wood ha
rvesti
ng
Port d
evelop
ment
Smelt
ing
1 Sources: Statistics Canada Community Profile data for 1991, 1996, 2001 and 2006, Environment Canada’s National Pollutant ReleaseInventory and New Brunswick’s Department of Environment Registry of Operating Approvals.
Fossil
fuel po
wer
gene
rating
statio
ns
Agricu
lture
Coalm
ining
Chem
icalm
anufa
cturin
g
Caraquet, along with Shippagan and Lamèque arethe three most important fishing ports and seafoodprocessing communities on the Acadian Peninsula.
The Drummond-Denmark area (Victoria county) aswell as adjacent Carleton county, in northwesternNew Brunswick are part of the province’s largepotato-growing region. Employment in this ruralarea is primarily linked to farming, forest harvestingand the transportation sectors (Appendix A). Duringthe late 1970’s and 1980’s, several provinciallysponsored studies and task forces examinedassociations between agricultural and forestrypesticide use and human health in New Brunswick.The 1983 Hatcher task force on chemicals in theenvironment and human reproductive problemsfound birth defects (neural tube defects, facial clefts
above provincial health guidelines.6 No health riskassessments have been done in Edmundston,Bathurst, Miramichi or the Minto area.
During the mid 1800’s, the fisheries in NewBrunswick were described in superlatives. Cod,herring, pollock, haddock and mackerel dominatedthe coastal fisheries and salmon in the Saint John,Restigouche and Miramichi Rivers were described as“prodigious”.7 Shellfish such as oyster, clams,mussels, whelks, crabs and shrimp were alsoabundant. Today, the fishery has changed. Where itwas once dominated by cod and herring, the fisheryis now primarily lobster, shrimp and crab and it isnow largely confined to the outer Bay of Fundy andthe Acadian Peninsula. Fish and shellfish aquacultureoperations have increased in number and scale.
Cancer in New Brunswick Communities: Investigating the environmental connection Part 2 11
Saint John
Moncton
Miramichi
Caraquet
Bathurst
Dalhousie
Edmundston
Fredericton
Minto Area
Harvey Area
Base Gagetown Area
Upper Miramichi Area
Belledune Area
Drummond-Denmark Area

1992. There was only one year, 1959, where sprayingdid not occur. Between 1952 and 1990, 100,000 mtof DDT and fenitrothion were applied to NewBrunswick’s forests.12
In 1982, a provincial task force was convened toexamine the relationship between aerial spraying offenitrothion in New Brunswick and cancer incidence.The Spitzer task force determined that, between 1972and 1981, Northumberland county had the highestfrequency of exposure to fenitrothion followed byVictoria, Madawaska and Restigouche counties.13
Fentirothion use in 1976, considered to be the year ofmost extensive forest spraying, was estimated at800 mt. The task force concluded that stomach,uterine and lymphatic system (other than leukemia)cancers were highest in counties with above averagespraying of forest pesticides (Northumberland,Victoria, and Restigouche counties).14
When the task force compared cancer rates betweenNew Brunswick and Nova Scotia where aerial sprayingwas not done at the time, cancer incidence rates(1969-78) were significantly higher in New Brunswickfor 11 cancers in males (lip, stomach, nose, skin,breast, prostate, brain, lymphosarcoma, Hodgkin’sdisease and other leukemias) and 11 cancers infemales (mouth, pancreas, multiple myeloma,connective tissues, melanoma (and other skincancers), bladder, nervous system, endocrine glandsand other leukemias).15
The task force made several recommendationsincluding further epidemiological case-control studies.It also recommended maintaining the exposure data-base developed by the task force to permit futureefficient surveillance of the health effects andenvironmental impacts of pesticides used in forestmanagement and agriculture. However, no additionalhealth studies or risk assessments have been done inareas of intensive forest and agricultural pesticide usein New Brunswick.
and incomplete kidney development [bilateral renalagenesis]) and still births were higher in Carlton andVictoria counties than in other counties in NewBrunswick.8 The study suggested these reproductiveproblems could be attributed to agriculturalchemicals without specifying which chemicals (e.g.nitrates and/or pesticides) were responsible. Highnitrate concentrations in drinking water have beenassociated with reproductive effects (specificallyneural tube defects and still births) as well as withspecific cancers (e.g. bladder, kidney, uterine, andnon-Hodgkin’s lymphoma).9
Two years after the Hatcher report was published, aconsultant for the provincial health departmentfound 18% of wells sampled in Carleton County hadnitrate levels as high as 30% above Canadiandrinking water guidelines.10 (Wells in Victoria countywere not sampled.) All the wells in the study areahad various levels of ethylene thiourea, a breakdownproduct of the pesticide mancozeb. No drinkingwater guidelines existed for this compound. Nofollow-up epidemiological studies or health riskassessments were done to examine possible healtheffects of exposure to agricultural pesticides ornitrates in drinking water in Carlton or Victoriacounties.
The Upper Miramichi area in Northumberland countyis an area of approximately 3000 square kilometresand includes the villages of Blackville and Doaktown.This rural area has relied almost exclusively onforest-related activities, primarily wood (spruce)harvesting, processing (sawmills) andtransportation. The area was also part of the longestand most extensive aerial pesticide spray program tocontrol spruce budworm in the world.11 Sprayingbegan in 1952 with DDT. In 1965, fenitrothion (anorganophosphate insecticide) replaced DDT and,from 1975 to 1985, a carbamate insecticide wasused. The spruce budworm spray program ended in
Cancer in New Brunswick Communities: Investigating the environmental connection Part 212

herbicide products were used. Conservatively, thequantity of five herbicides (Agent Orange, AgentPurple, Agent White, picloram, andhexachlorobenzene) used in the spray program hasbeen estimated at 1.4 million litres of chemicals insolution and an addition 1 million kilograms of drychemicals. In the 50-year history of spraying at theBase, there were only six years where no herbicideswere used. Military and non-military personnel wereinvolved in various aspects of the spraying includingmixing and loading herbicides, flagging and post-application bush clearing.20
In 2005, the federal government ordered severalstudies to investigate the extent and potentialhealth effects from the use of herbicides used at CFBGagetown from 1952 to 2003. The epidemiologicalstudy encompassed a large geographic area. Itincluded 35 towns, villages and parishes around theBase including the city of Fredericton and the parishof Queensbury to the west Fredericton. The studyextended south to the village and parish of Westfieldadjacent to the city of Saint John and to parishesnorthwest of Sussex (e.g. Brunswick parish). Thecontrol or reference population for the study was theprovince of New Brunswick.
The study concluded that specific populations wereat possible risk. These included individuals directlyinvolved in herbicide applications, post-applicationbrush clearing, family members of individualsinvolved in spraying through take-home or track-inpathways and bystanders when spraying occurred.21
The study reviewed the available scientific literatureand found there was sufficient or suggestiveevidence to make positive associations betweensome herbicide exposures (e.g. chlorophenoxy,pentachlorophenol, glyphosate andhexachlorobenzene) and various cancers (e.g. softtissue sarcoma, non-Hodgkin’s lymphoma, laryngeal,multiple myeloma, rectal, breast, prostate and
Like the Drummond-Denmark and Upper Miramichiareas, the Harvey and Base Gagetown areas are ruralregions. There are no large-scale industrial ormanufacturing operations in these areas. Economicactivity is currently based on agricultural andforestry-related activities (wood harvesting andsawmills). Employment in these rural areas iscentered around the transportation sector ratherthan manufacturing, utilities or trades (Appendix A).Antimony mining took place (on and off) in theHarvey area from the late 1890s to 1996. Antimonyis used in the manufacture of flame retardants usedin plastics, vinyls and synthetic fibres and as analloy in lead that is used for making automotivebatteries; the addition of antimony increases thestrength and hardness of the lead.16 The Harvey areais also known to have naturally high levels ofarsenic, radon and uranium in drinking water andradon gas in homes.17 Radon is an establishedhuman lung carcinogen and viewed as a secondleading risk factor for lung cancer after smoking.18
No health studies or risk assessments have beendone in the Harvey area.
The Base Gagetown area is so named because itencompasses Canadian Forces Base (CFB) Gagetown.(The town of Oromocto, headquarters for the Base’smilitary personnel, was not part of this study.) Themilitary base covers an area of 110,000 hectares(1100 square kilometres) and provides employmentfor residents living around the Base.
Since 1956, a wide-range of herbicides (e.g. 2,4-Dand 2,4,5-T, known as Agents Orange and Purple;chlorophenoxy, hexachlorobenzene, picloram andparaquat; tebuthiuron; tichlopyr; pentachlorophenol;trichlorbenzoic acid, and glyphosate known as Visonor RoundUp) were applied to an estimated 30,000hectares reserved for military training.19 Pesticideswere applied through ground and aerial sprayingBetween 1956 and 2004, a total of 37 different
Cancer in New Brunswick Communities: Investigating the environmental connection Part 2 13

testicular) as well as other diseases (e.g. spinabifida, spontaneous abortions, Parkinson’s disease,and Type 2 diabetes).22
Dalhousie, Saint John and the Belludune and Mintoareas have provincially-owned fossil-fuel powergenerating stations. (Saint John is also the site ofCanada’s largest oil refinery.) The Dalhousie facilitybegan by burning coal, then a bitumen-water slurrycalled orimulsion and now burns heavy fuel oil. TheBelledune power station burns a mixture of coal andpetroleum coke. The Saint John power station(Coleson Cove) burned heavy fuel oil until 2004 andnow burns a mixture of heavy oil and petroleumcoke. Historically the Minto, Belledune andDalhousie facilities burned locally mined andimported coal.
The Minto-area facility, known as the Grand Lakestation, burns locally-mined coal from the province’sonly coal mine. Minto coal is classified as soft orbituminous coal. Bituminous coal has the highestcontent of volatile compounds, including sulphur, ofall coal types, as well as arsenic and other metals.23
In the Minto area, high levels of arsenic have beenreported in groundwater and/or drinking water, soil,fish and in the sediments and water of Grand Lake.24
A 2003 community health assessment of the villagesof Minto, Chipman and the parishes of Canning,Chipman, Northfield and Sheffield reported themortality rates for men and women due to cancerand heart and respiratory diseases were higher thanthe provincial average.25 In September 2009, theprovincial government announced it would close theGrand Lake power station and the coal mine.
Cancer in New Brunswick Communities: Investigating the environmental connection Part 214

Cancer incidence rates and their major risk factors(1989–2005) were 98.2 and 43.9 respectively.27 TheNew Brunswick Department of Health reportedunadjusted incidence rates (1997-2001) of 97.4 andA summary of the cancer counts and incidence
rates for each cancer type in each study areaand the province appears in Appendix B.
Where cancer counts were below six,data was suppressed by the healthdepartment and, therefore, cancerincidence rates could not be calculatedfor some cancer types.
As identified in previous studies andreports, prostate, breast, lung andcolorectal cancers are the dominantcancers among New Brunswickers andCanadians in general, and rates of thesecancers vary for males and females.26
The following section discusses theresults, compares rates in the studyareas with provincial rates where datais available and examines the major riskfactors associated with each cancertype.
Lung CancerThe provincial unadjusted incidencerates of lung cancer (1989-2005) per100,000 population were 97.2 for malesand 52.6 for females. These rates aregenerally consistent with the averageage-standardized incidence rates(ASIRs) per 100,000 population for NewBrunswick for the same time period.Based on Statistics Canada data, theaverage ASIRs for lung cancer for NewBrunswick males and females
Cancer in New Brunswick Communities: Investigating the environmental connection Part 2 15
EFGH&EHGI& JEGJ&
KFGE&
KLGM& FNGL& FHGH&IKGO& IHGE&
NEGJ&
NIGM&MIGJ&
MMGI&
(
$(,
*(,
"(,
&(,
+((,
+$(,
:">.()&HG&:)2*,)/&D.#>&@*#3)(&P*$)/&QOEJEBHLLIR&&.#*6S./$)6&"#3"6)#3)&(*$)/&<)(&OLLTLLL&<%<.,*$"%#&
U(%8"#3)&IHGF&
FIGU
RE 2
183.4
146.8 145.4 142.3 139.9
118.7 116.1 114.1 110.1 98.5 97.1 88.6 88.0
75.9
0
20
40
60
80
100
120
140
160
180
200!"#$%&'()*+,-)183
140
160
180
2003.4
146 8146.8 145.4 142.3 139.9
118 7
!"#$%&'()*+,-)
0
20
40
60
80
100
120
140110.1
118.7 116.1 114.1 110.1 98.5 .5 97.1 88.6 88.0
75.9
FIGU
RE 1 Male Lung Cancer Rates (1989-2005)unadjusted incidence rates per 100,000 population
Female Lung Cancer Rates (1989-2005)unadjusted incidence rates per 100,000 population
New Brunswick 97.2
New Brunswick 52.6

16
rates for females.
Statistics Canada, as part of its Canadian CommunityHealth Survey initiated in 2000/2001, beganreporting smoking and other factors affecting health(e.g. physical activity, alcohol consumption, bodymass index, etc.) by health region and censusmetropolitan areas (CMAs). The only CMA identifiedin New Brunswick between 2000/2001-2005 was theSaint John CMA.
Table 2 summarizes Statistics Canada CommunityHealth Survey results for the percentage of daily oroccasional smokers aged 12 and over in NewBrunswick between 2000/2001 and 2005 by provinceand health regions. Data identified with an ‘e’ needsto be interpreted with caution because thecoefficient of variation around the mean is high(16.6% to 33.3%).30 Although the data is somewhatunreliable for some health regions and does notprovide a direct measure of the smoking rates in theurban and rural areas in this study, it does providesome insight into the variation in smoking rateswithin the province.
Within New Brunswick, males in Health Region 4 and5 had the highest smoking rates in the provincebetween 2000/2001 and 2005. Health Regions 4 and5 include the communities of Edmundston andDalhousie and portions of the rural areas ofBelledune and Drummond-Denmark. Among males,there appears to be some correlation between highersmoking rates in health regions and higher rates oflung cancer in some study areas (e.g. Dalhousie andEdmundston which are in Health Region 5 and 4respectively) although not for other areas (e.g.Minto area and Saint John which are in HealthRegion 2 and 3 respectively).
Among females, there appears to be less variabilityin smoking rates among the health regions and anycorrelations between high smoking and high lung
56.2 for males and females respectively.28
Lung cancer rates among males and females in theMinto area were almost twice the provincial rate(Figure 1 and 2). Dalhousie and Saint John malesand females had the second and third highest ratesof lung cancer. Cancer rates among Dalhousie andSaint John males were 50% higher than theprovincial rate. Among females, Dalhousie and SaintJohn rates were 76% and 71% higher than theprovincial unadjusted rate.
Males in Edmundston and the Belledune area alsohad rates of lung cancer significantly higher (44%and 42% respectively) than the provincial rate.Among females, Miramichi and Bathurst had ratessignificantly higher (46% and 34% respectively)than the provincial rate.
A direct comparison between cancer rates calculatedfor Moncton, Fredericton and Saint John in thisstudy can not be made with those calculated in aprevious study (unadjusted versus age-standardizedrates). However, this study confirmed the finding ofthe previous study. Lung cancer rates for men andwomen in Saint John are significantly higher thanrates in Moncton and Fredericton.
Lung Cancer Risk FactorsSmokingSmoking is a leading risk factor for lung cancerfollowed by occupational exposure and outdoor (andincreasingly indoor) air pollution. Smoking ratesamong New Brunswickers have dropped significantlysince the 1960s as they have for all Canadians(Figure 3, page 18). Smoking rates among NewBrunswick males have not been significantlydifferent from national rates since the mid 1990’s.29
For females, smoking rates briefly rose above thenational rate in the mid-1990s, and by 2000/2001smoking rates had dropped to meet the national
Cancer in New Brunswick Communities: Investigating the environmental connection Part 2

Geography
Canada
Province
Health Region 1(encompasses many communities includingMoncton,Dieppe,Sackville, Shediac,Bouctouche Richibucto)
Health Region 2(encompasses many communities including Rothesay,Quispamsis,Saint John, Sussex, St.George and St.Stephen)
Health Region 3(encompassesmany communities includingFredericton,Oromocto,HarveyArea,MintoArea,Woodstock,BaseGagetownArea andportions of theDrummond-DenmarkArea andUpperMiramichi Area)
Health Region 4(encompasses many communities including Edmundston,Grand Falls, Kedgwick and portions of the Drummond-Denmark Area)
Health Region 5(encompasses many communities including Dalhousie,Charlo,Balmoral, Campbellton,portions of the Belledune Area)
Health Region 6(encompasses many communities including portions of theBelledune Area, Bathurst, Caraquet, Shippagan,Tracadie Sheila)
Health Region 7(encompasses many communities including Tabusintac, Neguac,Miramichi, portions of the Upper Miramichi Area)
Sex 2000/2001 2003 2005 2000 / 2001
-2005 Average
Males 28 25 23.6 25.5
Females 23.8 20.9 19.8 21.5
Males 27.9 26.1 25.2 26.4
Females 24.9 24.6 19.3 22.9
Males 28.4 24.9 24.0 25.8
Females 26.9 24.4 18.5 23.3
Males 24.2 21.2 26.6 24.0
Females 24.7 24.3 20.5 22.5
Males 28.3 29.9 25.3 27.8
Females 25.7 22.3 19.4 22.5
Males 31.2 33.0 27.3e2 30.5e
Females 23.2 28.8 22.2e 24.7e
Males 37.2e 26.8 24.4e 29.5
Females 29.4 26.0 21.6e 25.7e
Males 24.3 26.3 26.3 25.6
Females 23.4 25.0 17.1e 21.8e
Males 33.8 26.8 20.8e 27.1e
Females 24.1 27.3 17.0e 22.8e
Table 2. Percentage of daily or occasional smokers aged 12 and over in New Brunswick (2000/2001-2005)1Communities and areas in bold type indicate urban and rural areas in this study.
1 Statistics Canada. Tables 105-0027, 105-0227, 105-0327. Percent of population who smoked, by age group and sex, householdpopulation aged 12 and over, Canada, provinces, territories, health regions (January 2000 boundaries) and peer groups, CANSIM(database).
2 Data with a coefficient of variation from 16.6% to 33.3% are identified with an (e) and should be interpreted with caution.
Cancer in New Brunswick Communities: Investigating the environmental connection Part 2 17

18
due to respiratory disease and breast cancer wassignificantly higher than the provincial rate forfemales. The study suggested higher smoking ratescould explain the high rates of respiratory diseasesand lung cancer in the area. The study did notexamine the role of occupational exposure or airquality.
Smoking rates nationally, provincially and acrosshealth regions are higher among males than femalesbut the differences are low (2-5%). New Brunswicksmoking rates have not been statistically differentfrom national rates since at least the 1990s,however, lung cancer rates have been significantlyhigher than the national rate (Figure 3).
As demonstrated in the Conservation Council’s firstcancer report, health information measured andreported by large geographic area provides animprecise and misleading reflection of community-level health status. Similarly, any meaningfulassessment of the role of smoking or other lifestylerisk factors in lung (or other) cancer rates amongcommunities must be based on community-leveldata.
Occupational ExposureOccupational exposures play a major role in causinglung cancer, as well as other cancer types.32 Thenumber of cancers attributed to occupationalexposure has increased from estimates of 2-10% in1981 to 15-20% in 2007 because the number ofagents/chemicals considered to be definiteoccupational carcinogens has increased from 16 in1981 to 28 in 2007, with an additional 140chemicals listed as probable or possible industrialcarcinogens.33 The risk for some cancers increaseseven further for workers who smoke.
Researchers at the Boston University School ofPublic Health and the University of Massachusettsrecently published a review of new evidence linking
cancer rates are not immediately apparent. As withmales, the highest rates of smoking among femalesappears to be in Health Region 4 and 5. Accordingto this study, lung cancer rates are highest in theMinto area (Health Region 3) followed by Dalhousie(Health Region 5), Saint John (Health Region 2) andMiramichi (Health Region 7).
A 2003 community health assessment of an areathat encompassed the villages of Minto, Chipmanand the parishes of Canning, Chipman, Northfieldand Sheffield reported that the smoking rate perhousehold (males and females combined) was31.9 %.31 Rates were based on a random selectedsurvey of 678 households in an area with 2435households. The study found that the rate of deathamong males from lung cancer and respiratory andheart diseases was higher than the provincialaverage for males. Among females, the rate of death
0
10
20
30
40
50
60
70
80
0
10
20
30
40
50
60
70
80
!"#"$%&'()*+$%#"#,-#,)-$."/"0"$$
Canada: Lung Cancer Rate (ASIR per 100,000)
New Brunswick: Lung Cancer Rate (ASIR per 100,000)
New Brunswick: Smoking Rate (% daily or occasional smoker)
Canada: Smoking Rate (% daily or occasional smoker)
FIGU
RE 3 Lung Cancer and Smoking rates(both sexes) 1994-2005
Cancer in New Brunswick Communities: Investigating the environmental connection Part 2

19
(29%) and kidney cancer (29%) claims between 1990and 2003.38 In 2007, Ontario amended its policy toinclude these and other (colorectal, ureter andesophageal) cancers as compensable diseases for full-time firefighters.39 In May 2009, the New Brunswickgovernment introduced proposed amendments to theFirefighters’ Compensation Act that would providecoverage to active and retired firefighters who hadserved the required number of years of service andwho had been diagnosed with a specified cancer.
On average, the Minto area has had the highestpercentage of males employed in the manufacturing,processing, utilities, trades and transportation sectorsamong the 14 study areas between 1991 and 2006(Appendix A).40 The power generating station andcoal mining in this area likely contribute to thehigher percentage of males employed in trades suchas welding, electrical, pipefitting and insulation.Males in the Minto area also had the highest rate oflung cancer among the 14 study areas (Figure 1).Fredericton, Moncton and Caraquet had the lowestparticipation rates in these sectors and their rates oflung cancer were among the lowest of the 14 studyareas (Appendix A).
Studies done elsewhere have linked lung and othercancers to occupational exposures associated withcoal mining, pulp and paper mills and metal smelters(Table 3).41 No peer-reviewed epidemiological cancerstudies have been done on coal miners in the Mintoarea, lead smelter workers in the Belledune area orpulp and paper mill workers in Dalhousie, Saint John,Edmundston, Bathurst and Miramichi. Communityhealth studies done in the Minto/Chipman andsurrounding areas (2003) and the Belledune area(2005) did find that mortality and/or incidence ratesof lung cancer were higher among males than rates intheir respective health regions.42 These studies did notexamine the potential link between cancer incidenceand occupation.
occupational, as well as environmental, exposure tovarious cancers.34 Table 3 summarizes the evidencefor occupational exposure to carcinogens.
In Canada, numerous peer-reviewed scientific studieshave examined mortality and incidence rates ofvarious cancers and their link to occupationalexposure in Canada.35 Studies done in BritishColumbia have observed excess risk for all lungcancers for men employed in primary metal andmining industries, machining/welding,transportation, carpentry/wood processing, shipbuilding, agriculture, electrical/utility occupationsand protective services (e.g. military).36 The risks wereassociated with exposure to metals, chlorinatedpesticides and compounds such as PCBs and dioxins,asbestos, radon, wood dust and polyaromatichydrocarbons (PAHs) such as benzene. Theseagents/compounds have been classified ascarcinogens by the International Agency for Researchon Cancer (IARC). Workers who smoked added to theirrisk of lung cancer.
A 2007 Ontario study examined the trends andcharacteristics of compensated occupational cancersin Ontario between 1937-2003. Overall, females madeup a very small proportion of the workers withallowed cancer claims. Of the claims made by males,lung cancers were the most frequently compensatedcancer cases and the cases were associated withworkplace exposure in manufacturing, constructionand mining industries (including coke ovens andsintering plants where ore is roasted). Cancers wereassociated with asbestos, arsenic, benzene and otherPAHs, silica, radon, uranium and nickel exposures.37
Mesothelioma (primarily the result of asbestosexposure) and skin cancer were the second and thirdmost commonly compensated cancers between 1990and 2003. Firefighters made up a significantproportion of brain cancer (86%), non-Hodgkin’slymphoma (83%), bladder cancer (35%), leukemia
Cancer in New Brunswick Communities: Investigating the environmental connection Part 2

metal mining and smelting; coal mining andburning; oil refineries;wood preserving operations
mining; insulation and shipyard workers;
oil and petrochemical industries; transportation;manufacturing of plastics, resins, some types ofrubbers and lubricants
oil refineries; petrochemical industries
metal mining and smelting; electrical workers;battery plant and alloy workers; painters
steel and alloy producers; chrome platingoperations;wood preserving operations
roofing; road paving; aluminum smelting andcoking
laboratory workers; hospital workers; fumigators
plywood and oriented strand boardmanufacturing; appliance, telephone andelectrical control manufacturing
high-voltage equipment operators; nuclearreactors; uranium mining
metal smelting and mining; batterymanufacturing/recyclers
nickel smelters,mixers and roasters; electrolysisworkers
agriculture and forestry workers; landscapers
mining; foundries, brickmaking and sandblasting;solar panel manufacturing
metal machining; print press operations
manufacturing of paint, thinners, adhesives andrubber; oil refineries
carpentry; furniture and cabinetry making
S t r o n g
bladder; lung; skin; soft tissue sarcoma(angiosarcoma of the liver)
lung; laryngeal;mesothelioma
leukemia; non-Hodgkin’s Lymphoma
lung
lung; nasal and nasopharynx
bladder (coal tars); lung; skin
leukemia
bone; brain & CNS; nervous system;breast; leukemia; liver & biliary; lung;multiple myeloma; soft tissue sarcoma;skin; thyroid
lung, nasal and sinuses;
lung
bladder; laryngeal; lung nasal andnasopharynx; rectal; skin; stomach
lung; nasal and nasopharynx
P robab l e and Suspec ted
brain/central nervous system; liver;prostate; soft tissue sarcoma
brain/central nervous system; lung;nasal & nasopharynx;multiple myeloma
leukemia
pancreatic; kidney; prostate
breast
nasal and nasopharynx
bladder; colon; nasal and nasopharynx;ovarian; stomach
brain/central nervous system; lung;kidney; stomach
laryngeal; pancreatic; stomach
brain/ central nervous system, breast;kidney; prostate; lung; leukemia; NHL;colon; Hodgkin’s; multiple myeloma;ovarian; pancreatic; soft tissue sarcoma;stomach; testicular
esophageal; pancreatic; prostate
brain/central nervous system; lung;rectal
laryngeal
10+
4-40
6-14
5-15
3-30
Cancer site and strength of evidence2 LatencyPeriodin years3Carcinogenic Agent
Arsenic
Asbestos
Benzene
Butadiene
Cadmium
Chromium
Creosotes; Coal tars
Ethylene oxide
Formaldehyde
Ionizing radiation
Lead
Nickel
Pesticides
Silica
Straight oils, solubleoils, synthetic andsemi-synthetic fluids
toluene
wood dust
Occupation
1 Source: Adapted from Clapp RW, Jacobs MM and Loechler EL. 2007. Environmental and Occupational Causes of Cancer: NewEvidence, 2005-2007. Prepared for: Cancer Working Group of the Collaborative on Health and the Environment. Lowell Center forSustainable Production. University of Massachusetts. 45 p.2 Strong causal evidence of a link is based primarily on a Group 1 (known carcinogen) designation by the International Agency forResearch on Cancer. Suspected evidence of a link is based on Clapp et al. 2007 assessment of existing epidemiologic studies.3 Source: Adapted from Davis DL. 2007. Secret History of the War on Cancer. Basic Books. New York, NY. p. 258-261.
Table 3. Selected carcinogenic agents and their occupational links with cancer.1
Cancer in New Brunswick Communities: Investigating the environmental connection Part 220

to increase as the particle size decreases. Fineparticles penetrate deeper into the respiratory tractand have a high retention rate (i.e. are not coughedup).
Fine (less than 2.5 microns in diameter) andultrafine (less than 1.0 microns) particulate mattercan include a number of contaminants includingmetals (e.g. arsenic, cadmium, nickel and lead), ions(e.g. nitrates), organic compounds (e.g. dioxins,PAHs, benzene, butadiene), reactive gases (e.g.radon) and material of biologic origin (e.g. wooddust), all of which have been classified as known orprobable carcinogens by the IARC.
Considerable research has been done to determinethe underlying mechanism of how air pollutioncauses cancer. There is a consensus amongresearchers that the cancer-causing effect ofparticulate matter is a combination of DNA repairsuppression and enhancement of DNA replicationerrors.46 The World Health Organization’s workinggroup of experts on the health aspects of airpollution reported in 2003 that there were no safelevels of exposure to fine particulate matter.47
Scientific studies report that each 10 µg/m3
(microgram per cubic meter) increase in fineparticulate pollution (PM2.5) significantly increasedthe risk of cardiopulmonary and lung cancerdeaths.48 After controlling for smoking effects, theincremental increase in risk was found to be as highas 4% for cardiopulmonary diseases and 8% for lungcancer.49 Scientists with the World HealthOrganization (2004) have estimated that an annualaverage PM2.5 concentration of 7.5 µg/m3 is thetheoretical minimum-risk exposure for cancer; levelsabove this value increase the risk of cancer.50 Forcoarse particulate matter (PM10), the annualminimum risk-exposure value was estimated at15 µg/m3.51 The Canada-wide 24-hour air qualitystandard for PM2.5 is 30 µg/m3. There are no Canada-
In 1994, wood dust was recognized by theInternational Agency for Research on Cancer (IARC) asa human carcinogen. Numerous epidemiologicalstudies have associated pulp and paper and otherwood-product industries with higher risks of lung,nasal and sino-nasal cancers as well as other types ofcancer (e.g. pancreas, bladder, kidney and colorectalcancers and Hodgkin’s disease).43 Wood dust can becontaminated with known and potential carcinogens(e.g. arsenic, chlorophenols, formaldehyde, sulfuricacid and chloroform) depending on themanufacturing process.44 Exposure to wood dustcould explain the higher rates of lung cancers amongmales in communities with wood-processingoperations such as those in Dalhousie, Saint John,Edmundston, Bathurst, Miramichi and the UpperMiramichi area.
While occupational exposure could explain thehigher rates of lung cancer among males in theMinto, Belledune, Dalhousie, Saint John,Edmundston, Bathurst and Miramichi areas, fewwomen in these communities and areas areemployed in the manufacturing, processing, utilities,trades and transportation sectors. However, femalesin the Minto area, Dalhousie, Saint John andMiramichi had lung cancer rates more than 40%higher than the provincial rate (Figure 2). Airpollution, another significant risk factor for lungcancer, could explain the higher rates among womenin these communities.
Air PollutionOver the past two decades hundreds of studies havehighlighted the role of airborne particulate matter(dust) in cardiovascular diseases and lung cancer45,two leading causes of death in New Brunswick andCanada. Major sources of particulate matter arevehicle exhaust, industrial smoke, fossil fuelcombustion and waste incinerators. The negativehealth effects of particulate air pollution are known
Cancer in New Brunswick Communities: Investigating the environmental connection Part 2 21

monitoring stations in Saint John record annualaverage PM2.5 levels over 7.5 µg/m3 56, a value theWHO has estimated as being a theoreticallyminimum risk level for cancer. Annual average PM2.5
levels in Edmundston are near the WHO cancer risklevel.
According to Environment Canada’s NationalPollutant Release Inventory (NPRI), 10 of the 14urban and rural areas in this study have facilitiesthat report to the NPRI.57 The NPRI is a databasecontaining information on the annual on-sitereleases of 367 substances and groups of substancesto the air, water and land from industrial sources.Companies are legally obligated to report to theNPRI if they release one or more of the listedsubstances and they employ approximately 10 ormore full-time employees. If a facility or operationis involved in waste or sewage sludge incineration,wood preservation, fuel terminal operations,municipal waste water collection and treatment,stationary combustion equipment or quarrying, areport may be required regardless of the number ofemployees.
The province’s environment department alsostipulates how often facilities must measure andreport pollutant releases from their stacks. Under theprovincial Clean Air Act, facilities are classified basedon their estimated annual emissions of sulphurdioxide and particulate matter. Generally, facilitiesdesignated as Class 2, 3 or 4 test and report theiremissions only when ordered to do so by theprovince. Large Class 1 facilities (e.g. powerstations, pulp mills and smelters) continuouslymonitor carbon dioxide, nitrogen oxides and sulphurdioxide and, depending on the facility, totalsuspended particulates (TSPs). Class 1 facilities mustmeasure other pollutants (e.g. metals, volatileorganic compounds (VOCs) and coarse and fineparticulates - PM2.5 and PM10) once a year usingmethods prescribed by the provincial environment
wide or provincial monthly or annual averagestandards for PM2.5 or PM10.
Since 1999, the New Brunswick Department ofEnvironment has been monitoring PM2.5 at severalsites around the province. Monitoring methods (e.g.dichotomous sampler, tapered element oscillatingmicrobalance (TOEM), and beta attenuation method(BAM)) have changed and are not consistent withinand between communities. For example, the BAMcontinuous sampler gives consistently higher PM2.5
results than the TOEM system.52
TOEM monitors are located in Saint John (ForestHill), Fredericton (Aberdeen Street), Edmundston(near Fraser paper mill), Bathurst (Rough WatersDrive), Moncton (Highfield Street) and St. Andrews(Brandy Cove Road). BAM monitors are located inSaint John (five sites), Canterbury (southwest ofNackawic) and Miramichi (two sites near the formerWeyhaeuser oriented-strandboard mill).
Differences in monitoring methods make it difficultto compare long-term trends within and betweencommunities. The provincial department ofenvironment has compared average one-hour PM2.5
monitoring (TOEM) results for Saint John (Forest HillBAM monitor), Fredericton, Moncton, St. Andrews,Edmundston and Bathurst between 2001 and 2007.Saint John and Edmundston consistently had higherPM2.5 levels.
53
Annual provincial air quality monitoring reportsindicate that, depending on monitor location andtype, stations in Saint John, Canterbury,Edmundston and Miramichi have all recordedviolations of the province’s 24-hour air qualitystandard for PM2.5 (2001-2007).
54 Annual averagePM10 levels measured in Saint John (provincialbuilding location) consistently and significantlyexceeded (1984-2000) the estimated PM10 cancerrisk level estimated by the WHO (15 µg/m3).55 Some
Cancer in New Brunswick Communities: Investigating the environmental connection Part 222

chemicals are a common set of carcinogensconsistently reported to the NPRI during 1995-2005and supplementary chemicals are all othercarcinogens that are reported. Miramichi has had thehighest amount of carcinogens released into the air,
department. The results of a stack test (usually doneover a three-day period) are the basis on which afacility estimates its total annual emission ofpollutants. Methods for estimating pollutant releasesbased on stack tests have varied over time.
In 2005, Saint John hadthe most facilities (23)reporting to the NPRIfollowed by Moncton (8)and Miramichi (4).Fredericton, Dalhousie,Bathurst and Edmundstoneach had three facilitiesand the Belledune, UpperMiramichi and Minto areashad two each. Saint Johnhad the highest annualPM2.5 releases fromindustrial sources between2002-2006 (Figure 4).(Data prior to 2002 is notavailable, as reporting ofPM2.5 releases to the NPRIwas not required.) Miramchiranked second and wasfollowed by Dalhousie,Edmundston andBelledune.
Fine particulates can becontaminated withcarcinogens, making the“dust” a more potentcarcinogen. Figure 5illustrates the total releaseof carcinogens (corechemicals andsupplementary chemicals)to the atmosphere fromfacilities in this study. Core
0
200
400
600
800
1000
1200
Sain
tJoh
n
Fred
eric
ton
Mon
cton
Dalh
ousi
e
Mira
mic
hi
Bath
urst
Cara
quet
Edm
unds
ton
Belle
dune
Area
Uppe
rMira
mic
hiAr
ea
Min
toAr
ea
Drum
mon
d-De
nmar
kAr
ea
Base
Gage
tow
nAr
ea
Harv
eyAr
ea
2002
2003
2004
2005
2006
!
!"#"$%&'()*+$,-./(&-0*-#$1"-"2"$3"#/&-"4$5&44'#"-#$6*4*"7*$8-.*-#&(9$
:/;<*($=>>?$."4'*7$/-$)&00'-/#/*7$@/#<$"-$"7#*(/7A$BCD$$(*E4*)#$)<"-;*7$3F$5&@*($0"2*$/-$#<*/($0*#<&27$E&($*7#/0"#/-;$7#")A$(*4*"7*7$E(&0$#<*/($G&@*($;*-*("#/-;$$
7#"#/&-7H$
!
FIGU
RE 4
0
50000
100000
150000
200000
250000
Sai
ntJo
hn
Fre
der
icto
n
Mo
ncto
n
Dal
hous
ie
Mir
amic
hi
Bat
hurs
t
Car
aque
t
Ed
mun
dst
on
Bel
led
une
Are
a
Up
per
Mir
amic
hiA
rea
Min
toA
rea
Dru
mm
ond
-Den
mar
kA
rea
Bas
eG
aget
ow
nA
rea
Har
vey
Are
a1995
1996
1997
1998
1999
2000
2001
2002
2003
2004
2005
2006
!"#"$%&'()*+$,-./(&-0*-#$1"-"2"$3"#/&-"4$5&44'#"-#$6*4*"7*$8-.*-#&(9$$
!
: 6*4*"7*7$".*(";*2$$<=>$?;$@<AABC<AADE$
Annual air releases (in kilograms) of carcinogens from industrialsources in 14 urban and rural areas in New Brunswick (1995-2006)FI
GURE 5
Annual fine particulates (PM2.5 released in metric tonnes from industrial sourcesin 14 urban and rural areas in New Brunswick (2002-2006)
Cancer in New Brunswick Communities: Investigating the environmental connection Part 2 23

Colorectal CancerThe provincial unadjusted incidence rate ofcolorectal cancer per 100,000 population (1989-2005) was 62.5 for males and 56.2 for females.These rates are consistent with the ASIRs per100,000 population for New Brunswick for the sametime period. Based on Statistics Canada data, theaverage ASIRs for colorectal cancer among NewBrunswick males and females (1989-2005) were 62.5and 44.2 respectively.59 The New Brunswick
primarily formaldehyde from a mill producingoriented strandboard. It was followed by Saint John,Edmundston, Bathurst, Belledune and Dalhousie.With the exception of Belledune, all communitieshad pulp and paper mills. As of 2009, most of thesemills have closed except for those in Saint John andEdmundston.
The 2005 spike in carcinogen releases in Dalhousiewas associated with the NB Power generating stationand related to higher reported releases of nickel. (Fineparticulates from the facility were alsosignificantly higher in 2005.) In bothinstances, companies cited changes inmethods for estimating releases asthe reason for difference between2005 and 2006.58Higher carcinogensreported in Edmundston in 2006 wererelated to significantly higherchloroform releases in that year fromthe Fraser pulp and paper mill.
The high volume of fine particulatesand carcinogen releases fromindustries and long-term exposure toair pollution levels above minimumrisk-exposure levels suggest that airquality could be a leading lung cancerrisk factor for males and females inDalhousie, Minto and Saint John.These areas have significantly higherrates (> 50%) of lung cancer than theprovince as a whole and other areasexamined in this study. Detailed case-control population studies would berequired to more accurately assess therole smoking, occupation and airquality play in the high rates of lungcancer in these communities.
DDEF&
GHEI& GFEI& GIEJ&
KLEI& KIEK& KIEM& JGEK& JKEM& JJEI& JLEI&HJEK&
MGED& MHEG&
+
#+,
)+,
'+,
$+,
&++,
&#+,
N)C&0(1#2C".@&&HJEF&
&#+,+
#+,
)+,
'+,
$+,
&++,
&#+,
DDEF&
+
GHEI& GFEI& GIEJ&
+
+
+
+
+
KLEI&
J
KLEI& KIEK& KIEM& JGEK&K JKEM& JJEI& JLEI&HJEK&
N)C&0(1#2C".@&&HJEF&
K
MGED& MHEG&
2C".@&&HJEF&
++
Female Colorectal Cancer Rates (1989-2005)unadjusted incidence rates per 100,000 populationFI
GURE 7
120.4
102.6
86.9 82.6 79.5 77.6 77.4 77.0 76.6 71.2 69.4
51.5 50.1 45.2
0
20
40
60
80
100
120
140
New Brunswick 62.5
140120.4
40
102.6
86.9
60
80
100
120
140
82.6 79.5 77.6 77.4 777.0 76.6 71.2 69.4
51
New Brunswick 62.5
1.5 50.1 45.2
swick 62.5
0
20
FIGU
RE 6 Male Colorectal Cancer Rates (1989-2005)unadjusted incidence rates per 100,000 population
Cancer in New Brunswick Communities: Investigating the environmental connection Part 224

provincial rates. Rates among women in Saint Johnand Dalhousie were more than 25% higher than theprovincial rate. Caraquet and the Drummond-Denmark and Base Gagetown areas were at or belowthe provincial rate.
Colorectal Cancer Risk FactorsLike most cancers, a very small percentage (3%) ofcolorectal cancer cases have been linked to geneticsyndromes, specifically familial adenomatouspolyposis and hereditary nonpolyposis coloncancer.61 A family history of colorectal cancer infirst-degree relatives has been estimated to occur in12-15% of colon cancer cases.62 Since geneticfactors play such a small role in colorectal cancer,the contribution of shared family lifestyle and
Department of Health reported ASIRs (1999-2003) of62.9 and 45.6 for males and females respectively.60
Males in Dalhousie had almost twice the provincialrate of colorectal cancer and the rate in the Mintoarea was 64% above the provincial rate (Figure 6).Rates in the Harvey area, Edmundston and SaintJohn were more than 25% above the provincial rate.Rates in Caraquet, Base Gagetown and theDrummond-Denmark areas were below the provincialrate for males.
Among females, colorectal cancer rates in the Mintoarea were 77% above the provincial rate and the ratein the Upper Miramichi area was 51% higher thanthe provincial rate (Figure 7). Rates in Bathurst andthe Belledune area were 46% and 45% higher than
Cancer in New Brunswick Communities: Investigating the environmental connection Part 2 25
Cancer Type High-income countries Low-income countries Worldwide
colon and rectum
overweight/obesity - 14%physical inactivity - 14%
low fruit/ vegetable intake - 1%
overweight/obesity - 9%physical inactivity - 15%
low fruit/vegetable intake - 2%
overweight/obesity - 11%physical inactivity - 15%
low fruit/vegetable intake - 2%
breastalcohol - 9%
overweight and obesity - 13%physical inactivity - 9%
alcohol - 4%overweight and obesity - 7%physical inactivity - 10%
alcohol - 5%overweight and obesity - 9%
physical inactivity - 10%
bladder smoking - 41% smoking - 21% smoking - 28%
pancreatic smoking - 33% smoking - 15% smoking - 28%
leukemia smoking - 17% smoking - 6% smoking -9%
all cancers
alcohol - 4%smoking - 29%
low fruit/ vegetable intake - 3%overweight and obesity -3%
physical inactivity - 2%
alcohol - 5%smoking - 18%
low fruit/vegetable intake - 6%overweight and obesity - 1%
physical inactivity - 2%
alcohol - 5%smoking - 21%
low fruit/vegetable intake - 5%overweight and obesity - 2%
physical inactivity - 2%
Table 4. Population attributable fractions (PAF)* for selected cancers and risk factors.1
* The World Health Organization has developed a methodology for quantifying the effects of selected risk factors on cancer incidenceand mortality in a population, otherwise known as the population attributable fraction (PAF).1 Source: Danaei et al. 2005. Causes of cancer in the world: comparative risk assessment of nine behavioural and environmental riskfactors. Lancet 366:1784-93.

stream and increase the risk of cancer.69
Cancers of the colon and rectum have also beenassociated with occupational and environmentalexposures to pesticides, dyes, metals, PCBs, metals,metal-working fluids (e.g. straight, soluble andsynthetic oils).70
Provincial-level data for potential diet and lifestylefactors associated with colorectal (or other cancers)are very limited. According to Statistics Canada datafor 1994/95 to 2005, New Brunswickers had lowerphysical activity and higher obesity rates than thenational average rates.71 If these factors represent keyrisks for colorectal cancer, New Brunswickers shouldhave higher rates of colorectal cancer. In fact,colorectal cancer rates among New Brunswickers aresimilar to national rates (Figure 8).72
Comparable long-term community-level data on thelifestyle risk factors associated with colorectalcancer (e.g. physical inactivity, poor diet, smoking)are not available for New Brunswick communitiesand therefore risk factor comparisons amongcommunities were not possible in this study.
environmental risk factors are key to understandingthe incidence of colorectal (and other) cancers.
A wide range of diet and lifestyle factors (e.g.excessive fat consumption, high meat - low fibreintake, obesity, lack of physical activity, smokingand alcohol consumption) have been identified aspotential risks for colorectal cancer.63 Physicalinactivity and so-called ’white collar’ or sedentaryjobs have been frequently (although not consistentlyor conclusively) linked to increased risk of colorectalcancer.64 Similarly, the evidence for high dietaryintake of red meat, low fruit and vegetableconsumption and obesity as colorectal risk factors ismixed.65 A 2005 international study used methodsdeveloped by the World Health Organization toestimate the percentage of different risk factors,primarily lifestyle factors, that could be attributedto 12 different cancers in seven World Bank regions.The study estimated that, for high-income countries,obesity, inactivity and low fruit and vegetableconsumption account for 29% of cancers of thecolon and rectum (Table 4).
An increasing number of researchers believe that fatand red meat per se are not carcinogens butrather the process of cooking meat at hightemperatures forms carcinogeniccompounds such as N-nitroso compoundsand polycyclic aromatic hydrocarbons.66
Fatty diets can activate specific liverenzymes that enhance the metabolism andtoxicity of environmental chemicals in thebody associated with the induction ofspecific liver enzymes.67 Similarly, obesityor over-weight per se has never been shownto cause or initiate cancer.68 An alternativeexplanation for the apparent link betweenoverweight/obesity and cancer is that fattissues are reservoirs for lipophilic (fat-loving) environmental chemical carcinogensthat eventually are released into the blood
Cancer in New Brunswick Communities: Investigating the environmental connection Part 226
0
10
20
30
40
50
60
70
1992 1993 1994 1995 1996 1997 1998 1999 2000 2001 2002 2003 2004 2005
Canada New Brunswick !"#"$%&'()*+$,#"#-%#-)%$."/"0"$$12'34$5667$..8$9-3*:$
Colorectal Cancer Rates (both sexes) for Canada andNew Brunswick (1992-2005)age-standardized incidence rates per 100,000 populationFI
GURE 8

Cancer in New Brunswick Communities: Investigating the environmental connection Part 2 27
Breast CancerThe provincial unadjusted incidence rate of breastcancer per 100,000 population (1989-2005) was115.5. Based on Statistics Canada data, the averageASIR per 100,000 population for breast cancer inNew Brunswick (1989-2005) was 98.0.73 The NewBrunswick Department of Health reported the ASIRper 100,000 population for breast cancer (1999-2003) was 101.5.74 The unadjusted incidence rateper 100,000 population reported by the province(1997-2001) was 124.4.75
Seven of 14 study areas (Fredericton, UpperMiramichi, Harvey, Dalhousie, Bathurst, Saint Johnand Miramichi) had breast cancer rates at least 25%higher than the provincial rate (Figure 9).Fredericton had the highest rate of breast cancerwhich was 38.5% above the provincial rate. UpperMiramichi and the Harvey area had rate 35 and 33%above the provincial rate.
The relative order of breast cancer rates (fromhighest to lowest) for Fredericton, Saint John andMoncton in this study were consistent with thefinding in the Conservation Council’s first cancerreport.76
Breast Cancer Risk FactorsIt is widely accepted that genetic mutations accountfor a very small percentage (2-10%) of all breastcancers.77 Approximately 20 genes are known tocontribute to inherited breast cancers. Mutations inthe so called “breast cancer genes”, BRCA 1 andBRCA 2, are the most common and account for asmall fraction (10%) of all breast cancer diagnoses.
Lifestyle factors with unknown or no apparentconsistent effects on breast cancer incidence includediet (coffee/tea consumption, high fat intake, lowfruit and vegetable consumption) as well as smokingand physical inactivity.78 Researchers have estimatedthat alcohol, overweight and physical inactivityaccount for approximately 33% of breast cancers inhigh-income countries (Table 4, page 25).79
Conservatively, half of all breast cancer risks can beattributed to a wide range of risk factors includinggenetics, family history, alcohol intake, obesity,
hormonal exposure, menopause andincreased breast density.80 Manyresearchers now believe the rise in breastcancer is associated with lifestylemodifications linked to hormonetreatments and changes in reproductivebehaviour (e.g. age at first pregnancy, lowbirthrates), and to increased levels ofestrogen mimics (xenoestrogens) in theenvironment.81
One of the most significant risk factors forbreast cancer is life-time exposure tosynthetic estrogens.82 A substantial (andgrowing) body of peer-reviewed scientific
literature has demonstrated that many classifiedcarcinogens are also estrogen mimics that disruptestrogen pathways and are risk factors for breastcancer (Table 5). For example, known carcinogenslike organochlorine pesticides (e.g. DDT,hexachlorobenzene), polychlorinated biphenyls
DEFGF, DHHGI, DHJGH,
DKLGF, DKEGE, DKEGM, DKFGH, DJDGM,DMIGE, DMEGJ,
DDFGD, DFLGM, DFIGJ,
ELGF,
#
*#0
(#0
"#0
)#0
!##0
!*#0
!(#0
!"#0
!)#0N#A,9"7)8A%&C,DDHGH,
Female Breast Cancer Rates (1989-2005)unadjusted incidence rates per 100,000 populationFI
GURE 9

28
Many of these compounds have been identified asbeing cancer-causing or estrogen mimics (Table 5).
It is not readily apparent why Fredericton has thehighest breast cancer rates, however a study done inthe United States may yield some clues. When anepidemiological study found breast cancer rates innine of 15 towns on Cape Cod were 20% above theaverage rate for the state of Massachusetts,researchers raised questions about possibleenvironmental exposure.87 Follow-up studies onindoor air and dust of 120 homes found 52 differenthormonally active agents and mammary carcinogencompounds in air and 66 in dust.88 The number ofcompounds detected per home ranged from 13 to 28in air and from 6-42 in dust. The most abundantwere plasticizers, disinfectants and certain flameretardants that were banned in 1977. Twenty-threepesticides, including those long-banned such as DDT,heptachlor, and chlordane, were detected in air and27 in dust. Detected concentrations exceededgovernment health-based guidelines for 15compounds, but no guidelines were available for 28compounds. In another related study, researchersfound synthetic estrogens in septic tanks,groundwater and private wells.89
Researchers also examined whether therewas an association between high breastcancer rates and length of residence onCape Cod90 and community versusindividual-level socioeconomic status(e.g. income, education,unemployment).91 They found that thelonger a women lived on Cape Cod, thegreater her risk of breast cancer - andthe risk was not associated with socio-economic status. However, when the riskwas calculated using community-levelsocioeconomic data, the study foundthat breast cancer risks were higher in
(PCBs) and dioxins are also estrogen mimics.83 Thesecompounds are lipophilic (fat loving) and deposit infatty tissue such as breasts where they have beenfound to generate estrogenic microenvironmentsthat influence the growth, shape and behaviour ofbreast tumours.84 These compounds also cross theplacental barrier and affect the developing fetus.Numerous studies have linked increased risks ofbreast and other cancers to pesticide exposure.85
Exposures to various forms of radiation are also riskfactors for breast cancer.86
Overall, breast cancer rates in New Brunswick aresimilar, if not generally lower, than national rates(Figure 10). Yet, breast cancer rates in 10 of 14urban and rural areas in this study were above theprovincial rate (Figure 9). Seven of 14 study areashad rates 25% above the provincial rate. Theseinclude Fredericton, Upper Miramichi, Harvey,Dalhousie, Bathurst, Saint John and the Minto area.With the exception of Fredericton, all of thesecommunities have documented environmental issues(e.g. arsenic, mercury, lead and cadmium inDalhousie; arsenic, radon and uranium in the Harveyarea; arsenic in the Minto area; lead, vanadium,aluminum, benzene and other VOCs in Saint John;and forest pesticides in the Upper Miramichi area).
0
20
40
60
80
100
120
1992 1993 1994 1995 1996 1997 1998 1999 2000 2001 2002 2003 2004 2005
Canada New Brunswick !"#"$%&'()*+$%#"#,-#,)-$."/"0"$12'34$5667$..8$9,3*:$
Female Breast Cancer Rates for Canada and New Brunswick(1992-2005) Age-standardized rates per 100,000 populationFI
GURE 10
Cancer in New Brunswick Communities: Investigating the environmental connection Part 2

Cancer in New Brunswick Communities: Investigating the environmental connection Part 2 29
Dioxins - by-product of incinerating chlorinated compounds andindustrial process that use chlorine (e.g. pesticide manufacturing)
PCBs - insulation fluids, plastics, inks, paints, dyes
DDT/DDE - insecticide
Hexachlorobenzene - herbicide
Atrazine - herbicide
Heptachlor - insecticide
Dieldrin and Aldrin - insecticides
Other pesticides
Polycylic aromatic hydrocarbons (PAHs) - fossil fuel combustion,industrial air pollution, oil refining
Bisphenol A (BPA) - hard/soft plastic containers labelled with atriangle and the numbers 3, 6 or 7
Alkylphenols - surfactants, detergents, some pesticides
Somemetals - smelters, oil refineries, battery recycling
Phthalates -plasticizer for PVC polymers
Benzene - solvents, fossil fuel combustion, oil refineries
Vinyl chloride - resins for production of plastic pipes, floor covering,food packaging, appliances, credit cards
Organic solvents - (e.g. styrene, formaldehyde, toluene,methylene chloride,trichlorethylene) used in manufacturing computer components, cleaningproducts and cosmetics
1,3 - Butadiene - oil refining and fossil fuel combustion; production ofpolymers for paints, carpet backing, tires and other rubber products
Ethylene oxide - disinfectant and pesticide; used in making resins,films and antifreeze
Aromatic amines - manufacture of polyurethane foams, dyes, pharmaceuticals;diesel exhaust
International Agency for Researchon Cancer (IARC) Classification
EndocrineDisruptingCompoundsKnown Probable PossibleCompound
1 Source: Adapted from Gray et al. 2009. State of the Evidence: The connection between breast cancer and theenvironment. International Journal of Occupational and Environmental Health 15:43-78.
Table 5. Some compounds linked to breast cancer1
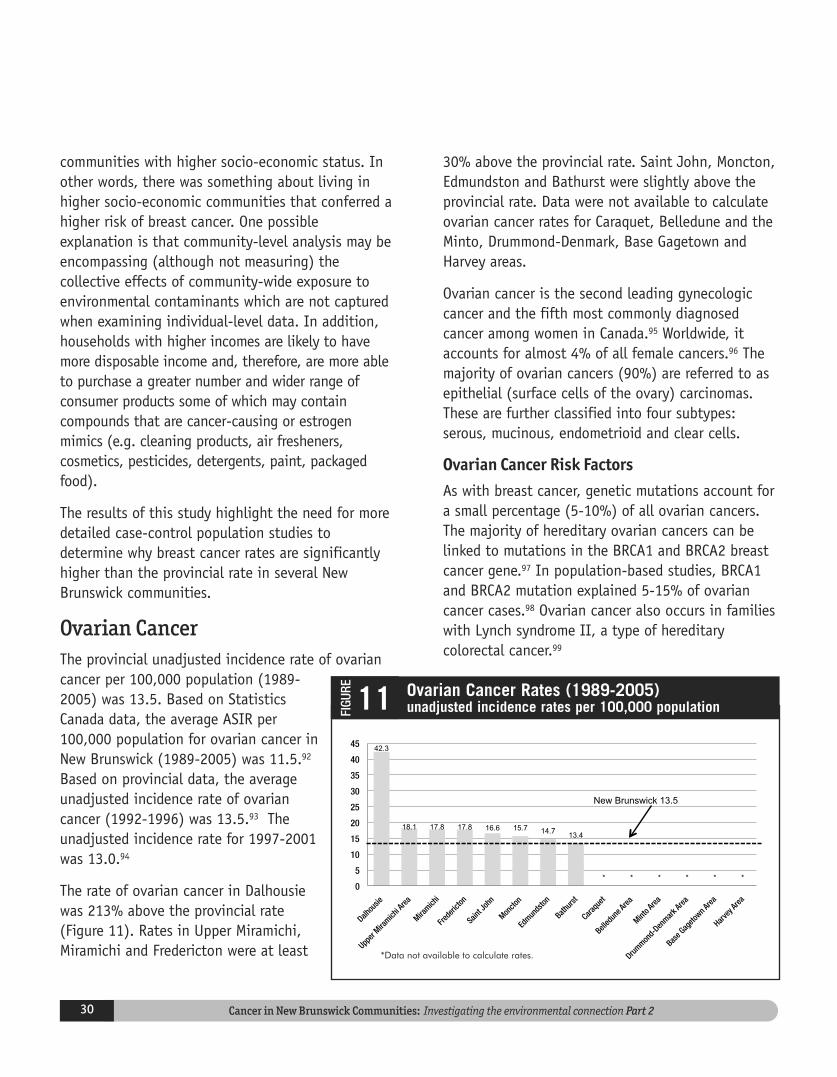
Cancer in New Brunswick Communities: Investigating the environmental connection Part 230
30% above the provincial rate. Saint John, Moncton,Edmundston and Bathurst were slightly above theprovincial rate. Data were not available to calculateovarian cancer rates for Caraquet, Belledune and theMinto, Drummond-Denmark, Base Gagetown andHarvey areas.
Ovarian cancer is the second leading gynecologiccancer and the fifth most commonly diagnosedcancer among women in Canada.95 Worldwide, itaccounts for almost 4% of all female cancers.96 Themajority of ovarian cancers (90%) are referred to asepithelial (surface cells of the ovary) carcinomas.These are further classified into four subtypes:serous, mucinous, endometrioid and clear cells.
Ovarian Cancer Risk FactorsAs with breast cancer, genetic mutations account fora small percentage (5-10%) of all ovarian cancers.The majority of hereditary ovarian cancers can belinked to mutations in the BRCA1 and BRCA2 breastcancer gene.97 In population-based studies, BRCA1and BRCA2 mutation explained 5-15% of ovariancancer cases.98 Ovarian cancer also occurs in familieswith Lynch syndrome II, a type of hereditarycolorectal cancer.99
communities with higher socio-economic status. Inother words, there was something about living inhigher socio-economic communities that conferred ahigher risk of breast cancer. One possibleexplanation is that community-level analysis may beencompassing (although not measuring) thecollective effects of community-wide exposure toenvironmental contaminants which are not capturedwhen examining individual-level data. In addition,households with higher incomes are likely to havemore disposable income and, therefore, are more ableto purchase a greater number and wider range ofconsumer products some of which may containcompounds that are cancer-causing or estrogenmimics (e.g. cleaning products, air fresheners,cosmetics, pesticides, detergents, paint, packagedfood).
The results of this study highlight the need for moredetailed case-control population studies todetermine why breast cancer rates are significantlyhigher than the provincial rate in several NewBrunswick communities.
Ovarian CancerThe provincial unadjusted incidence rate of ovariancancer per 100,000 population (1989-2005) was 13.5. Based on StatisticsCanada data, the average ASIR per100,000 population for ovarian cancer inNew Brunswick (1989-2005) was 11.5.92
Based on provincial data, the averageunadjusted incidence rate of ovariancancer (1992-1996) was 13.5.93 Theunadjusted incidence rate for 1997-2001was 13.0.94
The rate of ovarian cancer in Dalhousiewas 213% above the provincial rate(Figure 11). Rates in Upper Miramichi,Miramichi and Fredericton were at least
42.3
18.1 17.8 17.8 16.6 15.7 14.7
13.4
* * * * * *
0
5
10
15
20
25
30
35
40
45
New Brunswick 13.5
Ovarian Cancer Rates (1989-2005)unadjusted incidence rates per 100,000 populationFI
GURE 11
*Data not available to calculate rates.

of estrogen-related cancers (e.g. those of the breast,thyroid and ovary). Also, exposure to synthetichormone mimics, often referred to as endocrinedisrupting compounds (EDC), can alter normal fatmetabolism and development and result inobesity.109 These EDCs have been termedobesogens.110
Like breast cancer, exposure to EDCs is thought toincrease the risk of ovarian cancer. Hormones andauxiliary signaling chemicals such as enzymes andgrowth factors regulate the growth and functioningof various tissues and organs. EDCs de-rail hormoneswhich are often referred to as the body’s chemicalcommunication system.111 EDCs have beenimplicated in a wide-range of estrogen-, androgen-and progesterone-related health effects such asinfertility, birth defects, early puberty, reproductivecancers and thyroid diseases as well as other humanhealth conditions such as diabetes, obesity andother cancers.112 As described in the previous section(breast cancer risks), many known and probablecarcinogens (Table 5) are EDCs or hormone mimics.
Studies on lifestyle risk factors in ovarian (andother) cancers often do not consider occupationaland environmental (other than smoking) exposuresas potential confounding risk factors. Several studieshave linked occupational exposure to pesticides,organic dusts, aromatic amines, and PAHs (diesel,gasoline, engine exhaust) to ovarian cancer.113 Manyof these compounds are known EDCs (Table 5, page29). It is difficult to draw firm conclusions about therelationship of specific environmental oroccupational exposures and ovarian cancer due tothe low number of studies done to date.
The results of this study highlight the need for moredetailed case-control population studies todetermine why ovarian cancer rates in Dalhousie aremore than three times the provincial rate.
Family history is a risk factor for ovarian cancer.However, the lifetime risk of ovarian cancer forwomen with one affected relative was found to be5% and for two affected relatives the risk was 7%.100
As with breast cancer, hormones are thought to beinvolved in the promotion of ovarian cancer. In thecase of ovarian cancer, estrogen is believed tostimulate the proliferation and survival of bothnormal ovarian epithelial (surface) cells and ovariancancer cells while progesterone exposure is thoughtto enhance epithelial and cancer cell death andinterfere with and repress estrogen-induced geneexpression.101 One theory suggests that the processof ovulation, the frequent rupture and repair of thecells of the surface of the ovary, increases thelikelihood of DNA mutation and hence cancer.102
Several studies have found that pregnancy, breastfeeding and oral contraceptives, which suppressovulation, are associated with decreased risk ofovarian cancer.103 Late age-at-menopause, infertilityand hormone replacement therapy have beenidentified as possible risk factors.104
Studies that have examined lifestyle risk factors forovarian cancer (e.g. smoking, alcohol consumption,diet, overweight/obesity, physical inactivity) areinconsistent and highly variable in theirconclusions.105 Studies have found that smokingincreased the risk of mucinous, but not otherepithelial, ovarian cancers.106
Several studies have demonstrated a link betweenovarian cancer and obesity, particularly in pre-menopausal women.107 While adipose (fat) tissue perse has never been shown to cause or initiate cancer,fat tissue is becoming increasingly recognized as anendocrine-active organ that is able to produce manyhormones (including estrogen) and peptides (organiccompounds made up of two or more amino acids).108
An excess production of estrogen in obese oroverweight individuals could affect the development
Cancer in New Brunswick Communities: Investigating the environmental connection Part 2 31

Thyroid cancer rates were highest among males andfemales in Edmundston and more than double theunadjusted provincial rate (1997-2001) (Figures 12and 13). The rate among females in Bathurst wasalmost double the provincial rate and males inMiramichi had an incidence rate 60% higher thanthe provincial rate. Data were not available tocalculate thyroid cancer rates for males and females
in Dalhousie, Caraquet, Belledune, UpperMiramichi, Minto, Drummond-Denmarkand Harvey area or for males in Bathurstand the Base Gagetown area.
Thyroid cancer incidence has beensteadily rising provincially, nationally andglobally since the 1970s and rates amongfemales are significantly higher than formales.115 Thyroid cancer is the mostcommon cancer overall in young females(15-29 years of age) and representsabout 19% of diagnoses per yearbetween 1992 and 2005, followed byHodgkin’s lymphoma and melanoma.116 InNew Brunswick the average annualincreases in ASIR rates among femaleswas 6.6% between 1989 and 2001.117 Theannual increase nationally (1991-1999)for females was 3.9%.118 Between 2001-2005, women in Ontario, Alberta andNew Brunswick ranked first, second andthird highest among provinces in theirrates of thyroid cancer.119
There is considerable debate within thescientific community as to whether thedramatic rise in thyroid cancer rates sincethe 1970s reflects actual increases inincidence rates or simply changes indetection practices. Some researchershave suggested that increased use ofdiagnostic tools (e.g. ultrasonography)and fine-needle aspiration biopsy have
Thyroid CancerData were not available to calculate the provincialincidence rate of thyroid cancer between 1989 and2005. Based on provincial health data, theunadjusted incidence rate of thyroid cancer per100,000 population (1997-2001) was 2.5 and 8.4 formales and females respectively.114
Cancer in New Brunswick Communities: Investigating the environmental connection Part 232
5.8
4.1
3.3 2.6
2.3
* * * * * * * * *0
1
2
3
4
5
6
7
New Brunswick 2.5
(unadjusted rate 1997-2001)
* Data not available
Male Thyroid Cancer Rates (1989-2005)unadjusted incidence rates per 100,000 populationFI
GURE 12
22.4
16.7
10.2 9.3 8.8 8.4 8.3
* * * * * * *
0
5
10
15
20
25
!"#$%&'()#*+,$$-./$$
0'(123')4"2$&14"$566789::5;$
Female Thyroid Cancer Rates (1989-2005)unadjusted incidence rates per 100,000 populationFI
GURE 13
*Data not available to calculate rates.
*Data not available to calculate rates.

dose per exam than x-rays (8.8 mSv for CT versus 1.3mSv for x-rays) increased significantly in the1990s.126 The thyroid is at particular risk of ionizingradiation because iodine, which is trapped by thethyroid gland, blocks and traps photons (radiantenergy), thereby causing DNA breaks that lead tomutations.127
Numerous studies have linked secondary cancers,including thyroid cancer, to radiation therapy usedto treat primary cancers.128 Second primarymalignancies (SPMs) occur in 16% of individualstreated for primary cancers in the United States.129
The risk of SPMs due to radiation therapy generallydecreases with age and SPMs are greater in womenthan in men. The reason for this difference isunknown. Children and adolescents are moresusceptible to the risk of radiation-induced SPMs,particularly leukemia and brain, breast, bone andthyroid cancers.130 Several explanations have beensuggested for the increased risk in SPMs inchildren.131 Children have a higher number of stemcells (a cell that can undergo division to becomeanother cell type) in their tissues. These cells aredividing rapidly thereby increasing the chances ofDNA replication errors. A second suggestion is thatthe mechanisms that prevent cells from growing outof control in some organs are less effective orperhaps less developed in children. Another possibleexplanation is that growth hormones, which havebeen linked to cancer promotion, are likely greaterin children.
Occupational exposure to ionizing radiation and therisk of thyroid and other cancers have beenexamined for radiologists and radiologic technicians.Evidence of a risk of thyroid cancer or thyroid noduleformation in radiological workers is variabledepending on period and duration of occupationalexposure.132 The evidence indicates that the risk ishigher in women than in men and, overall, the riskof breast, leukemia and lung cancers may be
resulted in increased detection of small (less than 2cm) tumours. Results of studies to resolve thisdebate are inconsistent in their conclusions.120 Stillothers have (controversially) suggested that, in thegeneral population, small primarily micropapillary(less than 1 cm) thyroid tumours are normal, withrelatively few tumours ever developing intomalignant cancers.121
Thyroid Cancer Risk FactorsThe best-known and well-established risk factor forthyroid cancer is exposure to ionizing radiation (e.g.x-rays, gamma rays associated with nuclearreactions, sunlight, high-voltage equipment)particularly during childhood.122 Ionizing radiationmay inflict DNA damage or mutation by altering theatomic composition of cell structures, breakingchemical bonds and/or inducing free radicalformation thereby increasing the risk of malignancyor cell death.
Studies have found little or no support for smokingor alcohol and coffee consumption as risk factors.123
Genetic risk factors account for a small percentage(5%) of differentiated thyroid cancers, the mostcommon (90%) form of thyroid cancer. Otherpotential risk factors that have been examinedinclude family history, iodine deficiency andreproductive hormones in females.
Increased exposure to ionizing radiation associatedwith greater use of diagnostic devices (e.g. x-rays,PET, CT – computerized tomography – scanners), aswell as the increased use of therapeutic radiation(e.g. cancer treatment), has been suggested as apossible explanation for the increased incidence ofthyroid cancer.124 US data indicates that althoughthe dose for routine diagnostic x-ray exams hasdecreased over the decades, the frequency of examshave increased from 790 x-rays exams per 1,000population in 1980-1984 to 962 in 1991-1996.125
The use of CT scans which have a higher effective
Cancer in New Brunswick Communities: Investigating the environmental connection Part 2 33

Prostate CancerThe provincial unadjusted incidence rate of prostatecancer per 100,000 population (1989-2005) was133.2 (Figure 14). These rates are consistent withthe average age-standardized incidence rates (ASIRs)per 100,000 population for New Brunswick for thesame time period. Based on Statistics Canada data,the average ASIRs for prostate cancer among NewBrunswick males (1989-2005) was 135.0.138 Theprovincial unadjusted incidence rate for 1997-2001was 137.7.139
Men in the Belledune area had the highest rate ofprostate cancer (221.9); 66.5% above the provincialrate. This finding is consistent with the results of a2005 community health assessment done in thearea. That study, sponsored by the provincialgovernment, found prostate cancer rates (1989-2001) in the Belledune area were higher than ratesin their health regions (Health Region 5 and 6) andthe province.140 The study did not examine potentiallinks between high rates of prostate cancer andoccupation. Belledune has been the site of a leadsmelter and its associated industries (acid, fertilizerand gypsum plants) since 1967. Numerous studies and
stronger than the risk of thyroid cancer.133
Occupational studies have also suggested a linkbetween the risk of thyroid and other cancers andnuclear and radiation workers in general (e.g.nuclear, industrial, medical and dental).134
Most of our knowledge of the impacts ofenvironmental radiation exposure and risk of thyroidand other cancers is based on the study of atomic-bomb survivors in Japan and survivors of the 1986Chernobyl nuclear accident. Thousands of studieshave examined the effects of internally depositedradionuclides and external radiation on cancerinduction. It is widely acknowledged that exposureto radiation in utero increases the risk of childhoodcancers and childhood exposure is associated withincreased risks of adult-onset cancers. Ten yearsafter the accident in Chernobyl, children living inthree countries (Belarus, Russia and Ukraine) aroundthe Chernobyl nuclear facility had elevated rates ofthyroid cancer.135
Several studies have examined the risk of thyroidand other cancers (particularly leukemia in children)for residents living in the vicinity of nuclear power-generating facilities.136 The results of these studiesare inconsistent or inconclusive andoften challenged by alternativeanalyses.137
The results of this study identifysignificantly higher thyroid cancer ratesamong males and females inEdmundston. A case-control populationstudy should be done to determine whyrates in this community are double theprovincial rate.
221.9 214.3 211.9 198.9
179.9 172.2 163.2
151.6 141.7 136.3 130.4 119.8 119.2
88.6
0
50
100
150
200
250
Prostate Cancer Rates (1989-2005)unadjusted incidence rates per 100,000 populationFI
GURE 14
Cancer in New Brunswick Communities: Investigating the environmental connection Part 234
New Brunswick 133.5

Prostate Cancer Risk FactorsAs with breast cancer, genetic susceptibility andfamily occurrence explain a very small portion of theincidence of prostate cancer. Genetic mutationsaccount for less than 2% and family historyaccounts for 5-20%.143 There is little (or inconclusiveevidence) that high vegetable and fruit diets reducethe risk, or that animal fat, meat, coffee or smokingincrease the risk of prostate cancer.144 And, likebreast cancer, prostate cancer is a hormone-relatedcancer and there is strong and growing evidencethat exposure to synthetic hormone (endocrine)disrupting compounds affects prostate cancerdevelopment and progression.145 In addition,researchers believe that male infants and childrenexposed to endocrine disrupting compounds may beat increased risk of developing prostate cancer asthey age, since these compounds can pass throughthe placenta into the developing fetus, and theprostate appears to be more sensitive to thesecompounds during critical period of development(e.g. in utero and in early childhood).146
Occupational exposure to compounds that mimichormones (e.g. pesticides, metals, PAHs, andchlorinated compounds like dioxins and PCBs) has
been linked to increased risks ofprostate cancer (see Table 3, page20).147 Studies consistently show thatfarmers and men with occupationalpesticide exposure are at greater risk ofprostate cancer.148
Occupational and environmentalexposure to arsenic has been stronglylinked to lung, bladder and skin cancers,and the evidence of a link to prostatecancer is growing.149 The InternationalAgency for Research on Cancer (IARC)has concluded that there is a “consistentpattern of increased mortality from
monitoring reports have documented lead, arsenicand cadmium contamination of soil, water, seafood,produce and forage within an eight kilometre radiusof the smelter.141 A human health risk assessment inthe area concluded that levels of known (arsenic andcadmium) and probable (lead) carcinogens releasedfrom industrial facilities were high enough in theenvironment to pose a health risk (above provincialhealth guidelines) for residents for periods of morethan thirty years.142
Rates among men in Dalhousie and the Harvey areawere also significantly higher (at least 60%) than theprovincial rate. Men in Miramichi, Caraquet and theBase Gagetown and Drummond-Denmark area hadrates below the provincial rate.
Between 1992 and 2000, prostate cancer rates in NewBrunswick were significantly higher than nationalrates (Figure 15). For a brief period (2000-2003),rates matched the national rates, but in 2004 and2005 rates were once again higher than the nationalrate. When prostate cancer rates in this study arecompared to the national average (1989-2005) ASIRper 1000,000 population (135.0), 10 of the 14 studyareas have rates above the Canadian average rate.
0
20
40
60
80
100
120
140
160
180
200
1992 1993 1994 1995 1996 1997 1998 1999 2000 2001 2002 2003 2004 2005
Canada New Brunswick !"#"$%&'()*+$%#"#,-#,)-$."/"0"$12'34$5667$..8$9,3*:$
Prostate Cancer Rates for Canada and New Brunswick(1992-2005) Age-standardized rates per 100,000 populationFI
GURE 15
Cancer in New Brunswick Communities: Investigating the environmental connection Part 2 35

Miramichi, Harvey and Bathurst areas as well asother communities and urban areas which were notexamined in this study.153
These results highlight the need for more detailedcase-control population studies to determine whyprostate cancer rates are significantly higher in somecommunities examined in this study and in NewBrunswick in general.
Bladder CancerThe provincial unadjusted incidence rates per100,000 population (1989-2005) of bladder cancerwere 33.1 for males and 10.9 for females. Theserates are consistent with the average age-standardized incidence rates (ASIRs) per 100,000population for New Brunswick for the same timeperiod. Based on Statistics Canada data, the averageASIRs for bladder cancer among New Brunswickmales and females (1989-2005) were 34.5 and 8.8respectively.154 The provincial unadjusted incidencerate of bladder cancer for males and females (1997-2001) was 33.2 and 10.5 respectively.155 The averageunadjusted incidence rates for males and females(1992-1996) were 28.9 and 9.6 respectively.156
In general, bladder cancer rates among males werethree time the rate among females (Figures 16 and17). This three-fold difference between males andfemales is consistent with the pattern of bladdercancer rates in other developed countries.157 Malesin Dalhousie and the Minto area had bladder cancerrates 50% higher than the provincial rate and ratesamong males in the Harvey and Upper Miramichiareas were 47% higher than the provincial rate.Rates in Saint John were also significantly higher(32%) than the provincial rate. Rates in Belledune,Edmundston, Caraquet and the Drummond-Denmarkarea were at or below the provincial rate for males.
Similarly, bladder cancer rates among women in the
prostate cancer in areas that are highlycontaminated by arsenic, and there is evidence of adose-related response”.150 Arsenic compounds,specifically inorganic forms, are potent multi-sitehuman carcinogens. In addition to cancer, exposureto inorganic arsenic can also result in a wide rangeof non-cancer diseases such as hypertension, heartand liver diseases, diabetes, neuropathy andarteriosclerosis.151
Arsenic occurs naturally in the environment and alsoas a result of human activity. The environment canbecome contaminated with arsenic by naturalweathering of rock containing high levels of arsenic,air emissions from metal mining and smeltingoperations, coal and oil burning, fly ash from coal-and oil-fired power plants, sewage incineration, landapplication of sewage, tobacco smoke, somepesticides, air and water emissions from someindustries and the manufacturing of (and burning orleaching from) some “pressure-treated” woodproducts.
High rates of prostate cancer in Belledune, Dalhousieand the Harvey and Minto areas may be linked tooccupational and environmental exposures to arsenicand/or cadmium. (Occupational and environmentalexposures to cadmium have also been stronglylinked to lung cancer, and evidence of a link toprostate, kidney and pancreatic cancers is alsogrowing.152) Environmental monitoring reports andstudies in Dalhousie, Belledune and the Harvey andMinto areas have reported high levels of arsenic inthe environment that have been linked to an oreconcentrate storage facility (Dalhousie), powerplants (Dalhousie, Minto and Belledune), a coal mine(Minto), lead smelter (Belledune) and naturallyoccurring sources (Harvey area, Dalhousie). The NewBrunswick Groundwater Chemistry Atlas (2008) hasidentified high (>0.025 mg/l) levels of arsenic inwellwater sampled in the Dalhousie, Minto, Upper
Cancer in New Brunswick Communities: Investigating the environmental connection Part 236

chlorination by-products, specificallytrihalomethanes (THMs) from water disinfection, area risk factor for bladder cancer.162 THMs are a groupof compounds that can form when the chlorine usedto disinfect drinking water reacts with naturallyoccurring organic matter (e.g., decaying leaves andvegetation). According to Health Canada, themajority of drinking water treatment plants inCanada use some form of chlorine to disinfectdrinking water, by treating water directly in the
Dalhousie and Minto area were significantly higher(70% and 65% respectively) than the provincial rate.Women in the Base Gagetown area, Bathurst andEdmundston had bladder cancer rates below theprovincial rate. Data were not available to calculatebladder cancer rates for Caraquet, Belledune or theUpper Miramichi and Harvey areas.
Bladder Cancer Risk FactorsSmoking has been identified as a key risk factor forbladder cancer (Table 4, page 25). Fortyto 50% of all bladder cancers have beenlinked to tobacco smoking.158 Numerousepidemiological studies havedemonstrated no association betweenbladder cancer and alcohol and coffeedrinking, low fruit and vegetable intakeor high meat consumption.159
Occupational exposures account for asignificant percentage (up to 25%) ofbladder cancers depending upon theoccupation. Bladder cancer risks havebeen associated with mining andsmelting (arsenic), transportationsectors (diesel or gasoline exhaust),mechanics (PAHs), machinists (straightand soluble oils), hairdressers (hairdyes), dry cleaning workers (solvents,specifically tetrachloroethylene),painters (paints and solvents) andpetrochemical workers (PAHs).160
Environmental exposure to arsenic (viadrinking water) is a well-known andsignificant risk factor for bladdercancer. High levels of arsenic have beenreported in groundwater and/ordrinking water in the Harvey, Minto andBelledune areas and in Dalhousie.161
There is also growing evidence that
Cancer in New Brunswick Communities: Investigating the environmental connection Part 2 37
DEFG- DEFH-DIFJ-
DGFG-DKFL-
DMFI- DMFJ-
DHFN-NFM-
JFG-
O O O O
%
*
'
)
"
!%4
!*4
!'4
!)4
!"4
*%4
P);-8/&+';(26-DHFN-
O!","-+%,-"B"(#"Q#)-,%-2"#2&#",)-/",)'-
Female Bladder Cancer Rates (1989-2005)unadjusted incidence rates per 100,000 populationFI
GURE 17
49.9 49.7 48.9 48.8
43.7
38.4 37.9 37.0 36.5
34.5 33.5 33.3
27.1
20.7
0
10
20
30
40
50
60New Brunswick 33.1
Male Bladder Cancer Rates (1989-2005)unadjusted incidence rates per 100,000 populationFI
GURE 16
*Data not available to calculate rates.

poisoning. Subsequently, 244 residents had theirurine analyzed for total arsenic.167 Twelve percent(12%) of samples were at or above 40 microgramsarsenic per litre (µg As/l) – the upper limit ofnormal that was arbitrarily assigned by the report’sauthor.168 The report identified several possiblesources of arsenic including marine sediments andseafood from near the wharf area, the coal-firedpower plant, the paper mill, which burned Mintocoal until the 1970s, dust and leachate from fly ashpiles at the mill and power plant and oreconcentrate piles. The report concluded there was noconnection between urinary arsenic levels andenvironmental contamination and attributed highurinary arsenic levels to intake of seafood,particularly lobsters and clams.
Almost 25 years later, the owners responsible for theore concentrate piles in Dalhousie hired consultantsto examine the health risks of high lead, cadmiumand arsenic levels reported in residential soils in thevicinity of their operation. Ore concentrates wereshipped via open railcar from various mines innorthern New Brunswick and stored in open piles atthe Dalhousie wharf at the centre of town from 1964to 1996. While the facility was operating, there wereconstant complaints by Dalhousie residents aboutthe dust from the ore piles. Residents living in townsand villages along the rail line also complainedabout the fugitive dust blown from the openrailcars. By the late 1980’s, efforts by the companyto control the dust from railcars were moresuccessful than their efforts to control the dust fromthe piles on the wharf. The company stoppedshipping and stockpiling ore concentrates in 1997.
The 2006 Dalhousie study found that current arseniclevels pose a risk of cancer for residents thatexceeds the province’s health guideline.169 There wasan order of magnitude higher cancer risk associatedwith soil arsenic levels for Dalhousie residents when
treatment plant and/or by maintaining a chlorineresidual in the distribution system to preventbacterial regrowth. Health Canada has set themaximum acceptable concentration of THMs indrinking water at 0.1 mg/L.163 Exposure to THMs canoccur through drinking water, inhalation andabsorption through the skin during bathing orshowering, and in swimming pools.164 Testing done byHealth Canada (1993-94) found that several citiesacross Canada had levels of THMs above the agency’sguidelines.165 In 2007, high levels of THMs werereported in the water supply of residents living inwest Saint John.166 Health officials acknowledged theneed for a better water treatment facility for the city.
Except for Dalhousie and the Minto area, the patternof bladder cancer rates among communities isdifferent for females than for males. The fact thatmen in Dalhousie and the Minto area have threetimes the rate of bladder cancer than women inthese areas could be a function of generally highersmoking rates among men than women. (Data onsmoking rates in those communities does not exist.)It could also be attributed to occupational exposure.Men in Dalhousie and the Minto area have worked(and still work) in industries associated with arsenicexposure (e.g. coal mining, fossil fuel power plants),a known risk factor for bladder and other cancers.Occupational exposure is unlikely to explain the highrates of bladder cancer for women in Dalhousie andMinto. Smoking and environmental exposures arepotential risk factors. Environmental monitoring inthe Dalhousie, Minto, Belledune and Harvey areasindicate high levels of arsenic in the environment.Data were not available to calculate bladder cancerrates for females in the Belledune or Harvey areas.
In 1982, the provincial Department of Health beganan investigation of potential arsenic contaminationin Dalhousie when a 28 year old female wasdiagnosed as suffering from chronic arsenic
Cancer in New Brunswick Communities: Investigating the environmental connection Part 238

Males in the Belledune area had kidney cancer ratesalmost double the provincial rate (Figure 18). Thisfinding is consistent with the results of the 2005Belledune area health study. That study found kidneycancer rates (1989-2001) among males in theBelledune area were higher than rates in their healthregions (Health Regions 5 and 6) and theprovince.174 Males in Dalhousie and the UpperMiramichi area also had rates significantly above(71% and 66% respectively) the provincial rate.
they were compared with residents living 15-30 kmsouthwest of Dalhousie (Atholville and Maple Greenand McLeod area).170 The study concluded that atcurrent arsenic levels, soil and indoor and outdoordust (either inhaled or ingested) were not healthrisks and that there would be no benefit to cleaningup the soil in Dalhousie because soil representedonly a small proportion of the overall arsenic risk.The study did not examine the historic health riskwhen dust from the open piles was a chronicproblem in the community. According tothe study, drinking water, local seafoodand supermarket food were the main riskpathways in Dalhousie as well as fortypical New Brunswick residents.
The results of the present study highlightthe need for more detailed case-controlpopulation studies to determine whybladder cancer rates among men andwomen in the Dalhousie and Minto areaare more than 50% higher than theprovincial rate.
Kidney CancerThe provincial unadjusted incidence rateof kidney cancer per 100,000 population(1989-2005) was 17.2 for males and11.8 for females. These rates areconsistent with the average age-standardized incidence rates (ASIRs) per100,000 population for New Brunswickfor the same time period. Based onStatistics Canada data, the averageASIRs for kidney cancer among NewBrunswick males and females (1989-2005) were 16.7 and 9.9 respectively.172
The average provincial unadjustedincidence rate of kidney cancer for malesand females (1992-1996) was 16.2 and10.7 respectively.173
21.1 20.1
18.4
14.6 13.6
12.2 11.4 10.3
* * * * * *
!
#
$!"
$#"
%!"
%#"
&'(")*+,-(./0"$$12"
34565",76"585.95:9'"67"/59/+956'"*56'-"
Female Kidney Cancer Rates (1989-2005)unadjusted incidence rates per 100,000 populationFI
GURE 19
33.5
29.4 28.6
23.6 23.0
21.9 20.0
19.0
17.2 15.2
11.3 10.6
* *
0
5
10
15
20
25
30
35
40
!"#$$%&'()#*+,$-./0$
12343$(54$363*7387"$45$+37+'734"$&34")$
Male Kidney Cancer Rates (1989-2005)unadjusted incidence rates per 100,000 populationFI
GURE 18
Cancer in New Brunswick Communities: Investigating the environmental connection Part 2 39

Cadmium was designated a known carcinogen by theIARC in 1993 and was associated with increased riskof lung cancer. Since the IARC designation, there hasbeen growing evidence linking cadmium exposure toprostate, kidney, pancreas and breast cancer.183
Occupational exposures to cadmium include thosewho work in mining, smelting and refining metals,battery recycling, cement-manufacturing, plantsburning oil or coal, and sewage sludgeincinerators.184 Environmental exposures occur as aresult of air emissions or effluent releases from theseoperations which can contaminate soil, air, water,produce, vegetation, wildlife, fish and seafood.Cadmium is poorly excreted from the body andaccumulates mainly in the liver and kidneys where ithas a half-life (the time it takes for half thecadmium to be removed) of 10-30 years.185 Cadmiumalso has non-cancer health effects. It is toxic tokidneys and interferes with calcium metabolism inbones leading to pains in bones and joints andreduced bone density.
Cadmium, as well as lead and arsenic, have longbeen a concern for workers at the Belledune smelter.In 1987, after years of complaints by workers at thesmelter, a joint (industry-province) occupationhealth and hygiene study of workers in theBelledune smelter was done by McGill University. Thestudy found that workers throughout the smelterwere overexposed to levels of dust, SO2, lead,cadmium, and arsenic.186
Three years later, a clinical health study of smelterworkers was conducted by a researcher fromDalhousie University.187 The study found that 26.3%of workers had lung abnormalities, 24% hadunacceptable levels of lead, cadmium and arsenic intheir blood, 69% had hearing problems, 23.6%complained of chest pains, 24.5% had joint andmuscle pains, and 19.8% had severe itching of theskin.188 Although the study did not predict the long-term health effects of continued exposure to these
Males in Fredericton, Edmundston and theDrummond-Denmark and Base Gagetown areas hadrates at or below the provincial rate. Data were notavailable to calculate kidney cancer rates for malesin the Minto and Harvey areas.
Women in Dalhousie had kidney cancer rates 79%above the provincial rate (Figure 19). Rates inBathurst and Miramichi were also significantly abovethe provincial rate (70% and 56% respectively). Datawere not available to calculate kidney cancer ratesfor women in Caraquet and the Belledune, UpperMiramichi, Minto, Base Gagetown or Harvey areas.
Kidney Cancer Risk FactorsKidney (renal cell) cancers represent a smallpercentage (3-4%) of total cancer incidence rates inCanada (as well as the United States).175 A keylifestyle risk factor for kidney cancer is smoking.176
High blood pressure (hypertension) and high body-mass index have been found to increase thelong-term risk of kidney cancer in men.177 Coffee, teaand alcohol consumption have not been linked tokidney cancer.178 Some studies indicate a moderateconsumption of alcohol may decrease the risk ofkidney cancer in men and in women (mainlypostmenopausal women).179 Studies examining theassociation between fat and meat (red meat,processed meat, poultry and seafood) consumptionand physical inactivity and the risk of kidney cancerreflect contradictory conclusions.180
There is considerable evidence that exposure totrichloroethylene, a chlorinated solvent commonlyused as a degreaser in several occupations (e.g.metal workers, mechanics, printers, railroad workersand service station employees) is a risk factor forkidney cancer.181 Exposure to known or suspectedcarcinogens such as chromium compounds,cadmium, lead, benzene, vinyl chloride, asbestos,pesticides and herbicides have been linked toincreased risk of kidney cancer.182
Cancer in New Brunswick Communities: Investigating the environmental connection Part 240

Pancreatic CancerProvincial unadjusted incidence rates of pancreaticcancer per 100,000 population (1989-2005) were12.0 for males and 11.6 for females. These rates areconsistent with the average age-standardizedincidence rates (ASIRs) per 100,000 population forNew Brunswick for the same time period. Based onStatistics Canada data, the average ASIRs forpancreatic cancer among New Brunswick males andfemales (1989-2005) were 12.0 and 8.8respectively.190 The average provincial unadjustedincidence rates of pancreatic cancer for males andfemales (1992-1996) were 10.3 and 10.4respectively.191 Unadjusted incidence rates between1997-2001 for males and females were 17.0 and12.8 respectively.192
Caraquet males had twice the provincial rate (1989-2005) of pancreatic cancer (Figure 20). Rates amongmales in the Minto area and Dalhousie were 82% and71%, respectively, above the provincial rate. Ratesin Saint John, Bathurst and Moncton were 30%above the provincial rate. Data were not available tocalculate pancreatic cancer rates for the Belledune,Upper Miramichi and Harvey areas.
Females in Bathurst had the highest rates ofpancreatic cancer, almost double the provincial rate.Rates among women in Dalhousie, Caraquet andMiramichi were 82%, 55% and 48%, respectively,above the provincial rate (Figure 21). Data were notavailable to calculate pancreatic cancer rates for theBelledune, Minto and Harvey areas.
Pancreatic cancer occurs at approximately the samerate for males and females, and rates in Canada andNew Brunswick have been relatively stable for thepast three decades.
metals, the author suggested that arsenic couldcause lung cancer, cadmium could result in kidneydisease and a combination of the metals could affectskin, lungs, kidneys, gonads, nerves, bones andmuscles.189
As a result of the Dalhousie University study, morethan 100 smelter workers were flown to a medicalcentre in Baltimore for further examination. Whenthey returned, several workers were put on long-termdisability. No follow-up occupational health study ofsmelter workers in Belledune was ever done.
In 2007, the provincial health departmentannounced another health study to examine whetherhigh cancer rates in the Belledune area were linkedto lifestyle risk factors. The study would compare thelifestyles of Belledune residents to those ofBeresford, a community 40 km east of the smelter.The results of the study were due in September 2008but have not been released as of the publication ofthis report.
Occupational exposure to cadmium could also occurin mine workers. Base-metal mining operations (e.g.Brunswick 12, Heath Steele, Caribou mines) havebeen a major economic activity in northern NewBrunswick since the early 1960’s. The mine workforcehas been drawn from many northern communitiesincluding some of those examined in this study(Dalhousie, the Upper Miramichi area, Miramichi andBathurst). No occupational health studies haveexamined cancer incidence rates among miners inNew Brunswick.
According to this study, kidney (as well as prostate)cancer rates among men in the Belledune area werethe highest among the 14 study areas, followed byDalhousie. (Data were not available to calculatekidney cancer rates among women in the Belledunearea.) An occupational health study should be doneto determine why rates of kidney (and prostate)cancer are so high in Belledune and Dalhousie.
Cancer in New Brunswick Communities: Investigating the environmental connection Part 2 41

Pancreatic Cancer Risk FactorsGenetic mutations in pancreas-specificgenes have yet to be identified.193 Only 4-16% of individuals with pancreatic cancerhave a family history of the disease.194 Infamilies with a history of pancreaticcancer, other genes such as thoseassociated with the BRCA2 breast-ovariancancer gene, Peutz-Jeghers syndrome,Lynch syndrome, hereditary pancreatitisand hereditary colorectal cancer have beenidentified as risk factors.195 However, thesefactors account for a very small proportionof pancreatic cancer cases.
Numerous studies have examined lifestylerisk factors and their potential associationwith pancreatic cancer. The most consistentfindings are for smoking.196 An estimated33% of pancreatic cancers have beenattributed to smoking.197 The evidence foralcohol, specifically heavy consumption, asa potential risk factor for pancreatic canceris more consistent than that for obesity,diet, inactivity and coffee consumption.198
Few studies have specifically examined theincidence of pancreatic cancer andoccupational risk factors. A limited numberof studies have reported an increased riskof pancreatic cancer to be associated withpesticides, organic solvents and metal(specifically nickel and cadmium)exposures, and work in food industries.199
The high rates of pancreatic cancer among males andfemales in Caraquet merit investigation given thatrates of most other cancers (for males and females)in this community are among the lowest in thisstudy.
Cancer in New Brunswick Communities: Investigating the environmental connection Part 242
24.4 21.8 20.5
16.1 15.9 15.513.7
13.2 13.0 12.09.5
* * *0
5
10
15
20
25
30
!"#$%&'()#*+,$-./0$
*Data not available to calculate rates
Male Pancreatic Cancer Rates (1989-2005)unadjusted incidence rates per 100,000 populationFI
GURE 20
!!"#$ !%"%$
%&"'$ %("!$
%)"*$ %)"+$ %)")$
%,"#$ %!")$%%"+$
%'"'$
- - -
'
+
%'$
%+$
!'$
!+$
./0$123450678$%%"#$
-9:;:$4<;$:=:6>:?>/$;<$7:>73>:;/$2:;/5$
Female Pancreatic Cancer Rates (1989-2005)unadjusted incidence rates per 100,000 populationFI
GURE 21

cancers that begin in the cells of the immune system.The lymphatic system consists of lymph vessels,lymph (which contain lymphocytes) and lymph nodes.Lymph nodes trap, destroy and remove bacteria orother harmful substances that may be in the lymph. Ifthis does not occur, the lymph nodes can become thesite of secondary cancers. The lymph system can also
Non-Hodgkin’s Lymphoma (NHL)Provincial unadjusted incidence rates of non-Hodgkin’s lymphoma per 100,000 population(1989-2005) were 20.2 for males and 17.6 forfemales. These rates are consistent with the averageage-standardized incidence rates (ASIRs) per100,000 population for New Brunswick for the sametime period. Based on Statistics Canadadata, the average ASIRs for NHL amongNew Brunswick males and females (1989-2005) were 19.7 and 14.5 respectively.200
Average unadjusted NHL incidence ratesfor New Brunswick males and females(1992-1996) were 20.8 and 16.0respectively and unadjusted rates for1997-2001 were 21.9 and 16.5 for malesand females respectively.201
Males in Dalhousie had the highest NHLrates in this study (Figure 22). Theirrates were 118% above the provincialrate. Rates in Fredericton, Caraquet,Miramichi and the Drummond-Denmark,Upper Miramichi and Base Gagetownareas were at or below the provincial rate.Data were not available to calculate NHLrates for males in the Belledune area.
Females in the Upper Miramichi area hadthe highest incidence rates of NHL; 85%above the provincial rate (Figure 23).NHL rates in Drummond-Denmark andEdmundston were at or below theprovincial rate. Data were not availableto calculate NHL rates for the Belledune,Base Gagetown or Harvey areas.
The body’s primary defense mechanismagainst the spread of infection andtumours is the lymphatic system.Lymphoma and multiple myeloma are
GGHI.
JKHL.
KMHI.KNHL. KGHO. KGHJ.
KPHI. KIHL.PQHI.
POHL. POHI. PLHM. PLHO.
R
0
5
10
15
20
25
30
35
40
45
50
:(B&+).KPH.0"#).D%1=*%8B>(1E'.F-9@$%9".S"2)'.TPQMQ=KIINU.&1"8V&'2)8.(16(8)16).+"2)'.@)+.PIIWIII.@%@&#"2(%1.
R!"2".1%2.","(#"X#).2%.6"#6&#"2).+"2).
D)C.3+&1'C(6>.KIHK.
Male Non-Hodgkin’s Lymphoma Rates (1989-2005)unadjusted incidence rates per 100,000 populationFI
GURE 22
GHIJ%
HJIK%HKIL%
HGIH% HHIM% HHIN% HOIP% HLIP% OMIM%ONIQ%
R
R R R
&
+
)&-
)+-
"&-
"+-
!&-
!+-
D#@%6$021@'*<%ONIJ%
R -(3(%2/3%(B('.(S.#%3/%*(.*0.(3#%$(3#1%
Female Non-Hodgkin’s Lymphoma Rates (1989-2005)unadjusted incidence rates per 100,000 populationFI
GURE 23
Cancer in New Brunswick Communities: Investigating the environmental connection Part 2 43
*Data not available to calculate rates.

lupus, celiac disease) are at increased risk of NHL211
A very small portion of the overall increase in NHLhas been attributed to the increased incidence ofAIDS, since approximately 10% of people who haveHIV develop non-Hodgkin’s lymphoma. A number ofother viruses and microbes have also beenassociated with NHL. However, both immunedeficiency and viruses account for a relatively smallproportion of total NHL cases. Hereditary andfamilial lymphomas also account for a very smallpercentage of all NHL cases.212
Hundreds of studies have evaluated the role ofsmoking, diet, alcohol consumption, overweight/obesity and physical inactivity as risk factors forNHL. In general, most studies found no strong orconsistent associations between these lifestylefactors and increased risk of NHL. Many studies onalcohol consumption and sunlight have found aninverse relationship with NHL; moderate alcoholconsumption and sun exposure appear to be aprotective factor against NHL.213
Cancer is a disorder in cell growth, and cellreplication is under the control of genes. While theactual mechanisms responsible for initiating cancerare complex and unknown, it is well known thatviruses, various forms of radiation and somechemicals affect gene replication and/or repair.When cells lose the ability to replicate withouterrors or the DNA repair mechanism does not workproperly, abnormal growth occurs. In the case ofNHL, researchers believe that chronic antigenstimulation (in response to a harmful substances)causes specific cells (B-cells) in the lymph nodes toproliferate, which in turn increases the chance of arandom genetic mistake and can result in abnormaltissue growth (cancer).214
Many researchers believe the dramatic rise in NHLrates (as well as other cancer types) since the 1950scould be related to exponential increases in
carry cancerous cells between various parts of thebody in a process called metastasis.
There are more than 40 different types of lymphomas.Non-Hodgkin’s lymphoma (NHL), one of the morecommon lymphomas, is part of a group ofapproximately 20 cancers that arise primarily in thelymph nodes.202
Incidence rates of NHL have increased dramatically indeveloped countries.203 In Canada, NHL rates doubledin almost every age group between 1970 and 1990.204
Since then rates appear to have reached a plateaudepending on the age group.205
Lymphomas are the third most common (leukemiasand central nervous system cancers are first andsecond) cancers among children (0-14 years of age)in Canada; incidence rates for Hodgkin’s disease arehigher than those for non-Hodgkin’s lymphoma inNew Brunswick.206 Lymphomas (Hodgkin’s and non-Hodgkin’s combined) are also the most commonlydiagnosed cancer in Canadian adolescents and youngadults (15-29 years of age).207 The rate among malesin this age category is almost 20% higher comparedto that among females.
In Canada, cancer incidence rates in children arehighest among the 0 to 4 age category.208 Malestend to have higher cancer incidence rates thanfemales. For lymphomas, the ratio of males tofemales for new cases (0-4 years of age) in Canada is2.1 to 1.209 NHL incidence rates in Canada doubledamong children 0 to 4 years of age between 1970and 1990.210
Non-Hodgkin’s Lymphoma Risk FactorsThe best described (although not the main) riskfactor for NHL is immune deficiency. People onimmune suppression therapy after organ transplants,with HIV/AIDS or with congenital immunologicaldeficiencies (e.g. rheumatoid arthritis, systemic
Cancer in New Brunswick Communities: Investigating the environmental connection Part 244

crop land in New Brunswick sprayed with herbicides,insecticides and fungicides increased 19%, 11.2%and 11.5 % respectively, with further increasesreported in 2005. Most of New Brunswick’s large-scale potato production is concentrated in Carletonand Victoria counties.
New Brunswick also had the largest and longest-running aerial pesticide spray program in Canada forcombating spruce budworm. Spray operations wereconducted every year beginning in 1959. A veryconservative estimate of the amount of pesticidesused in the spray program between 1952-1990 is100,000 tonnes. Between 1975 and 1986, a total of19.4 million hectares of forest in New Brunswickwere treated with pesticides.221 The only otherprovince that came close to that figure was Quebecwith 13.7 million hectares, followed byNewfoundland with 0.598 million, Nova Scotia with0.22 million and Ontario with 0.28 million hectares.The 1984 Spitzer task force which examined theincidence of cancer and the use of pesticides tocontrol spruce budworm in New Brunswick’s forestsconcluded that stomach, uterine and lymphaticsystem (other than leukemia) cancers were highestin counties with above average spraying of forestpesticides (Northumberland, Victoria, andRestigouche counties).
A decades old ground and aerial herbicide sprayprogram also takes place at Canadian Forces Base(CFB) Gagetown. Between 1956 and 2004, a total of37 different herbicide products were used. A 2006federal government study on herbicide use at CFBGagetown found that, for men involved with aerialand ground spraying of pesticides, there wassufficient evidence or a positive association betweensome herbicide exposures and various cancersincluding non-Hodgkin’s lymphoma.222
In general, NHL rates among New Brunswick malesand females (1992-2005) are higher than national
pesticide and other chemical use over this period.Exposure to pesticides, including herbicides andfungicides, and incidence rates of NHL have beenthe subject of hundreds of epidemiologicalstudies.215 Evidence for a link betweenorganochlorine and organophosphate pesticides,herbicides, fungicides and NHL is variable andinconsistent. There are many reasons for differentconclusions among these studies. The number ofpeople participating in a study, the magnitude andduration of exposure to a pesticide or chemical,exposures to multiple substances and the timing of astudy post-exposure can all influence study resultsand limit the comparability of study conclusions.Despite these factors, most studies consistently finda link between the risk of NHL and exposure tophenoxy herbicides such as 2,4-D.216 Also, studies onoccupational exposure and NHL consistently findthat crop farmers and machinists are at higher riskof NHL and this risk increases with their duration ofemployment.217 Occupational exposure to PCBs,personal hair dyes, diesel exhaust and organicsolvents have also been linked to increased risk ofNHL.
New Brunswick is one of Canada’s largest producersof potatoes. Large-scale potato production requiresthe application of multiple pesticides, particularlyfungicides, to control a wide range of pests anddiseases. A 1984 New Brunswick task force on theenvironment and cancer reported that, in 1976, 500tonnes of pesticides were applied to about 50,000hectares of agricultural land (10 kg/ha).218 Thisfigure included fungicides (49%), insecticides (25%)and herbicides (20%).219 In 2001, Prince EdwardIsland (Canada’s largest producer of potatoes) andNew Brunswick spent more on herbicides,insecticides, fungicides and other chemcials (notincluding fertilizers) per hectare of land in crops($121 and $74 respectively) than any of the otherprovinces.220 Between 1995 and 2000, the area of
Cancer in New Brunswick Communities: Investigating the environmental connection Part 2 45

Hodgkin’s DiseaseData were not available to calculate the provincialunadjusted incidence rates of Hodgkin’s disease(sometimes referred to as Hodgkin’s lymphoma)between 1989 and 2005. Average, unadjustedHodgkin’s disease incidence rates per 100,000population for New Brunswick males and females(1992-1996) were 2.7 and 2.1 respectively and theunadjusted rates for 1997-2001 were 2.1 and 0.8 formales and females respectively.225
Among the study areas where data were available,males in Miramichi and females in Fredericton hadthe highest rates of Hodgkin’s disease (Figures 25and 26).
Hodgkin’s disease is a type of lymphoma that startin the lymph nodes and then spreads to surroundingareas of the body. The frequency of occurrence in thepopulation is very low, and it affects mostly (but notexclusively) men between the ages of 15 and 40 andmen over 50. Hodgkin’s disease and non-Hodgkin’slymphoma may cause similar symptoms, but theconditions themselves are different. Rates ofHodgkin’s disease have been declining. Thedistinction between Hodgkin’s disease and non-Hodgkin’s lymphoma is made by examining tissue
(taken from a biopsyor aspiration of thetumor tissue) under amicroscope. The typeof abnormal cellsidentified in thesample determineswhether a lymphomais classified asHodgkin’s disease ornon-Hodgkin’slymphoma.
rates (Figure 24).223 The average ASIRs for NHL inCanada (1989-2005) for males and females were18.5 and 13.3 respectively. For the same timeperiod, NHL rates for New Brunswick males andfemales were 19.7 and 14.5 respectively. On average(2000-2005), males in New Brunswick had thehighest incidence rates of NHL among all theCanadian provinces.224
In this study, areas with potentially highoccupational and environmental exposure topesticides (agricultural, forestry or militaryexposures) include the Upper Miramichi, Drummond-Denmark, Base Gagetown, Harvey and Minto areasand the communities of Dalhousie, Bathurst andMiramichi where forestry-related employment hasbeen historically high. Rates of NHL in these areaswere above, at or below provincial rates dependingon sex. Except for the 1984 Spitzer task force and2006 CFB Gagetown study, no other health studies orrisk assessments have been done on workers orresidents exposed to agricultural or forest pesticidesin New Brunswick. In order to determine whetherthere is link between historic agricultural and forestpesticide use in New Brunswick and the higher thanaverage NHL rates in the province, appropriateepidemiological studies should be done.
Cancer in New Brunswick Communities: Investigating the environmental connection Part 246
0
5
10
15
20
25
30
1992 1993 1994 1995 1996 1997 1998 1999 2000 2001 2002 2003 2004 2005
Canada - Males
Canada - Females
New Brunswick - Males
New Brunswick - Females
!"#"$%&'()*+$%#"#,-#,)-$."/"0"$12'34$5667$..8$9,3*:$
Non-Hodgkin’s Lymphoma Rates for Canada and New Brunswick (1992-2005)Age-standardized rates per 100,000 populationFI
GURE 24

disease.227 Adults and children treatedfor Hodgkin’s disease are at higher riskof developing secondary primarycancers.228 Patients treated withradiation for Hodgkin’s disease werealso at higher risk of developingcardiovascular diseases and strokes.229
Occupational exposure to solvents,aromatic hydrocarbons (e.g. toluene,benzene, xylene) and employment inpaper mills and woodworking havebeen identified as potential risk factorsfor Hodgkin’s disease.230 Historically, ahigh percentage of males in Miramichiworked in paper mills and wood-processing industries (e.g. plywoodand oriented strandboard mills). TheMiramichi pulp and paper mill was thelargest kraft paper mill in Canada. (Itclosed in 2007.)
Appropriate epidemiological studies areneeded to assess the role occupationalexposure may play in the higher ratesof Hodgkin’s disease among men inMiramichi compared with those in theother urban and rural areas examinedin this study.
Hodgkin’s Disease Risk FactorsLike non-Hodgkin’s lymphoma, immune deficienciesand infectious diseases are risk factors for Hodgkin’sdisease.226 Genetic susceptibilities are a smallpercentage of the risk factors for the disease. Thereis little evidence that lifestyle (e.g. smoking, alcoholconsumption) are risk factors for Hodgkin’s
Cancer in New Brunswick Communities: Investigating the environmental connection Part 2 47
!"!#
$"%#
$"$#
& & & & & & & & & & &
0
1
2
3
4'()#*+,-.)/01#$"2#
345(+46(#,-478,.9(7#+49(#2::$;2::%<#
&=494#->9#454/?4@?(#9>#04?0,?49(#+49(.#
Female Hodgkin’s Disease Rates (1989-2005)unadjusted incidence rates per 100,000 populationFI
GURE 26
4.13.7
3.43.2
* * * * * * * * * *0
1
2
3
4
5New Brunswick 2.7
(average unadjusted rate 1992-1996)
Male Hodgkin’s Disease Rates (1989-2005)unadjusted incidence rates per 100,000 populationFI
GURE 25
*Data not available to calculate rates.

adults; 2) chronic myeloid leukemia (CML); 3) acutelymphocytic leukemia (ALL), the most common typeof leukemia (and cancer in general) among youngchildren (0-14 years of age); and 4) acute myeloidleukemia (AML) which occurs in both adults andchildren. (Hairy cell leukemia (HCL) is a rare type ofchronic leukemia.)
LeukemiaData were not available to calculate the provincialunadjusted incidence rates of leukemia between1989 and 2005. Average, unadjusted leukemiaincidence rates per 100,000 population for NewBrunswick males and females (1992-1996) were 11.4and 8.2 respectively.231 The unadjusted rates for1997-2001 were 13.8 and 8.1 for malesand females respectively.232
Male and female leukemia rates werewell below the unadjusted provincialrates (1992-2001) for thosecommunities where data were available(Figures 27 and 28). Leukemiaincidence rates in New Brunswick areamong the lowest in Canada.233 Malesin Prince Edward Island generally havethe highest incidence rates in Canada(1998-2005).234
Leukemia is a type of cancer of thebone marrow and blood. There arenumerous types of leukemia which areclassified in several ways. They aregrouped based on how quickly thedisease develops and progresses.Leukemia is either chronic (gets worseslowly) or acute (gets worse quickly).Leukemias are also grouped by the typeof white blood cell affected. Leukemiacan arise in lymphoid cells or myeloidcells. Leukemia that affects lymphoidcells is called lymphocytic leukemia.Leukemia that affects myeloid cells iscalled myeloid leukemia or myelogenousleukemia.
There are four common types ofleukemia: 1) chronic lymphocyticleukemia (CLL) which affects mostly
2.2 2.1 2.0
* * * * * * * * * * *
0
1
2
3
4
5
6
7
8
9
!"#$%&'()#*+,$-./$$
0'(123')4"2$&14"$/5567899/:$
;<141$(=4$1>1*?1@?"$4=$+1?+'?14"$&14")$
Female Lukemia Rates (1989-2005)unadjusted incidence rates per 100,000 populationFI
GURE 28
55..8844..88
22..77 22..66
** ** ** ** ** ** ** ** ** **0
2
4
6
8
10
12
14
16
!"#$%&'()#*+,$-./0$
1'(234')5"3$&25"$-66789::-;$
!"#$#%%&'$%#(#)*#+*,%$'%-#*-.*#$,%/#$,0%
Male Lukemia Rates (1989-2005)unadjusted incidence rates per 100,000 populationFI
GURE 27
Cancer in New Brunswick Communities: Investigating the environmental connection Part 248

children breathe more air, eat more food and drinkmore water than adults. Therefore, children will beexposed to higher levels of toxic substances thanadults even when concentrations in the environmentare very low. Several studies have confirmed a linkbetween benzene and pesticide exposure and therisk of leukemia in children.239
Childhood and residential exposure to non-ionizingradiation, particularly electromagnetic field (EMF)radiation from certain power, electrical and wirelessdevices (e.g. cellular phones) have been linked toseveral adult cancers as well as to childhoodleukemia and brain cancer, and also to other non-cancer diseases.240 The International Agency forResearch on Cancer (IARC) has classified extremelylow frequency magnetic fields (ELG) as a possiblehuman carcinogen based on the consistentepidemiological evidence of an association betweenchildhood leukemia and ELFs.241 Children are morevulnerable to ELFs (as well as ionizing-radiation)because their nervous systems are developing, theirbrain tissue is more conductive, penetration isgreater relative to head size and they may have alonger lifetime exposure than adults.
Generally, leukemia rates among men (and boys) arehigher than among women (and girls). Leukemia isthe most common childhood cancer in Canada.Between 2000-2004, leukemia accounted for 33% ofnew cases of cancer among Canadian children 0-14years of age.235
Leukemia Risk FactorsGenetic and familial risk factors play a small role inthe occurrence of leukemia. The evidence for lifestyledifferences (e.g. smoking, obesity and dietary intake)as risk factors for leukemia is variable depending onthe leukemia type. Evidence linking smoking toleukemias, particularly myeloid leukemias, is strongerand more consistent than the evidence for obesity.236
Studies have shown no relationship between maternalor parental smoking and childhood leukemia but haveshown an increased association with alcoholconsumption before or during pregnancy.237 (However,maternal smoking and alcohol consumption have beenlinked to a wide range of other childhood diseasesand health problems.)
Established environmental and occupational riskfactors for leukemia include exposure to benzene,formaldehyde, solvents, pesticides, high dose ionizingradiation and chemotherapy. Several studies havelinked higher risks of leukemia and non-Hodgkin’slymphoma for residents living in close proximity to oilrefineries, petrochemical industries, gas stations andbus depots, as well as for workers associated withthese industries.238
The developing fetus as well as children areparticularly vulnerable to the affects of chemicalexposure. In the womb, toxic substances can passfrom the mother via the placenta into thedeveloping fetus. At birth, children’s lungs andkidneys and their immune and digestive systems arestill not fully developed. Their bodies don’t have thesame ability as those of adults to metabolize andeliminate toxic substances. Pound for pound,
Cancer in New Brunswick Communities: Investigating the environmental connection Part 2 49

incidence rates (ASIRs) per 100,000 population forNew Brunswick for the same time period. Based onStatistics Canada data, the average ASIRs for braincancer among New Brunswick males and females per100,000 population (1989-2005) were 7.8 and 5.3respectively.242 Average unadjusted brain cancerincidence rates for New Brunswick males and females(1992-1996) were 7.2 and 6.3 respectively, and theunadjusted rates for 1997-2001 were 8.3 and 5.9 for
males and females respectively.243
Males in Fredericton, the UpperMiramichi area and Bathurst had braincancer rates 25% above the provincialrate (Figure 29). Men in Moncton,Edmundston and Saint John had ratesslightly above the provincial rate formales. Females in the Base Gagetownand Upper Miramichi areas had braincancer rates 82% above the provincialrate (Figure 30). Rates among women inFredericton, Miramichi, Moncton andSaint John were also slightly above theprovincial rate.
Brain tumours are classified by cell typeand location. Cancers of the glial cells(gliomas) are the most common primarybrain tumour. Glial cells are non-neuralcells that surround nerve cells andphysically hold them in place. Theyperform housekeeping functions forneurons such as clearing out debris andexcess materials, providing nutritionand responding to injuries. Theyprevent nerve impulses from travelingbetween adjacent neurons. It isestimated that there are 10 to 50 timesmore glial cells than there are neuronsin the brain. There are numerous typesof gliomas and a glioblastoma is the
Brain (and central nervous system)cancersThe provincial unadjusted incidence rates of brainand central nervous system (CNS) cancers per100,000 population (1989-2005) were 8.0 for malesand 6.0 for females. (Herein, brain cancers will referto both brain and CNS cancers.) These rates areconsistent with the average age-standardized
1100..99 1100..99
88..22
77..00 66..88 66..44
55..0033..88
** ** ** ** ** **0
2
4
6
8
10
12
New Brunswick 6.0
D;"("%+)(%"B"1<"E<$%()%3"<39<"($%-"($#%
Female Brain Cancer Rates (1989-2005)unadjusted incidence rates per 100,000 populationFI
GURE 30
10.2 10.1 10.09.3
8.7 8.3 8.1
* * * * * * *0
2
4
6
8
10
12
!"#$%&'()#*+,$-./$
Male Brain Cancer Rates (1989-2005)unadjusted incidence rates per 100,000 populationFI
GURE 29
Cancer in New Brunswick Communities: Investigating the environmental connection Part 250
*Data not available to calculate rates.
*Data not available to calculate rates.
Smoking has not been linked to increased risk ofbrain cancers.249 The IARC does not list the nervoussystem as a target organ for smoking-inducedcancers. Some studies have linked maternal dietshigh in cured meats during pregnancy to increasedrisk of brain cancers in children.250 These foodscontain high levels of nitrites and can contain N-nitroso compounds which have been identified aspotent neurocarcinogens.
Many environmental and occupational risk factorshave been linked to increased rates of brain cancer.Various studies have linked employment asfirefighters, electronics equipmentmanufacturers/operators, metal processors,construction trades workers and transport equipmentoperators to increased risks of brain cancer.251 Thefour most common neurocarcinogens are acrylamide,1,3 butadiene, N-nitroso compounds and polycyclicaromatic hydrocarbons (PAHs).252 Chemicalscommonly cited in occupational exposures includemetals (particularly lead), asbestos, benzene andother petroleum products, mineral or lubricating oils,pesticides, solvents and hair dyes.253 Children’sexposure to these chemicals have also beenidentified as potential risk factors for brain cancer.254
A federally-sponsored study on the effects ofherbicide use in the Base Gagetown area found thatbrain cancer incidence rates for females weresignificantly higher than the provincial rates forfemales during the years 1989-1993 but not for theyears 1994-1998. The federal study found that braincancer incidence for males were not significantlyelevated compared with rates for the province.
The results of the present study found that braincancer incidence rates among women in the BaseGagetown and Upper Miramichi areas were 82%higher than the provincial rate and the highestamong the 14 study areas. Unlike the federally-
most frequently occurring brain cancer type.Secondary brain tumours are tumours that wereinitiated elsewhere in the body and then spread(metastasized) to the brain. For example, secondarybrain tumours could begin as breast or lung cancers.
Brain cancers are the second most common canceramong children (0-14 years of age) in Canada; thehighest rate occurs in the 0-4 age category.244
Worldwide, overall incidence of brain cancers rose1-2% during the 1980’s and 1990s.245 There is noconsensus among scientists as to why these rateshave increased, but many researchers believe thatimprovements in diagnostic procedures do not fullyexplain the increases.
Brain cancer risk factorsEstablished risk factors for brain cancer are rarehereditary syndromes, immune suppression andtherapeutic radiation. These factors account for avery small percentage of brain cancers. Children,particularly those younger than 5 years of age,treated with radiation for other cancers are at highrisk of developing brain tumours.246
Increasing public concern about potential healthrisks from extremely low frequency electromagneticfields (ELFs) and radiofrequency/microwave radiationemissions (RF) from wireless communications hasstimulated considerable scientific study and policydebate. ELFs and RFs have been linked to a widerange of cancers (e.g. leukemia and brain, breastand lung cancers) and other non-cancer effects (e.g.neuro-degenerative diseases, immune systemderegulation, allergic and inflammatory responses,miscarriages and some cardiovascular effects.247
Evidence of a link between ELFs and leukemia isstrong and consistent. Some studies have linkedlong-term exposure (10 years +) to RFs, particularlycellular phone use, and to brain tumours whileothers have not.248
Cancer in New Brunswick Communities: Investigating the environmental connection Part 2 51

It was not possible to calculate bone cancerincidence rates among females in any of the 14urban and rural areas in this study due to low cancercounts. Among males, bone cancer rates could onlybe calculated for Saint John (Figure 31). The rateamong Saint John males was 50% above theprovincial unadjusted incidence rate (1997-2001).
Primary bone cancers are rare, and when they dooccur it is mostly in children and adolescents. Bonecancer involving older adults is most commonly theresult of metastatic spread from another tumour.Bone cancer counts among males in Saint John werehighest among the 15-20 age group followed by the50+ age group.
There are many different types of bone cancer.Osteosarcoma is the most common primarymalignant bone cancer.256 It most commonly affectsmales between the ages of 10 and 25 but can affectolder adults less commonly. This type of cancer isoften very aggressive with risk of spread to thelungs. Ewing’s sarcoma is the most aggressive bonetumour and generally affects younger people
between 4-15 years of age.257 It is morecommon in males and is very rare inpeople over 30 years old.
Chondrosarcoma is the second mostcommon bone tumour and accounts forabout 25% of all malignant bonetumours.258 These tumours arise fromthe cartilage cells and can either bevery aggressive or relatively slow-growing. Unlike many other bonetumours, chondrosarcoma is mostcommon in people over 40 years of age.It is slightly more common in malesand can potentially spread to the lungsand lymph nodes. Chondrosracoma mostcommonly affects the bones of thepelvis and hips.
sponsored study, the Base Gagetown study area inthis study encompassed a much smaller geographicarea and did not include the city of Frederictonwhich was a separate study area. In this study, braincancer rates (1989-2005) among Base Gagetownfemales were 33% higher than rates among womenin Fredericton (Figure 29, page 50). Brain cancerrates among males in Fredericton, Upper Miramichiarea and Bathurst were the highest among the 14study areas and 25% above the provincial rate. Anappropriate epidemiological study is needed todetermine why women in the Base Gagetown andthe Upper Miramichi areas have brain cancerincidence rates significantly above the provincialrate.
Bone (and joint) CancersData were not available to calculate the provincialincidence rates of bone (and joint) cancers between1989 and 2005. Average unadjusted bone cancerincidence rates per 100,000 population for NewBrunswick males and females (1997-2001) were 0.9and 2.8 respectively.255
Cancer in New Brunswick Communities: Investigating the environmental connection Part 252
EFG&
:
:"@+
:"#+
:"%+
:"A+
!
!"@+
!"#+
!"%+
H,@&5+2$3@#.=&&IFJ&
K2$"-L23%,-&#$.#-,$.,-&+"%,&EJJM<NIIEB
O0"%"&$(%&"B"#1"P1,&%(&."1.21"%,&+"%,3&
O O O O O O O O O O O O O
Male Bone Cancer Rates (1989-2005)unadjusted incidence rates per 100,000 populationFI
GURE 31

Bone (and joint) Cancer Risk FactorsExposure to high doses of ionizing radiation andradioactive material that build up in bones (e.g.radium, strontium and plutonium) increase the riskof developing bone cancer.259 Evidence of low-doseenvironmental exposure to radiation or radioactivematerial and increased risk of bone cancer is variableand inconsistent. However, diagnostic radiation andradiation therapy used to treat primary cancers doesincrease the risk of developing second cancersincluding bone cancer. Cancer radiation therapy canalso result in a wide range of other non-cancer bonediseases such as osteoporosis (low bone mineraldensity) and osteomalacia (softening of thebones).260
The occurrence of certain primary cancers increasesthe risk of developing secondary cancers or eventertiary cancers because tumour cells from theprimary site can migrate to other organs.261 Thecommon “homing site” for cells from various primarytumours is bone.262 The skeleton is the most commonmetastatic sites for breast cancer.263 Metastasis tothe bone has also been associated with prostate,lung, colorectal and pancreatic cancers.
Rates of lung, breast, prostate and various othercancers in Saint John are higher than provincialrates and higher than rates in many of the otherstudy areas. Given these results, the high rate ofbone cancer among males in Saint John could resultfrom metastases from primary sites, particularly forthose in the 50+ age category. Diagnostic radiationand radiation therapy used to treat primary cancer atan earlier age could account for the incidence ofbone cancers among younger males (15-20 agecategory). Children and adolescents are moresusceptible than adults to radiation-inducedsecondary cancers, particularly leukemia and brain,breast, bone and thyroid cancers.264 As yetunidentified environmental factors could also
account for the higher bone cancer rates amongmales.
Cancer in New Brunswick Communities: Investigating the environmental connection Part 2 53

Cancer in New Brunswick Communities: Investigating the environmental connection Part 254
Due to insufficient data, cancer incidence ratescould not be calculated for some cancer typesand some of the communities studied.
Therefore, overall cancer rankings were limited tothose cancer types where data were complete for allstudy areas. For males, overall ranking was based onfour major cancer types (lung, colorectal, prostateand bladder) and, for females, it was based on threecancer types (lung, colorectal and breast). Tables 6and 7 summarize the rankings among the 14communities studied based on cancer types andoverall cancer incidence. The tables also identitythose study areas where cancer incidence rates were25%, 50%, 75% and 100% above the provincialrates for 1989-2005.
For males, Dalhousie ranked highest among all thecommunities studied, based on four major cancertypes (Table 6). The Minto and Harvey areas weresecond and third respectively, and Saint John rankedfourth. The Upper Miramichi area, Belledune andEdmundston were fifth, sixth and seventhrespectively. Among males in Dalhousie, incidencerates of lung, colorectal, prostate and bladdercancer and non-Hodgkin’s lymphoma were 51%,93%, 61%, 50% and 118% respectively aboveprovincial rates. Males in the Minto area had lung,colorectal and bladder cancer rates ranging from 50to 99% above the provincial rates for these cancers.
Where data were available, males in Caraquet andthe Drummond-Denmark and Base Gagetown areasgenerally had the lowest cancer incidence ratesamong the 14 study areas, with one exception.
Males in Caraquet had the highest rate of pancreaticcancer, more than 100% above the provincial rate.
Overall, females in Minto ranked highest among the14 communities studied based on three major cancertypes (Table 7). Dalhousie and Bathurst both rankedsecond highest, and Saint John and the UpperMiramichi area were third. The Harvey area andMiramichi ranked fourth and fifth respectively.Incidence rate for lung and colorectal cancersamong females in the Minto area were 75% abovethe provincial rates for these cancers, and rates ofbladder cancer and non-Hodgkin’s lymphoma were65% and 36% higher than the provincial rates.Females in Dalhousie had rates of lung, bladder,kidney, non-Hodgkin’s lymphoma, pancreatic andovarian cancer that were 50-99% higher than theprovincial rates. Females in Bathurst had rates ofkidney and pancreatic cancer that ranged between70% and 95% above the provincial rates.
As with males, females in Caraquet and theDrummond-Denmark and Base Gagetown areasgenerally had the lowest cancer rates among the 14communities studied, with one exception. Women inthe Base Gagetown area had the highest incidencerate of brain cancer, along with women in the UpperMiramichi area.
Overall Cancer Incidence

Cancer in New Brunswick Communities: Investigating the environmental connection Part 2 55
Base Gagetown Area
Bathurst
Belledune Area
Caraquet
Dalhousie
Drummond-Denmark Area
Edmundston
Fredericton
Harvey Area
Miramichi
Minto Area
Moncton
Saint John
Upper Miramichi Area
Lung Colorectal Prostate
Non-Hodgkin’s
Lymphoma
Individual Cancers
Bladder Kidney Pancreas Brain Thyroid1
Hodgkin’sDisease1
OverallRank2Leukemia1Urban/Rural Area
11 13 12 13 7 12 7 * * * * 11
6 6 5 4 6 6 6 3 * * * 5
4 10 1 * 11 1 * * * * * 7
14 12 13 9 13 8 1 * * * * 12
2 1 2 1 1 2 3 * * * * 1
12 14 14 11 14 11 8 * * * * 13
5 4 10 7 12 10 9 5 1 * 1 8
13 9 8 8 8 9 10 1 4 3 4 9
8 3 3 2 3 * * * * * * 3
9 8 11 10 10 5 11 7 2 1 * 9
1 2 4 3 2 * 2 * * * * 2
10 11 9 6 9 7 4 4 5 2 3 10
3 5 6 5 5 4 5 6 3 4 2 4
7 7 7 12 4 3 * 2 * * * 6
Table 6. Male cancer rankings among 14 urban and rural areas in New Brunswick (1989-2005)
25-49% above provincial rate
50-74% above provincial rate
75-99% above provincial rate
100 +% above provincial rate
Base Gagetown Area
Bathurst
Belledune Area
Caraquet
Dalhousie
Drummond-Denmark Area
Edmundston
Fredericton
Harvey Area
Miramichi
Minto Area
Moncton
Saint John
Upper Miramichi Area
Lung Colorectal Breast
Non-Hodgkin’s
Lymphoma
Individual CancersBladder Kidney Pancreas Brain Thyroid1
Hodgkin’sDisease1
OverallRank3Leukemia1
Urban/Rural Area
Table 7. Female cancer rankings among 14 urban and rural areas in New Brunswick (1989-2005)
1 Insufficient data to calculate provincial rates for the same time period.2 Ranking based on lung, colorectal, prostate and bladder cancer ratesonly.3 Ranking based on lung, colorectal and breast cancer rates only.* Insufficient data to calculate incidence rates
Ovary
12 14 13 * 8 * 9 1 * 4 * * 9
5 3 5 7 9 2 1 6 8 2 * * 2
8 4 11 * * * * * * * * * 6
13 12 12 4 * * 3 * * * * * 8
2 7 4 2 1 1 2 * 1 * * * 2
14 13 14 10 5 5 8 * * * * * 10
7 11 9 11 7 8 10 7 7 1 1 * 7
10 8 1 9 10 7 11 2 4 6 * 2 7
9 5 3 * * * * * * * * * 4
4 10 7 5 6 3 4 3 3 3 * * 5
1 1 10 3 2 * * * * * * * 1
6 9 8 6 4 6 7 4 6 7 2 1 6
3 6 6 8 3 4 5 5 5 5 3 3 3
11 2 2 1 * * 6 1 2 * * * 3

Cancer in New Brunswick Communities: Investigating the environmental connection Part 256
Avery small percentage of cancers (2-10%) arelinked to genetic mutations or syndromes. Theconsensus among the majority of health
researchers is that most cancers are preventable.Since genetic factors play a small role in mostcancers, shared family lifestyle factors (e.g. diet,smoking, alcohol consumption, physical inactivity,reproductive history), as well as occupational andenvironmental exposures are important forunderstanding why cancers occur.
The traditional definition of ’environment’ amonghealthcare professionals and policy makers covers awide range of factors including lifestyle factors(smoking, alcohol consumption, physical inactivity,excess weight and obesity), pollution, viruses,bacteria, sunlight, medications (e.g. estrogenreplacement therapy) and medical procedures (e.g.chemotherapy, radiation). This list of factors is a mixof initiating (or causal) factors and risk factors, adistinction that is important to cancer experts.265
Cancer initiating factors or agents are those physical(e.g. ionizing radiation and particles like asbestosand silica), chemical (e.g. arsenic, benzene,chlorinated compounds) and biological (e.g. viruses)factors that can cause mutations. Risk factors, on theother hand, are activities such as smoking andalcohol consumption, air pollution or occupationthat enhance or increase exposure to cancer-causingagents. The proportion of cancer deaths that havebeen attributed to so-called “classic” lifestyle factors(such as smoking, alcohol consumption, diet, andexcess weight/obesity) range from 25% to 45%, withsmoking being the most significant lifestyle factor.266
Data on key lifestyle risk factors at the communitylevel were not available for this study. This type ofdata is available only at the provincial or healthregion level. Published data on cancer incidence invarious occupational settings were also unavailable.Industrial pollutant releases and air quality data wereavailable, but only for some communities. Thisabsence/scarcity of data made it impossible toundertake any statistical analysis to examine thepotential links between cancer incidence rates andthese risk factors. Table 8 summarizes key lifestyle,environmental and occupational risk factors linked toeach type of cancer examined in this study based onpeer-reviewed scientific publications.
Table 9 summarizes potential environmental andoccupational exposures to selected carcinogens inthe 14 communities studied. Information onenvironmental contaminants in communities waslimited. The information that is available is based onstudies and monitoring reports prepared by federaland provincial agencies and/or industry, and onindustrial pollutant release data available fromEnvironment Canada. Information on occupationalexposure is based on studies done elsewhere whichdeal with industrial operations similar to thoselocated in the 14 New Brunswick communities thatare examined in this report. (see Table 1, page 11)
When we compared the risk factor information inTables 8 and 9 with the ranking of individual andoverall cancer rates among communities (Tables 6and 7), we noted the communities that have higheroverall rates of cancer, such as Dalhousie, Minto,
Overall Risk Factors

Cancer in New Brunswick Communities: Investigating the environmental connection Part 2 57
Cancer Type Lifestyle Environmental Occupational
Lung - smoking
- PAHs, silica, asbestos,wood dust, benzene, arsenic,cadmium, chromium, beryllium and nickel in outdoor airpollution- residential radon exposure- arsenic in drinking water
- smelter workers- uranium, coal and base-metal miners- petroleum refinery and petrochemical workers- wood products manufacturers- transportation workers
Colorectal * - pesticides
- agricultural workers, landscapers and pesticide applicators- textile workers- metal machinists- firefighters
Breast - hormone use/ treatments
- pesticides, plasticizers,metals, solvents, PAHs, dioxinsfound in food, air and/or drinking water- exposure to ionizing (e.g. gamma and x-rays, CT scans)and non-ionizing (e.g.microwaves, low-frequencyelectromagnetic fields) radiation
- pesticide applicators- radiologists and radiologic technicians
Ovarian - hormone use/treatments
- pesticides, plasticizers,metals, solvents, PAHs anddioxins found in food, air and/or drinking water
- agricultural workers- pesticide applicators
Thyroid *- ionizing radiation associated with x-rays, CT scans,sunlight, high-voltage equipment, cancer treatmentsand gamma rays associated with nuclear reactions
- radiologists and radiologic technicians
Prostate *- arsenic in drinking water- cadmium in air and/or drinking water
- agricultural workers, landscapers and pesticide applicators- base-metal miners and smelter workers
Bladder - smoking- arsenic in drinking water- trihalomethanes in drinking water- PAHs in air pollution
- coal and base-metal miners- base-metal smelter workers- metal machinists- transportation workers
Kidney - smoking - arsenic, lead and cadmium in food, air and/or water - base-metal mining and smelter workers
Pancreatic - smoking- emissions from industries associated with nickelsmelting, plating and battery production
- computer manufacturing- food industry workers- electrical workers- nickel smelting, plating and battery production
Non-Hodgkin’sLymphoma * - residential pesticide use - agricultural workers, landscapers and pesticide applicators
Hodgkin’s Disease *
- emissions and leakage from industries associated withsolvent use such as dry cleaners; paint, adhesive andvarnish manufacturing- residential pesticide use
- pulp and paper mill workers- woodworkers- agricultural workers, landscapers and pesticide applicators
Leukemia *
- ionizing and non-ionizing radiation- chemotherapy- pesticides- benzene and butadiene in air and/or water
- petroleum industry workers- agricultural workers, landscapers and pesticide applicators- firefighters- laboratory and hospital workers
Brain *- ionizing and non-ionizing radiation- benzene and toluene in air- pesticides
- firefighters- oil refinery and petrochemical workers- agricultural workers, landscapers and pesticide applicators
Bone *- high doses of ionizing radiation- diagnostic radiation and radiation therapy
*
Risk Factor Type
1 References to specific studies linking risk factors to cancer types can be found at the end of this report.* No consistent or conclusive risk factors have been identified.
Table 8. Summary of key lifestyle, environmental and occupational risk factors linked to 14 cancer types.1

Cancer in New Brunswick Communities: Investigating the environmental connection Part 258
1 See notes 5,6, 8,10, 13, 17, 22, 24, 32, 36, 41, 43 and 45 for study references. Data on industrial releases of pollutants by communitycan be found on Environment Canada’s National Pollutant Release Inventory website at http://www.ec.gc.ca/inrp-npri2 A list of known and probable carcinogens can be found on the International Agency for Research on Cancer website http://www.iarc.fr
Saint John and Belledune, seem to have moreindustrial activity and/or potential forenvironmental contamination than communities thathave lower rates of cancer such as Caraquet and theBase Gagetown and Drummond-Denmark areas.Studies done in locations outside New Brunswickhave identified (geographic) associations betweenresidential (or work site) proximity to known orlikely sources of industrial pollution and higher ratesof cancer (and other diseases).267
Some of the 14 New Brunswick communities studied
appear to share high rates of specific cancers andone or more of the occupational and environmentalrisk factors known to be associated with thosecancers. For example, lung cancer rates among malesand females in the Minto area, Dalhousie and SaintJohn were found to be the highest among the 14communities studied. These communities are alsoknown to have been subjected to substantial, longterm releases of industrial pollutants, including fineparticulates and carcinogens (see Figures 4 and 5,page 23). Many workers in these communities are
Table 9. Potential environmental and occupational exposure to selected known and probable carcinogens in14 urban and rural areas in New Brunswick (1989-2005)1
Community/Area ArsenicBenzene and/ or
other volatile organiccompounds (VOCs)
Cadmium Formaldehyde Lead Nickel PesticidesPolycylic aromatic
hydrocargons(PAHs)
Radon WoodDust
Base Gagetown Area
Bathurst
Belledune Area
Caraquet
Dalhousie
Drummond-DenmarkArea
Edmundston
Fredericton
Harvey Area
Miramichi
Minto Area
Moncton
Saint John
Upper MiramichiArea
Known and Probable Carcinogens2

Cancer in New Brunswick Communities: Investigating the environmental connection Part 2 59
employed in occupations known to be significant riskfactors for lung cancer (e.g. coal mining, petroleumrefining, pulp and paper production, see Table 8).Similarly, males and females in the Minto area andDalhousie all shared high rates of bladder cancer aswell as probable environmental exposure to arsenic,which is known to be a key risk factor for bladdercancer.
Certain cancers (some rare) are strongly associatedwith specific contaminants (such as exposure toasbestos and mesothelioma of the thoracic cavity andoccupational exposure to wood dust and sino-nasalcancers).268 These cancers were not examined in thisstudy. There are also several cancer types (laryngeal,multiple myeloma and testicular cancer) for which theevidence is sufficient to establish (or be suggestiveof) a positive link to some classes of pesticides (e.g.chlorophenoxy and hexachlorobenzene herbicides).269
Incidence rates of these cancers also were notexamined in this study.
All the potential risk-cancer relationships that aresuggested by the findings of this study requireadditional epidemiological studies in order toestablish or confirm these relationships.

Cancer in New Brunswick Communities: Investigating the environmental connection Part 260
This study provides never-before-reported cancerrates for 14 urban and rural areas in theCanadian province of New Brunswick. The
results of this study confirmed the findings of theConservation Council of New Brunswick’s first cancerreport (published June 2009). Cancer statistics,when aggregated for large geographic areas, tend toobscure important community-level healthinformation and fail to identify or call attention tospecific communities which are clearly experiencingunusually high rates of certain types of cancer.
Major findings of this study include:
• For males, Dalhousie ranked highest among the14 communities studied based on four majorcancer types (lung, prostate, colorectal andbladder). The Minto and Harvey areas rankedsecond and third, and Saint John ranked fourth;
• For females, Minto ranked highest among the 14communities studied based on three majorcancer types (lung, breast, and colorectal).Dalhousie and Bathurst ranked second, and SaintJohn and the Upper Miramichi area ranked third;
• In general, males and females in Caraquet andthe Drummond-Denmark and Base Gagetownareas had the lowest cancer incidence ratesamong the 14 communities studied with twoexceptions: males in Caraquet had the highestrate of pancreatic cancer and women in the BaseGagetown area had the highest rate of braincancer, along with women in the UpperMiramichi area;
• Several of the 14 communities studied hadcancer rates that were double the provincialrates for these cancers (e.g. pancreatic canceramong males in Caraquet, non-Hodgkin’slymphoma among males in Dalhousie. The rate ofovarian cancer in Dalhousie was triple thereported provincial rate for this cancer.
This study also confirmed the findings of a NewBrunswick government-sponsored community healthassessment done in the Belledune area. That 2005assessment found that prostate and kidney cancerrates (1989-2001) among men in the Belledune areawere higher than rates reported for its healthregions (Regions 5 and 6) and for the province.
In the present study, prostate and kidney cancerrates for males in the Belledune area were found tobe considerably higher than provincial rates forthese cancers (1989-2005), and incidence rates forthese cancers among males in the Belledune areawere found to be the highest among the 14communities studied.
In general, this study found that communities withhigher rates of cancer, such as Dalhousie, the Mintoarea, Saint John and the Belledune area, had moreindustrial activity and/or potential for exposure toenvironmental contamination associated with theircommunities than those with lower rates of cancersuch as Caraquet and the Base Gagetown andDrummond-Denmark areas.
Conclusions

Cancer in New Brunswick Communities: Investigating the environmental connection Part 2 61
Some of the communities that were studied sharedhigh rates of specific cancers and certainoccupational and environmental risk factors linkedto those cancer types.
This study had several important limitations. Datafor all cancer types were not available for all of thecommunities studied. Data on lifestyle risk factorsand the occurrence of cancers associated withvarious occupations in New Brunswick also were notavailable. Certain cancers (some rare) where theevidence that specific contaminants are linked tospecific cancer types is strong or sufficient to makea positive association (e.g. asbestos andmesothelioma of the thoracic cavity, occupationalexposure to wood dust and sino-nasal cancer, andspecific classes of pesticides such as chlorophenoxyand hexachlorobenzene herbicides with laryngeal,multiple myeloma and testicular cancer) were notexamined in this study. Despite these limitations,the findings of this study strongly suggest highcancer rates are possibly linked to environmentaland occupational risk factors.
The results of this study raise questions andunderscore the need for more detailed, community-focused epidemiological studies of cancer and otherchronic disease rates. For example:
• Why are breast cancer rates in half of thecommunities studied (Fredericton, UpperMiramichi and Harvey areas, Dalhousie, Bathurst,Saint John and the Minto area) at least 25%higher than the provincial rate?
• Why are ovarian cancer rates in Dalhousie morethan 200% higher than the provincial rate?
• Why do men and women in Edmundston havehigh rates of thyroid cancer?
• Why do men in Belledune have high rates ofprostate and kidney cancers?
• Why do women in the Base Gagetown and UpperMiramichi areas have high rates of brain cancer?
• Why do women in the Upper Miramichi area havehigh rates of non-Hodgkin’s lymphoma andbrain, breast, colorectal and ovarian cancers andwhy do men in that area have high rates ofkidney, pancreatic and brain cancers?
• Why do women in Dalhousie have high rates ofkidney, ovarian, bladder and pancreatic cancersand men have high rates of bladder, non-Hodgkin’s lymphoma and colorectal cancer?
• Why do men and women in the Minto area havehigh rates of lung, colorectal and bladdercancers?
Communities are where people live and work, whereoccupational and environmental exposures occur,and where industrial emissions are oftenconcentrated. Cancer rates reported at the healthregion or provincial level fail to identifycommunities at-risk and delay research that couldlead to the development and implementation ofappropriate risk reduction and cancer preventionprograms for those communities.

Cancer in New Brunswick Communities: Investigating the environmental connection Part 262
More community-focused health data, likethat assembled in this report, could helpidentify communities at-risk and enable
early intervention that could prevent cancer, reducehealth care costs, and save lives. The ConservationCouncil of New Brunswick is therefore recommendingthat the Minister of Health:
• Direct the New Brunswick Cancer Network tobegin public reporting of cancer rates at thecommunity level;
• Work with the Minister of Environment toimprove air and water quality standards andrequire industries to eliminate releases ofcarcinogens from their operations;
• Direct the New Brunswick Cancer Network toexpand cancer prevention outreach andeducational programs to include occupationaland environmental risk factors such as exposureto pesticides, household and industrialchemicals, and air and water pollution; and
• Enlist the assistance of government and non-government agencies and academic institutionsto effectively address the questions raised in thisreport.
The Minister of Health will need to assign a highpriority to an integrated program of epidemiologicalstudies and public policy changes in order to addressthe findings and questions raised by this study. Newfinancial commitments should not be necessary.Rather, the Minister should reorder some of thedepartment’s priorities and reallocate certain of itshuman and financial resources.
Recommendations

Cancer in New Brunswick Communities: Investigating the environmental connection Part 2 63
1. Milewski I and Liu L. 2009. Cancer in New BrunswickCommunities: Investigating the environmental connection.Part 1. Moncton, Saint John and Fredericton (1991-2005).Fredericton, New Brunswick. Conservation Council of NewBrunswick. 40 p.
2. Statistics Canada. Community Profiles 1991, 1996,2001 and 2006.
3. Eaton PB, Gray AG, Johnson PW and Hundert E. 1994.State of the Environment in the Atlantic Region. Minister ofSupply and Services (Ottawa). 457 p.
4. Hildebrand LP. 1984. An assessment of environmentalquality in the Baie des Chaleurs. Environment Canada,Atlantic Region. EPS-5-AR-84-8.
5. Ibid.
Matheson RAF and Bradshaw VI. 1985. The status ofselected environmental contaminants in the Baie desChaleurs ecosystem. Environmental Protection Service,Environment Canada.
Miramichi River Environmental Assessment Committee.undated. Summary - Final Report 1989-1992.
New Brunswick Department of the Environment andHealth and Community Services. 1993. An analysis of thetrace metal content of vegetables, garden soils and surfacewaters in East Saint John following an atmosphericdeposition of particulate. Report prepared by W. Pilgrimand D.J. Ecobicon, October 1993. 14 pages plus tablesand appendices.
Eaton et al. 1994. See note 3.
Pilgrim W and RN Hughes. 1994. Lead, cadmium, arsenicand zinc in the ecosystem surrounding a lead smelter.Environmental Monitoring and Assessment 32:1-20.
Zitko V. 1995. Fifty years of research on the MiramichiRiver, p. 29-41. In E.M.P. Chadwick [editor].Water,Science, and the Public: The Miramichi Ecosystem. CanadianSpecial Publication Fisheries and Aquatic Sciences, 123 p.
Beak Consultants Limited. 1996.Marine environmentalconditions near the Dalhousie Concentrate handling facility,1995. A report prepared for Brunswick Mining Division,Noranda Mining and Exploration Inc. Bathurst, NewBrunswick. 6 sections plus appendices.
Parson MB and Cranston RE. 2006. Influence of leadsmelter emissions on the distribution of metals in marine
sediments from Chaleur Bay, eastern Canada.Geochemistry: Exploration, Environment, Analysis 6:259–276.
6. Intrinsik, GlobalTox International, Genivar andConestoga-Rovers & Associates. 2008. The Shore Road SoilStudy, Belledune, New Brunswick. Prepared for XstrataZinc, June 2008. 92 p. + appendices.
CanTox Environmental, GlobalTox International, Genivarand MGI. 2006. The study of soils in the West Wharf Area,Dalhousie, New Brunswick. Final Report to Noranda. June2006. 80 p + appendices.
Goss Gilroy Inc, Environmental & OccupationalHealth+Plus, SENES Consultants Ltd. 2005. Belledune AreaHealth Study. Appendix A - Human Health risk Assessment.Prepared for the New Brunswick Department ofHealth.186 p.
Jacques Whitford Environmental Inc. 2003. Human HealthRisk: Proposed high temperature thermal oxidizer facility -Belledune, New Brunswick. Report to: BennetEnvironmental Inc. JWEL Project No. NBF114760.
CanTox Environmental. 1999. Public Health RiskAssessment of the Irving Oil Refinery Upgrade: FinalTechnical Document. Prepared for the Department ofHealth and Community Services. December 1999. 181 p.+ appendices.
7. Perley MH. 1852. Reports on the Sea and River Fisheriesof New Brunswick. Queen’s Printer, Fredericton. 244 p.
Mowat J.1888. Chaleur Bay and its Products for 1887-8,with net and rod. Printed at the Miramichi Advance Office,Chatham, New Brunswick 14 p.
8. Hatcher JD and White FMM. 1983. Interim Report. TaskForce on Chemicals in the Environment and HumanReproductive Problems in New Brunswick. Submitted to theDepartment of Health. April 29, 1983. 30 p.
White FMM, Cohen FG, Sherman G and McCurdy R. 1988.Chemicals, birth defects and stillbirths in New Brunswick:associations with agricultural activity. Canadian MedicalAssociation Journal 138: 117-124.
9. Ward MH, deKok TM, Levallois P, Brender J, Gulis G,Nolan BT and VanDerslice J. 2005. Workgroup Report:Drinking-Water Nitrate and Health- Recent Findings andResearch Needs. Environmental Health Perspectives113(11):1607-1614.
References

Cancer in New Brunswick Communities: Investigating the environmental connection Part 264
10. Ecobichon DJ, Allen M and Hicks R. 1985. Thecontamination of groundwater by agrochemicals asdetermined by well water quality study in CarletonCounty: A report 1984-1985. Prepared for the NBDepartment of Health. June 1985. 8 p. + figures andtables.
11. Environment Canada 1989. Environmental effects offenitrothion use in forestry: impact on insect pollinators,songbirds and aquatic organisms. Minister of Supply andServices. Cat. No. En40-370/1989E
12. Environment Canada. 1991. The State of Canada’sEnvironment - 1991. Minister of Supply and ServicesCanada, Ottawa. ISBN 0-660-14237-6.
13. Spitzer WO. 1984. Final Report: New Brunswick TaskForce on the Environment and Cancer. Commissioned bythe Honourable Charles G. Gallagher, Minister of Health,Government of the Province of New Brunswick. SubmittedMarch 16, 1984. 140 p.
14. Ibid, page 94, Table 3.1.3.
15. Ibid.
16. McCutcheon B. 2002. Antimony. In. CanadianMinerals Yearbook 2002. Natural Resources Canada. pp.10.1-10.6
17. BcBride JL and Davies JL.1981. Natural radioactivitymeasurements for the Harvey Area, York County, NB.Prepare for the Radiation Protection Service, NewBrunswick Department of Health. August 1981. 10 p. +figure, tables and appendix.
Martime Groundwater. 1992. Study of arsenic in well watersSouthern York County, New Brunswick. Prepared for theNew Brunswick Department of Health and CommunityServices and Environment. March 1992.
New Brunswick Department of Health. 2008. Uraniumexceedances found in 16 percent of water samples fromthe Harvey area. Communications New Brunswick NewsRelease 1703.
18. Al-Zoughooi M and Krewski D. 2009. Health effects ofradon: a review of the literature. International Journal ofRadiation Biology 85(1):57-69.
Field RW, Krewski D, Lubin JH et al. 2006. An overview ofthe North American residential radon and lung case-control studies. Journal of Toxicology Environment andHealth A 69(7):5999-631.
19. CanTox Environmental. 2007. Investigation ofpotential effects from the use of herbicides and anyherbicide-related contaminants, particularly dioxins used atCFB Gagetown from 1952 to the present. Prepared forHealth Canada. March 31, 2007.
20. Ibid.
21. Intrinsik Environmental Sciences. 2007. Task 3Summary Report: Investigation of potential health effectsfrom the use of herbicides and any herbicide-relatedcontaminants, particularly dioxins used at CFB Gagetownfrom 1952 to the present. Prepared for the Public HealthAgency of Canada and Health Canada. August 2007.
22. Intrinsik Environmental Sciences Inc. 2007. Task 3Reports: Epidemiology Study Report, Literature ReviewReport. Investigation of potential health effects from theuse of herbicides and any herbicide-related contaminants,particularly dioxins used at CFB Gagetown from 1952 to thepresent. Prepared for the Public Health Agency of Canadaand Health Canada. August 2007.
23. Ripley EA, Redmann RE and Crowder AA. 1996.Environmental effects of mining. 2nd Edition. St. LuciePress, Florida. 356 p.
24. New Brunswick Department of Environment. 2008.New Brunswick Groundwater Chemistry Atlas: 1994-2007.Science and Reporting Branch, Sciences and PlanningDivision, Environmental Reporting Series T2008-01, 31 p.
Environment Canada. 2008. Results of sediment and fishtesting in the vicinity of the Grand Lake power station.Sent via e-mail to the Conservation Council by B.Lalonde, Environment Canada (Dartmouth) on January 15,2008.
New Brunswick Department of Environment. 2007. Resultsof surface water sampling (August 2007) in the vicinityof the Grand Lake power generating station. Results sentto Conservation Council via e-mail November 16, 2007.
New Brunswick Department of Environment. 2007.Department releases results of analysis of soil samplesfrom Grand Lake area. Communications New BrunswickNews Release 1061.
25. Evaluation Designs Ltd. 2003. Community HealthNeeds Assessment: Minto Chipman and Surrounding Area.Prepared for River Valley Health, Region 3 HealthAuthority. Fredericton, New Brunswick.

Cancer in New Brunswick Communities: Investigating the environmental connection Part 2 65
26. Canadian Cancer Society/National Cancer Institute ofCanada. 2008. Canadian Cancer Statistics 2008. Toronto,Canada. April 2008, ISBN 0835-2976.
New Brunswick Department of Health. 2007. NewBrunswick Health Status Report: 1999-2003. ReportNumber: ISBN 978-1-55396-863-4.
New Brunswick Department of Health and Wellness. 2004.Cancer in New Brunswick 1997-2001. ISBN: 1-55396-229-X.
27. Statistics Canada. 2008. Table 103-0553- New casesand age-standardized rate for ICD-O-3 primary sites ofcancer (based on the July 2008 CCR tabulation file), by sex,Canada, provinces and territories, annual, CANSIM(database).
Statistics Canada. 1997. Cancer Incidence in Canada,1969-1993. Catalogue 82-566-XPB.
28. New Brunswick Department of Health and Wellness2004. See note 26.
29. Statistics Canada. 2009. Tables 105-0027, 105-0227,105-0327. Smoking, by age group and sex, householdpopulation aged 12 and over, Canada, provinces,territories, health regions (January 2000 boundaries) andpeer groups, every 2 years, CANSIM (database).
30. Ibid.
31. Evaluation Designs Ltd 2003. See note 25.
32. Brüske-Hohlfeld I. 2009. Environmental andoccupational risk factors for lung cancer. Methods ofMolecular Biology, Cancer Epidemiology 472: 3-23.
Rushton L, Hutchings S and Brown T. 2008. The burden ofcancer at work: estimation as the first step to prevention.Occupational and Environmental Medicine 65(12): 789-800.
Clapp RW, Jacobs MM and Loechler EL. 2007.Environmental and Occupational Causes of Cancer: NewEvidence, 2005-2007. Prepared for: Cancer Working Groupof the Collaborative on Health and the Environment.Lowell Center for Sustainable Production. University ofMassachusetts. 45 p.
33. Belpomme D. Irigarary P, Hardell L, Clapp R,Montagnier L, Epstein S and Sasco AJ. 2007. Themultitude and diversity of environmental carcinogens.
Environmental Research 105:414-429.
Rushton et al. 2008. See note 32.
Doll R and Peto R. 1981. The causes of cancer:quantitative estimates of avoidable/risk of cancer in theUnited States today. Journal of the National CancerInstitute 66:1191-1308.
34. Clapp et al. 2007. See note 32.
35. Karunanayake CP, McDuffie HH, Dosman JA , SpinelliJJ and Pahawa P. 2008. Occupational exposures and non-Hodgkin’s lymphoma: Canadian case-control study.Environmental Health 7: 44-52
Pahwa P and McDuffie HH. 2008. Cancer among potashworkers in Saskatchewan. Journal of Occupational andEnvironmental Medicine 50(9): 1035-1041.
Ramanahumar AV, Nadon L and Siemiatycki J. 2007.Exposure in painting related occupations and risk ofselected cancer: results from a case-control study inMontreal. American Journal of Industrial Medicine 51:419-427.
McDuffie HH, Quail J, Ghosh S, and Pahwa P. 2007. Hostfactors, occupation and testicular cancer inSaskatchewan, Canada: 1979-2002. Journal of Agriculture,Safety and Health 13(3):247-58.
Rouseau MC, Parent ME, Nadon L, Latreille B andSiemiatycki J. 2007. Occupational exposure to leadcompounds and risk of cancer among men: a population-based case-control study. American Journal ofEpidemiology 166(9): 1005-14.
Brophy et al. 2006. Occupation and breast cancer: ACanadian case-control study. Annals of the New YorkAcademy of Science 1076:765-77.
Gaertner RR, Trpeski L, and Johnson KC. 2004. A case-control study of occupational risk factors for bladder inCanada. Cancer Causes and Control 15(10):1007-19.
36. MacArthur AC, Le ND, Fang R and Band PR. 2009.Identification of occupational cancer risk in BritishColumbia: A population-based case-control study of2,998 lung cancers by histopathological type. AmericanJournal of Industrial Medicine, published online at DOI10.1002/ajim.20663.
37.Pichora EC and Payne JE. 2007. Trends andcharacteristics of compensated occupational cancer in

Cancer in New Brunswick Communities: Investigating the environmental connection Part 266
Ontario, Canada, 1937-2003. American Journal ofIndustrial Medicine 50:980-991.
38. Ibid.
39. Ibid
40. Statistics Canada. Community Census Profiles for1991, 1996, 2001, and 2006.
41. Brüske-Hohlfeld I. 2009. Environmental andoccupational risk factors for lung cancer. Methods ofMolecular Biology, Cancer Epidemiology 472:3-23.
Clapp et al. 2007. See note 32.
42. Evaluation Designs Ltd 2003. See note 25.
Goss Gilroy Inc, Environmental & OccupationalHealth+Plus, SENES Consultants Ltd. 2005. Belledune AreaHealth Study. Appendix D - Community Health StatusAssessment Technical Report. Prepared for the NewBrunswick Department of Health.107 p.
43. Szadkowska-Staczyk I and Szymczak W. 2001. Nestedcase-control study of lung cancer among pulp and paperworkers in relation to exposure to dusts. AmericanJournal of Industrial Medicine 39(6): 547-556.
Langseth H and Andersen A. 2000. Cancer incidenceamong male pulp and paper workers in Norway.Scandinavian Journal of Work and Environmental Health26(2): 99-105.
Band P, PR, Le ND, Fang R, Threlfall W, Astrakianakis G ,Anderson JTL, Keefe A and Krewski D. 1997. Cohortmortality study of pulp and paper mill workers in BritishColumbia, Canada. American Journal of Epidemiology146(2):186-194.
44. Ibid. Band et al. 1997.
45. Ballester F, Medina S, Boldo E et al. 2008. Reducingambient levels of fine particulates could substantiallyimprove health: a mortality impact assessment for 26European cities. Journal of Epidemiology and CommunityHealth 62:98-105.
Beelen R, Hoek G, van den Brandt PA et al. 2008. Long-term exposure to traffic-related air pollution and lungcancer risk. Epidemiology 19(5): 702-10.
Kampa M and Castanas E. 2008. Human health effects of
air pollution. Environmental Pollution 151(2):362-7.
Chen TM, Gokhale J, Shofter S and Kuschner WG. 2007.Outdoor air pollution: particulate matter health effects.American Journal of Medical Science 333(4): 235-43.
Laden F, Hart JE, Smith TJ, Davis ME and Garshick E.2007. Cause-specific mortality in the unionized truckingindustry. Environmental Health Perspectives 115(8): 1192-6.
Miller KA, Siscovick DS, Sheppard L et al. 2007. Long-term exposure to air pollution and incidence ofcardiovascular events in women. New England Journal ofMedicine 356(5):447-58.
Naess Ø, Nafstad P, Aamodt G, Clauseen B and Rosland P.2007. Relation between concentration of air pollutionand cause-specific mortality: four-year exposures tonitrogen dioxide and particulate pollution in 470neighborhoods in Oslo, Norway. American Journal ofEpidemiology 165(4): 435-43.
Coyle Y, Minahjuddin AT, Hynan LS and Minna JD. 2006.An ecological study of the association of metal airpollutants with lung cancer incidence in Texas. Journal ofThoracic Oncology 1(7): 654-61.
46. Mehta M, Chen LC, Gordon T, Rom W and Tang MS.2008. Particulate matter inhibits DNA repair and enhancemutagenesis. Mutagenesis Research 657(2): 116-21.
Møller P, Folkmann JK, Forchhammer L, Bruäuner EV,Danielsen PH, Risom L and Loft S. 2008. Air pollution,oxidative damage to DNA, and carcinogenesis. CancerLetters 266(1):84-97.
Valavanidis A, Fiotakis K and Vlachogianni T. 2008.Airborne particulate matter and human health:toxicological assessment and importance of size andcomposition of particulates for oxidative damage andcarcinogenic mechanism. Journal of Environmental Scienceand Health C. Environmental Carcinogenicity andEcotoxicologic Review 26(4): 339-62.
47.WHO Working Group. 2003. Health aspects of airpollution with particulate matter, ozone and nitrogendioxide. Report from WHO Working Group Meeting, Bonn,13-15 January 2003. Copenhagen: WHO Regional Officefor Europe.
48. Valavanidis et al., 2008. See note 46.

Cancer in New Brunswick Communities: Investigating the environmental connection Part 2 67
Pope CA, Burnett RT, Thun MJ, Calle EE, Krewski D, Ito Kand Thurston GD. 2002. Lung cancer, cardiopulmonarymortality, and long term exposure to fine particulate airpollution. Journal of the American Medical Association287(9):1132-41.
49. Laden F, Schwartz J, Speizer FE and Dockery DW.2006. Reduction in fine particulate air pollution andmortality: Extended follow-up of the Harvard Six CitiesStudy. American Journal of Respirology and Critical CareMedicine 173(6):667-72.
Cohen AJ. 2003. Air pollution and lung cancer: whatmore do we need to know? Thorax 58:1010-2.
Pope et al., 2002. see Note 48.
Dockery DW, Pope CA, Xu X et al. 1993. An associationbetween air pollution and mortality in six U.S. cities.New England Journal of Medicine 329:1753-9.
50. Cohen AJ, Andrson HR, Ostro B, et al. 2004. Urbanair pollution .1353-433. In: Ezzati M, Lopez AD, RodgersA, Murray CJL, eds. Comparative quantification of healthrisks: global and regional burden of disease attributable toselected major risk factors. Geneva: World HealthOrganization. Cited in Danaei et al., 2005, note 13.
51. Ibid.
52. New Brunswick Department of Environment. 2009.New Brunswick Air Quality Monitoring Results for the Year2007. Technical Report T-2009-02.
New Brunswick Department of Environment. 2008. NewBrunswick Air Quality Monitoring Results for the Year 2006.Technical Report T-2008-01.
New Brunswick Department of Environment. 2007. NewBrunswick Air Quality Monitoring Results for the Year 2005.Technical Report T-2007-01.
53. Ibid.
54. Ibid.
New Brunswick Department of Environment. 2006. NewBrunswick Air Quality Monitoring Results for the Year 2004.Technical Report T-2006-01.
New Brunswick Department of Environment. 2005. NewBrunswick Air Quality Monitoring Results for the Year 2003.Technical Report T-2005-01.
New Brunswick Department of Environment. 2004. NewBrunswick Air Quality Monitoring Results for the Year 2002.Technical Report T-2003-01.
New Brunswick Department of Environment. 2003. NewBrunswick Air Quality Monitoring Results for the Year 2001.Technical Report T-2002-02.
New Brunswick Department of Environment. 2002. NewBrunswick Air Quality Monitoring Results for the Year 2000.Technical Report T-2001-01.
55. New Brunswick Department of Environment. 2003.New Brunswick Air Quality Monitoring Results for the Year2002. Technical Report T-2003-01, pp. 70.
56. New Brunswick Department of Environment 2007-2009. See note 52.
57. Environment Canada.2009. National PollutantRelease Inventory online data base atwww.ec.gc.ca/inrpp-npri
58. Ibid.
59. Statistics Canada. See note 27.
60. New Brunswick Department of Health 2007. See note26.
61. Samowitz WS, Curtin K, and Lin HH. 2001. The coloncancer burden of genetically-defined hereditarynonpolyposis colon cancer. Gastroenterology 121(4):830-838.
Jass JR. 2000. Familial colorectal cancer: pathology andmolecular characteristics. Lancet Oncology 1:220-226.
62. Kerber RA, Slattery ML, Potter JD, Caan BJ andEdwards SL.1998. Risk of colon cancer associated withfamily history of cancer or colorectal polyps: the diet,activity, and reproduction in colon cancer study.International Journal of Cancer 78:157-160.
Fuchs C, Giovannucci E, Colditz G, Hunter DJ, Speizer Fand Willett W.1994. A prospective study of family historyand the risk of colorectal cancer. New England Journal ofMedicine 331:1669-1674.
63. Gibbons L, Waters C, Mao Y and Elliston L. 2001.Trends in colorectal cancer incidence and mortality.Health Reports 12(2): 41-55.

Cancer in New Brunswick Communities: Investigating the environmental connection Part 268
64. Harriss DJ, Atkinson G, Batterham A, George K, TimCable N, Reilly T, Haboubi N and Renehan AG. 2009.Lifestyle factors and colorectal cancer risk (2): asystematic review and meta-analysis of associations withleisure-time physical activity. Colorectal Disease[e-published January 17, 2009 ahead of print].
Moradi T, Gridley G, Bjork J, Dosemeci M, Ji BT, Berkel HJand Lemeshow S. 2008. Occupational physical activityand risk for cancer of the colon and rectum in Swedenamong men and women by anatomic subsite. EuropeanJournal of Cancer 17(3): 2001-8.
Zhang Y, Cantor KP, Dosemeci M, Lynch CF, Zhu Y andZheng T. 2006. Occupational and leisure-time activity andrisk of colon cancer by subsite. Journal of Occupation andEnvironmental Medicine 48(3):236-43.
Hsing AW, McLaughlin JK, Chow WH et al. 1998. Riskfactors for colorectal cancer in a prospective study amongU.S. white men. International Journal of Cancer 77(4):549-53.
Martinez ME, Giovannucci E, Spiegelman D, Hunter DJ,Willett WC and Colditz GA. 1997. Leisure-time physicalactivity, body size and colon cancer in women. Nurses’sHealth Study Research Group. Journal of the NationalCancer Institute 89(13): 948-55.
65. Wilkins T and Reynolds PL. 2008. Colorectal cancer: asummary of the evidence for screening and prevention.American Family Physician 78(12):1385-92.
Hu J, La Vecchia C, DesMeules M, Negri E and Mery L.2008. Meat and fish consumption in Canada. Nutritionand Cancer 60(3):313-24.
Ryan-Harshman M and Aldoori W. 2007. Diet andcolorectal cancer: review of the evidence. CanadianFamily Physician 53(11):1913-20.
Weisburger JH. 2002. Lifestyle, health and diseaseprevention: the underlying mechanisms. European Journalof Cancer Prevention 11:S1-7.
66. Santarelli RL, Pierre F and Corpet DE. 2008. Processedmeat and colorectal cancer: a review of epidemiologicand experimental evidence. Nutrition and Cancer60(2):131-44.
Ryan-Harshman M and Aldoori W. 2007. Diet andcolorectal cancer: review of the evidence. CanadianFamily Physician 53(11):1913-20.
Gonzalez GA. 2006. The European prospectiveinvestigation into cancer and nutrition (EPIC). PublicHealth and Nutrition 259:629-42.
67. Kato J, Ikemoto A and Mizutani T. 2003. The effect ofdietary fatty acids on the expression levels and activitiesof hepatic drug metabolizing enzymes. Journal of HealthScience 49:105-14.
Potter JD. 1996. Nutrition and colorectal cancer. CancerCauses and Control. 7:127-46.
68. Irigaray P, Newby JA, Clapp R, Hardell L, Howard V,Montagnier L, Epstein S and Belpomme D. 2007.Lifestyle-related factors and environmental agentscausing cancer: an overview. Biomedicine andPharmacotherapy 61:640-658.
69. Irigaray P, Newby JA, Lacomme S and Belpomme D.2007. Overweight/obesity and cancer genesis: more thana biological link. Biomedicine and Pharmacotherapy61:665-678.
70. Clapp et al. 2007. See note 32.
71. Statistics Canada, Canadian Community Health Survey(CCHS), 2000/2001, 2003 and 2005; National PopulationHealth Survey (NPHS), 1994/1995, 19996/1997 and1998/1999. Table 105-4009. Body mass index (BMI), bysex, household population aged 18 and over excludingpregnant females, Canada, provinces and territories,occasional. Table 105-4033. Leisure-time physical activity,by sex, household population aged 12 and over, Canada,provinces and territories, occasional.
72. Statistics Canada. Table 103-0553. New cases and age-standardized rate for ICD-O-3 primary cancer (based on theJuly 2008 CCR tabulation file), by sex, Canada, provincesand territories annual (1992-2006), CANSIM (database).
73. Statistics Canada. See note 27.
74. New Brunswick Department of Health 2007. See note26.
75. New Brunswick Department of Health and Wellness2004. See note 26.
76. Milewski and Liu 2009. See note 1.
77. Gray J, Evans N, Taylor B, Rizzo J and Walker M.2009. State of the Evidence: The connection betweenbreast cancer and the environment. International Journalof Occupational and Environmental Health 15(1):43-78.

Cancer in New Brunswick Communities: Investigating the environmental connection Part 2 69
Steiner E, Klubert D and Knuston D. 2008. Assessingbreast cancer risk in women. American Family Physician78(12): 1361-1366.
Peto J, Collins N, Barfoot R et al. 1999. Prevalence ofBRCA1 and BRCA2 genes mutations in patients withearly-onset breast cancer. Journal of the National CancerInstitute 91:943-949.
78. Pirie K, Beral V, Peto R et al., for the Million WomenStudy Collaborators. 2008. Passive smoking and breastcancer in never smokers; prospective study and meta-analysis. International Journal of Epidemiology37(5):1069-79.
Steiner E, Kulbert D, Hayes M, Hamilton A and Kolasa K.2007. Clinical inquiries. Does a low-fat diet help preventbreast cancer? Journal of Family Practice 56(7): 583-584.
Prentice RL, Caan B, Chlebowski RT, et al. 2006. Low-dietary pattern and risk of invasive breast cancer: theWomen’s Health Initiative Randomized Controlled DietaryModification Trial. Journal of the American MedicalAssociation 296(6):629-642.
van Gils CH, Peeters PH, Bueno-de-Mesquita HB et al.2005. Consumption of vegetables and fruits and risk ofbreast cancer. Journal of the American Medical Association293(2):183-193.
Hamajima N, Hirose K, Tajima K et al., for theCollaborative Group on Hormonal Factors in BreastCancer. 2002. Alcohol, tobacco and breast cancer -collaborative re-analysis of individual data from 53epidemiological studies, including 58,515 women withbreast cancer and 95,067 women without the disease.British Journal of Cancer 87(11): 1234-1245.
79. Danaei G, Vander Hoorn S, Lopez, AD et al. 2005.Causes of cancer in the world: comparative riskassessment of nine behavioural and environmental riskfactors. Lancet 366:1784-93.
80. Gray et al. 2009. See note 77.
Steiner et al. 2008. See note 77.
Salehi F, Turner MC, Phillips KP, Wigle DT, Krewski D andAronson KJ. 2008. Review of the etiology of breastcancer with special attention to organochlorines aspotential endocrine distruptors. Journal of Toxicology andEnvironmental Health Part B 11:276-300.
Gaudette LA, Silberberger C, Altmayer CA and Gao R.1996.Trends in breast cancer incidence and mortality. HealthReports 8(2): 29-37.
Madigan MP, Zielger RG, Benichou J, Byrne C and HooverRN. 1995. Proportion of breast cancer cases in the UnitedStates explained by well-established risk factors. Journalof the National Cancer Institute 87:1681-5.
81. Nudelman J, Taylor B, Evans N et al. 2009. Policy andresearch recommendations emerging from the scientificevidence connecting environmental factors and breastcancer. International Journal of Occupational andEnvironmental Health 15(1):79-101.
Reeves GK, Pirie K, Green J, Bull D and Beral V for theMillion Women Study Collaborators. 2009. Reproductivefactors and specific histological types of breast cancer:prospective study and meta-analysis. British Journal ofCancer 100(3):538-544.
82. Gray et al. 2009. See note 77.
Steiner et al. 2008. See note 77.
83. Salehi et al. 2008. See note 80.
84. Munoz-de-Toro M, Durando M, Beldomenico PM et al.2006. Estrogenic microenvironments generated byorganochlorine residues in adipose mammary tissuemodulates biomarker expression in ERalpha-positivebreast carcinoma. Breast Cancer Research 8: 47-56.
Muscat JE, Britton JA, Djordjevic MV et al. 2003. Adiposeconcentrations of organochlorine compounds and breastcancer recurrence in Long Island, New York. CancerEpidemiology Biomarkers and Prevention 12:1474-8.
Woolcott CG, Aronson KJ, Hanna WM et al. 2001.Organochlorines and breast cancer risk by receptor status,tumor size and grade (Canada). Cancer Causes Control12:395-404.
85. Bassil KL, Vakil C, Sanborn M, Cole DC, Kaur JS andKerr KJ. 2007. Cancer health effects of pesticides:Systematic review. Canadian Family Physician 53:1704-1711.
Brophy JT, Keith MM, Gorey KM et al. 2006. Occupationand breast cancer: a Canadian case-control study. Annalsof the New York Academy of Sciences 1076: 765-777.
Teitelbaum Sl, Gammon MD, Britton JA et al. 2006.Reported residential pesticide use and breast cancer risk

Cancer in New Brunswick Communities: Investigating the environmental connection Part 270
on Long Island New York. American Journal ofEpidemiology 165: 643-51.
86. Andrieu N, Easton DF, Chang -Claud J et al. 2006.Effect of chest X-rays on the risk of breast cancer amongBRAC1/2 mutation carriers in the International BRAC 1/2Carrier Cohort Study: a report from EMBRACE, GEGNNEPSO,GEO-HEBON and IBCCS Collaborators’ Group. 2006.Journal of Clinical Oncology 24:3361-6.
Tsai KK, Chuang EY, Little JB, Yuan ZM. 2005. Cellularmechanisms for low-dose ionizing radiation-inducedperturbation of the breast tissue microenvironment.Cancer Research 6:6734-44.
Barcellos-Hoff MH, Park C and Wright EG. 2005. Radiationand the microenvironment: tumorogenesis and therapy.National Review of Cancer 5:867-75.
Morgan WF. 2003. Non-targeted and delayed effects ofexposure to ionizing radiation: II. Radiation-inducedgenomic instability and bystander effects in vivo,castogenic factors and transgenerational effects.Radiation Research 159:581-96.
87. Brody JG, Rudel RA , Melly SJ and Maxwell NI. 1998.Endocrine disruptors and breast cancer. Forum for AppliedResearch and Public Policy 13(3): 24-31.
88. Rudel RA, Camann DE, Spengler JD, Korn LR andBrody JG. 2003. Phthalates, alkylphenols, pesticides,polybrominated diphenyl ethers, and other endocrine-disrupting compounds in indoor air and dust.Environmental Science and Technology 37(20):4543-4553.
89. Rudel RA, Geno P, Melly SJ et al. 1998. Identificationof alkyphenols and other estrogenic phenolic compoundsin wastewater, septage, and groundwater on Cape Cod,Massachusetts. Environmental Science and Technology32(7): 861-9.
90. McKelvey W, Brody JG, Aschengrau A and Swartz CH.2004. Association between residence on Cape Cod,Massachusetts, and breast cancer. Annals of Epidemiology14:89-94.
91. Webster TF, Hoffman K, Weinberg, J, Vieira J andAschengrau A. 2008. Community- and individual-levelsocioeconomic status and breast cancer risk: multilevelmodeling on Cape Cod, Massachusetts. EnvironmentalHealth Perspectives 116(3): 1125-1129.
92. Statistics Canada 2008. See note 27.
93. New Brunswick Department of Health and Wellness.2000. Cancer in New Brunswick 1992-1996. ISBN : 1-55236-699-5.
94. New Brunswick Department of Health and Wellness2004. See note 26.
95. Salehi F, Dunfield, L, Phillips KP, Krewski D andVanderhyden BC. 2008. Risk factors for ovarian cancer: anoverview with emphasis on hormonal factors. Journal ofToxicology and Environmental Health, Part B 11:301-321.
96. Permuth-Wey J and Sellers TA. 2009. Epidemiology ofovarian cancer. Methods of Molecular Biology, CancerEpidemiology 472:413-437.
97. Ibid.
Maehle L, Apoid J, Paulsen T et al. 2008. High risk forovarian cancer in prospective series is restricted toBRCA1/2 mutation carriers. Clinical Cancer Research14(22):7569-73.
98. Ramus SJ and Gayther SA. 2009. The contribution ofBRCA1 and BRCA2 to ovarian cancer. Molecular Oncology3(2):138-50
99. Permuth-Wey and Sellers 2009. See note 96.
100. Salehi et al. 2008. See note 95.
101. Ibid.
102. Ibid.
103. Ibid.
104. Permuth-Wey and Sellers 2009. See note 96.
Salehi et al. 2008. See note 95.
105. Ibid.
106. Rossing MA, Cushing-Haugen KL, Wicklund KG andWeiss NS. 2008. Cigarette smoking and risk of epithelialovarian cancer. Cancer Causes and Control 19(4):413-20.
Gram IT, Braaten T, Adami HO, Lund E and Weiderpass E.2008. Cigarette smoking and risk of borderline andinvasive epithelial ovarian cancer. International Journal ofCancer 122(3):647-52.
Soegaard M, Jensen A, Høgdall E, Christensen L, Høgdall
Cancer in New Brunswick Communities: Investigating the environmental connection Part 2 71
C, Blaakaer J and Kjaer SK. 2007. Different risk factorprofiles for mucinous and nonmucinous ovarian cancer:results from the Danish MALOVA study. CancerEpidemiology Biomarkers and Prevention 16(6):1160-6.
Jordan SJ, Whiteman DC, Purdie DM, Green AC and WebbPM. 2006. Does smoking increase risk of ovarian cancer?A systematic review. Gynecologic Oncology 103(3):1122-9.
107. Olsen CM, Nagle CM, Whiteman DC et al. 2008. Bodysize and risk of epithelial ovarian and related cancers: apopulation-based case-control study. InternationalJournal of Cancer 123(2):450-6.
Olsen CM, Green AC, Whiteman DC, Sadeghi S, KolahdoozF and Webb PM. 2007. Obesity and the risk of epithelialovarian cancer: a systematic review and meta-analysis.European Journal of Cancer 43:690 – 709.
Engeland A, Tretli S and Bjorge T. 2003. Height, bodymass index, and ovarian cancer: a follow-up of 1.1million Norwegian women. Journal of the National CancerInstitute 95:1244- 1248.
108. Prins JB. 2002. Adipose tissue as an endocrineorgan. Best Practices in Research and Clinical andEndocrinology Metabolism. 16:639–651.
109. Henley DV and Korach KS. 2006. Endocrine-disrupting chemicals use distinct mechanisms of actionto modulate endocrine system function. Endocrinology147:S25–32.
Heindel JJ. 2003. Endocrine disruptors and the obesityepidemic. Toxicological Sciences 76:247–249.
Baillie-Hamilton PF. 2002. Chemical toxins: A hypothesisto explain the global obesity epidemic. Journal ofAlternative and Complementary Medicine 8:185–192.
110. Grün F and Blumberg B. 2006. Environmentalobesogens: Organotins and endocrine disruption vianuclear receptor signaling. Endocrinology 147:S50–S55.
111. Henley and Korach 2006. See note 109.
Tabb MM and Blumberg B. 2006. New modes of action forendocrine-disrupting chemicals. Molecular Endocrinology20:475–482.
DeRosa C, Richter P, Pohl H, and Jones DE. 1998.Environmental exposures that affect the endocrinesystem: public health implications. Journal of Toxicologyand Environmental Health B 1:3–26.
112. Barros RP, Machado U F and Gustafsson J. 2006a.Estrogen receptors: New players in diabetes mellitus.Trends in Molecular Medicine 12:425–431.
Barlow NJ, McIntyre BS and Foster PM. 2004. Malereproductive tract lesions at 6, 12, and 18 months of agefollowing in uteroexposure to di(n-butyl) phthalate.Toxicologic Pathology 32:79–90.
Choi SM, Yoo SD and Lee BM. 2004. Toxicologicalcharacteristics of endocrine-disrupting chemicals:Developmental toxicity, carcinogenicity and mutagenicity.Journal of Toxicology and Environmental Health B 7:1–24.
Heindel JJ. 2003. Endocrine disruptors and the obesityepidemic. Toxicological Sciences 76:247–249.
Salazar-Martinez E, Romano-Riquer P, Yanez-Marquez E,Longnecker MP and Hernandez-Avila M. 2004. Anogenitaldistance in human male and female newborns: Adescriptive, cross-sectional study. Environmental Health3:8.
Longnecker MP and Michalek JE. 2000. Serum dioxin levelin relation to diabetes mellitus among Air Force veteranswith background levels of exposure. Epidemiology 11:44–48.
113. Alavanja MC, Sandler DP, Lynch DR et al. 2005.Cancer incidence in agricultural health study.Scandinavian Journal of Work and Environmental Health31(Suppl 1):39-45.
Shields T, Gridley G, Moradi T, Adami J, Plato N andDosemici M. 2002. Occupational exposures and the risk ofovarian cancer in Sweden. American Journal of IndustrialMedicine 42(3):200-13.
Vasam-Neuvonen K, Pukkala E, Paakkulainen H et al.1999. Ovarian cancer and occupational exposures inFinland. American Journal of Industrial Medicine36(1):83-9.
114. New Brunswick Department of Health and Wellness2004. See note 26.
115. Kilfoy BA, Zheng T, Holford TR et al. 2009.International patterns and trends in thyroid cancerincidence, 1973-2002. Cancer Causes and Control20(5):525-31.
Liu S, Semenciw R, Ugnat AM et al. 2001. Increasingthyroid cancer incidence in Canada, 1970–1996: timetrends and age-period-cohort effects. British Journal of

Cancer in New Brunswick Communities: Investigating the environmental connection Part 272
Cancer 85:1335-9.
116. Canadian Cancer Society’s Steering Committee.2009.Canadian Cancer Statistics 2009. Toronto: Canadian CancerSociety, April 2009. ISBN 0835-2976.
117. New Brunswick Department of Health and Wellness2004. See note 26.
118. Ibid.
119. Statistics Canada 2008. See note 27.
120. Enewold L, Zhu K, Ron E et al. 2009. Rising thyroidcancer incidence in the United States by demogrphic andtumor characteristics, 1980-2005. Cancer EpidemiologyBiomarkers and Prevention 18(3):784-91.
Kent WD, Hall SF, Isotalo PA, Houlden RL, George RL andGroome PA. 2007. Increased incidence of differentiatedthyroid carcinoma and detection of subclinical disease.Canadian Medical Association Journal 177(1):1357-1361.
Burgess JR and Tucker P. 2006. Incidence trends forpapillary thyroid carcinoma and their correlation withthyroid surgery and thyroid fine-needle aspirate cytology.Thyroid 16:47-53.
Davies KK and Welch HG. 2006. Increasing incidence ofthyroid cancer in the United States, 1973-2002. Journalof the American Medical Association 295(18):2164-7.
121. How J and Tabah R. 2007. Explaining the increasingincidence of differentiated thyroid cancer. CanadianMedical Association Journal 177(11):1383-1384.
Davis and Welch 2006. See note 120.
122. Adjadj E, Shlumberger M and de Vathaire F. 2009.Germ-line DNA polymorphisms and susceptibility todifferentiated thyroid cancer. Lancet Oncology 10(2):181-90.
Dal Maso L, Bosetti C, La Vecchia C and Franceschi S.2009. Risk factors for thyroid Cancer: an epidemiologicalreview focused on nutritional factors. Cancer Causes andControl 20(1):75-86.
Nagataki S and Nyström S. 2002. Epidemiology andprimary prevention of thyroid cancer. Thyroid 12(10):889-896.
123. Navarro Silvera SA, Miller AB and Rohan TE. 2005.Risk factors for thyroid cancer: a prospective cohort
study. International Journal of Cancer 116(3):433-8.
Zivaljevic V, Vlajinac H, Marinkovic J et al. 2004.Cigarette smoking as a risk factor for cancer of thethyroid in women. Tumori 90(3):273-5.
Galanti MR, Hansson L, Lunde E et al. 1996. Reproductivehistory and cigarette smoking as risk factors for thyroidcancer in women: a population-based case-control study.Cancer Epidemiology Biomarkers and Prevention 5(6):425-31.
124. Schneider AB and Ron E.2003. Radiation and thyroidcancer: lessons from a half century of study. In:Braverman LE, ed. Diseases of the thyroid. Totowa, NJ:Humana Press, cited in Ron E. 2003. Cancer risk frommedical radiation. Health Physics 85(1):47-59.
Bhatia S and Sklar C. 2002. Second cancers in survivorsof childhood cancer. Nature Review 2:124–132; 2002.
Travis LB, Curtis RE and Hankey BF. 1995. Secondmalignancies after testicular cancer. Journal of ClinicalOncology 13:533–534; 1995.
Schneider AB, Ron E, Lubin J, Stovall M and GierlowskiTC. 1993. Dose-response relationships for radiation-induced thyroid cancer and thyroid nodules: evidence forthe prolonged effects of radiation on the thyroid. Journalof Clinical Endocrinology and Metabolism 77:362–364.
125. Ron E. 2003. Cancer risk from medical radiation.Health Physics 85(1):47-59.
126. Ibid.
127. Baker SR and Bhatti W. 2006. The thyroid cancerepidemic: is it the dark side of the CT revolution?European Journal of Radiology 60:76-9.
128. Tubiana M.2009. Can we reduce the incidence ofsecond primary malignancies occurring afterradiotherapy? A critical review. Radiotherapy andOncology 91(1):4-15.
Ng AK and Travis LB. 2008. Subsequent neoplasms incancer survivors. Cancer Journal 14(6):429-34.
Suit H, Goldberg S, Niemierko A, et al. 2007. Secondarycarcinogenesis in patients treated with radiation: areview of data on radiation-induced cancers in human,non-human primate, canine and rodent subjects.Radiation Research 167:12–42.

Cancer in New Brunswick Communities: Investigating the environmental connection Part 2 73
Ron 2003. See note 125.
Little MP. 2001. Cancer after exposure to radiation in thecourse of treatment for benign and malignant disease.Lancet Oncology l2:212–220.
129. Ng and Travis 2008. See note 128.
130. Meadows At, Friedman Dl, Neglia JP et al. 2009.Second neoplasms in survivors of childhood cancer:findings from the Childhood Cancer Survivor Studycohort. Journal of Clinical Oncology 27(14):2356-62.
Robbins E. 2008. Radiation risks from imaging studies inchildren with cancer. Pediatric Blood and Cancer51(4):453-7.
Sigurdson AJ, Ronckers CM, Mertens AC et al. 2005.Primary thyroid cancer after a first tumour in childhood(the Childhood Cancer Survivor study):a nested case-control study. Lancet 365(9476):2014-23.
131. Tubiana 2009. See note 128.
132. Scarpato R, Antonelli A, Ballardin M et al. 2006.Analysis of chromosome damage in circulatinglymphocytes of radiological workers affected by thyroidnodules. Mutation Research 606(1-2):21-6.
Lope V, Pérez-Gómez B, Aragonés N et al. 2006.Occupational exposure to ionizing radiation andelectromagnetic fields in relation to the risk of thyroidcancer in Sweden. Scandinavian Journal of WorkEnvironment and Health 32(4):276-84.
Zabel EW, Alexander BH, Mongin SJ et al. 2006. Thyroidcancer and employment as a radiologic technologist.International Journal of Cancer 119(8):1940-5.
Violante FS, Romano P, Bonfiglioli R et al. 2003. Lack ofassociation between occupational radiation exposure andthyroid nodules in healthcare personnel. InternationalArchives of Occupation Environment and Health 76(7):529-32.
133. Bhatti P, Struewing JP, Alexander BH et al. 2008.Polymorphisms in DNA repair genes, ionizing radiationexposure and risk of breast cancer in U.S. radiologictechnologist. International Journal of Cancer 122(1):177-82.
Doody M, Freedman DM, Alexander BH et al. 2006. Breastcancer incidence in U.S. radiologic technologists. Cancer106(12):27-7-15.
Rajaraman P, Sigurdson AJ, Doody MM et al. 2006. Lungcancer risk among US radiologic technologists, 193-1998.International Journal of Cancer 119(10):2481-6.
Yoshinaga S, Mabuchi K, Sigurdson AJ, Doody MM andRon E. 2004. Cancer risk among radiologist and radiologictechnologists: review of epidemiologic studies. Radiology233(2):313-21.
134. Zielinski JM, Shilnikova NS and Krewski D. 2008.Canadian National Dose Registry of radiation workers:overview of research from 1951 through 2007.International Journal of Occupational MedicineEnvironment and Health 21(4):269-75.
Cardis E, Vrijheid M, Blettner E et al. 2007. The 15-country collaborative study of cancer risk amongradiation workers in the nuclear industry: estimates ofradiation-related cancer risk. Radiation Research167(4):396-416.
135. Ron E. 2007. Thyroid cancer incidence among peopleliving in areas contaminated by radiation from theChernobyl accident. Health Physics 93(5):502-11.
Cardis E, Kesminiene A, Ivanov V et al. 2005. Risk ofthyroid cancer after exposure to 131I in childhood.Journal of the National Cancer Institute 97(10): 734-32.
Moysich KF, Menezes RJ and Michalek AM. 2002.Chernobyl-related ionising radiation exposure and cancerrisk: an epidemiological review. Lancet Oncology 3(5):269-79.
136. Nussbaum RH. 2009. Childhood leukemia andcancers near German nuclear reactors: significance,context and ramifications of recent results. InternationalJournal of Occupational and Environmental Health15(3):318-23.
Grosche B. 2008. The “Kinderdrebs in der Umgebung vonKernfraftwerken’ study: results put into perspective.Radiation Protection Dosimetry 132(2):198-201.
Levin RJ. 2008. Incidence of thyroid cancer in residentssurrounding the Three Mile Island nuclear facility.Laryngoscope 118(4):618-28.
Boice JD Jr, Mumma MT and Blot WJ. 2006. Cancermortality among populations residing in counties nearthe Hanford site; 1950-2000. Health Physics 90(5):431-45.

Cancer in New Brunswick Communities: Investigating the environmental connection Part 274
White-Koning ML, Hemone D, Laurier D et al. 2004.Incidence of childhood leukaemia in the vicinity ofnuclear sites in France, 1990-1998. British Journal ofCancer 91(5):916-22.
Talbott EO, Youk AO, McHugh-Pemu KP and Zborowski JV.2003. Long-term follow-up of the residents of the ThreeMile Island accident area: 1979-1998. EnvironmentalHealth Perspectives 11(3):341-8.
López-Abente G, Aragonés N, Pollán M, Ruiz M andGandarillas.2199. Leukemia, lymphoma, and myelomamortality in the vicinity of nuclear power plants andnuclear fuel facilities in Spain. Cancer EpidemiologyBiomarkers and Prevention 8(10):925-34.
137. Bithell JF, Keegan Tj, Kroll ME, Murphy MF andVincent TJ. 2008. Childhood leukaemia near Britishnuclear installations: methodological issues and recentresults. Radiation Protection Dosimetry 132(2):191-7.
Laurier D, Jacob S, Bernier MO et al. 2008.Epidemiological studies of leukaemia in children andyoung adults around nuclear facilities: a critical review.Radiation Protection Dosimetry 132(2):182-90.
Hoffman FO, Ruttenber, AJ Apostoaei AI, Carroll RJ andGreenland S. 2007. The Hanford Thyroid Disease Study:and alternative view of the findings. Health Physics92(2):99-111.
Laurier D, Grosche B and HallP. Risk of childhoodleukaemia in the vicinity of nuclear installations -findings and recent controversies. Acta radiologicaOncology 41(1): 14-24.
138. Statistics Canada. See note 27.
139. New Brunswick Department of Health and Wellness2004. See note 26.
140. Goss Gilroy Inc, Environmental & OccupationalHealth+Plus, SENES Consultants Ltd. 2005. Belledune AreaHealth Study. Appendix D - Community Health StatusAssessment Technical Report.
141. Milewski I. 2006. Dying for development: the legacyof lead in Belledune. Conservation Council of NewBrunswick, New Brunswick (Fredericton). 93 p.
142. Goss Gilroy Inc et al. 2005. See note 6.
143. Wigle DT, Turner MC, Gomes J and Parent M. 2008.Role of hormonal and other factors in human prostate
cancer. Journal of Toxicology and Environmental HealthPart B 11:242-259.
Grönberg H. 2003. Prostate cancer epidemiology. Lancet361:859-64.
144. Ibid. Wigle et al. 2008.
Darlington GA, Kreiger N, Lightfoot N, Purdham, andSass-Kortsak A. 2007. Prostate cancer risk and diet,recreational physical activity and cigarette smoking.Chronic Disease in Canada 27(4):145-53.
145. Prins GS. 2008. Endocrine disruptors and prostatecancer risk. Endocrine Related Cancer 15(3):649-56.
Wigle et al. 2008. See note 143.
Hess-Wilson JK and Knudsen KE. 2006. Endocrinedisrupting compounds and prostate cancer. Cancer Letters241:1-12.
146. Ibid. Prins 2008.
147. Ramanakumar AV, Nadon L and Siemiatycki J. 2008.Exposure in painting related occupations and risk ofselected cancers: results from a case-control study inMontreal. American Journal of Industrial Medicine 51:419-427.
Clapp et al 2007. See note 32.
Hardell L, Andersson SO, Carlberg M, et al. 2006. Adiposetissue concentrations of persistent organic pollutants andthe risk of prostate cancer. Journal of Occupational andEnvironmental Medicine 48(7):700-707.
Band PR, Le ND, Fang R, Threlfall WJ and Gallagher RP.1999. Identification of occupational cancer risks inBritish Columbia, Part II: A population-based case-control study of 1516 prostate cancer cases. Journal ofOccupational and Environmental Medicine 41(4):223-47.
Aronson KJ, Siemiatycke J, Dewar R and Gérin M. 1996.Occupational risk factors for prostate cancer: results froma case-control study in Montréal, Québec, Canada.American Journal of Epidemiology 143(4): 363-73.
148. Bassil et al. 2007 see note 85.
Hardell L, Andersson SO, Carlberg M et al. 2006. Prostatecancer and exposure to pesticides in agricultural settings.Journal of Occupational and Environmental Medicine48:700-7.

Cancer in New Brunswick Communities: Investigating the environmental connection Part 2 75
Alavanja MCR, Sandler DP, Lynch CF, et al. 2005. Cancerincidence in the Agricultural Health Study, ScandinavianJournal of Work, Environment and Health 31(suppl 1):39-45.
Van Maele-Fabry G, Libotte V, Willems J and Lison D.2006. Review and meta-analysis of risk estimates forprostate cancer in pesticide manufacturing workers.Cancer Causes Control 17:353-373.
Alavanja MC, Samanic C, Dosemeci M et al. 2003. Use ofagricultural pesticides and prostate cancer risk in theAgricultural Health Study cohort. American Journal ofEpidemiology 157:800-14.
149. Benbrahim-Tallaa L and Waalkes M. 2008. Inorganicarsenic and human prostate cancer. Environmental HealthPerspectives 116(2):158-64.
Yang CY, Chang CC and Chiu HF. 2008. Does arsenicexposure increase the risk for prostate cancer? Journal ofToxicological and Environmental Health A 71(23):1559-63.
Baastrup R, Sørensen M, Balstrøm T et al. 2008. Arsenicin drinking-water and risk for cancer in Denmark.Environmental Health Perspectives 116(2): 231-7.
Achanzar WE, Brambila EM, Diwan BA, Webber MM andWaalkes MP. 2002. Inorganic arsenite-induced malignanttransformation of human prostate epithelial cells. Journalof National Cancer Institute 94(24):1888-91.
Buchet JP, Lison D. 1998. Mortality by cancer in groupsof the Belgian population with a moderately increasedintake of arsenic. International Archives of Occupationaland Environmental Health 71: 125–30.
150. International Agency for Research on Cancer (IARC).2004. Some drinking-water disinfectants andcontaminants, including arsenic. IARC MonographEvaluating Carcinogen Risk to Humans 84:269-477, citedin: Benbrahim-Tallaa L and Waalkes M (2008) see note149.
151. Navas-Acien A, Silbergeld EK, Pastor-Barriuso R andGuallar E. 2008. Arsenic exposure and prevalence of type2 diabetes in US adults. Journal of the American MedicalAssociation 300(7): 814-22.
Benbrahim-Tallaa L and Waalkes M (2008) see note 149.
152. Huff J, Lunn RM, Waalkes MP Tomatis L and InfantePF. 2007. Cadmium-induced cancers in animals and inhumans. International Journal of Occupational and
Environmental Health 13(2):2002-12.
Nawrot T, Plusquin M, Hogervorst J et al. 2006.Environmental exposure to cadmium and risk of cancer: aprospective population-based study. Lancet Oncology7:119-26.
Vinceti M, Venturelli M, Sighinolfi C, et al. 2007.Case-control study of toenail cadmium and prostate cancer riskin Italy. Science of the Total Environment 373(1):77-81.
153. New Brunswick Department of Environment. 2008.New Brunswick Groundwater Chemistry Atlas: 1994-2007.Science and Reporting Branch, Sciences and PlanningDivision, Environmental Reporting Series T2008-01, 31 p.
154. Statistics Canada. See note 27.
155. New Brunswick Department of Health and Wellness2004. See note 26.
156. New Brunswick Department of Health and Wellness2000. See note 93.
157. Parkin DM. 2008. The global burden of urinarybladder cancer. Scandinavian Journal of Urology andNephrology Supplement 218:12-20.
158. Boffetta P. 2008. Tobacco smoking and risk ofbladder cancer. Scandinavian Journal of Urology andNephrology Supplement 218:45-54.
159. Larsson SC, Johansson JE, Andersson SO and Wolk A.2009. Meat intake and bladder cancer risk in a Swedishprospective cohort. Cancer Causes and Control 20(1):35-40.
Larsson SC, Andersson SO, Johansson JE and Wolk A.2008. Fruit and vegetable consumption and risk ofbladder cancer: a prospective cohort study. CancerEpidemiology Biomarkers and Prevention 17(():2519-22.
Pelucchi C and La Vecchia C. 2009. Alcohol, coffee andbladder cancer risk: a review of epidemiological studies.European Journal of Cancer Prevention 18(1):62-8.
160. Reulen RC, Kellen E, Buntinx F, Brinkman M andZeegers MP. 2008. A meta-analysis on the associationbetween bladder cancer and occupation. ScandinavianJournal of Urology and Nephrology Supplement 218:64-78.
Dryson E, ’t Mannetje A, Walls C et al. 2008. Case-controlstudy of high risk occupations for bladder cancer in NewZealand. International Journal of Cancer 122(6): 1340-6.

Cancer in New Brunswick Communities: Investigating the environmental connection Part 276
Lohi J, Kyyrönen P, Kauppinen, T Jujala V and Pukkala E.2008. Occupational exposure to solvents and gasolineand risk of cancers in the urinary tract among Finnishworkers. American Journal of Industrial Medicine51(9):668-72.
Clapp et al. 2007. See note 32.
Kellen E, Zeegers M, Paulussen A et al. 2007. Doesoccupational exposure to PAHs, diesel and aromaticamines interact with smoking and metabolic geneticpolymorphisms to increased the risk on bladder cancer?The Belgian case control study on bladder cancer risk.Cancer Letters 245(1-2):51-60.
Band PR, Nhu DL, MacAurthur AC et al. 2005.Identification of occupational cancer risks in BritishColumbia: a population-based case-control study of 1129cases of bladder cancer. Journal of Occupational andEnvironmental Medicine 47(8):854-858.
Bosetti C, Pira E, La Vecchia C. 2005. Bladder cancer riskin painters: a review of the epidemiological evicenc,1989-2004. Cancer Causes and Control 16((): 997-1008.
Colt JS, Baris D, Stewart P et al. 2004. Occupation andbladder cancer risk in population-based case-controlstudy in New Hampshire. Cancer Causes and Control 15(8):759-69.
Kogenvinas M, ’t Mannetje A, Cordier S et al. 2003.Occupation and bladder cancer among men in westernEurope. Cancer Causes and Control 14(10):907-14.
161. New Brunswick Department of Environment 2008.See note 24.
162. Bove GE Jr, Rogerson PA and Vena JE. 2007. Case-control study of the effects of trihalomethanes on urinarybladder cancer risk. Archives of Environmental andOccupational Health 62(1):39-47
Villanueva CM, Cantor KP, Grimalt JO et al. 2007. Bladdercancer and exposure to water disinfection by-productsthrough ingestion, bathing, showering, and swimming inpools, American Journal of Epidemiology 165(2):148-156.
163. Health Canada 2006. Water Quality GuidelineTechnical Document: Trihalomethanes. Document can bedownloaded from Health Canada’s website (Environmentaland Workplace Health: Reports and Publications) atwww.hc-sc.gc.ca
164. Chowdhury S and Champagne P. 2009. Risk fromexposure to trihalomethanes during shower: probabilisticassessment and control. Science of the Total Environment407(5):1570-8
165. Health Canada. 1995. A National Survey ofChlorinated Disinfection By-products in Canadian DrinkingWater. Cat. No. H46-2/95-197E. Document can bedownloaded from Health Canada’s website at www.hc-sc.gc.ca
166. “Saint John needs better water treatment: healthofficer.” CBC Radio September 27, 2007.
167. New Brunswick Health Department. Arsenic inDalhousie. Prepared by W.H. Wyile, May 1983. 10 p.Provincial Archives of New Brunswick.
168. Ibid.
169. CanTox et al. 2006. See note 6.
170. Ibid. page 66
171. Ibid. page 67
172. Statistics Canada. See note 27.
173. New Brunswick Department of Health and Wellness2000. See note 93.
174. Goss Gilroy Inc et al. 2005. See note 42.
175. Canadian Cancer Society/National Cancer Instituteof Canada 2008. See note 26.
Chow WH and Devesa SS. 2008. Contemporaryepidemiology of renal cell cancer. Cancer Journal14(5):288-301.
176. Ibid.
177. Chow WH, Gridley G, Fraumeni JF jr and Järvholm B.2000. Obesity, hypertension and the risk of kidney cancerin men. New England Journal of Medicine 343(18):1305-11.
178. Montella M, Tramacere I, Tavani, A et al. 2009.Coffee, decaffeinated coffee, tea intake and risk of renalcell cancer. Nutrition and Cancer 61(1):76-80.
Chow and Devesa (2008) see note 175

Cancer in New Brunswick Communities: Investigating the environmental connection Part 2 77
179. Hu J, Chen Y, Mao Y et al. 2008. Alcohol drinkingand renal cell carcinoma in Canadian men and women.Cancer Detection and Prevention 32(1):7-14.
180. Hu J, La Vecchia C, DesMeules M et al. 2008. Meatand fish consumption and cancer in Canada. Nutritionand Cancer 60(3): 313-24.
Lee JE, Spiegelman D, Hunter DJ et al. 2008. Fat, proteinand meat consumption and renal cancer risk: a pooledanalysis of 13 prospective studies. Journal of the NationalCancer Institute 100(23):1695-706.
Mahabir S, Leitzmann MF, Pietinen P, et al. 2004. Physicalactivity and renal cell cancer risk in a cohort of malesmokers. International Journal of Cancer 108:600–605.
Bergström A, Terry P, Lindblad P, et al. 2001. Physicalactivity and risk of renal cell cancer. InternationalJournal of Cancer 92:155–157.
181. Chow and Devesa (2008) see note 175.
Clapp et al. 2007. See note 32.
182. Ibid.
183. Järup L and Akesson A. 2009. Current status ofcadmium as a environmental health problem. Toxicologyand Applied Pharmacology [E-published ahead of print]
Huff J, Lunn RM, Michael P et al. 2007. Cadmium-inducedcancers in animals and humans. International Journal ofOccupational and Environmental Health 13(2):202-212.
Il’yasova D and Schwartz GG. 2005. Cadmium and renalcancer. Toxicology and Applied Pharmacology 207(2):179-86.
184. Ibid. Huff et al. 2007.
185. Ibid.
186. Infante-Rivard C. 1987. Joint Occupational Healthand Hygiene Study, Smelting and Fertilizer Division,Brunswick Mining and Smelting Corporation Ltd, Belledune,New Brunswick. Occupational Hygiene InvestigationAugust 21-22, 1987 and November 19 - December 11,1987. Environmental Laboratories, School of OccupationalHealth, McGill University. 70 pp. Provincial Archives ofNew Brunswick (PANB) RS 260.
187. Marchant R. 1990. Health Assessment of the BMSSmelter Workers. Prepared for the Implementation
Committee of the New Brunswick Occupational Healthand Safety Commission. Dalhousie University, 48 pp.PANB Workplace Health, Safety and CompensationCommission Records RS 260.
188. Ibid., pp. 16-18.
189.“Brunswick urged to clean up lead smelter”,Telegraph-Journal, June 29, 1990. p.1, 6.
190. Statistics Canada. See note 27.
191. New Brunswick Department of Health and Wellness2000. See note 93.
192. New Brunswick Department of Health and Wellness2004. See note 26.
193. Foulkes W. 2003. Inherited susceptibility to commoncancers. New England Journal of Medicine 359:2143-53.
194. Klein AP, Hruban RH, Brune KA, Petersen GM andGoggins M. 2001. Familial pancreatic cancer. CancerJournal 7(4):266-73.
195. Landi S. 2009. Genetic predisposition andenvironmental risk factors to pancreatic cancer: A reviewof the literature. Mutation Research 681(2-3):299-307.
Foulkes 2003. See note 193.
Ghadirian P, Lynch HT and Krewski D. 2003. Epidemiologyof pancreatic cancer: an overview. Cancer Detection andPrevention 27(2):87-93.
Klein et al. 2001. See note 194.
196. Anderson LN, Cotterchio M and Gallinger S. 2009.Lifestyle, dietary, and medical history factors associatedwith pancreatic cancer risk in Ontario, Canada. CancerCauses and Control 20(6):825-34.
Lowenfels AB and Maisonneuve P. 2005. Risk factors forpancreatic cancer. Journal of Cell Biochemistry 95:649-56.
Ghadirian et al. 2003. See note 195.
197. Danaei et al. 2005. See note 79.
198. Li D, Morris JS, Liu J, Hassan MM Day RS, Bondy MLand Abbruzzese JL. 2009. Body mass index and risk, ageof onset and survival in patients with pancreatic cancer.Journal of the American Medical Association 301(24):2553-62.

Cancer in New Brunswick Communities: Investigating the environmental connection Part 278
Heinen MM, Verhage BA, Ambergen TA, Goldbohm RA andvan den Brandt PA. 2009. Alcohol consumption and riskof pancreatic cancer in the Netherlands cohort study.American Journal of Epidemiology 169(10): 1233-42.
Jiao L, Silverman DT, Schairer C et al. 2009. Alcohol useand risk of pancreatic cancer: the NIH-AARP Diet andHealth Study. American Journal of Epidemiology 169(9):1043-51.
Bao Y and Michaud DS. 2008. Physical activity andpancreatic cancer risk: a systematic review. CancerEpidemiology Biomarkers and Prevention 17(10):2671-82.
Stevens RJ, Roddam AW, Spencer EA et al. 2008. Factorsassociated with incident and fatal pancreatic cancers in acohort of middle-aged women. International Journal ofCancer 124(10):2400-5.
Stolzenberg-Solomon RZ, Adams K, Leitzmann M et al.2008. Adiposity, physical activity, and pancreatic cancerin the National Institutes of Health-AARP Diet and HealthCohort. American Journal of Epidemiology 167(5):586-97.
199. Clapp et al. 2007. See note 32.
Lo AC, Soliman AS, El-Ghawalby N et al. 2007. Lifestyle,occupational, and reproductive factors in relation topancreatic cancer risk. Pancreas 35(2):120-9.
Ji J and Hemminki K. 2006. Socioeconomic andoccupational risk factors for pancreatic cancer: a cohortstudy in Sweden. Journal of Occupation and EnvironmentalMedicine 48(3):283-8.
Laakkonen A, Kauppinen T and Pukkala E. 2006. Cancerrisk among Finnish food industry workers. InternationalJournal of Cancer 118:2567-2571.
Alguacil J, Polián M and Gustavsson P. 2003. Occupationswith increased risk of pancreatic cancer in the Swedishpopulation. Occupational and Environmental Medicine60(8):570-6.
Alguacil J, Porta M and Malats N et al. 2002.Occupational exposure to organic solvents and K-rasmutations in exocrine pancreatic cancer. Carcinogenesis23(1):1010-6.
Ji BT, Silverman DT, Stewart PA et al. 2001. Occupationalexposure to pesticides and pancreatic cancer. AmericanJournal of Industrial Medicine 39(1):92-9.
200. Statistics Canada. See note 27.
201. New Brunswick Department of Health and Wellness2004. See note 26.
New Brunswick Department of Health and Wellness 2000.See note 93.
202. Alexander DD, Mink PJ, Adami HO et al. 2007. Thenon-Hodgkin lymphomas: a review of the epidemiologicliterature. International Journal of Cancer 120(Supplement) 12:1-39.
203. Ibid.
Grulich AE and Vajdic CM. 2005. The epidemiology ofnon-Hodgkin’s lymphoma. Pathology 37(6):409-19.
Fisher SG and Fisher RI. 2004. The epidemiology of non-Hodgkin’s lymphoma. Oncogene 23:6524-6534.
204. Statistics Canada 1997. See note 27.
205. Ibid.
206. Canadian Cancer Society’s Steering Committee 2009.See note 116.
New Brunswick Department of Health and Wellness 2004.See note 26.
207. Ibid. Canadian Cancer Society’s Steering Committee2009.
208. Ibid.
209. Ibid.
210. Statistics Canada 1997. See note 27.
211. Alexander et al. 2007; See note 202.
Grulich and Vajdic 2007; Fisher and Fisher 2004. See note203.
212. Ibid.
213. Allen NE, Beral V, Casabonne D et al. 2009.Moderate alcohol intake and cancer incidence in women.Journal of the National Cancer Institute 101(5):296-305.
Boffetta P, van der Hel O, Kricker A et al. 2008. Exposureto ultraviolet radiation and risk of malignant lymphomaand multiple myeloma - a multicentre European case-control study. International Journal of Epidemiology37(5):1084-94.

Cancer in New Brunswick Communities: Investigating the environmental connection Part 2 79
Armstrong BK and Kricker A. 2007. Sun exposure andnon-Hodgkin lymphoma. Cancer Epidemiology Biomarkersand Prevention 16(3): 396-400.
Fernberg P, Odenbro A, Bellocco R, Boffetta P, Pawitan Yand Adami J. 2006. Tobacco use, body mass index andthe risk of malignant lymphomas - a nationwide cohortstudy in Sweden. International Journal of Cancer118(9):2298-302.
Morton LM, Zheng T, Holford TR et al. 2005. Alcoholconsumption and risk of non-Hodgkin lymphoma: apooled analysis. Lancet Oncology 6:469–76.
214. Fisher and Fisher 2004. See note 203.
215. McDuffie HH, Pahwa P, Karunanayake CP, Spinelli JJand Dosman JA. 2009. Clustering of cancer amongfamilies of cases with Hodgkin lymphoma (HL), multiplemyeloma (MM), non-Hodgkin’s lymphoma (NHL), softtissue sarcoma (STS) and control subjects. BMC Cancer9:70.
Orsi L, Delabre L, Monnereau A et al. 2009. Occupationalexposure to pesticides and lymphoid neoplasms amongmen: results of a French case-control study. OccupationalEnvironmental Medicine 66(5):291-8.
Alexander et al. 2007. See note 202.
Merhi M, Raynal H, Cahuzac E et al. 2007. Occupationalexposure to pesticides and risk of hematopoeitc cancers:meta-analysis of case-control studies. Cancer Causes andControls 18(10):1209-26.
Dreiher J and Kordysh E. 2006. Non-Hodgkin lymphomaand pesticide exposure: 25 years of research. ActaHaematology 116(3):153-64.
216. Ibid. Dreiher and Kordysh 2006.
217. Schenk M, Purdue MP, Colt JS et al. 2009.Occupation/industry and risk of non-Hodgkin’s lymphomain the United States. Occupational and EnvironmentalMedicine 66(1):23-31.
t’Mannetje A, Dryson E, Walls C et al. 2008. High riskoccupations for non-Hodgkin’s lymphoma in New Zealand:case-control study. Occupational and EnvironmentalMedicine 65(5):354-63.
Richardson DB, Terschüren C and Hoffmann W. 2008.Occupational risk factors for non-Hodgkin’s lymphoma: apopulation-based case-control study in Northern
Germany. American Journal of Industrial Medicine51(4):258-68.
Karunanayake CP, McDuffie HH, Dosman JA, Spinelli JJand Pahwa P. 2008. Occupational exposures and non-Hodgkin’s lymphoma: Canadian case-control study.Environmental Health 7:44.
218. Hatcher 1984. See note 8.
219. Ibid.
220. Statistics Canada. Table 153-0039 - Selectedagricultural activity, provinces, every five years. Chemicalproduct expenses (includes herbicides, insecticides,fungicides and other products) and cropland area. CANSIM(database).
221. Environment Canada 1991. See note 11.
222. Ibid.
223. Statistics Canada. See note 27.
224. Ibid.
225. New Brunswick Department of Health and Wellness2004. See note 26.
New Brunswick Department of Health and Wellness 2000.See note 93.
226. Cartwright RA and Watkins G. 2002. Epidemiology ofHodgkin’s disease: a review. Hematology and Oncology22(1):11-26.
227. Monnereau A, Orsi, Troussard X et al. 2008. Cigarettesmoking, alcohol drinking, and risk of lymphoidneoplasms: results of a French case-control study. CancerCauses and Control 19(10):1147-60.
Gorini G, Stagnaro E, Fontana V et al. 2007. Alcoholconsumption and risk of Hodgkin’s lymphoma andmultiple myeloma: a multicentre case-control study.Annals of Oncology 18(1):143-8.
Fernberg et al. 2006. See note 213.
Briggs NC, Hall HI, Brann EA, Moriarty DJ and Levine RS.2002. Cigarette smoking and risk of Hodgkin’s disease: apopulation-based case-control study. American Journal ofEpidemiology 156(11):1011-20.

Cancer in New Brunswick Communities: Investigating the environmental connection Part 280
228. Constine LS, Tarbell N, Hudson MM et al. 2008.Subsequent malignancies in children treated forHodgkin’s disease: associations with gender and radiationdose. International Journal of Radiation OncologyBiological and Physics 72(1):24-33.
Goodman KA, Riedel E, Serrano V, Gulati S, Moskowitz CHand Yahalom J. 2008. Long-term effects of high-dosechemotherapy and radiation for relapsed and refractoryHodgkin’s lymphoma. Journal of Clinical Oncology26(3):5240-7.
Gustavsson A, Osterman B and Cavallin-Ståhl E. 2003. Asystematic overview of radiation therapy effects inHodgkin’s lymphoma. Acta Radiologica Oncology 42(5-6):589-604.
229. Andersson A, Näslund U, Tavelin B, Enblad G,Gustavsson A and Malmer B. 2009. Long-term risk ofcardiovascular disease in Hodgkin lymphoma survivors:retrospective cohort analyses and a concept forprospective intervention. International Journal of Cancer124(8):1914-7.
De Bruin ML, Dorresteijn LD, van’t Veer MB et al. 2009.Increased risk of stroke and transient ischemic attack inf-year survivors of Hodgkin lymphoma. Journal of theNational Cancer Institute 1010(13):928-37.
Gustavsson et al. 2003. See note 228.
230. Miligi L, Costantini As, Benvenuti A et al. 2006.Occupational exposure to solvents and the risk oflymphomas. Epidemiology 17(5):552-61.
McCunney RJ. 1999. Hodgkin’s disease, work and theenvironment. A review. Journal of Occupational Health andMedicine 41(1):36-46.
Rix BA, Villadsen E, Engholm G and Lynge E. 1998.Hodgkin’s disease, pharyngeal cancer, and soft tissuesarcomas in Danish paper mill workers. Journal ofOccupation Health and Medicine 40(1):55-62.
231. New Brunswick Department of Health and Wellness2000. See note 93.
232. New Brunswick Department of Health and Wellness2004. See note 27.
233. Canadian Cancer Society/National Cancer Instituteof Canada 2008. See note 26.
Canadian Cancer Society/National Cancer Institute ofCanada. 2007. Canadian Cancer Statistics 2007. Toronto,Canada. April 2007. ISSN 0835-2976.
Canadian Cancer Society/National Cancer Institute ofCanada. 2006. Canadian Cancer Statistics 2006. Toronto,Canada. April 2006. ISSN 0835-2976.
Canadian Cancer Society/National Cancer Institute ofCanada. 2005. Canadian Cancer Statistics 2005. Toronto,Canada. April 2005. ISSN 0835-2976.
234. Ibid.
235. Canadian Cancer Society/National Cancer Instituteof Canada 2008. See note 26.
236. Strom SS, Yamamura Y, Kantarijian HM and Cortes-Franco JE. 2009. Obesity, weight gain, and risk of chronicmyeloid leukemia. Cancer Epidemiology Biomarkers andPrevention 18(5):1501-6.
Richardson DB, Terschüren C, Pohlabein H, Jöckel KH andHoffmann W. 2008. Temporal patterns of associationbetween cigarette smoking and leukemia risk. CancerCauses and Control 19(1):43-50.
Fernberg P, Odenbro A, Bellocco R. et al. 2007. Tobaccouse, body mass index, and the risk of leukemia andmultiple myeloma: a nationwide cohort study in Sweden.Cancer Research 67(12):5983-6.
Reeves GK, Pirie K, Beral V et al. 2007. Cancer incidenceand mortality in relation to body mass index in theMillion Women Study: cohort study. British MedicalJournal 335(7630): 1134.
Kasim K, Levallois P, Abdous B, Auger P and Johnson KC.2005. Lifestyle factors and the risk of adult leukemia inCanada. Cancer Causes and Control 16(5): 489-500.
Ross JA, Parker E, Blair CK, Cerhan JR and Folsom AR.2004. Body mass index and risk of leukemia in olderwomen. Cancer Epidemiology Biomarkers and Prevention13(11 Pt1):1810-3.
Thomas X and Cheighoum Y. 2004. Cigarette smoking andacute leukemia. Leukemia & Lymphoma 45(6):1109-9.
237. Chang JS. 2009. Parental smoking and childhoodleukemia. Methods in Molecular Biology 472:103-37.
Cancer in New Brunswick Communities: Investigating the environmental connection Part 2 81
MacArthur AC, McBride ML, Spinelli JJ et al. 2008. Risk ofchildhood leukemia associated with parental smoking andalcohol consumption prior to conception and duringpregnancy: the cross-Canada childhood leukemia study.Cancer Causes and Control 19(3):283-95.
Menegaux F, Ripert M, Hémon D and Clavel J. 2007.Material alcohol and coffee drinking, parental smokingand childhood leukaemia: a French population-basedcase-control study. Paediatric and Perinatal Epidemiology21(4):293-9.
238. Brosselin P, Rudant J, Orsi L et al. 2009. Childhoodacute leukemia and residence next to gas stations andautomotive repair garages: the ESCALE study (SFCE*).Occupational and Environmental Medicine [E-publishedahead of print].
Panko JM, Gaffney SH, Burns AM et al. 2009.Occupational exposure to benzene at the Exxon Mobilrefinery at Baton Rouge, Louisiana (1977-2005). Journalof Occupational and Environmental Hygiene 6(9):517-29.
Whitworth KW, Symanski E and Coker Al. 2008. Childhoodlymphohematopoietic cancer incidence and hazardous airpollutants in southeast Texas, 1995-2004. EnvironmentalHealth Perspectives 116(11):1576-80.
Huff J. 2007. Benzene-induced cancers: abridged historyand occupational health impact. International Journal ofOccupational and Environmental Health 13(2):213-21.
Smith MT, Jones RM and Smith AH. 2007. Benzeneexposure and risk of non-Hodgkin lymphoma. CancerEpidemiology, Biomarkers and Prevention 16(3): 385-391.
Yu et al. 2006. Residential exposure to petrochemicalsand the risk of leukemia: using geographic informationsystem tools to estimate individual-level residentialexposure. American Journal of Epidemiology 164:200-207)
O’Connor et al. 1999. Benzene and non-Hodgkin’slymphoma. Journal of Pathology 189:448-453.
239. Brosselin et al. 2009. See note 238.
Soldin OP, Nsouly-Maktabi H, Genkinger JM et al 2009.Pediatric acute lymphoblastic leukemia and exposure topesticides. Therapeutic Drug Monitoring [e-publishedahead of print].
Constantini As, Benvenuti A, Vineis P et al. Risk ofleukemia and multiple myeloma associated with expsureto benzen and other organic solvents: evidence from the
Italian multicentre case-control study. American Journalof Industrial Medicine 51(11):803-11.
Whitworth et al. 2008. See note 238.
Infante-Rivard C and Weichenthal S. 2007. Pesticides andchildhood cancer: an update of Zham and Ward’s 1998review. Journal of Toxicology Environment and Health BCritical Review 10(1-2):81-99.
Rudant J, Menegaux F, Leverger G et al. 2007. Householdexposure to pesticides and risk of childhoodhematopoietic malignancies: the ESCALE study (SFCE).Environmental Health Perspectives 115(12):1787-93.
240. Genuis S. 2008. Fielding a current idea: exploringthe public health impact of electromagnetic radiation.Public Health 122(2):113-124.
Hardell L, Carlberg M, Södeqvist F and Hansson Mild K.2008.Meta-analysis of long-term mobile phone use andthe association with brain tumours. International Journalof Oncology 32(5):1097-103.
Hardell L and Sage C. 2008. Biological effects fromelectromagnetic field exposure and public exposurestandards. Biomedicine and Pharmacotherapy 62(2):104-9.
Kabuto M, Nitta H, Yamamoto S. et al. 2006. Childhoodleukemia and magnetic fields in Japan: a case–controlstudy of childhood leukemia and residential power-frequency magnetic fields in Japan. International Journalof Cancer 119:643–50.
Draper G, Vincent T, Kroll ME, Swanson J. 2005.Childhood cancer in relation to distance from highvoltage power lines in England and Wales: a case–controlstudy. British Medical Journal 330:1290.
241. Kheifets L, Repacholi M, Saunders R and vanDeventer E. 2005. The sensitivity of children toelectromagnetic fields. Pediatrics 116(2):303-13.
242. Statistics Canada. See note 26.
243. New Brunswick Department of Health and Wellness2004. See note 27.
New Brunswick Department of Health and Wellness 2000.See note 93.
244. Canadian Cancer Society/National Cancer Instituteof Canada 2008. See note 26.

Cancer in New Brunswick Communities: Investigating the environmental connection Part 282
245. Ohgaki H. 2009. Epidemiology of brain tumors.Methods in Molecular Biology, Cancer Epidemiology472:323-342.
246. Neglia JP, Robison LL, Stovall M et al. 2006. Newprimary neoplasms of the central nervous system insurvivors of childhood cancer: a report from theChildhood Cancer Survey study. Journal of the NationalCancer Institute 98(21):1528-37.
Relling MV, Rubnitz JE, Rivera GK et al. 1999. Highincidence of secondary brain tumours after radiotherapyand antimetabolites. Lancet 354: 34-39.
247. Carpenter DO and Sage C. 2008. Setting prudentpublic policy for electromagnetic field exposures. Reviewsin Environmental Health 23(2):91-117.
Hardell and Sage. 2008. See note 240.
248. Hardell et al. 2008. See note 240.
Lönn S, Ahlbom A, Hall P et al. 2005. Long-term mobilephone use and brain tumor risk. American Journal ofEpidemiology 161:526-35.
249. Mandelzweig L, Novikov I and Sadetzki. 2009.Smoking and risk of glioma: a meta-analysis. CancerCauses and Controls [e-published ahead of print].
Holick CN, Giovannucci EL, Rosner B, Stampfer MJ andMichaud DS. 2007. Prospective study of cigarette smokingand adult glioma: dosage, duration, and latency. Neuro-Oncology 9(3):326-34.
Zheng T, Cantor KP, Zhang Y, Chiu BC and Lynch CF. 2001.Risk of brain glioma not associated with cigarettesmoking or use of other tobacco products in Iowa. CancerEpidemiology Biomarkers and Prevention 10:413-414.
250. Dietrich M, Block G, Pogoda JM et al. 2005. Areview: dietary and endogenously formed N-nitrosocompounds and risk of childhood brain tumours. CancerCauses and Control 16(6):619-35.
Huncharek M and Kupelnick B. 2004. A meta-analysis ofmaternal cured meat consumption during pregnancy andthe risk of childhood brain tumours. Neuro-epidemiology23(1-2):78-84.
Pogoda JM and Preston-Martin S. 2001. Maternal curedmeat consumption during pregnancy and risk ofpaediatric brain tumour in offspring: potentially harmfullevels of intake. Public Health and Nutrition 4:183-9.
251. Bondy ML, Scheurer ME, Malmer B et al. 2008. Braintumor epidemiology: consensus from the Brain TumorEpidemiology Consortium. Cancer 113(7) Suppliment:1953-68.
Connelly JM and Malkin MG. 2007. Environmental riskfactors for brain tumors. Current Neurology andNeuroscience Reports 7:208-14.
252. Il’yasova D, McCarthy BJ, Erdal S et al. 2009. Humanexposure to selected animal neurocarcinogens: abiomarker-based assessment and implications for braintumor epidemiology. Journal of Toxicology andEnvironmental Health B Critical Reviews 12(3):175-87.
253. Clapp et al. 2007. See note 32.
Connelly and Malkin 2007. See note 251.
254. Baldwin RT and Preston-Martin S. 2004.Epidemiology of brain tumors in childhood- a review.Toxicology and Applied Pharmacology 199(2):118-31.
McBride ML. Childhood cancer and environmentalcontaminants. Canadian Journal of Public Health 1:S53-63:58-68.
255. New Brunswick Department of Health and Wellness2004. See note 26.
New Brunswick Department of Health and Wellness 2000.See note 93.
256. Dorfman HE and Czerniak B. 1995. Bone Cancer.Cancer 75(S1):203-210.
257. Ibid.
258. Ibid.
259. Bijwaard H, Brugmans MJ and Leenhouts HP. 2004.Two-mutation models for bone cancer due to radium,strontium and plutonium. Radiation Research 162-(2):171-84.
260. Stava CJ, Jimenez C, Hu MI and Vassilopoulou-SelinR. 2009. Skeletal sequelae of cancer and cancertreatment. Journal of Cancer Survivorship 3:75-88.
261. Pantel K, Alix-Panabières C and Riethdorf S. 2009.Cancer micrometastases. National Reviews in ClinicOncology 6(6):339-51.
Riethdorf S, Wikman H and Pantel K. 2008. Review:
82

Cancer in New Brunswick Communities: Investigating the environmental connection Part 2 83
biological relevance of disseminated tumor cells in cancerpatients. International Journal of Cancer 123(9):1991-2006.
262. Ibid.
263. Braun S. Auer D and Marth C. 2009. The prognosticimpact of bone marrow micrometatases in women withbreast cancer. Cancer Investigation 27(6):598-603.
Suva L, Griffin R and Makhoul I.. 2009. Mechanisms ofbone metastases of breast cancer. Endocrine-RelatedCancer [e-published ahead of print].
Reithdorf S and Pantel K. 2008. Disseminated tumor cellsin bone marrow and circulating tumor cells in blood ofbreast cancer patients: current state of detection andcharacterization. Pathobiology 75(2):140-8.
Alix-Panabières C, Müller V and Pantel K. 2007. Currentstatus in human breast cancer micrometastasis. CurrentOpinion in Oncology 19(6):558-63.
264. Meadows et al. 2009. See note 130.
265. Belpomme et al. 2007. See note 33.
266. Ibid.
Irigaray P, Newby JA, Clapp R et al. 2007. Lifestyle-related factors and environmental agents causing cancer:an overview. Biomedicine and Pharmacoptherapy 61:640-58.
Danaei et al. 2005. See note 79.
Peto J. 2001. Cancer epidemiology in the last centuryand the next decade. Nature 411:390-5.
267. Best N and Hansell Al. 2009. Geographic variationsin risk: adjusting for unmeasured confounders throughjoint modeling of multiple diseases. Epidemiology[Epublished ahead of print].
McNally RJ, Alexander FE, Vincent TJ and Murphy MF.2009. Spatial clustering of childhood cancer in GreatBritain during the period 1969-1993. InternationalJournal of Cancer 124(4):932-6.
Dai D and Oyana Tj. 2008. Spatial variations in theincidence of breast cancer and potential risks associatedwith soil dioxin contamination in Midland, Saginaw andBay Counties, Michigan, USA. Environmental Health 7:49.
Vieira V, Webster T, Weinberg J, Aschengrau A. 2009.Spatial analysis of bladder, kidney and pancreatic canceron upper Cape Cod: an application of generalized additivemodels to case-control data. Environmental Health 8:3.
De Coster S, Koppen G, Bracke M et al. 2008. Pollutanteffect on genotoxic parameters and tumor-associatedprotein levels in adults: a cross sectional study.Environmental Health 7:26.
Elliot SJ, Eyels J, and DeLuca.P. 2001. Mapping health inthe Great Lakes Areas of Concern: A user-friendly tool forpolicy and decision makers. Environmental HealthPerspectives 109(s.6): 817-826.
268. Azuma K, Uchiyama I, Chiba Y and Okumura J. 2009.Mesothelioma risk and environmental exposure toasbestos: past and future trends in Japan. InternationalJournal of Occupational and Environmental Health15(2):166-72.
Ahn YS and Kang SK. 2009. Asbestos-related occupationalcancers compensated under the Industrial AccidentCompensation Insurance in Korea. Industrial Health47(2):113-22.
Cree MW, Lalji M, Jiang B and Carriere KC. Under-reportingof compensable mesothelioma in Alberta. AmericanJournal of Industrial Medicine 52(7):526-33.
d’Errico A, Pasian S, Baratti A et al. 2009. A case-controlstudy on occupational risk factors for sino-nasal cancer.Occupational and Environmental Medicine 66:448-55.
Pintos J, Parent ME, Case BW , Rousseau MC andSiemiatycki J. 2009. Risk of mesothelioma andoccupational exposure to asbestos and man-madevitreous fibers: evidence from two case-control studies inMontreal, Canada. Journal of Occupational andEnvironmental Medicine [Sept. 10 Epub ahead of print].
Pesch B, Pieri CB, Gebel M et al. 2008. Occupational riskfor adenocarcinoma of the nasal cavity and paranasalsinuses in the German wood industry. Occupation andEnvironmental Medicine 65(3):191-6.
269. Intrinsik Environmental Sciences Inc 2007. See note22.

Cancer in New Brunswick Communities: Investigating the environmental connection Part 284
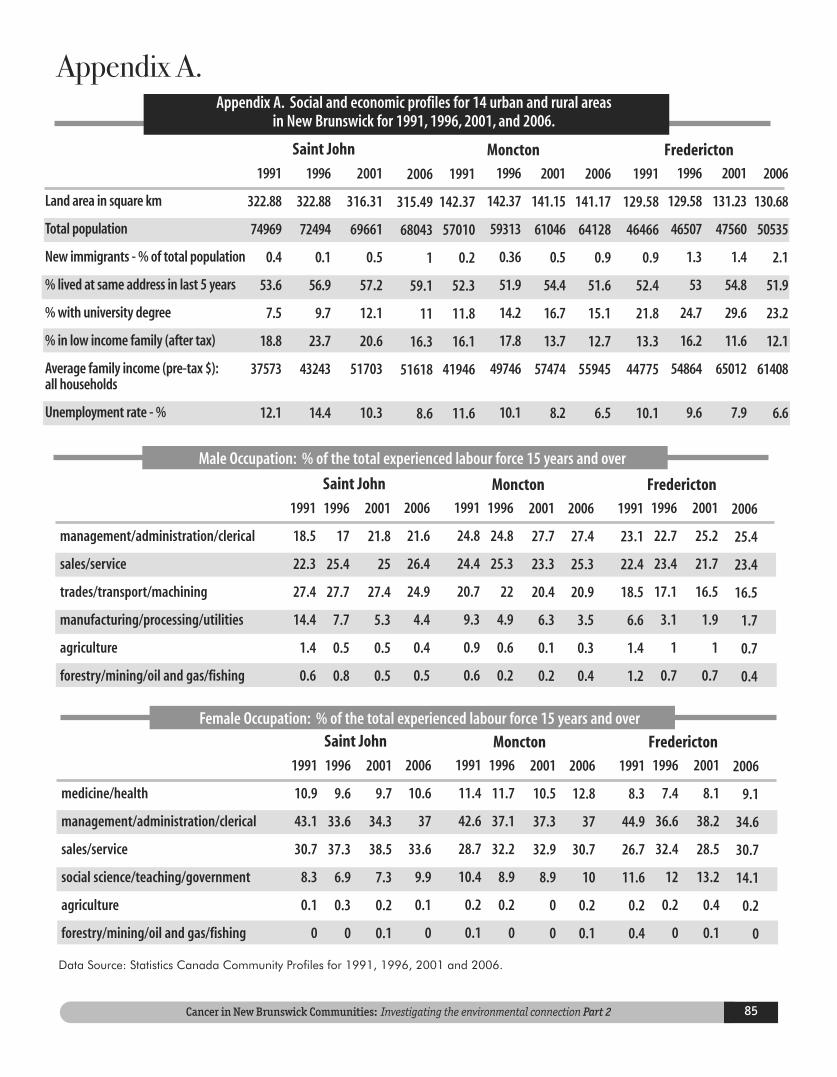
Cancer in New Brunswick Communities: Investigating the environmental connection Part 2 85
management/administration/clerical
sales/service
trades/transport/machining
manufacturing/processing/utilities
agriculture
forestry/mining/oil and gas/fishing
1991
18.5
22.3
27.4
14.4
1.4
0.6
1996
17
25.4
27.7
7.7
0.5
0.8
2001
21.8
25
27.4
5.3
0.5
0.5
2006
21.6
26.4
24.9
4.4
0.4
0.5
Saint John
1991
24.8
24.4
20.7
9.3
0.9
0.6
1996
24.8
25.3
22
4.9
0.6
0.2
2001
27.7
23.3
20.4
6.3
0.1
0.2
2006
27.4
25.3
20.9
3.5
0.3
0.4
Moncton1991
23.1
22.4
18.5
6.6
1.4
1.2
1996
22.7
23.4
17.1
3.1
1
0.7
2001
25.2
21.7
16.5
1.9
1
0.7
2006
25.4
23.4
16.5
1.7
0.7
0.4
Fredericton
medicine/health
management/administration/clerical
sales/service
social science/teaching/government
agriculture
forestry/mining/oil and gas/fishing
1991
10.9
43.1
30.7
8.3
0.1
0
1996
9.6
33.6
37.3
6.9
0.3
0
2001
9.7
34.3
38.5
7.3
0.2
0.1
2006
10.6
37
33.6
9.9
0.1
0
Saint John
1991
11.4
42.6
28.7
10.4
0.2
0.1
1996
11.7
37.1
32.2
8.9
0.2
0
2001
10.5
37.3
32.9
8.9
0
0
2006
12.8
37
30.7
10
0.2
0.1
Moncton1991
8.3
44.9
26.7
11.6
0.2
0.4
1996
7.4
36.6
32.4
12
0.2
0
2001
8.1
38.2
28.5
13.2
0.4
0.1
2006
9.1
34.6
30.7
14.1
0.2
0
Fredericton
Data Source: Statistics Canada Community Profiles for 1991, 1996, 2001 and 2006.
Female Occupation: % of the total experienced labour force 15 years and over
Appendix A. Social and economic profiles for 14 urban and rural areasin New Brunswick for 1991, 1996, 2001, and 2006.
Land area in square km
Total population
New immigrants - % of total population
% lived at same address in last 5 years
% with university degree
% in low income family (after tax)
Average family income (pre-tax $):all households
Unemployment rate - %
1991
322.88
74969
0.4
53.6
7.5
18.8
37573
12.1
1996
322.88
72494
0.1
56.9
9.7
23.7
43243
14.4
2001
316.31
69661
0.5
57.2
12.1
20.6
51703
10.3
2006
315.49
68043
1
59.1
11
16.3
51618
8.6
Saint John
1991
142.37
57010
0.2
52.3
11.8
16.1
41946
11.6
1996
142.37
59313
0.36
51.9
14.2
17.8
49746
10.1
2001
141.15
61046
0.5
54.4
16.7
13.7
57474
8.2
2006
141.17
64128
0.9
51.6
15.1
12.7
55945
6.5
Moncton
1991
129.58
46466
0.9
52.4
21.8
13.3
44775
10.1
1996
129.58
46507
1.3
53
24.7
16.2
54864
9.6
2001
131.23
47560
1.4
54.8
29.6
11.6
65012
7.9
2006
130.68
50535
2.1
51.9
23.2
12.1
61408
6.6
Fredericton
Male Occupation: % of the total experienced labour force 15 years and over
Appendix A.

Cancer in New Brunswick Communities: Investigating the environmental connection Part 286
Male Occupation: % of the total experienced labour force 15 years and over
management/administration/clerical
sales/service
trades/transport/machining
manufacturing/processing/utilities
agriculture
forestry/mining/oil and gas/fishing
1991
12.4
12.4
22.8
30.3
0.8
2.1
1996
15.7
16.2
32.4
14.8
0.9
0.9
2001
8.1
20
38.1
10.6
1.9
2.5
2006
14.6
21
27.4
10.2
0
1.3
Dalhousie
1991
13.2
30
23.6
14
1.1
2.4
1996
18.4
20.1
27.9
13
0.2
1.7
2001
16.8
21.4
28
13.2
0.2
2.3
2006
16.6
23.7
26.1
9.7
0.5
2.4
Miramichi1991
18.5
20.1
20.5
13.8
1.2
5.9
1996
24.7
24
19.7
4.3
1.2
3.6
2001
21
23.4
23.5
4.8
0
3.5
2006
19.6
28.3
22.9
2.7
0.5
3.3
Bathurst
medicine/health
management/administration/clerical
sales/service
social science/teaching/government
agriculture
forestry/mining/oil and gas/fishing
1991
14.5
35.2
28.5
15.6
0
1.1
1996
15.5
30.3
36.1
11
0
0
2001
15.7
26.5
36.7
11.4
0
0
2006
16.8
29.4
32.9
15.4
0
0
Dalhousie
1991
14.1
36.6
31.8
11.2
0
0
1996
12.7
29
37.6
10.7
0.5
0
2001
9.6
27.5
41.2
12.5
0
0.2
2006
14.4
31.1
36
11
0.2
0
Miramichi1991
10.5
43.2
25.8
12.1
0.6
0
1996
10.5
31.1
36.1
11.6
0
0
2001
11.2
33.1
40
8
0
0
2006
11.1
34.4
34.8
10.8
0
0
Bathurst
Data Source: Statistics Canada Community Profiles for 1991, 1996, 2001 and 2006.
Female Occupation: % of the total experienced labour force 15 years and over
Appendix A. Social and economic profiles for 14 urban and rural areasin New Brunswick for 1991, 1996, 2001, and 2006.
Land area in square km
Total population
New immigrants - % of total population
% lived at same address in last 5 years
% with university degree
% in low income family (after tax)
Average family income (pre-tax $):all households
Unemployment rate - %
1991
13.25
4775
0
72.2
6.5
18.7
36191
14.9
1996
13.25
4500
0
73.2
8.3
17.7
45735
18.8
2001
14.9
3975
0
83.2
7.2
13.8
52642
16
2006
14.51
3676
0.3
77.8
6.4
12.4
48850
11.7
Dalhousie
1991
85.08
15960
0.2
57.7
9.4
11.8
41328
16
1996
175.07
19241
0.5
70.8
9.7
15.9
48729
16.9
2001
179.83
18508
0.1
69.3
13.1
16
52038
14.2
2006
179.84
18129
0.4
72.7
11.2
10.3
53413
12.5
Miramichi
1991
90.94
14409
0.1
63.6
9.6
20.4
37278
17.5
1996
90.94
13815
0.1
64.3
11.5
19.2
45213
14.5
2001
91.55
12924
0.1
63.5
12.5
17.5
52644
11.9
2006
91.55
12714
0.3
65
11.5
15.1
51634
8.6
Bathurst

Cancer in New Brunswick Communities: Investigating the environmental connection Part 2 87
Male Occupation: % of the total experienced labour force 15 years and over
management/administration/clerical
sales/service
trades/transport/machining
manufacturing/processing/utilities
agriculture
forestry/mining/oil and gas/fishing
1991
21.7
15.7
28.7
14.6
0.8
4.7
1996
24.6
18.1
23.8
6.5
2.7
6.5
2001
20.5
19.3
20.8
6.6
1.2
9.7
2006
20.9
25.8
16.9
6.2
0
10.7
Caraquet
1991
15.2
16.6
25.5
14.7
0.8
2.4
1996
17.5
21.7
25.9
10
0.9
1
2001
18.6
18.3
28.8
12.7
0.3
0.1
2006
17.4
19.6
30.2
11.4
0.6
1.3
Edmundston1991
3.7
11.2
30.6
20.1
1.5
17.2
1996
4.7
12.1
33.6
20.1
1.3
13.4
2001
9.5
18.9
32.4
18.2
3.4
8.8
2006
14.7
15.5
35.3
15.5
1.7
8.6
Belledune Area
medicine/health
management/administration/clerical
sales/service
social science/teaching/government
agriculture
forestry/mining/oil and gas/fishing
1991
11.3
39.4
25.3
10
1.4
0.9
1996
10.4
27.4
32.1
13.2
0
0
2001
9.4
34.3
30.9
11.6
0
0
2006
8.6
31.7
31.7
13.6
0
0.9
Caraquet
1991
14.5
35.7
29
11.1
0
0
1996
11
29.3
34.4
10.3
0.2
0
2001
12.3
32.9
33.8
9.1
0.2
0
2006
15.9
29.8
33.3
9
0
0
Edmundston1991
2.3
30.2
40.7
12.8
0
2.3
1996
6.1
24.3
40.9
7
0
3.5
2001
12.3
34
34
6.6
1.9
0
2006
15.2
36.4
31.3
4
0
2
Belledune Area
Data Source: Statistics Canada Community Profiles for 1991, 1996, 2001 and 2006.
Female Occupation: % of the total experienced labour force 15 years and over
Appendix A. Social and economic profiles for 14 urban and rural areasin New Brunswick for 1991, 1996, 2001, and 2006.
Land area in square km
Total population
New immigrants - % of total population
% lived at same address in last 5 years
% with university degree
% in low income family (after tax)
Average family income (pre-tax $):all households
Unemployment rate - %
1991
67
4556
0
65.3
10.7
12.2
41158
15
1996
67
4653
0.3
65.4
12.3
20.5
42112
19.5
2001
68.26
4442
0
68.2
17.5
11.7
52139
15.6
2006
68.26
4156
0.2
71.7
14.8
11.3
53473
9.2
Caraquet
1991
102.84
17409
0.4
64.5
10.3
12.1
36925
13
1996
102.84
17716
0.2
64.9
12.9
17.7
44259
12.6
2001
106.9
17373
0.4
67.7
13.6
12.8
54401
9
2006
106.92
16643
0.3
69
10.9
10.1
51146
8
Edmundston
1991
51.98
2553
0.4
80.6
5
14.3
30677
20.5
1996
207.11
3182
0
83.4
3.5
22.3
36629
23.2
2001
202.82
2964
0
79.8
3.4
14.7
44740
19
2006
202.82
2682
0
81.4
5.4
11.6
44599
13.9
Belledune Area

Cancer in New Brunswick Communities: Investigating the environmental connection Part 288
Male Occupation: % of the total experienced labour force 15 years and over
management/administration/clerical
sales/service
trades/transport/machining
manufacturing/processing/utilities
agriculture
forestry/mining/oil and gas/fishing
1991
7.4
10.2
31.4
9.1
2.5
26.4
1996
4.7
12.5
34.3
11.9
0.6
19.7
2001
5.9
9.6
30.1
15.8
0.9
19.9
2006
9.6
7.9
34.6
12
2.1
13.4
Upper Miramichi Area
1991
14.6
7.5
37.7
13.7
0.9
12.3
1996
8.3
8.3
39.2
14.7
1.5
7.8
2001
8.1
8.1
47
17.8
3.2
6.5
2006
14.7
13.6
45.8
10.2
0
6.8
Minto Area1991
9.3
7.7
34.3
14.3
16.7
5.3
1996
9.9
11.4
32.4
10.2
19.1
2.8
2001
9.5
9.5
41.2
9.5
16.9
2.4
2006
10
9.1
47.9
11.8
12.6
1.5
Drummond-Denmark Area
Appendix A. Social and economic profiles for 14 urban and rural areasin New Brunswick for 1991, 1996, 2001, and 2006.
Land area in square km
Total population
New immigrants - % of total population
% lived at same address in last 5 years
% with university degree
% in low income family (after tax)
Average family income (pre-tax $):all households
Unemployment rate - %
1991
3196.29
6873
0
84.3
3.6
14.7
33006
37.3
1996
3196.29
7064
0
82.5
3.9
16.5
40398
39.1
2001
3130.79
6736
0
79.8
6.1
11.4
46326
32.4
2006
3130.79
6294
0
84.7
3.7
10.8
42772
23.7
Upper Miramichi Area
1991
204.82
4051
0
71.7
4.4
17.7
30256
19.7
1996
204.82
4006
0
72.5
3.8
14.6
40374
23.9
2001
204.98
3700
0
79.5
6.2
11.9
48488
22.5
2006
204.93
3631
0
67.9
4.6
10.1
47722
19.5
Minto Area
1991
1994.78
6123
0.2
80.5
4.9
17
33003
18.1
1996
1994.78
6307
0
79.7
5.2
25.2
34246
19.9
2001
1932.74
6185
0.5
75
6.4
17.9
42567
16.8
2006
1932.75
5980
0
71.9
5.2
10.8
46189
12.4
Drummond-Denmark Area
medicine/health
management/administration/clerical
sales/service
social science/teaching/government
agriculture
forestry/mining/oil and gas/fishing
1991
4.4
31.6
38.7
9.8
0.9
4.9
1996
5.4
28.3
36.8
9.3
2.7
0
2001
2.8
27.1
42.2
6.8
0
1.6
2006
8.1
22.7
43.8
9.2
0.8
0
Upper Miramichi Area
1991
4.2
46.5
27.5
4.9
6.3
4.9
1996
8
32
22.7
10
0
0
2001
5
30.2
39
8.2
1.3
0
2006
8.8
35.6
36.3
5
0
0
Minto Area1991
11.2
30.7
23.3
6
11.2
1.9
1996
9.3
25.7
30
4.3
6.2
0.8
2001
7.8
27.9
32.6
7.4
7
0
2006
8.9
18.9
41.3
11.7
4.6
0
Drummond-Denmark Area
Data Source: Statistics Canada Community Profiles for 1991, 1996, 2001 and 2006.
Female Occupation: % of the total experienced labour force 15 years and over

Cancer in New Brunswick Communities: Investigating the environmental connection Part 2 89
Male Occupation: % of the total experienced labour force 15 years and over
management/administration/clerical
sales/service
trades/transport/machining
manufacturing/processing/utilities
agriculture
forestry/mining/oil and gas/fishing
1991
13.9
10.4
30.4
20
2.6
7.8
1996
14.4
7.2
34.2
7.2
2.7
17.1
2001
16.9
5.9
44.9
5.9
7.6
7.6
2006
10.3
6.5
42.1
7.5
1.9
11.2
Harvey Area
Appendix A. Social and economic profiles for 14 urban and rural areasin New Brunswick for 1991, 1996, 2001, and 2006.
Land area in square km
Total population
New immigrants - % of total population
% lived at same address in last 5 years
% with university degree
% in low income family (after tax)
Average family income (pre-tax $):all households
Unemployment rate - %
1991
586.69
2113
0
76.7
7
9.2
34082
14.9
1996
586.69
2213
0
74.1
9.9
9
46007
15
2001
527.87
2231
0
79.4
8.7
5.8
45100
15.1
2006
527.93
2215
0
79.2
4.8
7.7
50121
8
Harvey Area
1991
1700.45
6901
0.1
69.3
3
10.8
35286
13.7
1996
1700.45
7695
0.4
65.3
4.7
14.9
38654
14.5
2001
1687.5
8112
0
68.4
5.6
3.1
51773
10.3
2006
1687.3
7919
0.1
68.9
5.2
10.4
50272
6.8
Base Gagetown Area
medicine/health
management/administration/clerical
sales/service
social science/teaching/government
agriculture
forestry/mining/oil and gas/fishing
1991
11.1
19.8
32.1
13.6
0
2.5
1996
3.9
28.4
38.2
10.8
3.9
0
2001
5.6
36.4
34.6
6.5
2.8
0
2006
10.4
29.2
25.5
16
1.9
0
Harvey Area
Data Source: Statistics Canada Community Profiles for 1991, 1996, 2001 and 2006.
Female Occupation: % of the total experienced labour force 15 years and over
1991
8.5
26.4
34.1
13.6
4.4
3.1
1996
6.3
32.8
37.3
3.5
2.8
4.8
2001
12.8
30.8
32.7
4.5
3.8
4.3
2006
10
36.5
30.6
4.5
3.8
2.8
Base Gagetown Area
1991
6.7
37.7
30.6
7.1
2.6
0.7
1996
7.9
34.5
38.5
3.3
3
0
2001
9
33
42.2
7.9
1.9
0
2006
10.1
31.6
38.1
9.1
0.5
0.5
Base Gagetown Area

Cancer in New Brunswick Communities: Investigating the environmental connection Part 290
Appendix B. Cancer counts (N) and unadjusted incidence rates (IR) per 100,000 populationfor males in 14 urban and rural areas in New Brunswick (1989-2005).
Colorectal
Lung (and bronchus)
Prostate
Non-Hodgkin’s Lymphoma
Bladder
Kidney
Pancreas
Brain (and central nervous system)
Bone (and joints)
Leukemia
Hodgkin'sDisease
Thyroid
N
3934
6121
8385
1271
2082
1081
755
499
N/A
N/A
N/A
N/A
IR
62.5
97.2
133.2
20.2
33.1
17.2
12
8
N/A
N/A
N/A
N/A
N
451
825
977
140
248
134
90
47
8
27
18
19
IR
79.5
145.4
172.2
24.7
43.7
23.6
15.9
8.3
24.0
4.8
3.2
3.3
Province
N
294
338
582
79
142
66
46
39
<6
10
13
10
IR
76.6
88.0
151.6
20.6
37.0
17.2
12.0
10.2
N/A
2.6
3.4
2.6
Saint John Fredericton
N
337
478
688
118
177
97
78
45
<6
13
18
11
IR
69.4
98.5
141.7
24.3
36.5
20.0
16.1
9.3
N/A
2.7
3.7
2.3
Moncton
N
41
50
73
15
17
10
7
<6
<6
<6
<6
<6
IR
120.4
146.8
214.3
44.0
49.9
29.4
20.5
N/A
N/A
N/A
N/A
N/A
Dalhousie
N
114
163
193
26
51
34
14
12
<6
<6
6
6
IR
77.0
110.1
130.4
17.6
34.5
23.0
9.5
8.1
N/A
N/A
4.1
4.1
Miramichi
Colorectal
Lung (and bronchus)
Prostate
Non-Hodgkin's Lymphoma
Bladder
Kidney
Pancreas
Brain (and central nervous system)
Bone (and joints)
Leukemia
Hodgkin'sDisease
Thyroid
N
85
130
197
28
42
24
17
11
<6
<6
<6
<6
IR
77.6
118.7
179.9
25.6
38.4
21.9
15.5
10.0
N/A
N/A
N/A
N/A
N
19
28
44
7
10
7
9
<6
<6
<6
<6
<6
IR
51.5
75.9
119.2
19.0
27.1
19.0
24.4
N/A
N/A
N/A
N/A
N/A
Bathurst
N
114
193
188
29
46
21
18
12
<6
8
<6
8
IR
82.6
139.9
136.3
21.0
33.3
15.2
13.0
8.7
N/A
5.8
N/A
5.8
Caraquet
Edmundston
N
17
34
53
<6
8
8
<6
<6
<6
<6
<6
<6
IR
71.2
142.3
221.9
N/A
33.5
33.5
N/A
N/A
N/A
N/A
N/A
N/A
Belledune Area
N
46
69
97
10
29
17
<6
6
<6
<6
<6
<6
IR
77.4
116.1
163.2
16.8
48.8
28.6
N/A
10.1
N/A
N/A
N/A
N/A
UpperMiramichi Area
N
33
59
64
9
16
<6
7
<6
<6
<6
<6
<6
IR
102.6
183.4
198.9
28.0
49.7
N/A
21.8
N/A
N/A
N/A
N/A
N/A
Minto Area
N
24
47
47
9
11
6
7
<6
<6
<6
<6
<6
IR
45.2
88.6
88.6
17.0
20.7
11.3
13.2
N/A
N/A
N/A
N/A
N/A
Drummond /DenmarkArea
N
33
64
79
11
25
7
9
<6
<6
<6
<6
<6
IR
50.1
97.1
119.8
16.7
37.9
10.6
13.7
N/A
N/A
N/A
N/A
N/A
BaseGagetownArea
N
16
21
39
6
9
<6
<6
<6
<6
<6
<6
<6
IR
86.9
114.1
211.9
32.6
48.9
N/A
N/A
N/A
N/A
N/A
N/A
N/A
HarveyArea
MALES
Appendix B.
N/A - Data not availableData Source: New Brunswick Cancer Registry Database

Cancer in New Brunswick Communities: Investigating the environmental connection Part 2 91
Appendix B. Cancer counts (N) and unadjusted incidence rates (IR) per 100,000 populationfor females in 14 urban and rural areas in New Brunswick (1989-2005).
Colorectal
Lung (and bronchus)
Breast
Non-Hodgkin's Lymphoma
Bladder
Kidney
Pancreas
Brain (and central nervous system)
Bone (and joints)
Leukemia
Hodgkin'sDisease
Ovarian
Thyroid
N
3610
3378
7419
1128
699
756
746
383
N/A
N/A
N/A
756
N/A
IR
56.2
52.6
115.5
17.6
10.9
11.8
11.6
6.0
N/A
N/A
N/A
13.5
N/A
N
462
579
942
134
112
94
96
41
<6
13
14
107
57
IR
71.7
89.8
146.2
20.8
17.4
14.6
14.9
6.4
N/A
2.0
2.2
16.6
8.8
Province
N
294
213
685
85
53
49
43
35
<6
9
14
76
36
IR
68.7
49.8
160.0
19.9
12.4
11.4
10.0
8.2
N/A
2.1
3.3
17.8
8.4
Saint John Fredericton
N
364
346
710
123
84
66
78
37
<6
12
14
85
45
IR
67.3
64.0
131.2
22.7
15.5
12.2
14.4
6.8
N/A
2.2
2.6
15.7
8.3
Moncton
N
27
35
56
10
7
8
8
<6
<6
<6
<6
16
<6
IR
71.3
92.5
148.0
26.4
18.5
21.1
21.1
N/A
N/A
N/A
N/A
42.3
N/A
Dalhousie
N
104
121
221
36
20
29
27
11
<6
<6
<6
28
16
IR
66.1
76.9
140.5
22.9
12.7
18.4
17.2
7.0
N/A
N/A
N/A
17.8
10.2
Miramichi
Colorectal
Lung (and bronchus)
Breast
Non-Hodgkin’s Lymphoma
Bladder
Kidney
Pancreas
Brain (and central nervous system)
Bone (and joints)
Leukemia
Hodgkin’sDisease
Ovarian
Thyroid
N
98
84
175
26
11
24
27
6
<6
<6
<6
16
20
IR
82.1
70.3
146.6
21.8
9.2
20.1
22.6
5.0
N/A
N/A
N/A
13.4
16.7
N
22
13
42
9
<6
<6
7
<6
<6
<6
<6
<6
<6
IR
56.7
33.5
108.2
23.2
N/A
N/A
18.0
N/A
N/A
N/A
N/A
N/A
N/A
Bathurst
N
100
97
199
25
7
16
18
6
<6
<6
<6
23
35
IR
64.1
62.2
127.6
16.0
4.5
10.3
11.5
3.8
N/A
N/A
N/A
14.7
22.4
Caraquet
Edmundston
N
20
14
27
<6
<6
<6
<6
<6
<6
<6
<6
<6
<6
IR
81.6
57.1
110.1
N/A
N/A
N/A
N/A
N/A
N/A
N/A
N/A
N/A
N/A
Belledune Area
N
47
25
86
18
<6
<6
8
6
<6
<6
<6
10
<6
IR
85.1
45.3
155.7
32.6
N/A
N/A
14.5
10.9
N/A
N/A
N/A
18.1
N/A
UpperMiramichi Area
N
33
32
42
8
6
<6
<6
<6
<6
<6
<6
<6
<6
IR
99.2
96.2
126.3
24.0
18.0
N/A
N/A
N/A
N/A
N/A
N/A
N/A
N/A
Minto Area
N
20
14
35
9
7
7
7
<6
<6
<6
<6
<6
<6
IR
38.9
27.2
68.0
17.5
13.6
13.6
13.6
N/A
N/A
N/A
N/A
N/A
N/A
Drummond /DenmarkArea
N
23
23
69
<6
7
<6
8
7
<6
<6
<6
<6
6
IR
35.8
35.8
107.3
N/A
10.9
N/A
12.4
10.9
N/A
N/A
N/A
N/A
9.3
BaseGagetownArea
N
14
10
29
<6
<6
<6
<6
<6
<6
<6
<6
<6
<6
IR
74.1
52.9
153.5
N/A
N/A
N/A
N/A
N/A
N/A
N/A
N/A
N/A
N/A
HarveyArea
FEMALES
N/A - Data not availableData Source: New Brunswick Cancer Registry Database