Canadians Celebrate Tax Freedom Day on June 10, 2013 · alco hol and tobacco, gas taxes and motor...
12
Main Conclusions ð On Tax Freedom Day, the average Canadian family has earned enough money to pay the taxes imposed on it by the three levels of government: federal, provincial, and local. ð In 2013, Canadians celebrate Tax Freedom Day on June 10. That is, Canadians will have worked until June 9 to pay the total tax bill imposed on them by all levels of government. ð Tax Freedom Day in 2013 arrives two days later than in 2012, when it fell on June 8. ð The later arrival of Tax Freedom Day in 2013 has been driven primarily by two factors. First, several governments have increased taxes this year. Second, Canada’s economy has improved since the recession. As incomes increase, a family’s tax burden tends to increase to a greater extent. That is partly due to our progressive tax system and because people’s consumption increases, which results in an increase in the amount of sales and other consumption taxes Canadian families pay. ð In 2013, the federal government and six provincial governments expect to run budget deficits. Since today’s deficits must one day be paid for by taxes, deficits should be considered as deferred taxation. Had Canadian governments increased taxes to balance their budgets, the average Canadian family would have worked until June 18 to pay the tax bill. In other words, the Balanced Budget Tax Freedom Day arrives on June 19, nine days later than Tax Freedom Day. ð The latest Tax Freedom Day in Canadian history was in 2000, when it fell on June 24, almost two months later than in 1961, the earliest year for which the calculation has been made. ð In 2013, the average Canadian family will earn $97,254 in income and pay a total of $42,400 in taxes (43.6 percent). ð Tax Freedom Day for each province varies according to the extent of the provincially levied tax burden. The earliest provincial Tax Freedom Day fell on May 19 in Alberta while the latest fell on June 22 in Newfoundland & Labrador. June 2013 Canadians Celebrate Tax Freedom Day on June 10, 2013 by Milagros Palacios and Charles Lammam
-
Upload
hoangthuan -
Category
Documents
-
view
222 -
download
0
Transcript of Canadians Celebrate Tax Freedom Day on June 10, 2013 · alco hol and tobacco, gas taxes and motor...

Main Conclusions
ðð On Tax Free dom Day, the aver age Cana dian fam ily has earned enough money to pay thetaxes imposed on it by the three lev els of gov ern ment: fed eral, pro vin cial, and local.
ðð In 2013, Cana di ans cel e brate Tax Free dom Day on June 10. That is, Cana di ans will haveworked until June 9 to pay the total tax bill imposed on them by all lev els of gov ern ment.
ðð Tax Free dom Day in 2013 arrives two days later than in 2012, when it fell on June 8.
ðð The later arrival of Tax Freedom Day in 2013 has been driven primarily by two factors.First, several governments have increased taxes this year. Second, Canada’s economy hasimproved since the recession. As incomes increase, a family’s tax burden tends toincrease to a greater extent. That is partly due to our progressive tax system and becausepeople’s consumption increases, which results in an increase in the amount of sales andother consumption taxes Canadian families pay.
ðð In 2013, the federal government and six provincial governments expect to run budgetdeficits. Since today’s deficits must one day be paid for by taxes, deficits should beconsidered as deferred taxation. Had Canadian governments increased taxes to balancetheir budgets, the average Canadian family would have worked until June 18 to pay thetax bill. In other words, the Balanced Budget Tax Freedom Day arrives on June 19, ninedays later than Tax Freedom Day.
ðð The lat est Tax Free dom Day in Cana dian his tory was in 2000, when it fell on June 24, almosttwo months later than in 1961, the ear li est year for which the cal cu la tion has been made.
ðð In 2013, the average Canadian family will earn $97,254 in income and pay a total of$42,400 in taxes (43.6 percent).
ðð Tax Freedom Day for each province varies according to the extent of the provinciallylevied tax burden. The earliest provincial Tax Freedom Day fell on May 19 in Albertawhile the latest fell on June 22 in Newfoundland & Labrador.
June 2013
Cana di ans Cel e brateTax Free dom Day on June 10, 2013
by Milagros Palacios and Charles Lammam
Intro duc tion
It is nearly impos si ble for ordi naryCana di ans to have a clear idea ofhow much total tax they really pay.Most Cana di ans would have lit tledif fi cultly deter min ing how muchincome tax they pay; a quick look at their income tax return or pay stubwould suf fice. The same is true forEmploy ment Insur ance (EI) andCana dian Pen sion Plan (CPP) pre -mi ums. How ever, there are a host of other taxes that are not so obvi ous.For instance, while Cana di ans arepain fully aware of sales taxes,
cal cu lat ing the total amount paidwould require peo ple to track all oftheir pur chases over the course of ayear. Fur ther, there is a class oftaxes of which Cana di ans are largely unaware and which are built intothe price of goods and ser vices. Themost nota ble of these “hid den”taxes are import duties, gas taxes,excise taxes on tobacco and alco hol,and amuse ment taxes. Finally, mostCana di ans are unaware that theypay the employ ers’ por tion of pay -roll taxes, such as EI and CPP pre -mi ums, and other taxes lev ied onbusi nesses. Although busi nesses pay
these taxes directly, the cost of busi -ness tax a tion is ulti mately passedonto ordi nary Cana di ans.1
Cana di ans Cel e brate Tax Free dom Day on June 10, 2013 2www.fraserinstitute.org
About the authors
Milagros Palacios is asenior econ o mist with theFra ser Insti tute’s Cen tre for Tax and Bud get Pol icy.
Charles Lammam is theAsso ci ate Direc tor of theCen tre for Tax and Bud get Pol icy at the Fra ser Insti tute.
1981 1985 1995 2000re 2005re 2009re 2010re 2011re 2012re 2013pe
Newfoundland& Labrador
May 18 May 09 May 24 June 10 June 22 June 18 June 23 June 27 June 24 June 22
Prince EdwardIsland
May 06 June 07 May 22 May 30 June 11 May 30 May 30 June 02 June 02 June 04
Nova Scotia May 11 May 17 May 31 June 09 June 16 May 30 June 05 June 07 June 08 June 10
New Brunswick May 06 June 02 June 01 June 06 June 08 May 28 May 30 June 02 June 03 June 06
Quebec June 07 June 17 June 09 July 03 June 25 June 05 June 08 June 13 June 15 June 18
Ontario May 29 May 26 June 08 June 16 June 16 May 30 June 03 June 05 June 07 June 09
Manitoba May 17 May 05 June 14 June 16 June 15 May 28 June 01 June 04 June 02 June 06
Saskatchewan May 24 May 17 June 20 June 27 June 29 June 08 June 11 June 10 June 09 June 11
Alberta May 30 May 22 June 02 June 21 June 16 May 22 May 22 May 24 May 19 May 19
BritishColumbia
June 09 June 16 June 12 June 26 June 22 May 29 May 31 June 03 June 02 June 04
Canada May 30 June 06 June 11 June 24 June 20 June 02 June 04 June 07 June 08 June 10
With out nat u ral resources
Newfoundland& Labrador
May 17 May 08 May 23 June 09 June 14 May 27 May 27 May 28 June 01 May 31
Saskatchewan May 15 May 09 June 13 June 15 June 16 June 02 June 01 May 31 June 01 June 02
Alberta May 06 May 03 May 24 May 27 May 25 May 15 May 14 May 13 May 13 May 14
BritishColumbia
June 06 June 12 June 08 June 18 June 15 May 26 May 28 May 31 May 31 June 01
Canada May 27 June 04 June 09 June 20 June 16 May 31 June 01 June 05 June 06 June 08
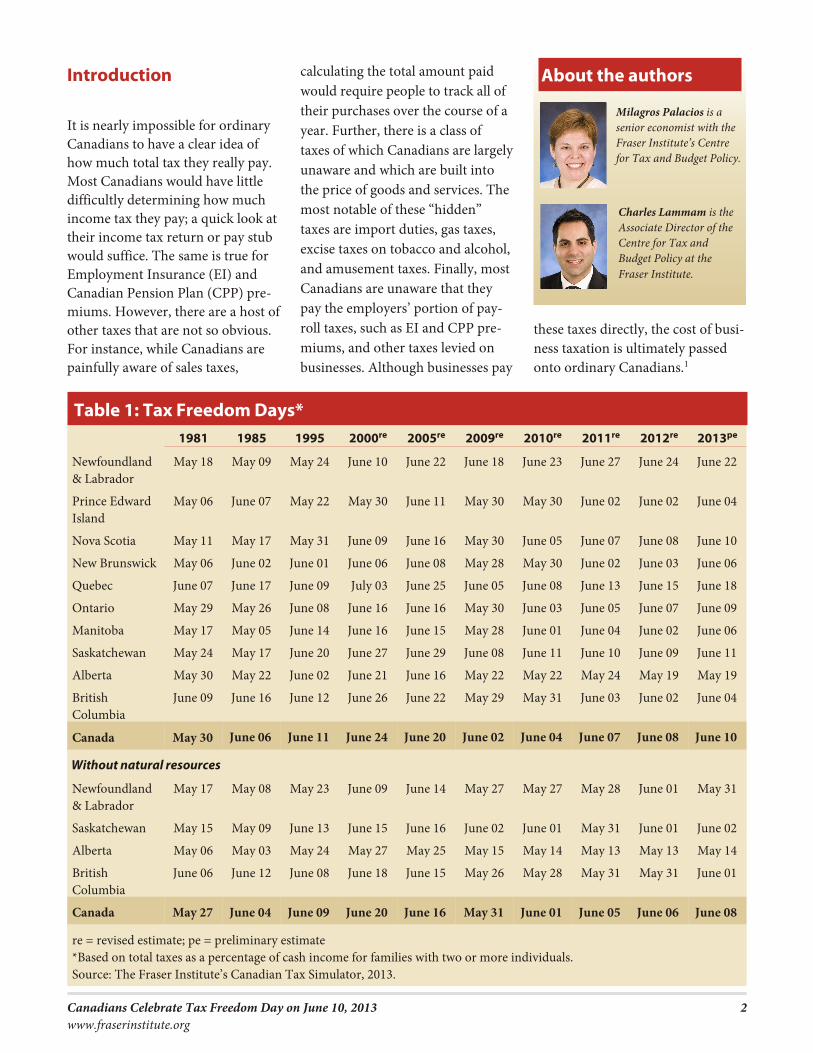
re = revised estimate; pe = preliminary estimate*Based on total taxes as a percentage of cash income for families with two or more individuals.Source: The Fraser Institute’s Canadian Tax Simulator, 2013.
Table 1: Tax Free dom Days*
Each year, the Fra ser Insti tute cal -cu lates Tax Free dom Day to pro vide a com pre hen sive and eas ily under -stood indi ca tor of the over all taxbur den faced by the aver age Cana -dian fam ily. This pub li ca tion pres -ents pre lim i nary cal cu la tions forTax Free dom Day in 2013.2
Tax Free dom Day
Tax Free dom Day is the day in theyear when the aver age Cana dianfam ily has earned enough money topay the taxes imposed on it by thethree lev els of Cana dian gov ern -ment: fed eral, pro vin cial, and local.In other words, if Cana di ans wererequired to pay all of their taxes upfront, they would have to pay eachand every dol lar they earned to gov -ern ment prior to Tax Freedom Day.
Taxes used to com pute Tax Free -dom Day include income taxes,pay roll taxes, sales taxes, profittaxes, taxes on the con sump tion ofalco hol and tobacco, gas taxes andmotor vehi cle licence fees, importduties, nat u ral resource fees, and ahost of other levies.
In 2013, Cana di ans start work ingfor them selves on June 10 (table 1).That is, Cana di ans must work untilJune 9 to pay the total tax bill imposedon them by all lev els of gov ern ment.From June 10 to the end of the year,taxpayers can use the income theyearn as they please. This rep re sentsa two day exten sion over 2012 when Tax Free dom Day fell on June 8.3
It is impor tant to note that TaxFree dom Day is not intended to
mea sure the ben e fits Cana di ansreceive from gov ern ments in returnfor their taxes. Rather, it looks at the price that is paid for a prod uct—gov ern ment. Tax Free dom Day isnot a reflec tion of the qual ity of theprod uct, how much of it each of usreceives, or whether we get ourmoney’s worth. These are ques tionsonly each of us can answer forour selves.
Cana di ans can cal cu late their per -sonal Tax Free dom Day using theFra ser Insti tute’s Per sonal Tax Free -dom Day Cal cu la tor atwww.fraserinstitute.org.
A later Tax Free dom Day
This year, Tax Free dom Day arrivestwo days later than in 2012, when it
Cana di ans Cel e brate Tax Free dom Day on June 10, 2013 3www.fraserinstitute.org
Table 2: Taxes of the Average Family (with two or more individuals), 2013, preliminary estimates ($ Cdn)
Cashincome
Incometax
Socialsecurity, pension, & health
taxes
Salestaxes
Property taxes
Profitstax
Liquor,tobacco, amuse-ment, &
otherexcisetaxes
Auto,fuel, &motorvehiclelicencetaxes
Othertaxes
Importduties
Naturalresource
levies
Totaltax bill
NL 79,265 9,956 6,062 6,014 1,763 3,703 2,433 1,092 1,302 221 4,633 37,180
PE 71,739 9,730 5,898 5,786 2,576 2,371 1,999 923 689 219 0 30,191
NS 82,701 12,509 6,646 6,941 2,736 3,238 2,349 1,071 400 266 48 36,205
NB 77,873 10,033 6,814 5,745 3,559 2,503 2,271 1,236 549 241 176 33,126
QC 84,498 11,513 9,967 7,301 3,108 2,942 1,990 1,057 481 273 38 38,671
ON 98,528 13,357 9,970 7,025 4,414 3,855 2,040 909 837 331 23 42,760
MB 91,152 12,909 7,366 6,706 3,085 2,957 2,784 1,011 1,646 285 101 38,851
SK 109,092 16,572 8,398 6,202 2,910 4,447 3,196 2,025 1,193 348 2,560 47,851
AB 133,409 21,126 9,387 3,142 3,548 4,463 3,406 1,003 1,818 420 2,059 50,373
BC 92,758 11,205 8,882 5,816 3,325 3,467 2,436 1,552 1,282 309 696 38,970
CDA 97,254 13,512 9,599 6,723 3,720 3,627 2,342 1,132 938 321 486 42,400
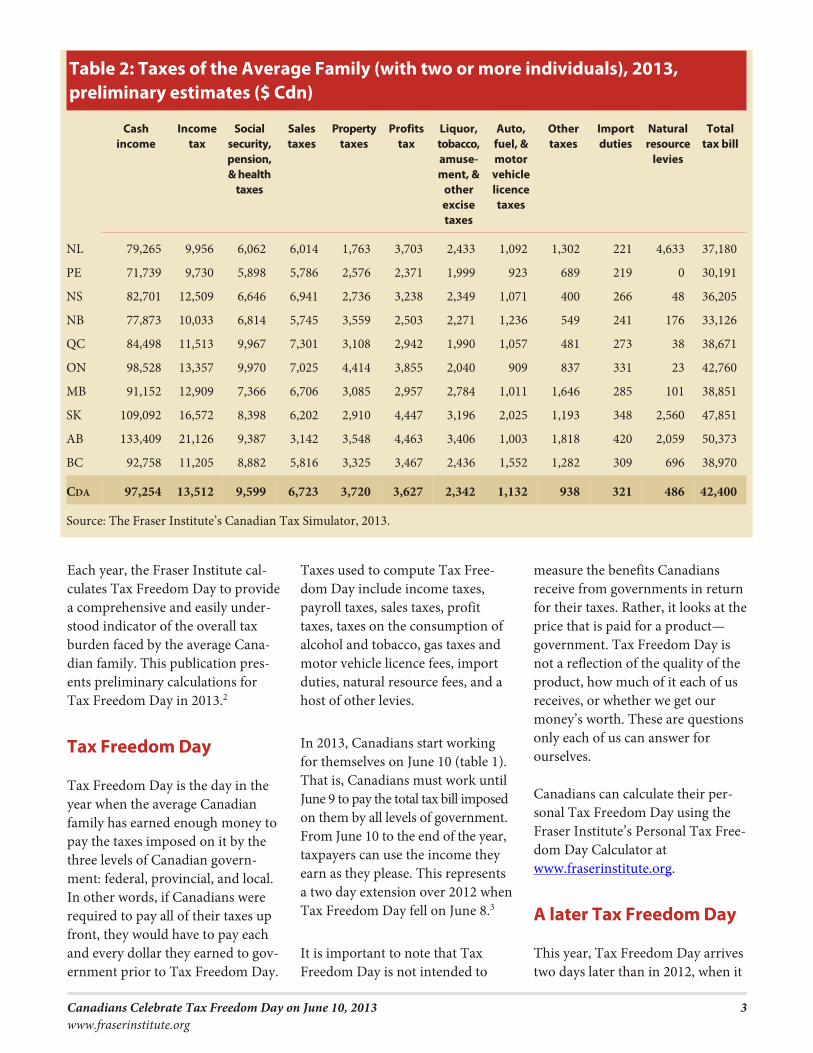
Source: The Fraser Institute’s Canadian Tax Simulator, 2013.

fell on June 8. The lat est Tax Free -dom Day in Cana dian his tory wasin 2000, when it fell on June 24, adate almost two months later than in1961 (May 3), the ear li est year forwhich the cal cu la tion has been made.
Tax Free dom Day decreased slightly from 2000 to 2005, from June 24 toJune 20. From 2005 to 2009, TaxFree dom Day for the aver age Cana -dian fam ily decreased fur ther—fromJune 20 in 2005, to June 2, in 2009.4
There are many rea sons for the rel a -tively large reduc tion in Tax Free -dom Day over this period. Prior tothe 2008/09 reces sion, many Cana -dian gov ern ments reduced taxes.For exam ple, the fed eral gov ern mentreduced the Goods and Ser vices Tax (GST) rate from 7 per cent to 6 per -cent in 2006 and to 5 per cent in
2008. In addi tion, the fed eral andmany pro vin cial gov ern mentsreformed their busi ness tax regimesby cut ting cor po rate income andcor po rate cap i tal taxes. More over,some prov inces, such as Brit ishColum bia and Man i toba, enactedper sonal income tax relief whileSas katch e wan reduced its pro vin cial sales tax.5
How ever, the decline in Tax Free -dom Day in both 2008 and 2009had lit tle to do with either the fed -eral or any pro vin cial gov ern ment’stax-reduc ing actions. Tax Free domDay is deter mined by the ratio oftotal taxes to income for aver ageCana dian fam i lies. When the econ -omy slows and incomes either stag -nate, or worse, decline, the taxbur den of those fam i lies tends todecrease to a greater extent. The
main rea son for this accel er ateddecrease in the tax bur den com -pared to income is the pro gres sivenature of the Cana dian tax sys tem.Progressivity means that as oneearns more income, they pay pro -por tion ately more in taxes. Thereverse is also true. It is this reversephe nom e non that drove some ofthe decrease in Tax Freedom Day in 2008 and 2009.
The Cana dian econ omy reboundedfrom the 2008/09 reces sion and Tax Free dom Day has come later eachyear start ing in 2010. As explainedabove, when the econ omy recov ersand incomes increase, a fam ily’s taxbur den tends to increase to agreater extent because of our pro -gres sive tax sys tem. House hold con -sump tion also increases, whichresults in an increase in the amount
Cana di ans Cel e brate Tax Free dom Day on June 10, 2013 4www.fraserinstitute.org
Table 3: Taxes of the Average Family (with two or more individuals), 2012, revised estimates ($ Cdn)
Cashincome
Incometax
Socialsecurity, pension, & health
taxes
Salestaxes
Propertytaxes
Profitstax
Liquor,tobacco, amuse-ment, &
otherexcisetaxes
Auto,fuel, &motorvehiclelicencetaxes
Othertaxes
Importduties
Naturalresource
levies
Totaltax bill
NL 76,293 9,345 5,761 5,546 1,397 4,651 2,312 1,059 1,216 219 4,965 36,470
PE 71,283 9,726 5,737 5,330 2,603 2,268 2,117 1,039 693 227 0 29,740
NS 80,531 11,865 6,203 6,713 2,757 3,197 2,325 1,051 388 267 44 34,809
NB 76,430 9,404 6,430 5,779 3,581 2,418 2,217 1,238 536 244 191 32,038
QC 82,696 11,229 9,530 7,111 3,006 2,772 1,920 983 473 276 31 37,331
ON 96,818 12,979 9,531 6,874 4,261 3,854 2,039 893 812 336 23 41,602
MB 89,326 12,553 6,986 6,114 3,014 2,946 2,718 1,016 1,582 289 84 37,302
SK 105,612 15,989 7,889 5,953 2,840 4,436 3,029 1,965 1,163 350 2,289 45,902
AB 127,623 19,988 8,825 3,040 3,420 4,436 3,403 986 1,735 421 2,055 48,309
BC 90,963 10,769 8,442 5,899 3,248 3,386 2,440 1,526 1,265 313 634 37,922
CDA 95,091 13,056 9,117 6,556 3,637 3,604 2,312 1,099 912 324 473 41,090
Source: The Fraser Institute’s Canadian Tax Simulator, 2013.
Cana di ans Cel e brate Tax Free dom Day on June 10, 2013 5www.fraserinstitute.org
Table 4: Difference in the Average Family’s Tax Bill between 2013 and 2012 ($ Cdn)
Cashincome
Incometax
Socialsecurity, pension,& health
taxes
Salestaxes
Propertytaxes
Profitstax
Liquor,tobacco,amuse-ment, &
otherexcisetaxes
Auto,fuel, &motorvehiclelicencetaxes
Othertaxes
Importduties
Naturalresource
levies
Totaltax bill
NL 2,971 611 301 468 366 (948) 122 33 87 2 (332) 709
PE 456 4 161 456 (27) 103 (118) (115) (4) (8) 0 451
NS 2,171 644 442 228 (21) 41 25 20 13 (1) 4 1,395
NB 1,443 629 384 (34) (22) 84 54 (1) 13 (3) (16) 1,088
QC 1,802 285 437 191 102 170 71 74 8 (3) 6 1,340
ON 1,710 378 438 151 153 0 1 16 25 (4) 0 1,158
MB 1,826 356 380 592 71 11 66 (5) 64 (4) 17 1,549
SK 3,480 582 509 250 69 11 168 60 31 (2) 270 1,948
AB 5,786 1,139 562 102 129 27 3 16 83 0 3 2,064
BC 1,795 436 440 (83) 77 82 (4) 25 17 (4) 62 1,048
CDA 2,163 455 483 167 83 23 29 33 26 (3) 14 1,311
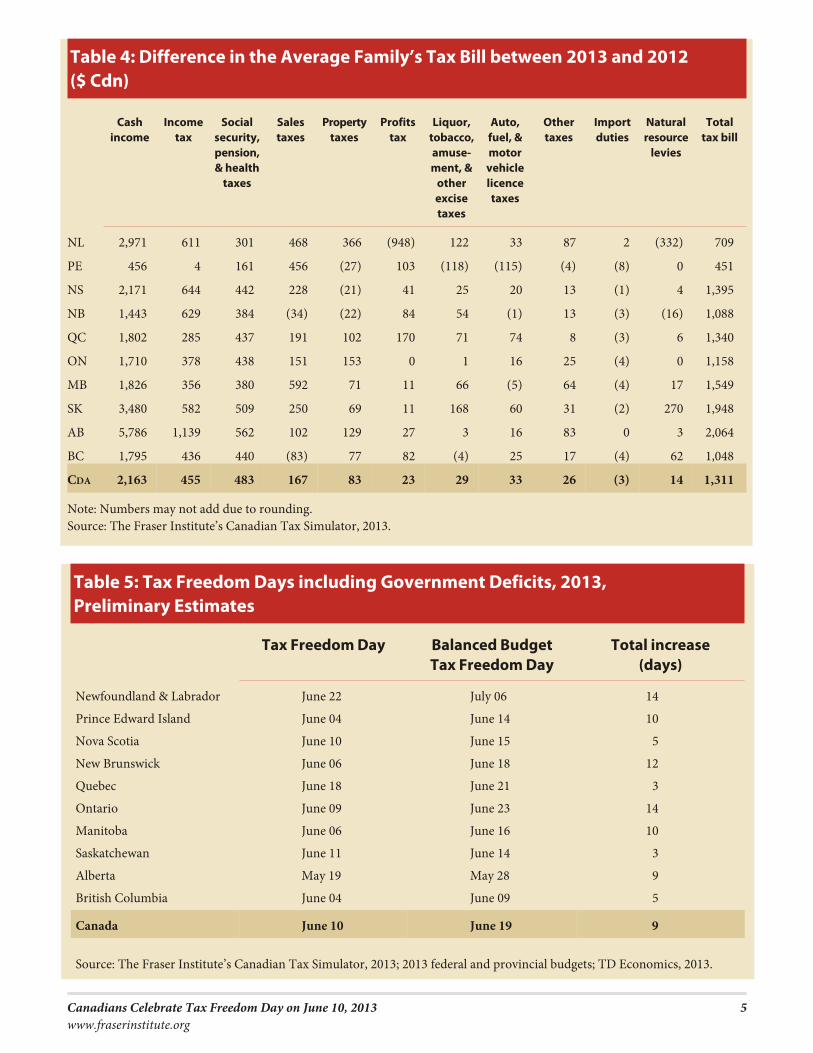
Note: Numbers may not add due to rounding.Source: The Fraser Institute’s Canadian Tax Simulator, 2013.
Table 5: Tax Freedom Days including Government Deficits, 2013, Preliminary Estimates
Tax Free dom Day Bal anced Bud getTax Free dom Day
Total increase(days)
Newfoundland & Labrador June 22 July 06 14
Prince Edward Island June 04 June 14 10
Nova Scotia June 10 June 15 5
New Brunswick June 06 June 18 12
Quebec June 18 June 21 3
Ontario June 09 June 23 14
Manitoba June 06 June 16 10
Saskatchewan June 11 June 14 3
Alberta May 19 May 28 9
British Columbia June 04 June 09 5
Canada June 10 June 19 9
Source: The Fraser Institute’s Canadian Tax Simulator, 2013; 2013 federal and provincial budgets; TD Economics, 2013.

of sales and other con sump tiontaxes that Cana dian fam i lies pay.Busi ness prof its also increase dur ing a recov ery, which increases theprofit taxes that are paid.
Tax Free dom Day also comes laterin 2013 because the fed eral gov ern -ment and some prov inces haveincreased taxes. For exam ple, thefed eral gov ern ment increasedEmploy ment Insur ance pre mi ums;Brit ish Colum bia increased itsmonthly Med i cal Ser vices Plan pre -mi ums (health tax), its gen eral cor -po rate income tax rate, and its
high est per sonal income tax rate;Sas katch e wan can celed a sched uleddecrease in the gen eral cor po rateincome tax rate; Man i tobaincreased its Pro vin cial Sales Tax(PST) rate and its finan cial cor po -rate cap i tal tax rate; Que bec alsoincreased its high est per sonalincome tax rate; New Bruns wickincreased its gen eral cor po rateincome tax rate and all four of itsper sonal income tax rates; PrinceEdward Island increased its smallbusi ness income tax rate; and sevenof ten prov inces (Brit ish Colum bia,Sas katch e wan, Man i toba, Que bec,
New Bruns wick, Nova Sco tia, andNew found land & Lab ra dor) increasedtaxes on tobacco prod ucts.
As is the case every year, Tax Free -dom Day cal cu la tions are based onfore casts of per sonal income andbud get fore casts of fed eral and pro -vin cial tax rev e nue. When final rev -e nue num bers become avail able atthe end of each fis cal year and per -sonal income data are updated bySta tis tics Can ada, we revise our TaxFree dom Day cal cu la tions for pre vi -ous years. If fed eral and pro vin cialrev e nue or per sonal income ends up
Cana di ans Cel e brate Tax Free dom Day on June 10, 2013 6www.fraserinstitute.org
Table 6: Average Income and Tax for Three Different Types of Family, 2013, preliminary estimates ($ Cdn)
1. Fam i lies and unat tached indi vid u als
NL PE NS NB QC ON MB SK AB BC CDA
Avg. Cash Income 63,397 60,787 63,815 64,630 63,548 79,256 73,490 82,977 105,573 71,659 76,214
Total Tax 27,547 25,623 26,866 26,402 28,088 34,453 30,286 35,248 39,820 30,122 32,283
Tax Rate 43.5% 42.2% 42.1% 40.9% 44.2% 43.5% 41.2% 42.5% 37.7% 42.0% 42.4%
Tax Rate (excluding Natural Resources)
37.9% 42.2% 42.0% 40.6% 44.2% 43.4% 41.1% 40.1% 36.1% 41.3% 41.8%
2. Fam i lies with two or more indi vid u als
NL PE NS NB QC ON MB SK AB BC CDA
Avg. Cash Income 79,265 71,739 82,701 77,873 84,498 98,528 91,152 109,092 133,409 92,758 97,254
Total Tax 37,180 30,191 36,205 33,126 38,671 42,760 38,851 47,851 50,373 38,970 42,400
Tax Rate 46.9% 42.1% 43.8% 42.5% 45.8% 43.4% 42.6% 43.9% 37.8% 42.0% 43.6%
Tax Rate (excluding Natural Resources)
41.1% 42.1% 43.7% 42.3% 45.7% 43.4% 42.5% 41.5% 36.2% 41.3% 43.1%
3. Fam i lies of four (par ents and two chil dren under 18)
NL PE NS NB QC ON MB SK AB BC CDA
Avg. Cash Income 103,498 77,801 91,428 100,226 97,872 114,858 100,432 124,041 151,588 108,532 113,247
Total Tax 49,118 29,666 39,598 42,508 43,692 46,072 40,313 48,866 53,839 42,810 46,493
Tax Rate 47.5% 38.1% 43.3% 42.4% 44.6% 40.1% 40.1% 39.4% 35.5% 39.4% 41.1%
Tax Rate (excluding Natural Resources)
40.6% 38.1% 43.2% 42.1% 44.6% 40.1% 40.0% 36.8% 33.8% 38.5% 40.5%
Source: The Fraser Institute’s Canadian Tax Simulator, 2013.

lower (or higher) than cur rentlypro jected, the 2013 Tax Free domDay will change when the pre lim i -nary esti mates are revised.6
Income and the aver agefam ily’s total tax bill
Table 2 dis plays the taxes and incomeof the aver age fam ily in Can ada andin each of the prov inces.7 In 2013,the aver age Cana dian fam ily (com -pris ing two or more indi vid u als)earned $97,254 in cash income andpaid a total of $42,400 in taxes.8 Inother words, the total tax bill of theaver age Cana dian fam ily in 2013amounted to 43.6 per cent of itsincome (table 8).
The cash income of the aver ageCana dian fam ily increased by 2.3
per cent ($2,163) between 2012 and2013 (table 4). This com pares to amuch larger increase in the total tax bill of 3.2 per cent ($1,311).
The larg est increase among the myr -iad taxes came in the form of socialsecu rity, pen sion, and health taxes—up $483 for the aver age Cana dianfam ily (table 4). Other notableincreases came in the form of income taxes ($455), sales taxes ($167), andprop erty taxes ($83). The only taxesthat decreased between 2012 and2013 for the aver age Cana dian fam -ily were import duties (table 4).
Tax Free dom Day by prov ince
Tax Free dom Day for each prov ince var ies accord ing to the extent of the
pro vin cially lev ied tax bur den (table 1). This year, the ear li est pro vin cialTax Free dom Day fell on May 19 inAlberta; the lat est in New found land& Lab ra dor on June 22.
Com pared to last year, Tax Free -dom Day comes later in 2013 forall but New found land & Lab ra dorand Alberta (table 1). This meansthat most Cana di ans are work ingmore for the gov ern ment and lessfor them selves and their fam i lies.The larg est advance in Tax Free -dom Day among the prov inces isin Man i toba, where Manitobansmust wait an addi tional four daysto cel e brate Tax Free dom Day.Almost 40 per cent of the $1,549increase in the total tax bill paid by the aver age Man i toba fam ily is dueto an increase in sales taxes, whichis partly driven by an increase to
Cana di ans Cel e brate Tax Free dom Day on June 10, 2013 7www.fraserinstitute.org
Table 7: Breakdown of the Average Family’s* Tax Bill by Level of Government,2013, Preliminary Estimate
Fed eralgov ern ment
Pro vin cialgov ern ment**
Localgov ern ment
Taxbill**
$ as a % oftotal
$ as a % oftotal
$ as a % oftotal
$
Newfoundland & Labrador 16,250 49.9% 14,500 44.6% 1,797 5.5% 32,547
Prince Edward Island 15,364 50.9% 13,848 45.9% 980 3.2% 30,191
Nova Scotia 18,653 51.6% 14,726 40.7% 2,777 7.7% 36,157
New Brunswick 17,263 52.4% 13,678 41.5% 2,010 6.1% 32,951
Quebec 17,912 46.4% 17,580 45.5% 3,141 8.1% 38,634
Ontario 23,586 55.2% 14,836 34.7% 4,315 10.1% 42,738
Manitoba 19,824 51.2% 15,875 41.0% 3,052 7.9% 38,750
Saskatchewan 24,973 55.1% 17,120 37.8% 3,198 7.1% 45,291
Alberta 31,175 64.5% 14,270 29.5% 2,870 5.9% 48,314
British Columbia 21,962 57.4% 14,079 36.8% 2,233 5.8% 38,275
Canada 22,507 53.7% 15,985 38.1% 3,421 8.2% 41,914
*The average family with two or more individuals.**Excludes natural resource levies.Source: The Fraser Institute’s Canadian Tax Simulator, 2013.
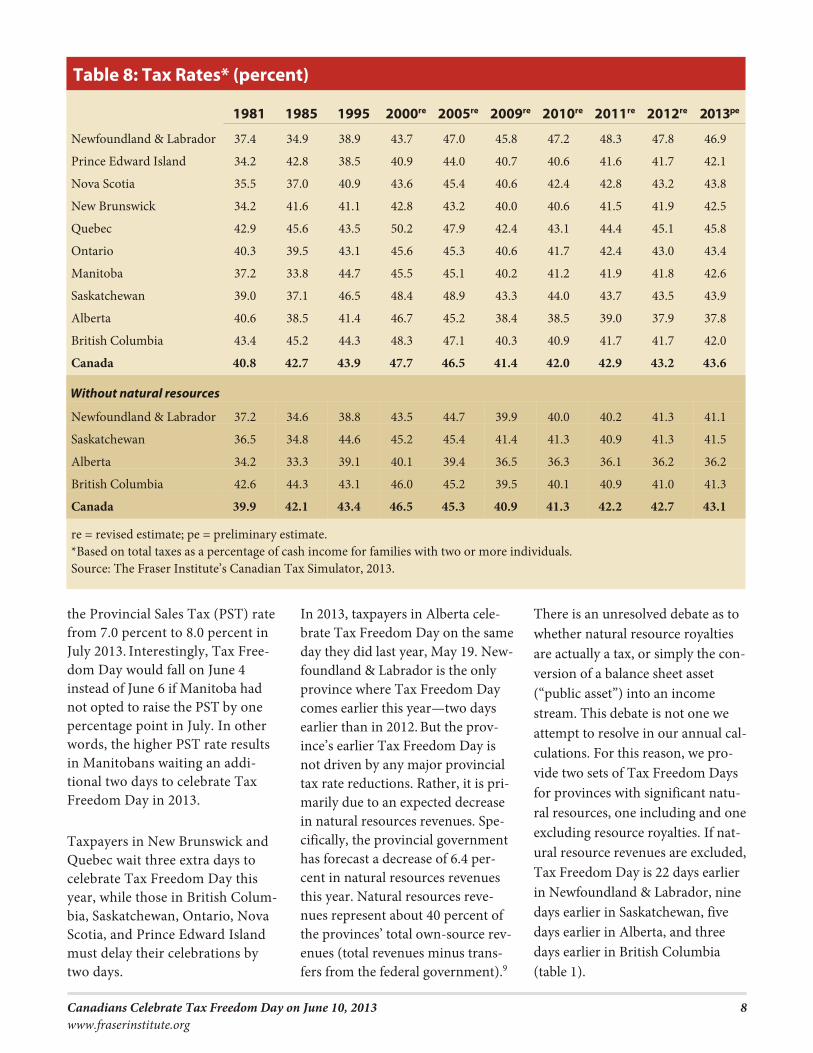
the Pro vin cial Sales Tax (PST) ratefrom 7.0 per cent to 8.0 per cent inJuly 2013. Inter est ingly, Tax Free -dom Day would fall on June 4instead of June 6 if Man i toba hadnot opted to raise the PST by oneper cent age point in July. In otherwords, the higher PST rate resultsin Manitobans wait ing an addi -tional two days to cel e brate TaxFree dom Day in 2013.
Tax pay ers in New Bruns wick andQue bec wait three extra days tocel e brate Tax Free dom Day thisyear, while those in Brit ish Colum -bia, Sas katch e wan, Ontario, NovaSco tia, and Prince Edward Islandmust delay their cel e bra tions bytwo days.
In 2013, tax pay ers in Alberta cel e -brate Tax Free dom Day on the same day they did last year, May 19. New -found land & Lab ra dor is the onlyprov ince where Tax Free dom Daycomes ear lier this year—two daysear lier than in 2012. But the prov -ince’s ear lier Tax Free dom Day isnot driven by any major pro vin cialtax rate reduc tions. Rather, it is pri -mar ily due to an expected decreasein nat u ral resources rev e nues. Spe -cif i cally, the pro vin cial gov ern menthas fore cast a decrease of 6.4 per -cent in nat u ral resources rev e nuesthis year. Nat u ral resources rev e -nues rep re sent about 40 per cent ofthe prov inces’ total own-source rev -e nues (total rev e nues minus trans -fers from the fed eral gov ern ment).9
There is an unre solved debate as towhether nat u ral resource roy al tiesare actu ally a tax, or sim ply the con -ver sion of a bal ance sheet asset(“pub lic asset”) into an incomestream. This debate is not one weattempt to resolve in our annual cal -cu la tions. For this rea son, we pro -vide two sets of Tax Free dom Daysfor prov inces with sig nif i cant nat u -ral resources, one includ ing and one exclud ing resource roy al ties. If nat -u ral resource rev e nues are excluded, Tax Free dom Day is 22 days ear lierin New found land & Lab ra dor, ninedays ear lier in Sas katch e wan, fivedays ear lier in Alberta, and threedays earlier in British Columbia(table 1).
Cana di ans Cel e brate Tax Free dom Day on June 10, 2013 8www.fraserinstitute.org
Table 8: Tax Rates* (percent)
1981 1985 1995 2000re 2005re 2009re 2010re 2011re 2012re 2013pe
Newfoundland & Labrador 37.4 34.9 38.9 43.7 47.0 45.8 47.2 48.3 47.8 46.9
Prince Edward Island 34.2 42.8 38.5 40.9 44.0 40.7 40.6 41.6 41.7 42.1
Nova Scotia 35.5 37.0 40.9 43.6 45.4 40.6 42.4 42.8 43.2 43.8
New Brunswick 34.2 41.6 41.1 42.8 43.2 40.0 40.6 41.5 41.9 42.5
Quebec 42.9 45.6 43.5 50.2 47.9 42.4 43.1 44.4 45.1 45.8
Ontario 40.3 39.5 43.1 45.6 45.3 40.6 41.7 42.4 43.0 43.4
Manitoba 37.2 33.8 44.7 45.5 45.1 40.2 41.2 41.9 41.8 42.6
Saskatchewan 39.0 37.1 46.5 48.4 48.9 43.3 44.0 43.7 43.5 43.9
Alberta 40.6 38.5 41.4 46.7 45.2 38.4 38.5 39.0 37.9 37.8
British Columbia 43.4 45.2 44.3 48.3 47.1 40.3 40.9 41.7 41.7 42.0
Canada 40.8 42.7 43.9 47.7 46.5 41.4 42.0 42.9 43.2 43.6
With out natural resources
Newfoundland & Labrador 37.2 34.6 38.8 43.5 44.7 39.9 40.0 40.2 41.3 41.1
Saskatchewan 36.5 34.8 44.6 45.2 45.4 41.4 41.3 40.9 41.3 41.5
Alberta 34.2 33.3 39.1 40.1 39.4 36.5 36.3 36.1 36.2 36.2
British Columbia 42.6 44.3 43.1 46.0 45.2 39.5 40.1 40.9 41.0 41.3
Canada 39.9 42.1 43.4 46.5 45.3 40.9 41.3 42.2 42.7 43.1
re = revised estimate; pe = preliminary estimate.*Based on total taxes as a percentage of cash income for families with two or more individuals.Source: The Fraser Institute’s Canadian Tax Simulator, 2013.

Bal anced Bud getTax Free dom Day
Cana di ans may be think ing aboutthe eco nomic and tax impli ca tionsof bud get def i cits since the fed eraland six pro vin cial gov ern ments(includ ing Alberta, Man i toba,Ontario, New Bruns wick, PrinceEdward Island, and New found land& Lab ra dor) are fore cast ing bud getdef i cits this year. Spe cif i cally, thefed eral gov ern ment bud geted for an $18.7 bil lion def i cit in 2013/14while the prov inces are cumu la -tively fore cast ing def i cits amount -ing to $15.3 bil lion.10
Of course, today’s def i cits mustone day be paid for by taxes. Def i -cits should there fore be con sid ered as deferred tax a tion. For this rea -son, we cal cu late a Bal anced Bud -get Tax Free dom Day, the day onwhich aver age Cana di ans wouldstart work ing for them selves if gov -ern ments were obliged to covercur rent expen di tures with cur renttax a tion.
Table 5 pres ents Bal anced Bud getTax Free dom Days for Can ada andthe prov inces. Bal anced Bud get TaxFree dom Day for Can ada arrives on June 19, which means that the aver -age Cana dian fam ily has to workuntil June 18 to pay its tax bill if,instead of financ ing expen di tureswith def i cits, Cana dian gov ern -ments had sim ply increased taxes to bal ance their bud gets. The Bal anced Bud get Tax Free dom Day arrives 9days later than Tax Free dom Day.Among the prov inces, the lat est Bal -anced Bud get Tax Free dom Dayfalls on July 6 in New found land &Lab ra dor. Of par tic u lar con cern isthe Bal anced Bud get Tax Free domDay in Can ada’s larg est prov ince,Ontario, which arrives on June 23— two weeks later than its Tax Free -dom Day.
Fair ness in the tax sys tem
In addi tion to the size of the aver age fam ily’s tax bill, there are con cernsabout the fair ness of the Cana diantax sys tem. The top 30 per cent ofincome earn ers pay 67.8 per cent of
all taxes and earn 60.0 per cent of allincome, while the bot tom 30 per -cent of all income earn ers pay 4.5per cent of all taxes and earn 9.2 per -cent of all income (table 9). Theover all dis tri bu tion shows that Can ada’s tax sys tem is effec tivelypro gres sive and extracts pro por -tion ately more money from thoseon the higher end of the incomescale.
Con clu sion
The Cana dian tax sys tem is com -plex and no sin gle num ber can giveus a com plete idea of who pays howmuch. That said, Tax Free dom Dayis the most com pre hen sive and eas -ily under stood indi ca tor of theover all tax bill of the aver age Cana -dian fam ily. In 2013, Cana di ans cel -e brate Tax Free dom Day on June10, two days later than in 2012.
Notes1 See Clem ens and Veldhuis (2003) for
a dis cus sion of who actu ally paysbusi ness taxes.
Cana di ans Cel e brate Tax Free dom Day on June 10, 2013 9www.fraserinstitute.org
Table 9: The Distribution of Cash Income and Tax Across Deciles*, and theAverage Tax Rate by Decile, 2013, preliminary estimate
Decile 1 2 3 4 5 6 7 8 9 10
Dis tri bu tion across dec iles
Tax 0.5% 1.3% 2.7% 4.2% 5.9% 7.8% 9.8% 12.3% 16.5% 38.9%
Income 1.6% 3.2% 4.4% 5.5% 6.8% 8.3% 10.1% 12.6% 16.0% 31.5%
Aver age tax rate
15.2% 18.4% 27.2% 33.9% 38.8% 42.3% 43.5% 44.1% 46.2% 55.5%
*Deciles group families from lowest to highest incomes with each group containing ten percent of all families. The firstdecile, for example, represents the ten percent of families with the lowest incomes.Note: Deciles may not sum to 100% due to rounding.Source: The Fraser Institute’s Canadian Tax Simulator, 2013.
Cana di ans Cel e brate Tax Free dom Day on June 10, 2013 10www.fraserinstitute.org
Meth od ol ogy—How the Fra ser Insti tute’s Cana dian Tax Sim u la tor Works
Tax Free dom Days are cal cu lated using the Fra serInsti tute’s Cana dian Tax Sim u la tor. The Cana dianTax Sim u la tor is a model we use to cal cu late all thetaxes paid to the three lev els of gov ern ment by aver -age fam i lies. The cal cu la tion has two parts. First, wecal cu late total cash income and then we esti matetotal taxes paid.
Cash income includes wages and sal a ries, self-employ -ment income (farm and non-farm), inter est, div i -dends, pri vate and gov ern ment pen sion pay ments, old age pen sion pay ments, and other trans fers from gov -ern ments (such as the Uni ver sal Child Care Ben e fit).The sources for this data are Sta tis tics Can ada (Pro -vin cial Eco nomic Accounts, National Accounts,Invest ment Income divi sion, farm income series) andthe Can ada Rev e nue Agency.
A broader def i ni tion of income is total income beforetaxes, which includes cash income plus fringe ben e fitsfrom employ ment, value of food from farm, invest -ment income from pen sion plans and insur ance com -pa nies, and cor po rate retained earn ings. How ever,cash income is the appro pri ate income mea sure tocon vey the size of the total tax bill imposed on Cana -dian fam i lies because total income before taxesincludes deferred incomes such as invest ment incomeaccu mu lated by pen sion plans, inter est accu mu latedon insur ance pol i cies, and cor po rate retained earn -ings. While these types of incomes are accu mu lated,they are not paid to Cana dian fam i lies in the cur rentyear, and thus should not be con sid ered as part oftheir income for Tax Free dom Day cal cu la tions.
The tax cal cu la tion con sists of add ing up the var i oustaxes that Cana dian fam i lies pay to the three lev els of
gov ern ment: fed eral, pro vin cial, and local. Theseinclude income taxes, prop erty taxes, sales taxes,profit taxes, health, social secu rity, and employ -ment taxes, import duties, licence fees, taxes on the con sump tion of alco hol and tobacco, nat u ralresource fees, fuel taxes, health taxes, and a host ofother lev ies. The tax data comes from Sta tis ticsCan ada (Sys tem of National Accounts, Gov ern -ment Finance) as well as fed eral and pro vin cialpub lic accounts and gov ern ment bud gets (for thelat est year of anal y sis).
Sta tis tics Can ada’s Social Pol icy Sim u la tion Data -base and Model, ver sion 20.0 (SPSD/M), is animpor tant part of the Cana dian Tax Sim u la tor; it is used to cal cu late Tax Free dom Days from 1997 to2013. SPSD/M helps allo cate fed eral taxes to theprov inces as well as cash income and tax shares toan aver age fam ily.
After the cur rent income and tax totals for eachfam ily type is deter mined, Tax Free dom Day iscalculated by divid ing total taxes paid in the cur -rent year by total cash income. The result is thencon verted to days of the year, start ing from Jan u -ary 1. That date on the cal en dar is then Tax Free -dom Day.
Dis claimer
The assump tions and cal cu la tions under ly ing theSPSD/M sim u la tion results were pre pared by TheFra ser Insti tute and the respon si bil ity for the useand inter pre ta tion of these data is entirely that ofthe authors.

2 As is the case every year, Tax Free -dom Day cal cu la tions are based onfore casts of per sonal income and fed -eral and pro vin cial bud get tax rev e -nue. When final rev e nue num bersbecome avail able at the end of eachfis cal year and per sonal income dataare updated by Sta tis tics Can ada, werevise our Tax Free dom Day cal cu la -tions for previous years.
3 In last year’s Tax Free dom Day pub -li ca tion (Palacios et al., 2012), ourpre lim i nary cal cu la tions esti mated aJune 11 Tax Free dom Day for 2012.This year we recal cu lated Tax Free -dom Day for 2012 using updatedpro vin cial and fed eral bud get num -bers and updated data from Sta tis ticsCan ada. Our revised cal cu la tionsshow that Tax Free dom Day in 2012actu ally fell on June 8 (table 1).
4 Between 2005 and 2009, Tax Free -dom Day fell on: June 19 (2006); June 12 (2007); and June 6 (2008) (TheFra ser Insti tute’s Cana dian Tax Sim -u la tor, 2013).
5 A com plete delin ea tion of taxchanges enacted before the reces sionis avail able in Treff and Perry andTreff and Ort, Finances of the Nation(var i ous issues).
6 As is explained in the meth od ol ogysec tion, Sta tis tics Can ada’s SocialPol icy Sim u la tion Data base andModel (SPSD/M) is an impor tantpart of the Fra ser Insti tute’s Cana -dian Tax Sim u la tor for cal cu lat ingTax Free dom Day from 1997 to 2013. Sta tis tics Can ada’s Sur vey of Labourand Income Dynam ics (SLID) is thehost data base for the SPSD/M. Thelat est ver sion of the SPSD/M (ver sion 20) is based on the 2008 Sur vey ofLabour and Income Dynam ics, anupdate of the 2007 sur vey used in thepre vi ous ver sion (ver sion 19). WhileThe Fra ser Insti tute’s meth od ol ogyhas not changed, the change in baseyear from 2007 to 2008 has led tochanges in his tor i cal Tax Free domDays in some prov inces. Of note, Tax Free dom Day for the aver age Albertafam ily has increased between one and four days, depend ing on the year.The rea son for this change can be
attrib uted partly to Alberta’s share oftotal cap i tal and labour income inCan ada. Spe cif i cally, the change inthe base year increased Alberta’s por -tion of total cap i tal and labourincome in Can ada. Pro vin cial sharesof cap i tal and labour income are used to dis trib ute var i ous fed eral taxes tothe prov inces. As a result, Albertareceived a slightly larger share of fed -eral tax rev e nue using the updatedSPSD/M.
His tor i cal changes to Tax Free domDay can also be attrib uted to dif fer -ences in invest ment income dataunder the two ver sions of SPSD/M.For instance, in Brit ish Colum bia,Man i toba, and Nova Sco tia, upperincome fam i lies earn a larger por tion
of invest ment income under the cur -rent ver sion of SPSD/M. Cap i talbased taxes such as profit taxes andprop erty taxes are dis trib uted to fam -i lies based on their share of totalinvest ment income. Given that thenew ver sion shows that upperincome fam i lies earned a greater por -tion of invest ment income than theydid in the pre vi ous ver sion for theseprov inces, a larger por tion of cap i talbased taxes are paid by upper income fam i lies. The end result is that TaxFree dom Day comes later in the yearfor upper income earn ers and ear lierin the year for aver age income earn -ers. In Prince Edward Island, theoppo site phe nom e non occurs.
In Can ada’s case, the his tor i cal
Cana di ans Cel e brate Tax Free dom Day on June 10, 2013 11www.fraserinstitute.org
About this publication
Fra ser Alerts are pub lished from time to time by the Fra ser In sti tute to pro vide, in a for mat eas ily ac ces si ble on line, short, timely stud ies of cur -rent is sues in eco nom ics and pub lic pol icy.
Our mission
Founded in 1974, the Fra ser In sti tute is an in de -pend ent Ca na dian pub lic pol icy re search anded u ca tional or ga ni za tion with of fices in Van -cou ver, Cal gary, To ronto, and Mon treal and ties to a global net work of 85 think-tanks. Its mis -sion is to mea sure, study, and com mu ni cate theim pact of com pet i tive mar kets and gov ern mentin ter ven tion on the wel fare of in di vid u als. Topro tect the In sti tute’s in de pend ence, it does notac cept grants from gov ern ments or con tractsfor re search.
All re search is sub ject to rig or ous re view byex ter nal ex perts, and is con ducted and pub -lished sep a rately from the In sti tute’s Board ofTrust ees and its do nors.
The opin ions expressed by staff or author(s)are those of the indi vid u als them selves, andshould not be inter preted to reflect those of theIn sti tute or other staff, its Board of Trust ees, orits donors and sup port ers.
Dis tri bu tion
These pub li ca tions are avail able fromwww.fraserinstitute.org in Por ta ble Doc u mentFor mat (PDF) and can be read with Adobe Ac -ro bat® or with Adobe Reader®, which is avail able free of charge from Adobe Sys tems Inc. Todown load Adobe Reader, go to this link:www.adobe.com/products/acrobat/
readstep.html with your browser. We en cour -age you to in stall the most re cent ver sion.
Copy right and ISSNCopy right © 2013 by the Fra ser In sti tute.All rights re served. No part of this pub li ca tionmay be re pro duced in any man ner what so everwith out writ ten per mis sion ex cept in the case of brief pas sages quoted in crit i cal ar ti cles andre views.ISSN 1714-6720Date of Issue: June 2013
Media inqui ries and informationFor me dia in qui ries, please con tact our Com mu ni ca tions de part ment by tele phone at604.714.4582 or e-mail com mu ni ca [email protected]
Our web site, www.fraserinstitute.org, con tainsmore in for ma tion on Fra ser In sti tute events,pub li ca tions, and staff.
Devel op ment
For in for ma tion about be com ing a Fra ser In sti tute sup porter, please con tact the De vel op ment De part ment via e-mail at de vel op ment@ fraserinstitute.org; or via tele phone: 1-800-665-3558, ext. 586
Editing, design, and production
Kristin McCahon

decreases in Tax Free dom Daysoccur for a vari ety of rea sons. One ofthem is the dif fer ence in invest mentincome explained above. Anotherrea son is that Sta tis tics Can adarecently under took a revi sion ofNational Accounts (NA) report ingfrom 1981. Although national num -bers are avail able from 1981 onwards, pro vin cial data are only avail ablefrom 2007. For this rea son, data usedfrom 1997 to 2006 are based on esti -mates using the cur rent nationaltotals. Revised data for the prov inceswill be avail able at the end of thisyear from Sta tis tics Can ada.
7 The aver age fam ily income dis playedthrough out the report is not the trueaver age of all fam i lies in a par tic u larjuris dic tion. Rather, the aver ageincome is deter mined by a sam ple offam i lies that excludes those withincomes that are either sig nif i cantlyabove or below the aver age. This isdone to adjust for out li ers.
8 For a def i ni tion and expla na tion ofcash income, see the meth od ol ogysec tion at the end of this pub li ca tion.
9 In addi tion, it is impor tant to notethat the aver age fam ily in New found -land & Lab ra dor expe ri ences amarked decrease of 20.4 per cent inprofit taxes in 2013 com pared to2012. The rea son is that the
pro vin cial gov ern ment has fore cast a50 per cent decrease in cor po rateincome tax rev e nues this year.
By con trast, the aver age fam ily inNew found land & Lab ra dor expe ri -ences a 26.2 per cent increase in prop -erty taxes in 2013 com pared to lastyear. Pos si ble rea sons include: (1) a3.7 per cent increase expected in localgov ern ment prop erty tax rev e nue in2013; (2) a 4.0 per cent increase ininvest ment income, which is used todis trib ute cap i tal based taxes such asprop erty taxes; and (3) fam i liesincluded in New found land & Lab ra -dor’s sam ple to cal cu late Tax Free -dom Day in 2013 earn a largerpor tion of invest ment income thanthose included in the 2012 cal cu la -tions (since prop erty taxes are dis -trib uted to fam i lies based on theirshare of total invest ment income,fam i lies pay a larger portion ofproperty taxes in 2013.)
10 The cumu la tive def i cit fig ure onlyincludes those prov inces with fore -casted def i cits for 2013/14.
Ref er encesClem ens, Jason, and Niels Veldhuis (2003).
Who pays busi ness taxes? A dif fer entview. Fra ser Forum (Octo ber).
Palacios, Milagros, Charles Lammam, andNiels Veldhuis (2012). Cana di ans Cel e -brate Tax Free dom Day on June 11,2012. Fra ser Alert (June). Fra ser Insti -tute. <http://www.fraserinstitute.org/uploadedFiles/fraser-ca/Content/research-news/research/publications/tax-freedom-day-2012.pdf>, as of May22, 2013.
TD Eco nom ics (2013). Gov ern ment Bud getBal ances and Net Debt, as of May 3,2013. TD Eco nom ics <http://www.td.com/document/PDF/economics/budgets/gov_budget_20130503.pdf, asof May 22, 2013.
Treff, Karin and Deborah Ort (var i ousdates). Finances of the Nation (var i ousissues). Cana dian Tax Foun da tion.<http://www.ctf.ca/ctfweb/EN/CTF_Publications/Books/Finances_of_the_Nation/EN/Publications/Finances_of_the_Nation.aspx?hkey=0638cad2-e583-4e10-8ab2-0805350b3500>, as of May22, 2013.
Treff, Karin and David B. Perry (var i ousdates). Finances of the Nation (var i ousissues). Cana dian Tax Foun da tion.<http://www.ctf.ca/ctfweb/EN/CTF_Publications/Books/Finances_of_the_Nation/EN/Publications/Finances_of_the_Nation.aspx?hkey=0638cad2-e583-4e10-8ab2-0805350b3500>, as of May22, 2013.
Cana di ans Cel e brate Tax Free dom Day on June 10, 2013 12www.fraserinstitute.org