
Canadian Wildlife Service - arlis.org · Richard Lanctot, David Lank, Elizabeth Mallory, Brian...
67
Transcript of Canadian Wildlife Service - arlis.org · Richard Lanctot, David Lank, Elizabeth Mallory, Brian...


Canadian Wildlife ServiceOccasional Papers
Occasional Papers report the peer-reviewedresults of original research carried out bymembers of the Canadian Wildlife Service orsupported by the Canadian Wildlife Service.
Editorial Board
C.D. AnkneyUniversity of Western Ontario
David CairnsFisheries and Oceans Canada
Fred CookeSimon Fraser University
A.W. DiamondUniversity of New Brunswick
Charles J. HennyU.S. Geological Survey
Raymond McNeillUniversité de Montréal
Ross J. NorstromCanadian Wildlife Service
David PeakallKing’s College LondonUniversity of London
Austin ReedCanadian Wildlife Service
Harold WelchNorthwater Consultants
Managing Editors
Hugh BoydCanadian Wildlife Service
Erica H. DunnCanadian Wildlife Service
Patricia LoganCanadian Wildlife Service
The Canadian Wildlife Service
The Canadian Wildlife Service of Envi-ronment Canada handles wildlife matters that arethe responsibility of the Canadian government.These include protection and management ofmigratory birds as well as nationally significantwildlife habitat. Other responsibilities are endan-gered species, control of international trade inendangered species, and research on wildlifeissues of national importance. The service coop-erates with the provinces, territories, ParksCanada, and other federal agencies in wildliferesearch and management.
For more information about the CanadianWildlife Service or its other publications, pleasecontact:
PublicationsCanadian Wildlife ServiceEnvironment CanadaOttawa, Ontario K1A 0H3(819) 997-1095(819) 997-2756 (fax)[email protected]://www.cws-scf.ec.gc.ca
R.I.G. Morrison1
R.E. Gill, Jr.2
B.A. Harrington3
S. Skagen4
G.W. Page5
C.L. Gratto-Trevor6
S.M. Haig7
Estimates of shorebirdpopulations in North America
Occasional PaperNumber 104Canadian Wildlife Service
1 National Wildlife Research Centre, Canadian WildlifeService, Environment Canada, 100 Gamelin Boulevard,Hull, Quebec, Canada K1A 0H3.
2 U.S. Geological Survey, Alaska Biological ScienceCenter, 1011 East Tudor Road, Anchorage, Alaska 99503,U.S.A.
3 Manomet Observatory for Conservation Sciences, P.O.Box 1770, Manomet, Massachusetts 02345, U.S.A.
4 U.S. Geological Survey, Midcontinent Ecological ScienceCenter, Fort Collins, Colorado 80525-3400, U.S.A.
5 Point Reyes Bird Observatory, 4990 Shoreline Highway,Stinson Beach, California 94970, U.S.A.
6 Prairie and Northern Wildlife Research Centre, CanadianWildlife Service, Environment Canada, 115 PerimeterRoad, Saskatoon, Saskatchewan, Canada S7N 0X4.
7 U.S. Geological Survey, Forest and Rangeland EcosystemScience Center, 3200 SW Jefferson Way, Corvallis,Oregon 97331, U.S.A.
A member of the Environmental Conservation family

Cover photo: Sanderling on nest (R.I.G. Morrison)
Published by Authority of theMinister of EnvironmentCanadian Wildlife Service
©Minister of Public Works andGovernment Services Canada, 2001
Catalogue No. CW69-1/104EISBN 0-662-29614-1ISSN 0576-6370
Canadian Cataloguing in Publication Data
Main entry under title:
Estimates of shorebird populations in North America
(Occasional paper, ISSN 0576-6370; no. 104)Includes bibliographical references.ISBN 0-662-29614-1Cat. no. CW69-1/104E
1. Shore birds — Geographical distribution — North America.I. Morrison, R.I.G.II. Canadian Wildlife Service.III. Series: Occasional paper (Canadian Wildlife Service); no. 104.
QL681.E87 2000 598.3'3 C00-980461-7
2 2001-01
Abstract
Estimates are presented for the population sizes of 53 species of Nearctic shorebirds occurring regularlyin North America, plus four species that breed occasionally. Population estimates range from a few tens toseveral millions. Overall, population estimates most commonly fall in the range of hundreds of thousands, par-ticularly the low hundreds of thousands; estimated population sizes for large shorebird species currently all fallbelow 500 000. Population size is inversely related to size (mass) of the species, with a statistically significantnegative regression between log(population size) and log(mass). Two outlying groups are evident on the regres-sion graph: one, with populations lower than predicted, includes species considered to be either “at risk” or par-ticularly hard to count, and a second, with populations higher than predicted, includes two species that arehunted. Shorebird population sizes were derived from data obtained by a variety of methods from breeding,migration, and wintering areas, and formal assessments of accuracy of counts or estimates are rarely available.Accurate estimates exist only for a few species that have been the subject of detailed investigation, and thelikely accuracy of most estimates is considered poor or low. Population estimates are an integral part of conser-vation plans being developed for shorebirds in the United States and Canada and may be used to identify areasof key international and regional importance.
Résumé
Des estimations sont présentées pour les tailles des populations de 53 espèces d’oiseaux de rivagenéarctiques que l’on trouve régulièrement en Amérique du Nord, en plus de quatre espèces qui s’y reproduisentparfois. Les estimations des populations varient de quelques dizaines à plusieurs millions. Globalement, lesestimations des populations se situent généralement dans les centaines de milliers, notamment les quelquescentaines de milliers; les tailles estimées des populations pour les espèces de gros oiseaux de rivage se situentactuellement toutes sous les 500 000 individus. La taille de la population est en relation inverse au poids(masse) de l’espèce, comportant une régression négative statistiquement significative entre l’inscription (taillede la population) et l’inscription (masse). Deux groupes éloignés sont évidents dans le graphique de régression :le premier, comportant de plus faibles populations que prévues, comprend des espèces considérées soit « enpéril » ou particulièrement difficiles à dénombrer, et le second, comportant des populations plus abondantesque prévues, comprend deux espèces qui sont chassées. Les tailles des populations des oiseaux de rivage ont étécalculées à partir des données obtenues par une gamme de méthodes provenant des aires de nidification, demigration et d’hivernage; les évaluations officielles de l’exactitude des dénombrements ou des estimations sontrarement disponibles. Des estimations exactes existent seulement pour quelques espèces qui ont fait l’objet derelevés détaillés, et l’exactitude probable de la plupart des estimations est considérée faible ou basse. Les esti-mations des populations sont une partie intégrante des plans de conservation en voie d’élaboration pour lesoiseaux de rivage aux États-Unis et au Canada et elles peuvent servir à cerner les régions d’importanceprimaire internationale et régionale.
3
R.I.G. Morrison; R.E. Gill, Jr.; B.A. Harrington; S. Skagen; G.W. Page; C.L. Gratto-Trevor; S.M. Haig.2001. Estimates of shorebird populations in North America. Occasional Paper No. 104, Canadian WildlifeService, Ottawa, Ontario. 64 pp.

Acknowledgements
We thank the many people who have contributed to counting and monitoring shorebird popula-tions in the Americas through various survey activities referred to in this report. We thank thefollowing colleagues for their expert input and information on particular species or techniques: BradAndres, Keith Arnold, Yves Aubrey, Jon Bart, Mary Anne Bishop, Mark Colwell, Peter Connors,John Cooper, Chris Elphick, Peter Hicklin, Richard Holmes, Joe Jehl, Fritz Knopf, David Krementz,Richard Lanctot, David Lank, Elizabeth Mallory, Brian McCaffery, William Moskoff, Erica Nol, LewOring, Denis Paulson, Roly Redmond, Ken Rosenberg, Margaret Rubega, Peter Sanzenbacher, DougSchamel, Lee Tibbitts, and Nils Warnock. A special thanks goes to Lew Oring for his critical assess-ments of the merits of different methods of determining population numbers. We thank John Sauer forproviding data from the Breeding Bird Survey (BBS) for use in estimating shorebird numbers onNorth American breeding grounds, and Ken Rosenberg for input regarding BBS estimates. A specialthanks goes to Doug Watkins for information on shorebird populations in Australasia. We thank RobButler and Fred Cooke for critical comments on the manuscript. A special thanks is extended toStephen Brown for encouraging us to grapple with the process of attempting to know the unknowable.
This publication was produced by the Scientific and Technical Documents Division of theCanadian Wildlife Service. The following people were responsible: Pat Logan — coordination andsupervision; Sylvie Larose — layout; Marla Sheffer (Contract Editor) — scientific editing; and MarkHickson — printing.
4
Contents
1. Introduction 7
2. Methods 9Data sources 9Data compilation 11Use of maximum counts 11Seasonal considerations 12Assessing the accuracy of population estimates 12Data presentation 13
3. Species accounts 14Black-bellied Plover Pluvialis squatarola 14American Golden-Plover Pluvialis dominicus 15Pacific Golden-Plover Pluvialis fulva 15Snowy Plover Charadrius alexandrinus 16Wilson’s Plover Charadrius wilsonia 16Common Ringed Plover Charadrius hiaticula 17Semipalmated Plover Charadrius semipalmatus 17Piping Plover Charadrius melodus 18Killdeer Charadrius vociferus 19Mountain Plover Charadrius montanus 19American Oystercatcher Haematopus palliatus 20Black Oystercatcher Haematopus bachmani 21Black-necked Stilt Himantopus mexicanus mexicanus 21Hawaiian Stilt Himantopus mexicanus knudseni 22American Avocet Recurvirostra americana 22Greater Yellowlegs Tringa melanoleuca 23Lesser Yellowlegs Tringa flavipes 23Solitary Sandpiper Tringa solitaria 24Willet Catoptrophorus semipalmatus 24Wandering Tattler Heteroscelus incanus 25Spotted Sandpiper Actitis macularia 25Upland Sandpiper Bartramia longicauda 26Eskimo Curlew Numenius borealis 27Whimbrel Numenius phaeopus 27Bristle-thighed Curlew Numenius tahitiensis 28Long-billed Curlew Numenius americana 29Hudsonian Godwit Limosa haemastica 29Bar-tailed Godwit Limosa lapponica 30
5
Marbled Godwit Limosa fedoa 30Ruddy Turnstone Arenaria interpres 31Black Turnstone Arenaria melanocephala 32Surfbird Aphriza virgata 32Red Knot Calidris canutus 33Sanderling Calidris alba 34Semipalmated Sandpiper Calidris pusilla 35Western Sandpiper Calidris mauri 35Least Sandpiper Calidris minutilla 36White-rumped Sandpiper Calidris fuscicollis 36Baird’s Sandpiper Calidris bairdii 37Pectoral Sandpiper Calidris melanotos 37Sharp-tailed Sandpiper Calidris acuminata 38Purple Sandpiper Calidris maritima 38Rock Sandpiper Calidris ptilocnemis 38Dunlin Calidris alpina 39Stilt Sandpiper Calidris himantopus 40Buff-breasted Sandpiper Tryngites subruficollis 40Short-billed Dowitcher Limnodromus griseus 41Long-billed Dowitcher Limnodromus scolopaceus 42Common Snipe Gallinago gallinago 42American Woodcock Scolopax minor 43Wilson’s Phalarope Phalaropus tricolor 43Red-necked Phalarope Phalaropus lobatus 44Red Phalarope Phalaropus fulicaria 44Additional species 45
4. Results, overview, and discussion 46
5. Literature cited 55
List of tablesTable 1. Sizes, ranges, and likely accuracy of North Americanshorebird population estimates 47
Table 2. Distribution of estimated population sizes of 53 speciesof shorebirds occurring in North America 48
Table 3. Summary of highest seasonal counts or estimatesfor 53 species of shorebirds in North America 52
List of figuresFigure 1. Relationship between log(population size) and log(mass [g]) forshorebirds occurring in North America (a) for all 53 species occurring regularlyin North America (includes Canada, United States, including Hawaii, andMexico), and (b) for 41 selected species (excluding outlying groups consideredto contain species with artificially low [“at risk,” difficult to count] or high[hunted] populations 49
6

1. Introduction
Knowledge of the number of animals in a population not only is of intrinsic biological interest,but, for shorebirds and other waterbirds, has also assumed considerable practical application in con-servation planning and action. Population estimates have been used, for instance, in assessing theimportance of sites and habitats for protection and for setting targets for the recovery of endangeredspecies or for the maintenance of populations at desired levels. Two major tools used for the conser-vation of wetlands and waterbird populations in the Western Hemisphere use criteria involving per-centages of flyway populations of waterbirds using the site to determine its potential importance;these are the Ramsar Convention on Wetlands of International Importance, especially as WaterfowlHabitat (Ramsar Convention), and the Western Hemisphere Shorebird Reserve Network (WHSRN)(Morrison et al. 1995; Frazier 1996; Rose and Scott 1997; MCCS 1999). For Ramsar sites, an area canbe identified as a wetland of international importance if it regularly supports 1% of a species or sub-species of waterfowl, and this criterion has been widely used in identifying wetlands for conservationand protection (Frazier 1996; Rose and Scott 1997). For WHSRN, three levels of importance havebeen recognized for site designation, depending on whether it supports more than 5% (Regional), 15%(International), or 30% (Hemispheric) of a flyway population of shorebirds (Morrison et al. 1995;MCCS 1999). In addition, similar criteria have been adopted by the Important Bird Areas (IBA)program of BirdLife International, launched in Canada in 1996 in partnership with the CanadianNature Federation and Bird Studies Canada (IBA 1998). Application of these criteria clearly requiresa knowledge of the population sizes of the species being considered.
For endangered species, knowledge of population size is necessary to assess the status of thespecies as well as to provide a criterion or target against which the success of management effortsmay be measured (e.g., for Piping Plover [for scientific names of species, refer to Table 1]; Goosen etal. 1997). Target population levels were adopted for waterfowl to measure the success of conservationinitiatives undertaken through the North American Waterfowl Management Plan. Shorebird Conserva-tion Plans being developed in Canada and the United States also require knowledge of shorebird pop-ulation levels and trends to assess their success. Knowledge of population size and status is alsoneeded to support a variety of other conservation efforts, including maintaining global diversity underthe Convention on Biological Diversity, signed by many nations in Rio de Janeiro in 1992, protocolssuch as the Agreement on the Conservation of African-Eurasian Migratory Waterbirds under the BonnConvention, and the East Asian Australasian Shorebird Reserve Network.
On a practical level, the estimation of population sizes of shorebirds is fraught with many diffi-culties. Many Nearctic species migrate from breeding grounds in the North American Arctic andsub-Arctic, where they are found dispersed at low densities over vast areas, through migration areas,where they may occur in large but highly variable numbers, to wintering areas, some of which occurin remote areas as far south as Tierra del Fuego at the southern tip of South America (Morrison 1984;Morrison and Ross 1989). Attempting to count or otherwise determine the numbers of birds occurringat any one of these stages brings with it a different set of problems relating to logistics, methodology,adequacy of geographic coverage, accuracy and biases of estimates obtained, and the life history char-acteristics of the species being studied.
7

These difficulties apply to assessing shorebird numbers for flyways in most parts of the world(see flyway review papers in Davidson and Pienkowski [1987]), and it is only within the past 20 yearsthat enough information has been obtained to allow the question of shorebird population sizes to beaddressed. In Europe, many shorebirds using the East Atlantic Flyway winter in or pass through areasnear human populations, and a combination of internationally coordinated ground counts by networksof observers in Europe and by expeditions to more remote areas in west Africa enabled estimates ofnumbers occurring on this flyway to be assembled by Smit and Piersma (1989).
In the Western Hemisphere, although anecdotal accounts of large numbers of shorebirds atvarious places in their migration ranges have been known for many years (see accounts in Bent [1927,1929]), coordinated information over wide geographical areas started to become available only afterthe mid-1970s, when observer networks were set up in Canada and the United States to countshorebirds during migration periods (Morrison 1983). Initial efforts were mainly in eastern Canadaand the United States, and data from these programs (the Maritimes Shorebird Survey [MSS] andInternational Shorebird Survey [ISS], respectively) have been used to identify potential WHSRN sitesin Canada (Morrison et al. 1995) and the United States (Harrington and Perry 1995), as well as toassess shorebird population trends (Howe et al. 1989; Morrison et al. 1994b). Extensive compilationsof data are now also available from the interior of the United States and Canada (the Interior Flyway:Skagen et al. 1999), as well as for western and Pacific areas of the United States and Canada (thePacific Flyway: Page et al. 1992; Page and Gill 1994), including Alaska (Gill et al. 1999; R.E. Gill,unpubl. data). Aerial surveys have been used to cover large and/or remote areas, such as James Bay(Morrison and Harrington 1979), Hudson Bay (Morrison and Harrington 1979), and Delaware Bay(Clark et al. 1993); they have been especially useful on the wintering grounds, where “Atlas” projectshave covered large geographical areas, including South America (Morrison and Ross 1989), Panama(Morrison et al. 1998), and Mexico (Morrison et al. 1992, 1993, 1994c).
Page and Gill (1994) reviewed information on shorebird populations in western North America,and some preliminary estimates for numbers occurring in Canada were presented by Morrison et al.(1994a), although in many cases these represented a best “guesstimate” or an assignment to the mostlikely order of magnitude. The present report attempts to bring together as much information aspossible from breeding, migration, and wintering areas to update our current knowledge of the size ofWestern Hemisphere shorebird populations; this has led to considerable modification of the estimatesfor many species. The report covers 57 species of shorebirds occurring in Canada and the UnitedStates, including Hawaii, 47 of which are considered to occur regularly and/or to be “at risk” inCanada (Morrison et al. 1994a, and unpubl. data).
8

2. Methods
Data sources
The data used in assembling population estimates have been taken mostly from major regionalcompilations, with some additions from other published and unpublished material, as described belowand in the species accounts. Material from publications on individual sites within the major regionshas also been examined and used to adjust totals from regional compilations where appropriate,although this literature review has not been exhaustive. Much of the data has been compiled on aregional or geographical basis into broadly defined flyways. On an individual species basis, a flywaymay be considered as the migration route(s) and areas used by a shorebird population in movingbetween its breeding and wintering grounds (Davidson and Pienkowski 1987), and in a more generalsense as a distinguishable pattern of migration routes used by a group of related species (Piersma etal. 1987). In North America, three major shorebird flyways are considered to exist: (1) the PacificFlyway, involving routes along the Pacific coast of North America (Mexico, the United States,including Alaska, and Canada) and associated western areas, including the Central Valley of Califor-nia; (2) the Interior Flyway, involving all interior parts of the continent (this would include theCentral Flyway and the Mississippi Flyway used in waterfowl terminology; Lincoln 1952); and (3) theEastern Flyway, involving routes passing up and down the Atlantic coast of the United States andCanada and involving interior areas in the eastern part of the continent between the Atlantic coast andapproximately James Bay.
Principal data sources are as follows:
• Canada: Data from the MSS, which covers the Atlantic provinces of Canada (NovaScotia, New Brunswick, Prince Edward Island, and Newfoundland), were analyzed toextract the maximum count of each species at each site covered during fall and springsurveys for the years 1974–1991. Maximum counts were summed to produce a regionaltotal for each species. Data compiled in Morrison et al. (1995) to document potentialWHSRN sites in Canada were used for other parts of Canada. Additional informationcame from aerial and ground surveys carried out by the Canadian Wildlife Service(CWS) in James Bay and Hudson Bay and along the St. Lawrence River estuary(Morrison and Harrington 1979; Brousseau 1981; Maisonneuve 1982; Maisonneuve et al.1990).
• United States: Data from the ISS for the years 1971–1998 were analyzed in a mannersimilar to that described above for the MSS data to produce totals for Pacific (Utah,Nevada, Arizona, California, Idaho, Washington, and Oregon), interior (Minnesota, Iowa,Missouri, North Dakota, South Dakota, Nebraska, Kansas, Montana, Wyoming,Colorado, Oklahoma, Arkansas, Texas, Louisiana, and New Mexico), and eastern(Maine, New Hampshire, Vermont, Massachusetts, Rhode Island, Connecticut, NewYork, Pennsylvania, New Jersey, Maryland, Delaware, Michigan, Ohio, West Virginia,Virginia, North Carolina, South Carolina, Wisconsin, Illinois, Indiana, Kentucky,Tennessee, Mississippi, Alabama, Georgia, and Florida) regions of the United States for
9

both spring and fall migration periods. In addition, maximum count totals were extractedfor the same regions from data compiled by Harrington and Perry (1995) to documentpotential WHSRN sites in the United States. Regional compilations of data produced byHarrington and Page (1992), covering areas in the three above regions, including sites inCanada, were also consulted. Clark et al. (1993) provided multiyear aerial survey datafrom Delaware Bay.
For the Interior Flyway, the major compilation of data by Skagen et al. (1999), coveringsites in the central United States and Canada, provided the most extensive summary ofcounts from this region currently available.
For the Pacific Flyway, Page et al. (1992) provided a summary of counts from the westcoast and western interior wetlands, including the United States, Baja California, andparts of Canada. Page and Gill (1994) reviewed population estimates for some speciesoccurring in western North America. For the present analysis, updated populationestimates have been compiled (G.W. Page, unpubl. data) for “western North America”(see also Page et al. 1999), comprising the ISS “Pacific” states plus New Mexico andincluding Baja California. In some cases, counts by Skagen et al. (1999) included countsfrom these states; these counts were subtracted from Interior Flyway totals where overlapoccurred to eliminate duplication. Where totals for wintering populations in “westernNorth America” were used, counts in Mexico (see below) were adjusted so that therewould not be duplication of Baja California counts.
• Canadian Arctic: Although estimates of breeding shorebird densities have been made fora fairly large number of sites in the Arctic, estimates of populations occurring over widergeographical regions are less common. The current Arctic estimates have been derivedfrom early exploratory avifaunal surveys, environmental impact assessment surveys, and,more recently, extrapolations based on remote sensing studies; this material has beenreviewed in Morrison (1997).
• Alaska: Data were compiled from information on potential WHSRN sites in Alaska (Gillet al. 1999), as well as other literature sources (e.g., Islieb and Kessel 1973; Islieb 1979;Gill and Handel 1990; Gill and McCaffery 1999) mentioned in the species accounts.
• Mexico: Data from the CWS “Atlas” project provided information on wintering numbersof shorebirds on both coasts of Mexico (Morrison et al. 1992, 1993, 1994c). Several otherstudies have provided comparative data, especially from the Pacific northwest and BajaCalifornia regions of Mexico (Harrington 1993a,b, 1994; Page and Palacios 1993; Page etal. 1997; Engilis et al. 1998).
• Central America and the Caribbean: Apart from Panama, where CWS “Atlas” and otheraerial surveys (Morrison et al. 1998; Watts et al. 1998) have provided information on keymigration and wintering areas, few quantitative data are available, although wetlandinventories of the area have been carried out (Scott and Carbonell 1986).
• South America: CWS “Atlas” surveys of wintering populations provide extensivecoverage of key coastal sites in South America (Morrison and Ross 1989), whereasadditional material is provided for interior and coastal areas in the extensive wetlandinventory conducted by Scott and Carbonell (1986) and in a summary updatingdistributional information by Blanco and Canevari (1998).
• Population estimates using Breeding Bird Survey (BBS) data: Although the mostcommon use of BBS data is for assessing population trends, it is theoretically possible tomake an estimate of breeding population numbers from BBS data for those shorebirdspecies whose ranges occur in areas covered by the BBS. BBS routes involve coverage ofa known area (each route consists of 50 stops, each stop covering a nonoverlapping areaof radius 0.4 km [one quarter mile]) in a known landscape type or physiographic stratum.
10

The mean density of the species in each physiographic stratum may be derived from theroutes occurring in that stratum, and a population estimate for the stratum may beobtained based on the total area of the stratum. Summing the numbers occurring in all thestrata produces an overall population estimate. There are many potential sources of biasand error using this approach, however, and it is probably useful for only a few, if any,shorebird species. Population estimates for shorebird species covered by the BBS havebeen included in the text for comparative purposes, but they are not generally used wherethey are clearly divergent from estimates obtained by other methods.
Data compilation
The procedure used in assembling the numbers presented in the species accounts below is asfollows. First, data were tabulated separately for each species and for each of the following “seasons”:breeding, northward migration, southward migration, and wintering. Data were then compiled formajor regions (e.g., Mexico, Pacific Flyway, Interior Flyway, Eastern Flyway [United States andCanada], Alaska, etc.), and maximum count totals were extracted for each species for that region.Data from publications on specific sites within a region were in some cases compared with the totalsfor those sites in regional summary publications and substituted for those totals if larger, although thistype of comparison has not been exhaustive. Counts for Alaska were in some cases considered sepa-rately, where it was judged that birds counted at migration sites in Alaska would also have beencounted in another geographical region within the same season; in such cases, the larger regional totalwas used in assessing overall population size. Overall totals were then produced for all regions for agiven season, and the largest seasonal total was taken to indicate at least a minimum likely populationfor that species. How these seasonal totals are used to assess an estimated overall population size isdiscussed in each species account.
In general, we have attempted to be conservative in our assessment of population sizes. Wherecounts derived from observable numbers of birds differ considerably from those obtained usingextrapolations, we have usually adopted the smaller estimate, particularly in cases where the speciesmay be considered “at risk” and where the extrapolation was obtained from BBS data. More quantita-tive approaches from Arctic breeding areas, where extrapolations have been based on surveys andassociated remote sensing data that provide an estimate of areas of suitable habitat, may provideuseful perspectives on population numbers and are discussed in the species accounts as appropriate.
Use of maximum counts
Maximum counts were chosen as the most practicable number for use in estimating overall pop-ulations. The maximum count provides at least a minimum estimate of the number of birds occurringin an area: total numbers will clearly be larger, as there is considerable turnover (which varies indifferent geographical regions) as birds move through a site, and often adults and juveniles movethrough a site at different times during southward migration. On the other hand, maximum counts maybe unrepresentative — for instance, in cases where an exceptionally large number of birds may befound in a site for a brief period following unusual weather events (Morrison et al. 1994b). Movementof birds between sites gives rise to the possibility that they may be counted multiple times. Thissource of error is most likely to arise during migration periods, as most populations are thought to berelatively stable or sedentary during breeding and wintering seasons. It is also difficult to assess, as itis likely to vary with the species being counted and the region being considered. For instance,Western Sandpipers are liable to use a number of Pacific coast stopover areas during northwardmigration in a manner dependent on weather conditions (Iverson et al. 1996; Warnock and Bishop1998), whereas studies in other areas have shown that some species are highly site-faithful from yearto year and probably do not move a great deal on a regional scale within a single season.
11
It is also unlikely that all sites used by shorebirds will be covered during survey operations.Where aerial surveys have been used to determine shorebird numbers over large areas, as in the CWS“Atlas” projects (see above), flights will provide only a single “snapshot” of the birds present, andnumbers are usually underestimated for a variety of reasons, including counting errors, weather andtidal conditions (in coastal areas), and areas not covered during the flights. Overall, these consider-ations indicate that nearly all estimates of numbers derived from either ground or aerial counts arelikely to be underestimates.
Seasonal considerations
In addition to the phenological considerations mentioned above, there are a number of otherfactors relating to shorebird biology that are liable to influence counts obtained during differentperiods of the year. Estimates based on numbers of nesting pairs on the breeding grounds clearly donot include nonbreeding segments of the population, including subadult and other birds that mayspend the summer south of the breeding grounds and birds that have reached the breeding areas but donot nest. During the southward migration, numbers are likely to be at their highest, as both adults andjuveniles hatched that summer will be present, resulting in a population that could be perhaps doublethat at the beginning of the nesting season. Mortality during the fall migration and subsequent winterwill lead to lower numbers during the following northward migration. These considerations may notnecessarily be reflected in counts obtained in the field; for instance, counts will be higher for a speciesthat is highly concentrated during spring migration and relatively easily counted than for one that ismore highly dispersed in space and time during the fall migration. These points serve to emphasizethe difficulties faced in assessing population numbers at different times of the year.
Assessing the accuracy of population estimates
The accuracies of estimates obtained for different species are likely to vary considerably, as themethods used range from dedicated counts directed at a particular species (e.g., Piping Plover) tocases where almost no information is available and the estimate is essentially an educated guess. Wehave attempted to rate the accuracy of the estimate for each species to give some indication of thereliability of the number presented. In almost no cases were data available to present a statisticallybased estimate of the standard deviation or error of the estimate, and the ranges shown are intended toillustrate the likely range of uncertainty. Accuracy scores were assigned as follows:
• 1 (Poor): A population estimate based on an educated guess. Score 1 was also given toEskimo Curlew, which has not been reliably seen in recent years.
• 2 (Low): A population estimate based on broad-scale surveys where estimated populationsize is likely to be in the right order of magnitude.
• 3 (Moderate): A population estimate based on a special survey or on broad-scale surveysof a narrowly distributed species whose populations tend to concentrate to a high degreeeither in a restricted habitat or at a small number of favoured sites. Estimate thought to bewithin 50% of the true number.
• 4 (Good): A calculated estimate based on broad-scale mark:recapture ratios or othersystematic estimating effort resulting in estimates on which confidence limits can beplaced.
• 5 (High): Number obtained from a dedicated census effort and thought to be accurate andprecise. Sometimes an indication of the probable percentage accuracy is given, or at leasta minimum population figure derived from the data.
12
Data presentation
Data for each species are summarized in a table at the top of the species account, and for allspecies together in Table 1. Estimates are given for the global population, if available, taken mainlyfrom Rose and Scott (1997) and adjusted if necessary because of revisions made to Western Hemi-sphere population estimates. Numbers are also provided for Neotropical (South America, CentralAmerica, and Caribbean), North American (includes Canada, United States [including Alaska andHawaii], and Mexico), and Canadian populations. These are often the same, but they may differ incases where, for example, Canadian or Alaskan breeding grounds support populations that migrate toareas outside the Western Hemisphere (Europe, Australasia, etc.), so that Canadian/North Americanpopulations are larger than Neotropical ones; or where portions of breeding ranges occur south ofCanada, so that the Canadian population will be smaller than the North American(/Neotropical) one.The numbers represent individuals (all ages). Numbers for a given region include birds if they arelikely to occur in the region at any stage of their life cycle; for example, birds breeding in Alaska andwintering in the Western Hemisphere are likely to pass through Canada on migration, so they areincluded in the Canadian total. Neotropical population size will be the same as the North Americanone where a species entirely breeds within or passes through North America on migration and wintersentirely in the Neotropics; it may be larger where the species also breeds within the Neotropicalregion. Where a population winters in both North America and the Neotropics and the proportionoccurring in both areas is not known, the Neotropical population estimate is generally left blank.These numbers are all the most likely population estimate based on combinations of the data currentlyavailable.
In contrast, the flyway totals (Pacific, Interior, Eastern) are based on the largest currentlyobserved combination of maximum counts that has been recorded in each of those flyways, wheneverthose counts have occurred (i.e., during northward or southward migration, breeding, or wintering);they are not likely, therefore, to approach overall totals, as more comprehensive data may be availablein other regions at other times of the year (e.g., on breeding or wintering areas) for the species.
In addition, information is presented on the percentage of the breeding range that is thought tooccur in Canada (E. Dunn, pers. commun.), as well as breeding status in Canada and abundance statusin Canada (Morrison et al. 1994a, and unpubl. data).
13
3. Species accounts
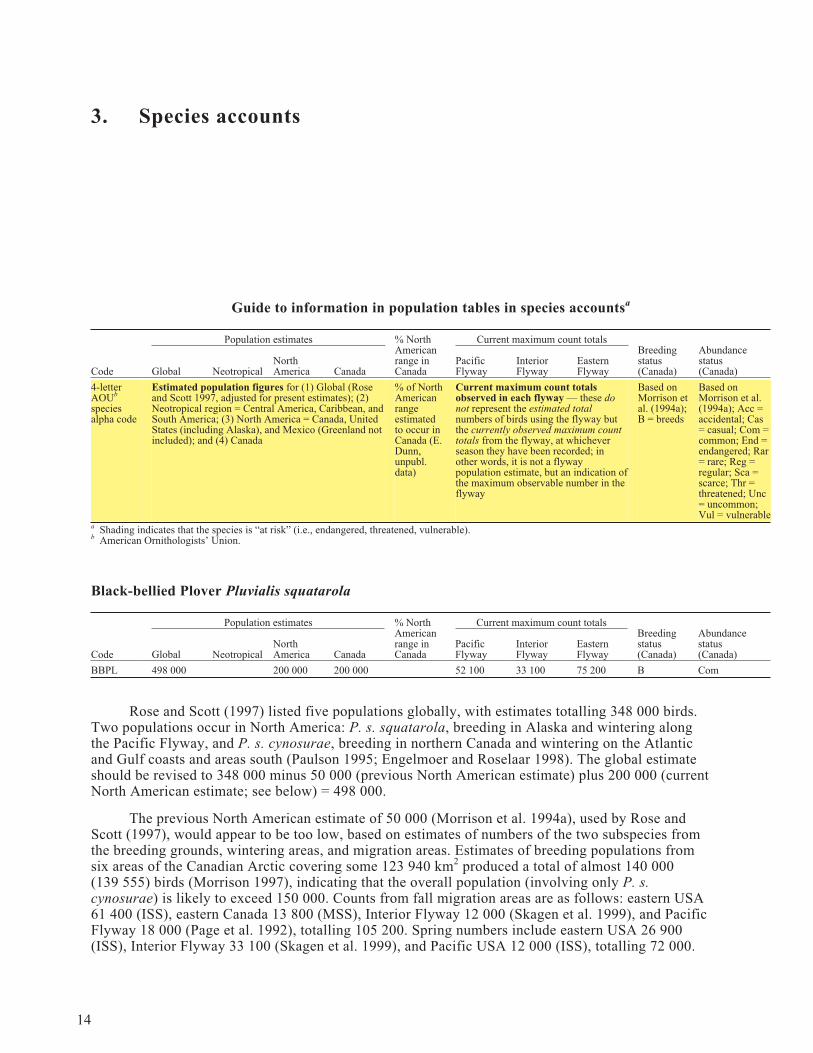
Guide to information in population tables in species accountsa
Population estimates % NorthAmericanrange inCanada
Current maximum count totalsBreedingstatus(Canada)
Abundancestatus(Canada)Code Global Neotropical
NorthAmerica Canada
PacificFlyway
InteriorFlyway
EasternFlyway
4-letterAOUb
speciesalpha code
Estimated population figures for (1) Global (Roseand Scott 1997, adjusted for present estimates); (2)Neotropical region = Central America, Caribbean, andSouth America; (3) North America = Canada, UnitedStates (including Alaska), and Mexico (Greenland notincluded); and (4) Canada
% of NorthAmericanrangeestimatedto occur inCanada (E.Dunn,unpubl.data)
Current maximum count totalsobserved in each flyway — these donot represent the estimated totalnumbers of birds using the flyway butthe currently observed maximum counttotals from the flyway, at whicheverseason they have been recorded; inother words, it is not a flywaypopulation estimate, but an indication ofthe maximum observable number in theflyway
Based onMorrison etal. (1994a);B = breeds
Based onMorrison et al.(1994a); Acc =accidental; Cas= casual; Com =common; End =endangered; Rar= rare; Reg =regular; Sca =scarce; Thr =threatened; Unc= uncommon;Vul = vulnerable
a Shading indicates that the species is “at risk” (i.e., endangered, threatened, vulnerable).b American Ornithologists’ Union.
Black-bellied Plover Pluvialis squatarola
Population estimates % NorthAmericanrange inCanada
Current maximum count totalsBreedingstatus(Canada)
Abundancestatus(Canada)Code Global Neotropical
NorthAmerica Canada
PacificFlyway
InteriorFlyway
EasternFlyway
BBPL 498 000 200 000 200 000 52 100 33 100 75 200 B Com
Rose and Scott (1997) listed five populations globally, with estimates totalling 348 000 birds.Two populations occur in North America: P. s. squatarola, breeding in Alaska and wintering alongthe Pacific Flyway, and P. s. cynosurae, breeding in northern Canada and wintering on the Atlanticand Gulf coasts and areas south (Paulson 1995; Engelmoer and Roselaar 1998). The global estimateshould be revised to 348 000 minus 50 000 (previous North American estimate) plus 200 000 (currentNorth American estimate; see below) = 498 000.
The previous North American estimate of 50 000 (Morrison et al. 1994a), used by Rose andScott (1997), would appear to be too low, based on estimates of numbers of the two subspecies fromthe breeding grounds, wintering areas, and migration areas. Estimates of breeding populations fromsix areas of the Canadian Arctic covering some 123 940 km2 produced a total of almost 140 000(139 555) birds (Morrison 1997), indicating that the overall population (involving only P. s.cynosurae) is likely to exceed 150 000. Counts from fall migration areas are as follows: eastern USA61 400 (ISS), eastern Canada 13 800 (MSS), Interior Flyway 12 000 (Skagen et al. 1999), and PacificFlyway 18 000 (Page et al. 1992), totalling 105 200. Spring numbers include eastern USA 26 900(ISS), Interior Flyway 33 100 (Skagen et al. 1999), and Pacific USA 12 000 (ISS), totalling 72 000.
14

Winter counts from various areas include British Columbia 1440 (Butler 1992), Pacific coast USAand Baja California 45 000 (G.W. Page, unpubl. data), central USA 5000 (Harrington and Page 1992),eastern USA/Canada 3700 (Harrington and Page 1992), Mexico (excluding Baja California) 4600(Morrison et al. 1992, 1993, 1994c), Panama 400 (Morrison et al. 1998), and South America 27 300(Morrison and Ross 1989), totalling 87 440. Winter counts of birds on the Pacific side only of theAmericas (contained in the counts just listed) include British Columbia 1440, Pacific coast USA andBaja California 45 000, remainder of Pacific coast of Mexico outside of Baja California 2741, andPacific coast South America 2873, totalling 52 054; this suggests that the population of P. s.squatarola is around 50 000. The Canadian/North American wintering population recorded onChristmas Bird Counts in 1992 was 32 300 (Paulson 1995). In summary, current population estimatesare 150 000 for P. s. cynosurae and 50 000 for P. s. squatarola.
American Golden-Plover Pluvialis dominicus
Population estimates % NorthAmericanrange inCanada
Current maximum count totalsBreedingstatus(Canada)
Abundancestatus(Canada)Code Global Neotropical
NorthAmerica Canada
PacificFlyway
InteriorFlyway
EasternFlyway
AGPL 150 000+ 150 000+ 150 000+ 150 000+ 78.2 77 900 31 200 15 000 B Com
The initial estimate of <50 000 (Morrison et al. 1994a) would appear to be too low, based oninformation from breeding and migration areas. Numbers estimated in six areas of the CanadianArctic covering some 96 060 km2 totalled nearly 65 000 birds (Morrison 1997), whereas a further68 900 were estimated to breed in the area of the Northeast Alaska Lagoons (Gill et al. 1999).Estimated numbers from the breeding grounds thus currently total 133 900, suggesting that the entirepopulation would likely exceed 150 000. At migration areas, the largest numbers have been recordedduring fall migration: eastern USA 2800 (ISS), eastern Canada 1700 (MSS), Interior Flyway 14 800(Skagen et al. 1999), Pacific USA 100 (ISS), and Alaska 77 800 (Gill et al. 1999), totalling 97 200.Spring counts include eastern North America 15 000 (Harrington and Page 1992), Interior Flyway31 200 (Skagen et al. 1999), and Pacific USA 14 (ISS), for a total of 46 210. Large numbers passthrough Iowa and eastern Nebraska in spring (S. Dinsmore, pers. commun.). Counts from winteringareas in South America are lower and include 4055 from coastal areas (Morrison and Ross 1989) and2100 from other wetlands (Scott and Carbonell 1986), totalling 6155; up to 5000 have been observedat the Lagoa do Peixe in southern Brazil on ground surveys (R.I.G. Morrison, unpubl. data). Manyshorebird surveys do not cover upland areas used by the species very well, so it is difficult to assessthe significance of migration and wintering count totals.
Pacific Golden-Plover Pluvialis fulva
Population estimates % NorthAmericanrange inCanada
Current maximum count totalsBreedingstatus(Canada)
Abundancestatus(Canada)Code Global Neotropical
NorthAmerica Canada
PacificFlyway
InteriorFlyway
EasternFlyway
PGPL 125 000 16 000 Rar
The population of the Pacific Golden-Plover, which is thought to be rare in Canada, has beenreported to be at least 90 000 (Watkins 1993; Johnson and Connors 1996). Recent revisions include anestimate of 100 000 for the nonbreeding population occurring in eastern and southeastern Asia andAustralia and 25 000 for the population wintering in southwestern and southern Asia and easternAfrica (D. Watkins, pers. commun.), indicating that the global population for the species is at least125 000. Fall counts from three sites in Alaska total 15 900 (Gill et al. 1999). The Alaskan breeding
15
grounds are situated along the coastline of the Bering Sea in western Alaska and occupy a fairly smallproportion of the entire species’ range, which extends eastwards along much of the northern coast ofRussia (Hayman et al. 1986; AOU 1998); the North American population estimate is therefore tenta-tively given as 16 000, based on the counts from Alaska.
Snowy Plover Charadrius alexandrinus
Population estimates % NorthAmericanrange inCanada
Current maximum count totalsBreedingstatus(Canada)
Abundancestatus(Canada)Code Global Neotropical
NorthAmerica Canada
PacificFlyway
InteriorFlyway
EasternFlyway
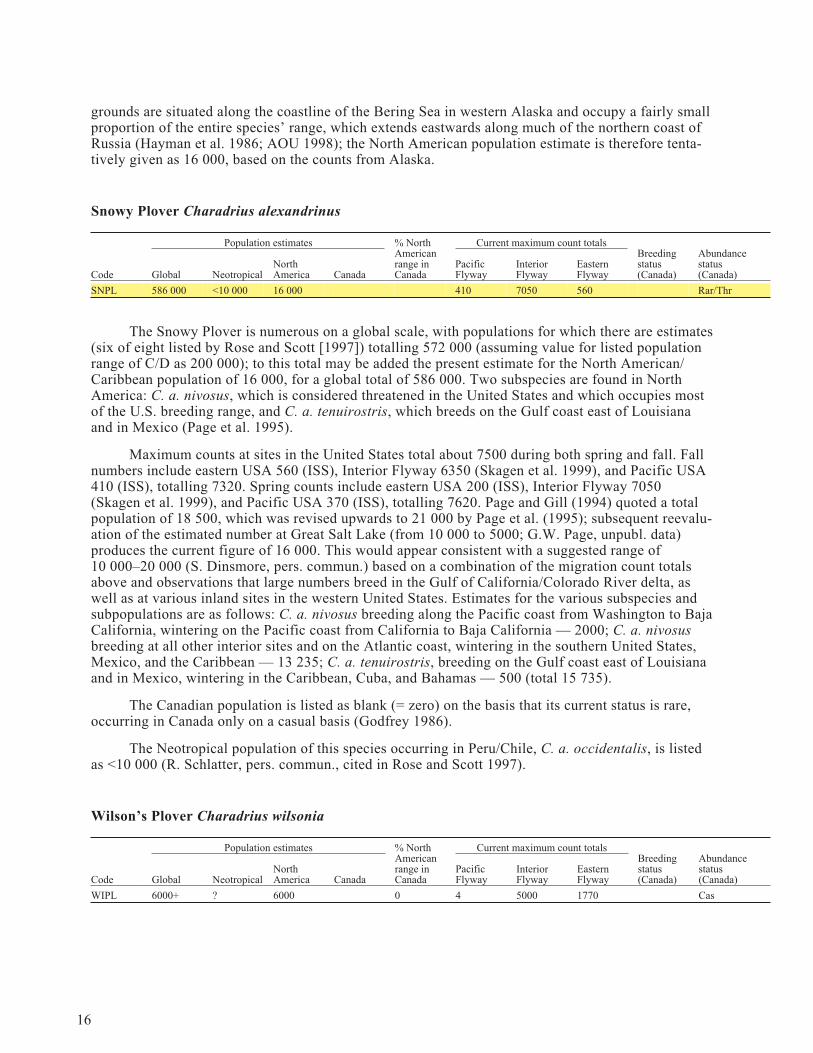
SNPL 586 000 <10 000 16 000 410 7050 560 Rar/Thr
The Snowy Plover is numerous on a global scale, with populations for which there are estimates(six of eight listed by Rose and Scott [1997]) totalling 572 000 (assuming value for listed populationrange of C/D as 200 000); to this total may be added the present estimate for the North American/Caribbean population of 16 000, for a global total of 586 000. Two subspecies are found in NorthAmerica: C. a. nivosus, which is considered threatened in the United States and which occupies mostof the U.S. breeding range, and C. a. tenuirostris, which breeds on the Gulf coast east of Louisianaand in Mexico (Page et al. 1995).
Maximum counts at sites in the United States total about 7500 during both spring and fall. Fallnumbers include eastern USA 560 (ISS), Interior Flyway 6350 (Skagen et al. 1999), and Pacific USA410 (ISS), totalling 7320. Spring counts include eastern USA 200 (ISS), Interior Flyway 7050(Skagen et al. 1999), and Pacific USA 370 (ISS), totalling 7620. Page and Gill (1994) quoted a totalpopulation of 18 500, which was revised upwards to 21 000 by Page et al. (1995); subsequent reevalu-ation of the estimated number at Great Salt Lake (from 10 000 to 5000; G.W. Page, unpubl. data)produces the current figure of 16 000. This would appear consistent with a suggested range of10 000–20 000 (S. Dinsmore, pers. commun.) based on a combination of the migration count totalsabove and observations that large numbers breed in the Gulf of California/Colorado River delta, aswell as at various inland sites in the western United States. Estimates for the various subspecies andsubpopulations are as follows: C. a. nivosus breeding along the Pacific coast from Washington to BajaCalifornia, wintering on the Pacific coast from California to Baja California — 2000; C. a. nivosusbreeding at all other interior sites and on the Atlantic coast, wintering in the southern United States,Mexico, and the Caribbean — 13 235; C. a. tenuirostris, breeding on the Gulf coast east of Louisianaand in Mexico, wintering in the Caribbean, Cuba, and Bahamas — 500 (total 15 735).
The Canadian population is listed as blank (= zero) on the basis that its current status is rare,occurring in Canada only on a casual basis (Godfrey 1986).
The Neotropical population of this species occurring in Peru/Chile, C. a. occidentalis, is listedas <10 000 (R. Schlatter, pers. commun., cited in Rose and Scott 1997).
Wilson’s Plover Charadrius wilsonia
Population estimates % NorthAmericanrange inCanada
Current maximum count totalsBreedingstatus(Canada)
Abundancestatus(Canada)Code Global Neotropical
NorthAmerica Canada
PacificFlyway
InteriorFlyway
EasternFlyway
WIPL 6000+ ? 6000 0 4 5000 1770 Cas
16
Rose and Scott (1997) listed four populations of Wilson’s Plover globally, two of which occurin North America (C. w. wilsonia in the eastern United States and Gulf of Mexico and C. w. beldingiin Mexico, Central America, and northwestern South America); no population estimates wereprovided. The species is of only casual occurrence in Canada (Godfrey 1986; Morrison et al. 1994a).
The North American population would appear to be around 6000, based on counts at migrationand wintering areas. The largest counts during migration occur during the spring: eastern USA 821(ISS), Interior Flyway 5000 (in Texas; Harrington and Page 1992), and Pacific USA 1 (ISS), totalling5822. Fall counts include eastern USA 1770 (ISS), Interior Flyway 1051 (Skagen et al. 1999), andPacific USA 4 (ISS), totalling 2825. Winter counts in Texas (5000) and Florida (175) total 5175 (Har-rington and Page 1992). Less information is available for areas farther south, and counts tend to belower: Page et al. (1997) reported counts totalling 170 in Baja California (an earlier estimateinvolving extrapolation of aerial counts indicated up to 800 in this region; Page and Palacios 1993),Engilis et al. (1998) found 55 in Ensenada Pabellones and Bahia Santa Maria, Sinaloa, in Pacificnorthwest Mexico (extrapolated total estimated as 91), and only one (in Colombia) was specificallymentioned in wetlands listed in Scott and Carbonell (1986) in Central and South America. Thesenumbers suggest a tentative total of approximately 6000 (range 5000–6000).
Common Ringed Plover Charadrius hiaticula
Population estimates % NorthAmericanrange inCanada
Current maximum count totalsBreedingstatus(Canada)
Abundancestatus(Canada)Code Global Neotropical
NorthAmerica Canada
PacificFlyway
InteriorFlyway
EasternFlyway
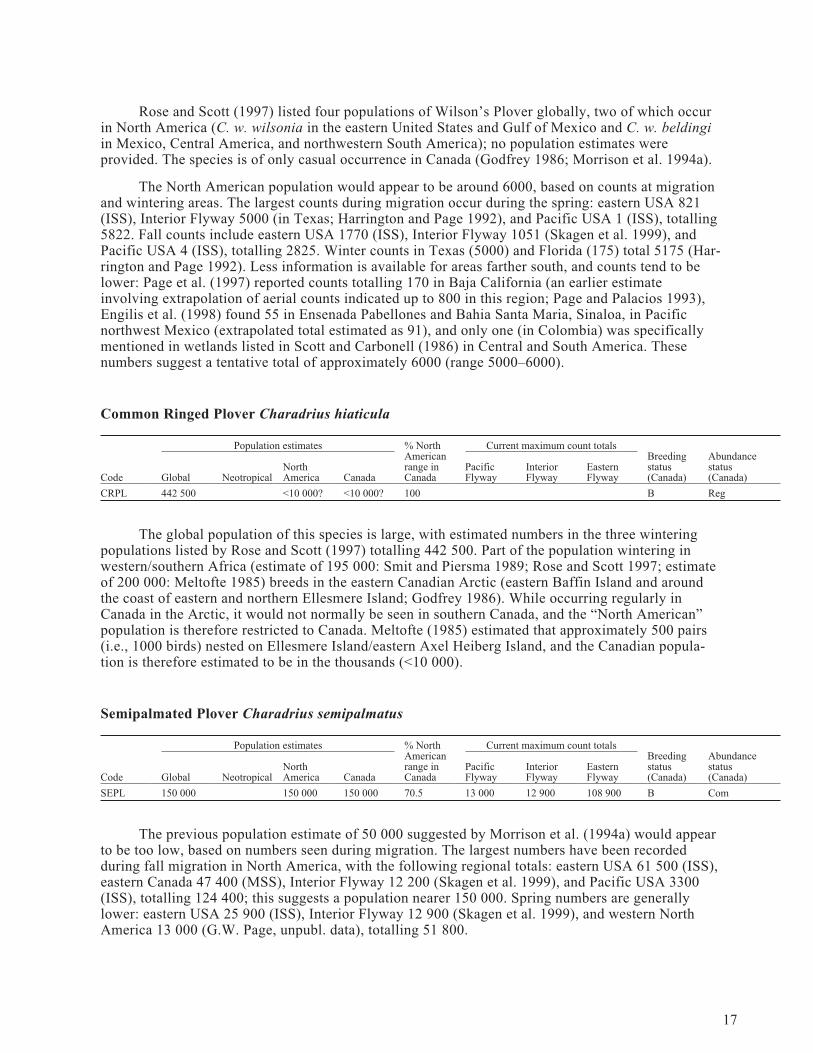
CRPL 442 500 <10 000? <10 000? 100 B Reg
The global population of this species is large, with estimated numbers in the three winteringpopulations listed by Rose and Scott (1997) totalling 442 500. Part of the population wintering inwestern/southern Africa (estimate of 195 000: Smit and Piersma 1989; Rose and Scott 1997; estimateof 200 000: Meltofte 1985) breeds in the eastern Canadian Arctic (eastern Baffin Island and aroundthe coast of eastern and northern Ellesmere Island; Godfrey 1986). While occurring regularly inCanada in the Arctic, it would not normally be seen in southern Canada, and the “North American”population is therefore restricted to Canada. Meltofte (1985) estimated that approximately 500 pairs(i.e., 1000 birds) nested on Ellesmere Island/eastern Axel Heiberg Island, and the Canadian popula-tion is therefore estimated to be in the thousands (<10 000).
Semipalmated Plover Charadrius semipalmatus
Population estimates % NorthAmericanrange inCanada
Current maximum count totalsBreedingstatus(Canada)
Abundancestatus(Canada)Code Global Neotropical
NorthAmerica Canada
PacificFlyway
InteriorFlyway
EasternFlyway
SEPL 150 000 150 000 150 000 70.5 13 000 12 900 108 900 B Com
The previous population estimate of 50 000 suggested by Morrison et al. (1994a) would appearto be too low, based on numbers seen during migration. The largest numbers have been recordedduring fall migration in North America, with the following regional totals: eastern USA 61 500 (ISS),eastern Canada 47 400 (MSS), Interior Flyway 12 200 (Skagen et al. 1999), and Pacific USA 3300(ISS), totalling 124 400; this suggests a population nearer 150 000. Spring numbers are generallylower: eastern USA 25 900 (ISS), Interior Flyway 12 900 (Skagen et al. 1999), and western NorthAmerica 13 000 (G.W. Page, unpubl. data), totalling 51 800.
17
Fewer estimates are available from wintering or migration areas south of North America, espe-cially where aerial surveys have been used (e.g., Mexico: Morrison et al. 1992, 1993, 1994c; Panama:Morrison et al. 1998; South America: Morrison and Ross 1989), as the species is difficult to distin-guish where large flocks of small sandpipers (peeps) may be present. Watts et al. (1998) estimatedthat 30 600 were present in the Bay of Panama during southward migration, and totals at 17 sites inSouth America at which the species was mentioned in Scott and Carbonell (1986) came to 18 000.
Piping Plover Charadrius melodus
Population estimates % NorthAmericanrange inCanada
Current maximum count totalsBreedingstatus(Canada)
Abundancestatus(Canada)Code Global Neotropical
NorthAmerica Canada
PacificFlyway
InteriorFlyway
EasternFlyway
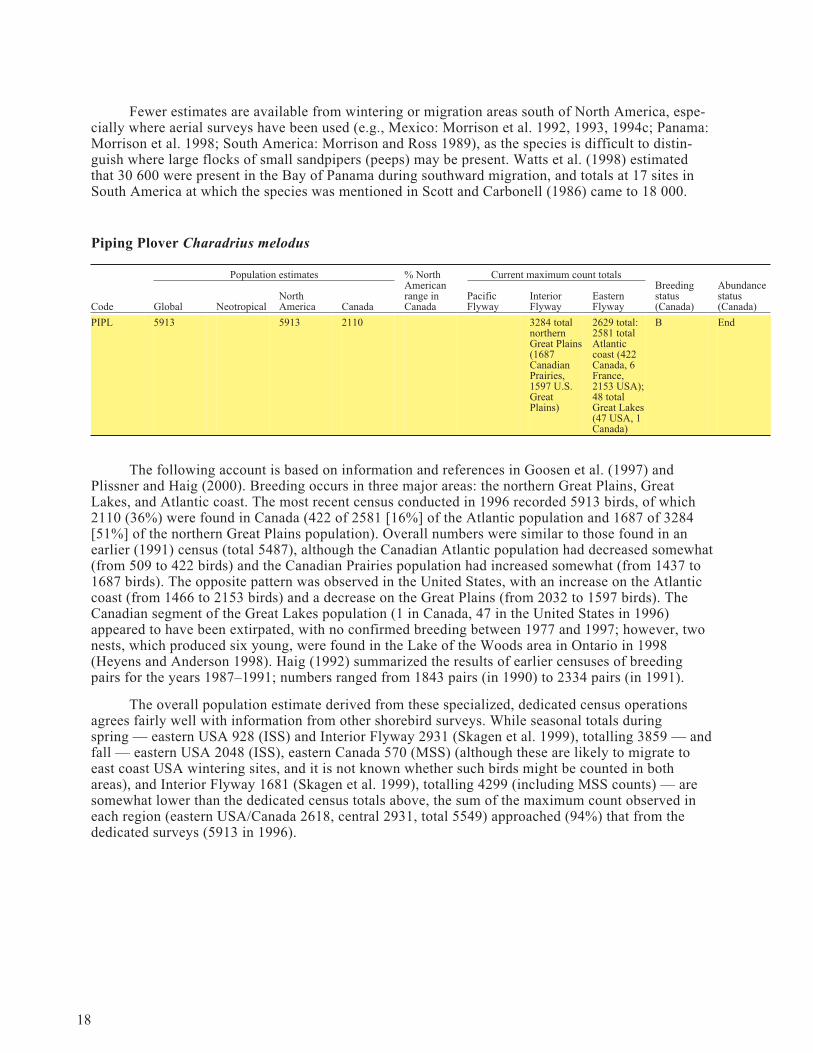
PIPL 5913 5913 2110 3284 totalnorthernGreat Plains(1687CanadianPrairies,1597 U.S.GreatPlains)
2629 total:2581 totalAtlanticcoast (422Canada, 6France,2153 USA);48 totalGreat Lakes(47 USA, 1Canada)
B End
The following account is based on information and references in Goosen et al. (1997) andPlissner and Haig (2000). Breeding occurs in three major areas: the northern Great Plains, GreatLakes, and Atlantic coast. The most recent census conducted in 1996 recorded 5913 birds, of which2110 (36%) were found in Canada (422 of 2581 [16%] of the Atlantic population and 1687 of 3284[51%] of the northern Great Plains population). Overall numbers were similar to those found in anearlier (1991) census (total 5487), although the Canadian Atlantic population had decreased somewhat(from 509 to 422 birds) and the Canadian Prairies population had increased somewhat (from 1437 to1687 birds). The opposite pattern was observed in the United States, with an increase on the Atlanticcoast (from 1466 to 2153 birds) and a decrease on the Great Plains (from 2032 to 1597 birds). TheCanadian segment of the Great Lakes population (1 in Canada, 47 in the United States in 1996)appeared to have been extirpated, with no confirmed breeding between 1977 and 1997; however, twonests, which produced six young, were found in the Lake of the Woods area in Ontario in 1998(Heyens and Anderson 1998). Haig (1992) summarized the results of earlier censuses of breedingpairs for the years 1987–1991; numbers ranged from 1843 pairs (in 1990) to 2334 pairs (in 1991).
The overall population estimate derived from these specialized, dedicated census operationsagrees fairly well with information from other shorebird surveys. While seasonal totals duringspring — eastern USA 928 (ISS) and Interior Flyway 2931 (Skagen et al. 1999), totalling 3859 — andfall — eastern USA 2048 (ISS), eastern Canada 570 (MSS) (although these are likely to migrate toeast coast USA wintering sites, and it is not known whether such birds might be counted in bothareas), and Interior Flyway 1681 (Skagen et al. 1999), totalling 4299 (including MSS counts) — aresomewhat lower than the dedicated census totals above, the sum of the maximum count observed ineach region (eastern USA/Canada 2618, central 2931, total 5549) approached (94%) that from thededicated surveys (5913 in 1996).
18
Killdeer Charadrius vociferus
Population estimates % NorthAmericanrange inCanada
Current maximum count totalsBreedingstatus(Canada)
Abundancestatus(Canada)Code Global Neotropical
NorthAmerica Canada
PacificFlyway
InteriorFlyway
EasternFlyway
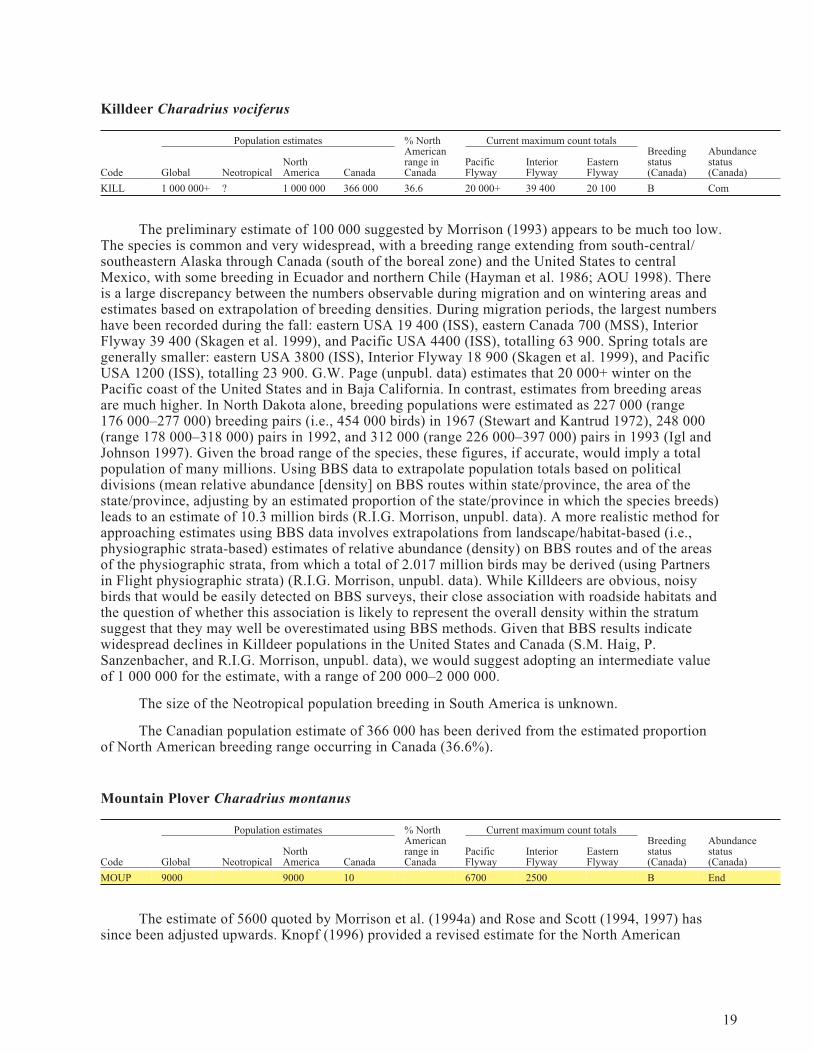
KILL 1 000 000+ ? 1 000 000 366 000 36.6 20 000+ 39 400 20 100 B Com
The preliminary estimate of 100 000 suggested by Morrison (1993) appears to be much too low.The species is common and very widespread, with a breeding range extending from south-central/southeastern Alaska through Canada (south of the boreal zone) and the United States to centralMexico, with some breeding in Ecuador and northern Chile (Hayman et al. 1986; AOU 1998). Thereis a large discrepancy between the numbers observable during migration and on wintering areas andestimates based on extrapolation of breeding densities. During migration periods, the largest numbershave been recorded during the fall: eastern USA 19 400 (ISS), eastern Canada 700 (MSS), InteriorFlyway 39 400 (Skagen et al. 1999), and Pacific USA 4400 (ISS), totalling 63 900. Spring totals aregenerally smaller: eastern USA 3800 (ISS), Interior Flyway 18 900 (Skagen et al. 1999), and PacificUSA 1200 (ISS), totalling 23 900. G.W. Page (unpubl. data) estimates that 20 000+ winter on thePacific coast of the United States and in Baja California. In contrast, estimates from breeding areasare much higher. In North Dakota alone, breeding populations were estimated as 227 000 (range176 000–277 000) breeding pairs (i.e., 454 000 birds) in 1967 (Stewart and Kantrud 1972), 248 000(range 178 000–318 000) pairs in 1992, and 312 000 (range 226 000–397 000) pairs in 1993 (Igl andJohnson 1997). Given the broad range of the species, these figures, if accurate, would imply a totalpopulation of many millions. Using BBS data to extrapolate population totals based on politicaldivisions (mean relative abundance [density] on BBS routes within state/province, the area of thestate/province, adjusting by an estimated proportion of the state/province in which the species breeds)leads to an estimate of 10.3 million birds (R.I.G. Morrison, unpubl. data). A more realistic method forapproaching estimates using BBS data involves extrapolations from landscape/habitat-based (i.e.,physiographic strata-based) estimates of relative abundance (density) on BBS routes and of the areasof the physiographic strata, from which a total of 2.017 million birds may be derived (using Partnersin Flight physiographic strata) (R.I.G. Morrison, unpubl. data). While Killdeers are obvious, noisybirds that would be easily detected on BBS surveys, their close association with roadside habitats andthe question of whether this association is likely to represent the overall density within the stratumsuggest that they may well be overestimated using BBS methods. Given that BBS results indicatewidespread declines in Killdeer populations in the United States and Canada (S.M. Haig, P.Sanzenbacher, and R.I.G. Morrison, unpubl. data), we would suggest adopting an intermediate valueof 1 000 000 for the estimate, with a range of 200 000–2 000 000.
The size of the Neotropical population breeding in South America is unknown.
The Canadian population estimate of 366 000 has been derived from the estimated proportionof North American breeding range occurring in Canada (36.6%).
Mountain Plover Charadrius montanus
Population estimates % NorthAmericanrange inCanada
Current maximum count totalsBreedingstatus(Canada)
Abundancestatus(Canada)Code Global Neotropical
NorthAmerica Canada
PacificFlyway
InteriorFlyway
EasternFlyway
MOUP 9000 9000 10 6700 2500 B End
The estimate of 5600 quoted by Morrison et al. (1994a) and Rose and Scott (1994, 1997) hassince been adjusted upwards. Knopf (1996) provided a revised estimate for the North American
19
population in 1995 of 8000–10 000 birds; this was based on the number of birds found during a wintercount in California in 1994 (3346, which was then doubled) plus estimated wintering populations inTexas and Mexico (1000–3000). S. Dinsmore (pers. commun.) suggested that this estimate may besomewhat low and could be increased to 10 000–15 000 birds (i.e., in the upper part of the range5000–15 000 given by Page and Gill [1994]); we suggest retaining the “most recent” estimate of some9000 birds (S. Jones, pers. commun.). The species is generally not recorded on ISS surveys.Maximum spring and fall counts from interior U.S. areas were 1334 and 2497, respectively (Skagen etal. 1999).
The species’ range only just extends into Canada, where it is considered a rare breeder in thesouthern Prairie provinces (Godfrey 1986); the latest population estimate for Canada is about 4–6pairs or generally less than 12 birds (value of 10 birds in table; RENEW 1998, 1999).
American Oystercatcher Haematopus palliatus
Population estimates % NorthAmericanrange inCanada
Current maximum count totalsBreedingstatus(Canada)
Abundancestatus(Canada)Code Global Neotropical
NorthAmerica Canada
PacificFlyway
InteriorFlyway
EasternFlyway
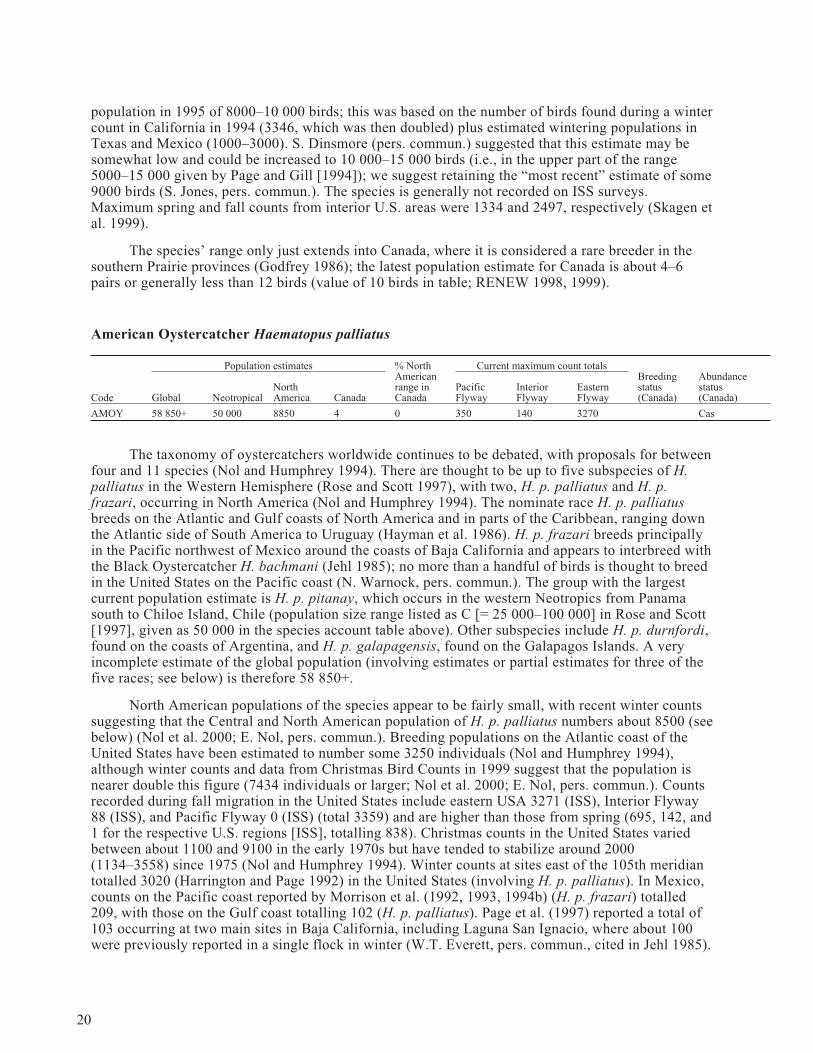
AMOY 58 850+ 50 000 8850 4 0 350 140 3270 Cas
The taxonomy of oystercatchers worldwide continues to be debated, with proposals for betweenfour and 11 species (Nol and Humphrey 1994). There are thought to be up to five subspecies of H.palliatus in the Western Hemisphere (Rose and Scott 1997), with two, H. p. palliatus and H. p.frazari, occurring in North America (Nol and Humphrey 1994). The nominate race H. p. palliatusbreeds on the Atlantic and Gulf coasts of North America and in parts of the Caribbean, ranging downthe Atlantic side of South America to Uruguay (Hayman et al. 1986). H. p. frazari breeds principallyin the Pacific northwest of Mexico around the coasts of Baja California and appears to interbreed withthe Black Oystercatcher H. bachmani (Jehl 1985); no more than a handful of birds is thought to breedin the United States on the Pacific coast (N. Warnock, pers. commun.). The group with the largestcurrent population estimate is H. p. pitanay, which occurs in the western Neotropics from Panamasouth to Chiloe Island, Chile (population size range listed as C [= 25 000–100 000] in Rose and Scott[1997], given as 50 000 in the species account table above). Other subspecies include H. p. durnfordi,found on the coasts of Argentina, and H. p. galapagensis, found on the Galapagos Islands. A veryincomplete estimate of the global population (involving estimates or partial estimates for three of thefive races; see below) is therefore 58 850+.
North American populations of the species appear to be fairly small, with recent winter countssuggesting that the Central and North American population of H. p. palliatus numbers about 8500 (seebelow) (Nol et al. 2000; E. Nol, pers. commun.). Breeding populations on the Atlantic coast of theUnited States have been estimated to number some 3250 individuals (Nol and Humphrey 1994),although winter counts and data from Christmas Bird Counts in 1999 suggest that the population isnearer double this figure (7434 individuals or larger; Nol et al. 2000; E. Nol, pers. commun.). Countsrecorded during fall migration in the United States include eastern USA 3271 (ISS), Interior Flyway88 (ISS), and Pacific Flyway 0 (ISS) (total 3359) and are higher than those from spring (695, 142, and1 for the respective U.S. regions [ISS], totalling 838). Christmas counts in the United States variedbetween about 1100 and 9100 in the early 1970s but have tended to stabilize around 2000(1134–3558) since 1975 (Nol and Humphrey 1994). Winter counts at sites east of the 105th meridiantotalled 3020 (Harrington and Page 1992) in the United States (involving H. p. palliatus). In Mexico,counts on the Pacific coast reported by Morrison et al. (1992, 1993, 1994b) (H. p. frazari) totalled209, with those on the Gulf coast totalling 102 (H. p. palliatus). Page et al. (1997) reported a total of103 occurring at two main sites in Baja California, including Laguna San Ignacio, where about 100were previously reported in a single flock in winter (W.T. Everett, pers. commun., cited in Jehl 1985).
20

Winter counts from aerial surveys in Panama in January 1993 (presumably involving H. p. pitanay)totalled 153, all of which occurred on the Pacific coast (Morrison et al. 1998). Surveys of the Gulf ofPanama in February 1988, October 1991, and January 1993 yielded counts of 67, 247, and 124,respectively (Morrison et al. 1998), and a survey of a 100-km sector of the coast in the fall of 1997yielded 346 birds (B. Watts, pers. commun., cited in Nol et al. 2000).
The combined 1999 winter survey and Christmas Bird Count data from the east and Gulf coastsof the United States produce a total of 7434 birds, suggesting that the total for the H. p. palliatus pop-ulation could range as high as 8500 when allowance is made for areas that were poorly covered andfor islands in the Caribbean (Nol et al. 2000; E. Nol, pers. commun.). For H. p. frazari, combiningcounts for the Pacific coast of Mexico from Page et al. (1997) and Morrison et al. (1992, 1994c) (onthe basis that counts did not overlap) gives a total of 103 + 209 = 312, which, if adjusted for the largercount previously noted at Laguna San Ignacio, becomes approximately 350. Highest counts on thePacific coast of Panama (see above) come to some 350 birds, although it is not clear whether thesemay refer to H. p. pitanay.
The American Oystercatcher is generally considered of casual occurrence in Canada (Godfrey1986; Morrison et al. 1994a), and there were no confirmed breeding records until recent years, whenabout two pairs have bred at Cape Sable in southern Nova Scotia (P. Hicklin and R.D. Elliot, pers.commun.).
Black Oystercatcher Haematopus bachmani
Population estimates % NorthAmericanrange inCanada
Current maximum count totalsBreedingstatus(Canada)
Abundancestatus(Canada)Code Global Neotropical
NorthAmerica Canada
PacificFlyway
InteriorFlyway
EasternFlyway
BLOY 8900 8900 8000 11 000 B Reg
The estimate for the breeding population of 7600 provided by Page and Gill (1994) may beincreased somewhat to 8900, representing the approximate midpoint of the range of 6900–10 800given by Andres and Falxa (1995) (similar to the “guesstimate” of 10 000 provided by Morrison et al.[1994a]). The Canadian population is presumably smaller than the overall North American popula-tion, as the species’ breeding range extends south to Baja California (Hayman et al. 1986), and hasbeen tentatively listed as 8000.
Black-necked Stilt Himantopus mexicanus mexicanus
Population estimates % NorthAmericanrange inCanada
Current maximum count totalsBreedingstatus(Canada)
Abundancestatus(Canada)Code Global Neotropical
NorthAmerica Canada
PacificFlyway
InteriorFlyway
EasternFlyway
BNST 850 000+ 200 000+ 150 000 400 16 000 120 000 5400 B Sca
Global population estimates for this species involve a minimum of 850 000 birds, based on datafor six of 10 populations (involving five races; Hayman et al. 1986) for which information is available(Rose and Scott 1997), plus the current estimate for the “North American” population, H. m.mexicanus. The largest numbers in North America have been recorded during fall migration: easternUSA 5400 (ISS), Interior Flyway 120 000 (Skagen et al. 1999), and Pacific USA 16 000 (Harringtonand Perry 1995), totalling 141 400. Spring numbers are also substantial: eastern USA 2300 (ISS),Interior Flyway 111 600 (Skagen et al. 1999), and Pacific USA 5900 (ISS), totalling 119 800. Pageand Gill (1994) reported a winter total of 25 000 for the Pacific Flyway. Winter counts include about
21

5700 in eastern and central USA (Harrington and Page 1992), 5600 on the Pacific coast of the USA(Page et al. 1999), and 48 800 in Mexico (Morrison et al. 1992, 1993, 1994c), totalling 60 100. Thesenumbers suggest that just the North American segment of the population, whose overall range extendsinto northern South America, probably exceeds 150 000. This impression is supported by the estimateof the population obtained by extrapolation of relative densities observed on BBS surveys usingPartners in Flight physiographic strata, which result in an estimate of slightly more than 175 000(R.I.G. Morrison, unpubl. data). In view of the uncertainties regarding BBS extrapolations, wesuggest retaining an estimate of 150 000 for the North American population.
Himantopus m. mexicanus reaches the edge of its range in the Canadian Prairies, although inrecent years it appears to have been expanding its range. There are now thought to be some 100–300pairs (400 individuals in the table) breeding regularly in southern Alberta (C.L. Gratto-Trevor,unpubl. data), up from the previous estimate of 100 birds (Morrison et al. 1994a).
The population size of the South American race, H. m. melanurus, whose distribution extendsfrom Peru and northern Brazil to central Argentina and Chile, is listed as 25 000–100 000 (R.Schlatter, pers. commun., cited in Rose and Scott 1997). This population is also likely to be consider-ably larger, as aerial surveys conducted in the Pantanal wetlands in Brazil in October 1996 yielded adirect count of over 15 000 birds, with a possible extrapolated total for the region in the 50 000–100 000 range (Morrison et al. 1997, and unpubl. data). Totals listed for 19 sites at which the specieswas mentioned in Scott and Carbonell (1986) came to 9800.
Hawaiian Stilt Himantopus mexicanus knudseni
Population estimates % NorthAmericanrange inCanada
Current maximum count totalsBreedingstatus(Canada)
Abundancestatus(Canada)Code Global Neotropical
NorthAmerica Canada
PacificFlyway
InteriorFlyway
EasternFlyway
HAST 1650 1650
The population of the race of the Black-necked Stilt occurring on Hawaii (AOU 1998), H.mexicanus knudseni or Hawaiian Stilt, has been estimated as 1500–1800 (S. Reilly, pers. commun.).
American Avocet Recurvirostra americana
Population estimates % NorthAmericanrange inCanada
Current maximum count totalsBreedingstatus(Canada)
Abundancestatus(Canada)Code Global Neotropical
NorthAmerica Canada
PacificFlyway
InteriorFlyway
EasternFlyway
AMAV 450 000 450 000 63 000 13.9 56 300 325 300 4900 B Reg
The largest numbers in North America have been recorded during fall migration: eastern USA4900 (ISS), western North America, including interior areas, 425 000 (G.W. Page, unpubl. data), andother interior sites in central USA 18 500 (Skagen et al. 1999), totalling 448 400; this indicates thatthe North American population very likely exceeds 450 000. Spring totals are lower: eastern USA2500 (ISS), Interior Flyway 149 800 (Skagen et al. 1999), and Pacific Flyway 17 900 (Harrington andPerry 1995), totalling 170 200. At least 100 000 winter in North America west of the RockyMountains (Page and Gill 1994; Robinson et al. 1997), and Morrison et al. (1992, 1993, 1994c)recorded a total of 163 900 during aerial surveys of wintering areas in Mexico. Estimates of the popu-lation size from extrapolation of BBS data using Partners in Flight physiographic strata approach293 000 (R.I.G. Morrison, unpubl. data).
22
The Canadian total of 63 000 is based on the proportion of the breeding range (13.9%)occurring in Canada.
Greater Yellowlegs Tringa melanoleuca
Population estimates % NorthAmericanrange inCanada
Current maximum count totalsBreedingstatus(Canada)
Abundancestatus(Canada)Code Global Neotropical
NorthAmerica Canada
PacificFlyway
InteriorFlyway
EasternFlyway
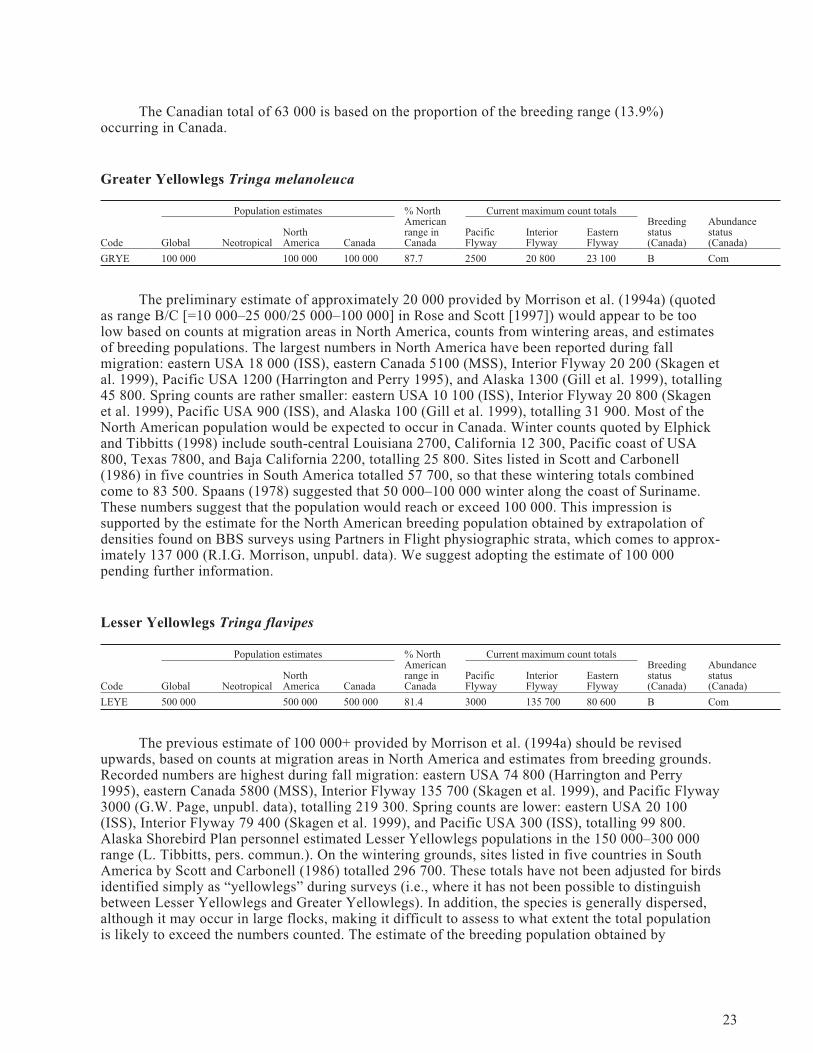
GRYE 100 000 100 000 100 000 87.7 2500 20 800 23 100 B Com
The preliminary estimate of approximately 20 000 provided by Morrison et al. (1994a) (quotedas range B/C [=10 000–25 000/25 000–100 000] in Rose and Scott [1997]) would appear to be toolow based on counts at migration areas in North America, counts from wintering areas, and estimatesof breeding populations. The largest numbers in North America have been reported during fallmigration: eastern USA 18 000 (ISS), eastern Canada 5100 (MSS), Interior Flyway 20 200 (Skagen etal. 1999), Pacific USA 1200 (Harrington and Perry 1995), and Alaska 1300 (Gill et al. 1999), totalling45 800. Spring counts are rather smaller: eastern USA 10 100 (ISS), Interior Flyway 20 800 (Skagenet al. 1999), Pacific USA 900 (ISS), and Alaska 100 (Gill et al. 1999), totalling 31 900. Most of theNorth American population would be expected to occur in Canada. Winter counts quoted by Elphickand Tibbitts (1998) include south-central Louisiana 2700, California 12 300, Pacific coast of USA800, Texas 7800, and Baja California 2200, totalling 25 800. Sites listed in Scott and Carbonell(1986) in five countries in South America totalled 57 700, so that these wintering totals combinedcome to 83 500. Spaans (1978) suggested that 50 000–100 000 winter along the coast of Suriname.These numbers suggest that the population would reach or exceed 100 000. This impression issupported by the estimate for the North American breeding population obtained by extrapolation ofdensities found on BBS surveys using Partners in Flight physiographic strata, which comes to approx-imately 137 000 (R.I.G. Morrison, unpubl. data). We suggest adopting the estimate of 100 000pending further information.
Lesser Yellowlegs Tringa flavipes
Population estimates % NorthAmericanrange inCanada
Current maximum count totalsBreedingstatus(Canada)
Abundancestatus(Canada)Code Global Neotropical
NorthAmerica Canada
PacificFlyway
InteriorFlyway
EasternFlyway
LEYE 500 000 500 000 500 000 81.4 3000 135 700 80 600 B Com
The previous estimate of 100 000+ provided by Morrison et al. (1994a) should be revisedupwards, based on counts at migration areas in North America and estimates from breeding grounds.Recorded numbers are highest during fall migration: eastern USA 74 800 (Harrington and Perry1995), eastern Canada 5800 (MSS), Interior Flyway 135 700 (Skagen et al. 1999), and Pacific Flyway3000 (G.W. Page, unpubl. data), totalling 219 300. Spring counts are lower: eastern USA 20 100(ISS), Interior Flyway 79 400 (Skagen et al. 1999), and Pacific USA 300 (ISS), totalling 99 800.Alaska Shorebird Plan personnel estimated Lesser Yellowlegs populations in the 150 000–300 000range (L. Tibbitts, pers. commun.). On the wintering grounds, sites listed in five countries in SouthAmerica by Scott and Carbonell (1986) totalled 296 700. These totals have not been adjusted for birdsidentified simply as “yellowlegs” during surveys (i.e., where it has not been possible to distinguishbetween Lesser Yellowlegs and Greater Yellowlegs). In addition, the species is generally dispersed,although it may occur in large flocks, making it difficult to assess to what extent the total populationis likely to exceed the numbers counted. The estimate of the breeding population obtained by
23

extrapolation of densities found on BBS surveys using Partners in Flight physiographic strata comesto some 821 000 birds; however, this method is likely to produce biased (possibly inflated) estimates,depending on the stage of the nesting cycle at which the surveys are conducted (L. Tibbitts, pers.commun.). We therefore suggest a current global population estimate of 500 000 (range 300 000–800 000).
Most of the North American population may be expected to occur in Canada, even though thebreeding range extends well westwards into Alaska (Hayman et al. 1986).
Solitary Sandpiper Tringa solitaria
Population estimates % NorthAmericanrange inCanada
Current maximum count totalsBreedingstatus(Canada)
Abundancestatus(Canada)Code Global Neotropical
NorthAmerica Canada
PacificFlyway
InteriorFlyway
EasternFlyway
SOSA 25 000 25 000 25 000 25 000 83.9 200 5600 800 B Reg
The preliminary estimate of 10 000 by Morrison et al. (1994a), referred to in Rose and Scott(1997), is probably considerably low. The species is generally dispersed during migration (Moskoff1995), making it difficult to use counts for assessing population size, and it may be missed in somesurveys. Regional/seasonal totals are generally low compared with those for many other species.Counts are highest in spring: eastern USA 500 (Harrington and Perry 1995) and Interior Flyway 5600(Skagen et al. 1999), with no data from Pacific Flyway, totalling 6100. Fall totals include easternUSA 700 (Harrington and Perry 1995), eastern Canada 100 (MSS), Interior Flyway 2000 (Skagen etal. 1999), and Pacific Flyway 200 (G.W. Page, unpubl. data), totalling 3000. Totals for two sites inSuriname listed by Scott and Carbonell (1986) come to 3000. A minimum of 700 birds is consideredto breed in Quebec (Gauthier and Aubrey 1996). It is difficult to come up with an estimate for thepopulation from these minimal counts, but they would suggest a figure of perhaps 25 000. The popu-lation estimate obtained from extrapolation of BBS data using Partners in Flight physiographic stratais much higher (188 000 birds), but the survey method is unlikely to be suitable for detecting thespecies (Moskoff 1995; L. Oring, pers. commun.). Given the extensive breeding range, which coversmainly boreal habitats stretching from Alaska to eastern Canada, and extensive wintering range,involving tropical and subtropical habitats from Mexico through South America east of the Andes toArgentina (Moskoff 1995), the estimate of 25 000 might appear low; however, in view of the species’tendency to be highly dispersed in both ranges, much uncertainty remains as to how much larger itmight be. We suggest adopting a conservative estimate of 25 000, with a range of 25 000–150 000,pending further information.
Willet Catoptrophorus semipalmatus
Population estimates % NorthAmericanrange inCanada
Current maximum count totalsBreedingstatus(Canada)
Abundancestatus(Canada)Code Global Neotropical
NorthAmerica Canada
PacificFlyway
InteriorFlyway
EasternFlyway
WILL 250 000+ 250 000 25 000 106 300 52 300 15 600 B Com
Two main races occur in the Western Hemisphere — the “eastern” Willet (C. s. semipalmatus),breeding in eastern North America and breeding/wintering in northern Mexico and the Caribbean,some wintering as far south as northern South America (Brazil), and the “western” Willet (C. s.inornatus), breeding in the interior of western North America and wintering coastally in CentralAmerica and northwestern South America (Pacific and northern coasts to Suriname) (Hayman et al.1986).
24
The highest counts are recorded in North America during fall migration: eastern USA 13 700(ISS), eastern Canada 1900 (MSS), Interior Flyway 50 000 (Harrington and Page 1992), and PacificUSA 26 400 (ISS), totalling 92 000. Spring counts include eastern USA 6800 (ISS), Interior Flyway22 200 (Skagen et al. 1999), and Pacific USA 7400 (ISS), totalling 36 400. Counts from winteringareas exceed both spring and fall totals: eastern USA 5200 (Harrington and Perry 1995), central USA52 300 (Harrington and Page 1992), Pacific Flyway 70 000+ (Page and Gill 1994), Mexico 29 800(Morrison et al. 1992, 1993, 1994c), Panama 4400 (Morrison et al. 1998), and South America 83 700(replacing the Suriname total of 15 600 in Morrison and Ross [1989] by 55 000 [Scott and Carbonell1986] to give a revised total of 83 700), totalling 245 400+ (counts occurring on Pacific coastlines ofthe above areas total 106 300). The overall population of both races is therefore probably at least250 000. Estimates of the overall breeding population obtained through extrapolation of BBSdensities using BBS physiographic strata are quite similar (226 000) (but smaller [133 000] if Partnersin Flight physiographic strata are used; R.I.G. Morrison, unpubl. data).
Rough estimates for the two races are suggested as follows: eastern race C. s. semipalmatus90 000 (South America 83 700 plus winter eastern USA 5200 = 88 900, rounded up to 90 000);western race C. c. inornatus 160 000 (winter central 52 300, Pacific 70 000+, Mexico 29 800, andPanama 4400 = 156 500, rounded up to 160 000).
The Canadian population is tentatively estimated to be 10% of the overall population — i.e.,approximately 25 000 — but little information is available.
Wandering Tattler Heteroscelus incanus
Population estimates % NorthAmericanrange inCanada
Current maximum count totalsBreedingstatus(Canada)
Abundancestatus(Canada)Code Global Neotropical
NorthAmerica Canada
PacificFlyway
InteriorFlyway
EasternFlyway
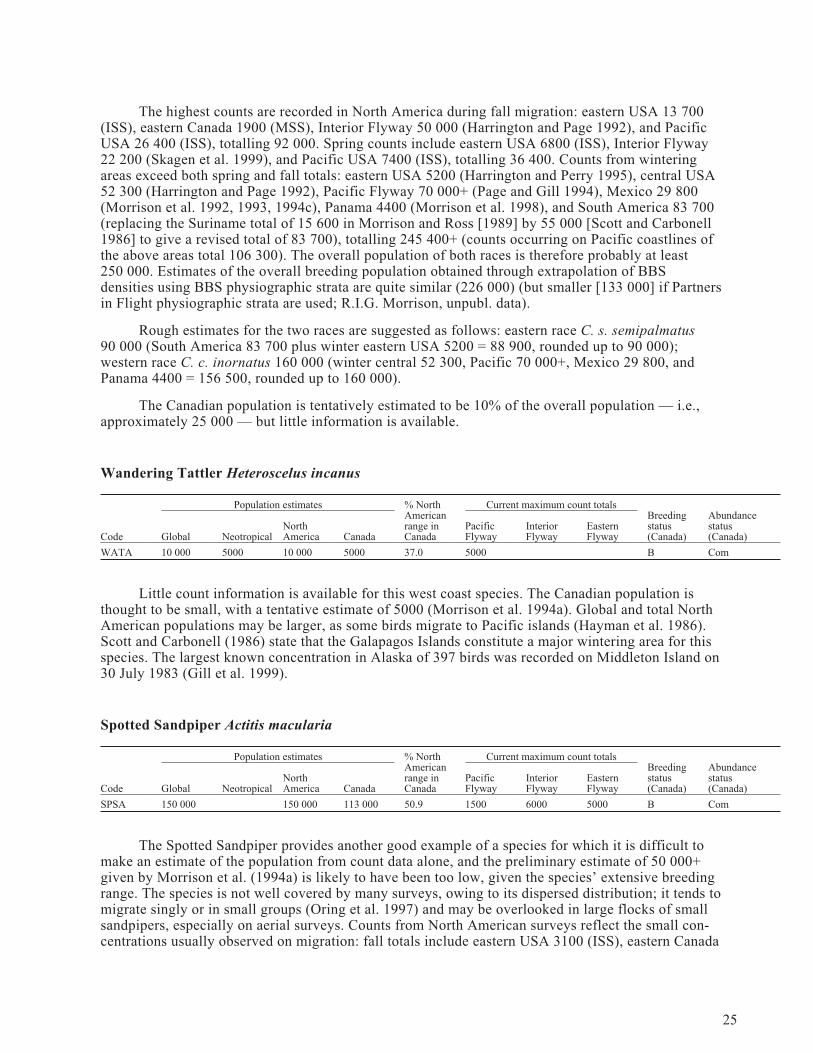
WATA 10 000 5000 10 000 5000 37.0 5000 B Com
Little count information is available for this west coast species. The Canadian population isthought to be small, with a tentative estimate of 5000 (Morrison et al. 1994a). Global and total NorthAmerican populations may be larger, as some birds migrate to Pacific islands (Hayman et al. 1986).Scott and Carbonell (1986) state that the Galapagos Islands constitute a major wintering area for thisspecies. The largest known concentration in Alaska of 397 birds was recorded on Middleton Island on30 July 1983 (Gill et al. 1999).
Spotted Sandpiper Actitis macularia
Population estimates % NorthAmericanrange inCanada
Current maximum count totalsBreedingstatus(Canada)
Abundancestatus(Canada)Code Global Neotropical
NorthAmerica Canada
PacificFlyway
InteriorFlyway
EasternFlyway
SPSA 150 000 150 000 113 000 50.9 1500 6000 5000 B Com
The Spotted Sandpiper provides another good example of a species for which it is difficult tomake an estimate of the population from count data alone, and the preliminary estimate of 50 000+given by Morrison et al. (1994a) is likely to have been too low, given the species’ extensive breedingrange. The species is not well covered by many surveys, owing to its dispersed distribution; it tends tomigrate singly or in small groups (Oring et al. 1997) and may be overlooked in large flocks of smallsandpipers, especially on aerial surveys. Counts from North American surveys reflect the small con-centrations usually observed on migration: fall totals include eastern USA 3100 (ISS), eastern Canada
25
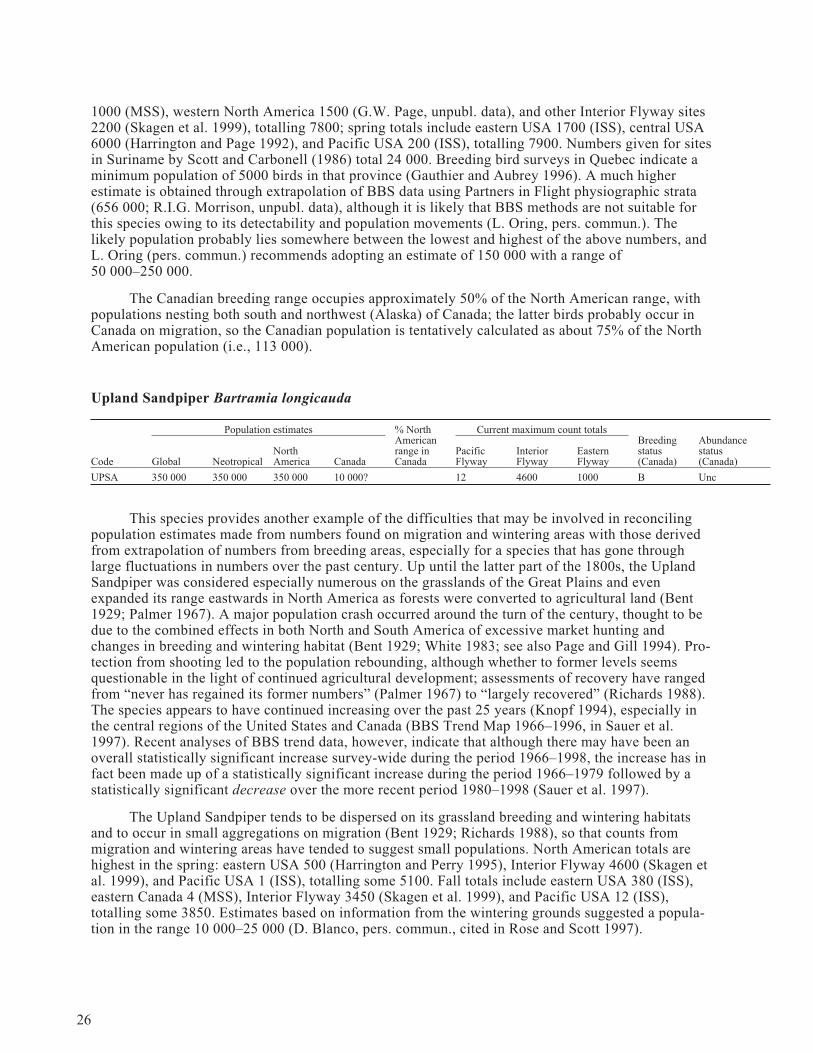
1000 (MSS), western North America 1500 (G.W. Page, unpubl. data), and other Interior Flyway sites2200 (Skagen et al. 1999), totalling 7800; spring totals include eastern USA 1700 (ISS), central USA6000 (Harrington and Page 1992), and Pacific USA 200 (ISS), totalling 7900. Numbers given for sitesin Suriname by Scott and Carbonell (1986) total 24 000. Breeding bird surveys in Quebec indicate aminimum population of 5000 birds in that province (Gauthier and Aubrey 1996). A much higherestimate is obtained through extrapolation of BBS data using Partners in Flight physiographic strata(656 000; R.I.G. Morrison, unpubl. data), although it is likely that BBS methods are not suitable forthis species owing to its detectability and population movements (L. Oring, pers. commun.). Thelikely population probably lies somewhere between the lowest and highest of the above numbers, andL. Oring (pers. commun.) recommends adopting an estimate of 150 000 with a range of50 000–250 000.
The Canadian breeding range occupies approximately 50% of the North American range, withpopulations nesting both south and northwest (Alaska) of Canada; the latter birds probably occur inCanada on migration, so the Canadian population is tentatively calculated as about 75% of the NorthAmerican population (i.e., 113 000).
Upland Sandpiper Bartramia longicauda
Population estimates % NorthAmericanrange inCanada
Current maximum count totalsBreedingstatus(Canada)
Abundancestatus(Canada)Code Global Neotropical
NorthAmerica Canada
PacificFlyway
InteriorFlyway
EasternFlyway
UPSA 350 000 350 000 350 000 10 000? 12 4600 1000 B Unc
This species provides another example of the difficulties that may be involved in reconcilingpopulation estimates made from numbers found on migration and wintering areas with those derivedfrom extrapolation of numbers from breeding areas, especially for a species that has gone throughlarge fluctuations in numbers over the past century. Up until the latter part of the 1800s, the UplandSandpiper was considered especially numerous on the grasslands of the Great Plains and evenexpanded its range eastwards in North America as forests were converted to agricultural land (Bent1929; Palmer 1967). A major population crash occurred around the turn of the century, thought to bedue to the combined effects in both North and South America of excessive market hunting andchanges in breeding and wintering habitat (Bent 1929; White 1983; see also Page and Gill 1994). Pro-tection from shooting led to the population rebounding, although whether to former levels seemsquestionable in the light of continued agricultural development; assessments of recovery have rangedfrom “never has regained its former numbers” (Palmer 1967) to “largely recovered” (Richards 1988).The species appears to have continued increasing over the past 25 years (Knopf 1994), especially inthe central regions of the United States and Canada (BBS Trend Map 1966–1996, in Sauer et al.1997). Recent analyses of BBS trend data, however, indicate that although there may have been anoverall statistically significant increase survey-wide during the period 1966–1998, the increase has infact been made up of a statistically significant increase during the period 1966–1979 followed by astatistically significant decrease over the more recent period 1980–1998 (Sauer et al. 1997).
The Upland Sandpiper tends to be dispersed on its grassland breeding and wintering habitatsand to occur in small aggregations on migration (Bent 1929; Richards 1988), so that counts frommigration and wintering areas have tended to suggest small populations. North American totals arehighest in the spring: eastern USA 500 (Harrington and Perry 1995), Interior Flyway 4600 (Skagen etal. 1999), and Pacific USA 1 (ISS), totalling some 5100. Fall totals include eastern USA 380 (ISS),eastern Canada 4 (MSS), Interior Flyway 3450 (Skagen et al. 1999), and Pacific USA 12 (ISS),totalling some 3850. Estimates based on information from the wintering grounds suggested a popula-tion in the range 10 000–25 000 (D. Blanco, pers. commun., cited in Rose and Scott 1997).
26

Estimates from the breeding grounds suggest considerably larger populations. In Illinois,numbers were thought to be around 283 000 in 1907–1909 and 177 000–208 000 in 1957–1958(Graber and Graber 1963). Estimates for North Dakota have included 91 000–183 000 breeding pairsin 1967 (Stewart and Kantrud 1972), 166 000–307 000 pairs in 1992, and 138 000–258 000 pairs in1993 (Igl and Johnson 1997). On the basis of the estimates up to 1967 and a consideration of the dis-tribution of the species, Page and Gill (1994) suggested that the population likely numbered betweenseveral hundred thousand and a few million birds.
This range is consistent with various estimates that can be calculated using BBS data. Oneapproach is to take the mean population estimated for North Dakota by Igl and Johnson (1997) andcalculate populations of other states in the core of the species’ range (South Dakota, Nebraska,Kansas, Oklahoma, Illinois) based on relative abundances given in the BBS data set and areas of thestates concerned, which leads to an estimate of 1.732 million. This approach, however, relies entirelyon the accuracy of the estimate in one state (North Dakota) and takes little account of the habitat dif-ferences across the other states. Another approach is to use densities found in different physiographicstrata on BBS routes and extrapolate populations based on the areas of the different strata; this leadsto an estimate of 346 000 based on Partners in Flight physiographic strata and about 386 000 based onBBS strata. Given the small numbers that can be counted during migration and wintering areas andestimates from breeding grounds suggesting anywhere from hundreds of thousands to millions ofbirds, we suggest adopting an interim value of 350 000.
Estimates of the likely numbers breeding in Canada are more uncertain. Gauthier and Aubrey(1996) and Y. Aubrey (pers. commun.) considered the minimum population breeding in Quebec to besome 1000 birds. Calculations based on BBS coverage in Canada are not available. An estimate ofsome 10 000 is tentatively suggested.
Eskimo Curlew Numenius borealis
Population estimates % NorthAmericanrange inCanada
Current maximum count totalsBreedingstatus(Canada)
Abundancestatus(Canada)Code Global Neotropical
NorthAmerica Canada
PacificFlyway
InteriorFlyway
EasternFlyway
ESCU <50 <50 <50 <50 B End
There have been few, if any, reliable sightings of this endangered species in recent years. Thehighest reported sighting was 23 in May 1981 in Texas (Blankinship and King 1984). The global pop-ulation is likely less than 50 (Gollop et al. 1986; Morrison et al. 1994a), if the species still survives.At one time, it probably numbered in the hundreds of thousands (Gill et al. 1998). No birds werefound during searches of suitable habitat on wintering grounds in Argentina and Uruguay in 1993(Blanco et al. 1993).
Whimbrel Numenius phaeopus
Population estimates % NorthAmericanrange inCanada
Current maximum count totalsBreedingstatus(Canada)
Abundancestatus(Canada)Code Global Neotropical
NorthAmerica Canada
PacificFlyway
InteriorFlyway
EasternFlyway
WHIM 797 000+ 57 000 57 000 46.5 25 100 4400 4200 B Com
The global population of this species is at least 797 000, based on estimates for four (of six)populations (involving four subspecies) for which information is available (Rose and Scott 1997). TheNorth American population (which was formerly separated as a species, the Hudsonian Curlew N.
27

hudsonicus) may be divided into two subspecies/populations, with N. p. hudsonicus breeding west andsouth of Hudson Bay and N. p. rufiventris breeding in Alaska and east to the Melville Hills, Nunavut(Skeel and Mallory 1996; Engelmoer and Roselaar 1998). The North American birds may be distin-guished genetically from the nearest subspecies/population breeding in northeastern Siberia, N. p.variegatus (Zink et al. 1985), whereas the two North American races may be distinguished on theirmorphometrics, with N. p. hudsonicus generally being smaller than N. p. rufiventris (Engelmoer andRoselaar 1998).
Count totals are highest in North America during spring migration: eastern USA 2100 (ISS),Interior Flyway 4400 (Skagen et al. 1999), western North America 25 000 (G.W. Page, unpubl. data),and Alaska 100 (Gill et al. 1999), totalling 31 600. Fall counts include eastern USA 3100 (ISS),eastern Canada 1100 (MSS), central USA 500 (Harrington and Page 1992), Pacific USA 750 (ISS),and Alaska 3900 (Gill et al. 1999), totalling 9350. These are exceeded by counts from breeding andwintering areas. Data in Gill et al. (1999) indicate a possible total of 36 000 birds (3% of an estimated1.2 million shorebirds) on the Yukon River delta in Alaska, which, combined with an estimated 2600for the Mackenzie River delta (Morrison 1997), indicates a total from the breeding grounds of at least38 600; these estimates would involve the subspecies N. p. rufiventris. Wintering ground countsinclude Mexico 1900 (Morrison et al. 1992, 1993, 1994c), Panama 1600 (Morrison et al. 1998), andSouth America 27 100 (replacing the 3300 for Suriname in Morrison and Ross [1989] with 5500 fromScott and Carbonell [1986] for this country), totalling 30 600.
Skeel and Mallory (1996) indicated that the migration routes used by the two subspecies aregenerally separate and suggested that little mixing occurs; the western population would appear towinter on the Pacific side of the Americas, whereas the eastern population occupies wintering groundson the Atlantic and Gulf coasts of the Americas. If this is the case, a rough estimate (from counts) ofthe size of the N. p. hudsonicus population would come from numbers found on the north and eastcoasts of South America and around the Caribbean and Gulf coasts of the United States, CentralAmerica, and South America; available data include the north and Atlantic coasts of South America17 457 (replacing count in Suriname as above) plus 210 (Morrison and Ross 1989), the Gulf/Caribbean coasts of Mexico 57 (Morrison et al. 1993), and the Gulf coast of Panama 88 (Morrison etal. 1998), totalling some 17 800.
Rounding the subspecies estimates to 39 000 for N. p. rufiventris and to 18 000 for N. p.hudsonicus produces a North American population estimate of 57 000, which is consistent with thecurrent listing by Rose and Scott (1997) (range C, 25 000–100 000; see Skeel and Mallory 1996).
Bristle-thighed Curlew Numenius tahitiensis
Population estimates % NorthAmericanrange inCanada
Current maximum count totalsBreedingstatus(Canada)
Abundancestatus(Canada)Code Global Neotropical
NorthAmerica Canada
PacificFlyway
InteriorFlyway
EasternFlyway
BTCU 10 000 10 000 0 Acc
The Bristle-thighed Curlew, which breeds in western Alaska and winters in Oceania, is thoughtto have a population of some 10 000 birds (R.E. Gill, pers. commun., cited in Collar et al. 1992; seealso Rose and Scott 1997). This figure is derived from an estimate for the breeding population ofapproximately 7000 based on breeding ground surveys (Gill and Redmond 1992; Page and Gill 1994)plus an estimated oversummering population of approximately 3000 (birds 1–3 years old). Thepresent estimate for the breeding population of 3313 pairs, with a 95% confidence interval of2239–4387 pairs (R.E. Gill and C. Handel, pers. commun.), suggests a population range of7500–11 800 individuals.
28

It is rarely seen in Canada, being considered of accidental occurrence by Godfrey (1986) andlisted as casual in British Columbia by Campbell et al. (1990) on the basis of two acceptable records.
Long-billed Curlew Numenius americana
Population estimates % NorthAmericanrange inCanada
Current maximum count totalsBreedingstatus(Canada)
Abundancestatus(Canada)Code Global Neotropical
NorthAmerica Canada
PacificFlyway
InteriorFlyway
EasternFlyway
LBCU 20 000 20 000 1000s 11 200+ 8100 160 B Vul
The previous estimate of 6500 (de Smet 1992 [500 Pacific, 6000 central]; see also Morrison etal. 1994a; Rose and Scott 1997) would appear to be too low, based on counts at migration areas inNorth America. The highest counts recorded in North America occur in the fall: eastern USA 30(ISS), Interior Flyway 8100 (Skagen et al. 1999), and Pacific USA 6000 (Harrington and Perry 1995),totalling 14 130. Spring counts include eastern USA 10 (ISS), Interior Flyway 5030 (Skagen et al.1999), Pacific USA 420 (ISS), totalling 5460. S. Dinsmore (pers. commun.) reports flocks numberingmore than 750 birds in Montana. Winter counts include eastern and mid USA 160 and 140, respec-tively (Harrington and Perry 1995), western North America including Baja California 11 000+ (G.W.Page, unpubl. data), and Mexico (other than Baja California) 210 (Morrison et al. 1992, 1993, 1994c),totalling 11 510. These counts suggest a population of perhaps 20 000. Given the size of the speciesand its relatively obvious nature, it would seem unlikely that major parts of the population would gounrecorded on migration or wintering surveys. Estimates based on extrapolation from densitiesrecorded on BBS surveys using Partners in Flight physiographic strata are much higher (168 000birds; R.I.G. Morrison, unpubl. data) but are considered unrealistic; the coarse nature of the strata andunknown proportion of specific land cover types, limited number of BBS routes within some strata,and spotty distribution of the species suggest that extrapolations will be subject to large errors,probably overestimates (R. Redmond, pers. commun.). Until evidence is available to the contrary, wewould recommend adopting a population estimate of 20 000 (range 15 000–20 000) birds.
The species is listed as vulnerable in Canada (COSEWIC 1998); the Canadian breeding popula-tion probably numbers several thousand birds.
Hudsonian Godwit Limosa haemastica
Population estimates % NorthAmericanrange inCanada
Current maximum count totalsBreedingstatus(Canada)
Abundancestatus(Canada)Code Global Neotropical
NorthAmerica Canada
PacificFlyway
InteriorFlyway
EasternFlyway
HUGO 50 000 50 000 50 000 50 000 41.6 230 17 200 11 000 B Reg
The Western Hemisphere (i.e., global) population is presumed to be at least 50 000, based onthe South American wintering grounds survey total of 46 000 (Morrison and Ross 1989). Count totalsof birds on migration in North America reach 17 000–20 000. Spring numbers include eastern USA500 (Harrington and Perry 1995), Interior Flyway 17 200 (Skagen et al. 1999), and Pacific USA 2(ISS), totalling some 17 700; fall numbers consist of eastern North America 10 200 (Harrington andPage 1992) (includes 10 000 in James Bay; see Morrison and Harrington 1979), eastern Canada 800(MSS), Interior Flyway 9400 (Skagen et al. 1999), Pacific USA 0 (ISS), and Alaska 230 (Gill et al.1999), totalling 20 630. Data in Gill et al. (1999) indicated that as many as 36 000 (3% of an esti-mated 1.2 million shorebirds) may occur (breeding) on the Yukon River delta in Alaska. The popula-tions breeding in the western part of the breeding range in Alaska appear to be genetically distinctfrom those breeding in more central areas (Haig et al. 1997) and probably migrate to wintering areas
29

on the Pacific side of South America. Not enough is known about the likely accuracy of the estimatedsize of the breeding population in Alaska (Yukon River delta area) or about the efficiency and accu-racy of the aerial surveys on the wintering grounds to determine whether the population may be largerthan the current estimate of 50 000.
Bar-tailed Godwit Limosa lapponica
Population estimates % NorthAmericanrange inCanada
Current maximum count totalsBreedingstatus(Canada)
Abundancestatus(Canada)Code Global Neotropical
NorthAmerica Canada
PacificFlyway
InteriorFlyway
EasternFlyway
BTGO 1 345 000 100 000
The global population of the Bar-tailed Godwit, involving some 3–5 subspecies (del Hoyo et al.1996; Higgins and Davies 1996; Engelmoer and Roselaar 1998), is listed by Rose and Scott (1997) as1 345 000 (range 1 200 000–2 200 000). The population breeding in Alaska, L. l. baueri, which stagesin western and southwestern Alaska prior to migration to wintering grounds in New Zealand (Gill andMcCaffery 1999), has been estimated at 100 000 birds (Gill and McCaffery 1999; Riegen 1999; Sagaret al. 1999). The population of L. l. baueri wintering in Australasia, which has been estimated at330 000 birds (Watkins 1993, and pers. commun.; see also Rose and Scott 1997), is likely to includebirds breeding in eastern Siberia, which Engelmoer and Roselaar (1998) argued should be assigned toa new subspecies, L. l. anadyrensis.
Marbled Godwit Limosa fedoa
Population estimates % NorthAmericanrange inCanada
Current maximum count totalsBreedingstatus(Canada)
Abundancestatus(Canada)Code Global Neotropical
NorthAmerica Canada
PacificFlyway
InteriorFlyway
EasternFlyway
MAGO 171 500 171 500 103 000 59.6 36 000 58 700 1500 B Reg
The preliminary estimate of 10 000? by Morrison et al. (1994a) is much too low; a figure of atleast 173 500 is more realistic based on maximum counts during migration in North America, wintertotals, and estimates of isolated breeding populations. Three disjunct populations are found in NorthAmerica. The major part of the population breeds in the grasslands of the northern United States andsouthern Canada (L. f. fedoa), and smaller isolated populations nest in southwestern James Bay (L. f.fedoa) and southwestern Alaska (L. f. beringiae) (Gibson and Kessel 1989; Gratto-Trevor 2000).
Counts from the fall migration period include eastern USA 1500 (ISS), eastern Canada 3(MSS), Interior Flyway 58 700 (Skagen et al. 1999), and Pacific USA 34 400 (ISS), totalling 94 600.Spring numbers include eastern USA 800 (ISS), Interior Flyway 55 300 (Skagen et al. 1999), andPacific USA 36 000 (ISS), totalling 92 100. The relatively small numbers reported from Alaskaduring migration (fall 1450, spring 1910; Gill et al. 1999) are likely to be included in counts fromother regions. In Panama, some 700 Marbled Godwits were reported during aerial surveys in October1991 (Morrison et al. 1998), although the species was not noted during January (1993) and February(1988) surveys. Counts from wintering areas include eastern USA 300 (Harrington and Perry 1995),central USA 10 (Harrington and Perry 1995), western North America and Baja California 130 000(G.W. Page, unpubl. data), and Mexico (excluding Baja California) 22 800 (Morrison et al. 1992,1993, 1994c), totalling 153 110, indicating that the population is at least 160 000. Gratto-Trevor(2000) estimated the population range from wintering numbers as 140 000–200 000 based on thewestern North America (40 000) and Baja California (90 000) total of 130 000 (from G.W. Page,unpubl. data, as above) and a total of 11 000–37 000 for the remainder of Mexico derived from counts
30
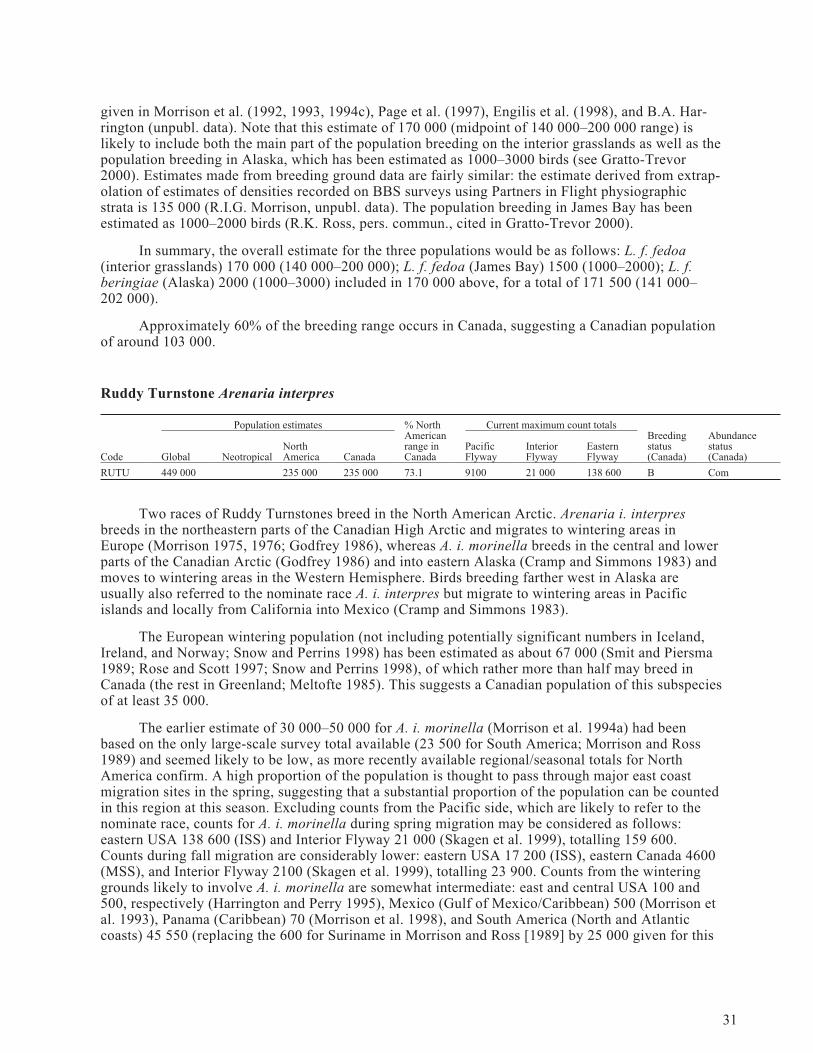
given in Morrison et al. (1992, 1993, 1994c), Page et al. (1997), Engilis et al. (1998), and B.A. Har-rington (unpubl. data). Note that this estimate of 170 000 (midpoint of 140 000–200 000 range) islikely to include both the main part of the population breeding on the interior grasslands as well as thepopulation breeding in Alaska, which has been estimated as 1000–3000 birds (see Gratto-Trevor2000). Estimates made from breeding ground data are fairly similar: the estimate derived from extrap-olation of estimates of densities recorded on BBS surveys using Partners in Flight physiographicstrata is 135 000 (R.I.G. Morrison, unpubl. data). The population breeding in James Bay has beenestimated as 1000–2000 birds (R.K. Ross, pers. commun., cited in Gratto-Trevor 2000).
In summary, the overall estimate for the three populations would be as follows: L. f. fedoa(interior grasslands) 170 000 (140 000–200 000); L. f. fedoa (James Bay) 1500 (1000–2000); L. f.beringiae (Alaska) 2000 (1000–3000) included in 170 000 above, for a total of 171 500 (141 000–202 000).
Approximately 60% of the breeding range occurs in Canada, suggesting a Canadian populationof around 103 000.
Ruddy Turnstone Arenaria interpres
Population estimates % NorthAmericanrange inCanada
Current maximum count totalsBreedingstatus(Canada)
Abundancestatus(Canada)Code Global Neotropical
NorthAmerica Canada
PacificFlyway
InteriorFlyway
EasternFlyway
RUTU 449 000 235 000 235 000 73.1 9100 21 000 138 600 B Com
Two races of Ruddy Turnstones breed in the North American Arctic. Arenaria i. interpresbreeds in the northeastern parts of the Canadian High Arctic and migrates to wintering areas inEurope (Morrison 1975, 1976; Godfrey 1986), whereas A. i. morinella breeds in the central and lowerparts of the Canadian Arctic (Godfrey 1986) and into eastern Alaska (Cramp and Simmons 1983) andmoves to wintering areas in the Western Hemisphere. Birds breeding farther west in Alaska areusually also referred to the nominate race A. i. interpres but migrate to wintering areas in Pacificislands and locally from California into Mexico (Cramp and Simmons 1983).
The European wintering population (not including potentially significant numbers in Iceland,Ireland, and Norway; Snow and Perrins 1998) has been estimated as about 67 000 (Smit and Piersma1989; Rose and Scott 1997; Snow and Perrins 1998), of which rather more than half may breed inCanada (the rest in Greenland; Meltofte 1985). This suggests a Canadian population of this subspeciesof at least 35 000.
The earlier estimate of 30 000–50 000 for A. i. morinella (Morrison et al. 1994a) had beenbased on the only large-scale survey total available (23 500 for South America; Morrison and Ross1989) and seemed likely to be low, as more recently available regional/seasonal totals for NorthAmerica confirm. A high proportion of the population is thought to pass through major east coastmigration sites in the spring, suggesting that a substantial proportion of the population can be countedin this region at this season. Excluding counts from the Pacific side, which are likely to refer to thenominate race, counts for A. i. morinella during spring migration may be considered as follows:eastern USA 138 600 (ISS) and Interior Flyway 21 000 (Skagen et al. 1999), totalling 159 600.Counts during fall migration are considerably lower: eastern USA 17 200 (ISS), eastern Canada 4600(MSS), and Interior Flyway 2100 (Skagen et al. 1999), totalling 23 900. Counts from the winteringgrounds likely to involve A. i. morinella are somewhat intermediate: east and central USA 100 and500, respectively (Harrington and Perry 1995), Mexico (Gulf of Mexico/Caribbean) 500 (Morrison etal. 1993), Panama (Caribbean) 70 (Morrison et al. 1998), and South America (North and Atlanticcoasts) 45 550 (replacing the 600 for Suriname in Morrison and Ross [1989] by 25 000 given for this
31

country by Scott and Carbonell [1986]), totalling 46 720. Extrapolated totals from five major breedingregions covering 116 170 km2 in the Canadian Arctic came to 86 900 (Morrison 1997). On the basisof the spring total, the Arctic estimate, and the fact that the species is widespread and common, itappears possible that the North American population of A. i. morinella may reach 180 000.
Counts from migration and wintering areas in the Western Hemisphere likely to involve thewestern populations of A. i. interpres (here taken simply as the birds counted on the Pacific coasts ofNorth, Central, and South America) are lower, as many of the breeding population move to islands inthe Pacific Ocean. Spring counts include Pacific USA 700 (ISS); fall counts include Pacific USA 500(ISS) and Alaska 8600 (Gill et al. 1999), totalling 9100 (note also the records of up to 10 000 turn-stones on southward migration through the Pribiloff Islands; Thompson 1973); and winter countsinclude Pacific USA 500 (Harrington and Perry 1995), Mexico (Pacific) 410 (Morrison et al. 1992,1994c), Panama (Pacific) 205 (Morrison et al. 1998), and South America (Pacific, although it is notclear whether these birds may be A. i. morinella) 2350 (Morrison and Ross 1989), totalling 3465. InAlaska, 11 200 were estimated to breed in the Northeast Alaska Lagoons area (Gill et al. 1999). Onthe basis of the breeding estimates and numbers recorded during fall migration, it seems likely that theAlaskan population of A. i. interpres may reach 20 000.
This would bring the global total for the species to 449 000, based on the ranges in Rose andScott (1997) and an adjusted total for the North American population of A. i. morinella.
Black Turnstone Arenaria melanocephala
Population estimates % NorthAmericanrange inCanada
Current maximum count totalsBreedingstatus(Canada)
Abundancestatus(Canada)Code Global Neotropical
NorthAmerica Canada
PacificFlyway
InteriorFlyway
EasternFlyway
BLTU 80 000 80 000 80 000 80 000 Com
Handel and Gill (1992) and Page and Gill (1994) provided a population estimate of61 000–99 000 (J. Trapp, pers. commun., cited in Rose and Scott 1997; given as 80 000 in the table)for this species. Gill et al. (1999) indicated that over 90% of the flyway population of the species(80 000) nests on the outer central Yukon-Kuskokwim Delta in Alaska. Spring and fall count datafrom Alaska total 29 240 and 835, respectively (Gill et al. 1999). Few other count data are available.Harrington and Perry (1995) reported totals of 300, 1200, and 600 for fall, winter, and spring Pacificcounts, respectively. Most of the population is likely to pass through Canada en route to morenortherly breeding grounds in Alaska; perhaps 10 000 winter on the Pacific coast of Canada (R.Butler, pers. commun.).
Surfbird Aphriza virgata
Population estimates % NorthAmericanrange inCanada
Current maximum count totalsBreedingstatus(Canada)
Abundancestatus(Canada)Code Global Neotropical
NorthAmerica Canada
PacificFlyway
InteriorFlyway
EasternFlyway
SURF 70 000 70 000 70 000 27.5 70 000 B Reg
The provisional estimate of 5000–10 000 (Morrison et al. 1994a) is too low. Few counts areavailable. Up to 56 000 were recorded in a single day in Prince William Sound, Alaska (P. Martin,pers. commun., cited in Senner and McCaffery 1997; see also Gill et al. 1999), to which may be added14 000 in Kachemak Bay, Alaska (Gill et al. 1999), for a spring total of some 70 000 (i.e., at the upperend of the estimate of 50 000–70 000 given by Page and Gill [1994]). Senner and McCaffery (1997)
32
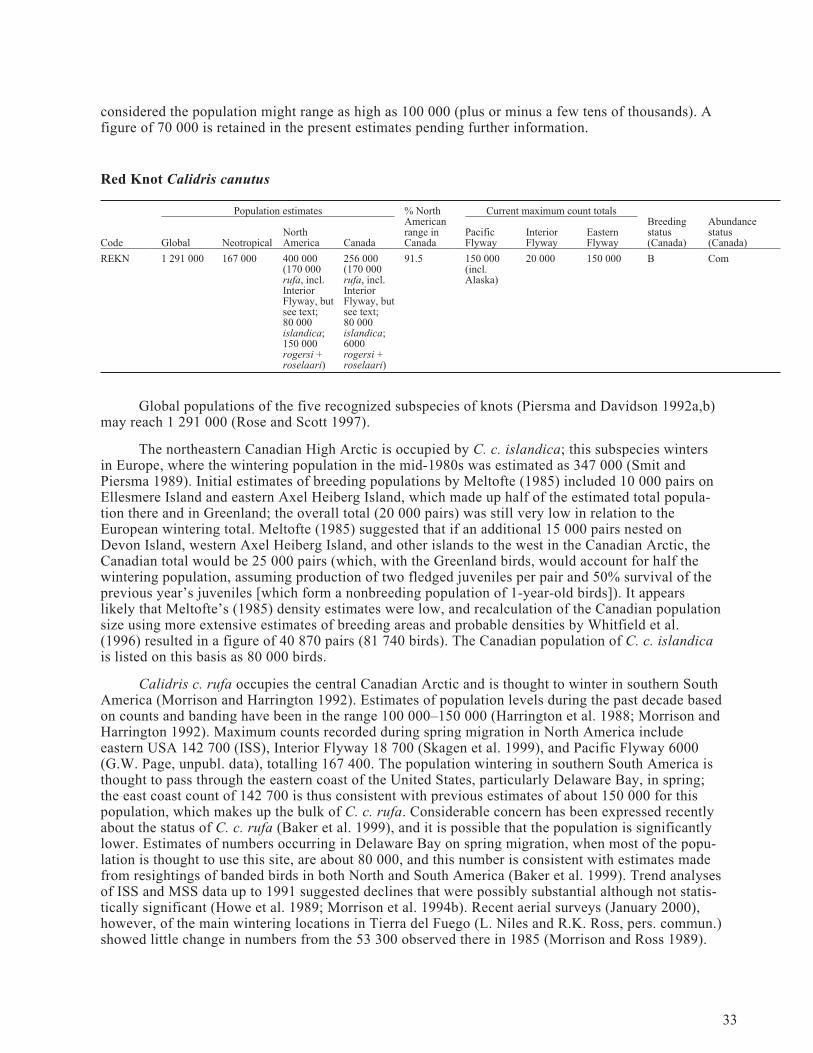
considered the population might range as high as 100 000 (plus or minus a few tens of thousands). Afigure of 70 000 is retained in the present estimates pending further information.
Red Knot Calidris canutus
Population estimates % NorthAmericanrange inCanada
Current maximum count totalsBreedingstatus(Canada)
Abundancestatus(Canada)Code Global Neotropical
NorthAmerica Canada
PacificFlyway
InteriorFlyway
EasternFlyway
REKN 1 291 000 167 000 400 000(170 000rufa, incl.InteriorFlyway, butsee text;80 000islandica;150 000rogersi +roselaari)
256 000(170 000rufa, incl.InteriorFlyway, butsee text;80 000islandica;6000rogersi +roselaari)
91.5 150 000(incl.Alaska)
20 000 150 000 B Com
Global populations of the five recognized subspecies of knots (Piersma and Davidson 1992a,b)may reach 1 291 000 (Rose and Scott 1997).
The northeastern Canadian High Arctic is occupied by C. c. islandica; this subspecies wintersin Europe, where the wintering population in the mid-1980s was estimated as 347 000 (Smit andPiersma 1989). Initial estimates of breeding populations by Meltofte (1985) included 10 000 pairs onEllesmere Island and eastern Axel Heiberg Island, which made up half of the estimated total popula-tion there and in Greenland; the overall total (20 000 pairs) was still very low in relation to theEuropean wintering total. Meltofte (1985) suggested that if an additional 15 000 pairs nested onDevon Island, western Axel Heiberg Island, and other islands to the west in the Canadian Arctic, theCanadian total would be 25 000 pairs (which, with the Greenland birds, would account for half thewintering population, assuming production of two fledged juveniles per pair and 50% survival of theprevious year’s juveniles [which form a nonbreeding population of 1-year-old birds]). It appearslikely that Meltofte’s (1985) density estimates were low, and recalculation of the Canadian populationsize using more extensive estimates of breeding areas and probable densities by Whitfield et al.(1996) resulted in a figure of 40 870 pairs (81 740 birds). The Canadian population of C. c. islandicais listed on this basis as 80 000 birds.
Calidris c. rufa occupies the central Canadian Arctic and is thought to winter in southern SouthAmerica (Morrison and Harrington 1992). Estimates of population levels during the past decade basedon counts and banding have been in the range 100 000–150 000 (Harrington et al. 1988; Morrison andHarrington 1992). Maximum counts recorded during spring migration in North America includeeastern USA 142 700 (ISS), Interior Flyway 18 700 (Skagen et al. 1999), and Pacific Flyway 6000(G.W. Page, unpubl. data), totalling 167 400. The population wintering in southern South America isthought to pass through the eastern coast of the United States, particularly Delaware Bay, in spring;the east coast count of 142 700 is thus consistent with previous estimates of about 150 000 for thispopulation, which makes up the bulk of C. c. rufa. Considerable concern has been expressed recentlyabout the status of C. c. rufa (Baker et al. 1999), and it is possible that the population is significantlylower. Estimates of numbers occurring in Delaware Bay on spring migration, when most of the popu-lation is thought to use this site, are about 80 000, and this number is consistent with estimates madefrom resightings of banded birds in both North and South America (Baker et al. 1999). Trend analysesof ISS and MSS data up to 1991 suggested declines that were possibly substantial although not statis-tically significant (Howe et al. 1989; Morrison et al. 1994b). Recent aerial surveys (January 2000),however, of the main wintering locations in Tierra del Fuego (L. Niles and R.K. Ross, pers. commun.)showed little change in numbers from the 53 300 observed there in 1985 (Morrison and Ross 1989).
33

The subspecific status of populations passing through midcontinental North America is lesscertain. These knots may consist of birds wintering from Florida through the north coast of SouthAmerica, and the spring sum of 19 000 for the central United States is consistent with counts ofwintering birds from these areas (about 20 000; Morrison and Harrington 1992; Piersma and Davidson1992a).
Less is known about populations wintering on and moving along the Pacific coast of NorthAmerica and Mexico (and how they relate to knots found in Alaska). G.W. Page (unpubl. data)estimates that 6000 Red Knots are found on the Pacific coasts of the United States and Baja Californiain spring. In Alaska, a maximum count of 40 000 was recorded on the Copper River delta in May1975, and up to 100 000 are thought to use the area (Kessel and Gibson 1978; Islieb 1979; Kessel1989). Gill and Handel (1990) reported flocks totalling 110 000 on the central Yukon-KuskokwimDelta in spring 1980. Maximum count totals in Alaska in spring thus reach 150 000 knots. Thebreeding origins and wintering destinations of these birds are not clear and their subspecific statusremains uncertain, but they presumably belong to the rogersi or roselaari groups (Gill and Handel1990; Piersma and Davidson 1992a; Gill et al. 1994). It is likely that they involve birds wintering inAustralasia and other parts of the Pacific, possibly including the Pacific coast of the Americas.
Numbers occurring in different regions of North America may be summarized as follows on thebasis of spring counts and breeding estimates: northeastern Canadian High Arctic 80 000 (C. c.islandica), eastern North America 150 000 (C. c. rufa; possibly fewer, see above), central NorthAmerica 20 000 (?), Alaska 150 000 (C. c. rogersi/C. c. roselaari) (includes the Pacific 6000) (total400 000).
Sanderling Calidris alba
Population estimates % NorthAmericanrange inCanada
Current maximum count totalsBreedingstatus(Canada)
Abundancestatus(Canada)Code Global Neotropical
NorthAmerica Canada
PacificFlyway
InteriorFlyway
EasternFlyway
SAND 643 000 112 000+ 300 000 300 000 97.8 50 000 130 400 115 900 B Com
The previous estimate for the North American population (111 800; Morrison et al. 1994a) wasbased on the wintering total recorded by Morrison and Ross (1989) for South America alone and istherefore likely to be too low. Counts are now available for other wintering areas and migration sites,and these suggest that a total nearer 300 000 would be more appropriate. Counts from wintering areasnow include eastern USA 14 500 (Harrington and Page 1992), central USA 100 000 (Harrington andPage 1992), Pacific USA 9900 (Harrington and Perry 1995), Mexico 22 900 (Morrison et al. 1992,1993, 1994c), Panama 1000 (Morrison et al. 1998), and South America 111 800 (Morrison and Ross1989), for a total of 260 100. Counts at migration areas in North America are also substantial andproduce totals over 200 000. Fall counts include eastern USA 99 000 (ISS), eastern Canada 16 900(MSS), central USA 100 000 (Harrington and Page 1992), and western North America 50 000 (G.W.Page, unpubl. data), totalling 265 900. Spring counts include eastern USA 68 000 (ISS), InteriorFlyway 130 400 (Skagen et al. 1999), and Pacific USA 5100 (ISS), totalling 203 500. Estimates ofnumbers from three areas in the Canadian Arctic covering some 96 380 km2 totalled 136 800(Morrison 1997).
Sanderlings breeding in the northeastern Canadian High Arctic are thought to migrate to Europefor the winter (Morrison 1992); no numerical estimates are available for this segment of thepopulation.
The global total for the five populations listed in Rose and Scott (1997) may be adjusted from493 000 to 643 000 on the basis of the increased Nearctic population estimate.
34
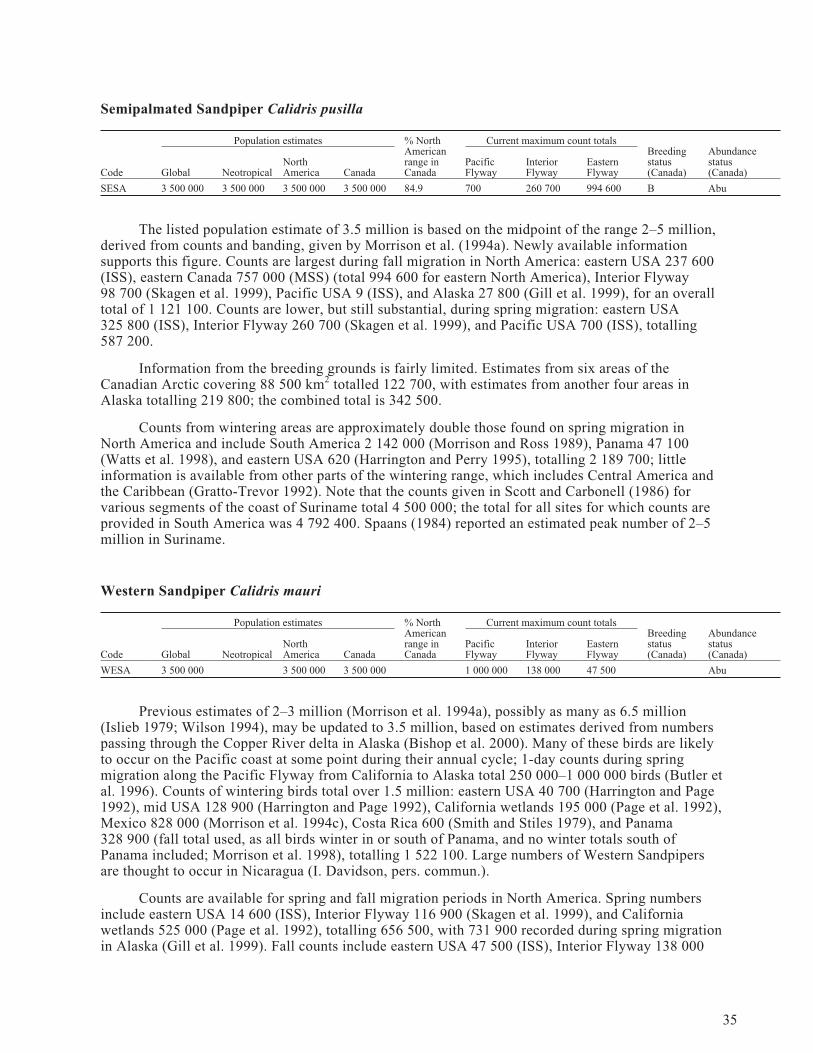
Semipalmated Sandpiper Calidris pusilla
Population estimates % NorthAmericanrange inCanada
Current maximum count totalsBreedingstatus(Canada)
Abundancestatus(Canada)Code Global Neotropical
NorthAmerica Canada
PacificFlyway
InteriorFlyway
EasternFlyway
SESA 3 500 000 3 500 000 3 500 000 3 500 000 84.9 700 260 700 994 600 B Abu
The listed population estimate of 3.5 million is based on the midpoint of the range 2–5 million,derived from counts and banding, given by Morrison et al. (1994a). Newly available informationsupports this figure. Counts are largest during fall migration in North America: eastern USA 237 600(ISS), eastern Canada 757 000 (MSS) (total 994 600 for eastern North America), Interior Flyway98 700 (Skagen et al. 1999), Pacific USA 9 (ISS), and Alaska 27 800 (Gill et al. 1999), for an overalltotal of 1 121 100. Counts are lower, but still substantial, during spring migration: eastern USA325 800 (ISS), Interior Flyway 260 700 (Skagen et al. 1999), and Pacific USA 700 (ISS), totalling587 200.
Information from the breeding grounds is fairly limited. Estimates from six areas of theCanadian Arctic covering 88 500 km2 totalled 122 700, with estimates from another four areas inAlaska totalling 219 800; the combined total is 342 500.
Counts from wintering areas are approximately double those found on spring migration inNorth America and include South America 2 142 000 (Morrison and Ross 1989), Panama 47 100(Watts et al. 1998), and eastern USA 620 (Harrington and Perry 1995), totalling 2 189 700; littleinformation is available from other parts of the wintering range, which includes Central America andthe Caribbean (Gratto-Trevor 1992). Note that the counts given in Scott and Carbonell (1986) forvarious segments of the coast of Suriname total 4 500 000; the total for all sites for which counts areprovided in South America was 4 792 400. Spaans (1984) reported an estimated peak number of 2–5million in Suriname.
Western Sandpiper Calidris mauri
Population estimates % NorthAmericanrange inCanada
Current maximum count totalsBreedingstatus(Canada)
Abundancestatus(Canada)Code Global Neotropical
NorthAmerica Canada
PacificFlyway
InteriorFlyway
EasternFlyway
WESA 3 500 000 3 500 000 3 500 000 1 000 000 138 000 47 500 Abu
Previous estimates of 2–3 million (Morrison et al. 1994a), possibly as many as 6.5 million(Islieb 1979; Wilson 1994), may be updated to 3.5 million, based on estimates derived from numberspassing through the Copper River delta in Alaska (Bishop et al. 2000). Many of these birds are likelyto occur on the Pacific coast at some point during their annual cycle; 1-day counts during springmigration along the Pacific Flyway from California to Alaska total 250 000–1 000 000 birds (Butler etal. 1996). Counts of wintering birds total over 1.5 million: eastern USA 40 700 (Harrington and Page1992), mid USA 128 900 (Harrington and Page 1992), California wetlands 195 000 (Page et al. 1992),Mexico 828 000 (Morrison et al. 1994c), Costa Rica 600 (Smith and Stiles 1979), and Panama328 900 (fall total used, as all birds winter in or south of Panama, and no winter totals south ofPanama included; Morrison et al. 1998), totalling 1 522 100. Large numbers of Western Sandpipersare thought to occur in Nicaragua (I. Davidson, pers. commun.).
Counts are available for spring and fall migration periods in North America. Spring numbersinclude eastern USA 14 600 (ISS), Interior Flyway 116 900 (Skagen et al. 1999), and Californiawetlands 525 000 (Page et al. 1992), totalling 656 500, with 731 900 recorded during spring migrationin Alaska (Gill et al. 1999). Fall counts include eastern USA 47 500 (ISS), Interior Flyway 138 000
35

(Skagen et al. 1999), and California wetlands 285 000 (Page et al. 1992), totalling 470 500, with249 500 from Alaska (Gill et al. 1999). Butler et al. (1987) estimated that up to 2.4 million may passthrough British Columbia on fall migration.
Least Sandpiper Calidris minutilla
Population estimates % NorthAmericanrange inCanada
Current maximum count totalsBreedingstatus(Canada)
Abundancestatus(Canada)Code Global Neotropical
NorthAmerica Canada
PacificFlyway
InteriorFlyway
EasternFlyway
LESA 600 000 600 000 600 000 70.7 150 000 322 700 101 900 B Com
Earlier estimates include 50 000–100 000 for Canada by Morrison et al. (1994a) and range C/D(25 000–100 000/100 000–1 000 000) by Rose and Scott (1997). It would now appear that the popula-tion is at least 600 000, perhaps considerably more (i.e., in the range suggested by Rose and Scott[1997]), as indicated by fall counts in North America: eastern USA 70 900 (ISS), eastern Canada31 000 (MSS), Interior Flyway 322 700 (Harrington and Page 1992), and western USA and Baja Cali-fornia 150 000 (G.W. Page, unpubl. data), totalling 574 600 (a further 11 000 were reported fromAlaska by Gill et al. [1999]). Spring counts are generally lower: eastern USA 37 700 (ISS), centralUSA 124 600 (Harrington and Page 1992), and Pacific (California wetlands) 48 000 (Page et al.1992), totalling 210 300. Few estimates are available from wintering areas. Aerial surveys may missthe species where it occurs with flocks of other peeps or occurs in habitats away from coastlines; thespecies is also difficult to census from the ground owing to its similarity to other small sandpipers(Cooper 1994). Counts provided for sites in Suriname and Venezuela by Scott and Carbonell (1986)total 41 000, and Spaans (1978) estimated 50 000–100 000 in Suriname. Least Sandpipers presumablymake up a significant, but unknown, proportion of the estimated 2.1 million small sandpipers on thenorth coast of South America (Morrison and Ross 1989; Cooper 1994).
White-rumped Sandpiper Calidris fuscicollis
Population estimates % NorthAmericanrange inCanada
Current maximum count totalsBreedingstatus(Canada)
Abundancestatus(Canada)Code Global Neotropical
NorthAmerica Canada
PacificFlyway
InteriorFlyway
EasternFlyway
WRSA 400 000 400 000 400 000 400 000 95.7 343 300 23 300 B Com
Previous estimates (50 000+ for Canadian population: Morrison et al. 1994a; 73 000 for SouthAmerica wintering population: Morrison and Ross 1989) were based on few data and were clearly toolow. New information, particularly from the Interior Flyway, has improved the number of dataavailable considerably, and an estimate of 400 000 is suggested based on spring counts in NorthAmerica and estimates from Canadian Arctic breeding areas. The species has a pronounced ellipticalmigration pattern (see Parmelee 1992), passing northward in large numbers through interior sites inthe spring and returning south through the east coast at points north of the Bay of Fundy in the fall,where few counts are conducted. Spring counts include 6900 eastern USA (Harrington and Perry1995) and 343 300 Interior Flyway (Skagen et al. 1999), with none reported from the Pacific coast(ISS), totalling 350 200. Fall totals are rather lower: eastern USA 3400 (ISS), Maritime provinces ofCanada 9900 (MSS), Magdalen Islands 10 000 (Hagar 1956), and Interior Flyway 5200 (Skagen et al.1999), with none reported from the Pacific coast (ISS), totalling 28 500.
The highest regional population estimate currently comes from the Arctic, where totals fromfive areas covering some 116 170 km2 came to 365 700 (Morrison 1997). This estimate and the springcount total suggest the population could number 400 000, probably more.
36
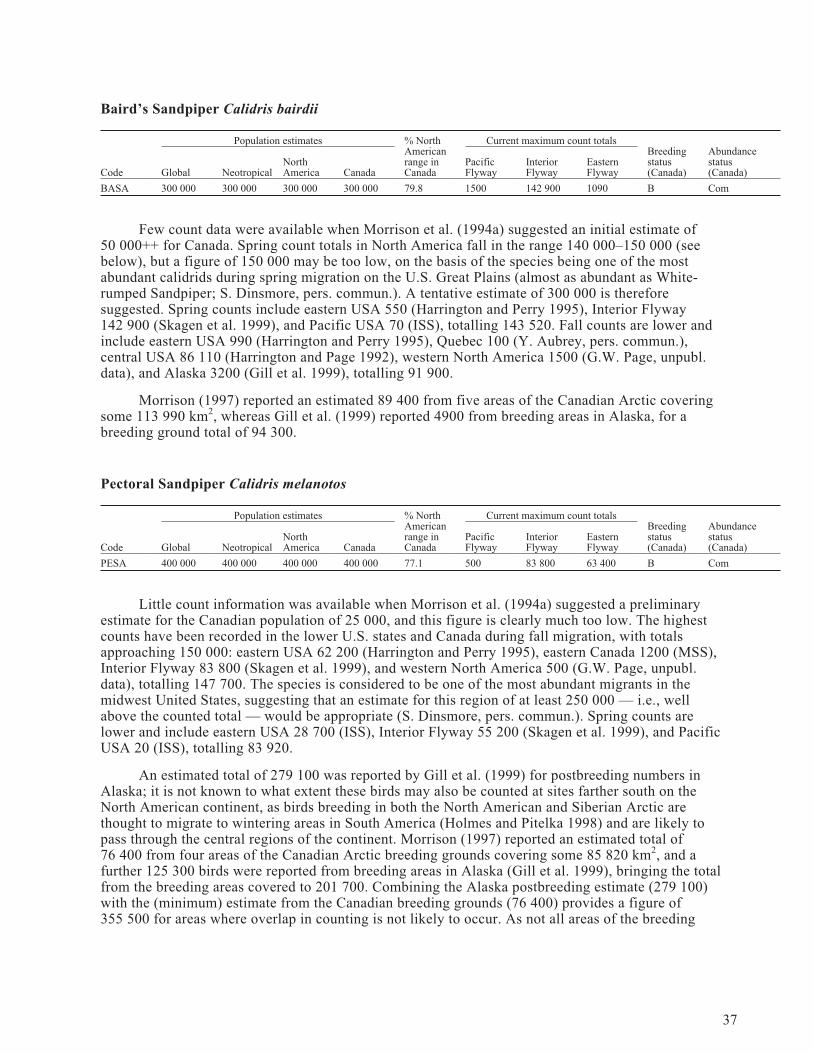
Baird’s Sandpiper Calidris bairdii
Population estimates % NorthAmericanrange inCanada
Current maximum count totalsBreedingstatus(Canada)
Abundancestatus(Canada)Code Global Neotropical
NorthAmerica Canada
PacificFlyway
InteriorFlyway
EasternFlyway
BASA 300 000 300 000 300 000 300 000 79.8 1500 142 900 1090 B Com
Few count data were available when Morrison et al. (1994a) suggested an initial estimate of50 000++ for Canada. Spring count totals in North America fall in the range 140 000–150 000 (seebelow), but a figure of 150 000 may be too low, on the basis of the species being one of the mostabundant calidrids during spring migration on the U.S. Great Plains (almost as abundant as White-rumped Sandpiper; S. Dinsmore, pers. commun.). A tentative estimate of 300 000 is thereforesuggested. Spring counts include eastern USA 550 (Harrington and Perry 1995), Interior Flyway142 900 (Skagen et al. 1999), and Pacific USA 70 (ISS), totalling 143 520. Fall counts are lower andinclude eastern USA 990 (Harrington and Perry 1995), Quebec 100 (Y. Aubrey, pers. commun.),central USA 86 110 (Harrington and Page 1992), western North America 1500 (G.W. Page, unpubl.data), and Alaska 3200 (Gill et al. 1999), totalling 91 900.
Morrison (1997) reported an estimated 89 400 from five areas of the Canadian Arctic coveringsome 113 990 km2, whereas Gill et al. (1999) reported 4900 from breeding areas in Alaska, for abreeding ground total of 94 300.
Pectoral Sandpiper Calidris melanotos
Population estimates % NorthAmericanrange inCanada
Current maximum count totalsBreedingstatus(Canada)
Abundancestatus(Canada)Code Global Neotropical
NorthAmerica Canada
PacificFlyway
InteriorFlyway
EasternFlyway
PESA 400 000 400 000 400 000 400 000 77.1 500 83 800 63 400 B Com
Little count information was available when Morrison et al. (1994a) suggested a preliminaryestimate for the Canadian population of 25 000, and this figure is clearly much too low. The highestcounts have been recorded in the lower U.S. states and Canada during fall migration, with totalsapproaching 150 000: eastern USA 62 200 (Harrington and Perry 1995), eastern Canada 1200 (MSS),Interior Flyway 83 800 (Skagen et al. 1999), and western North America 500 (G.W. Page, unpubl.data), totalling 147 700. The species is considered to be one of the most abundant migrants in themidwest United States, suggesting that an estimate for this region of at least 250 000 — i.e., wellabove the counted total — would be appropriate (S. Dinsmore, pers. commun.). Spring counts arelower and include eastern USA 28 700 (ISS), Interior Flyway 55 200 (Skagen et al. 1999), and PacificUSA 20 (ISS), totalling 83 920.
An estimated total of 279 100 was reported by Gill et al. (1999) for postbreeding numbers inAlaska; it is not known to what extent these birds may also be counted at sites farther south on theNorth American continent, as birds breeding in both the North American and Siberian Arctic arethought to migrate to wintering areas in South America (Holmes and Pitelka 1998) and are likely topass through the central regions of the continent. Morrison (1997) reported an estimated total of76 400 from four areas of the Canadian Arctic breeding grounds covering some 85 820 km2, and afurther 125 300 birds were reported from breeding areas in Alaska (Gill et al. 1999), bringing the totalfrom the breeding areas covered to 201 700. Combining the Alaska postbreeding estimate (279 100)with the (minimum) estimate from the Canadian breeding grounds (76 400) provides a figure of355 500 for areas where overlap in counting is not likely to occur. As not all areas of the breeding
37
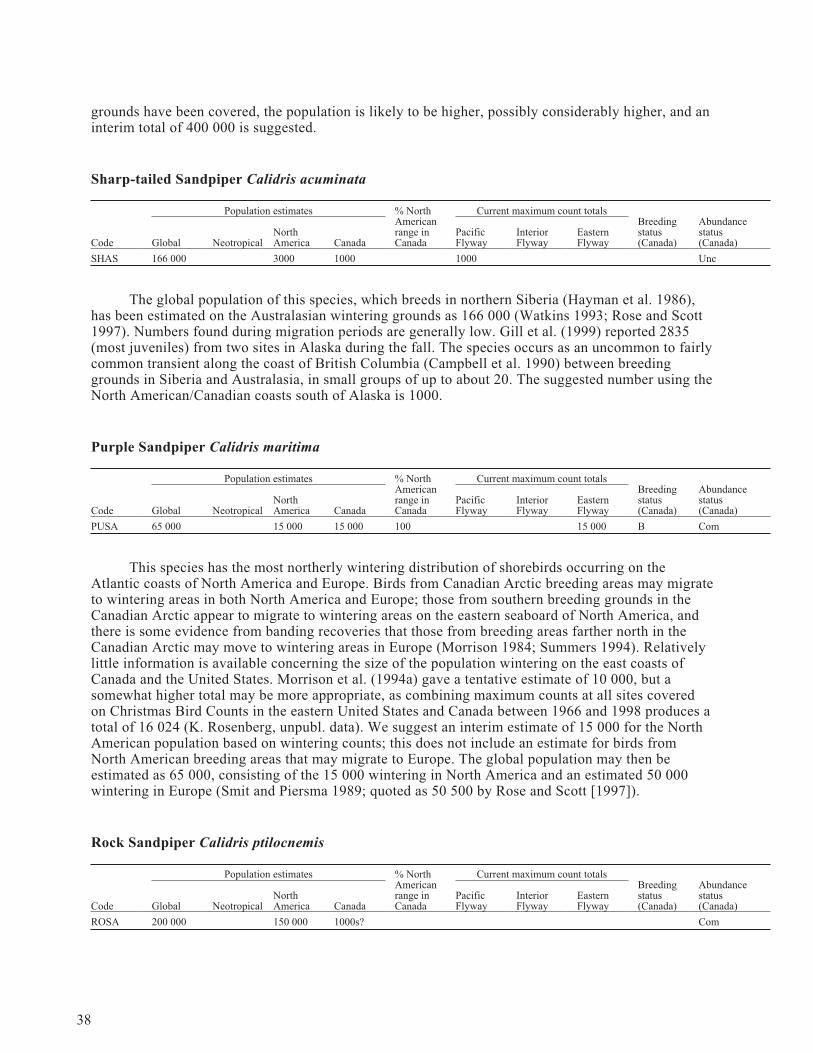
grounds have been covered, the population is likely to be higher, possibly considerably higher, and aninterim total of 400 000 is suggested.
Sharp-tailed Sandpiper Calidris acuminata
Population estimates % NorthAmericanrange inCanada
Current maximum count totalsBreedingstatus(Canada)
Abundancestatus(Canada)Code Global Neotropical
NorthAmerica Canada
PacificFlyway
InteriorFlyway
EasternFlyway
SHAS 166 000 3000 1000 1000 Unc
The global population of this species, which breeds in northern Siberia (Hayman et al. 1986),has been estimated on the Australasian wintering grounds as 166 000 (Watkins 1993; Rose and Scott1997). Numbers found during migration periods are generally low. Gill et al. (1999) reported 2835(most juveniles) from two sites in Alaska during the fall. The species occurs as an uncommon to fairlycommon transient along the coast of British Columbia (Campbell et al. 1990) between breedinggrounds in Siberia and Australasia, in small groups of up to about 20. The suggested number using theNorth American/Canadian coasts south of Alaska is 1000.
Purple Sandpiper Calidris maritima
Population estimates % NorthAmericanrange inCanada
Current maximum count totalsBreedingstatus(Canada)
Abundancestatus(Canada)Code Global Neotropical
NorthAmerica Canada
PacificFlyway
InteriorFlyway
EasternFlyway
PUSA 65 000 15 000 15 000 100 15 000 B Com
This species has the most northerly wintering distribution of shorebirds occurring on theAtlantic coasts of North America and Europe. Birds from Canadian Arctic breeding areas may migrateto wintering areas in both North America and Europe; those from southern breeding grounds in theCanadian Arctic appear to migrate to wintering areas on the eastern seaboard of North America, andthere is some evidence from banding recoveries that those from breeding areas farther north in theCanadian Arctic may move to wintering areas in Europe (Morrison 1984; Summers 1994). Relativelylittle information is available concerning the size of the population wintering on the east coasts ofCanada and the United States. Morrison et al. (1994a) gave a tentative estimate of 10 000, but asomewhat higher total may be more appropriate, as combining maximum counts at all sites coveredon Christmas Bird Counts in the eastern United States and Canada between 1966 and 1998 produces atotal of 16 024 (K. Rosenberg, unpubl. data). We suggest an interim estimate of 15 000 for the NorthAmerican population based on wintering counts; this does not include an estimate for birds fromNorth American breeding areas that may migrate to Europe. The global population may then beestimated as 65 000, consisting of the 15 000 wintering in North America and an estimated 50 000wintering in Europe (Smit and Piersma 1989; quoted as 50 500 by Rose and Scott [1997]).
Rock Sandpiper Calidris ptilocnemis
Population estimates % NorthAmericanrange inCanada
Current maximum count totalsBreedingstatus(Canada)
Abundancestatus(Canada)Code Global Neotropical
NorthAmerica Canada
PacificFlyway
InteriorFlyway
EasternFlyway
ROSA 200 000 150 000 1000s? Com
38
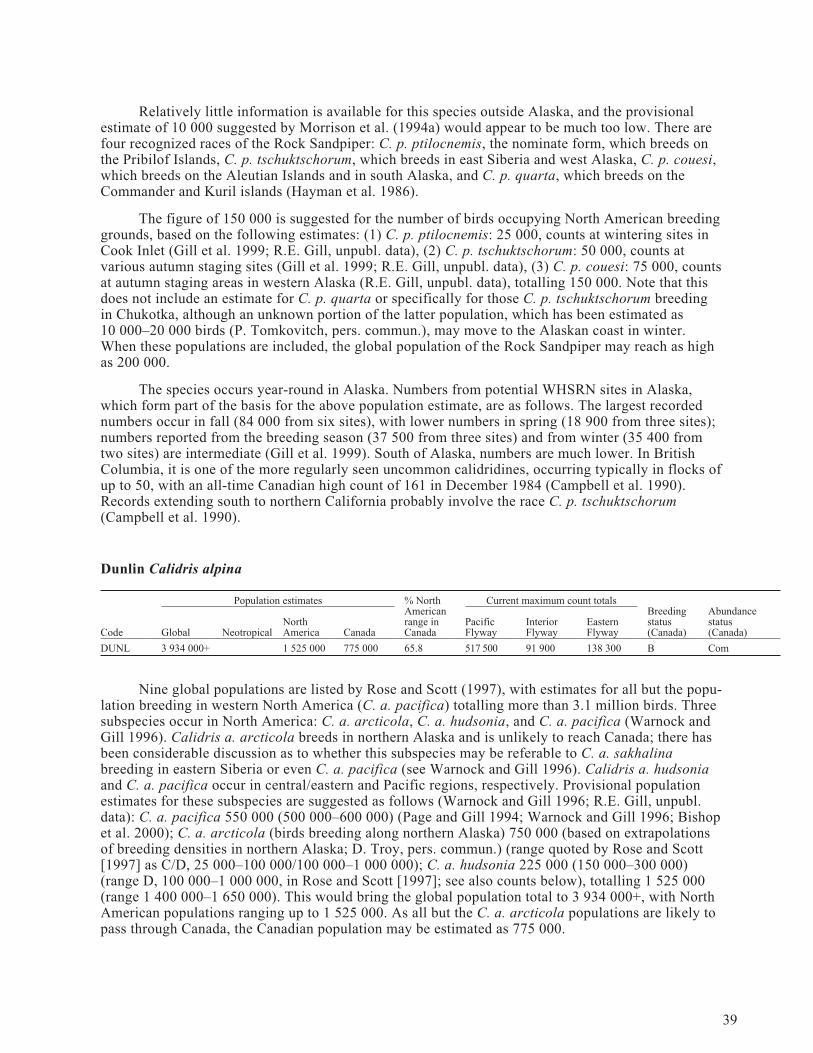
Relatively little information is available for this species outside Alaska, and the provisionalestimate of 10 000 suggested by Morrison et al. (1994a) would appear to be much too low. There arefour recognized races of the Rock Sandpiper: C. p. ptilocnemis, the nominate form, which breeds onthe Pribilof Islands, C. p. tschuktschorum, which breeds in east Siberia and west Alaska, C. p. couesi,which breeds on the Aleutian Islands and in south Alaska, and C. p. quarta, which breeds on theCommander and Kuril islands (Hayman et al. 1986).
The figure of 150 000 is suggested for the number of birds occupying North American breedinggrounds, based on the following estimates: (1) C. p. ptilocnemis: 25 000, counts at wintering sites inCook Inlet (Gill et al. 1999; R.E. Gill, unpubl. data), (2) C. p. tschuktschorum: 50 000, counts atvarious autumn staging sites (Gill et al. 1999; R.E. Gill, unpubl. data), (3) C. p. couesi: 75 000, countsat autumn staging areas in western Alaska (R.E. Gill, unpubl. data), totalling 150 000. Note that thisdoes not include an estimate for C. p. quarta or specifically for those C. p. tschuktschorum breedingin Chukotka, although an unknown portion of the latter population, which has been estimated as10 000–20 000 birds (P. Tomkovitch, pers. commun.), may move to the Alaskan coast in winter.When these populations are included, the global population of the Rock Sandpiper may reach as highas 200 000.
The species occurs year-round in Alaska. Numbers from potential WHSRN sites in Alaska,which form part of the basis for the above population estimate, are as follows. The largest recordednumbers occur in fall (84 000 from six sites), with lower numbers in spring (18 900 from three sites);numbers reported from the breeding season (37 500 from three sites) and from winter (35 400 fromtwo sites) are intermediate (Gill et al. 1999). South of Alaska, numbers are much lower. In BritishColumbia, it is one of the more regularly seen uncommon calidridines, occurring typically in flocks ofup to 50, with an all-time Canadian high count of 161 in December 1984 (Campbell et al. 1990).Records extending south to northern California probably involve the race C. p. tschuktschorum(Campbell et al. 1990).
Dunlin Calidris alpina
Population estimates % NorthAmericanrange inCanada
Current maximum count totalsBreedingstatus(Canada)
Abundancestatus(Canada)Code Global Neotropical
NorthAmerica Canada
PacificFlyway
InteriorFlyway
EasternFlyway
DUNL 3 934 000+ 1 525 000 775 000 65.8 517 500 91 900 138 300 B Com
Nine global populations are listed by Rose and Scott (1997), with estimates for all but the popu-lation breeding in western North America (C. a. pacifica) totalling more than 3.1 million birds. Threesubspecies occur in North America: C. a. arcticola, C. a. hudsonia, and C. a. pacifica (Warnock andGill 1996). Calidris a. arcticola breeds in northern Alaska and is unlikely to reach Canada; there hasbeen considerable discussion as to whether this subspecies may be referable to C. a. sakhalinabreeding in eastern Siberia or even C. a. pacifica (see Warnock and Gill 1996). Calidris a. hudsoniaand C. a. pacifica occur in central/eastern and Pacific regions, respectively. Provisional populationestimates for these subspecies are suggested as follows (Warnock and Gill 1996; R.E. Gill, unpubl.data): C. a. pacifica 550 000 (500 000–600 000) (Page and Gill 1994; Warnock and Gill 1996; Bishopet al. 2000); C. a. arcticola (birds breeding along northern Alaska) 750 000 (based on extrapolationsof breeding densities in northern Alaska; D. Troy, pers. commun.) (range quoted by Rose and Scott[1997] as C/D, 25 000–100 000/100 000–1 000 000); C. a. hudsonia 225 000 (150 000–300 000)(range D, 100 000–1 000 000, in Rose and Scott [1997]; see also counts below), totalling 1 525 000(range 1 400 000–1 650 000). This would bring the global population total to 3 934 000+, with NorthAmerican populations ranging up to 1 525 000. As all but the C. a. arcticola populations are likely topass through Canada, the Canadian population may be estimated as 775 000.
39
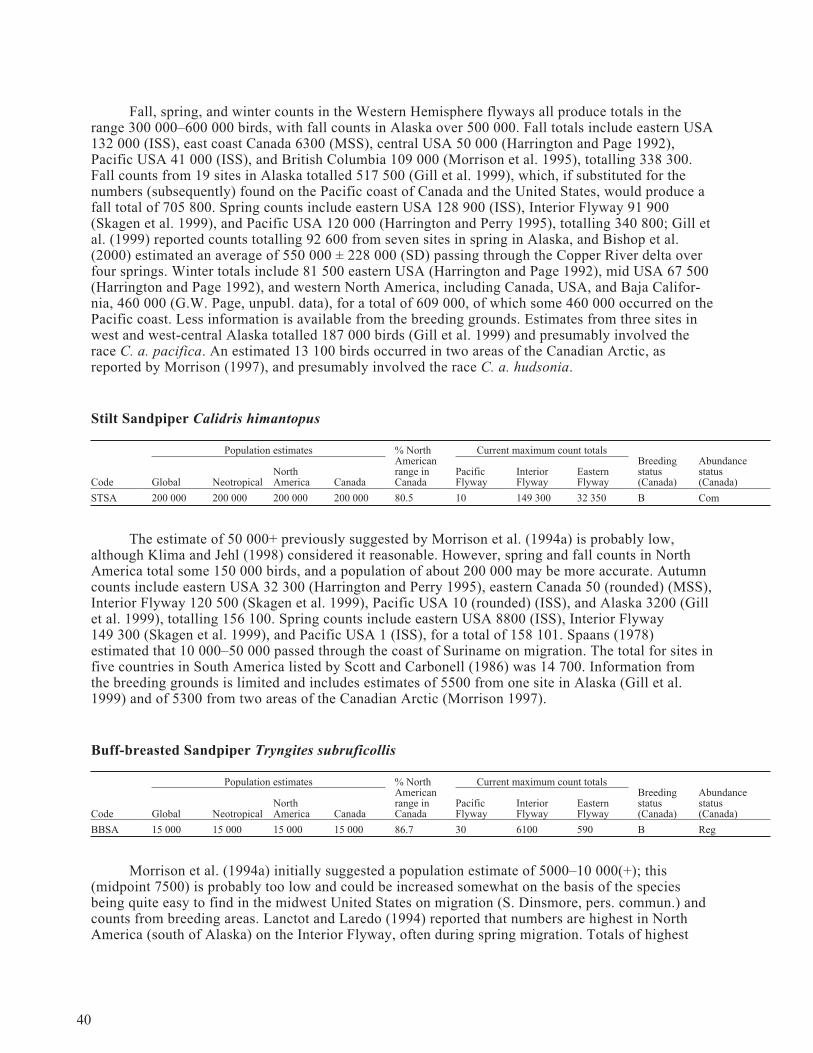
Fall, spring, and winter counts in the Western Hemisphere flyways all produce totals in therange 300 000–600 000 birds, with fall counts in Alaska over 500 000. Fall totals include eastern USA132 000 (ISS), east coast Canada 6300 (MSS), central USA 50 000 (Harrington and Page 1992),Pacific USA 41 000 (ISS), and British Columbia 109 000 (Morrison et al. 1995), totalling 338 300.Fall counts from 19 sites in Alaska totalled 517 500 (Gill et al. 1999), which, if substituted for thenumbers (subsequently) found on the Pacific coast of Canada and the United States, would produce afall total of 705 800. Spring counts include eastern USA 128 900 (ISS), Interior Flyway 91 900(Skagen et al. 1999), and Pacific USA 120 000 (Harrington and Perry 1995), totalling 340 800; Gill etal. (1999) reported counts totalling 92 600 from seven sites in spring in Alaska, and Bishop et al.(2000) estimated an average of 550 000 ± 228 000 (SD) passing through the Copper River delta overfour springs. Winter totals include 81 500 eastern USA (Harrington and Page 1992), mid USA 67 500(Harrington and Page 1992), and western North America, including Canada, USA, and Baja Califor-nia, 460 000 (G.W. Page, unpubl. data), for a total of 609 000, of which some 460 000 occurred on thePacific coast. Less information is available from the breeding grounds. Estimates from three sites inwest and west-central Alaska totalled 187 000 birds (Gill et al. 1999) and presumably involved therace C. a. pacifica. An estimated 13 100 birds occurred in two areas of the Canadian Arctic, asreported by Morrison (1997), and presumably involved the race C. a. hudsonia.
Stilt Sandpiper Calidris himantopus
Population estimates % NorthAmericanrange inCanada
Current maximum count totalsBreedingstatus(Canada)
Abundancestatus(Canada)Code Global Neotropical
NorthAmerica Canada
PacificFlyway
InteriorFlyway
EasternFlyway
STSA 200 000 200 000 200 000 200 000 80.5 10 149 300 32 350 B Com
The estimate of 50 000+ previously suggested by Morrison et al. (1994a) is probably low,although Klima and Jehl (1998) considered it reasonable. However, spring and fall counts in NorthAmerica total some 150 000 birds, and a population of about 200 000 may be more accurate. Autumncounts include eastern USA 32 300 (Harrington and Perry 1995), eastern Canada 50 (rounded) (MSS),Interior Flyway 120 500 (Skagen et al. 1999), Pacific USA 10 (rounded) (ISS), and Alaska 3200 (Gillet al. 1999), totalling 156 100. Spring counts include eastern USA 8800 (ISS), Interior Flyway149 300 (Skagen et al. 1999), and Pacific USA 1 (ISS), for a total of 158 101. Spaans (1978)estimated that 10 000–50 000 passed through the coast of Suriname on migration. The total for sites infive countries in South America listed by Scott and Carbonell (1986) was 14 700. Information fromthe breeding grounds is limited and includes estimates of 5500 from one site in Alaska (Gill et al.1999) and of 5300 from two areas of the Canadian Arctic (Morrison 1997).
Buff-breasted Sandpiper Tryngites subruficollis
Population estimates % NorthAmericanrange inCanada
Current maximum count totalsBreedingstatus(Canada)
Abundancestatus(Canada)Code Global Neotropical
NorthAmerica Canada
PacificFlyway
InteriorFlyway
EasternFlyway
BBSA 15 000 15 000 15 000 15 000 86.7 30 6100 590 B Reg
Morrison et al. (1994a) initially suggested a population estimate of 5000–10 000(+); this(midpoint 7500) is probably too low and could be increased somewhat on the basis of the speciesbeing quite easy to find in the midwest United States on migration (S. Dinsmore, pers. commun.) andcounts from breeding areas. Lanctot and Laredo (1994) reported that numbers are highest in NorthAmerica (south of Alaska) on the Interior Flyway, often during spring migration. Totals of highest
40

counts during spring include eastern USA 321 (ISS), Interior Flyway 6142 (Skagen et al. 1999, withrevisions from Lanctot and Laredo [1994] for Beaverhill Lake, Alberta, and Saskatchewan [netincrease of 3300 birds]), and Pacific USA 0 (ISS), for a total of 6463. Fall totals include eastern USA553 (ISS), eastern Canada 33 (MSS), Interior Flyway 3747 (Skagen et al. 1999), Pacific USA 29(ISS), and Alaska 5200 (Gill et al. 1999), totalling 9562. On the breeding grounds in the CanadianArctic, 6560 birds were estimated in two breeding areas covering some 73 560 km2 (Morrison 1997),and 14 000 were estimated to breed in the Northeast Alaska Lagoons (Gill et al. 1999), for a total of20 560. On the wintering grounds, up to 2000 were considered to be present at one estancia inArgentina in Buenos Aires Province (Myers 1980), and Blanco et al. (1993) reported 899 on over11 500 km of (mostly road) surveys in Uruguay and Argentina. Counts during more recent winteringground surveys in Argentina, Uruguay, and southern Brazil (December 1999) totalled 1800 birds, andassociated remote sensing/geographic information system (GIS) studies have suggested a morerestricted wintering range than previously thought (R.B. Lanctot, pers. commun.). Given the relativeperceived scarcity of the species, its tendency to occur in small concentrations, uncertainties concern-ing extrapolations on the breeding grounds (for a species that tends to form “exploded leks”; Myers1979; Lanctot and Laredo 1994), and the fact that its wintering range may be smaller than previouslythought, it would appear appropriate to adopt a conservative population estimate of some 15 000(range 15 000–20 000) birds.
Short-billed Dowitcher Limnodromus griseus
Population estimates % NorthAmericanrange inCanada
Current maximum count totalsBreedingstatus(Canada)
Abundancestatus(Canada)Code Global Neotropical
NorthAmerica Canada
PacificFlyway
InteriorFlyway
EasternFlyway
SBDO 320 000 320 000 320 000 92.3 150 000 60 000 112 300 B Com
The initial estimate of 100 000+ suggested by Morrison et al. (1994a) is probably rather lowand can be increased to 320 000 on the basis of totals from wintering areas of some 264 500 and con-sideration of the likely subspecies involved. Three subspecies breed in North America: the nominateL. g. griseus, which breeds in eastern Canada (northern Quebec) and winters in Central America andSouth America, L. g. hendersoni, which breeds in central Canada west of Hudson Bay and winters onthe Atlantic and Gulf coasts, and L. g. caurinus, which breeds in southern Alaska and winters alongthe Pacific coast from California into South America (Cramp and Simmons 1983; Godfrey 1986;Hayman et al. 1986).
Wintering ground totals include South America 192 100 (replacing the 21 800 for Surinamegiven by Morrison and Ross [1989] with 165 000 from estimates listed for this country by Scott andCarbonell [1986]), Panama 3100 (Morrison et al. 1998), and Mexico 69 300 (Morrison et al. 1994c),totalling 264 500. Numbers seen during migration are somewhat lower, although still substantial. Falltotals include eastern USA 68 700 (ISS), eastern Canada 38 600 (MSS), Quebec 5000 (Y. Aubrey,pers. commun.), central USA 60 000 (Harrington and Page 1992), Pacific USA 1850 (ISS), andAlaska 6100 (Gill et al. 1999), totalling 180 250. Spring totals include eastern USA 32 500 (ISS),Interior Flyway 55 000 (Harrington and Page 1992), and western North America 150 000 (G.W. Page,unpubl. data), for a total of 237 500. Spring counts in Alaska, which probably involve birds alreadycounted farther south, total 3250 (Gill et al. 1999). Consideration of the above numbers and the likelymigration routes of the subspecies leads to the following minimum estimates for each of the groups.The highest seasonal total for the west coast (spring) is 150 000, which would involve L. g. caurinus.Short-billed Dowitchers passing through central areas in the fall are likely to consist of L. g.hendersoni, indicating 60 000 as a minimum estimate for this population. Dowitchers passing throughthe east coast of the United States and Canada during the fall are likely to belong to the eastern popu-lation of L. g. griseus, indicating a minimum total of 68 700 + 38 600 = 107 300, or approximately
41
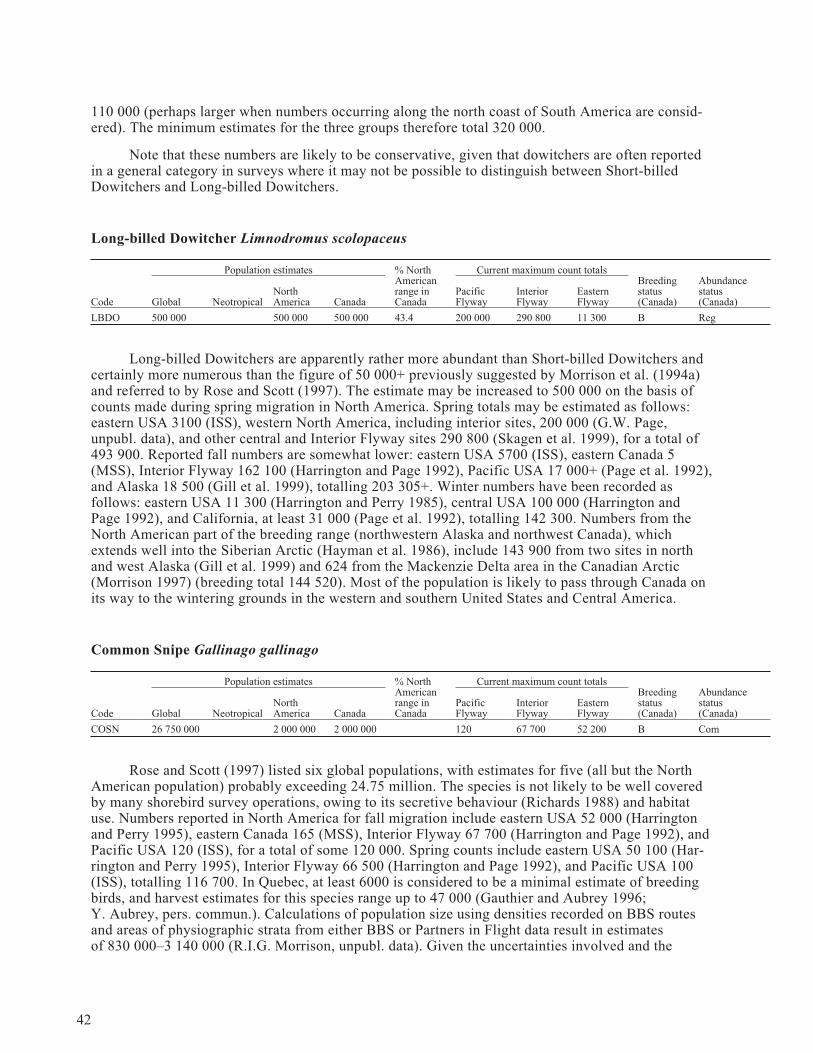
110 000 (perhaps larger when numbers occurring along the north coast of South America are consid-ered). The minimum estimates for the three groups therefore total 320 000.
Note that these numbers are likely to be conservative, given that dowitchers are often reportedin a general category in surveys where it may not be possible to distinguish between Short-billedDowitchers and Long-billed Dowitchers.
Long-billed Dowitcher Limnodromus scolopaceus
Population estimates % NorthAmericanrange inCanada
Current maximum count totalsBreedingstatus(Canada)
Abundancestatus(Canada)Code Global Neotropical
NorthAmerica Canada
PacificFlyway
InteriorFlyway
EasternFlyway
LBDO 500 000 500 000 500 000 43.4 200 000 290 800 11 300 B Reg
Long-billed Dowitchers are apparently rather more abundant than Short-billed Dowitchers andcertainly more numerous than the figure of 50 000+ previously suggested by Morrison et al. (1994a)and referred to by Rose and Scott (1997). The estimate may be increased to 500 000 on the basis ofcounts made during spring migration in North America. Spring totals may be estimated as follows:eastern USA 3100 (ISS), western North America, including interior sites, 200 000 (G.W. Page,unpubl. data), and other central and Interior Flyway sites 290 800 (Skagen et al. 1999), for a total of493 900. Reported fall numbers are somewhat lower: eastern USA 5700 (ISS), eastern Canada 5(MSS), Interior Flyway 162 100 (Harrington and Page 1992), Pacific USA 17 000+ (Page et al. 1992),and Alaska 18 500 (Gill et al. 1999), totalling 203 305+. Winter numbers have been recorded asfollows: eastern USA 11 300 (Harrington and Perry 1985), central USA 100 000 (Harrington andPage 1992), and California, at least 31 000 (Page et al. 1992), totalling 142 300. Numbers from theNorth American part of the breeding range (northwestern Alaska and northwest Canada), whichextends well into the Siberian Arctic (Hayman et al. 1986), include 143 900 from two sites in northand west Alaska (Gill et al. 1999) and 624 from the Mackenzie Delta area in the Canadian Arctic(Morrison 1997) (breeding total 144 520). Most of the population is likely to pass through Canada onits way to the wintering grounds in the western and southern United States and Central America.
Common Snipe Gallinago gallinago
Population estimates % NorthAmericanrange inCanada
Current maximum count totalsBreedingstatus(Canada)
Abundancestatus(Canada)Code Global Neotropical
NorthAmerica Canada
PacificFlyway
InteriorFlyway
EasternFlyway
COSN 26 750 000 2 000 000 2 000 000 120 67 700 52 200 B Com
Rose and Scott (1997) listed six global populations, with estimates for five (all but the NorthAmerican population) probably exceeding 24.75 million. The species is not likely to be well coveredby many shorebird survey operations, owing to its secretive behaviour (Richards 1988) and habitatuse. Numbers reported in North America for fall migration include eastern USA 52 000 (Harringtonand Perry 1995), eastern Canada 165 (MSS), Interior Flyway 67 700 (Harrington and Page 1992), andPacific USA 120 (ISS), for a total of some 120 000. Spring counts include eastern USA 50 100 (Har-rington and Perry 1995), Interior Flyway 66 500 (Harrington and Page 1992), and Pacific USA 100(ISS), totalling 116 700. In Quebec, at least 6000 is considered to be a minimal estimate of breedingbirds, and harvest estimates for this species range up to 47 000 (Gauthier and Aubrey 1996;Y. Aubrey, pers. commun.). Calculations of population size using densities recorded on BBS routesand areas of physiographic strata from either BBS or Partners in Flight data result in estimatesof 830 000–3 140 000 (R.I.G. Morrison, unpubl. data). Given the uncertainties involved and the
42
difficulties in assessing population size, we suggest adopting an population estimate of 2 million(range 1–3 million). This would bring the estimate for the global population to 26.75 million.
American Woodcock Scolopax minor
Population estimates % NorthAmericanrange inCanada
Current maximum count totalsBreedingstatus(Canada)
Abundancestatus(Canada)Code Global Neotropical
NorthAmerica Canada
PacificFlyway
InteriorFlyway
EasternFlyway
AMWO 5 000 000 5 000 000 1 000 000 20 5000 56 000 B Com
Little information is available, as this species tends to be dispersed and not covered adequatelyby most survey operations. Counts reported in North America include the following: fall — easternUSA 5010 (Harrington and Perry 1995), central USA 5000 (Harrington and Page 1992), and PacificUSA 20 (ISS), totalling 10 030: spring — eastern USA 5000 (Harrington and Perry 1995), centralUSA 5000 (Harrington and Page 1992), and Pacific 0 (ISS), totalling 10 000; and winter — easternUSA 26 600 (Harrington and Page 1992). The total population must be considerably larger, as Keppieand Whiting (1994) reported that perhaps as many as 2 million were shot annually in the United Statesand nearly 86 000 in Canada, indicating that the population might be in the 5 million range. Theharvest in Quebec has been estimated to range up to 56 000 birds (Gauthier and Aubrey 1996). Thespecies’ behaviour renders it unsuitable for using BBS data for calculating population size (anestimate of approximately 5000 is obtained; R.I.G. Morrison, unpubl. data).
Wilson’s Phalarope Phalaropus tricolor
Population estimates % NorthAmericanrange inCanada
Current maximum count totalsBreedingstatus(Canada)
Abundancestatus(Canada)Code Global Neotropical
NorthAmerica Canada
PacificFlyway
InteriorFlyway
EasternFlyway
WIPH 1 500 000 1 500 000 1 500 000 680 000 45.3 82 500 827 100 830 B Com
The initial estimate of 100 000+ suggested by Morrison et al. (1994a), as quoted in Rose andScott (1997), appears to be much too low. Jehl (1988) (see also Colwell and Jehl 1994; Page and Gill1994) provided an estimate for continental North America of 1.5 million, which is consistent withcounts at migration areas in North America, which approach 1 million. Fall flyway counts total over910 000 birds: eastern USA 800 (ISS), eastern Canada 26 (MSS), Interior Flyway 827 100 (Skagen etal. 1999), and Pacific USA 82 500 (Harrington and Perry 1995), totalling 910 400. Spring counts arelower, although still substantial in the interior: eastern USA 500 (Harrington and Perry 1995), InteriorFlyway 392 300 (Skagen et al. 1999), and Pacific USA 855 (ISS), totalling 393 700. On the winteringgrounds, Scott and Carbonell (1986) reported counts totalling 569 700 from sites at three countries inSouth America, including 500 000 at Laguna Mar Chiquita, Argentina.
Numbers occurring in Canada are expected to be lower than those in the United States, asbreeding grounds used by the species in the United States are south of Canada. On the basis of Canadacontaining 45.3% of the breeding range, the estimated Canadian population would be 680 000.
43

Red-necked Phalarope Phalaropus lobatus
Population estimates % NorthAmericanrange inCanada
Current maximum count totalsBreedingstatus(Canada)
Abundancestatus(Canada)Code Global Neotropical
NorthAmerica Canada
PacificFlyway
InteriorFlyway
EasternFlyway
RNPH 4 000 000 2 500 000 2 500 000 74.3 83 200 348 200 2 000 000 B Com
Two global populations are listed by Rose and Scott (1997), with the Eurasian one estimated at1 500 000 (range D/E: 100 000–1 000 000/>1 000 000) and the Nearctic one at >2 000 000 (Morrisonet al. 1994a). The North American population should probably be adjusted to 2 500 000 on the basisof historical counts, although significant uncertainty exists about the current status of this population.The estimate is based on fall counts, including eastern Canada 2 000 000 (see Morrison et al. 1995)(this number would be large enough to include smaller numbers reported in MSS counts [2400] andISS counts [sum 1000; Harrington and Page 1992]), Interior Flyway 348 200 (consisting of 48 200reported by Skagen et al. [1999] to which may be added 300 000 reported at Great Salt Lake by Pageet al. [1992]), Pacific USA 63 200 (Harrington and Perry 1995), Pacific Canada 20 000 (see Morrisonet al. 1995), and Alaska 92 900 (Gill et al. 1999), for a total of 2 524 300. Numbers off easternCanada appear to have declined drastically in recent years, and it is not known whether the birds havemoved elsewhere or whether the population may have declined (see Morrison et al. 1995). Determina-tion of the current status of the species is a pressing conservation requirement. Spring counts aregenerally lower: eastern USA 85 (ISS), Interior Flyway 225 442 (Skagen et al. 1999), and PacificUSA 1920 (ISS), for a total of 227 400.
Limited information is available from the breeding grounds. In Alaska, Gill et al. (1999)reported an estimated 670 500 birds from four sites between northern and western Alaska, andMorrison (1997) listed an estimated population of 63 700 from four areas covering 14 815 km2 in theCanadian Arctic, for a breeding grounds total of 734 200.
Red Phalarope Phalaropus fulicaria
Population estimates % NorthAmericanrange inCanada
Current maximum count totalsBreedingstatus(Canada)
Abundancestatus(Canada)Code Global Neotropical
NorthAmerica Canada
PacificFlyway
InteriorFlyway
EasternFlyway
REPH 1 000 000 1 000 000 920 000 91.8 100 400 B Com
Relatively little information is available for this species, as it occurs mostly offshore and is notoften recorded on shorebird surveys. Morrison et al. (1994a) suggested an estimate of 100 000–1 000 000, similar to the range indicated by R. Schlatter (pers. commun., cited in Rose and Scott1997) for the population wintering off the Pacific coast of southern South America (range C/D:25 000–100 000/100 000–1 000 000). Fall counts include 100 300 in eastern Canada (MSS), 100 inQuebec (Y. Aubrey, pers. commun.), and 34 500 from Alaska (Gill et al. 1999), totalling 134 900.Estimates of numbers in six breeding areas covering some 123 940 km2 in Arctic Canada totalled623 800 (Morrison 1997), and a further 101 000 were reported from two sites in Alaska (Gill et al.1999), bringing the total from breeding areas to 724 800. It would appear likely the population is atleast 1 million, possibly (considerably) more. The Canadian population is probably somewhat lowerthan the overall North American population, as birds breeding in northern Alaska may not necessarilymigrate south through Canada; if numbers found in Canada are proportional to the percentage of thebreeding range occurring in Canada (91.8%), the Canadian population would be 920 000.
44
Additional species
The following species have been recorded breeding in very small numbers in North America, asindicated below (R.E. Gill, unpubl. data):
Species Scientific name Global population Notes on numbers in North Americaa
Grey-tailed Tattler Tringa brevipes 25 000–100 000b,c One confirmed breeding record in Alaska
Red-necked Stint Calidris ruficollis 471 000d A few dozen breed in Alaska
Curlew Sandpiper Calidris ferruginea 250 000d A few dozen breed in Alaska
Ruff Philomachus pugnax 25 000–100 000b,c A few dozen breed in Alaskaa R.E. Gill (unpubl. data).b Rose and Scott (1997).c Perennou et al. (1994).d Watkins (1993, and pers. commun.).
45

4. Results, overview, and discussion
Current estimates of the population sizes of 53 species of shorebirds occurring in NorthAmerica (plus four occasionally breeding species) are summarized in Table 1, with an assessment ofthe likely accuracies of the counts. The population estimates ranged from a few tens to severalmillions (Tables 1 and 2). Overall, the population estimates for the 53 regularly occurring speciesmost commonly fell in the range of hundreds of thousands, particularly the low hundreds ofthousands. Estimated population sizes for large shorebird species currently all fall below 500 000, andsmaller species tend to have larger populations; the proportion of populations over 100 000 is 10/12(83.3%) for small, 19/28 (67.9%) for medium-sized, and 4/13 (30.8%) for large species (Table 2).However, if mass (taken principally from Dunning [1984]) is taken as a measure of size, then alog–log plot of population size against mass (log transformation resulted in normalization of the datafor both variables [excluding data for Eskimo Curlew; Shapiro-Wilk W test]) reveals a statisticallysignificant negative relationship between population size and mass (Fig. 1(a); log(population size) =16.479 –1.030*log(mass [g]), r = –0.41, r2 = 0.170, p = 0.002, n = 53). The biological factors influ-encing population size are likely to be complex (Ricklefs 1973), and a discussion of the reasons forpopulation size and mass being so closely related in the shorebird species being considered is outsidethe scope of the present paper. A number of features of the graph, however, are of particular interest.In addition to the main bundle of points lying along the regression line, two groups of outlying pointsmay be distinguished: (1) a group of 10 species below the line (SNPL, SOSA, BBSA, PIPL, WIPL,PUSA, MOUP, WATA, HAST, ESCU), and (2) two outlying points above the line (COSN, AMWO).The species below the line, whose populations are generally lower than those of others of similarmass, include two broad categories of shorebirds:
• Species at risk. This group contains five of the six species considered to be “at risk” inCanada and the United States, including Eskimo Curlew (ESCU), Mountain Plover(MOUP), Snowy Plover (SNPL), Piping Plover (PIPL), and Hawaiian Stilt (HAST) (thesixth species, Long-billed Curlew [LBCU], falls on the line). The position of these fivespecies below the regression line might suggest that their populations could be eitherdepressed or underestimated; however, as these species have in many cases been thesubject of specialized counts or investigations, it would appear likely that the populationsare depressed rather than poorly counted.
• Difficult-to-count species. The other species in the group below the regression lineinclude Solitary Sandpiper (SOSA), Buff-breasted Sandpiper (BBSA), Wilson’s Plover(WIPL), Purple Sandpiper (PUSA), and Wandering Tattler (WATA). These are allspecies that tend to either be dispersed (SOSA) or occur in upland (BBSA), beach(WIPL), or rocky habitats (PUSA, WATA) and that are often poorly studied; these are allsituations in which it is difficult to obtain shorebird counts over extensive areas,suggesting that the population estimates may be too low.
The two outliers above the regression line, Common Snipe (COSN) and American Woodcock(AMWO), are both cryptic species that are difficult to count and observe and whose estimates have
46
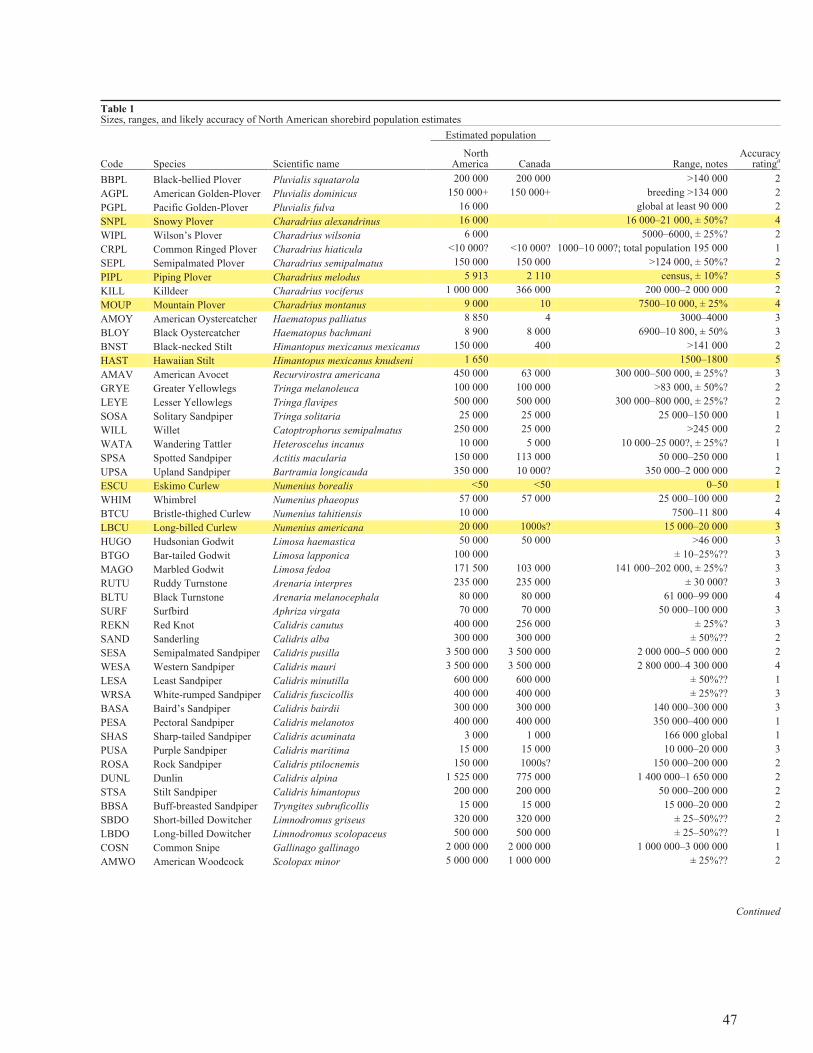
47
Table 1Sizes, ranges, and likely accuracy of North American shorebird population estimates
Code Species Scientific name
Estimated population
Accuracyratinga
NorthAmerica Canada Range, notes
BBPL Black-bellied Plover Pluvialis squatarola 200 000 200 000 >140 000 2
AGPL American Golden-Plover Pluvialis dominicus 150 000+ 150 000+ breeding >134 000 2
PGPL Pacific Golden-Plover Pluvialis fulva 16 000 global at least 90 000 2
SNPL Snowy Plover Charadrius alexandrinus 16 000 16 000–21 000, ± 50%? 4
WIPL Wilson’s Plover Charadrius wilsonia 6 000 5000–6000, ± 25%? 2
CRPL Common Ringed Plover Charadrius hiaticula <10 000? <10 000? 1000–10 000?; total population 195 000 1
SEPL Semipalmated Plover Charadrius semipalmatus 150 000 150 000 >124 000, ± 50%? 2
PIPL Piping Plover Charadrius melodus 5 913 2 110 census, ± 10%? 5
KILL Killdeer Charadrius vociferus 1 000 000 366 000 200 000–2 000 000 2
MOUP Mountain Plover Charadrius montanus 9 000 10 7500–10 000, ± 25% 4
AMOY American Oystercatcher Haematopus palliatus 8 850 4 3000–4000 3
BLOY Black Oystercatcher Haematopus bachmani 8 900 8 000 6900–10 800, ± 50% 3
BNST Black-necked Stilt Himantopus mexicanus mexicanus 150 000 400 >141 000 2
HAST Hawaiian Stilt Himantopus mexicanus knudseni 1 650 1500–1800 5
AMAV American Avocet Recurvirostra americana 450 000 63 000 300 000–500 000, ± 25%? 3
GRYE Greater Yellowlegs Tringa melanoleuca 100 000 100 000 >83 000, ± 50%? 2
LEYE Lesser Yellowlegs Tringa flavipes 500 000 500 000 300 000–800 000, ± 25%? 2
SOSA Solitary Sandpiper Tringa solitaria 25 000 25 000 25 000–150 000 1
WILL Willet Catoptrophorus semipalmatus 250 000 25 000 >245 000 2
WATA Wandering Tattler Heteroscelus incanus 10 000 5 000 10 000–25 000?, ± 25%? 1
SPSA Spotted Sandpiper Actitis macularia 150 000 113 000 50 000–250 000 1
UPSA Upland Sandpiper Bartramia longicauda 350 000 10 000? 350 000–2 000 000 2
ESCU Eskimo Curlew Numenius borealis <50 <50 0–50 1
WHIM Whimbrel Numenius phaeopus 57 000 57 000 25 000–100 000 2
BTCU Bristle-thighed Curlew Numenius tahitiensis 10 000 7500–11 800 4
LBCU Long-billed Curlew Numenius americana 20 000 1000s? 15 000–20 000 3
HUGO Hudsonian Godwit Limosa haemastica 50 000 50 000 >46 000 3
BTGO Bar-tailed Godwit Limosa lapponica 100 000 ± 10–25%?? 3
MAGO Marbled Godwit Limosa fedoa 171 500 103 000 141 000–202 000, ± 25%? 3
RUTU Ruddy Turnstone Arenaria interpres 235 000 235 000 ± 30 000? 3
BLTU Black Turnstone Arenaria melanocephala 80 000 80 000 61 000–99 000 4
SURF Surfbird Aphriza virgata 70 000 70 000 50 000–100 000 3
REKN Red Knot Calidris canutus 400 000 256 000 ± 25%? 3
SAND Sanderling Calidris alba 300 000 300 000 ± 50%?? 2
SESA Semipalmated Sandpiper Calidris pusilla 3 500 000 3 500 000 2 000 000–5 000 000 2
WESA Western Sandpiper Calidris mauri 3 500 000 3 500 000 2 800 000–4 300 000 4
LESA Least Sandpiper Calidris minutilla 600 000 600 000 ± 50%?? 1
WRSA White-rumped Sandpiper Calidris fuscicollis 400 000 400 000 ± 25%?? 3
BASA Baird’s Sandpiper Calidris bairdii 300 000 300 000 140 000–300 000 3
PESA Pectoral Sandpiper Calidris melanotos 400 000 400 000 350 000–400 000 1
SHAS Sharp-tailed Sandpiper Calidris acuminata 3 000 1 000 166 000 global 1
PUSA Purple Sandpiper Calidris maritima 15 000 15 000 10 000–20 000 3
ROSA Rock Sandpiper Calidris ptilocnemis 150 000 1000s? 150 000–200 000 2
DUNL Dunlin Calidris alpina 1 525 000 775 000 1 400 000–1 650 000 2
STSA Stilt Sandpiper Calidris himantopus 200 000 200 000 50 000–200 000 2
BBSA Buff-breasted Sandpiper Tryngites subruficollis 15 000 15 000 15 000–20 000 2
SBDO Short-billed Dowitcher Limnodromus griseus 320 000 320 000 ± 25–50%?? 2
LBDO Long-billed Dowitcher Limnodromus scolopaceus 500 000 500 000 ± 25–50%?? 1
COSN Common Snipe Gallinago gallinago 2 000 000 2 000 000 1 000 000–3 000 000 1
AMWO American Woodcock Scolopax minor 5 000 000 1 000 000 ± 25%?? 2
Continued

been derived from extrapolations that may be subject to large errors. These are also the only speciesin the shorebird group that are regularly hunted and are thus liable to different population pressuresthan the others.
As would be anticipated, removal of the outlying groups (on the basis of their populations beingartificially low or high) results in an even closer relationship between population size and mass for theremaining species: log(population size) = 17.920 – 1.204*log(mass [g]), r = 0.78, r2 = 0.60, p =0.0000, n = 41 (Fig. 1(b)). Although the results suggest that the pattern of the regression may be inter-preted meaningfully in identifying species whose populations are either artificially lower or higherthan might be anticipated, use of the relationship for other purposes such as identifying potentialtarget population levels for conservation would remain debatable, as the biological reasons underlyingthe observed relationship are not well understood at present.
48
Table 1 (cont'd)Sizes, ranges, and likely accuracy of North American shorebird population estimates
Code Species Scientific name
Estimated population
Accuracyratinga
NorthAmerica Canada Range, notes
WIPH Wilson’s Phalarope Phalaropus tricolor 1 500 000 680 000 500 000–1 500 000 2
RNPH Red-necked Phalarope Phalaropus lobatus 2 500 000 2 500 000 1 000 000–3 000 000 1
REPH Red Phalarope Phalaropus fulicaria 1 000 000 920 000 1 000 000–2 500 000 1
Additional species
GTTA Grey-tailed Tattler Tringa brevipes 2 0 global 25 000–100 000
RNST Red-necked Stint Calidris ruficollis <50 0 global 471 000
CUSA Curlew Sandpiper Calidris ferruginea <50 0 global 250 000
RUFF Ruff Philomachus pugnax <50 0? regional 25 000–100 000a Population estimate accuracy classification:
1 (Poor): A population estimate based on an educated guess. Score 1 also given to ESCU, which has not been reliably seen in recent years.2 (Low): A population estimate based on broad-scale surveys where estimated population size is likely to be in right order of magnitude.3 (Moderate): A population estimate based on a special survey or on broad-scale surveys of a narrowly distributed species whose populations tend to concen-trate to a high degree either a) in a restricted habitat or b) at a small number of favoured sites. Estimate thought to be within 50% of the true number.4 (Good): A calculated estimate based on broad-scale mark:recapture ratios or other systematic estimating effort resulting in estimates on which confidencelimits can be placed.5 (High): Number obtained from a dedicated census effort and thought to be accurate and precise.
In some cases, an indication of the estimated % accuracy is also given in the Range, notes column. No accuracy rating is given for the four “Additional spe-cies” breeding in very small numbers in Alaska.
Shading indicates species that are considered “at risk” (i.e., endangered, threatened, vulnerable).
?, ?? indicate guesses, with increasing degree of uncertainty.
Table 2Distribution of estimated population sizes of 53 species of shorebirdsoccurring in North America
Species size
Population size Small Medium Large Total %
10s 1 1 1.9
100s
1000s 1 1 3 5 9.4
10 000–50 000 1 5 3 9 17.0
50 001–100 000 3 2 5 9.4
100 001–500 000 6 13 4 23 43.4
500 001–999 999 1 1 2 3.8
1 000 000+ 3 3 (2)a 6 (2) 11.3 (3.8)
12 26 (2) 13 51 (2)a Numbers in parentheses refer to Common Snipe and American Woodcock.

49
Figure 1
Relationship between log(population size) and log(mass [g]) for shorebirds occurring in North America (a) for all53 species occurring regularly in North America (includes Canada, United States, including Hawaii, and Mexico), and(b) for 41 selected species (excluding outlying groups considered to contain species with artificially low [“at risk,”difficult to count] or high [hunted] populations; see text)
An indication of the likely accuracy of the population estimate for each species is given inTable 1. Likely accuracies are often difficult to assess, as estimates have been derived by a variety ofmethods using counts and survey information obtained at various times of the year and for whichthere is often no statistical assessment of likely error. Estimates range from those based on aneducated guess to those that have been derived from a dedicated census effort that is likely to producea relatively precise estimate. Even though a single number is given for each population, the broadrange of many of the estimates emphasizes the need for considerable caution in using the estimates forconservation purposes, such as setting target levels for management of a species.
Many sources of error are associated with population estimates based on counts at migrationareas. Use of maximum counts at a site will almost certainly underestimate the total number of birdsusing the site owing to the phenomenon of “turnover” as birds pass through the site. Turnover ratesmay be considerably different in different regions and at different times of the year. For instance,among small sandpipers, Semipalmated Sandpipers on the Atlantic coast of Canada are thought tohave a turnover time of about 10–15 days in the Bay of Fundy during fall migration (Hicklin 1987),whereas Western Sandpipers on the Pacific coast of British Columbia are thought to have a turnovertime of only 1–3 days during fall migration (Butler et al. 1987), leading to very different peaknumbers occurring at the major sites during migration in the two areas. Turnover times for WesternSandpipers during spring migration are also generally less than 5 days (Iverson et al. 1996; Warnockand Bishop 1998). Turnover rates for several shorebird species on the Canadian Prairies were appar-ently longer in the fall (7–10 days) than in the spring (4–6 days) (Alexander and Gratto-Trevor 1997).
When a species visits more than one site in a region during migration, use of maximum countsat various sites leads to the possibility of birds being counted more than once. On the other hand,several aspects of shorebird migration are likely to lead to undercounting, including differentialmigration of age groups, peaks being missed when maximum numbers occur on days when countswere not conducted, sites not being counted, etc. These types of error are likely to vary considerablyacross species, seasons, and sites. When adults and juveniles pass through migration sites at differenttimes, as is the case for many species during fall migration, peak counts are likely to refer to only oneof the age groups. For some species that do not commence breeding until several years of age, thenonbreeding (mostly prebreeding) segment of the population may remain as a “summering” popula-tion on the wintering grounds or in areas well south of the breeding areas. Although these birds wouldbe included in counts conducted at wintering sites, they would generally be missed in counts carriedout at migration areas. Another obvious source of error is incomplete coverage of sites at which thespecies occurs, whether on migration or on wintering areas. In the case of birds passing throughwetlands in the interior of the continent, the highly variable conditions that are found from year toyear may lead birds to change sites between years, so that maximum counts at different sites mayinvolve the same birds over a period of years and hence lead to inflated maximum count totals. On theother hand, many birds will not be counted at all, as coverage of sites is always substantiallyincomplete.
Counting errors at sites are rarely assessed. Stochastic errors occurring when counts of manyflocks are added to obtain an overall total tend to balance out and may be in the order of 5–10% whenmany medium-sized flocks are counted, although they are potentially much higher when species occurin a few large flocks (Rappoldt et al. 1985). Errors resulting from missing flocks when high-tideroosts are counted are likely to exceed counting errors (Yates and Goss-Custard 1991). Errorsinvolved in aerial survey counts are likely to be larger than those resulting from ground counts(Meltofte et al. 1994). Systematic errors are generally thought to lead to underestimates, rather thanoverestimates, when large numbers of birds are being counted (Meltofte et al. 1994).
Sources of error resulting from misidentification are likely to be small for many species whoseplumage or size results in a distinctive appearance. For some species, however, it may not always bepossible or practicable to distinguish between similar species, such as dowitchers (Short-billed andLong-billed) and yellowlegs (Lesser and Greater), especially if birds have to be viewed at a distance
50

or are being counted during aerial surveys. In the small sandpipers, it may be difficult to account forsmall numbers of species such as Least Sandpipers or Spotted Sandpipers occurring in very largeflocks of more common species such as Semipalmated Sandpipers. Dispersed species, such as SolitarySandpipers, are potentially more difficult to count, as they may occur in small numbers at many sites,in contrast to species that occur in large numbers at a restricted number of sites; however, if the bot-tlenecks are missed with species that concentrate, large errors will result. Cryptic species such asAmerican Woodcocks present special problems, as illustrated by the data that show a seasonal highcount of 26 000 but an estimated total population of some 5 million (Keppie and Whiting 1994).
Estimates that are most likely to be reasonably accurate are likely therefore to involve speciesthat concentrate to a moderate or high degree on migration or wintering areas, where they are able tobe counted in a fairly complete manner. The best estimates currently available may involve speciessuch as the Red Knot and Semipalmated Sandpiper. For the Red Knot, combinations of winteringground surveys and banding suggested a total of 100 000–150 000 (Harrington et al. 1988; Morrisonand Ross 1989; Morrison and Harrington 1992), which is similar to the current estimate of 167 000based on counts at migration areas, where the species is heavily concentrated during northwardmigration. Note, however, that some recent work has suggested that knot populations may havedeclined in recent years (Baker et al. 1999). For Semipalmated Sandpipers, aerial surveys of the mainwintering grounds in South America as well as banding indicated a population in the order of2–5 million (Spaans 1984; Morrison and Ross 1989), a figure compatible with numbers occurring inthe Bay of Fundy during fall migration (Hicklin 1987). The much improved availability of informa-tion from central flyways has led to increases in the population estimates for a number of species,especially small sandpipers such as White-rumped Sandpiper and Baird’s Sandpiper, where thecurrent estimates in the hundreds of thousands are likely much closer to the actual population numberthan were previous estimates (Morrison et al. 1994a).
The few cases for which confidence limits or error estimates are available for populationestimates usually come from studies on the breeding grounds, which often involve more formalizedassessments than coastal surveys, but which may or may not cover the entire breeding range of thespecies involved (e.g., Black Turnstones in Alaska, Handel and Gill 1992; six species on PrinceCharles Island, Nunavut, Morrison 1997; four species on the Rasmussen Lowlands, Nunavut,Gratto-Trevor et al. 1998). Remote sensing studies have been used successfully to identify andquantify areas of different breeding habitats in particular regions of the Arctic (Gratto-Trevor 1996;Morrison 1997), allowing extrapolated estimates of breeding populations over large areas; they mayalso enable modelling to be carried out to allow for effects such as variation in breeding densities withdistance from coast and elimination of unsuitable patches of a habitat type where required combina-tions of other habitats are not present (Morrison 1997). Remote sensing studies may work well at aregional level in the Arctic, but it is unlikely that studies in one region could be extended to otherswithout extensive ground-truthing operations over enormous regions, thus limiting the practicabilityof this method for assessing populations across the entire Arctic (Morrison 1997).
In cases where the sum of the highest counts across sites within one season formed the basis formaking an estimate of the population size, the season at which this highest aggregated total occurredvaried considerably across the 53 shorebird species considered (Table 3). Highest totals for just underhalf the species (25 of 53, 47%) were derived from counts made at migration areas, including both fall(13 species) and spring (12 species) staging/stopover sites. Highest counts or estimates for most of theremaining species (27 of 28) came from outside migration periods, involving wintering grounds (13species) or breeding areas (14 species). Population estimates for one species were not related directlyto counts from any particular part of the annual cycle and represent the current best guess — thespecies involved, the Wandering Tattler, occurs principally on rocky coastal habitats, which are oftendifficult to cover adequately during surveys.
When counts at migration areas only were considered, data for both spring and fall wereavailable for 40 species, with 26 showing higher peaks in the fall and 14 showing higher peaks in the
51
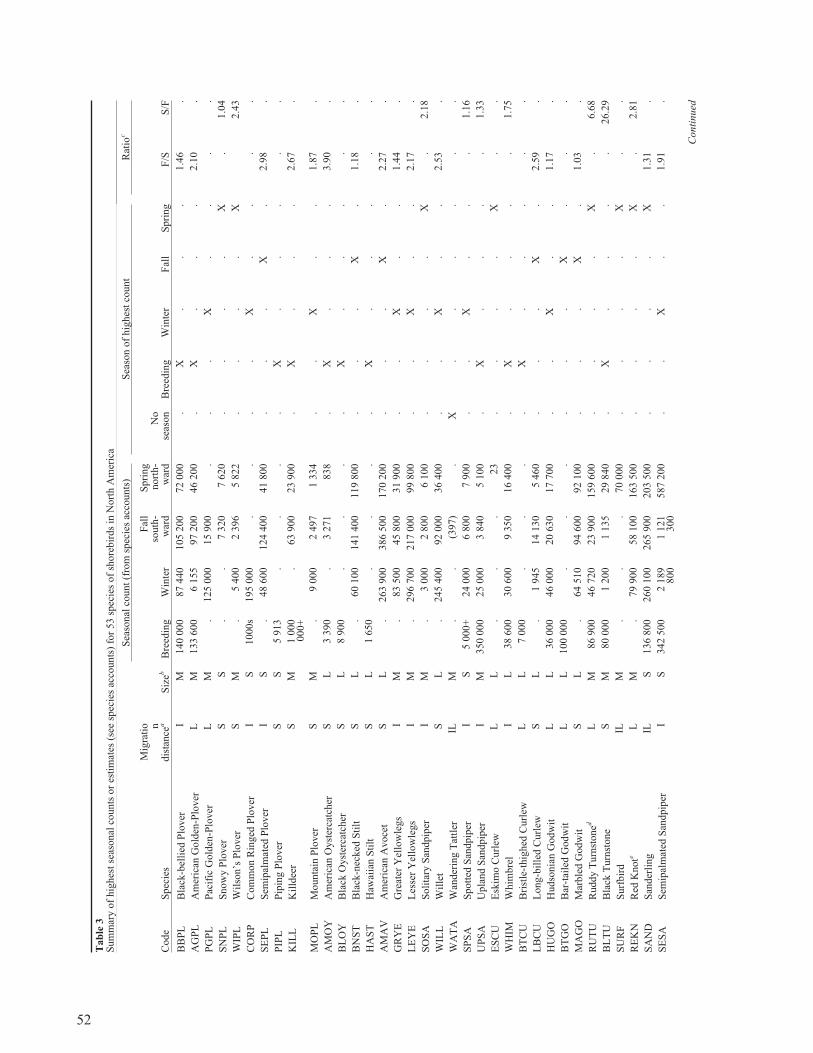
52
Tab
le3
Sum
mar
yof
hig
hes
tse
asonal
counts
or
esti
mat
es(s
eesp
ecie
sac
counts
)fo
r53
spec
ies
of
shore
bir
ds
inN
ort
hA
mer
ica
Sea
sonal
count
(fro
msp
ecie
sac
counts
)S
easo
nof
hig
hes
tco
unt
Rat
ioc
Code
Spec
ies
Mig
rati
o ndis
tance
aS
izeb
Bre
edin
gW
inte
r
Fal
lso
uth
-w
ard
Spri
ng
nort
h-
war
dN
ose
ason
Bre
edin
gW
inte
rF
all
Spri
ng
F/S
S/F
BB
PL
Bla
ck-b
elli
edP
lover
IM
140
000
87
440
105
200
72
000
.X
..
.1.4
6.
AG
PL
Am
eric
anG
old
en-P
lover
LM
133
600
6155
97
200
46
200
.X
..
.2.1
0.
PG
PL
Pac
ific
Gold
en-P
lover
LM
.125
000
15
900
..
.X
..
..
SN
PL
Snow
yP
lover
SS
..
7320
7620
..
..
X.
1.0
4
WIP
LW
ilso
n’s
Plo
ver
SM
.5
400
2396
5822
..
..
X2.4
3
CO
RP
Com
mon
Rin
ged
Plo
ver
IS
1000s
195
000
..
..
X.
..
.
SE
PL
Sem
ipal
mat
edP
lover
IS
.48
600
124
400
41
800
..
.X
.2.9
8.
PIP
LP
ipin
gP
lover
SS
5913
..
..
X.
..
..
KIL
LK
illd
eer
SM
1000
000+
.63
900
23
900
.X
..
.2.6
7.
MO
PL
Mounta
inP
lover
SM
.9
000
2497
1334
..
X.
.1.8
7.
AM
OY
Am
eric
anO
yst
erca
tcher
SL
3390
.3
271
838
.X
..
.3.9
0.
BL
OY
Bla
ckO
yst
erca
tcher
SL
8900
..
..
X.
..
..
BN
ST
Bla
ck-n
ecked
Sti
ltS
L.
60
100
141
400
119
800
..
.X
.1.1
8.
HA
ST
Haw
aiia
nS
tilt
SL
1650
..
..
X.
..
..
AM
AV
Am
eric
anA
voce
tS
L.
263
900
386
500
170
200
..
.X
.2.2
7.
GR
YE
Gre
ater
Yel
low
legs
IM
.83
500
45
800
31
900
..
X.
.1.4
4.
LE
YE
Les
ser
Yel
low
legs
IM
.296
700
217
000
99
800
..
X.
.2.1
7.
SO
SA
Soli
tary
San
dpip
erI
M.
3000
2800
6100
..
..
X.
2.1
8
WIL
LW
ille
tS
L.
245
400
92
000
36
400
..
X.
.2.5
3.
WA
TA
Wan
der
ing
Tat
tler
ILM
..
(397)
.X
..
..
..
SP
SA
Spott
edS
andpip
erI
S5
000+
24
000
6800
7900
..
X.
..
1.1
6
UP
SA
Upla
nd
San
dpip
erI
M350
000
25
000
3840
5100
.X
..
..
1.3
3
ES
CU
Esk
imo
Curl
ewL
L.
..
23
..
..
X.
.
WH
IMW
him
bre
lI
L38
600
30
600
9350
16
400
.X
..
..
1.7
5
BT
CU
Bri
stle
-thig
hed
Curl
ewL
L7
000
..
..
X.
..
..
LB
CU
Long-b
ille
dC
url
ewS
L.
1945
14
130
5460
..
.X
.2.5
9.
HU
GO
Hudso
nia
nG
odw
itL
L36
000
46
000
20
630
17
700
..
X.
.1.1
7.
BT
GO
Bar
-tai
led
Godw
itL
L100
000
..
..
..
X.
..
MA
GO
Mar
ble
dG
odw
itS
L.
64
510
94
600
92
100
..
.X
.1.0
3.
RU
TU
Ruddy
Turn
stoned
LM
86
900
46
720
23
900
159
600
..
..
X.
6.6
8
BL
TU
Bla
ckT
urn
stone
SM
80
000
1200
1135
29
840
.X
..
..
26.2
9
SU
RF
Surf
bir
dIL
M.
..
70
000
..
..
X.
.
RE
KN
Red
Knote
LM
.79
900
58
100
163
500
..
..
X.
2.8
1
SA
ND
San
der
ling
ILS
136
800
260
100
265
900
203
500
..
..
X1.3
1.
SE
SA
Sem
ipal
mat
edS
andpip
erI
S342
500
2189
800
1121
300
587
200
..
X.
.1.9
1.
Conti
nued
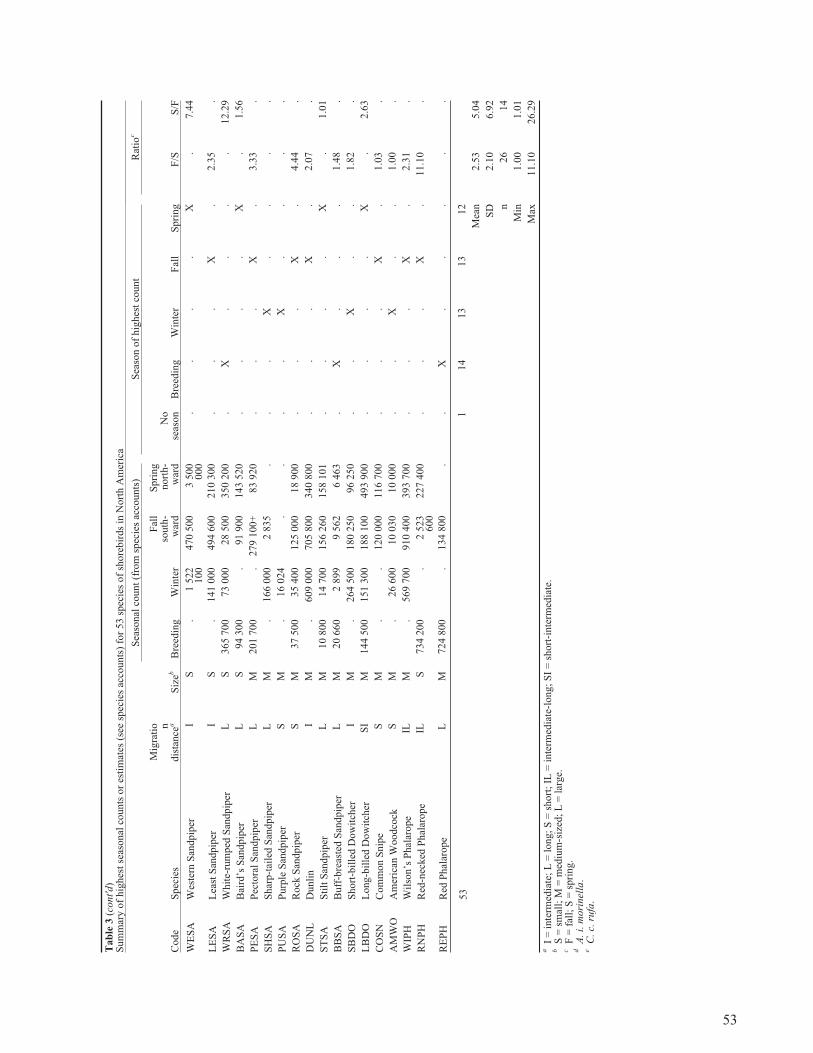
53
Tab
le3
(cont'd)
Sum
mar
yof
hig
hes
tse
asonal
counts
or
esti
mat
es(s
eesp
ecie
sac
counts
)fo
r53
spec
ies
of
shore
bir
ds
inN
ort
hA
mer
ica
Sea
sonal
count
(fro
msp
ecie
sac
counts
)S
easo
nof
hig
hes
tco
unt
Rat
ioc
Code
Spec
ies
Mig
rati
o ndis
tance
aS
izeb
Bre
edin
gW
inte
r
Fal
lso
uth
-w
ard
Spri
ng
nort
h-
war
dN
ose
ason
Bre
edin
gW
inte
rF
all
Spri
ng
F/S
S/F
WE
SA
Wes
tern
San
dpip
erI
S.
1522
100
470
500
3500
000
..
..
X.
7.4
4
LE
SA
Lea
stS
andpip
erI
S.
141
000
494
600
210
300
..
.X
.2.3
5.
WR
SA
Whit
e-ru
mped
San
dpip
erL
S365
700
73
000
28
500
350
200
.X
..
..
12.2
9
BA
SA
Bai
rd’s
San
dpip
erL
S94
300
.91
900
143
520
..
..
X.
1.5
6
PE
SA
Pec
tora
lS
andpip
erL
M201
700
.279
100+
83
920
..
.X
.3.3
3.
SH
SA
Shar
p-t
aile
dS
andpip
erL
M.
166
000
2835
..
.X
..
..
PU
SA
Purp
leS
andpip
erS
M.
16
024
..
..
X.
..
.
RO
SA
Rock
San
dpip
erS
M37
500
35
400
125
000
18
900
..
.X
.4.4
4.
DU
NL
Dunli
nI
M.
609
000
705
800
340
800
..
.X
.2.0
7.
ST
SA
Sti
ltS
andpip
erL
M10
800
14
700
156
260
158
101
..
..
X.
1.0
1
BB
SA
Buff
-bre
aste
dS
andpip
erL
M20
660
2899
9562
6463
.X
..
.1.4
8.
SB
DO
Short
-bil
led
Dow
itch
erI
M.
264
500
180
250
96
250
..
X.
.1.8
2.
LB
DO
Long-b
ille
dD
ow
itch
erS
IM
144
500
151
300
188
100
493
900
..
..
X.
2.6
3
CO
SN
Com
mon
Snip
eS
M.
.120
000
116
700
..
.X
.1.0
3.
AM
WO
Am
eric
anW
oodco
ckS
M.
26
600
10
030
10
000
..
X.
.1.0
0.
WIP
HW
ilso
n’s
Phal
arope
ILM
.569
700
910
400
393
700
..
.X
.2.3
1.
RN
PH
Red
-nec
ked
Phal
arope
ILS
734
200
.2
523
600
227
400
..
.X
.11.1
0.
RE
PH
Red
Phal
arope
LM
724
800
.134
800
..
X.
..
..
53
114
13
13
12
Mea
n2.5
35.0
4
SD
2.1
06.9
2
n26
14
Min
1.0
01.0
1
Max
11.1
026.2
9a
I=
inte
rmed
iate
;L
=lo
ng
;S
=sh
ort
;IL
=in
term
edia
te-l
ong;
SI
=sh
ort
-inte
rmed
iate
.b
S=
smal
l;M
=m
ediu
m-s
ized
;L
=la
rge.
cF
=fa
ll;
S=
spri
ng.
dA
.i.
mori
nel
la.
eC
.c.
rufa
.

spring (Table 3). There did not appear to be any statistically significant tendency to concentrate dis-proportionately in one season or the other. Ratios of counts between the two seasons were generallysimilar in the two groups; for species with higher fall counts, the fall count was on average 2.53 ±2.10 (SD) times higher than the spring count, ranging from about even (1.003) to some 11.1 times thespring count; for species with higher spring counts, the ratio averaged 5.04 ± 6.92 (SD) times the fallcount, varying from about even (1.01) to some 26.3 times the fall count (Kruskal-Wallis ANOVA by
ranks, H(1,40) = 0.50, p = 0.48, ns; median test �2 = 0.44, p = 0.51) (Table 3).
Although species whose maximum counts were recorded in spring had the longest meanmigration distances (latitudinal span between breeding and wintering areas), this mean was not signif-icantly different from those found for species having maximum counts at other times of the year(means ± SD (n): spring 67.5 ± 35.9 (12), fall 42.5 ± 29.7 (12), breeding 55.3 ± 42.6 (15), wintering57.3 ± 32.2 (13), ANOVA, F = 0.98, p = 0.41, data distributed normally within each group,Kolmogorov-Smirnov test, p > 0.20 in all cases). Long-distance migrants moving to winteringgrounds in the southern parts of South America tend to gather in large numbers at staging sites inNorth America in the spring to replenish reserves depleted during flights from the southerly parts ofthe wintering range before the final stage of the migration to the breeding grounds. Long-distancemigrants such as the Red Knot and Sanderling concentrate in large numbers at east coast sites in theUnited States (especially Delaware Bay), whereas species such as White-rumped Sandpiper andBaird’s Sandpiper occur in large numbers in the Interior Flyway during spring migration. This con-centration at spring “bottlenecks” may enable a substantial part of the population to be accessed forcounting at a small number of places at one time.
There was no overall link between flocking characteristic (i.e., tendency of species to occur inflocks or to be dispersed) and the season (migration vs. nonmigration) at which highest counts were
observed (Pearson �2 = 0.41, 1 df, p = 0.52). Flocking species, however, did tend to migrate longer
distances as estimated by the mean latitudinal span between breeding and wintering areas (meansSD (n): flocking species 61.5 ± 35.2 (40) degrees, dispersed species 38.5 ± 31.8 (13) degrees, t =2.10, p = 0.04, data within each group normally distributed, Kolmogorov-Smirnov test, p > 0.20 forboth groups).
Size and migration distance were not related for small and medium-sized species, whereas therewas a borderline tendency for large species to be shorter-distance migrants compared withmedium-sized species (LSD test, p = 0.08; mean distances in degrees of latitude ± SD (n): small58.9 ± 34.0 (14), medium-sized 61.9 ± 32.5 (26), large 40.4 ± 40.8 (13); data in each group normallydistributed, Kolmogorov-Smirnof test, p > 0.20 for all groups).
A major use of population figures is in assessing the importance of a site for conservation,based on one of the percentage criteria used with the Ramsar Convention (1%) or WHSRN (5%, 15%,30% for different site categories). Shorebird populations are dynamic, with the implication that moni-toring and regular updating of population estimates are necessary if information used for conservationpurposes is to be kept current. Wetlands International has adopted a 3-year update schedule for itspopulation estimates for world waterbird populations, to coincide with the Meeting of the Conferenceof the Contracting Parties to the Ramsar Convention (Rose and Scott 1997). If large changes innumbers are detected, supporting research will be needed to identify causes; for instance, uncertaintyexists about whether the huge decreases in numbers of Red-necked Phalaropes that have occurred inthe Bay of Fundy over the past 25 years represent a true population crash or whether the birds mayhave moved elsewhere. Increasing evidence from many parts of North America suggests that amajority of shorebird populations are in decline (Howe et al. 1989; Morrison et al. 1994b; Page andGill 1994; Harrington 1995), emphasizing the need for future monitoring of shorebird populationnumbers and trends.
54
5. Literature cited
Alexander, S.A.; Gratto-Trevor, C.L. 1997. Shorebird migration and staging at a large prairie lake and wetland complex:the Quill Lakes, Saskatchewan. Occasional Paper No. 97, Canadian Wildlife Service, Ottawa, Ontario. 47 pp.
Andres, B.A.; Falxa, G.A. 1995. Black Oystercatcher (Haematopus bachmani). The Birds of North America No. 155 (A.Poole and F. Gill, eds.). Academy of Natural Sciences, Philadelphia, Pennsylvania, and American Ornithologists’ Union,Washington, D.C. 20 pp.
AOU (American Ornithologists’ Union). 1998. Check-list of North American birds. 7th ed. Washington, D.C. 829 pp.
Baker, A.J.; Gonzalez, P.M.; Minton, C.D.T.; Carter, D.B.; Niles, L.; Nascimento, I.L.S.; Piersma, T. 1999.Hemispheric problems in the conservation of Red Knots (Calidris canutus rufa). Paper presented at the 6th NeotropicalOrnithological Congress, Shorebird Symposium, 9 October 1999, Monterrey, Mexico. To be published in CongressProceedings.
Bent, A.C. 1927. Life histories of North American shorebirds. Part 1. U.S. National Museum Bulletin No. 142.
Bent, A.C. 1929. Life histories of North American shorebirds. Part 2. U.S. National Museum Bulletin No. 146.
Bishop, M.A.; Meyers, P.M.; McNeley, P.F. 2000. A method to estimate migrant shorebird numbers on the Copper RiverDelta, Alaska. J. Field Ornithol. 71 (in press).
Blanco, D.E.; Canevari, P. 1998. Identifying wetlands of critical value to shorebirds in South America. An updatedpanorama about distribution and numbers. Wetlands for the Americas, Buenos Aires, Argentina. 66 pp.
Blanco, D.; Banchs, R.; Canevari, P. 1993. Critical sites for the Eskimo Curlew (Numenius borealis) and other Nearcticgrassland shorebirds in Argentina and Uruguay. Wetlands for the Americas, Buenos Aires, Argentina.
Blankinship, D.R.; King, K.A. 1984. A probable sighting of 23 Eskimo Curlews in Texas. Am. Birds 38: 1066–1067.
Brousseau, P. 1981. Distribution et abondance des oiseaux de rivage le long du Saint-Laurent. Canadian Wildlife ServiceReport, Canadian Wildlife Service, Quebec City, Quebec. 132 pp.
Butler, R.W. 1992. Populations, distribution and habitat requirements of Western Sandpipers, Dunlins, Black-belliedPlovers and Great Blue Herons. Pages 70–85 in R.W. Butler (ed.), Abundance, distribution and conservation of birds inthe vicinity of Boundary Bay, British Columbia. Canadian Wildlife Service Technical Report Series No. 155, CanadianWildlife Service, Pacific and Yukon Region, Delta, British Columbia. 132 pp.
Butler, R.W.; Kaiser, G.W.; Smith, A.R. 1987. Migration chronology, length of stay, sex ratio, and weight of WesternSandpipers (Calidris mauri) on the south coast of British Columbia. J. Field Ornithol. 58: 103–111.
Butler, R.W.; Delgado, F.S.; de la Cueva, H.; Pulido, V.; Sandercock, B.K. 1996. Migration routes of the WesternSandpiper. Wilson Bull. 108: 662–672.
Campbell, R.W.; Dawe, N.K.; McTaggart-Cowan, I.; Cooper, J.M.; Kaiser, G.W.; McNall, M.C.E. 1990. The birds ofBritish Columbia. Vol. II. Non-passerines. Royal British Columbia Museum, Victoria, British Columbia. 636 pp.
Clark, K.E.; Niles, L.J.; Burger, J. 1993. Abundance and distribution of migrant shorebirds in Delaware Bay. Condor 95:694–705.
Collar, N.J.; Gonzaga, L.P.; Krabbe, N.; Madrono-Nieto, A.; Parker, T.A., III; Wege, D.C. 1992. Threatened birds ofthe Americas. IUCN Red Data Book. International Council for Bird Preservation (ICBP), Cambridge, U.K.
55
Colwell, M.A.; Jehl, J.R. 1994. Wilson’s Phalarope (Phalaropus tricolor). The Birds of North America No. 83 (A. Pooleand F. Gill, eds.). Academy of Natural Sciences, Philadelphia, Pennsylvania, and American Ornithologists’ Union,Washington, D.C. 20 pp.
Cooper, J.M. 1994. Least Sandpiper (Calidris minutilla). The Birds of North America No. 115 (A. Poole and F. Gill, eds.).Academy of Natural Sciences, Philadelphia, Pennsylvania, and American Ornithologists’ Union, Washington, D.C.28 pp.
COSEWIC (Committee on the Status of Endangered Wildlife in Canada). 1998. List of species at risk, April 1998.Ottawa, Ontario. 25 pp.
Cramp, S.; Simmons, K.E.L. 1983. Handbook of the birds of Europe, the Middle East and North Africa. Vol. III. Waders togulls. Oxford University Press, Oxford, U.K. 913 pp.
Davidson, N.C.; Pienkowski, M.W. (eds.). 1987. The conservation of international flyway populations of waders. WaderStudy Group Bulletin 49, Supplement/International Waterfowl Research Bureau (IWRB) Special Publication 7. 151 pp.
del Hoyo, J.; Elliott, A.; Sargatal, J. (eds.). 1996. Handbook of the birds of the world. Vol. 3. Hoatzin to auks. LynxEditions, Barcelona, Spain.
de Smet, K. 1992. Status report on the Long-billed Curlew Numenius americanus in Canada. Committee on the Status ofEndangered Wildlife in Canada. Canadian Wildlife Service, Ottawa, Ontario. 28 pp.
Dunning, J.B. 1984. Body weights of 686 species of North American birds. Eldon Publishing, Cave Creek, Arizona. 38 pp.
Elphick, C.S.; Tibbitts, T.L. 1998. Greater Yellowlegs (Tringa melanoleuca). The Birds of North America No. 355 (A.Poole and F. Gill, eds.). The Birds of North America, Inc., Philadelphia, Pennsylvania. 24 pp.
Engelmoer, M.; Roselaar, C. 1998. Geographical variation in waders. Kluwer Academic Publishers, Dordrecht,Netherlands.
Engilis, A.; Oring, L.W.; Carrera, E.; Nelson, J.W.; Lopez, A.M. 1998. Shorebird surveys in Ensenada Pabellones andBahia Santa Maria, Sinaloa, Mexico: critical winter habitats for Pacific Flyway shorebirds. Wilson Bull. 110: 332–341.
Frazier, S. 1996. An overview of the world’s Ramsar Sites. Wetlands International Publication No. 39, WetlandsInternational, Slimbridge, U.K. 58 pp.
Gauthier, J.; Aubrey, Y. 1996. The breeding birds of Quebec: Atlas of the breeding birds of southern Quebec. Associationquébécoise des groupes d’ornithologues, Province of Quebec Society for the Protection of Birds, and Canadian WildlifeService, Environment Canada, Montreal, Quebec. 1302 pp.
Gibson, D.D.; Kessel, B. 1989. Geographic variations in the Marbled Godwit and description of an Alaska subspecies.Condor 91: 436–443.
Gill, R.E.; Handel, C.M. 1990. The importance of subarctic intertidal habitats to shorebirds: a study of the centralYukon-Kuskokwim Delta, Alaska. Condor 9: 709–725.
Gill, R.E.; McCaffery, B.J. 1999. Bar-tailed Godwits Limosa lapponica in Alaska: a population estimate from staginggrounds. Wader Study Group Bull. 88: 49–54.
Gill, R.E.; Redmond, R.L. 1992. Distribution, numbers, and habitat of Bristle-thighed Curlews Numenius tahitiensis onRangiroa Atoll. Notornis 39: 17–26.
Gill, R.E.; Butler, R.W.; Tomkovitch, P.S.; Mundkur, T.; Handel, C.M. 1994. Conservation of North Pacific shorebirds.Trans. N. Am. Wildl. Nat. Resour. Conf. 59: 63–78.
Gill, R.E.; Canevari, P.; Iversen, E.H. 1998. Eskimo Curlew (Numenius borealis). The Birds of North America No. 347(A. Poole and F. Gill, eds.). The Birds of North America, Inc., Philadelphia, Pennsylvania. 28 pp.
Gill, R.E.; Tibbitts, T.L.; Handel, C.M. 1999. Profiles of potential Western Hemisphere Shorebird Reserve Network Sitesin Alaska. Unpublished report, Alaska Biological Science Center, U.S. Geological Survey, Anchorage, Alaska. 134 pp.
Godfrey, W.E. 1986. The birds of Canada. Revised edition. National Museum of Natural Sciences, Ottawa, Ontario. 595 pp.
Gollop, J.B.; Barry, T.W.; Iversen, E.H. 1986. Eskimo Curlew. A vanishing species? Saskatchewan Natural HistorySociety, Regina, Saskatchewan. 160 pp.
56
Goosen, J.P.; Amirault, D.L.; Arndt, J.E.; Boates, S.; Brazil, J.; Bjorge, R.; Brechtel, S.; Corbett, G.N.; Curley, F.R.;Flemming, S.P.; Harris, W.; Heyens, L.; Hjertaas, D.; Huot, M.; Jones, R.; Koonz, W.; Laporte, P.; McAskill, D.;Morrison, R.I.G.; Richard, S.G.; Wiltse, E. 1997. Revised Canadian Piping Plover Recovery Plan (draft). Recovery ofNationally Endangered Wildlife (RENEW), Canadian Nature Federation, Ottawa, Ontario. 50 pp.
Graber, R.R.; Graber, J.W. 1963. A comparative study of bird populations in Illinois, 1906–1909 and 1956–1958. IllinoisNatural History Survey Bulletin 28.
Gratto-Trevor, C.L. 1992. Semipalmated Sandpiper (Calidris pusilla). The Birds of North America No. 6 (A. Poole and F.Gill, eds.). Academy of Natural Sciences, Philadelphia, Pennsylvania, and American Ornithologists’ Union, Washington,D.C. 20 pp.
Gratto-Trevor, C.L. 1996. Use of Landsat TM imagery in determining important shorebird habitat in the outer MackenzieDelta, Northwest Territories. Arctic 49: 11–22.
Gratto-Trevor, C.L. 2000. Marbled Godwit Limosa fedoa. The Birds of North America. The Birds of North America, Inc.,Philadelphia, Pennsylvania. In press.
Gratto-Trevor, C.L.; Johnston, V.H.; Pepper, S.T. 1998. Changes in shorebird and eider abundance in the RasmussenLowlands, NWT. Wilson Bull. 110: 316–325.
Hagar, J.A. 1956. Magdalen Islands — 1956. Unpublished manuscript, Canadian Wildlife Service, Sackville, NewBrunswick.
Haig, S.M. 1992. Piping Plover (Charadrius melodus). The Birds of North America No. 2 (A. Poole, P. Stettenheim, and F.Gill, eds.). Academy of Natural Sciences, Philadelphia, Pennsylvania, and American Ornithologists’ Union, Washington,D.C. 18 pp.
Haig, S.M.; Gratto-Trevor, C.L.; Mullins, T.W.; Colwell, M.A. 1997. Population identification of Western Hemisphereshorebirds throughout the annual cycle. Mol. Ecol. 6: 418–427.
Handel, C.M.; Gill, R.E. 1992. Breeding distribution of the Black Turnstone. Wilson Bull. 104: 122–135.
Harrington, B.A. 1993a. A coastal, aerial winter shorebird survey in Sonora and Sinaloa, Mexico, January 1993. ManometObservatory for Conservation Sciences, Manomet, Massachusetts.
Harrington, B.A. 1993b. A coastal, aerial winter shorebird survey on the Sonora and Sinaloa coasts of Mexico. WaderStudy Group Bull. 67: 44–49.
Harrington, B.A. 1994. A coastal, aerial winter shorebird survey in Sonora, Sinaloa, and Nayarit, Mexico, January 1994.Manomet Observatory for Conservation Sciences, Manomet, Massachusetts.
Harrington, B. 1995. Shorebirds: east of the 105th meridian. Pages 57–60 in Our living resources. U.S. Department of theInterior, National Biological Service, Washington, D.C.
Harrington, B.A.; Page, G.W. 1992. Development of a North American survey for monitoring shorebird populations.Report for U.S. Fish and Wildlife Service. Manomet Bird Observatory, Manomet, Massachusetts, and Point Reyes BirdObservatory, Stinson Beach, California.
Harrington, B.; Perry, E. 1995. Important shorebird staging sites meeting Western Hemisphere Shorebird Reserve Networkcriteria in the United States. U.S. Department of the Interior, Washington, D.C. 121 pp.
Harrington, B.A.; Hagan, J.M.; Leddy, L.E. 1988. Site fidelity and survival differences between two groups of NewWorld Red Knots Calidris canutus. Auk 105: 439–445.
Hayman, P.; Marchant, J.; Prater, T. 1986. Shorebirds. An identification guide to the waders of the world. Croom HelmLtd., Beckenham, Kent, U.K. 412 pp.
Heyens, L.E.; Anderson, D.J. 1998. 1998 Ontario report: Prairie Piping Plover Recovery Team. Unpublished report,Ontario Ministry of Natural Resources, Kenora, Ontario. 6 pp.
Hicklin, P.W. 1987. The migration of shorebirds in the Bay of Fundy. Wilson Bull. 99: 540–570.
Higgins, P.J.; Davies, S.J.J.F. (eds.). 1996. Handbook of Australian, New Zealand and Antarctic birds. Vol. 3. Snipe topigeons. Oxford University Press, Melbourne, Australia.
Holmes, R.T.; Pitelka, F.A. 1998. Pectoral Sandpiper (Calidris melanotos). The Birds of North America No. 348 (A. Pooleand F. Gill, eds.). The Birds of North America, Inc., Philadelphia, Pennsylvania. 24 pp.
57
Howe, M.A.; Geissler, P.H.; Harrington, B.A. 1989. Population trends of North American shorebirds based on theInternational Shorebird Survey. Biol. Conserv. 49: 185–199.
IBA (Important Bird Areas Program). 1998. Internet Website address: http://www.ibacanada.com, updated 2 February1998.
Igl, L.D.; Johnson, D.H. 1997. Changes in breeding bird populations in North Dakota: 1967 to 1992–93. Auk 114: 74–92.
Islieb, M.E. 1979. Migratory shorebird populations on the Copper River Delta and eastern Prince William Sound, Alaska.Stud. Avian Biol. 2: 125–129.
Islieb, M.E.; Kessel, B. 1973. Birds of the North Gulf Coast–Prince William Sound region, Alaska. Biological Papers of theUniversity of Alaska No. 14.
Iverson, G.C.; Warnock, S.E.; Butler, R.W.; Bishop, M.A.; Warnock, N. 1996. Spring migration of Western Sandpipers(Calidris mauri) along the Pacific coast of North America: a telemetry study. Condor 98: 10–21.
Jehl, J.R. 1985. Hybridization and evolution of oystercatchers on the Pacific coast of Baja California. Ornithol. Monogr. 36:484–504.
Jehl, J.R. 1988. Biology of the Eared Grebe and Wilson’s Phalarope in the non-breeding season: a study of adaptations tosaline lakes. Stud. Avian Biol. 12.
Johnson, O.W.; Connors, P.G. 1996. American Golden-Plover (Pluvialis dominica), Pacific Golden-Plover (Pluvialisfulva). The Birds of North America No. 201-202 (A. Poole and F. Gill, eds.). Academy of Natural Sciences,Philadelphia, Pennsylvania, and American Ornithologists’ Union, Washington, D.C. 40 pp.
Keppie, D.M.; Whiting, R.M. 1994. American Woodcock (Scolopax minor). The Birds of North America No. 100 (A.Poole and F. Gill, eds.). Academy of Natural Sciences, Philadelphia, Pennsylvania, and American Ornithologists’ Union,Washington, D.C. 28 pp.
Kessel, B. 1989. Birds of the Seward Peninsula, Alaska. University of Alaska Press, Fairbanks, Alaska.
Kessel, B.; Gibson, D.D. 1978. Status and distribution of Alaska birds. Stud. Avian Biol. 1: 1–100.
Klima, J.; Jehl, J.R. 1998. Stilt Sandpiper Calidris himantopus. The Birds of North America No. 341 (A. Poole and F. Gill,eds.). The Birds of North America, Inc., Philadelphia, Pennsylvania. 20 pp.
Knopf, F. 1994. Avian assemblages on altered grasslands. Stud. Avian Biol. 15: 247–257.
Knopf, F.L. 1996. Mountain Plover Charadrius montanus. The Birds of North America No. 155 (A. Poole and F. Gill, eds.).Academy of Natural Sciences, Philadelphia, Pennsylvania, and American Ornithologists’ Union, Washington, D.C. 20pp.
Lanctot, R.B.; Laredo, C.D. 1994. Buff-breasted Sandpiper (Tryngites subruficollis). The Birds of North America No. 91(A. Poole and F. Gill, eds.). Academy of Natural Sciences, Philadelphia, Pennsylvania, and American Ornithologists’Union, Washington, D.C. 20 pp.
Lincoln, F.C. 1952. Migration of birds. Doubleday, New York, N.Y.
Maisonneuve, C. 1982. Distribution et abondance des oiseaux de rivage le long du Saint-Laurent. (Estuarie moyen, estuairemaritime, Gaspésie, Baie des Chaleurs, Côte Nord et Îles-de-la-Madeleine.) Canadian Wildlife Service Report, CanadianWildlife Service, Ste-Foy, Quebec. 81 pp.
Maisonneuve, C.; Brousseau, P.; Lahoux, D. 1990. Critical fall staging sites for shorebirds migrating through the St.Lawrence system, Quebec. Can. Field-Nat. 104: 372–378.
MCCS (Manomet Center for Conservation Sciences). 1999. Western Hemisphere Shorebird Reserve Network selectioncriteria. Internet Website address: http://www.manomet.org/wetlands/criteria.htm (revised 5 April 1999).
Meltofte, H. 1985. Populations and breeding schedules of waders, Charadrii, in high arctic Greenland. Medd. Groenl. 16:1–43.
Meltofte, H.; Blew, J.; Frikke, J.; Rosner, H.-U.; Smit, C.J. 1994. Numbers and distribution of waterbirds in the WaddenSea. International Waterfowl and Wetlands Research Bureau (IWRB) Publication 34/Wader Study Group BulletinSpecial Issue. 192 pp.
Morrison, R.I.G. 1975. Migration and morphometrics of European Knot and Turnstone on Ellesmere Island, Canada.Bird-Banding 46: 290–301.
58
Morrison, R.I.G. 1976. Further records, including the first double journey recovery, of European-banded Ruddy Turnstoneson Ellesmere Island, N.W.T. Bird-Banding 47: 274.
Morrison, R.I.G. 1983. A hemispheric perspective on the distribution and migration of some shorebirds in North and SouthAmerica. Pages 84–94 in H. Boyd (ed.), First Western Hemisphere Waterfowl and Waterbird Symposium. CanadianWildlife Service Special Publication, Canadian Wildlife Service, Ottawa, Ontario. 147 pp.
Morrison, R.I.G. 1984. Migration systems of some New World shorebirds. Pages 125–202 in J. Burger and B.L. Olla (eds.),Shorebirds. Migration and foraging behavior. Behavior of Marine Animals Vol. 6. Plenum Press, New York, N.Y.
Morrison, R.I.G. 1992. Avifauna of the Ellesmere Island National Park Reserve. Canadian Wildlife Service TechnicalReport Series No. 158, Canadian Wildlife Service, Ottawa, Ontario. 110 pp.
Morrison, R.I.G. 1993. Shorebird population status and trends in Canada. Bird Trends 3: 3–6. Canadian Wildlife Service,Ottawa, Ontario.
Morrison, R.I.G. 1997. The use of remote sensing to evaluate shorebird habitats and populations on Prince Charles Island,Foxe Basin, Canada. Arctic 50: 55–75.
Morrison, R.I.G.; Harrington, B.A. 1979. Critical shorebird resources in James Bay and eastern North America. Trans. N.Am. Wildl. Nat. Resour. Conf. 44: 498–507.
Morrison, R.I.G.; Harrington, B.A. 1992. The migration system of the Red Knot Calidris canutus rufa in the New World.Wader Study Group Bull. 64 (Suppl.): 71–84.
Morrison, R.I.G.; Ross, R.K. 1989. Atlas of Nearctic shorebirds on the coast of South America. 2 vols. Special Publication,Canadian Wildlife Service, Ottawa, Ontario. 325 pp.
Morrison, R.I.G.; Ross, R.K.; Torres, M.S. 1992. Aerial surveys of Nearctic shorebirds wintering in Mexico: somepreliminary results. Canadian Wildlife Service Progress Notes No. 201, Canadian Wildlife Service, Ottawa, Ontario. 11pp.
Morrison, R.I.G.; Ross, R.K.; Guzman, P.J.; Estrada, A. 1993. Aerial surveys of Nearctic shorebirds wintering inMexico: preliminary results of surveys on the Gulf of Mexico and Caribbean coasts. Canadian Wildlife Service ProgressNotes No. 206, Canadian Wildlife Service, Ottawa, Ontario. 14 pp.
Morrison, R.I.G.; Bourget, A.; Butler, R.; Dickson, H.L.; Gratto-Trevor, C.; Hicklin, P.; Hyslop, C.; Ross, R.K.1994a. A preliminary assessment of the status of shorebird populations in Canada. Can. Wildl. Serv. Prog. Notes 208:1–19.
Morrison, R.I.G.; Downes, C.; Collins, B. 1994b. Population trends of shorebirds on fall migration in eastern Canada1974–1991. Wilson Bull. 106: 431–447.
Morrison, R.I.G.; Ross, R.K.; Guzman, P.J. 1994c. Aerial surveys of Nearctic shorebirds wintering in Mexico:preliminary results of surveys of the southern half of the Pacific coast, Chiapas to Sinaloa. Canadian Wildlife ServiceProgress Notes No. 209, Canadian Wildlife Service, Ottawa, Ontario. 21 pp.
Morrison, R.I.G.; Butler, R.W.; Beyersbergen, G.W.; Dickson, H.L.; Bourget, A.; Hicklin, P.W.; Goosen, J.P.; Ross,R.K.; Gratto-Trevor, C.L. 1995. Potential Western Hemisphere Shorebird Reserve Network sites for shorebirds inCanada. 2nd edition. Technical Report No. 227, Canadian Wildlife Service, Ottawa, Ontario. 104 pp.
Morrison, R.I.G.; Ross, R.K.; Antas, P.T.Z.; Nascimento, I. 1997. The distribution and abundance of Nearctic andNeotropical shorebirds and other waterbirds in the Pantanal, Brasil, in October 1996. Unpublished report, World WildlifeFund, Toronto, Ontario, and Canadian Wildlife Service, Ottawa, Ontario. 71 pp.
Morrison, R.I.G.; Butler, R.W.; Delgado, F.S.; Ross, R.K. 1998. Atlas of Nearctic shorebirds and other waterbirds on thecoast of Panama. Special Publication, Canadian Wildlife Service, Ottawa, Ontario. 112 pp.
Moskoff, W. 1995. Solitary Sandpiper (Tringa solitaria). The Birds of North America No. 156 (A. Poole and F. Gill, eds.).Academy of Natural Sciences, Philadelphia, Pennsylvania, and American Ornithologists’ Union, Washington, D.C.16 pp.
Myers, J.P. 1979. Leks, sex and Buff-breasted Sandpipers. Am. Birds 33: 823–825.
Myers, J.P. 1980. Territoriality and flocking by Buff-breasted Sandpipers: variations in non-breeding dispersion. Condor82: 241–250.
59
Nol, E.; Humphrey, R.C. 1994. American Oystercatcher (Haematopus palliatus). The Birds of North America No. 82 (A.Poole and F. Gill, eds.). Academy of Natural Sciences, Philadelphia, Pennsylvania, and American Ornithologists’ Union,Washington, D.C. 24 pp.
Nol, E.; Truitt, B.; Allen, D.; Winn, B.; Murphy, T. 2000. A survey of wintering American Oystercatchers from Georgiato Virginia, U.S.A., 1999. Unpublished report, Trent University, Peterborough, Ontario. 7 pp.
Oring, L.W.; Gray, E.M.; Reed, J.M. 1997. Spotted Sandpiper (Actitis macularia). The Birds of North America No. 289(A. Poole and F. Gill, eds.). Academy of Natural Sciences, Philadelphia, Pennsylvania, and American Ornithologists’Union, Washington, D.C. 32 pp.
Page, G.W.; Gill, R.E. 1994. Shorebirds in western North America: late 1800s to late 1900s. Stud. Avian Biol. 15: 147–160.
Page, G.W.; Palacios, E. 1993. Winter shorebird numbers in wetlands along the west coast of Baja California. Point ReyesBird Observatory, Stinson Beach, California, and Centro de Investigacion Cientifica y Educacion Superior de Ensenada(CICESE), Ensenada, Mexico. 17 pp.
Page, G.W.; Shuford, W.D.; Kjelmyr, J.E.; Stenzel, L.E. 1992. Shorebird numbers in wetlands of the Pacific flyway: asummary of counts from April 1988 to January 1992. Point Reyes Bird Observatory, Stinson Beach, California. 20 pp. +appendices.
Page, G.W.; Warriner, J.S.; Paton, P.W.C. 1995. Snowy Plover (Charadrius alexandrinus). The Birds of North AmericaNo. 154 (A. Poole and F. Gill, eds.). Academy of Natural Sciences, Philadelphia, Pennsylvania, and AmericanOrnithologists’ Union, Washington, D.C. 24 pp.
Page, G.W.; Palacios, E.; Alfaro, L.; Gonzalez, S.; Stenzel, L.E.; Jungers, M. 1997. Numbers of wintering shorebirds incoastal wetlands of Baja California, Mexico. J. Field Ornithol. 68: 562–574.
Page, G.W.; Stenzel, L.E.; Kjelmyr, J.E. 1999. Overview of shorebird abundance and distribution in wetlands of thePacific coast of the contiguous United States. Condor 101: 461–471.
Palmer, R.S. 1967. Species accounts. Pages 143–267 in G.D. Stout (ed.), The shorebirds of North America. Viking Press,New York, N.Y.
Parmelee, D.F. 1992. White-rumped Sandpiper (Calidris fuscicollis). The Birds of North America No. 29 (A. Poole,P. Stettenheim, and F. Gill, eds.). Academy of Natural Sciences, Philadelphia, Pennsylvania, and AmericanOrnithologists’ Union, Washington, D.C. 16 pp.
Paulson, D. 1995. Black-bellied Plover (Pluvialis squatarola). The Birds of North America No. 186 (A. Poole and F. Gill,eds.). Academy of Natural Sciences, Philadelphia, Pennsylvania, and American Ornithologists’ Union, Washington, D.C.28 pp.
Perennou, C.P.; Mundkur, T.; Scott, D.A. 1994. The Asian Waterfowl Census 1987–1991: distribution and status of Asianwaterfowl. IWRB Special Publication No. 24, International Waterfowl and Wetlands Research Bureau, Slimbridge,U.K.; and AWB Special Publication No. 86, Asian Wetland Bureau, Kuala Lumpur, Malaysia.
Piersma, T.; Davidson, N. 1992a. The migrations and annual cycles of five subspecies of Knots in perspective. WaderStudy Group Bull. 64 (Suppl.): 187–197.
Piersma, T.; Davidson, N. (eds.). 1992b. The migration of knots. Wader Study Group Bull. 64 (Suppl.): 1–209.
Piersma, T.; Beintema, A.J.; Davidson, N.C.; OAG Munster; Pienkowski, M.W. 1987. Wader migration systems in theEast Atlantic. Pages 35–56 in Wader Study Group Bulletin 49, Supplement/International Waterfowl Research Bureau(IWRB) Special Publication 7.
Plissner, J.H.; Haig, S.M. 2000. Status of a broadly-distributed endangered species: results and implications of the secondInternational Piping Plover Census. Can. J. Zool. 78: 128–139.
Rappoldt, C.; Kersten, M.; Smit, C. 1985. Errors in large-scale shorebird counts. Ardea 73: 13–24.
RENEW (Recovery of Nationally Endangered Wildlife). 1998. RENEW Report No. 8. 1988–98. Canadian WildlifeService, Ottawa, Ontario. 52 pp.
RENEW (Recovery of Nationally Endangered Wildlife). 1999. RENEW Report No. 9. 1998–99. Canadian WildlifeService, Ottawa, Ontario. 48 pp.
Richards, A. 1988. Shorebirds of the northern hemisphere. Dragon’s World Ltd., Limpsfield, Surrey, U.K. 224 pp.
Ricklefs, R.E. 1973. Ecology. Chiron Press, Inc., Portland, Oregon. 861 pp.
60
Riegen, A.C. 1999. Movement of banded arctic waders to and from New Zealand. Notornis 46: 123–142.
Robinson, J.A.; Oring, L.W.; Skorupa, J.P.; Boettcher, R. 1997. American Avocet (Recurvirostra americana). The Birdsof North America No. 275 (A. Poole and F. Gill, eds.). Academy of Natural Sciences, Philadelphia, Pennsylvania, andAmerican Ornithologists’ Union, Washington, D.C. 32 pp.
Rose, P.M.; Scott, D.A. 1994. Waterfowl population estimates. International Waterfowl and Wetlands Research Bureau(IWRB), Slimbridge, U.K. 102 pp.
Rose, P.M.; Scott, D.A. 1997. Waterfowl population estimates. 2nd edition. Wetlands International, Wageningen,Netherlands. 106 pp.
Sagar, P.M.; Shankar, U.; Brown, S. 1999. Distribution and numbers of waders in New Zealand, 1983–1994. Notornis 46:1–43.
Sauer, J.R.; Hines, J.E.; Gough, G.; Thomas, I.; Peterjohn, B.G. 1997. The North American Breeding Bird Surveyresults and analysis. Version 96.4. Patuxent Wildlife Research Center, Laurel, Maryland (updated draft version on BBSInternet Website at http://www.mbr.nbs.gov/bbs/trend/trend98.html).
Scott, D.A.; Carbonell, M. 1986. A directory of Neotropical wetlands. International Union for Conservation of Nature andNatural Resources (IUCN), Cambridge, U.K., and International Waterfowl and Wetlands Research Bureau (IWRB),Slimbridge, U.K. 684 pp.
Senner, S.E.; McCaffery, B.J. 1997. Surfbird (Aphriza virgata). The Birds of North America No. 266 (A. Poole and F. Gill,eds.). Academy of Natural Sciences, Philadelphia, Pennsylvania, and American Ornithologists’ Union, Washington, D.C.20 pp.
Skagen, S.K.; Sharpe, P.B.; Waltermire, R.G.; Dillon, M.B. 1999. Biogeographical profiles of shorebird migration inmidcontinental North America. Biological Science Report USGS/BRD/BSR-2000-0003. U.S. Government PrintingOffice, Denver, Colorado. 167 pp. (also published on Internet at http://www.mesc.usgs.gov/shorebirds).
Skeel, M.A.; Mallory, E.P. 1996. Whimbrel (Numenius phaeopus). The Birds of North America No. 219 (A. Poole and F.Gill, eds.). Academy of Natural Sciences, Philadelphia, Pennsylvania, and American Ornithologists’ Union, Washington,D.C. 28 pp.
Smit, C.J.; Piersma, T. 1989. Numbers, midwinter distribution, and migration of wader populations using the East AtlanticFlyway. Pages 24–63 in H. Boyd and J.-Y Pirot (eds.), Flyways and reserve networks for water birds. IWRB SpecialPublication No. 9, Canadian Wildlife Service, Ottawa, Ontario, and International Waterfowl and Wetlands ResearchBureau, Slimbridge, U.K. 109 pp.
Smith, S.M.; Stiles, F.G. 1979. Banding studies of migrant shorebirds in northwestern Costa Rica. Stud. Avian Biol. 2:41–47.
Snow, D.W.; Perrins, C.M. 1998. The birds of the Western Palearctic. Concise edition. Oxford University Press, Oxford,U.K. 1008 pp.
Spaans, A.L. 1978. Status and numerical fluctuations of some North American waders along the Surinam coast. WilsonBull. 90: 60–83.
Spaans, A.L. 1984. Waterbird studies in coastal Suriname: a contribution to wetland conservation in northeastern SouthAmerica. Pages 63–76 in Annual report 1983. Research Institute for Nature Management, Wageningen, Netherlands.
Stewart, R.E.; Kantrud, H.A. 1972. Population estimates of breeding birds in North Dakota. Auk 89: 766–788.
Summers, R.W. 1994. The migration patterns of the Purple Sandpiper Calidris maritima. Ostrich 65: 167–173.
Thompson, M.C. 1973. Migratory patterns of Ruddy Turnstones in the central Pacific region. Living Bird 12: 5–23.
Warnock, N.; Bishop, M.A. 1998. Spring stopover ecology of migrant Western Sandpipers. Condor 100: 456–467.
Warnock, N.D.; Gill, R.E. 1996. Dunlin (Calidris alpina). The Birds of North America No. 203 (A. Poole and F. Gill, eds.).Academy of Natural Sciences, Philadelphia, Pennsylvania, and American Ornithologists’ Union, Washington, D.C.24 pp.
Watkins, D. 1993. A national plan for shorebird conservation in Australia. Australasian Wader Study Group, RAOU ReportNo. 90, Royal Australian Ornithologists’ Union, Melbourne, Australia.
Watts, B.D.; Bradshaw, D.S.; Watts, M.U. 1998. Migrant shorebirds within the upper Bay of Panama. Centre forConservation Biology, College of William and Mary, Williamsburg, Virginia. 16 pp.
61
White, R.P. 1983. Distribution and habitat preference of the Upland Sandpiper Bartramia longicauda in Wisconsin. Am.Birds 37: 16–22.
Whitfield, D.P.; Brade, J.J.; Burton, R.W.; Hankinson, K.W. 1996. The abundance of breeding Knot Calidris canutusislandica. Bird Study 43: 290–299.
Wilson, W.H. 1994. Western Sandpiper (Calidris mauri). The Birds of North America No. 90 (A. Poole and F. Gill, eds.).Academy of Natural Sciences, Philadelphia, Pennsylvania, and American Ornithologists’ Union, Washington, D.C. 20pp.
Yates, M.G.; Goss-Custard, J.D. 1991. A comparison between high water and low water counts of shorebirds on the Wash,east England. Bird Study 38: 179–187.
Zink, R.M.; Rohwer, S.; Andreev, A.V.; Dittman, D.L. 1985. Trans-Beringia comparisons of mitochondrial DNAdifferentiation in birds. Condor 97: 639–649.
62

Recent publications in theOccasional Papers series
No. 76Declines in Canadian amphibian populations: designing a national monitoring strategy, by C.A. Bishop, K.E. Pettit, eds.Cat. No. CW69-1/76E. Publ. 1992.
No. 77Studies of high-latitude seabirds. 3. A model of the energy demands of the seabirds of eastern and Arctic Canada, by A.W.Diamond, A.J. Gaston, and R.G.B. Brown (edited by W.A. Montevecchi).Cat. No. CW69-1/77E. Publ. 1993.
No. 78Historical review of water bird populations and annotated list of water birds associated with Burlington Bay, Lake Ontario,1857-1990, by M.B. Gebauer, R.Z. Dobos, and D. Vaughn Weseloh.Cat. No. CW69-1/78E. Publ. 1993.
No. 79Hydrological classification of Canadian prairie wetlands and prediction of wetland inundation in response to climatic variability,by Ming-ko Woo, Robert D. Rowsell, and Robert G. Clark.Cat. No. CW69-1/79E. Publ. 1993.
No. 80Monitoring Thick-billed Murre populations at colonies in northern Hudson Bay, 1972-92, by A.J. Gaston, L.N. de Forest, G.Gilchrist, and D.N. Nettleship.Cat. No. CW69-1/80E. Publ. 1994.
No. 81Colonies and numbers of Ross’ Geese and Lesser Snow Geese in the Queen Maud Gulf Migratory Bird Sanctuary, by R.H.Kerbes.Cat. No. CW69-1/81E. Publ. 1994.
No. 82The 1991 International Piping Plover Census in Canada, by S.P. Flemming, ed.Cat. No. CW69-1/82E. Publ. 1994.
No. 83The abundance and distribution of estuarine birds in the Strait of Georgia, British Columbia, by R.W. Butler and K. Vermeer,eds.Cat. No. CW69-1/83E. Publ. 1994.
No. 84Wintering populations of Lesser Snow Geese and Ross’ Geese in the Northern Highlands of México, 1988-1990, by BruceTurner, Roy Tomlinson, Raquel Leyva, and Pablo Dominguez.Cat. No. CW69-1/84E. Publ. 1994.
No. 85Caspian Terns on the Great Lakes: organochlorine contamination, reproduction, diet, and population changes, 1972-91, by PeterJ. Ewins, D.V. (Chip) Weseloh, Ross J. Norstrom, Karin Legierse, Heidi J. Auman, and James P. Ludwig.Cat. No. CW69-1/85E. Publ. 1994.
No. 86The patient predator: foraging and population ecology of the Great Blue Heron Ardea herodias in British Columbia, by Robert W.Butler.Cat. No. CW69-1/86E. Publ. 1995.
No. 87Use of various habitat types by nesting ducks on islands in the St. Lawrence River between Montréal and Trois-Rivières, by LucBélanger and Denis Lehoux. Disponible également en français.Cat. No. CW69-1/87E. Publ. 1995.
63

No. 88A review of the environmental impacts of lead shotshell ammunition and lead fishing weights in Canada, by A.M. Scheuhammerand S.L. Norris. Disponible également en français.Cat. No. CW69-1/88E. Publ. 1995.
No. 89The colonial waterbirds of Great Slave Lake, Northwest Territories: an annotated atlas, by J. Sirois, M.A. Fournier, and M.F.Kay.Cat. No. CW69-1/89E. Publ. 1995.
No. 90Duck use of the coastal habitats of northeastern James Bay, by Austin Reed, Réjean Benoit, Richard Lalumière, and MichelJulien. Disponible également en français.Cat. No. CW69-1/90E. Publ. 1996.
No. 91Studies of high-latitude seabirds. 4. Trophic relationships and energetics of endotherms in cold ocean systems, by W.A.Montevecchi, ed.Cat. No. CW69-1/91E. Publ. 1996.
No. 92Goose use of the coastal habitats of northeastern James Bay, by Austin Reed, Réjean Benoit, Michel Lalumière. Disponibleégalement en français.Cat. No. CW69-1/92E. Publ. 1996.
No. 93The ecology, status, and conservation of marine and shoreline birds of the Queen Charlotte Islands, by K. Vermeer and K.H.Morgan, eds.Cat. No. CW69-1/93E. Publ. 1997.
No. 94King and Common eiders of the western Canadian Arctic, by D. Lynne Dickson, ed.Cat. No. CW69-1/94E. Publ. 1997.
No. 95Monitoring bird populations: the Canadian experience, by Erica H. Dunn, Michael D. Cadman, and J. Bruce Falls, eds.Cat. No. CW69-1/95E. Publ. 1997.
No. 96Winter distributions of Thick-billed Murres from the eastern Canadian Arctic and western Greenland in relation to age and timeof year, by G.M. Donaldson, A.J. Gaston, J.W. Chardine, K. Kampp, D.N. Nettleship, and R.D. Elliot.Cat. No. CW69-1/96E. Publ. 1997.
No. 97Shorebird migration and staging at a large prairie lake and wetland complex: the Quill Lakes, Saskatchewan, by Stuart A.Alexander and Cheri L. Gratto-Trevor.Cat. No. CW69-1/97E. Publ. 1997.
No. 98Distribution, survival, and numbers of Lesser Snow Geese of the Western Canadian Arctic and Wrangel Island, Russia, byRichard H. Kerbes, Katherine M. Meeres, and James E. Hines, eds.Cat. No. CW69-1/98E. Publ. 1999.
No. 99Breeding ecology of the Horned Grebe Podiceps auritus in subarctic wetlands, by Michael A. Fournier and James E. Hines.Cat. No. CW69-1/99E. Publ. 1999.
No. 100Behaviour and ecology of sea ducks, by R. Ian Goudie, Margaret R. Petersen, and Gregory J. Robertson, eds.Cat. No. CW69-1/100E. Publ. 1999.
No. 101Assessment of bird populations in the Rasmussen Lowlands, Nunavut, by Victoria H. Johnston, Cheri L. Gratto-Trevor, andStephen T. Pepper.Cat. No. CW69-1/101E. Publ. 2000.
No. 102Population modelling and management of Snow Geese, by Hugh Boyd, ed. Aussi disponible en français.Cat. No. CW69-1/102E. Publ. 2000.
No. 103Towards conservation of the diversity of Canada Geese (Branta canadensis), by Kathryn M. Dickson, ed.Cat. No. CW69-1/103E. Publ. 2000.
64


![Normalizing Flow Model for Policy Representation in ... · [13] Marc Lanctot, Vinicius Zambaldi, Audrunas Gruslys, et al. 2017. A unified game-theoretic approach to multiagent reinforcement](https://static.fdocuments.us/doc/165x107/5fd36bf1e68eae7a6c17d992/normalizing-flow-model-for-policy-representation-in-13-marc-lanctot-vinicius.jpg)