Canadian Scholarship Trust Family Savings Plan - … Scholarship Trust Plan Sponsor ... Government...
15
Canadian Scholarship Trust Family Savings Plan Semi-Annual Financial Statements April 30, 2012 Unaudited
Transcript of Canadian Scholarship Trust Family Savings Plan - … Scholarship Trust Plan Sponsor ... Government...

Canadian Scholarship Trust PlanSponsorCanadian Scholarship Trust Foundation2225 Sheppard Avenue East, Suite 600Toronto, Ontario M2J 5C21.877.333.RESP (7377)
Investment Fund Manager and DistributorC.S.T. Consultants Inc.2225 Sheppard Avenue East, Suite 600Toronto, Ontario M2J 5C2
TrusteeRBC Dexia Investor Services Trust155 Wellington Street West, 7th FloorToronto, Ontario M5V 3L3
Legal CounselHeenan Blaikie LLPBay Adelaide CentreP.O. Box 2900333 Bay Street, Suite 2900Toronto, Ontario M5H 2T4
AuditorDeloitte & Touche LLPBrookfield Place181 Bay Street, Suite 1400Toronto, Ontario M5J 2V1
BankRoyal Bank of CanadaRoyal Bank PlazaSouth Tower200 Bay Street, 10th FloorToronto, Ontario M5J 2J5
For updates on your Plan account, login to Online Services at www.cst.org
In Quebec, Canadian Scholarship Trust Plan is distributed by C.S.T. Consultants Inc. Scholarship Plan Brokerage Firm.
2002 P5-E (2012-04)
Canadian Scholarship TrustFamily Savings Plan
Semi-Annual Financial StatementsApril 30, 2012
Unaudited

Canadian Scholarship Trust Family Savings Plan
Contents
Statements of Net Assets Available for Education Assistance Payments 1Statements of Investment Operations 2Statements of Changes in Net Assets Available for Education Assistance Payments 2Statements of Cash Flows 3Schedule I – Statement of Investment Portfolio 4Notes to the Financial Statements 6Government Grants (Appendix I to Schedule I) 10
Unaudited semi-annual financial statements
The accompanying semi-annual financial statements have not been reviewed by the external auditors of the Plan in accordance with assurance standards applicable to a review of interim financial statements.

The accompanying notes are an integral part of these financial statements.
Canadian Scholarship Trust Family Savings PlanUnaudited Semi-Annual Financial Statements
Statements of Net Assets Available for Education Assistance PaymentsAs at April 30, 2012 and October 31, 2011 (in thousands of dollars)
Apr 30, 2012 Oct 31, 2011
(Audited)
AssetsInvestments, at fair value (Note 4 and Schedule I) $ 144,001 $ 138,341
Cash and cash equivalents 9,336 9,704
Short-term investments 28,642 24,861
Accrued interest and other receivables 3,778 1,982
Receivables for securities sold 109 728
Government grants receivable 13 41
185,879 175,657
LiabilitiesAccounts payable, accrued liabilities and unclaimed contributors’ funds 3,578 5,724
Payables for securities purchased 285 464
Contributors’ deposits (Note 6) 101,446 94,248
105,309 100,436
Net Assets Available for Education Assistance Payments 80,570 75,221
Represented by:Non-Discretionary Funds
Accumulated interest held for future education assistance payments 41,333 39,400
Government grants 28,065 24,840
Interest on Government grants 11,089 9,923
Unrealized Gains 83 1,058
$ 80,570 $ 75,221
Family Savings Plan 1

The accompanying notes are an integral part of these financial statements.
2 Family Savings Plan
Canadian Scholarship Trust Family Savings PlanUnaudited Semi-Annual Financial Statements
Statements of Investment Operations For the six months ended April 30, 2012 and 2011 (in thousands of dollars)
Apr 30, 2012 Apr 30, 2011
IncomeInterest income $ 2,454 $ 2,401
Realized losses (218) (50)
2,236 2,351
ExpensesPlan administration and processing fees (Note 3(a)) 739 642
Financial reporting (Note 3(a)) 239 220
Portfolio management fees 109 94
Custodian fees 9 8
Trustee fees 8 5
1,104 969
Net Investment Income 1,132 1,382
Decrease in Unrealized Gains (975) (1,724)
Increase (decrease) in Net Assets from Investment Operations $ 157 $ (342)
Statements of Changes in Net Assets Available for Education Assistance PaymentsFor the six months ended April 30, 2012 and 2011 (in thousands of dollars)
Apr 30, 2012 Apr 30, 2011
Net Assets Available for Education Assistance Payments, Beginning of Period $ 75,221 $ 67,764
Increase (decrease) in Net Assets from Investment Operations 157 (342)
Transfers from internal and external plans 10,575 8,328
10,732 7,986
DisbursementsGovernment grants repaid (net of receipts) (5) (296)
Payments to beneficiaries
Education assistance payments (4,238) (3,092)
Government grants (1,077) (743)
Return of interest (63) (22)
(5,378) (3,857)
Total Disbursements (5,383) (4,153)
Increase in Net Assets Available for Education Assistance Payments 5,349 3,833
Net Assets Available for Education Assistance Payments, End of Period $ 80,570 $ 71,597

The accompanying notes are an integral part of these financial statements.
Family Savings Plan 3
Canadian Scholarship Trust Family Savings PlanUnaudited Semi-Annual Financial Statements
Statements of Cash FlowsFor the six months ended April 30, 2012 and 2011 (in thousands of dollars)
Apr 30, 2012 Apr 30, 2011
Operating ActivitiesIncrease (decrease) in Net Assets from Investment Operations $ 157 $ (342)
Net disbursements for investment transactions (10,194) (19,094)
Items not affecting cash
Realized losses on sale of investments 218 50
Decrease in Unrealized Gains 975 1,724
Change in non-cash operating working capital
Increase in Accrued interest and other receivables (1,796) (253)
Decrease (increase) in Government grants receivable 28 (36)
Increase (decrease) in Accounts payable, accrued liabilities and unclaimed contributors’ funds (2,146) 541
Cash flow from Operating Activities (12,758) (17,410)
Financing ActivitiesTransfers from internal and external plans 10,575 8,328
Government grants repaid (net of receipts) (5) (296)
Increase in Contributors’ deposits (Note 6) 7,198 7,254
Payments to beneficiaries (5,378) (3,857)
Cash flow from Financing Activities 12,390 11,429
Net decrease in Cash and cash equivalents (368) (5,981)
Cash and cash equivalents, Beginning of Period 9,704 11,556
Cash and cash equivalents, End of Period $ 9,336 $ 5,575

4 Family Savings Plan
The accompanying notes are an integral part of these financial statements.
Canadian Scholarship Trust Family Savings PlanUnaudited Semi-Annual Financial Statements
Schedule I – Statement of Investment PortfolioAs at April 30, 2012 (in thousands of dollars)
Fair AverageSecurity Par Value ($) Value ($) Cost ($)
BondsFederal – 27.5%Government of Canada3.75% 1 Jun 2012 2,002 2,006 2,0521.50 1 Dec 2012 10,285 10,303 10,3791.75 1 Mar 2013 1,165 1,170 1,1782.50 1 Jun 2013 1,840 1,869 1,8783.50 1 Jun 2013 7,125 7,294 7,4442.50 1 Jun 2015 3,810 3,927 3,888
Canada Housing Trust4.80 15 Jun 2012 2,550 2,561 2,7282.75 15 Dec 2014 3,810 3,922 3,9012.45 15 Dec 2015 2,215 2,267 2,267
35,319 35,715
Provincial – 31.3%Province of British Columbia4.25 18 Jun 2014 1,335 1,410 1,4224.65 18 Dec 2018 4,560 5,185 5,016
Province of Ontario5.38 2 Dec 2012 5,005 5,123 5,3494.75 2 Jun 2013 3,645 3,775 3,9073.25 8 Sep 2014 9,120 9,453 9,4034.40 8 Mar 2016 2,015 2,194 2,2093.20 8 Sep 2016 225 236 240
Province of Quebec6.00 1 Oct 2012 1,975 2,014 2,1195.50 1 Dec 2014 7,735 8,472 8,5164.50 1 Dec 2016 175 193 1974.50 1 Dec 2020 1,950 2,182 2,005
40,237 40,383
Corporate – 11.9%Bank of Montreal5.18 6 Oct 2015 740 804 8082.96 2 Aug 2016 75 76 763.10 10 Mar 2016 250 256 256
Bank of Nova Scotia2.74 1 Dec 2016 365 367 3672.60 27 Feb 2017 160 160 1616.28 30 Jun 2053 874 914 934
BCIMC Realty Corporation5.25 19 Sep 2012 150 152 156
BMW Canada 2.88 8 Sep 2016 180 180 180
Caisse Centrale Desjardins3.11 4 Dec 2014 375 384 382
Fair AverageSecurity Par Value ($) Value ($) Cost ($)
Bonds (continued)Corporate – 11.9% (continued)Canadian Imperial Bank of Commerce2.65% 11 Aug 2016 90 90 913.15 2 Nov 2020 1,320 1,333 1,325
Cards II Trust 3.10 15 Sep 2015 314 322 318
Caterpillar Financial Services Ltd.2.64 12 Mar 2013 120 121 121
GE Capital Canada5.28 22 Oct 2014 575 615 6175.10 1 Jun 2016 692 751 747
Honda Canada Finance Inc.5.08 9 May 2013 115 119 1215.61 12 Sep 2013 500 524 533
HSBC Canada2.90 13 Jan 2017 350 352 3535.15 30 Jun 2049 836 884 889
Hydro One Inc.5.18 18 Oct 2017 200 227 230
Master Credit Card Trust2.63 21 Jan 2017 106 106 106
Merrill Lynch Financial Assets 4.82 12 Feb 2015 140 147 149
National Bank Canada2.23 30 Jan 2015 205 205 2053.58 26 Apr 2016 375 389 3923.26 4 Nov 2022 180 180 180
RBC Capital Trust4.87 31 Dec 2049 457 487 4885.81 31 Dec 2053 510 538 549
Real Estate Asset Liquidity Series Class A4.61 12 Nov 2016 375 402 405
Royal Bank of Canada3.18 2 Nov 2020 267 270 268
Score Trust4.95 20 Feb 2014 348 364 369
TD Capital Trust6.79 31 Dec 2049 674 695 715
Toronto Dominion Bank3.37 2 Nov 2020 610 621 617
Toyota Credit Canada Inc.3.55 22 Feb 2016 732 762 758
Family Savings Plan 5
The accompanying notes are an integral part of these financial statements.
Canadian Scholarship Trust Family Savings PlanUnaudited Semi-Annual Financial Statements
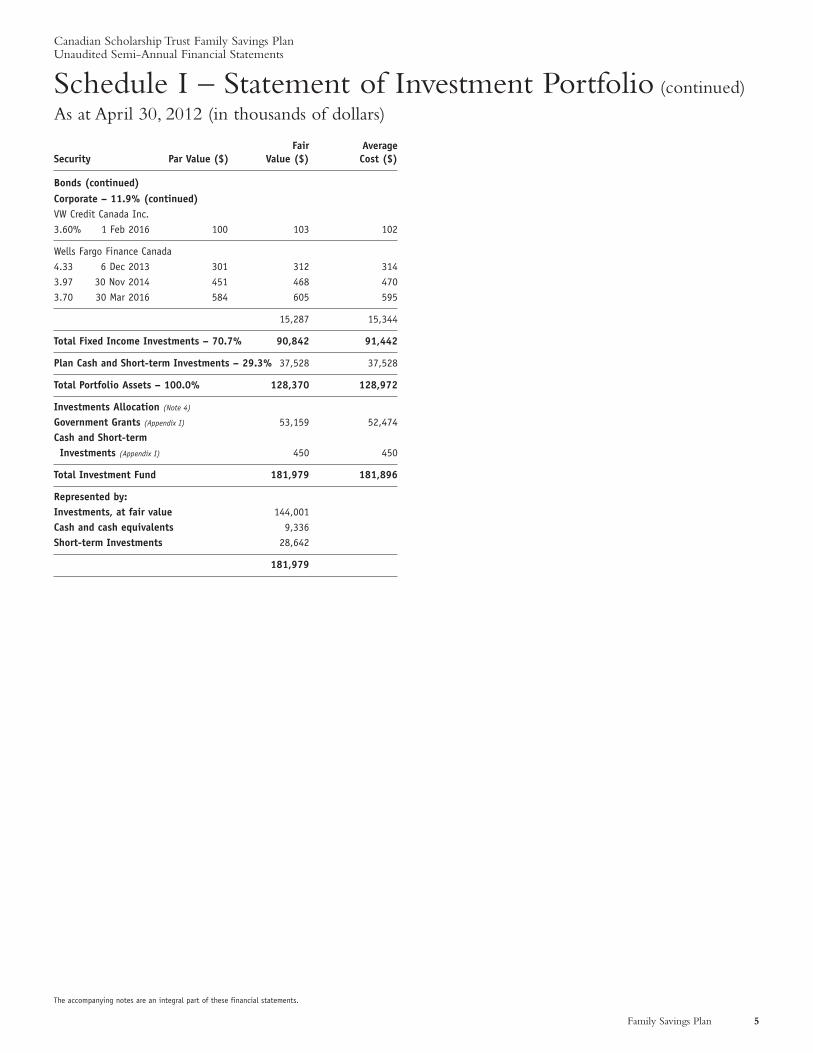
Schedule I – Statement of Investment Portfolio (continued)
As at April 30, 2012 (in thousands of dollars)
Fair AverageSecurity Par Value ($) Value ($) Cost ($)
Bonds (continued)Corporate – 11.9% (continued)VW Credit Canada Inc.3.60% 1 Feb 2016 100 103 102
Wells Fargo Finance Canada4.33 6 Dec 2013 301 312 3143.97 30 Nov 2014 451 468 4703.70 30 Mar 2016 584 605 595
15,287 15,344
Total Fixed Income Investments – 70.7% 90,842 91,442
Plan Cash and Short-term Investments – 29.3% 37,528 37,528
Total Portfolio Assets – 100.0% 128,370 128,972
Investments Allocation (Note 4)
Government Grants (Appendix I) 53,159 52,474Cash and Short-term Investments (Appendix I) 450 450
Total Investment Fund 181,979 181,896
Represented by:Investments, at fair value 144,001Cash and cash equivalents 9,336Short-term Investments 28,642
181,979

Notes to the Financial StatementsSix months ended April 30, 2012 and 2011 (Unaudited, in thousands of dollars)
6 Family Savings Plan
Canadian Scholarship Trust Family Savings Plan
Note 1. Nature of Operations
The Canadian Scholarship Trust Family Savings Plan (“FamilySavings Plan” or the “Plan”) is a self-determined Education SavingsPlan that was established on March 1, 1997. The objective of theFamily Savings Plan is to assist parents and others to save for thepost-secondary education of children. The Family Savings Plan ismanaged and distributed by C.S.T. Consultants Inc. (“C.S.T.C.”), a wholly-owned subsidiary of the Canadian Scholarship TrustFoundation (the “Foundation”). The Foundation was created toencourage and promote post-secondary education by makingeducation savings plans available to Canadian residents.
Payments are made by a contributor to an account maintained by the depository trustee on behalf of a beneficiary. Payments ofenrolment fees are made with the contributor’s initial contribution.The principal accumulated over the term of the contributor’seducation savings plan agreement (“Agreement”) is returned inwhole or in part at any time at the request of the contributor.A beneficiary is deemed to be a qualified student upon receipt bythe Foundation of evidence of enrolment in a qualifyingeducational program at an eligible institution. Education assistancepayments paid to qualified students from the Family Savings Plan aredetermined by the contributor and are paid from the income earnedon the contributor’s principal.
There are a number of government grants that may be availableto beneficiaries:
i. The Canada Education Savings Grant Program (“CESG”) is a grant from the Federal Government whereby RegisteredEducation Savings Plans (“RESPs”) receive grant amountsdependent on family income;
ii. Any child born on or after January 1, 2004, and who alsoqualifies for the National Child Benefit Supplement may beeligible for the Canada Learning Bond (“CLB”);
iii. Any child born in the province of Alberta on or afterJanuary 1, 2005, may be eligible for the initial AlbertaCentennial Education Savings Grant (“ACES”). Subsequentgrants may be paid to all children attending school in Albertaat certain eligible ages; and
iv. The Québec Education Savings Incentive (“QESI”) isavailable for beneficiaries who are under eighteen years ofage and reside in Québec on December 31 of each year. The amount of QESI to be received by a beneficiary willdepend on annual family income.
The Family Savings Plan receives the CESG, CLB, ACES andQESI (collectively, “Government grants”), which are paid directly into a beneficiary’s RESP and invests these funds in accordance withthe Plan’s investment policies. The Government grants, along withinvestment income earned thereon, are paid to qualified students.
Agreements are registered with appropriate government authoritiesif all required information is provided, and once registered are subjectto the rules for RESPs under the Income Tax Act (Canada). The currenttax legislation provides that income credited on contributors’principal is not taxable income of the contributor, unless withdrawnearly. The deposits are not deductible for income tax purposes and arenot taxable when returned to the contributor. Payments made to aqualified student will constitute taxable income of that student in theyear that the payments are made.
Note 2. Significant Accounting Policies
(a) Generally accepted accounting principlesThese financial statements have been prepared in accordancewith Canadian generally accepted accounting principles(“Canadian GAAP”).
(b) Future accounting standardsIn February 2008, the Canadian Accounting Standards Board(“AcSB”) confirmed that the use of International FinancialReporting Standards (“IFRS”) will be required for publiclyaccountable enterprises. In December 2011, the AcSB amendedthe deadline for adoption of IFRS by certain qualifying investmentfunds to extend the adoption date to years beginning on or afterJanuary 1, 2014. Therefore, IFRS will replace Canadian GAAPand become effective for the Plan’s interim and annual financialstatements relating to the fiscal year ending October 31, 2015.Management is in the process of developing a transition plan,which will include identifying differences between the Plan’scurrent accounting policies and those it expects to apply underIFRS, as well as any accounting policy and implementationdecisions and their resulting impact, if any, on the financialstatements of the Plan.
(c) Investment valuationInvestments, at fair value include the following types of securities:bonds, money market securities and variable rate securities.
Bonds and money market securities are valued using bidprices at period end. In the event that quoted market prices are not available, the fair values presented are estimated usingpresent value or other valuation techniques.
Variable rate securities are hybrid financial debt instrumentsissued by governments, Canadian chartered banks and licensedtrust and loan companies that have embedded components thatchange the risk/return profile of the security. Included in thisclass are structured notes that are debt instruments whose returnsare based on indices or underlying assets rather than typicalinterest payments. Variable rate securities are carried at fair valuesusing external pricing models to value their components.
Note 7 provides further guidance on the fair valuemeasurements.
(d) Investment transactions and income recognitionInvestment transactions are accounted for on a trade-date basis.Interest income on investments is recognized using the effectiveinterest method. Realized gains (losses) on the sale of investmentsand change in unrealized gains (losses) on investments are calculatedwith reference to the average cost of the related investments andare recognized in the period that such gains (losses) occur.
(e) Contributors’ deposits and Enrolment feesContributors’ deposits reflect amounts received from contributors anddo not include future amounts receivable on outstanding Agreements.An enrolment fee is required as part of the initial contribution undereach educational savings plan Agreement. Enrolment fees collectedduring the reporting period are paid to C.S.T.C.
Family Savings Plan 7
Canadian Scholarship Trust Family Savings Plan
Notes to the Financial Statements (continued)
Six months ended April 30, 2012 and 2011 (Unaudited, in thousands of dollars)
(f) Income taxes Family Savings Plan is exempt from income taxes under Section 146.1 of the Income Tax Act (Canada).
(g) Cash and cash equivalentsCash and cash equivalents include short-term investments witha purchase date to maturity of 90 days or less.
(h) Use of estimatesIn preparing the financial statements, management is required touse estimates and assumptions that affect the reported amountsof assets and liabilities and disclosures of contingent assets andliabilities at the date of the financial statements and the reportedamounts of revenues and expenses during the reporting period.Actual results could differ from the current estimates. Significantestimates included in these financial statements relate to thevaluation of Level 3 financial instruments as discussed in Note 7and Accounts payable, accrued liabilities and unclaimedcontributors’ funds.
Note 3. Related Party Transactions
(a) Distribution and Administration of the Family Savings PlanThe Foundation, as the Plan sponsor, has appointed C.S.T.C. asthe Investment Fund Manager to distribute and administer theFamily Savings Plan. The distribution agreement is renewableannually on November 1. Administration fees (comprising Planadministration and processing fees and Financial reportingexpenses) are paid to the Foundation. Administration fees areannual fees of 1% of the total amount of principal, Governmentgrants and income earned thereon. Enrolment fees are paid to C.S.T.C.
(b) Other Related Party TransactionsThe Foundation retains the services of Greystone ManagedInvestments Inc., an investment management firm andwholly-owned subsidiary of Greystone Capital ManagementInc. (“Greystone”). As at April 31, 2012, two directors of theFoundation were members of the Board of Directors ofGreystone and they did not have any equity ownership in thecompany.The directors do not participate in any of theFoundation’s Board deliberations concerning the investmentmanagement of the Plan, nor do they vote on any resolutionsrecommended by the Investment Committee of the Foundation.
Portfolio management fees in the Statements of InvestmentOperations include fees paid or payable to Greystone of$8 (2011 – $17). Included in Accounts payable, accruedliabilities and unclaimed contributors’ funds in the Statements of Net Assets Available for Education Assistance Payments are theaccrued amounts owing to Greystone as at April 30, 2012 of$6 (October 31, 2011 – $6).
All related party transactions are in the normal course ofbusiness and are measured at the exchange amount.
Note 4. Investment Holdings
The investment holdings are disclosed in Schedule I – Statement of Investment Portfolio and the related Appendix I to the schedule,which is explained below.
The Government grants received from Human Resources andSkills Development Canada are collectively invested together withother C.S.T.C. administered plans. The principal and incomereceived are separately tracked for each contributor’s Agreement.The portfolio holdings are allocated across all plans based on theproportion of principal and income attributable to Agreementswithin each plan (see Appendix I to Schedule I).
Note 5. Risks Associated with FinancialInstruments
In the normal course of business the Plan may be exposed to a variety of risks arising from financial instruments. The Plan’sexposures to such risks are concentrated in its investment holdingsand are related to market risk (which includes interest rate riskand other price risk), credit risk, liquidity risk and currency risk.
The Plan’s risk management process includes monitoringcompliance with the Plan’s investment policy. The Plan managesthe effects of these financial risks to the Plan portfolio performanceby retaining and overseeing professional external investment managers.The investment managers regularly monitor the Plan’s positions andmarket events, and manage the investment portfolio within theconstraints of the investment policy.
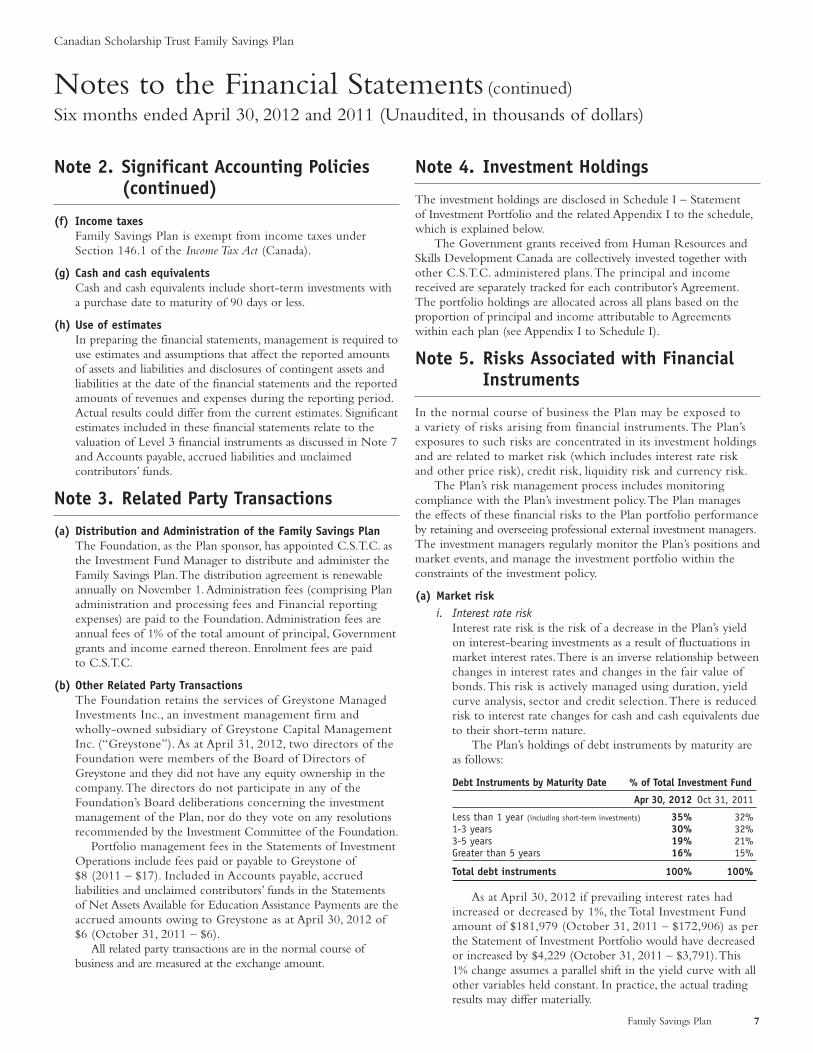
(a) Market riski. Interest rate risk
Interest rate risk is the risk of a decrease in the Plan’s yieldon interest-bearing investments as a result of fluctuations inmarket interest rates. There is an inverse relationship betweenchanges in interest rates and changes in the fair value ofbonds. This risk is actively managed using duration, yieldcurve analysis, sector and credit selection. There is reducedrisk to interest rate changes for cash and cash equivalents dueto their short-term nature.
The Plan’s holdings of debt instruments by maturity areas follows:
As at April 30, 2012 if prevailing interest rates hadincreased or decreased by 1%, the Total Investment Fundamount of $181,979 (October 31, 2011 – $172,906) as perthe Statement of Investment Portfolio would have decreasedor increased by $4,229 (October 31, 2011 – $3,791). This 1% change assumes a parallel shift in the yield curve with allother variables held constant. In practice, the actual tradingresults may differ materially.
Debt Instruments by Maturity Date % of Total Investment Fund
Apr 30, 2012 Oct 31, 2011
Less than 1 year (including short-term investments) 35% 32%1-3 years 30% 32%3-5 years 19% 21%Greater than 5 years 16% 15%
Total debt instruments 100% 100%
Note 2. Significant Accounting Policies(continued)

8 Family Savings Plan
Canadian Scholarship Trust Family Savings Plan
(a) Market risk (continued)ii. Other price risk
Other price risk is the risk that the value of a financialinstrument will fluctuate as a result of changes in marketprices, other than those arising from interest rate risk.Factors specific to an individual investment, its issuer or all factors affecting all instruments traded in a market ormarket segment affect other price risk. The asset class thatis most impacted by other price risk is variable ratesecurities, which represents 0.1% (October 31, 2011 –0.1%) of the Total Investment Fund amount as at April 30,2012. For these securities, positive returns are capped andthe return of principal at maturity is protected from any negative performance. These features limit volatilityand mitigate the downward impact on the value of these securities.
As at April 30, 2012, if underlying indices prices hadincreased or decreased by 1%, with all other variables heldconstant, the Total Investment Fund amount as per Schedule I –Statement of Investment Portfolio would not have increased ordecreased at April 30,2012 or at October 31,2011. In practice,the actual trading results may differ materially.
(b) Credit riskCredit risk refers to the ability of the issuer of debt securities tomake interest payments and repay principal. The Plan’s portfoliois comprised of bonds issued or guaranteed by federal orprovincial governments along with corporate debt instrumentswith a minimum approved credit rating as set by CanadianSecurities Administrators, currently A-low. Family Savings Planhas a concentration of investments in government and governmentguaranteed bonds, which are considered to be high credit qualityinvestments thereby moderating credit risk.
The Plan’s credit risk exposure is listed below:
Apr 30, 2012 Oct 31, 2011% of Total % of Total
Investment Amount Investment AmountCredit rating Fund (in thousands) Fund (in thousands)
AAA 37% $ 66,476 60% $ 104,217AA/AAH/AAL 24% 44,254 15% 26,242A/AH/AL 18% 33,269 5% 7,882R-1 20% 36,697 19% 33,133P-2 1% 1,092 1% 1,595Short-term unrated 0% 191 0% (163)
Total Investment Fund 100% $ 181,979 100% $ 172,906
The Dominion Bond Rating Service (“DBRS”) was theprimary source for obtaining credit ratings. Secondary sourcesused include Standard & Poor’s Financial Services LLC andMoody’s Investors Service, Inc.
(c) Liquidity riskLiquidity risk is the risk that the Plan may not be able to meet its obligations on time. The Plan’s exposure to liquidityrisk is concentrated in principal repayments to subscribers andEducation Assistance Payments to beneficiaries. The Planprimarily invests in securities that are traded in the activemarkets and can be readily sold. The Plan retains sufficient cashand cash equivalents positions to meet liquidity requirements by utilizing cash forecasting models that reflect the distributionof Contributors’ deposits and accumulated income. All otherfinancial liabilities are short term and due within one year.
(d) Currency risk Currency risk is the risk that the value of a financial instrumentwill fluctuate due to changes in foreign exchange rates. The Planis not exposed to currency risk as it holds only Canadiansecurities.
Note 6. Contributors’ Deposits
The changes in Contributors’ deposits for the six-month periodended April 30, 2012 and 2011, are as follows:
Apr 30, 2012 Apr 30, 2011
Payments from contributors $ 3,607 $ 3,364
Inter-plan principal transfers 15,717 13,636
Return of principal (12,126) (9,746)
Net increase in Contributors’ deposits 7,198 7,254
Balance, Beginning of Period 94,248 82,182
Balance, End of Period $ 101,446 $ 89,436
The April 30, 2011 comparative figures have been reclassified to conform to thepresentation adopted in 2012.
Note 7. Fair Value of Financial Instruments
Investments, at fair value, Cash and cash equivalents and Short-terminvestments are carried at fair value. The carrying values of otherfinancial instruments such as Accrued interest and other receivables,Receivables for securities sold, Government grants receivable,Accounts payable, accrued liabilities and unclaimed contributors’funds, Payables for securities purchased and Contributors’ depositsapproximate their fair values as these financial instruments are shortterm in nature.
Fair value represents the amount at which a financial instrumentcould be exchanged in an arm’s-length transaction between willingparties under no compulsion to act and is best evidenced by a quotedbid price in an active market, if one exists.
Note 5. Risks Associated with FinancialInstruments (continued)
Notes to the Financial Statements (continued)
Six months ended April 30, 2012 and 2011 (Unaudited, in thousands of dollars)

Family Savings Plan 9
Canadian Scholarship Trust Family Savings Plan
Notes to the Financial Statements (continued)
Six months ended April 30, 2012 and 2011 (Unaudited, in thousands of dollars)
The following table presents the Plan’s financial instrumentscarried at fair value in the statements of net assets available foreducation assistance payments classified by the fair value hierarchyset out in CICA Handbook Section 3862 Financial Instruments –Disclosures:
i. “Level 1” financial instruments are valued using quotedprices (unadjusted) in active markets for identical assets orliabilities.
ii. “Level 2” financial instruments are valued using observableinputs other than quoted prices included in Level 1.
iii. “Level 3” financial instruments are valued usingunobservable inputs for the asset or liability.
Assets Measured at Fair Value as of April 30, 2012
Level 1 Level 2 Level 3 Total
Cash and Cash Equivalents $ 9,336 $ – $ – $ 9,336Short-term Investments – 28,642 – 28,642Fixed Income Securities – 143,754 – 143,754Variable Rate Securities – – 247 247
Total Investment Fund $ 9,336 $ 172,396 $ 247 $ 181,979
Assets Measured at Fair Value as of October 31, 2011
Level 1 Level 2 Level 3 Total
Cash and Cash Equivalents $ 9,704 $ – $ – $ 9,704Short-term Investments – 24,861 – 24,861Fixed Income Securities – 138,088 – 138,088Variable Rate Securities – – 253 253
Total Investment Fund $ 9,704 $ 162,949 $ 253 $ 172,906
For the six-month period ended April 30, 2012 and year endedOctober 31, 2011, there were no transfers between Levels 1, 2, or 3.
The Plan’s financial instruments classified as Level 3 representthe Plan’s investment in Equity Linked Notes, which are principalprotected by a major Canadian bank (DBRS rating “AA”). EquityLinked Notes are hybrid securities comprised of a bond and anoption. The price of the variable rate securities are based onexternal pricing models provided from third-party brokers. Thesevaluations are derived from the information on similar publiclytraded bonds and options using standard pricing methodology. Such techniques include assumptions related to the assessmentand quantification of market, credit, and liquidity risks referredto in Note 5. There are no reasonable alternative assumptions.
Level 3 – Variable Rate SecuritiesApril 30, October 31,
2012 2011
Opening Balance $ 253 $ 1,219
Sales (5) (953)
Decrease in Unrealized Gains (1) (13)
Closing Balance $ 247 $ 253
Note 7. Fair Value of Financial Instruments (continued)

Government Grants (Appendix I to Schedule I)
Statement of Investment Portfolio
As at April 30, 2012 (in thousands of dollars)
Fair AverageSecurity Par Value ($) Value ($) Cost ($)
Bonds (continued)Municipal and Provincial – 19.5% (continued)Province of Ontario4.50% 2 Dec 2012 1,700 1,732 1,7734.75 2 Jun 2013 4,670 4,836 4,9363.25 8 Sep 2014 6,475 6,711 6,6593.15 8 Sep 2015 10,524 10,955 10,8274.40 8 Mar 2016 6,108 6,652 6,8103.20 8 Sep 2016 3,700 3,875 3,7384.30 8 Mar 2017 5,560 6,108 5,4714.40 2 Jun 2019 2,835 3,155 2,9604.20 2 Jun 2020 3,805 4,183 3,9534.00 2 Jun 2021 2,105 2,276 2,1727.60 2 Jun 2027 2,075 3,089 3,0035.60 2 Jun 2035 3,145 4,096 3,5684.70 2 Jun 2037 3,760 4,466 4,105
Province of Quebec5.25 1 Oct 2013 8,800 9,263 9,4624.50 1 Dec 2016 8,952 9,886 10,0214.50 1 Dec 2019 6,200 6,941 6,5324.50 1 Dec 2020 6,295 7,047 6,5955.75 1 Dec 2036 2,025 2,673 2,3425.00 1 Dec 2038 3,235 3,918 3,298
162,616 157,251
Corporate – 32.7%407 International Inc.7.13 26 Jul 2040 6,113 8,751 8,073
Access Justice Durham Ltd.5.02 31 Aug 2039 320 346 305
Arrow Lakes Power Corp.5.52 5 Apr 2041 847 962 847
BAC Canada Finance2.71 21 Feb 2014 8,217 8,100 8,004
Bank of Montreal4.78 30 Apr 2014 3,290 3,475 3,4835.18 6 Oct 2015 3,350 3,642 3,6573.10 10 Mar 2016 3,575 3,656 3,657
Bank of Nova Scotia3.34 25 Mar 2015 3,440 3,549 3,5512.74 1 Dec 2016 3,200 3,218 3,2032.60 27 Feb 2017 1,050 1,048 1,0476.28 30 Jun 2053 3,275 3,425 3,520
BCIMC Realty Corporation4.65 10 Feb 2015 166 176 1785.65 5 Jan 2018 2,371 2,715 2,638
Blue Water Bridge Authority6.41 9 Jul 2027 2,371 2,072 2,077
Fair AverageSecurity Par Value ($) Value ($) Cost ($)
BondsFederal – 46.2%Government of Canada1.75% 1 Mar 2013 31,672 31,802 31,8411.50 1 Nov 2013 10,680 10,709 10,7880.75 1 May 2014 3,314 3,275 3,2813.00 1 Dec 2015 8,733 9,180 8,8555.00 1 Jun 2037 6,425 9,184 8,0654.00 1 Jun 2041 2,295 2,941 2,448
Canada Housing Trust2.70 15 Dec 2013 17,080 17,424 17,4782.20 15 Mar 2014 16,125 16,350 16,3673.15 15 Jun 2014 29,629 30,657 30,7092.75 15 Sep 2014 25,925 26,650 26,8892.75 15 Dec 2014 29,581 30,452 30,7831.43 15 Mar 2015 8,264 8,297 8,2773.15 15 Jun 2015 25,249 26,362 25,4402.75 15 Dec 2015 46,872 48,450 48,0851.40 15 Mar 2016 15,862 15,905 15,9172.75 15 Jun 2016 43,172 44,687 44,0031.33 15 Sep 2016 34,163 34,140 34,1341.85 15 Dec 2016 9,805 9,772 9,8574.10 15 Dec 2018 2,105 2,350 2,2203.80 15 Jun 2021 2,200 2,427 2,460
Ontario Infrastructure3.95 3 Jun 2013 927 951 925
PSP Capital Inc.4.57 9 Dec 2013 2,800 2,926 2,825
384,891 381,647
Municipal and Provincial – 19.5%Province of Alberta1.38 27 May 2016 12,753 12,729 12,7521.85 1 Sep 2016 2,736 2,736 2,735
Province of British Columbia4.25 18 Jun 2014 6,010 6,346 6,3774.70 1 Dec 2017 2,925 3,308 3,126
Province of Manitoba2.05 1 Dec 2016 6,316 6,324 6,363
Province of New Brunswick4.45 26 Mar 2018 4,705 5,230 5,1135.65 27 Dec 2028 650 818 7615.50 27 Jan 2034 13,300 16,805 15,6324.65 26 Sep 2035 1,245 1,420 1,282
Province of Newfoundland and Labrador5.25 4 Jun 2014 2,735 2,940 2,947
Province of Nova Scotia5.80 1 Jun 2033 1,600 2,098 1,937
10 Family Savings Plan
The accompanying notes are an integral part of these financial statements.
Canadian Scholarship Trust Family Savings PlanUnaudited Semi-Annual Financial Statements

Family Savings Plan 11
The accompanying notes are an integral part of these financial statements.
Canadian Scholarship Trust Family Savings PlanUnaudited Semi-Annual Financial Statements
Government Grants (continued)
(Appendix I to Schedule I)
Statement of Investment Portfolio
As at April 30, 2012 (in thousands of dollars)
Fair AverageSecurity Par Value ($) Value ($) Cost ($)
Bonds (continued)Corporate – 32.7% (continued)Honda Canada Finance Inc.5.61% 12 Sep 2013 220 230 2311.34 23 Feb 2015 8,310 8,286 8,310
Hospital Infrastructure Partners5.44 31 Jan 2045 398 436 398
HSBC Bank Canada2.90 13 Jan 2017 1,390 1,399 1,390
Inter American Development Bank4.40 26 Jan 2026 1,380 1,526 1,372
Leisureworld4.81 24 Nov 2015 5,214 5,424 5,448
Manufacturers Life Insurance Company4.21 18 Nov 2021 3,673 3,754 3,6594.17 1 Jun 2022 2,769 2,814 2,777
Manulife Financial Capital Trust6.70 30 Jun 2012 3,920 3,947 4,3464.85 12 Dec 2015 2,365 1,569 1,543
Manulife Financial Corporation4.90 2 Jun 2014 706 734 7385.16 26 Jun 2015 1,695 1,795 1,788
Maritimes and Northeast Pipelines4.34 30 Nov 2019 4,596 4,768 4,743
Master Credit Card Trust2.63 21 Jan 2017 488 488 489
Merrill Lynch Financial Assets 4.82 12 Feb 2015 1,560 1,637 1,6144.62 12 Nov 2015 1,235 1,299 1,2224.98 12 Jun 2016 2,979 3,172 3,1534.66 12 Jul 2016 500 273 2834.64 12 Oct 2016 578 430 4354.81 12 Oct 2016 2,814 2,968 2,9334.71 12 Nov 2016 3,409 3,452 3,4744.48 12 Jul 2037 920 965 9004.75 12 Jan 2040 2,009 2,130 2,155
Milit-Air Inc.5.75 30 Jun 2019 2,721 3,015 2,940
N-45 First CMBS 5.67 15 Nov 2020 2,048 2,142 2,179
National Bank Canada2.23 30 Jan 2015 1,275 1,274 1,2753.26 4 Nov 2022 480 480 479
NAV Canada4.71 24 Feb 2016 1,722 1,873 1,7857.56 1 Mar 2027 4,822 6,213 6,137
Fair AverageSecurity Par Value ($) Value ($) Cost ($)
Bonds (continued)Corporate – 32.7% (continued)BMW Canada 2.88% 8 Sep 2016 1,000 1,001 1,000
Cadillac Fairview Finance Trust3.24 25 Jan 2016 3,803 3,919 3,794
Canadian Capital Auto Receivables Asset Trust2.63 17 Aug 2014 4,537 4,610 4,560
Canadian Credit Card Trust2.31 24 Apr 2015 1,580 1,582 1,580
Canadian Imperial Bank of Commerce4.75 22 Dec 2014 2,769 2,954 2,8373.15 2 Nov 2020 2,700 2,727 2,710
CBC4.69 15 May 2027 3,774 4,160 4,027
CDP Financial Inc.4.60 15 Jul 2020 164 182 181
Citigroup Finance Canada4.75 17 Mar 2014 2,000 2,062 2,060
Claregold Trust5.07 15 May 2044 3,953 2,686 2,689
CSS Partnership6.92 31 Jul 2042 2,507 3,172 3,207
Enbridge Inc.5.16 24 Sep 2014 3,200 3,436 3,447
First National Financial1.33 1 Mar 2015 2,509 1,402 1,400
GE Capital Canada2.10 10 Feb 2014 1,268 1,271 1,2674.65 2 Nov 2015 5,700 6,033 5,7745.10 1 Jun 2016 1,450 1,574 1,5663.35 23 Nov 2016 1,750 1,782 1,7485.53 17 Aug 2017 800 894 7785.68 10 Sep 2019 1,640 1,855 1,7955.73 22 Oct 2037 4,418 4,939 4,228
Gloucester Credit Card Trust5.38 15 May 2014 2,624 2,787 2,760
Great West Lifeco Inc.6.14 21 Mar 2018 4,510 5,228 5,154
Greater Toronto Airport Authority6.45 30 Jul 2029 5,976 7,357 7,3544.53 12 Feb 2041 430 455 430
Green Timbers LP6.84 30 Jun 2037 684 828 746
Health Partners Markham3.43 31 Jan 2014 834 834 834

12 Family Savings Plan
The accompanying notes are an integral part of these financial statements.
Canadian Scholarship Trust Family Savings PlanUnaudited Semi-Annual Financial Statements
Fair AverageSecurity Par Value ($) Value ($) Cost ($)
Bonds (continued)Corporate – 32.7% (continued)Northwest Connect Group5.95% 30 Apr 2041 2,462 2,854 2,571
Ontrea Inc.4.62 9 Apr 2018 1,754 1,860 1,783
Ornge Issuer Trust5.73 11 Jun 2034 1,553 1,774 1,625
Ottawa Hydro Holdings4.93 9 Feb 2015 1,263 1,351 1,320
Pearson International Fuel Facilities Corporation5.09 9 Mar 2032 3,464 3,627 3,713
Peoples Trust4.10 1 Jul 2015 2,000 1,630 1,591
Plenary Properties Ltap LP3.16 13 Mar 2015 1,762 1,778 1,7642.63 18 May 2015 5,500 5,464 5,5027.25 31 Aug 2042 2,500 3,358 3,3276.29 31 Jan 2044 2,431 2,982 2,671
Power Corporation of Canada7.57 22 Apr 2019 1,308 1,596 1,502
RBC Capital Trust4.87 31 Dec 2049 7,725 8,240 7,7935.81 31 Dec 2053 4,435 4,680 4,750
Real Estate Asset Liquidity Series Class A4.62 12 Sep 2016 1,975 2,101 2,0085.08 12 Oct 2036 745 782 763
Royal Bank of Canada2.68 8 Dec 2016 1,350 1,353 1,3502.58 13 Apr 2017 1,500 1,493 1,5003.55 1 Sep 2019 5,542 5,235 4,898
SNC Lavalin Group6.63 30 Jun 2044 1,851 2,332 2,147
Sun Life Financial Inc.4.80 23 Nov 2035 800 811 8114.95 1 Jun 2036 1,772 1,799 1,806
Toronto Dominion Bank2.95 2 Aug 2016 3,210 3,272 3,2843.37 2 Nov 2020 3,430 3,490 3,490
Toronto Hospital5.64 8 Dec 2022 4,596 5,195 5,249
Government Grants (continued)
(Appendix I to Schedule I)
Statement of Investment Portfolio
As at April 30, 2012 (in thousands of dollars)
Fair AverageSecurity Par Value ($) Value ($) Cost ($)
Bonds (continued)Corporate – 32.7% (continued)Transcanada Pipelines8.05% 17 Feb 2039 1,707 2,706 2,5574.55 15 Nov 2041 5,168 5,425 5,173
Wells Fargo Finance Canada4.38 30 Jun 2015 3,225 3,409 3,4022.77 9 Feb 2017 1,610 1,599 1,610
WTH Car Rental 4.14 20 Mar 2015 6,817 6,944 7,001
272,498 267,323
Total Fixed Income Investments – 98.4% 820,005 806,221
Variable Rate Securities – 0.6%Toronto-Dominion Bank S&P/TSX 60 Index Linked Note
26 Oct 2012 5,000 4,966 5,000
4,966 5,000
Plan Investments – 99.0% 824,971 811,221
Cash and Short-term Investments – 1.0% 9,043 9,043
Total Portfolio Assets – 100.0% 834,014 820,264
Government Grant Investments AllocationPlan II 441 409Founders’ Plan 40,483 39,631Group Savings Plan 205,383 201,478Group Savings Plan 2001 521,756 513,509Family Savings Plan 53,159 52,474Individual Savings Plan 3,749 3,720
824,971 811,221
Cash and Short-term Investments AllocationPlan II 18 18Founders’ Plan 515 515Group Savings Plan 2,371 2,371Group Savings Plan 2001 5,667 5,667Family Savings Plan 450 450Individual Savings Plan 22 22
9,043 9,043

Canadian Scholarship Trust PlanSponsorCanadian Scholarship Trust Foundation2225 Sheppard Avenue East, Suite 600Toronto, Ontario M2J 5C21.877.333.RESP (7377)
Investment Fund Manager and DistributorC.S.T. Consultants Inc.2225 Sheppard Avenue East, Suite 600Toronto, Ontario M2J 5C2
TrusteeRBC Dexia Investor Services Trust155 Wellington Street West, 7th FloorToronto, Ontario M5V 3L3
Legal CounselHeenan Blaikie LLPBay Adelaide CentreP.O. Box 2900333 Bay Street, Suite 2900Toronto, Ontario M5H 2T4
AuditorDeloitte & Touche LLPBrookfield Place181 Bay Street, Suite 1400Toronto, Ontario M5J 2V1
BankRoyal Bank of CanadaRoyal Bank PlazaSouth Tower200 Bay Street, 10th FloorToronto, Ontario M5J 2J5
For updates on your Plan account, login to Online Services at www.cst.org
In Quebec, Canadian Scholarship Trust Plan is distributed by C.S.T. Consultants Inc. Scholarship Plan Brokerage Firm.
Canadian Scholarship TrustFamily Savings Plan
Semi-Annual Financial StatementsApril 30, 2012
Unaudited
2002 -E (2012-04)M1