Canadian Natural Resources Limited · Property, plant and equipment 4 65,135 50,910 ... Gain on...
25
Canadian Natural Resources Limited UNAUDITED INTERIM CONSOLIDATED FINANCIAL STATEMENTS FOR THE THREE AND NINE MONTHS ENDED SEPTEMBER 30, 2017 AND 2016
Transcript of Canadian Natural Resources Limited · Property, plant and equipment 4 65,135 50,910 ... Gain on...
Canadian Natural Resources LimitedUNAUDITED INTERIM CONSOLIDATED FINANCIAL STATEMENTS
FOR THE THREE AND NINE MONTHS ENDED SEPTEMBER 30, 2017 AND 2016
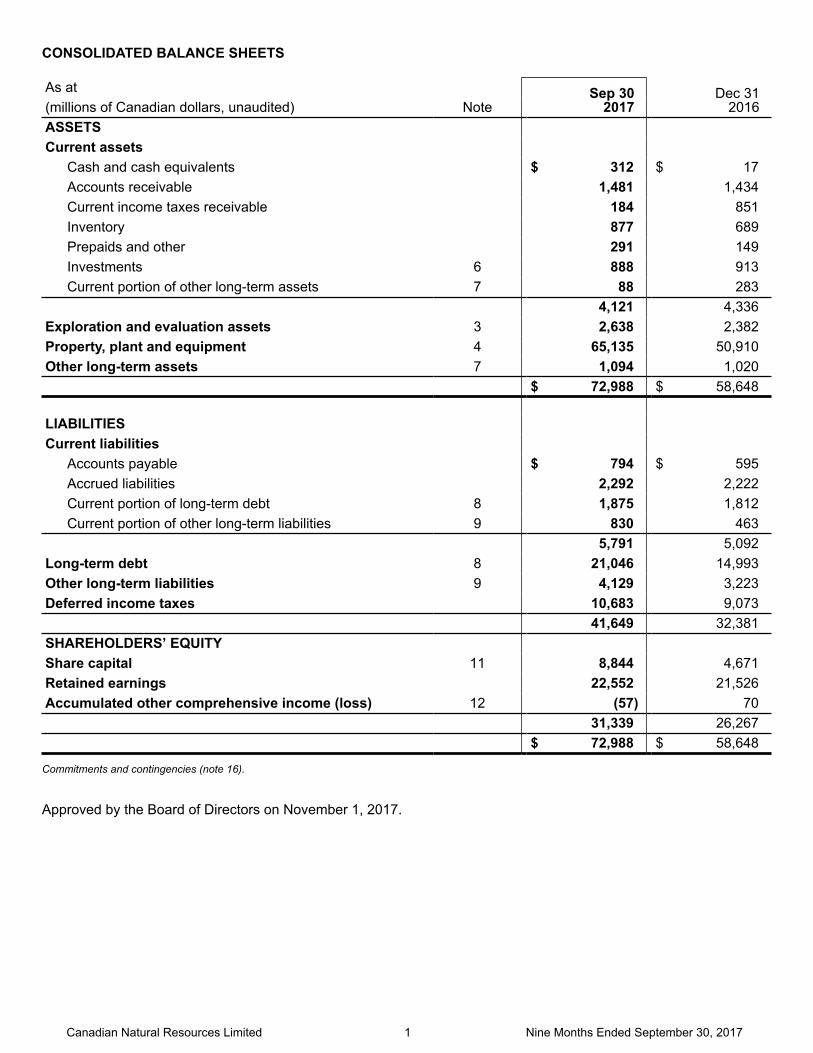
CONSOLIDATED BALANCE SHEETS
Canadian Natural Resources Limited 1 Nine Months Ended September 30, 2017
As atNote
Sep 30 2017
Dec 31 2016(millions of Canadian dollars, unaudited)
ASSETSCurrent assets
Cash and cash equivalents $ 312 $ 17Accounts receivable 1,481 1,434Current income taxes receivable 184 851Inventory 877 689Prepaids and other 291 149Investments 6 888 913Current portion of other long-term assets 7 88 283
4,121 4,336Exploration and evaluation assets 3 2,638 2,382Property, plant and equipment 4 65,135 50,910Other long-term assets 7 1,094 1,020
$ 72,988 $ 58,648
LIABILITIESCurrent liabilities
Accounts payable $ 794 $ 595Accrued liabilities 2,292 2,222Current portion of long-term debt 8 1,875 1,812Current portion of other long-term liabilities 9 830 463
5,791 5,092Long-term debt 8 21,046 14,993Other long-term liabilities 9 4,129 3,223Deferred income taxes 10,683 9,073
41,649 32,381SHAREHOLDERS’ EQUITYShare capital 11 8,844 4,671Retained earnings 22,552 21,526Accumulated other comprehensive income (loss) 12 (57) 70
31,339 26,267$ 72,988 $ 58,648
Commitments and contingencies (note 16).
Approved by the Board of Directors on November 1, 2017.

CONSOLIDATED STATEMENTS OF EARNINGS (LOSS)
Three Months Ended Nine Months Ended(millions of Canadian dollars, except per common share amounts, unaudited) Note
Sep 30 2017
Sep 30 2016
Sep 30 2017
Sep 30 2016
Product sales $ 4,547 $ 2,477 $ 12,346 $ 7,426Less: royalties (259) (142) (705) (361)Revenue 4,288 2,335 11,641 7,065ExpensesProduction 1,577 994 3,951 3,007Transportation, blending and feedstock 705 444 1,930 1,445Depletion, depreciation and amortization 4 1,271 1,216 3,780 3,609Administration 73 82 235 259Share-based compensation 9 114 74 37 313Asset retirement obligation accretion 9 44 36 119 107Interest and other financing expense 183 90 462 268Risk management activities 15 104 (13) 33 54Foreign exchange (gain) loss (367) 51 (770) (215)Gain on acquisition, disposition and revaluation
of properties 3, 4, 5 (114) — (379) (32)Gain from investments 6, 7 (84) (50) (28) (216)
3,506 2,924 9,370 8,599Earnings (loss) before taxes 782 (589) 2,271 (1,534)Current income tax recovery 10 (50) (281) (76) (569)Deferred income tax expense (recovery) 10 148 18 346 (195)Net earnings (loss) $ 684 $ (326) $ 2,001 $ (770)Net earnings (loss) per common share
Basic 14 $ 0.56 $ (0.29) $ 1.72 $ (0.70)Diluted 14 $ 0.56 $ (0.29) $ 1.71 $ (0.70)
Canadian Natural Resources Limited 2 Nine Months Ended September 30, 2017
CONSOLIDATED STATEMENTS OF COMPREHENSIVE INCOME (LOSS)
Three Months Ended Nine Months Ended
(millions of Canadian dollars, unaudited)Sep 30
2017Sep 30
2016Sep 30
2017Sep 30
2016Net earnings (loss) $ 684 $ (326) $ 2,001 $ (770)Items that may be reclassified subsequently to netearnings (loss)
Net change in derivative financial instrumentsdesignated as cash flow hedgesUnrealized income (loss) during the period, net oftaxes of $3 million (2016 – $1 million) – three months ended;$9 million (2016 – $1 million) – nine months ended 21 (5) 60 (4)
Reclassification to net earnings (loss), net of taxes of $1 million (2016 – $1 million) – three months ended;$4 million (2016 – $nil) – nine months ended (7) (10) (29) (3)
14 (15) 31 (7)Foreign currency translation adjustment
Translation of net investment (83) 19 (158) (28)Other comprehensive income (loss), net of taxes (69) 4 (127) (35)Comprehensive income (loss) $ 615 $ (322) $ 1,874 $ (805)

CONSOLIDATED STATEMENTS OF CHANGES IN EQUITY
Nine Months Ended
(millions of Canadian dollars, unaudited) NoteSep 30
2017Sep 30
2016Share capital 11Balance – beginning of period $ 4,671 $ 4,541Issued for the acquisition of AOSP and other assets (1) 5, 11 3,818 —Issued upon exercise of stock options 280 321Previously recognized liability on stock options exercised for
common shares 75 51Return of capital on PrairieSky Royalty Ltd. share distribution — (546)Balance – end of period 8,844 4,367Retained earningsBalance – beginning of period 21,526 22,765Net earnings (loss) 2,001 (770)Dividends on common shares 11 (975) (758)Balance – end of period 22,552 21,237Accumulated other comprehensive income (loss) 12Balance – beginning of period 70 75Other comprehensive loss, net of taxes (127) (35)Balance – end of period (57) 40Shareholders’ equity $ 31,339 $ 25,644
(1) In connection with the acquisition of direct and indirect interests in the Athabasca Oil Sands Project ("AOSP") and other assets, the Company issued non-cash share consideration of $3,818 million in the second quarter of 2017. See note 5.
Canadian Natural Resources Limited 3 Nine Months Ended September 30, 2017

CONSOLIDATED STATEMENTS OF CASH FLOWS
Three Months Ended Nine Months Ended
(millions of Canadian dollars, unaudited) NoteSep 30
2017Sep 30
2016Sep 30
2017Sep 30
2016Operating activitiesNet earnings (loss) $ 684 $ (326) $ 2,001 $ (770)Non-cash items
Depletion, depreciation and amortization 1,271 1,216 3,780 3,609Share-based compensation 114 74 37 313Asset retirement obligation accretion 44 36 119 107Unrealized risk management loss (gain) 8 10 (38) 32Unrealized foreign exchange (gain) loss (404) 39 (819) (255)Gain from investments 6, 7 (76) (46) (7) (193)Deferred income tax expense (recovery) 148 18 346 (195)Gain on acquisition, disposition and
revaluation of properties 3, 4, 5 (114) — (379) (32)Other (6) 14 (13) 38Abandonment expenditures (65) (122) (211) (232)Net change in non-cash working capital 918 (14) 1,008 (225)
2,522 899 5,824 2,197Financing activities(Repayment) issue of bank credit facilities and
commercial paper, net 8 (22) (684) 2,612 1,048Issue of medium-term notes, net 8 — 998 1,791 998(Repayment) issue of US dollar debt securities,
net 8 — (279) 2,733 (834)Issue of common shares on exercise of stock
options 56 170 280 321Dividends on common shares (334) (252) (917) (504)
(300) (47) 6,499 1,029Investing activitiesNet (expenditures) proceeds on exploration and
evaluation assets (67) — (108) 10Net expenditures on property, plant and
equipment (1,962) (1,063) (3,510) (3,161)Acquisition of AOSP and other assets, net of
cash acquired (1) 5 — — (8,630) —Investment in other long-term assets (21) — (44) (99)Net change in non-cash working capital 90 206 264 (26)
(1,960) (857) (12,028) (3,276)Increase (decrease) in cash and cash
equivalents 262 (5) 295 (50)Cash and cash equivalents – beginning of
period 50 24 17 69Cash and cash equivalents – end of period $ 312 $ 19 $ 312 $ 19Interest paid, net $ 218 $ 194 $ 540 $ 499Income taxes received $ (479) $ (327) $ (804) $ (440)
(1) The acquisition of AOSP in the second quarter of 2017 includes net working capital of $291 million and excludes non-cash share consideration of $3,818million. See note 5.
Canadian Natural Resources Limited 4 Nine Months Ended September 30, 2017
NOTES TO THE CONSOLIDATED FINANCIAL STATEMENTS(tabular amounts in millions of Canadian dollars, unless otherwise stated, unaudited)
Canadian Natural Resources Limited 5 Nine Months Ended September 30, 2017
1. ACCOUNTING POLICIES Canadian Natural Resources Limited (the “Company”) is a senior independent crude oil and natural gas exploration,development and production company. The Company’s exploration and production operations are focused in NorthAmerica, largely in Western Canada; the United Kingdom (“UK”) portion of the North Sea; and Côte d’Ivoire, Gabon, andSouth Africa in Offshore Africa.
The "Oil Sands Mining and Upgrading" segment produces synthetic crude oil through bitumen mining and upgradingoperations at Horizon Oil Sands ("Horizon") and through the Company's direct and indirect interest in the Athabasca OilSands Project ("AOSP").
Within Western Canada, the Company maintains certain midstream activities that include pipeline operations, an electricityco-generation system and an investment in the North West Redwater Partnership ("Redwater Partnership"), a generalpartnership formed in the Province of Alberta.
The Company was incorporated in Alberta, Canada. The address of its registered office is 2100, 855 - 2 Street S.W.,Calgary, Alberta, Canada.
These interim consolidated financial statements and the related notes have been prepared in accordance with InternationalFinancial Reporting Standards (“IFRS”) as issued by the International Accounting Standards Board (“IASB”), applicableto the preparation of interim financial statements, including International Accounting Standard (“IAS”) 34, “Interim FinancialReporting”, following the same accounting policies as the audited consolidated financial statements of the Company asat December 31, 2016. These interim consolidated financial statements contain disclosures that are supplemental to theCompany’s annual audited consolidated financial statements. Certain disclosures that are normally required to be includedin the notes to the annual audited consolidated financial statements have been condensed. These interim consolidatedfinancial statements should be read in conjunction with the Company’s audited consolidated financial statements andnotes thereto for the year ended December 31, 2016.
2. ACCOUNTING STANDARDS ISSUED BUT NOT YET APPLIED In June 2017, the IASB issued IFRIC 23 "Uncertainty over Income Tax Treatments". The interpretation provides guidanceon how to reflect the effects of uncertainty in accounting for income taxes where IAS 12 is unclear. The interpretation iseffective January 1, 2019. The Company is assessing the impact of this interpretation on its consolidated financialstatements.
3. EXPLORATION AND EVALUATION ASSETS
Exploration and Production
Oil SandsMining andUpgrading Total
NorthAmerica North Sea
OffshoreAfrica
CostAt December 31, 2016 $ 2,306 $ — $ 76 $ — $ 2,382Additions 133 — 10 — 143Acquisition of AOSP and other assets
(note 5) 31 — — 259 290Transfers to property, plant and
equipment (176) — — — (176)Disposals/derecognitions (1) — — — (1)At September 30, 2017 $ 2,293 $ — $ 86 $ 259 $ 2,638
On May 31, 2017, the Company completed the acquisition of AOSP and other assets in the Oil Sands Mining andUpgrading and North America Exploration and Production segments, including exploration and evaluation assets of $290million. Refer to note 5 regarding the acquisition of AOSP and other assets.
During the nine months ended September 30, 2017, the Company disposed of certain North America exploration andevaluation assets with a net book value of $1 million for consideration of $36 million, resulting in a pre-tax cash gain onsale of properties of $35 million.
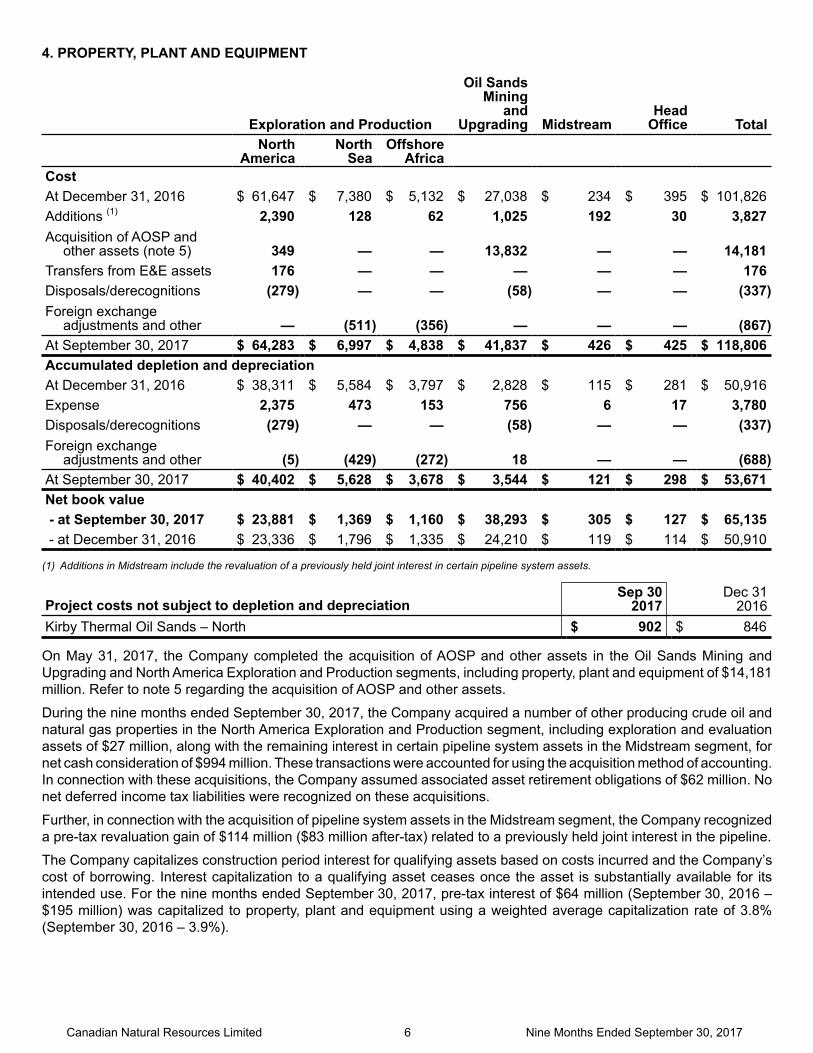
4. PROPERTY, PLANT AND EQUIPMENT
Exploration and Production
Oil Sands Mining
andUpgrading Midstream
HeadOffice Total
NorthAmerica
NorthSea
OffshoreAfrica
CostAt December 31, 2016 $ 61,647 $ 7,380 $ 5,132 $ 27,038 $ 234 $ 395 $ 101,826Additions (1) 2,390 128 62 1,025 192 30 3,827Acquisition of AOSP and
other assets (note 5) 349 — — 13,832 — — 14,181Transfers from E&E assets 176 — — — — — 176Disposals/derecognitions (279) — — (58) — — (337)Foreign exchange
adjustments and other — (511) (356) — — — (867)At September 30, 2017 $ 64,283 $ 6,997 $ 4,838 $ 41,837 $ 426 $ 425 $ 118,806Accumulated depletion and depreciationAt December 31, 2016 $ 38,311 $ 5,584 $ 3,797 $ 2,828 $ 115 $ 281 $ 50,916Expense 2,375 473 153 756 6 17 3,780Disposals/derecognitions (279) — — (58) — — (337)Foreign exchange
adjustments and other (5) (429) (272) 18 — — (688)At September 30, 2017 $ 40,402 $ 5,628 $ 3,678 $ 3,544 $ 121 $ 298 $ 53,671Net book value - at September 30, 2017 $ 23,881 $ 1,369 $ 1,160 $ 38,293 $ 305 $ 127 $ 65,135 - at December 31, 2016 $ 23,336 $ 1,796 $ 1,335 $ 24,210 $ 119 $ 114 $ 50,910
(1) Additions in Midstream include the revaluation of a previously held joint interest in certain pipeline system assets.
Project costs not subject to depletion and depreciationSep 30
2017Dec 31
2016Kirby Thermal Oil Sands – North $ 902 $ 846
On May 31, 2017, the Company completed the acquisition of AOSP and other assets in the Oil Sands Mining andUpgrading and North America Exploration and Production segments, including property, plant and equipment of $14,181million. Refer to note 5 regarding the acquisition of AOSP and other assets.
During the nine months ended September 30, 2017, the Company acquired a number of other producing crude oil andnatural gas properties in the North America Exploration and Production segment, including exploration and evaluationassets of $27 million, along with the remaining interest in certain pipeline system assets in the Midstream segment, fornet cash consideration of $994 million. These transactions were accounted for using the acquisition method of accounting.In connection with these acquisitions, the Company assumed associated asset retirement obligations of $62 million. Nonet deferred income tax liabilities were recognized on these acquisitions.
Further, in connection with the acquisition of pipeline system assets in the Midstream segment, the Company recognizeda pre-tax revaluation gain of $114 million ($83 million after-tax) related to a previously held joint interest in the pipeline.
The Company capitalizes construction period interest for qualifying assets based on costs incurred and the Company’scost of borrowing. Interest capitalization to a qualifying asset ceases once the asset is substantially available for itsintended use. For the nine months ended September 30, 2017, pre-tax interest of $64 million (September 30, 2016 –$195 million) was capitalized to property, plant and equipment using a weighted average capitalization rate of 3.8%(September 30, 2016 – 3.9%).
Canadian Natural Resources Limited 6 Nine Months Ended September 30, 2017

5. ACQUISITION OF INTERESTS IN THE ATHABASCA OIL SANDS PROJECT AND OTHER ASSETSOn May 31, 2017, the Company completed the acquisition of a direct and indirect 70% interest in AOSP from ShellCanada Limited and certain subsidiaries (“Shell”) and an affiliate of Marathon Oil Corporation (“Marathon"), including a70% interest in the mining and extraction operations north of Fort McMurray, Alberta, 70% of the Scotford Upgrader andQuest Carbon Capture and Storage ("CCS") project, and a 100% working interest in the Peace River thermal in situoperations and Cliffdale heavy oil field, as well as other oil sands leases. The Company also assumed certain pipelineand other commitments (see note 16). The Company consolidates its direct and indirect interest in the assets, liabilities,revenue and expenses of AOSP and other assets in proportion to the Company’s interests.
Total purchase consideration of $12,541 million, subject to closing adjustments, was comprised of cash payments of$8,217 million, approximately 97.6 million common shares of the Company issued to Shell with a fair value of approximately$3,818 million, and deferred purchase consideration of $506 million (US$375 million) payable to Marathon in March 2018.The fair value of the Company's common shares was determined using the market price of the shares as at the acquisitiondate.
In connection with the acquisition of AOSP and other assets, the Company arranged acquisition financing of $1.8 billionof medium-term notes in Canada, US$3 billion of long-term notes in the United States and a $3 billion non-revolving termloan facility (see note 8).
The acquisition has been accounted for as a business combination using the acquisition method of accounting. Theallocation of the purchase price was based on management's best estimates of the fair value of the assets and liabilitiesacquired as at the acquisition date. Key assumptions used in the determination of estimated fair value were futurecommodity prices, expected production volumes, quantity of reserves, asset retirement obligations, future developmentand operating costs, discount rates, income taxes and foreign exchange rates. The fair value of accounts receivable,inventory, accounts payable and accrued liabilities approximate their carrying values due to the liquid nature of the assetsand liabilities.
The following provides a summary of the net assets acquired and (liabilities) assumed relating to the acquisition:
Cash $ 93Other working capital 291Property, plant and equipment 14,181Exploration and evaluation assets 290Asset retirement obligations (721)Other long-term liabilities (73)Deferred income taxes (1,287)Net assets acquired $ 12,774
Total purchase consideration 12,541Gain on acquisition before transaction costs $ 233
The Company recognized a gain of $230 million, net of transaction costs of $3 million, representing the excess of thefair value of the net assets acquired compared to total purchase consideration. The above amounts are estimates, andmay be subject to change based on the receipt of new information.
As a result of the acquisitions, revenue increased by $1,536 million to $11,641 million and net operating income (comprisedof revenue less production, and transportation, blending, and feedstock expense) increased by $620 million to $5,760million for the nine months ended September 30, 2017. If the acquisitions had occurred on January 1, 2017, the Companyestimates that pro forma revenue would have increased by $2,181 million to $13,822 million and pro forma net operatingincome would have increased by $735 million to $6,495 million for the nine months ended September 30, 2017. Readersare cautioned that pro forma revenue and pro forma net operating income are not necessarily indicative of the results ofoperations that would have resulted had the acquisition actually occurred on January 1, 2017, or of future results. Actualresults would have been different and those differences may have been material in comparison to the pro forma informationprovided. Pro forma results are based on available historical information for the assets as provided to the Company anddo not include any synergies that have or may arise subsequent to the acquisition date.
Canadian Natural Resources Limited 7 Nine Months Ended September 30, 2017

6. INVESTMENTSAs at September 30, 2017, the Company had the following investments:
Sep 30 2017
Dec 31 2016
Investment in PrairieSky Royalty Ltd. $ 722 $ 723Investment in Inter Pipeline Ltd. 166 190
$ 888 $ 913
Investment in PrairieSky Royalty Ltd.
The Company’s investment of 22.6 million common shares of PrairieSky Royalty Ltd. ("PrairieSky") does not constitutesignificant influence, and is accounted for at fair value through profit or loss, remeasured at each reporting date. As atSeptember 30, 2017, the Company’s investment in PrairieSky was classified as a current asset.
The gain from the investment in PrairieSky was comprised as follows:
Three Months Ended Nine Months EndedSep 30
2017Sep 30
2016Sep 30
2017Sep 30
2016Fair value (gain) loss from PrairieSky $ (53) $ (50) $ 1 $ (174)Dividend income from PrairieSky (5) (4) (13) (23)
$ (58) $ (54) $ (12) $ (197)
Investment in Inter Pipeline Ltd.
The Company's investment of 6.4 million common shares of Inter Pipeline Ltd. ("Inter Pipeline") does not constitutesignificant influence, and is accounted for at fair value through profit or loss, remeasured at each reporting date. As atSeptember 30, 2017, the Company's investment in Inter Pipeline was classified as a current asset.
The (gain) loss from the investment in Inter Pipeline was comprised as follows:
Three Months Ended Nine Months EndedSep 30
2017Sep 30
2016Sep 30
2017Sep 30
2016Fair value (gain) loss from Inter Pipeline $ (3) $ — $ 24 $ —Dividend income from Inter Pipeline (3) — (8) —
$ (6) $ — $ 16 $ —
Canadian Natural Resources Limited 8 Nine Months Ended September 30, 2017

7. OTHER LONG-TERM ASSETS
Sep 30 2017
Dec 31 2016
Investment in North West Redwater Partnership $ 293 $ 261North West Redwater Partnership subordinated debt (1) 456 385Risk management (note 15) 279 489Other 154 168
1,182 1,303Less: current portion 88 283
$ 1,094 $ 1,020(1) Includes accrued interest.
Investment in North West Redwater Partnership The Company's 50% interest in Redwater Partnership is accounted for using the equity method based on RedwaterPartnership’s voting and decision-making structure and legal form. Redwater Partnership has entered into agreementsto construct and operate a 50,000 barrel per day bitumen upgrader and refinery (the "Project") under processingagreements that target to process 12,500 barrels per day of bitumen feedstock for the Company and 37,500 barrels perday of bitumen feedstock for the Alberta Petroleum Marketing Commission (“APMC”), an agent of the Government ofAlberta, under a 30 year fee-for-service tolling agreement.During 2013, the Company along with APMC, initially committed each to provide funding up to $350 million by each partyby January 2016 in the form of subordinated debt bearing interest at prime plus 6%, based on a facility capital cost("FCC") budget at $8,500 million, which was subsequently increased by approximately 11% to approximately $9,400million. As a result, the Company and APMC have agreed, each with a 50% interest, to provide additional subordinateddebt as required for Project costs in excess of the FCC of $8,500 million to reflect an agreed debt to equity ratio of 80/20and, subject to the Company being able to meet certain funding conditions, to fund any shortfall in available third partycommercial lending required to attain Project completion, which is currently targeted for mid-2018. For the nine monthsended September 30, 2017, the Company and APMC each contributed an additional $44 million. The Company's shareof any additional subordinated debt financing resulting from the increase in the FCC in excess of $8,500 million is notexpected to be significant. To September 30, 2017, each party has provided $368 million of subordinated debt, togetherwith accrued interest thereon of $88 million, for a Company total of $456 million.
During the second quarter of 2017, Redwater Partnership issued $750 million of 2.80% series J senior secured bondsdue June 2027 and $750 million of 3.65% series K senior secured bonds due June 2035.
As at September 30, 2017, Redwater Partnership had additional borrowings of $1,351 million under its secured $3,500million syndicated credit facility.Under its processing agreement, beginning on the earlier of the commercial operations date of the refinery and June 1,2018, the Company is unconditionally obligated to pay its 25% pro rata share of the debt portion of the monthly cost ofservice toll, including interest, fees and principal repayments, of the syndicated credit facility and bonds, over the tollingperiod of 30 years.
During the three months ended September 30, 2017, the Company recognized an equity gain from Redwater Partnershipof $20 million (three months ended September 30, 2016 – loss of $4 million; nine months ended September 30, 2017 –gain of $32 million; nine months ended September 30, 2016 – gain of $19 million).Redwater Partnership has entered into various agreements related to the engineering, procurement and construction ofthe Project. These contracts can be cancelled by Redwater Partnership upon notice without penalty, subject to the costsincurred up to and in respect of the cancellation.
Canadian Natural Resources Limited 9 Nine Months Ended September 30, 2017
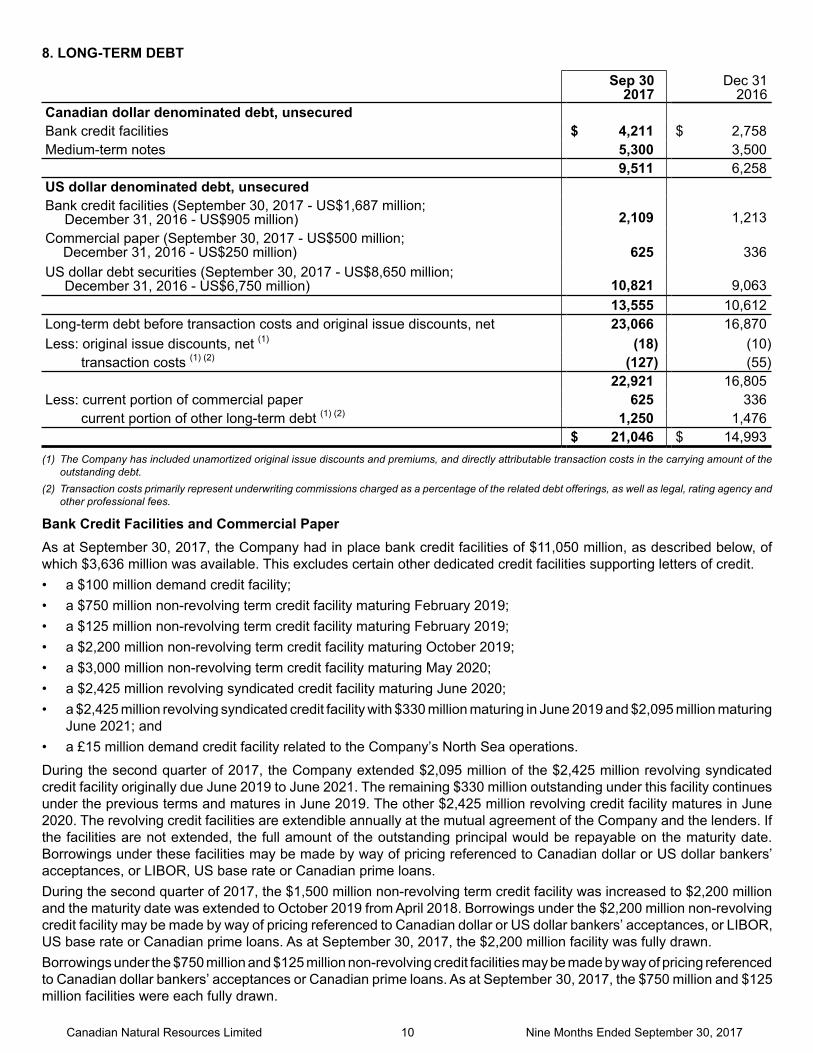
8. LONG-TERM DEBT
Sep 30 2017
Dec 31 2016
Canadian dollar denominated debt, unsecuredBank credit facilities $ 4,211 $ 2,758Medium-term notes 5,300 3,500
9,511 6,258US dollar denominated debt, unsecuredBank credit facilities (September 30, 2017 - US$1,687 million; December 31, 2016 - US$905 million) 2,109 1,213Commercial paper (September 30, 2017 - US$500 million;
December 31, 2016 - US$250 million) 625 336US dollar debt securities (September 30, 2017 - US$8,650 million; December 31, 2016 - US$6,750 million) 10,821 9,063
13,555 10,612Long-term debt before transaction costs and original issue discounts, net 23,066 16,870Less: original issue discounts, net (1) (18) (10)
transaction costs (1) (2) (127) (55)22,921 16,805
Less: current portion of commercial paper 625 336current portion of other long-term debt (1) (2) 1,250 1,476
$ 21,046 $ 14,993(1) The Company has included unamortized original issue discounts and premiums, and directly attributable transaction costs in the carrying amount of the
outstanding debt.(2) Transaction costs primarily represent underwriting commissions charged as a percentage of the related debt offerings, as well as legal, rating agency and
other professional fees.
Bank Credit Facilities and Commercial PaperAs at September 30, 2017, the Company had in place bank credit facilities of $11,050 million, as described below, ofwhich $3,636 million was available. This excludes certain other dedicated credit facilities supporting letters of credit.• a $100 million demand credit facility;• a $750 million non-revolving term credit facility maturing February 2019;• a $125 million non-revolving term credit facility maturing February 2019;• a $2,200 million non-revolving term credit facility maturing October 2019;• a $3,000 million non-revolving term credit facility maturing May 2020;• a $2,425 million revolving syndicated credit facility maturing June 2020;• a $2,425 million revolving syndicated credit facility with $330 million maturing in June 2019 and $2,095 million maturing
June 2021; and• a £15 million demand credit facility related to the Company’s North Sea operations.
During the second quarter of 2017, the Company extended $2,095 million of the $2,425 million revolving syndicatedcredit facility originally due June 2019 to June 2021. The remaining $330 million outstanding under this facility continuesunder the previous terms and matures in June 2019. The other $2,425 million revolving credit facility matures in June2020. The revolving credit facilities are extendible annually at the mutual agreement of the Company and the lenders. Ifthe facilities are not extended, the full amount of the outstanding principal would be repayable on the maturity date.Borrowings under these facilities may be made by way of pricing referenced to Canadian dollar or US dollar bankers’acceptances, or LIBOR, US base rate or Canadian prime loans. During the second quarter of 2017, the $1,500 million non-revolving term credit facility was increased to $2,200 millionand the maturity date was extended to October 2019 from April 2018. Borrowings under the $2,200 million non-revolvingcredit facility may be made by way of pricing referenced to Canadian dollar or US dollar bankers’ acceptances, or LIBOR,US base rate or Canadian prime loans. As at September 30, 2017, the $2,200 million facility was fully drawn.Borrowings under the $750 million and $125 million non-revolving credit facilities may be made by way of pricing referencedto Canadian dollar bankers’ acceptances or Canadian prime loans. As at September 30, 2017, the $750 million and $125million facilities were each fully drawn.
Canadian Natural Resources Limited 10 Nine Months Ended September 30, 2017

In addition to the credit facilities described above, during the second quarter of 2017, the Company entered into a $3,000million non-revolving term loan facility to finance the acquisition of AOSP and other assets. This facility matures in May2020 and is subject to annual amortization of 5% of the original balance. Borrowings under the term loan facility may bemade by way of pricing referenced to Canadian dollar or US dollar bankers’ acceptances, or LIBOR, US base rate orCanadian prime loans. This facility also supports a US$375 million letter of credit relating to the deferred purchaseconsideration payable to Marathon in March 2018. As at September 30, 2017, the $3,000 million facility was fully drawn.
The Company’s borrowings under its US commercial paper program are authorized up to a maximum US$2,500 million.The Company reserves capacity under its bank credit facilities for amounts outstanding under this program.The Company’s weighted average interest rate on bank credit facilities and commercial paper outstanding as atSeptember 30, 2017 was 2.3% (September 30, 2016 – 1.9%), and on total long-term debt outstanding for the nine monthsended September 30, 2017 was 3.8% (September 30, 2016 – 3.9%).At September 30, 2017, letters of credit and guarantees aggregating $883 million were outstanding, including letters ofcredit of $651 million related to AOSP (including the deferred purchase consideration payable to Marathon in March2018), a $39 million financial guarantee related to Horizon and $83 million of letters of credit related to North Seaoperations.
Medium-Term NotesDuring the second quarter of 2017, the Company issued $900 million of 2.05% medium-term notes due June 2020, $600million of 3.42% medium-term notes due December 2026 and $300 million of 4.85% medium-term notes due May 2047.Proceeds from the securities were used to finance the acquisition of AOSP and other assets. In July 2017, the Companyfiled a base shelf prospectus that allows for the offer for sale from time to time of up to $3,000 million of medium-termnotes in Canada, which expires in August 2019. If issued, these securities may be offered in amounts and at prices,including interest rates, to be determined based on market condition at the time of issuance.
US Dollar Debt SecuritiesDuring the second quarter of 2017, the Company repaid US$1,100 million of 5.70% notes. In addition, the Companyissued US$1,000 million of 2.95% notes due January 2023, US$1,250 million of 3.85% notes due June 2027 andUS$750 million of 4.95% notes due June 2047. Proceeds from the debt securities were used to finance the acquisitionof AOSP and other assets. In July 2017, the Company filed a base shelf prospectus that allows for the offer for sale fromtime to time of up to US$3,000 million of debt securities in the United States, which expires in August 2019. If issued,these securities may be offered in amounts and at prices, including interest rates, to be determined based on marketcondition at the time of issuance.
Canadian Natural Resources Limited 11 Nine Months Ended September 30, 2017
9. OTHER LONG-TERM LIABILITIES
Sep 30 2017
Dec 31 2016
Asset retirement obligations $ 4,007 $ 3,243Share-based compensation 388 426Other (1) 564 17
4,959 3,686Less: current portion 830 463
$ 4,129 $ 3,223
(1) Included in Other at September 30, 2017 is $469 million (US$375 million) of deferred purchase consideration payable to Marathon in March 2018.
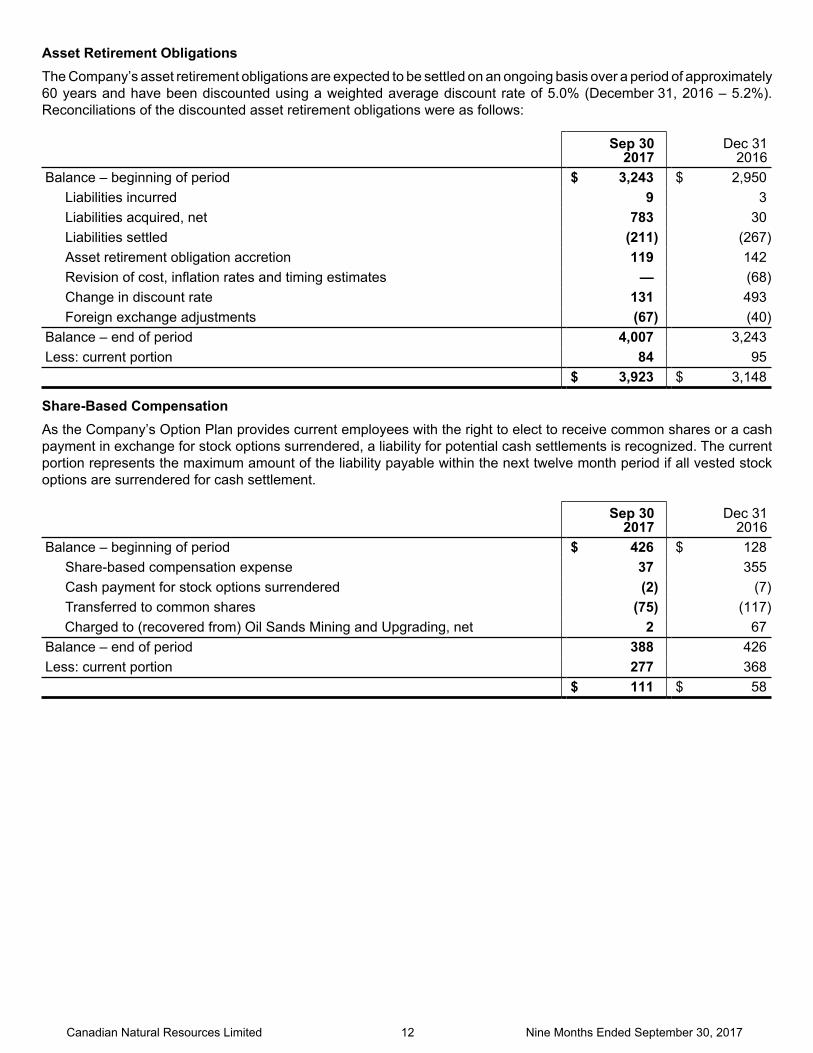
Asset Retirement ObligationsThe Company’s asset retirement obligations are expected to be settled on an ongoing basis over a period of approximately60 years and have been discounted using a weighted average discount rate of 5.0% (December 31, 2016 – 5.2%).Reconciliations of the discounted asset retirement obligations were as follows:
Sep 30 2017
Dec 31 2016
Balance – beginning of period $ 3,243 $ 2,950Liabilities incurred 9 3Liabilities acquired, net 783 30Liabilities settled (211) (267)Asset retirement obligation accretion 119 142Revision of cost, inflation rates and timing estimates — (68)Change in discount rate 131 493Foreign exchange adjustments (67) (40)
Balance – end of period 4,007 3,243Less: current portion 84 95
$ 3,923 $ 3,148
Share-Based CompensationAs the Company’s Option Plan provides current employees with the right to elect to receive common shares or a cashpayment in exchange for stock options surrendered, a liability for potential cash settlements is recognized. The currentportion represents the maximum amount of the liability payable within the next twelve month period if all vested stockoptions are surrendered for cash settlement.
Sep 30 2017
Dec 31 2016
Balance – beginning of period $ 426 $ 128Share-based compensation expense 37 355Cash payment for stock options surrendered (2) (7)Transferred to common shares (75) (117)
Charged to (recovered from) Oil Sands Mining and Upgrading, net 2 67Balance – end of period 388 426Less: current portion 277 368
$ 111 $ 58
Canadian Natural Resources Limited 12 Nine Months Ended September 30, 2017

10. INCOME TAXESThe provision for income tax was as follows:
Three Months Ended Nine Months Ended
Expense (recovery)Sep 30
2017Sep 30
2016Sep 30
2017Sep 30
2016Current corporate income tax – North America $ (43) $ (168) $ (52) $ (355)Current corporate income tax – North Sea 11 (43) 47 (74)Current corporate income tax – Offshore Africa 14 5 28 17Current PRT (1) – North Sea (34) (77) (107) (163)Other taxes 2 2 8 6Current income tax (50) (281) (76) (569)Deferred corporate income tax 141 (32) 279 (51)Deferred PRT (1) – North Sea 7 50 67 (144)Deferred income tax 148 18 346 (195)Income tax $ 98 $ (263) $ 270 $ (764)
(1) Petroleum Revenue Tax.
Canadian Natural Resources Limited 13 Nine Months Ended September 30, 2017
11. SHARE CAPITALAuthorizedPreferred shares issuable in a series.Unlimited number of common shares without par value.
Nine Months Ended Sep 30, 2017
Issued common sharesNumber of shares
(thousands) AmountBalance – beginning of period 1,110,952 $ 4,671Issued for the acquisition of AOSP and other assets (note 5) 97,561 3,818Issued upon exercise of stock options 8,350 280Previously recognized liability on stock options exercised for
common shares — 75Balance – end of period 1,216,863 $ 8,844
Dividend PolicyThe Company has paid regular quarterly dividends in each year since 2001. The dividend policy undergoes periodicreview by the Board of Directors and is subject to change.On March 1, 2017, the Board of Directors declared a quarterly dividend of $0.275 per common share ($0.25 per commonshare on November 2, 2016), beginning with the dividend payable on April 1, 2017.
Normal Course Issuer BidOn May 16, 2017, the Company's application was approved for a Normal Course Issuer Bid to purchase through thefacilities of the Toronto Stock Exchange, alternative Canadian trading platforms, and the New York Stock Exchange, upto 27,931,135 common shares, over a 12 month period commencing May 23, 2017 and ending May 22, 2018. For thenine months ended September 30, 2017, the Company did not purchase any common shares for cancellation.
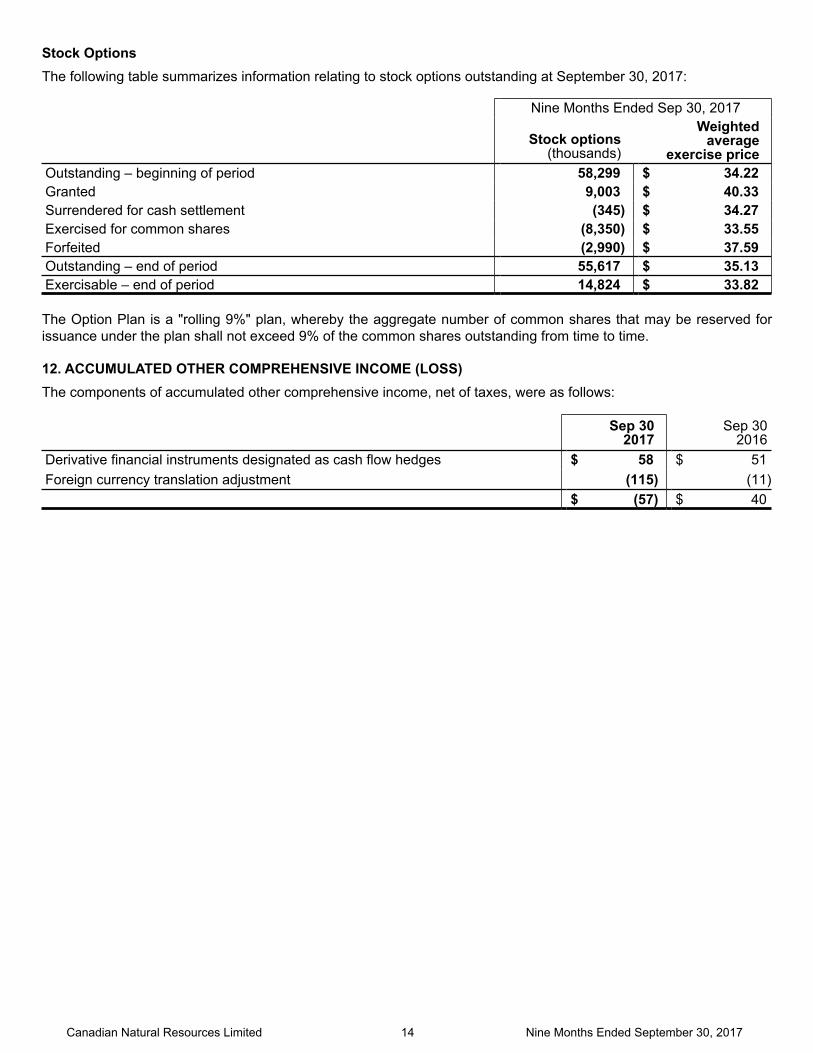
Stock OptionsThe following table summarizes information relating to stock options outstanding at September 30, 2017:
Nine Months Ended Sep 30, 2017
Stock options(thousands)
Weighted average
exercise priceOutstanding – beginning of period 58,299 $ 34.22Granted 9,003 $ 40.33Surrendered for cash settlement (345) $ 34.27Exercised for common shares (8,350) $ 33.55Forfeited (2,990) $ 37.59Outstanding – end of period 55,617 $ 35.13Exercisable – end of period 14,824 $ 33.82
The Option Plan is a "rolling 9%" plan, whereby the aggregate number of common shares that may be reserved forissuance under the plan shall not exceed 9% of the common shares outstanding from time to time.
Canadian Natural Resources Limited 14 Nine Months Ended September 30, 2017
12. ACCUMULATED OTHER COMPREHENSIVE INCOME (LOSS)The components of accumulated other comprehensive income, net of taxes, were as follows:
Sep 30 2017
Sep 30 2016
Derivative financial instruments designated as cash flow hedges $ 58 $ 51Foreign currency translation adjustment (115) (11)
$ (57) $ 40

13. CAPITAL DISCLOSURESThe Company does not have any externally imposed regulatory capital requirements for managing capital. The Companyhas defined its capital to mean its long-term debt and consolidated shareholders’ equity, as determined at each reportingdate.The Company’s objectives when managing its capital structure are to maintain financial flexibility and balance to enablethe Company to access capital markets to sustain its on-going operations and to support its growth strategies. TheCompany primarily monitors capital on the basis of an internally derived financial measure referred to as its "debt to bookcapitalization ratio", which is the arithmetic ratio of current and long-term debt divided by the sum of the carrying valueof shareholders’ equity plus current and long-term debt. The Company’s internal targeted range for its debt to bookcapitalization ratio is 25% to 45%. This range may be exceeded in periods when a combination of capital projects,acquisitions, or lower commodity prices occurs. The Company may be below the low end of the targeted range whencash flow from operating activities is greater than current investment activities. At September 30, 2017, the ratio waswithin the target range at 42%.Readers are cautioned that the debt to book capitalization ratio is not defined by IFRS and this financial measure maynot be comparable to similar measures presented by other companies. Further, there are no assurances that the Companywill continue to use this measure to monitor capital or will not alter the method of calculation of this measure in the future.
Sep 30 2017
Dec 31 2016
Long-term debt (1) $ 22,921 $ 16,805Total shareholders’ equity $ 31,339 $ 26,267Debt to book capitalization 42% 39%
(1) Includes the current portion of long-term debt.
Canadian Natural Resources Limited 15 Nine Months Ended September 30, 2017
14. NET EARNINGS (LOSS) PER COMMON SHARE
Three Months Ended Nine Months EndedSep 30
2017Sep 30
2016Sep 30
2017Sep 30
2016Weighted average common shares outstanding
– basic (thousands of shares) 1,215,616 1,102,117 1,160,006 1,098,219Effect of dilutive stock options (thousands of shares) 6,312 — 7,520 —Weighted average common shares outstanding
– diluted (thousands of shares) 1,221,928 1,102,117 1,167,526 1,098,219Net earnings (loss) $ 684 $ (326) $ 2,001 $ (770)Net earnings (loss) per common share – basic $ 0.56 $ (0.29) $ 1.72 $ (0.70)
– diluted $ 0.56 $ (0.29) $ 1.71 $ (0.70)
15. FINANCIAL INSTRUMENTSThe carrying amounts of the Company’s financial instruments by category were as follows:
Sep 30, 2017
Asset (liability)
Financial assets
at amortized cost
Fair value through
profit or loss
Derivatives used for hedging
Financial liabilities at
amortizedcost Total
Accounts receivable $ 1,481 $ — $ — $ — $ 1,481Investments — 888 — — 888Other long-term assets 456 38 241 — 735Accounts payable — — — (794) (794)Accrued liabilities — — — (2,292) (2,292)Other long-term liabilities (1) — — — (469) (469)Long-term debt (2) — — — (22,921) (22,921)
$ 1,937 $ 926 $ 241 $ (26,476) $ (23,372)
Dec 31, 2016
Asset (liability)
Financial assets
at amortized cost
Fair value through
profit or loss
Derivatives used for hedging
Financial liabilities at amortized
cost TotalAccounts receivable $ 1,434 $ — $ — $ — $ 1,434Investments — 913 — — 913Other long-term assets 385 4 485 — 874Accounts payable — — — (595) (595)Accrued liabilities — — — (2,222) (2,222)Long-term debt (2) — — — (16,805) (16,805)
$ 1,819 $ 917 $ 485 $ (19,622) $ (16,401)(1) Includes $469 million (US$375 million) of deferred purchase consideration payable to Marathon in March 2018.(2) Includes the current portion of long-term debt.
The carrying amounts of the Company’s financial instruments approximated their fair value, except for fixed rate long-term debt. The fair values of the Company’s investments, recurring other long-term assets and fixed rate long-term debtare outlined below:
Sep 30, 2017Carrying amount Fair value
Asset (liability) (1) (2) Level 1 Level 2 Level 3Investments (3) $ 888 $ 888 $ — $ —Other long-term assets (4) $ 735 $ — $ 279 $ 456Fixed rate long-term debt (5) (6) $ (15,976) $ (17,050) $ — $ —
Canadian Natural Resources Limited 16 Nine Months Ended September 30, 2017
Dec 31, 2016Carrying amount Fair value
Asset (liability) (1) (2) Level 1 Level 2 Level 3
Investments (3) $ 913 $ 913 $ — $ —Other long-term assets (4) $ 874 $ — $ 489 $ 385Fixed rate long-term debt (5) (6) $ (12,498) $ (13,217) $ — $ —
(1) Excludes financial assets and liabilities where the carrying amount approximates fair value due to the liquid nature of the asset or liability (cash and cashequivalents, accounts receivable, accounts payable and accrued liabilities, and deferred purchase consideration payable to Marathon in March 2018).
(2) There were no transfers between Level 1, 2 and 3 financial instruments.(3) The fair value of the investments are based on quoted market prices.(4) The fair value of North West Redwater Partnership subordinated debt is based on the present value of future cash receipts.(5) The fair value of fixed rate long-term debt has been determined based on quoted market prices.(6) Includes the current portion of fixed rate long-term debt.
The following provides a summary of the carrying amounts of derivative financial instruments held and a reconciliationto the Company’s consolidated balance sheets.
Asset (liability)Sep 30
2017Dec 31
2016Derivatives held for trading
Foreign currency forward contracts $ 29 $ 10Crude oil price collars 7 —Natural gas AECO swaps 2 (6)
Cash flow hedgesForeign currency forward contracts 19 16Cross currency swaps 222 469
$ 279 $ 489
Included within:Current portion of other long-term assets $ 63 $ 222Other long-term assets 216 267
$ 279 $ 489
For the nine months ended September 30, 2017, the Company recognized a gain of $4 million (year ended December 31,2016 – gain of $7 million) related to ineffectiveness arising from cash flow hedges.The estimated fair value of derivative financial instruments in Level 2 at each measurement date have been determinedbased on appropriate internal valuation methodologies and/or third party indications. Level 2 fair values determined usingvaluation models require the use of assumptions concerning the amount and timing of future cash flows and discountrates. In determining these assumptions, the Company primarily relied on external, readily-observable quoted marketinputs as applicable, including crude oil and natural gas forward benchmark commodity prices and volatility, Canadianand United States forward interest rate yield curves, and Canadian and United States foreign exchange rates, discountedto present value as appropriate. The resulting fair value estimates may not necessarily be indicative of the amounts thatcould be realized or settled in a current market transaction and these differences may be material.
Canadian Natural Resources Limited 17 Nine Months Ended September 30, 2017

Risk ManagementThe Company periodically uses derivative financial instruments to manage its commodity price, interest rate and foreigncurrency exposures. These financial instruments are entered into solely for hedging purposes and are not used forspeculative purposes.The changes in estimated fair values of derivative financial instruments included in the risk management asset wererecognized in the financial statements as follows:
Asset (liability)Sep 30
2017Dec 31
2016Balance – beginning of period $ 489 $ 854Net change in fair value of outstanding derivative financial instruments
recognized in:Risk management activities 38 (25)Foreign exchange (284) (304)Other comprehensive income (loss) 36 (36)
Balance – end of period 279 489Less: current portion 63 222
$ 216 $ 267
Net loss (gain) from risk management activities were as follows:
Three Months Ended Nine Months EndedSep 30
2017Sep 30
2016Sep 30
2017Sep 30
2016Net realized risk management loss (gain) $ 96 $ (23) $ 71 $ 22Net unrealized risk management loss (gain) 8 10 (38) 32
$ 104 $ (13) $ 33 $ 54
Financial Risk Factorsa) Market risk Market risk is the risk that the fair value or future cash flows of a financial instrument will fluctuate because of changesin market prices. The Company’s market risk is comprised of commodity price risk, interest rate risk, and foreign currencyexchange risk.
Commodity price risk managementThe Company periodically uses commodity derivative financial instruments to manage its exposure to commodity pricerisk associated with the sale of its future crude oil and natural gas production and with natural gas purchases. AtSeptember 30, 2017, the Company had the following derivative financial instruments outstanding to manage its commodityprice risk:
Sales contracts
Remaining term Volume Weighted average price IndexCrude Oil
Price collars Oct 2017 - Dec 2017 67,500 bbl/d US$50.00 - US$60.10 WTI
Natural GasAECO swaps Oct 2017 50,000 GJ/d $2.80 AECO
The Company’s outstanding commodity derivative financial instruments are expected to be settled monthly based onthe applicable index pricing for the respective contract month.
Canadian Natural Resources Limited 18 Nine Months Ended September 30, 2017

Interest rate risk managementThe Company is exposed to interest rate price risk on its fixed rate long-term debt and to interest rate cash flow risk onits floating rate long-term debt. The Company periodically enters into interest rate swap contracts to manage its fixed tofloating interest rate mix on long-term debt. Interest rate swap contracts require the periodic exchange of paymentswithout the exchange of the notional principal amounts on which the payments are based. At September 30, 2017, theCompany had no interest rate swap contracts outstanding.
Foreign currency exchange rate risk managementThe Company is exposed to foreign currency exchange rate risk in Canada primarily related to its US dollar denominatedlong-term debt, commercial paper and working capital. The Company is also exposed to foreign currency exchange raterisk on transactions conducted in other currencies and in the carrying value of its foreign subsidiaries. The Companyperiodically enters into cross currency swap contracts and foreign currency forward contracts to manage known currencyexposure on US dollar denominated long-term debt, commercial paper and working capital. The cross currency swapcontracts require the periodic exchange of payments with the exchange at maturity of notional principal amounts onwhich the payments are based. At September 30, 2017, the Company had the following cross currency swap contractsoutstanding:
Remaining term AmountExchange rate
(US$/C$)Interest rate
(US$)Interest rate
(C$)Cross currencySwaps Oct 2017 — Nov 2021 US$500 1.022 3.45% 3.96%
Oct 2017 — Mar 2038 US$550 1.170 6.25% 5.76%
All cross currency swap derivative financial instruments were designated as hedges at September 30, 2017 and wereclassified as cash flow hedges.In addition to the cross currency swap contracts noted above, at September 30, 2017, the Company had US$3,566million of foreign currency forward contracts outstanding, with original terms of up to 90 days, including US$2,187 milliondesignated as cash flow hedges.
b) Credit RiskCredit risk is the risk that a party to a financial instrument will cause a financial loss to the Company by failing to dischargean obligation.
Counterparty credit risk management The Company’s accounts receivable are mainly with customers in the crude oil and natural gas industry and are subjectto normal industry credit risks. The Company manages these risks by reviewing its exposure to individual companies ona regular basis and where appropriate, ensures that parental guarantees or letters of credit are in place to minimize theimpact in the event of default. At September 30, 2017, substantially all of the Company’s accounts receivable were duewithin normal trade terms.The Company is also exposed to possible losses in the event of nonperformance by counterparties to derivative financialinstruments; however, the Company manages this credit risk by entering into agreements with counterparties that aresubstantially all investment grade financial institutions. At September 30, 2017, the Company had net risk managementassets of $279 million with specific counterparties related to derivative financial instruments (December 31, 2016 – $489million).The carrying amount of financial assets approximates the maximum credit exposure.
c) Liquidity risk Liquidity risk is the risk that the Company will encounter difficulty in meeting obligations associated with financial liabilities.Management of liquidity risk requires the Company to maintain sufficient cash and cash equivalents, along with othersources of capital, consisting primarily of cash flow from operating activities, available credit facilities, commercial paperand access to debt capital markets, to meet obligations as they become due. The Company believes it has adequatebank credit facilities to provide liquidity to manage fluctuations in the timing of the receipt and/or disbursement of operatingcash flows.
Canadian Natural Resources Limited 19 Nine Months Ended September 30, 2017

The maturity dates for financial liabilities were as follows:
Less than1 year
1 to less than2 years
2 to less than5 years Thereafter
Accounts payable $ 794 $ — $ — $ —Accrued liabilities $ 2,292 $ — $ — $ —Other long-term liabilities (1) $ 469 $ — $ — $ —Long-term debt (2) $ 2,026 $ 1,569 $ 9,127 $ 10,344
(1) Includes $469 million (US$375 million) of deferred purchase consideration payable to Marathon in March 2018.(2) Long-term debt represents principal repayments only and does not reflect interest, original issue discounts and premiums or transaction costs.
Canadian Natural Resources Limited 20 Nine Months Ended September 30, 2017
16. COMMITMENTS AND CONTINGENCIESThe Company has committed to certain payments as follows:
Remaining2017 2018 2019 2020 2021 Thereafter
Product transportation and pipeline $ 172 $ 648 $ 499 $ 476 $ 445 $ 4,065Offshore equipment operating leases
and offshore drilling $ 54 $ 181 $ 92 $ 69 $ 68 $ 8Office leases $ 12 $ 45 $ 43 $ 42 $ 40 $ 152Other $ 33 $ 45 $ 40 $ 39 $ 39 $ 359 In addition to the commitments disclosed above, the Company has entered into various agreements related to theengineering, procurement and construction of Horizon and Kirby North. These contracts can be canceled by the Companyupon notice without penalty, subject to the costs incurred up to and in respect of the cancellation.The Company is defendant and plaintiff in a number of legal actions arising in the normal course of business. In addition,the Company is subject to certain contractor construction claims. The Company believes that any liabilities that mightarise pertaining to any such matters would not have a material effect on its consolidated financial position.
17. SEGMENTED INFORMATION
North America North Sea Offshore Africa Total Exploration and Production
(millions of Canadian dollars,unaudited) Three Months Ended Nine Months Ended Three Months Ended Nine Months Ended Three Months Ended Nine Months Ended Three Months Ended Nine Months Ended
Sep 30 Sep 30 Sep 30 Sep 30 Sep 30 Sep 30 Sep 30 Sep 30
2017 2016 2017 2016 2017 2016 2017 2016 2017 2016 2017 2016 2017 2016 2017 2016
Segmented product sales 2,096 1,779 6,569 4,968 185 171 569 402 196 134 448 440 2,477 2,084 7,586 5,810
Less: royalties (201) (132) (581) (332) — — (1) (1) (12) (6) (25) (18) (213) (138) (607) (351)
Segmented revenue 1,895 1,647 5,988 4,636 185 171 568 401 184 128 423 422 2,264 1,946 6,979 5,459
Segmented expenses
Production 569 518 1,730 1,630 95 107 281 299 82 38 180 147 746 663 2,191 2,076Transportation, blending and
feedstock 472 422 1,626 1,395 8 15 26 37 — 1 1 2 480 438 1,653 1,434Depletion, depreciation and
amortization 821 854 2,393 2,606 71 117 472 315 53 60 153 215 945 1,031 3,018 3,136Asset retirement obligation
accretion 20 17 59 50 7 8 21 26 2 3 6 9 29 28 86 85
Realized risk management activities 96 (23) 71 22 — — — — — — — — 96 (23) 71 22Gain on acquisition, disposition and
revaluation of properties — — (35) (32) — — — — — — — — — — (35) (32)
(Gain) loss from investments (64) (54) 4 (197) — — — — — — — — (64) (54) 4 (197)
Total segmented expenses 1,914 1,734 5,848 5,474 181 247 800 677 137 102 340 373 2,232 2,083 6,988 6,524Segmented earnings (loss)
before the following (19) (87) 140 (838) 4 (76) (232) (276) 47 26 83 49 32 (137) (9) (1,065)
Non–segmented expenses
Administration
Share-based compensation
Interest and other financing expense
Unrealized risk management activities
Foreign exchange (gain) loss
Total non–segmented expenses
Earnings (loss) before taxes
Current income tax recovery
Deferred income tax expense(recovery)
Net earnings (loss)
Canadian Natural Resources Limited 21 Nine Months Ended September 30, 2017

Oil Sands Mining and Upgrading Midstream Inter–segment
elimination and other
Total
(millions of Canadian dollars,unaudited) Three Months Ended Nine Months Ended Three Months Ended Nine Months Ended Three Months Ended Nine Months Ended Three Months Ended Nine Months Ended
Sep 30 Sep 30 Sep 30 Sep 30 Sep 30 Sep 30 Sep 30 Sep 30
2017 2016 2017 2016 2017 2016 2017 2016 2017 2016 2017 2016 2017 2016 2017 2016
Segmented product sales 2,067 380 4,749 1,578 26 31 74 88 (23) (18) (63) (50) 4,547 2,477 12,346 7,426
Less: royalties (46) (4) (98) (10) — — — — — — — — (259) (142) (705) (361)
Segmented revenue 2,021 376 4,651 1,568 26 31 74 88 (23) (18) (63) (50) 4,288 2,335 11,641 7,065
Segmented expenses
Production 829 326 1,754 916 4 7 12 20 (2) (2) (6) (5) 1,577 994 3,951 3,007Transportation, blending and
feedstock 246 22 340 60 — — — — (21) (16) (63) (49) 705 444 1,930 1,445Depletion, depreciation and
amortization 324 182 756 464 2 3 6 9 — — — — 1,271 1,216 3,780 3,609Asset retirement obligation
accretion 15 8 33 22 — — — — — — — — 44 36 119 107
Realized risk management activities — — — — — — — — — — — — 96 (23) 71 22Gain on acquisition, disposition and
revaluation of properties — — (230) — (114) — (114) — — — — — (114) — (379) (32)
(Gain) loss from investments — — — — (20) 4 (32) (19) — — — — (84) (50) (28) (216)
Total segmented expenses 1,414 538 2,653 1,462 (128) 14 (128) 10 (23) (18) (69) (54) 3,495 2,617 9,444 7,942Segmented earnings (loss)
before the following 607 (162) 1,998 106 154 17 202 78 — — 6 4 793 (282) 2,197 (877)
Non–segmented expenses
Administration 73 82 235 259
Share-based compensation 114 74 37 313Interest and other financing
expense 183 90 462 268Unrealized risk management
activities 8 10 (38) 32
Foreign exchange (gain) loss (367) 51 (770) (215)
Total non–segmented expenses 11 307 (74) 657
Earnings (loss) before taxes 782 (589) 2,271 (1,534)
Current income tax recovery (50) (281) (76) (569)Deferred income tax expense
(recovery) 148 18 346 (195)
Net earnings (loss) 684 (326) 2,001 (770)
Canadian Natural Resources Limited 22 Nine Months Ended September 30, 2017

Capital Expenditures (1)
Nine Months EndedSep 30, 2017 Sep 30, 2016
Net (2)
expenditures
Non-cashand fair valuechanges (2) (3)
Capitalized costs
Netexpenditures
Non-cashand fair value
changes (3)Capitalized
costs
Exploration andevaluation assets
Exploration and Production
North America (4) $ 149 $ (162) $ (13) $ 17 $ (167) $ (150)North Sea — — — — — —Offshore Africa 10 — 10 5 (18) (13)
Oil Sands Mining andUpgrading 142 117 259 — — —
$ 301 $ (45) $ 256 $ 22 $ (185) $ (163)
Property, plant and equipmentExploration and Production
North America $ 2,382 $ 254 $ 2,636 $ 842 $ (134) $ 708North Sea 108 20 128 89 — 89Offshore Africa 58 4 62 123 — 123
2,548 278 2,826 1,054 (134) 920Oil Sands Mining and Upgrading (5) 9,035 5,764 14,799 2,090 (120) 1,970Midstream (6) 78 114 192 4 — 4Head office 30 — 30 13 — 13
$ 11,691 $ 6,156 $ 17,847 $ 3,161 $ (254) $ 2,907(1) This table provides a reconciliation of capitalized costs including derecognitions and does not include the impact of foreign exchange adjustments.(2) Net expenditures on exploration and evaluation assets and property, plant and equipment for the nine months ended September 30, 2017 exclude non-
cash share consideration of $3,818 million issued on the acquisition of AOSP and other assets. This non-cash consideration is included in non-cash andother fair value changes.
(3) Asset retirement obligations, deferred income tax adjustments related to differences between carrying amounts and tax values, transfers of explorationand evaluation assets, transfers of property, plant and equipment to inventory due to change in use, and other fair value adjustments.
(4) The above noted figures for 2017 do not include the impact of a pre-tax cash gain of $35 million (2016 - $32 million pre-tax cash gain) on the dispositionof certain exploration and evaluation assets.
(5) Net expenditures for Oil Sands Mining and Upgrading include capitalized interest and share-based compensation.(6) The above noted figures for 2017 include the impact of a pre-tax non-cash revaluation gain of $114 million ($83 million after-tax) related to a previously
held joint interest in a pipeline system.
Segmented Assets
Sep 30 2017
Dec 31 2016
Exploration and ProductionNorth America $ 28,883 $ 28,892North Sea 1,663 2,269Offshore Africa 1,325 1,580Other 63 29
Oil Sands Mining and Upgrading 39,739 24,852Midstream 1,188 912Head office 127 114
$ 72,988 $ 58,648
Canadian Natural Resources Limited 23 Nine Months Ended September 30, 2017

SUPPLEMENTARY INFORMATIONINTEREST COVERAGE RATIOSThe following financial ratios are provided in connection with the Company’s continuous offering of medium-term notespursuant to the short form prospectus dated July 2017. These ratios are based on the Company’s interim consolidatedfinancial statements that are prepared in accordance with accounting principles generally accepted in Canada.
Interest coverage ratios for the twelve month period ended September 30, 2017:Interest coverage (times)
Net earnings (1) 5.0x Funds flow from operations (2) 10.8x
(1) Net earnings plus income taxes and interest expense excluding current and deferred PRT expense and other taxes; divided by the sum of interest expenseand capitalized interest.
(2) Funds flow from operations plus current income taxes and interest expense excluding current PRT expense and other taxes; divided by the sum of interestexpense and capitalized interest.
Canadian Natural Resources Limited 24 Nine Months Ended September 30, 2017


![Yantra Natural Resources Limited Natural Resources Limited – Annual Report 2013 - 2014 [CIN: L14297AP1988PLC074808]](https://static.fdocuments.us/doc/165x107/5b00814d7f8b9ad85d8cb361/yantra-natural-resources-limited-natural-resources-limited-annual-report-2013.jpg)