Canadian National Honey Bee Health Survey
33
Photo Credit: Christy Curran CANADIAN NATIONAL HONEY BEE HEALTH SURVEY 2016 REPORT British Columbia, Alberta, Manitoba, Ontario, Quebec, New Brunswick, Nova Scotia, Prince Edward Island, Newfoundland & Labrador, and Yukon Territory 1 Research Road Beaverlodge, AB T0H 0C0 Phone: 780-357-7737 Fax: 780-354-8080 www.thenbdc.ca
Transcript of Canadian National Honey Bee Health Survey

Pho
to C
red
it: Christy
Curra
n
CANADIAN NATIONAL HONEY BEE HEALTH SURVEY
2016 REPORT British Columbia, Alberta, Manitoba, Ontario, Quebec, New Brunswick, Nova Scotia, Prince Edward Island, Newfoundland & Labrador, and Yukon Territory
1 Research Road
Beaverlodge, AB T0H 0C0
Phone: 780-357-7737
Fax: 780-354-8080
www.thenbdc.ca

2016 Canadian National Honey Bee Health Survey
Page 1
2016 Canadian National Honey Bee Health Survey
The Canadian National Honey Bee Health Survey is a four year, nation-wide initiative established to
index honey bee health; the Survey began in 2014 and will complete its first phase in 2017. This project
was industry driven by the Alberta Beekeepers Commission and the Manitoba Beekeeper’s Association,
on behalf of the Grande Prairie Regional College’s National Bee Diagnostic Centre – Technology Access
Centre (GPRC NBDC-TAC).
The purpose of this project, the first of its kind in Canada, is to document the prevalence, intensity and
distribution of pests and pathogens in Canadian apiaries. This information will help ensure that Canada,
as a country, has robust data to establish a bee health database- similar to other leading beekeeping
countries in the world.
To accomplish this, bee samples are collected from across Canada- with a goal of sampling 0.5% of
registered hives.
The Survey was designed to systematically expand across the country, starting in Alberta and Manitoba
the first year, and to conclude its fourth year fully national in scope with over 350 samples from all
Provinces.
Year One (2014) the Survey began in Alberta and Manitoba, resulting in samples from 163 apiaries.
Year Two (2015) the Survey expanded to 2 additional provinces, British Columbia and Ontario, resulting
in samples from 212 apiaries.
Year Three (2016) the Survey moved into Eastern Canada, including Quebec, New Brunswick, Nova
Scotia, Prince Edward Island and Newfoundland & Labrador. Samples from the Yukon Territories were
also received, resulting in samples from 314 apiaries.
The information generated by the Canadian National Honey Bee Health Survey will play a central role in
developing regional colony health management practices and will provide the best opportunity to
identify exotic organisms before they establish themselves within Canadian bee populations; maintenance
of healthy bee populations will allow for a sustainable apiculture industry.

2016 Canadian National Honey Bee Health Survey
Page 2
Table of Contents G L O S S A RY -------------------------------------------------------------------------------------------------------3-4
S U R V E Y M E T H O D O L O G Y ------------------------------------------------------------------------------ 5-7
M A P S O F S A M P L E R E G I O N S
British Columbia------------------------------------------------------------------------------------------------8
Alberta----------------------------------------------------------------------------------------------------------9
Manitoba------------------------------------------------------------------------------------------------------10
Ontario--------------------------------------------------------------------------------------------------------11
Quebec--------------------------------------------------------------------------------------------------------12
New Brunswick------------------------------------------------------------------------------------------------13
Nova Scotia---------------------------------------------------------------------------------------------------14
Prince Edward Island----------------------------------------------------------------------------------------15
Newfoundland/Yukon Territory----------------------------------------------------------------------------16
R E S U L T S
Visual Inspection----------------------------------------------------------------------------------------------17
Nosema----------------------------------------------------------------------------------------------------18-20
Varroa-----------------------------------------------------------------------------------------------------21-22
American Foulbrood-------------------------------------------------------------------------------------23-25
European Foulbrood-----------------------------------------------------------------------------------------26
Tracheal Mites and Tropilaelaps----------------------------------------------------------------------------27
African Genetics Testing-------------------------------------------------------------------------------------27
Viral Analysis-------------------------------------------------------------------------------------------------28
N O T E S ---------------------------------------------------------------------------------------------------------------29
D I S C U S S I O N / S U M M A RY -----------------------------------------------------------------------------30-31
A C K N O W L E D G E M E N T S ---------------------------------------------------------------------------------------32

2016 Canadian National Honey Bee Health Survey
Page 3
Glossary
AAFC
AB
ABPV
AFB
AHB
BC
BQCV
CBPV
CFU
DNA
DWV
EFB
EHB
GPRC
IAPV
KBV
MB
mtDNA
NB
NBDC
NL
NS
ON
OTC
QC
Agriculture & Agri-Food Canada
Alberta
Acute Bee Paralysis Virus
American Foulbrood
Africanized Honey Bees
British Columbia
Black Queen Cell Virus
Chronic Bee Paralysis Virus
Colony Forming Unit
Deoxyribonucleic Acid
Deformed Wing Virus
European Foulbrood
European Honey Bees
Grande Prairie Regional College
Israeli Acute Paralysis Virus
Kashmir Bee Virus
Manitoba
Mitochondrial DNA
New Brunswick
National Bee Diagnostic Centre
Newfoundland & Labrador
Nova Scotia
Ontario
Oxytetracycline
Quebec
2016 Canadian National Honey Bee Health Survey
Page 4
Glossary con’t
PEI
PCR
RFLP
RNA
SBV
SNP
TAC
YT
Prince Edward Island
Polymerase Chain Reaction
Restriction Fragment-Length Polymorphism
Ribonucleic Acid
Sacbrood Virus
Single Nucleotide Polymorphism
Technology Access Centre
Yukon Territory

2016 Canadian National Honey Bee Health Survey
Page 5
Survey Methodology
YEAR 3: During the Summer of 2016, 314 apiary samples were collected ,
representing 3,097 colonies. All diagnostic tests were performed a t the GPRC NBDC -
TAC in Beaverlodge, Alber ta.
Apiary Sampling: Samples were collected between July and mid-September 2016 - before fall
treatments for Varroa and Nosema were applied. Sample technicians in each province were employees or contractors of the GPRC NBDC-TAC that received skill specific training for the Survey. In addition to individual contractors, AB Agriculture and Forestry, Agriculture & Agri-Food Canada (AAFC), BC Ministry of Agriculture, Centre de Recherche en Sciences Animales de Deschambault (CRSAD) and the Atlantic Tech Transfer Team for Apiculture (ATTTA) each provided personnel support for sampling.
3 types of composite samples were collected from 10 randomly-chosen colonies at each apiary:
I. LIVE BEE SAMPLE: bees were collected in a battery box and shipped live for disease and pest
analysis including Nosema spore count and species identification, American Foulbrood (AFB)
culture and antibiotic response testing, European Foulbrood (EFB) detection, tracheal mite
detection and analysis of 7 honey bee viruses.
New for 2016, samples were tested for hybridization with African races of honey bees.
II. ALCOHOL WASH SAMPLE: bees were collected and submerged in 70% ethanol to determine
Varroa mite levels.
III. BROOD FRAME DEBRIS SAMPLE: material was collected from the “knock test” of a brood frame
to monitor for Tropilaelaps mites.
Sample Distribution: see Map Section for detailed figures outlining sample regions.
British Columbia 30 Total Samples Ontario 30 Total Samples
Fraser Valley 9 Samples Central 3 Samples
Kootenay 3 Samples Southeast 5 Samples
Northwest 3 Samples Southwest 22 Samples
Okanagan 5 Samples Quebec 35 Total Samples
Peace 3 Samples Capital 18 Samples
Thompson/Cariboo 4 Samples Northeast 6 Samples
Vancouver 3 Samples Northwest 3 Samples
Alberta 138 Total Samples Southwest 8 Samples
Central 14 Samples New Brunswick 11 Total Samples
Northeast 14 Samples North 5 Samples
Northwest 34 Samples South 6 Samples
Peace 35 Samples Nova Scotia 14 Total Samples
South 41 Samples Central 9 Samples
Manitoba 39 Total Samples Western 5 Samples
Central 10 Samples Prince Ed. Island 8 Total Samples
Eastern Interlake 10 Samples East 4 Samples
Northwest 9 Samples West 4 Samples
Southern 10 Samples Newfoundland 5 Total Samples
Provincial 5 Samples
Yukon Territory 4 Total Samples
Territory 4 Samples

2016 Canadian National Honey Bee Health Survey
Page 6
Visual Inspection: The 3 central brood frames were examined for brood and adult clinical disease
symptoms or other colony conditions in each of the 10 colonies sampled per apiary. Results were scored
for the presence or absence of a symptom or condition.
Nosema Counting/Identification: Sixty bees were macerated and analyzed for Nosema spp.
infections. Samples were examined using a haemocytometer under light microscopy (400x) to calculate a
Nosema spore count. Additionally, DNA was extracted from the same maceration and a PCR protocol
performed to identify Nosema species (N. apis, N. ceranae, or both).
Varroa Counting: Bees (~1,000) were collected in 70% ethanol and agitated with a laboratory
bench-top shaker to dislodge mites for the Varroa mite analysis. Dislodged mites were counted to
provide an infestation level of the apiary, expressed as the number of mites per 100 adult bees (%).
AFB Bacterial Culture: One hundred and twenty adult bees were tested for the presence or
absence of Paenibacillus larvae, the bacterium that causes AFB. Each sample was cultivated in triplicate
on diagnostic media plates that supported the growth of the bacterium. If present, the number of
bacterial colonies that grew was scored as the number of colony forming units (CFU). Samples that tested
positive for Paenibacillus larvae were further analyzed for resistance or sensitivity towards the antibiotics
Oxytetracycline (Oxytet) and Tylosin, which are registered for the control of AFB in Canada.
AFB Risk: Apiaries were categorized into 4 nominal groups for their propensity to develop clinical
symptoms of AFB. Risk categories were designated based on the average number of bacterial colony
forming units (CFU) that were cultivated on diagnostic media plates: Not Detected, Possible Risk (1-99
CFU), Moderate Risk (100-999 CFU) and High Risk (>1,000 CFU).
EFB (PCR) Detection: DNA was extracted from samples and a PCR protocol was applied to detect
the presence or absence of European Foulbrood (Melissococcus plutonius).
African Ancestry Testing:
I.PCR-RFLP Assay: DNA was extracted from 60 bees and a PCR-based restriction fragment-length
polymorphism (RFLP) assay that targets three mitochondrial DNA genes and employs four restriction
enzymes for the discrimination of four honey bee subspecies (Eastern European, Western European, Apis
mellifera lamarckii and sub-Saharan African) was performed.
As a follow-up, 30 bees were analyzed from each positive composite sample to identify individual bees
positive for African genetics.
A blind subset of this DNA was also sent to the University of Guelph’s Honey Bee Research Centre to
verify results. This analysis indicates a positive or negative detection of mtDNA with African origin.
*mtDNA is maternally inherited; therefore, analysis by this method will not detect progeny of European
queens mated with Africanized drones.

2016 Canadian National Honey Bee Health Survey
Page 7
African Ancestry Testing Con’t :
II. SNP Analysis: Further examination of positive samples determined by the PCR-RFLP Assay was
performed using a Single Nucleotide Polymorphism (SNP) analysis. A second subset of DNA from the
individual bees positive for African ancestry was sent to the Genome Quebec sequencing facility at
McGill University for a SNP assay to identify Africanized honey bees via proportion of their African
ancestry. This method quantifies the ancestry of honey bees using both maternal and paternal inherited
nuclear markers to distinguish between Africanized honey bees (AHB) and European honey bees (EHB).
Tracheal Mites: PCR was used to detect the presence or absence of tracheal mites (Acarapis woodi)
from extracted DNA. Samples positively identified with Acarapis woodi were further investigated; 20
bees from the apiary sample were dissected for tracheal mite identification, examined under a light
microscope.
Tropilaelaps Detection: Debris was collected by knocking an unsealed brood frame into a metal
collection pan. The debris was screened for the presence of Tropilaelaps spp. mites under a dissecting
microscope. Tropilaelaps are a parasitic mite found in Asia, not native in North America. Surveillance for
Tropilaelaps is valuable as they are a potential invasive pest.
Viral Detection: RNA was extracted from 60 bees, converted into cDNA and analyzed for 7 viruses by
PCR: Acute Bee Paralysis Virus (ABPV), Black Queen Cell Virus (BQCV), Chronic Bee Paralysis Virus
(CBPV), Deformed Wing Virus (DWV), Israeli Acute Bee Paralysis Virus (IAPV), Kashmir Bee Virus (KBV),
and Sacbrood Virus (SBV). Apiaries were scored as “Positive” for any detection level of the virus or
“Negative” for the absence of the virus.

2016 Canadian National Honey Bee Health Survey
Page 8
Provincial/Territory Maps
BRITISH COLUMBIA
Figure 1. Provincial map of British Columbia, includes 7 Regions: Fraser Valley, Kootenay, Northwest,
Okanagan, Peace, Thompson/Cariboo, and Vancouver Coast.

2016 Canadian National Honey Bee Health Survey
Page 9
ALBERTA
Figure 2. Provincial map of Alberta, includes 5 Regions: Central, Northeast, Northwest, Peace and South.

2016 Canadian National Honey Bee Health Survey
Page 10
MANITOBA
Figure 3. Provincial map of Manitoba, includes 4 Regions: Central, Eastern Interlake, Northwest and
Southern.

2016 Canadian National Honey Bee Health Survey
Page 11
ONTARIO
Figure 4. Provincial map of Ontario, includes 3 Regions: Central, Southwest and Southeast.

2016 Canadian National Honey Bee Health Survey
Page 12
QUEBEC
Figure 5. Provincial map of Quebec, includes 4 Regions: Northeast, Northwest, Southwest and Capital.

2016 Canadian National Honey Bee Health Survey
Page 13
NEW BRUNSWICK
Figure 6. Provincial map of New Brunswick, includes 2 Regions: North and South.

2016 Canadian National Honey Bee Health Survey
Page 14
NOVA SCOTIA
Figure 7. Provincial map of Nova Scotia, includes 2 Regions: Western and Central.

2016 Canadian National Honey Bee Health Survey
Page 15
PRINCE EDWARD ISLAND
Figure 8. Provincial map of Prince Edward Island, includes 2 Regions: West and East.

2016 Canadian National Honey Bee Health Survey
Page 16
NEWFOUNDLAND AND LABRADOR/ YUKON TERRITORY
Figure 9. Provincial/territory maps of Newfoundland & Labrador and the Yukon Territory, both
analyzed as a single entity- not enough samples for regional distribution.

2016 Canadian National Honey Bee Health Survey
Page 17
Results Visual Inspection (Incidence)
Disease/
Condition
BC
n=300
AB
n=1380
MB
n=390
ON
n=296*
QC
n=350
NB
n=102*
NS
n=132*
PEI
n=79*
NL
n=50
YT
n=18*
National
Average
n=3097
AFB 0 0.5 0 0 0 0 0 0 0 0 0.2%
EFB 0.7 0.1 0 0.7 2.0 2.9 0.8 1.3 0 0 0.6%
Sacbrood 1.3 0.9 0.3 0.3 0 0 0.8 0 0 0 0.6%
Chalkbrood 5.0 5.5 5.9 3.0 2.0 31.4 40.9 38.0 0 5.6 7.9%
Deformed
Wing Bees 10.3 2.8 1.3 2.7 1.7 4.9 0.8 5.1 0 11.1 3.3%
Black Shiny
Bees 6.7 0.3 2.6 0.3 0.6 0 0 3.8 0 0 1.3%
Small Hive
Beetle
(larvae or
adults)
0 0 0 0 0 0 0 0 0 0 0.0%
Wax Moth
(larvae or
adults)
1.0 0 0.5 0.7 0 0 0 0 0 0 0.2%
Queen
Cells
Present
5.0 9.8 6.7 2.7 0.6 0 1.5 3.8 6.0 0 6.3%
Drone
Laying
Queen
0.7 1.3 1.5 0.3 0 0 0 0 2.0 0 0.9%
Table 1. Visual inspection results for each province/territory identifying the presence or absence of brood and adult clinical disease symptoms or other colony conditions. The three central brood frames from the ten colonies sampled per apiary were inspected. *The number of colonies (n) does not represent 10 colonies per apiary. Some composite samples in these regions were incomplete (<10 colonies per apiary) due to discovery of weak colonies or inclement weather during sampling.

2016 Canadian National Honey Bee Health Survey
Page 18
Nosema (Regional & Provincial Incidence)
British Columbia 27%
Incidence Quebec
51% Incidence
Fraser Valley 4/9 Capital 8/18
Kootenay 0/3 Northeast 2/6
Northwest 0/3 Northwest 3/3
Okanagan 1/5 Southwest 5/8
Peace 1/3 New Brunswick 81%
Incidence
Thompson/Cariboo 2/4 North 4/5
Vancouver 0/3 South 5/6
Alberta 66%
Incidence Nova Scotia
57% Incidence
Central 10/14 Central 6/9
Northeast 6/14 Western 2/5
Northwest 15/34 Prince Ed. Island 75%
Incidence
Peace 22/35 East 3/4
South 38/41 West 3/4
Manitoba 51%
Incidence Newfoundland
80% Incidence
Central 6/10 Provincial 4/5
Eastern Interlake 6/10 Yukon Territories 25%
Incidence
Northwest 3/9 Territory 1/4
Southern 5/10 National Level 56%
Incidence
Ontario 37%
Incidence National Total 176/314
Central 3/3
Southeast 1/5
Southwest 7/22
Table 2. Nosema incidence (number of apiaries affected per region and provincial total), identified by
microscopy.

2016 Canadian National Honey Bee Health Survey
Page 19
Nosema (Counting)
Figure 10: Average Nosema spore count per bee, enumerated with a haemocytometer under light microscopy (400x); reported by provincial/territory average for 2014, 2015 and 2016, when possible. The average Nosema spore count is represented in millions of spores per bee.
*Fries I., Ekbohm G., Villumstad E. (1984). Nosema apis, sampling techniques and honey yield. J. Apic. Res. 23, 102-105.
*Fall Nominal Treatment Threshold

2016 Canadian National Honey Bee Health Survey
Page 20
Nosema (Species Identification)
Figure 11. Nosema spp. composition by province/territory in 2016 detected by DNA extraction and PCR.
Figure 12. Nosema spp. composition by year detected by DNA extraction and PCR.
0
20
40
60
80
100
BC AB MB ON QC NB NS PEI NL YT
% C
om
po
sition
Nosema spp. Composition per Province (2016)
Negative N.apis N.ceranae Both
18.4126.89
43.951.84
3.77
0.32
76.0762.74
52.55
3.68 6.6 3.18
0
10
20
30
40
50
60
70
80
90
100
2014 (n=163) 2015 (n=212) 2016 (n=314)
% C
om
posi
tion
Nosema spp. Composition per Year
Negative N.apis N.ceranae Both
2 Provinces 4 Provinces 9 Provinces, 1 Territory

2016 Canadian National Honey Bee Health Survey
Page 21
Varroa (Regional & Provincial Incidence)
British Columbia 93%
Incidence Quebec
91% Incidence
Fraser Valley 9/9 Capital 16/18
Kootenay 3/3 Northeast 6/6
Northwest 3/3 Northwest 2/3
Okanagan 4/5 Southwest 8/8
Peace 2/3 New Brunswick 45%
Incidence
Thompson/Cariboo 4/4 North 2/5
Vancouver 3/3 South 3/6
Alberta 85%
Incidence Nova Scotia
71% Incidence
Central 12/14 Central 6/9
Northeast 10/14 Western 4/5
Northwest 29/34 Prince Ed. Island 88%
Incidence
Peace 32/35 East 3/4
South 34/41 West 4/4
Manitoba 97%
Incidence Newfoundland
0% Incidence
Central 10/10 Provincial 0/5
Eastern Interlake 9/10 Yukon Territories 50%
Incidence
Northwest 9/9 Territory 2/4
Southern 10/10 National Level 84%
Incidence
Ontario 87%
Incidence National Total 265/314
Central 1/3
Southeast 5/5
Southwest 20/22
Table 3. Varroa incidence (number of apiaries affected per region and provincial total), detected using
laboratory alcohol washes of adult bees.

2016 Canadian National Honey Bee Health Survey
Page 22
Varroa (Counting)
Figure 13. Average Varroa infestation level per province/territory, expressed as the number of mites
per 100 adult bees (%).
*Currie, R.W. 2008. Economic Threshold for Varroa on the Canadian Prairies. University of Manitoba, Dept. of Entomology.
0.0
2.0
4.0
6.0
8.0
10.0
12.0
14.0
16.0
BC AB MB ON QC NB NS PEI NL YT
Infe
sta
tion L
evel±
(%)
±SEM
Varroa Infestation Level by Year
2014 2015 2016
*Fall Nominal Treatment Threshold

2016 Canadian National Honey Bee Health Survey
Page 23
AFB (Bacterial Culture-Adult Bees)
British Columbia 10%
Incidence Quebec
3% Incidence
Fraser Valley 1/9 Capital 0/18
Kootenay 0/3 Northeast 0/6
Northwest 0/3 Northwest 0/3
Okanagan 0/5 Southwest 1/8
Peace 0/3 New Brunswick 9%
Incidence
Thompson/Cariboo 0/4 North 0/5
Vancouver 2/3 South 1/6
Alberta 22%
Incidence Nova Scotia
21% Incidence
Central 2/14 Central 3/9
Northeast 1/14 Western 0/5
Northwest 8/34 Prince Ed. Island 38%
Incidence
Peace 12/35 East 2/4
South 7/41 West 1/4
Manitoba 3%
Incidence Newfoundland
0% Incidence
Central 0/10 Provincial 0/5
Eastern Interlake 1/10 Yukon Territories 0%
Incidence
Northwest 0/9 Territory 0/4
Southern 0/10 National Level 13%
Incidence
Ontario 0%
Incidence National Total 42/314
Central 0/3
Southeast 0/5
Southwest 0/22 Table 4. Incidence of apiaries positive for American Foulbrood (AFB), as determined by bacterial culture of adult bee samples, per province/territory and region, when applicable.

2016 Canadian National Honey Bee Health Survey
Page 24
AFB (Bacterial Culture-Adult Bees)
Figure 14. Based on previous research*, AFB positive apiary samples were categorized into 3 groups
for their propensity to develop clinical symptoms of the disease. Risk levels were designated based on
the average number of CFUs that grew on the diagnostic media plates: Possible Risk (1-99 CFU),
Moderate Risk (100-999 CFU) and High Risk (>1,000 CFU). The proportion of apiaries affected in each
province/territory is shown by the bar height, the number of apiary samples this represents is noted
inside each bar segment. When possible, results for multiple years are provided.
* Pernal S.F., Melathopoulous, A.P. (2006) Monitoring for American foulbrood spores from honey and bee samples in Canada. Apiacta 41,
99-109.
Pernal S.F., Albright R.L., Melathopoulous, A.P. (2008). Evaluation of the shaking technique for the economic management of American
foulbrood disease of honey bees (Hymenoptera; Apidae). J. Econ. Entomol 101: 1095-1104.
2016 Canadian National Honey Bee Health Survey
Page 25
AFB (Bacterial Culture-Adult Bees)
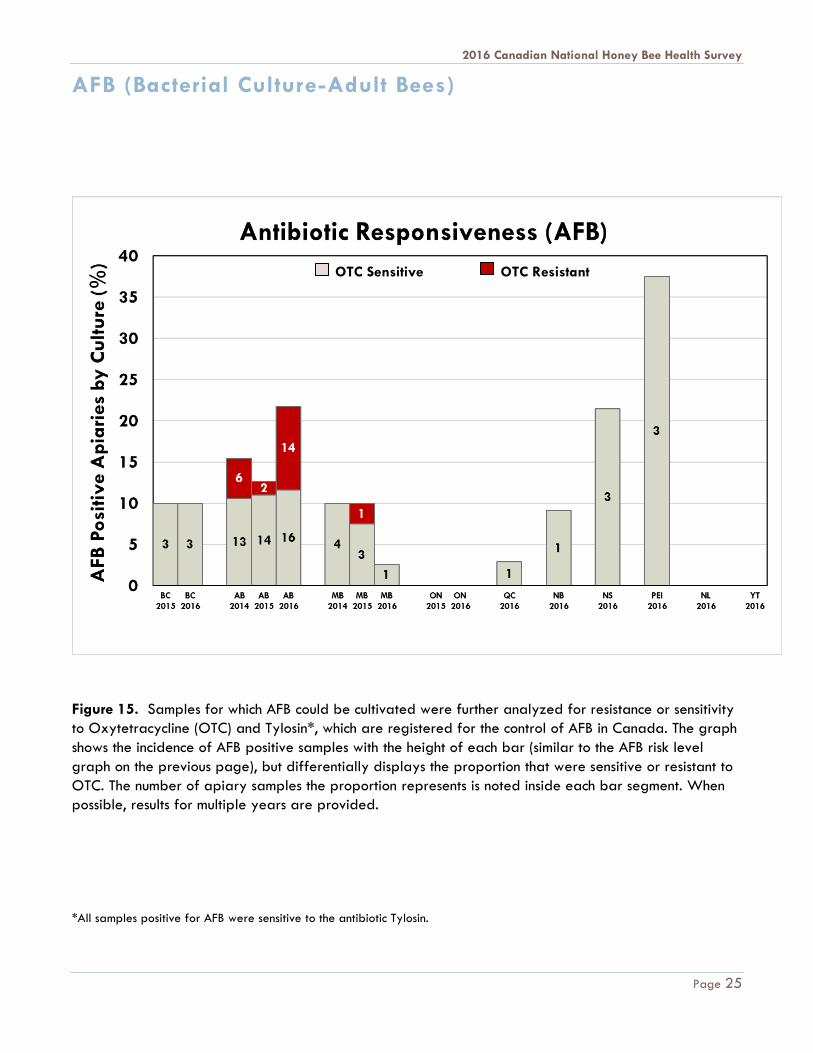
Figure 15. Samples for which AFB could be cultivated were further analyzed for resistance or sensitivity
to Oxytetracycline (OTC) and Tylosin*, which are registered for the control of AFB in Canada. The graph
shows the incidence of AFB positive samples with the height of each bar (similar to the AFB risk level
graph on the previous page), but differentially displays the proportion that were sensitive or resistant to
OTC. The number of apiary samples the proportion represents is noted inside each bar segment. When
possible, results for multiple years are provided.
*All samples positive for AFB were sensitive to the antibiotic Tylosin.
OTC Sensitive OTC Resistant

2016 Canadian National Honey Bee Health Survey
Page 26
EFB (PCR)
Figure 16. Molecular detection of EFB per province in 2014, 2015, and 2016, when possible, detected
by PCR*.
*Positive detection by PCR does not conclusively diagnose an active condition within the apiary.
0
10
20
30
40
50
60
70
BC AB MB ON QC NB NS PEI NL YT
Dete
ctio
n L
evel (%
)
Molecular Detections of EFB Level per Year
2014 2015 2016

2016 Canadian National Honey Bee Health Survey
Page 27
Tracheal Mites (PCR & Dissection)
In the 2014 Survey, tracheal mites were not detected in any samples from Alberta and Manitoba.
In the 2015 Survey, tracheal mites were not detected in any samples from British Columbia or Ontario.
In Alberta: 6/127 and in Manitoba: 1/40 samples tested positive for tracheal mites by PCR - but not
confirmed by dissection.
In the 2016 Survey, tracheal mites were not detected in any samples from Manitoba, Ontario, Nova
Scotia, Prince Edward Island, Newfoundland & Labrador or Yukon Territories.
In Alberta: 7/138, British Columbia: 3/30, New Brunswick: 1/11 and Quebec: 1/35 samples tested
positive for tracheal mites by PCR - but not confirmed by dissection.
Tropilaelaps (Microscopy)
Tropilaelaps specimen have not been identified in any samples from the Survey, for any year (2014-
2016).
African Ancestry Testing
PCR-RFLP ASSAY
mtDNA of African origin was detected in 26 composite samples from 5 Provinces and 1 Territory.
Province/Territory Positive Samples
British Columbia 3 of 30 Apiaries
Alberta 4 of 138 Apiaries
Manitoba 4 of 39 Apiaries
Ontario 5 of 30 Apiaries
Quebec 9 of 35 Apiaries
Yukon Territory 1 of 4 Apiaries
NATIONAL TOTAL 26 of 314 Apiaries
SNP ANALYSIS
SNP sequencing data for all 26 composite samples positive by PCR-RFLP Assay ranged from 0.6 -15.9%
(average 5.6%) African ancestry. These values fall well below the 25% threshold instituted by Dr.
Zayed and collaborators above which bees are considered Africanized. These values are also consistent
with the range found through other recent analyses of Canadian bee stock by Dr. Zayed’s group.

2016 Canadian National Honey Bee Health Survey
Page 28
Viral Incidence (PCR Detection)
Figure 17. Viral incidence per province for 2016 detected from extracted RNA, converted into cDNA
and PCR method; apiaries were scored as ‘Positive’ for any detection level of the virus or ‘Negative’ for
the absence of the virus.
*Positive detection by PCR does not conclusively diagnose an active condition within the apiary.
0
10
20
30
40
50
60
70
80
90
100
ABPV BQCV CBPV DWV IAPV KBV SBV
Inci
den
ce (
%)
Viral Incidence per Province (2016)
BC AB MB ON QC NB NS PEI NL YT

2016 Canadian National Honey Bee Health Survey
Page 29
Notes Sample Size
The protocol for Year Three (2016) projected sampling in British Columbia, Alberta, Saskatchewan, Manitoba,
Ontario, Quebec, New Brunswick, Nova Scotia, and Prince Edward Island. This goal was met with the
exception of Saskatchewan; Saskatchewan Beekeepers Association declined to participate in the Survey,
consistent with their response in 2015.
In several provinces, complete composite apiary samples were unable to be collected due to unexpected
circumstances. In New Brunswick: 8/110 colonies; Nova Scotia: 8/140 colonies; and Ontario: 4/300 colonies
were missed due to weak colony conditions the day of sampling. In Prince Edward Island: 1/80 colonies was
missed due to inclement weather conditions. In the Yukon Territory, only 18/40 colonies were collected from
as commercial beekeeping in this area has been newly developed.
Testing Limitations
PCR: The use of PCR is an effective diagnostic technique, but is also very sensitive. Therefore, a positive
detection using the technique does not conclusively diagnose an active or overt condition. Specifically, PCR
detection of EFB and the viral panel require further development, such as quantitative PCR, to more
accurately associate positive detections with possible clinical symptoms in an apiary.
African Ancestry Testing: Testing for African Ancestry in honey bees is an evolving technique; the current
diagnostic standard for the detection of AHB by the Canadian Food Inspection Agency (CFIA) and the US
Animal and Plant Health Inspection Service (APHIS) uses a PCR-based RFLP assay. This method targets mtDNA
genes, but because mtDNA is maternally inherited, this analysis fails to detect progeny of European queens
mated with Africanized drones.
Even though it has inherent limitations, this method is recognized as the current diagnostic standard for the
detection of AHB. It is also used as the standard technique by which queen breeding apiaries are certified as
being free of the sub-Saharan type of AHB. Specifically, this test is an export certification requirement that
CFIA imposes on California breeders that ship queens to Canada.
As described previously, an emerging technique using a Single Nucleotide Polymorphism (SNP) analysis has
been developed out of York University (Zayed et al.) to identify AHB by using both maternal and paternal
inherited nuclear markers to distinguish between AHB and EHB.
Although positive samples were identified in the Survey using the current diagnostic standard (PCR-RFLP
Assay), the NBDC-TAC is not aware of any highly-defensive behavior or incidents involving bees from the
affected apiaries.
As defensive behavior is primarily a paternal effect, progeny from these colonies are likely to retain typical
EHB behaviors when mated with European drones. It is plausible that the African ancestry identified in these
hives was introduced through importation of stock and maintained, possibly for several generations, if queens
were not artificially replaced by beekeepers.
Our results clearly show the limitations of the current method used to identify AHB colonies, thus research and
development of a more informative AHB detection method, such as the SNP-based techniques, is required.

2016 Canadian National Honey Bee Health Survey
Page 30
Discussion/Summary
Chalkbrood was documented at noticeably higher levels in the Maritime provinces (NB, NS, PEI); all three provinces had an incidence 31% and above. All other provinces fell below 6%.
Nosema was detected in 28 of the 31 provincial/territory regions included in the Survey. Only three BC regions (Kootenay, Northwest and Vancouver) did not show presence of Nosema. The highest average level of spores provincially was reported in PEI with ~1.5 million spores/bee and the lowest level was found in the Yukon Territory with ~50,000 spores/bee. Nosema infection in the provinces sampled multiple years (BC, AB, MB and ON) have declined overall since the Survey started in 2014.
Nosema ceranae was the most prevalent species detected in all provinces/territories in 2016. In addition, Nosema ceranae has been the most common species found in Canada every year of the Survey; Nosema apis was only identified in one sample as a single infection this year, from British Columbia. Results from 2016 record the first documented findings of N. ceranae in Newfoundland & Labrador.
Newfoundland & Labrador is the only province reported to be Varroa-free, based on our findings in the 2016 Survey. Varroa was detected in all other regions sampled in 2016, with provincial infestation levels ranging from 0.4% in NS to 8.0% in the Yukon Territory. In the provinces sampled multiple years (BC, AB, MB and ON) a trend of increasing infestation levels of Varroa exists.
Upon visual inspection, AFB was only identified in AB in 7 colonies from 2 individual apiaries. When cultivated in the lab from adult honey bees, AFB was detected in samples from 13 of the 31 regions. High risk (>1,000 CFU) samples by culture were identified in BC, AB, QC, NS and PEI.
AFB positive samples from AB were the only cases that indicated resistance to the antibiotic Oxytetracycline, 14 samples in total. Samples from AB and MB are the only provinces documented to date showing resistance to OTC. All AFB positive samples were sensitive to the antibiotic Tylosin.
EFB was detected molecularly in every province, ranging from 13.3% incidence in ON to 62.9% incidence in QC. In the provinces sampled multiple years (BC, AB, MB and ON) a trend of increasing incidence of EFB is present, with the exception of ON.
Tracheal mites have been detected molecularly in samples from 2015 and 2016, but never confirmed by dissection to date.
Tropilaelaps have not be identified in any samples collected for the Survey.
Using the current method recognized for the detection of AHB and certification of queen exports by the CFIA, 26 apiary level samples tested positive for African Ancestry in the 2016 Survey from BC, AB, MB, ON , QC and YT. This analysis uses mtDNA that only reflects maternal genetics. Further analysis using a new technique that accounts for both maternal and paternal genetics

2016 Canadian National Honey Bee Health Survey
Page 31
indicated that all 26 positive samples identified initially, show low levels of African ancestry. Genetic sequencing to identify AHB with this technique sets 25% as the threshold instituted above which bees are considered Africanized. None of the samples met this threshold; samples ranged from 0.6% to 15.9% with an overall average of 5.6%.
The most prevalent viruses detected in the survey were Black Queen Cell Virus (BQCV), Deformed Wing Virus (DWV) and Sacbrood Virus (SBV). Conversely, Acute Bee Paralysis Virus (ABPV) was entirely absent in samples from MB, QC, NB, NS, PEI, NL and YT.
Year Four (2017) will conclude the first phase of the Canadian National Honey Bee Health Survey. As
the last year, the panel of diagnostics will expand further to include chemical residue testing of bee
bread, molecular detection of 2 additional viruses (Lake Sinai Virus and Slow Bee Paralysis Virus) and
presence of Apis cerana. In addition, results from all years will be statistically analyzed in depth to create
a detailed summary of honey bee health for Canada.

2016 Canadian National Honey Bee Health Survey
Page 32
Acknowledgements We thank the following for their suppor t:
B E E K E E P I N G A S S O C I A T I O N S : Alberta Beekeepers Commission (ABC), British Columbia
Honey Producers’ Association (BCPHA), Fédération des Apiculteurs du Québec (FAQ), Manitoba
Beekeepers’ Association (MBA), New Brunswick Beekeepers' Association Inc. (NBBA), Newfoundland and
Labrador Beekeeping Association (NLBKA), Nova Scotia Beekeepers Association (NSBA), Ontario
Beekeepers’ Association (OBA), and Prince Edward Island Beekeeper’s Association (PEIBA).
P R O V I N C I A L A P I C U L T U R I S T S : Julie Ferland (QC), Chris Jordan (PEI), Karen Kennedy (NL),
Paul Kozak (ON), Rheal Lafreniere (MB), Chris Maund (NB), Medhat Nasr (AB), Jason Sproule (NS), Paul
van Westendorp (BC)
S A M P L E T E C H N I C I A N S : Elena Battle, Carlos Castillo, Kerry Clark, Diane Dunaway, Bill Farney,
Terry Fehr, Wendi Gilson, Doug Gordon, Scott Gordon, Greg Hawkins, Shelley Hoover, Karen Kennedy,
Axel Krause, Ray Levesque, Jamie Lee Martin, Robyn McCallum, Cameron Menzies, Sawyer Olmstead,
Lynae Ovinge, Steve Pernal, Rudi Peters, Thomas Schweizer, Nicolas Tremblay, Patricia Wolf Veiga, and
Daryl Wright.
B E E K E E P E R S : 261 Beekeepers who willingly donated 1,000s of bees to our research!
F U N D I N G : Agri-Food Canada’s Growing Forward 2 Program, ABC, MBA, Crop Life Canada and
Syngenta Canada.
D I A G N O S T I C S U P P O R T : Amro Zayed, Associate Professor, York University
Ernesto Guzman, Professor/Head of the Honey Bee Research Centre,
University of Guelph
The NBDC is the result of a partnership between the Grande Prairie Regional College’s
(Research and Innovation) (GPRC R&I) and the Beaverlodge Research Farm (AAFC), both of
which also provide support to the project.
N B D C S TA F F : Carlos Castillo, Applied Scientist Manager
Patricia Wolf Veiga, Diagnostic Technician
Jamie Lee Martin, Laboratory Technician
Christy Curran, Research Project Coordinator
Emily Ryan, Administrative Assistant
G P R C R & I S T A F F : Bruce Rutley, Director
Kelly Manuel, Administrative Assistant
A A F C S TA F F : Steve Pernal, Research Scientist, Apiculture, Officer-in-Charge
Abdullah Ibrahim, Research Technician, Apiculture

![[PPT]Honey Bee Anatomy & Biology - Illinois State Universitywenning/HIBA/Workshop PPTs/Honey Bee... · Web viewHoney Bee Apis mellifera Anatomy & Biology Honey Bee External Anatomy](https://static.fdocuments.us/doc/165x107/5b0a09fe7f8b9aba628b8dcf/ppthoney-bee-anatomy-biology-illinois-state-wenninghibaworkshop-pptshoney.jpg)