Canadian Hydrogen and Fuel Cell Sector Profile 2012 WEB 2389-01 CHFC Sector Profile... ·...
20
Canadian Hydrogen and Fuel Cell Sector Profile 2012
Transcript of Canadian Hydrogen and Fuel Cell Sector Profile 2012 WEB 2389-01 CHFC Sector Profile... ·...
Canadian Hydrogen and Fuel Cell
Sector Profile 2012
ii
Since 2004, the Government of Canada, the Canadian Hydrogen and Fuel Cell Association (CHFCA) and PricewaterhouseCoopers LLP (PwC) have collaborated to provide an extensive profile of the Canadian hydrogen and fuel cell sector. The 2012 Sector Profile follows a similar format to the previous eight editions and provides industry insight on Canada’s hydrogen and fuel cell sector for policy makers, investors and other stakeholders. The research adds value to business strategies, investment decisions, and the overall expertise across our country.
The Profile is published annually to monitor trends and recognize growth and achievements for this key influence of the Canadian economy. We would like to thank all the organizations that contributed to the development of the Canadian Hydrogen and Fuel Cell Sector Profile 2012.
Canadian Hydrogen and Fuel Cell Sector Profile 2012
For a print copy of this publication, please contact:
Publishing and Depository Services Public Works and Government Services Canada Ottawa ON K1A 0S5
Tel. (toll-free): 1-800-635-7943 (Canada and U.S.) Tel. (local): 613-941-5995 TTY: 1-800-465-7735 Fax (toll-free): 1-800-565-7757 (Canada and U.S.) Fax (local): 613-954-5779 Email: [email protected] Website: www.publications.gc.ca
This publication is available upon request in accessible formats. Contact:
Multimedia Services Section Communications and Marketing Branch Industry Canada Room 264D, West Tower 235 Queen Street Ottawa ON K1A 0H5
Tel.: 613-948-1554 Fax: 613-947-7155 Email: [email protected]
This publication is also available electronically on the World Wide Web in HTML format at the following address: www.ic.gc.ca
Permission to Reproduce
Except as otherwise specifically noted, the information in this publication may be reproduced, in part or in whole and by any means, without charge or further permission from Industry Canada, provided that due diligence is exercised in ensuring the accuracy of the information reproduced; that Industry Canada is identified as the source institution; and that the reproduction is not represented as an official version of the information reproduced, nor as having been made in affiliation with, or with the endorsement of, Industry Canada.
For permission to reproduce the information in this publication for commercial redistribution, please email: [email protected]
Cat. No. Iu41-3/2011E - PDF
Aussi offert en français sous le titre Profil de l’industrie canadienne de l’hydrogène et des piles à combustible 2012.
Printed in Canada on paper made from 30% post consumer fibre.
1
The Canadian Hydrogen and Fuel Cell Sector Profile 2012 measures performance indicators and provides industry insight to assess Canada’s position within an increasingly competitive global industry. Interest in clean energy research and technologies continues to gain momentum worldwide driven by concerns over the environment, economic development, and energy pricing. Hydrogen and fuel cells have become an increasingly viable commercial resource, and the Canadian sector is well positioned as an established leader in this field. By supporting hydrogen and fuel cell technology to help address climate change and sustainable energy issues, the Government of Canada, CHFCA and PwC create the opportunity to provide products and solutions for greenhouse gas emissions, air quality, energy security and economic development.
Introduction The Industry at a Glance in 2011:• Revenuewas$211million.
• Productsalesgenerated$99millionofrevenue.
• Research,developmentanddemonstrationexpenditureswere$136.6million.
• Employmentwas2,025.
• 123demonstrationprojectswerereported.
• 582researchpartnershipswerereported.
Mercedes-Benz F-Cell fuel cell electric vehicle
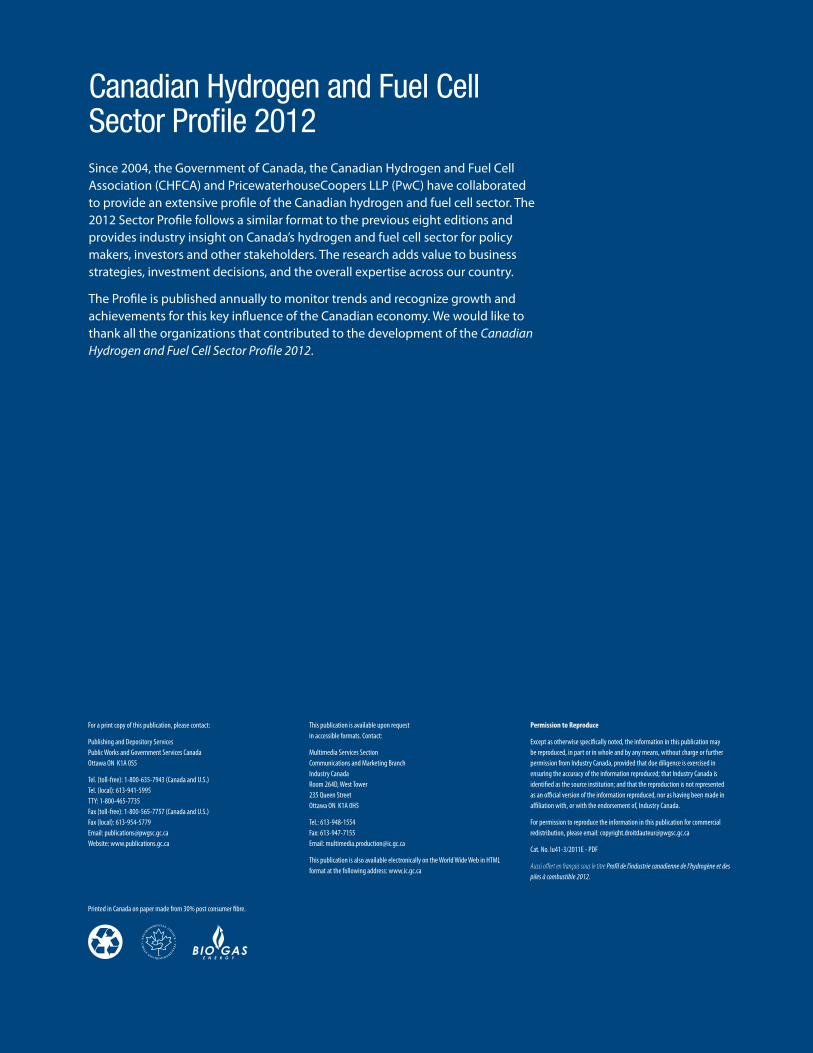
Chevy Equinox Fuel Cell Electric Vehicle and Shell hydrogen fueling station designed, manufactured and commissioned by Powertech Labs
2
ORganiz atiOn t yPe
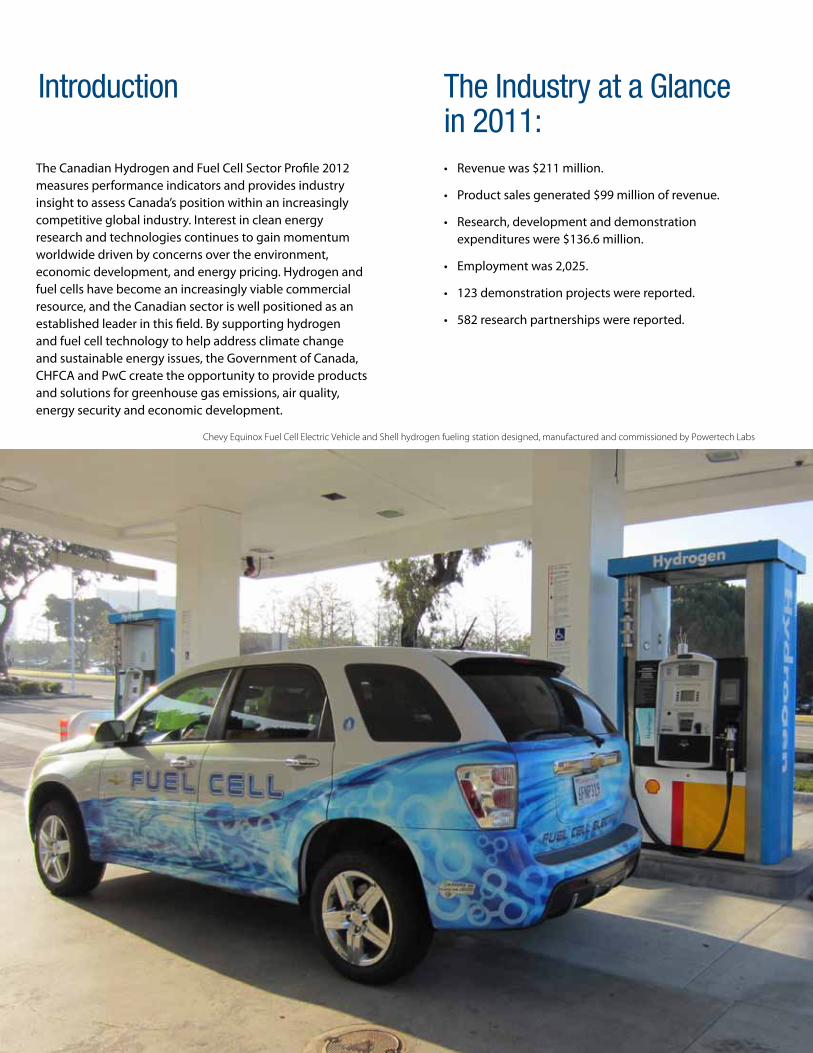
Corporate organizations, including public and private companies, and subsidiaries, represented63%oftotalresponses.Government organizations accounted for18%,witheducationorganizations,and non-profit organizations including associations representing the remaining 19%ofrespondents.
HeadquaRteRs
Themajorityofrespondents(89%)reported headquarters of hydrogen and fuel cell activities in Canada. Others were headquartered in the United States and Europe.
yeaRs Of invOlvement in HydROgen and fuel Cell aC tivities
Fifty-one percent of respondents reported involvement in hydrogen and fuel cell activities for more than ten years.
aReas Of exPeRtise
The main area of expertise was researchorganizations(22%).Fuelcell developer or manufacturer and hydrogen production each represented 12%,followedbyprofessionalserviceprovider(9%).Policydevelopmentandprogramadministrationrepresented8%while systems integrator represented 7%,followedbyeducation,safetyandtraining(6%).Fuelcelluseroccupied5%whilehydrogenstorageaccountedfor4%.Suppliertodeveloperormanufacturer and commercialization supporteachrepresented3%,followedby fuel cell distributor or agent, hydrogendistributionandutility(2%each). The ‘other’ area of expertise category(3%)includedhydrogenfueling infrastructure.
Organization Profile
Organization Type
Private company40%
Public company15%Division/subsidiary
of public company8%
Governmentorganizations
18%
Educationorganization
18%
Non-profit organization incl. associations
1%
p. 2 Organization Type
Apr 2012
Not provided15%
> 20 years18%
11 – 20 years33%
5 – 10 years26%
< 5 years8%
p.2 Years of Involvement in Hydrogen and Fuel Cell Activities
Mobile –Auxiliary Power
5%
Mobile – Primary Power and Drivetrain
24%
Portable(including
micro)11%
Small Stationary 50kW or less
19%
Large Stationary > 50kW
14%HydrogenProduction
and Fueling Infrastructure
27%
p.3 Market Focus
Rest of World7%
Rest of Canada15%
Ontario18%
Quebec9%
Alberta6%
British Columbia22%
USA8%
p.3 Hydrogen and Fuel Cell Facilities by Region
Provision of services
37%
Product sales59%
Canadian government supportrecognized as revenue
1%
p.4 Revenue by Category
Small Stationary50kW or less
14%LargeStationary
> 50kW2%
Mobile –Primary
Power andDrivetrain
13%
Mobile – Auxiliary Power
21%
FuelingInfrastructure
50%
p.7 Focus of Demonstration Projects
Rest of Canada 4%USA5%
Quebec9%
Asia2%
Rest of Europe 6%
British Columbia58%
Ontario13%
p.8 Employment by Region
Government9%
Academia andnon-profit
15%
Corporate76%
p.8 Employment by Organization
Remain the same (+/-5%)
52%
Significant increase(greater than 15%
of current employees)17%
Increase(between 5%
and 15%)23%
p.11 Plans to change employment in the next 18 months
Government13%
Private equity19%
Other10%
Angel Investors4%
Operations52%
p.9 Sources of Funding - Corporate
A-Base15%
Programs85%
p.9 Sources of Funding - Government
Other non-profitorganization
37%
NSERC/Canadian Foundation for Innovation
13%
Other 50%
p.9 Sources of Funding – Academia and Non-Profit
Other OEM13%
Public-privatepartnerships
26%
Hydrogen andfuel cell companies
26%
EnergyProviders
11%
Other 7%
p.10 Strategic Alliances
Declined3%
No reply40%
Completed survey57%
p.10 Profile participation rate
Technicians2%
Academic/research staff
26%
Undergraduatestudents
including coop13%
Canadian graduate andpostgraduate students
46%
International graduate andpostgraduate students
13%
p.6 People Involved in Research
USA25%Germany
30%
Asia 4%
Rest of world 5%
BritishColumbia
27%Ontario 1%
Rest of Canada1%Rest of
Europe7%
p.6 R&D by region
British Columbia77%
Rest of the world5%
Ontario10%
Quebec 3%Germany 3%
USA 1%
p.4 Revenue by Region
R&DIn-house
48%
p.9 Funding Allocation by Area - Gov’t & Academia & Non-profit
R&DIntramural
35%
Marketing andbusiness development
1%Education,
safety and training5%
Policy development1%
Monitoringand reporting
1%
Demonstrationand pilot projects
9%
Europe11%
Other 3%
Germany 3%
Significantly decrease (greater than 15%)
3%Decrease
(between 5 and 15%)5%
Japan 1%
Japan4%
Automotive OEM17%
Public capital markets2%
Years of Involvement in Hydrogen and Fuel Cell Activities
Private company40%
Public company15%Division/subsidiary
of public company8%
Governmentorganizations
18%
Educationorganization
18%
Non-profit organization incl. associations
1%
p. 2 Organization Type
Apr 2012
Not provided15%
> 20 years18%
11 – 20 years33%
5 – 10 years26%
< 5 years8%
p.2 Years of Involvement in Hydrogen and Fuel Cell Activities
Mobile –Auxiliary Power
5%
Mobile – Primary Power and Drivetrain
24%
Portable(including
micro)11%
Small Stationary 50kW or less
19%
Large Stationary > 50kW
14%HydrogenProduction
and Fueling Infrastructure
27%
p.3 Market Focus
Rest of World7%
Rest of Canada15%
Ontario18%
Quebec9%
Alberta6%
British Columbia22%
USA8%
p.3 Hydrogen and Fuel Cell Facilities by Region
Provision of services
37%
Product sales59%
Canadian government supportrecognized as revenue
1%
p.4 Revenue by Category
Small Stationary50kW or less
14%LargeStationary
> 50kW2%
Mobile –Primary
Power andDrivetrain
13%
Mobile – Auxiliary Power
21%
FuelingInfrastructure
50%
p.7 Focus of Demonstration Projects
Rest of Canada 4%USA5%
Quebec9%
Asia2%
Rest of Europe 6%
British Columbia58%
Ontario13%
p.8 Employment by Region
Government9%
Academia andnon-profit
15%
Corporate76%
p.8 Employment by Organization
Remain the same (+/-5%)
52%
Significant increase(greater than 15%
of current employees)17%
Increase(between 5%
and 15%)23%
p.11 Plans to change employment in the next 18 months
Government13%
Private equity19%
Other10%
Angel Investors4%
Operations52%
p.9 Sources of Funding - Corporate
A-Base15%
Programs85%
p.9 Sources of Funding - Government
Other non-profitorganization
37%
NSERC/Canadian Foundation for Innovation
13%
Other 50%
p.9 Sources of Funding – Academia and Non-Profit
Other OEM13%
Public-privatepartnerships
26%
Hydrogen andfuel cell companies
26%
EnergyProviders
11%
Other 7%
p.10 Strategic Alliances
Declined3%
No reply40%
Completed survey57%
p.10 Profile participation rate
Technicians2%
Academic/research staff
26%
Undergraduatestudents
including coop13%
Canadian graduate andpostgraduate students
46%
International graduate andpostgraduate students
13%
p.6 People Involved in Research
USA25%Germany
30%
Asia 4%
Rest of world 5%
BritishColumbia
27%Ontario 1%
Rest of Canada1%Rest of
Europe7%
p.6 R&D by region
British Columbia77%
Rest of the world5%
Ontario10%
Quebec 3%Germany 3%
USA 1%
p.4 Revenue by Region
R&DIn-house
48%
p.9 Funding Allocation by Area - Gov’t & Academia & Non-profit
R&DIntramural
35%
Marketing andbusiness development
1%Education,
safety and training5%
Policy development1%
Monitoringand reporting
1%
Demonstrationand pilot projects
9%
Europe11%
Other 3%
Germany 3%
Significantly decrease (greater than 15%)
3%Decrease
(between 5 and 15%)5%
Japan 1%
Japan4%
Automotive OEM17%
Public capital markets2%
Areas of Expertise
Access to markets
Lack of funding
Technology development
p.2 Areas of Expertise
p.3 Technology Focus
p.4 Total Revenue ($ millions)
Hydrogen production
Research organization
Policy development andprogram administration
Fuel cell user
Professional services provider
Hydrogen distribution
Fuel cell developer or manufacturer
5 10 15 20 250
Other
Systems integrator
Education, safety and training
Commercialization support
Supplier to developer or manufacturer
Hydrogen storage
Fuel cell distributor or agent
22%
12%
12%
9%
8%
7%
6%
5%
4%
3%
3%
2%
2%
3%
0 5 10 15 20 25 30 35 40 45
Proton Exchange Membrane
Solid Oxide Fuel Cells
Hydrogen Production
Hydrogen Distribution
Hydrogen Storage
Metal-Air
Molten Carbonate
Direct Liquid
Other
1%
7%
7%
37%
8%
2%
2%
14%
20%
0
50
100
150
200
250
2008
p.8 Employment
28. Growth since 2001
1,500
1,000
0
2,500
2006
2007 20092006
2007 2008 2010
0
50
100
150
200
250
300
2005 2006 2007 201020042003200220010
500
1,000
1,500
2,000
2,500
3,000
R&DRevenue Employees
$
p.7 Patents
200
100
0
300
400
235
351
Alberta
Canadian government (all levels)
Corporate operations
Parent, affiliatedor subsidiary
Research, non-profit,non-governmental institute
Contract work conductedfor another institute
0 20 40 60 80 100
12. Sources of Funding for R&D Expenditure by Organization
23%
68%
7%
7%
9%
Foreign government
University oracademic institute
1%
3%
14%
0% 20% 40% 60% 80% 100%
100%61%
GovernmentCorporate Academic and non-profit
290
179
134
276
188
97
133 135 133
177
128
2011
215
142
Feb 2011
Patentsapproved
Patentspending
p.11 Priorities to enhance competitive performance in 2012
0 5 10 15 20 25
Collaboration/strategic alliances
Gain market share
Better targetingof customers
Improving processes
Better marketor customer data
Plans for expansion(new products/new markets)
Other
Outsourcing
8%
1%
8%
21%
8%
Reduce costof operations
7%
6%
19%
12%
10%
p.? challenges faced in 2010
0% 5 10 15 20 25 30
Profitability
Economy
Exchange rates
6%
31%
6%
Other 9%
24%
10%
10%
GermanyUSA
British ColumbiaQuebecOntario
0 5 10 15 20 25 30 35 40 45 50 55 60
16. Demonstration Projects by Region (Number of Projects)
51
Other
GovernmentCorporate Academia and non-profit
%
%
%
Millions Employees
Utility 2%
Direct Methanol 2%
2,000
500
2009
2,001 1,9912,043
1,7651,556
2,025
2011
2010 2011
Competition 4%
Labour shortages
15
12
5
5
4 2
2
1
1
1
12
JapanUK
Rest of Canada
184
136
2008 2009
194
1
1
23
23
195
215 211
133
194
168
237
218211
168
195
211
3
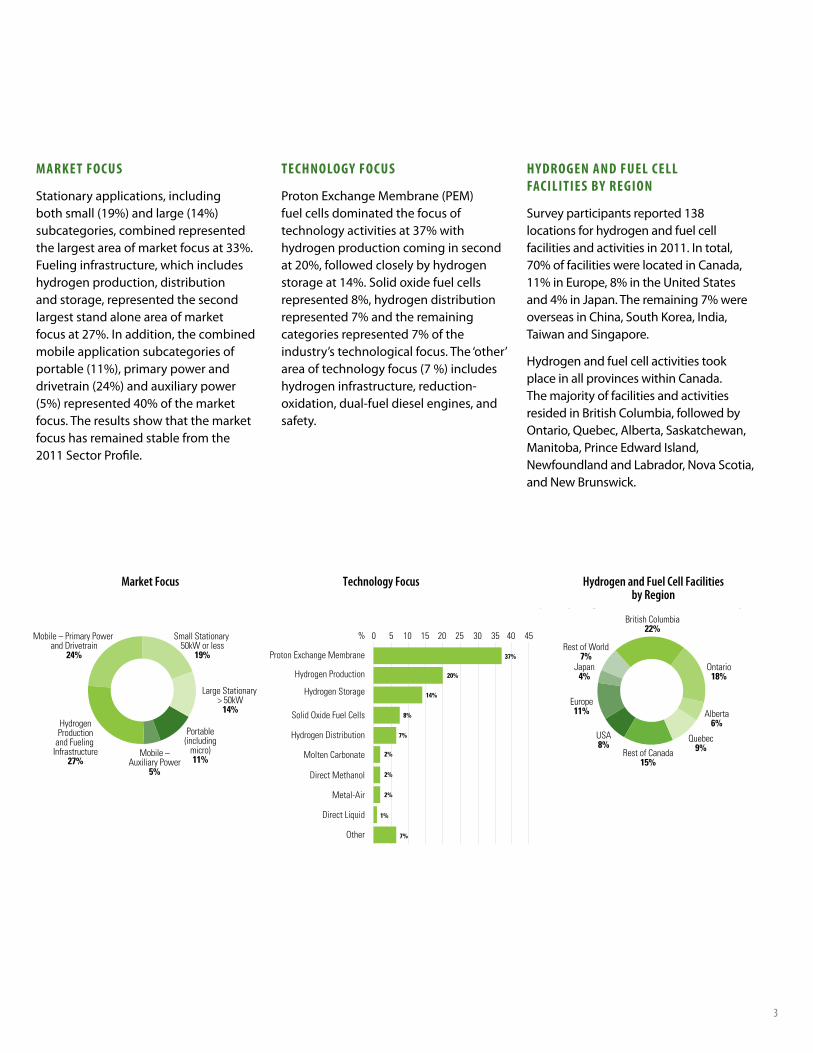
maRket fOCus
Stationary applications, including bothsmall(19%)andlarge(14%)subcategories, combined represented thelargestareaofmarketfocusat33%.Fueling infrastructure, which includes hydrogen production, distribution and storage, represented the second largest stand alone area of market focusat27%.Inaddition,thecombinedmobile application subcategories of portable(11%),primarypoweranddrivetrain(24%)andauxiliarypower(5%)represented40%ofthemarketfocus. The results show that the market focus has remained stable from the 2011 Sector Profile.
teCHnOlOgy fOCus
ProtonExchangeMembrane(PEM)fuel cells dominated the focus of technologyactivitiesat37%withhydrogen production coming in second at20%,followedcloselybyhydrogenstorageat14%.Solidoxidefuelcellsrepresented8%,hydrogendistributionrepresented7%andtheremainingcategoriesrepresented7%oftheindustry’s technological focus. The ‘other’ areaoftechnologyfocus(7%)includeshydrogen infrastructure, reduction-oxidation, dual-fuel diesel engines, and safety.
HydROgen and fuel Cell faCilities by RegiOn
Surveyparticipantsreported138locations for hydrogen and fuel cell facilities and activities in 2011. In total, 70%offacilitieswerelocatedinCanada,11%inEurope,8%intheUnitedStatesand4%inJapan.Theremaining7%wereoverseas in China, South Korea, India, Taiwan and Singapore.
Hydrogen and fuel cell activities took place in all provinces within Canada. Themajorityoffacilitiesandactivitiesresided in British Columbia, followed by Ontario, Quebec, Alberta, Saskatchewan, Manitoba,PrinceEdwardIsland,Newfoundland and Labrador, Nova Scotia, and New Brunswick.
Technology Focus Hydrogen and Fuel Cell Facilities by Region
Market Focus
Private company40%
Public company15%Division/subsidiary
of public company8%
Governmentorganizations
18%
Educationorganization
18%
Non-profit organization incl. associations
1%
p. 2 Organization Type
Apr 2012
Not provided15%
> 20 years18%
11 – 20 years33%
5 – 10 years26%
< 5 years8%
p.2 Years of Involvement in Hydrogen and Fuel Cell Activities
Mobile –Auxiliary Power
5%
Mobile – Primary Power and Drivetrain
24%
Portable(including
micro)11%
Small Stationary 50kW or less
19%
Large Stationary > 50kW
14%HydrogenProduction
and Fueling Infrastructure
27%
p.3 Market Focus
Rest of World7%
Rest of Canada15%
Ontario18%
Quebec9%
Alberta6%
British Columbia22%
USA8%
p.3 Hydrogen and Fuel Cell Facilities by Region
Provision of services
37%
Product sales59%
Canadian government supportrecognized as revenue
1%
p.4 Revenue by Category
Small Stationary50kW or less
14%LargeStationary
> 50kW2%
Mobile –Primary
Power andDrivetrain
13%
Mobile – Auxiliary Power
21%
FuelingInfrastructure
50%
p.7 Focus of Demonstration Projects
Rest of Canada 4%USA5%
Quebec9%
Asia2%
Rest of Europe 6%
British Columbia58%
Ontario13%
p.8 Employment by Region
Government9%
Academia andnon-profit
15%
Corporate76%
p.8 Employment by Organization
Remain the same (+/-5%)
52%
Significant increase(greater than 15%
of current employees)17%
Increase(between 5%
and 15%)23%
p.11 Plans to change employment in the next 18 months
Government13%
Private equity19%
Other10%
Angel Investors4%
Operations52%
p.9 Sources of Funding - Corporate
A-Base15%
Programs85%
p.9 Sources of Funding - Government
Other non-profitorganization
37%
NSERC/Canadian Foundation for Innovation
13%
Other 50%
p.9 Sources of Funding – Academia and Non-Profit
Other OEM13%
Public-privatepartnerships
26%
Hydrogen andfuel cell companies
26%
EnergyProviders
11%
Other 7%
p.10 Strategic Alliances
Declined3%
No reply40%
Completed survey57%
p.10 Profile participation rate
Technicians2%
Academic/research staff
26%
Undergraduatestudents
including coop13%
Canadian graduate andpostgraduate students
46%
International graduate andpostgraduate students
13%
p.6 People Involved in Research
USA25%Germany
30%
Asia 4%
Rest of world 5%
BritishColumbia
27%Ontario 1%
Rest of Canada1%Rest of
Europe7%
p.6 R&D by region
British Columbia77%
Rest of the world5%
Ontario10%
Quebec 3%Germany 3%
USA 1%
p.4 Revenue by Region
R&DIn-house
48%
p.9 Funding Allocation by Area - Gov’t & Academia & Non-profit
R&DIntramural
35%
Marketing andbusiness development
1%Education,
safety and training5%
Policy development1%
Monitoringand reporting
1%
Demonstrationand pilot projects
9%
Europe11%
Other 3%
Germany 3%
Significantly decrease (greater than 15%)
3%Decrease
(between 5 and 15%)5%
Japan 1%
Japan4%
Automotive OEM17%
Public capital markets2%
Access to markets
Lack of funding
Technology development
p.2 Areas of Expertise
p.3 Technology Focus
p.4 Total Revenue ($ millions)
Hydrogen production
Research organization
Policy development andprogram administration
Fuel cell user
Professional services provider
Hydrogen distribution
Fuel cell developer or manufacturer
5 10 15 20 250
Other
Systems integrator
Education, safety and training
Commercialization support
Supplier to developer or manufacturer
Hydrogen storage
Fuel cell distributor or agent
22%
12%
12%
9%
8%
7%
6%
5%
4%
3%
3%
2%
2%
3%
0 5 10 15 20 25 30 35 40 45
Proton Exchange Membrane
Solid Oxide Fuel Cells
Hydrogen Production
Hydrogen Distribution
Hydrogen Storage
Metal-Air
Molten Carbonate
Direct Liquid
Other
1%
7%
7%
37%
8%
2%
2%
14%
20%
0
50
100
150
200
250
2008
p.8 Employment
28. Growth since 2001
1,500
1,000
0
2,500
2006
2007 20092006
2007 2008 2010
0
50
100
150
200
250
300
2005 2006 2007 201020042003200220010
500
1,000
1,500
2,000
2,500
3,000
R&DRevenue Employees
$
p.7 Patents
200
100
0
300
400
235
351
Alberta
Canadian government (all levels)
Corporate operations
Parent, affiliatedor subsidiary
Research, non-profit,non-governmental institute
Contract work conductedfor another institute
0 20 40 60 80 100
12. Sources of Funding for R&D Expenditure by Organization
23%
68%
7%
7%
9%
Foreign government
University oracademic institute
1%
3%
14%
0% 20% 40% 60% 80% 100%
100%61%
GovernmentCorporate Academic and non-profit
290
179
134
276
188
97
133 135 133
177
128
2011
215
142
Feb 2011
Patentsapproved
Patentspending
p.11 Priorities to enhance competitive performance in 2012
0 5 10 15 20 25
Collaboration/strategic alliances
Gain market share
Better targetingof customers
Improving processes
Better marketor customer data
Plans for expansion(new products/new markets)
Other
Outsourcing
8%
1%
8%
21%
8%
Reduce costof operations
7%
6%
19%
12%
10%
p.? challenges faced in 2010
0% 5 10 15 20 25 30
Profitability
Economy
Exchange rates
6%
31%
6%
Other 9%
24%
10%
10%
GermanyUSA
British ColumbiaQuebecOntario
0 5 10 15 20 25 30 35 40 45 50 55 60
16. Demonstration Projects by Region (Number of Projects)
51
Other
GovernmentCorporate Academia and non-profit
%
%
%
Millions Employees
Utility 2%
Direct Methanol 2%
2,000
500
2009
2,001 1,9912,043
1,7651,556
2,025
2011
2010 2011
Competition 4%
Labour shortages
15
12
5
5
4 2
2
1
1
1
12
JapanUK
Rest of Canada
184
136
2008 2009
194
1
1
23
23
195
215 211
133
194
168
237
218211
168
195
211
4
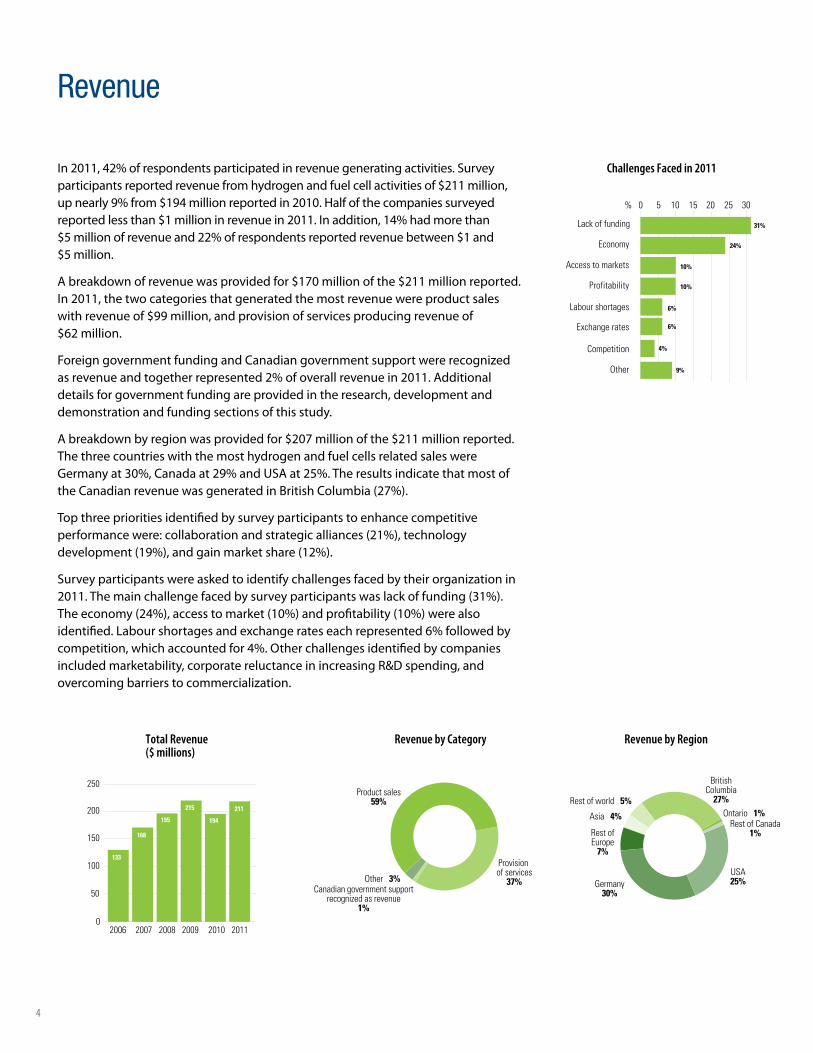
In2011,42%ofrespondentsparticipatedinrevenuegeneratingactivities.Surveyparticipantsreportedrevenuefromhydrogenandfuelcellactivitiesof$211million,upnearly9%from$194millionreportedin2010.Halfofthecompaniessurveyedreportedlessthan$1millioninrevenuein2011.Inaddition,14%hadmorethan$5 millionofrevenueand22%ofrespondentsreportedrevenuebetween$1and$5 million.
Abreakdownofrevenuewasprovidedfor$170millionofthe$211millionreported.In 2011, the two categories that generated the most revenue were product sales withrevenueof$99million,andprovisionofservicesproducingrevenueof$62 million.
Foreign government funding and Canadian government support were recognized asrevenueandtogetherrepresented2%ofoverallrevenuein2011.Additionaldetails for government funding are provided in the research, development and demonstration and funding sections of this study.
Abreakdownbyregionwasprovidedfor$207millionofthe$211millionreported.The three countries with the most hydrogen and fuel cells related sales were Germanyat30%,Canadaat29%andUSAat25%.TheresultsindicatethatmostoftheCanadianrevenuewasgeneratedinBritishColumbia(27%).
Top three priorities identified by survey participants to enhance competitive performancewere:collaborationandstrategicalliances(21%),technologydevelopment(19%),andgainmarketshare(12%).
Survey participants were asked to identify challenges faced by their organization in 2011.Themainchallengefacedbysurveyparticipantswaslackoffunding(31%).Theeconomy(24%),accesstomarket(10%)andprofitability(10%)werealsoidentified.Labourshortagesandexchangerateseachrepresented6%followedbycompetition,whichaccountedfor4%.Otherchallengesidentifiedbycompaniesincludedmarketability,corporatereluctanceinincreasingR&Dspending,andovercoming barriers to commercialization.
Revenue
Revenue by Category
Private company40%
Public company15%Division/subsidiary
of public company8%
Governmentorganizations
18%
Educationorganization
18%
Non-profit organization incl. associations
1%
p. 2 Organization Type
Apr 2012
Not provided15%
> 20 years18%
11 – 20 years33%
5 – 10 years26%
< 5 years8%
p.2 Years of Involvement in Hydrogen and Fuel Cell Activities
Mobile –Auxiliary Power
5%
Mobile – Primary Power and Drivetrain
24%
Portable(including
micro)11%
Small Stationary 50kW or less
19%
Large Stationary > 50kW
14%HydrogenProduction
and Fueling Infrastructure
27%
p.3 Market Focus
Rest of World7%
Rest of Canada15%
Ontario18%
Quebec9%
Alberta6%
British Columbia22%
USA8%
p.3 Hydrogen and Fuel Cell Facilities by Region
Provision of services
37%
Product sales59%
Canadian government supportrecognized as revenue
1%
p.4 Revenue by Category
Small Stationary50kW or less
14%LargeStationary
> 50kW2%
Mobile –Primary
Power andDrivetrain
13%
Mobile – Auxiliary Power
21%
FuelingInfrastructure
50%
p.7 Focus of Demonstration Projects
Rest of Canada 4%USA5%
Quebec9%
Asia2%
Rest of Europe 6%
British Columbia58%
Ontario13%
p.8 Employment by Region
Government9%
Academia andnon-profit
15%
Corporate76%
p.8 Employment by Organization
Remain the same (+/-5%)
52%
Significant increase(greater than 15%
of current employees)17%
Increase(between 5%
and 15%)23%
p.11 Plans to change employment in the next 18 months
Government13%
Private equity19%
Other10%
Angel Investors4%
Operations52%
p.9 Sources of Funding - Corporate
A-Base15%
Programs85%
p.9 Sources of Funding - Government
Other non-profitorganization
37%
NSERC/Canadian Foundation for Innovation
13%
Other 50%
p.9 Sources of Funding – Academia and Non-Profit
Other OEM13%
Public-privatepartnerships
26%
Hydrogen andfuel cell companies
26%
EnergyProviders
11%
Other 7%
p.10 Strategic Alliances
Declined3%
No reply40%
Completed survey57%
p.10 Profile participation rate
Technicians2%
Academic/research staff
26%
Undergraduatestudents
including coop13%
Canadian graduate andpostgraduate students
46%
International graduate andpostgraduate students
13%
p.6 People Involved in Research
USA25%Germany
30%
Asia 4%
Rest of world 5%
BritishColumbia
27%Ontario 1%
Rest of Canada1%Rest of
Europe7%
p.6 R&D by region
British Columbia77%
Rest of the world5%
Ontario10%
Quebec 3%Germany 3%
USA 1%
p.4 Revenue by Region
R&DIn-house
48%
p.9 Funding Allocation by Area - Gov’t & Academia & Non-profit
R&DIntramural
35%
Marketing andbusiness development
1%Education,
safety and training5%
Policy development1%
Monitoringand reporting
1%
Demonstrationand pilot projects
9%
Europe11%
Other 3%
Germany 3%
Significantly decrease (greater than 15%)
3%Decrease
(between 5 and 15%)5%
Japan 1%
Japan4%
Automotive OEM17%
Public capital markets2%
Revenue by Region
Private company40%
Public company15%Division/subsidiary
of public company8%
Governmentorganizations
18%
Educationorganization
18%
Non-profit organization incl. associations
1%
p. 2 Organization Type
Apr 2012
Not provided15%
> 20 years18%
11 – 20 years33%
5 – 10 years26%
< 5 years8%
p.2 Years of Involvement in Hydrogen and Fuel Cell Activities
Mobile –Auxiliary Power
5%
Mobile – Primary Power and Drivetrain
24%
Portable(including
micro)11%
Small Stationary 50kW or less
19%
Large Stationary > 50kW
14%HydrogenProduction
and Fueling Infrastructure
27%
p.3 Market Focus
Rest of World7%
Rest of Canada15%
Ontario18%
Quebec9%
Alberta6%
British Columbia22%
USA8%
p.3 Hydrogen and Fuel Cell Facilities by Region
Provision of services
37%
Product sales59%
Canadian government supportrecognized as revenue
1%
p.4 Revenue by Category
Small Stationary50kW or less
14%LargeStationary
> 50kW2%
Mobile –Primary
Power andDrivetrain
13%
Mobile – Auxiliary Power
21%
FuelingInfrastructure
50%
p.7 Focus of Demonstration Projects
Rest of Canada 4%USA5%
Quebec9%
Asia2%
Rest of Europe 6%
British Columbia58%
Ontario13%
p.8 Employment by Region
Government9%
Academia andnon-profit
15%
Corporate76%
p.8 Employment by Organization
Remain the same (+/-5%)
52%
Significant increase(greater than 15%
of current employees)17%
Increase(between 5%
and 15%)23%
p.11 Plans to change employment in the next 18 months
Government13%
Private equity19%
Other10%
Angel Investors4%
Operations52%
p.9 Sources of Funding - Corporate
A-Base15%
Programs85%
p.9 Sources of Funding - Government
Other non-profitorganization
37%
NSERC/Canadian Foundation for Innovation
13%
Other 50%
p.9 Sources of Funding – Academia and Non-Profit
Other OEM13%
Public-privatepartnerships
26%
Hydrogen andfuel cell companies
26%
EnergyProviders
11%
Other 7%
p.10 Strategic Alliances
Declined3%
No reply40%
Completed survey57%
p.10 Profile participation rate
Technicians2%
Academic/research staff
26%
Undergraduatestudents
including coop13%
Canadian graduate andpostgraduate students
46%
International graduate andpostgraduate students
13%
p.6 People Involved in Research
USA25%Germany
30%
Asia 4%
Rest of world 5%
BritishColumbia
27%Ontario 1%
Rest of Canada1%Rest of
Europe7%
p.6 R&D by region
British Columbia77%
Rest of the world5%
Ontario10%
Quebec 3%Germany 3%
USA 1%
p.4 Revenue by Region
R&DIn-house
48%
p.9 Funding Allocation by Area - Gov’t & Academia & Non-profit
R&DIntramural
35%
Marketing andbusiness development
1%Education,
safety and training5%
Policy development1%
Monitoringand reporting
1%
Demonstrationand pilot projects
9%
Europe11%
Other 3%
Germany 3%
Significantly decrease (greater than 15%)
3%Decrease
(between 5 and 15%)5%
Japan 1%
Japan4%
Automotive OEM17%
Public capital markets2%
Total Revenue ($ millions)
Challenges Faced in 2011
Access to markets
Lack of funding
Technology development
p.2 Areas of Expertise
p.3 Technology Focus
p.4 Total Revenue ($ millions)
Hydrogen production
Research organization
Policy development andprogram administration
Fuel cell user
Professional services provider
Hydrogen distribution
Fuel cell developer or manufacturer
5 10 15 20 250
Other
Systems integrator
Education, safety and training
Commercialization support
Supplier to developer or manufacturer
Hydrogen storage
Fuel cell distributor or agent
22%
12%
12%
9%
8%
7%
6%
5%
4%
3%
3%
2%
2%
3%
0 5 10 15 20 25 30 35 40 45
Proton Exchange Membrane
Solid Oxide Fuel Cells
Hydrogen Production
Hydrogen Distribution
Hydrogen Storage
Metal-Air
Molten Carbonate
Direct Liquid
Other
1%
7%
7%
37%
8%
2%
2%
14%
20%
0
50
100
150
200
250
2008
p.8 Employment
28. Growth since 2001
1,500
1,000
0
2,500
2006
2007 20092006
2007 2008 2010
0
50
100
150
200
250
300
2005 2006 2007 201020042003200220010
500
1,000
1,500
2,000
2,500
3,000
R&DRevenue Employees
$
p.7 Patents
200
100
0
300
400
235
351
Alberta
Canadian government (all levels)
Corporate operations
Parent, affiliatedor subsidiary
Research, non-profit,non-governmental institute
Contract work conductedfor another institute
0 20 40 60 80 100
12. Sources of Funding for R&D Expenditure by Organization
23%
68%
7%
7%
9%
Foreign government
University oracademic institute
1%
3%
14%
0% 20% 40% 60% 80% 100%
100%61%
GovernmentCorporate Academic and non-profit
290
179
134
276
188
97
133 135 133
177
128
2011
215
142
Feb 2011
Patentsapproved
Patentspending
p.11 Priorities to enhance competitive performance in 2012
0 5 10 15 20 25
Collaboration/strategic alliances
Gain market share
Better targetingof customers
Improving processes
Better marketor customer data
Plans for expansion(new products/new markets)
Other
Outsourcing
8%
1%
8%
21%
8%
Reduce costof operations
7%
6%
19%
12%
10%
p.? challenges faced in 2010
0% 5 10 15 20 25 30
Profitability
Economy
Exchange rates
6%
31%
6%
Other 9%
24%
10%
10%
GermanyUSA
British ColumbiaQuebecOntario
0 5 10 15 20 25 30 35 40 45 50 55 60
16. Demonstration Projects by Region (Number of Projects)
51
Other
GovernmentCorporate Academia and non-profit
%
%
%
Millions Employees
Utility 2%
Direct Methanol 2%
2,000
500
2009
2,001 1,9912,043
1,7651,556
2,025
2011
2010 2011
Competition 4%
Labour shortages
15
12
5
5
4 2
2
1
1
1
12
JapanUK
Rest of Canada
184
136
2008 2009
194
1
1
23
23
195
215 211
133
194
168
237
218211
168
195
211
5
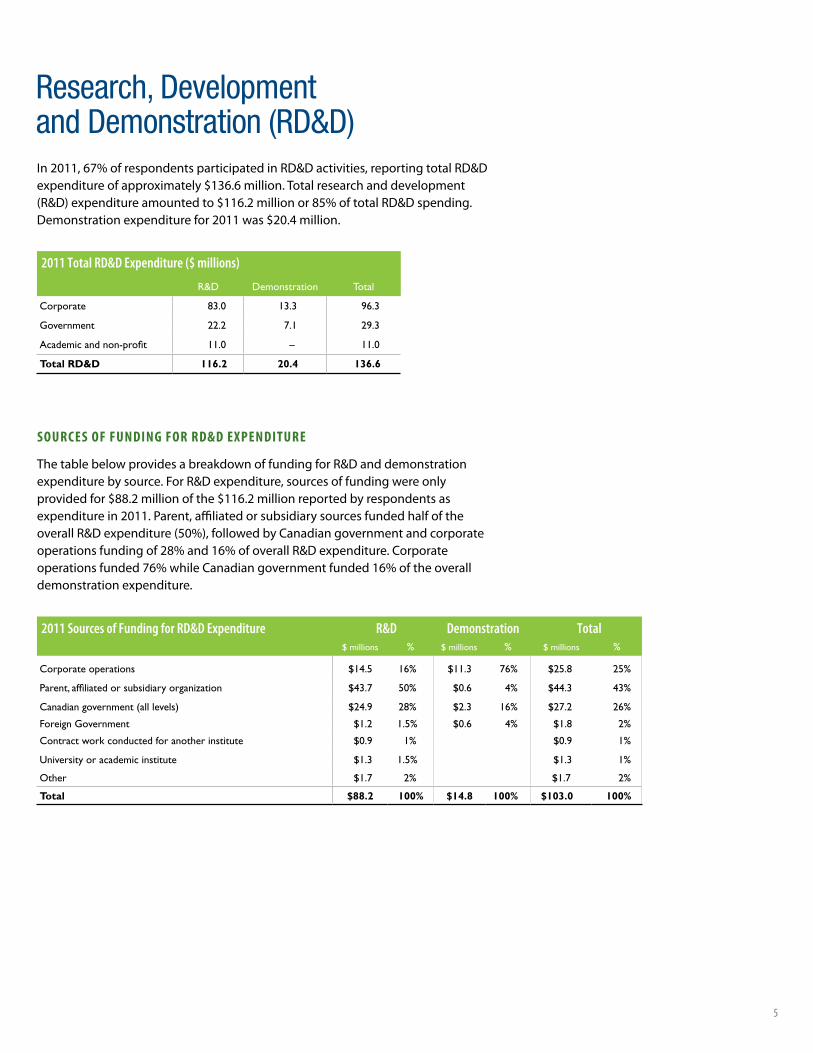
In2011,67%ofrespondentsparticipatedinRD&Dactivities,reportingtotalRD&Dexpenditureofapproximately$136.6million.Totalresearchanddevelopment(R&D)expenditureamountedto$116.2millionor85%oftotalRD&Dspending.Demonstrationexpenditurefor2011was$20.4million.
Research, Development and Demonstration (RD&D)
R&D Demonstration Total
Corporate 83.0 13.3 96.3
Government 22.2 7.1 29.3
Academic and non-profit 11.0 – 11.0
Total RD&D 116.2 20.4 136.6
2011 Total RD&D Expenditure ($ millions)
sOuRCes Of funding fOR Rd&d exPendituRe
ThetablebelowprovidesabreakdownoffundingforR&Danddemonstrationexpenditurebysource.ForR&Dexpenditure,sourcesoffundingwereonlyprovidedfor$88.2millionofthe$116.2millionreportedbyrespondentsasexpenditure in 2011. Parent, affiliated or subsidiary sources funded half of the overallR&Dexpenditure(50%),followedbyCanadiangovernmentandcorporateoperationsfundingof28%and16%ofoverallR&Dexpenditure.Corporateoperationsfunded76%whileCanadiangovernmentfunded16%oftheoveralldemonstration expenditure.
Sources of Funding for R&D Expenditure
$ millions % $ millions % $ millions %
Corporate operations $14.5 16% $11.3 76% $25.8 25%
Parent, affiliated or subsidiary organization $43.7 50% $0.6 4% $44.3 43%
Canadian government (all levels) $24.9 28% $2.3 16% $27.2 26%
Foreign Government $1.2 1.5% $0.6 4% $1.8 2%
Contract work conducted for another institute $0.9 1% $0.9 1%
University or academic institute $1.3 1.5% $1.3 1%
Other $1.7 2% $1.7 2%
Total $88.2 100% $14.8 100% $103.0 100%
2011 Sources of Funding for RD&D Expenditure R&D Demonstration Total
6
Access to markets
Lack of funding
Technology development
p.2 Areas of Expertise
p.3 Technology Focus
p.4 Total Revenue ($ millions)
Hydrogen production
Research organization
Policy development andprogram administration
Fuel cell user
Professional services provider
Hydrogen distribution
Fuel cell developer or manufacturer
5 10 15 20 250
Other
Systems integrator
Education, safety and training
Commercialization support
Supplier to developer or manufacturer
Hydrogen storage
Fuel cell distributor or agent
22%
12%
12%
9%
8%
7%
6%
5%
4%
3%
3%
2%
2%
3%
0 5 10 15 20 25 30 35 40 45
Proton Exchange Membrane
Solid Oxide Fuel Cells
Hydrogen Production
Hydrogen Distribution
Hydrogen Storage
Metal-Air
Molten Carbonate
Direct Liquid
Other
1%
7%
7%
37%
8%
2%
2%
14%
20%
0
50
100
150
200
250
2008
p.8 Employment
28. Growth since 2001
1,500
1,000
0
2,500
2006
2007 20092006
2007 2008 2010
0
50
100
150
200
250
300
2005 2006 2007 201020042003200220010
500
1,000
1,500
2,000
2,500
3,000
R&DRevenue Employees
$
p.7 Patents
200
100
0
300
400
235
351
Alberta
Canadian government (all levels)
Corporate operations
Parent, affiliatedor subsidiary
Research, non-profit,non-governmental institute
Contract work conductedfor another institute
0 20 40 60 80 100
12. Sources of Funding for R&D Expenditure by Organization
23%
68%
7%
7%
9%
Foreign government
University oracademic institute
1%
3%
14%
0% 20% 40% 60% 80% 100%
100%61%
GovernmentCorporate Academic and non-profit
290
179
134
276
188
97
133 135 133
177
128
2011
215
142
Feb 2011
Patentsapproved
Patentspending
p.11 Priorities to enhance competitive performance in 2012
0 5 10 15 20 25
Collaboration/strategic alliances
Gain market share
Better targetingof customers
Improving processes
Better marketor customer data
Plans for expansion(new products/new markets)
Other
Outsourcing
8%
1%
8%
21%
8%
Reduce costof operations
7%
6%
19%
12%
10%
p.? challenges faced in 2010
0% 5 10 15 20 25 30
Profitability
Economy
Exchange rates
6%
31%
6%
Other 9%
24%
10%
10%
GermanyUSA
British ColumbiaQuebecOntario
0 5 10 15 20 25 30 35 40 45 50 55 60
16. Demonstration Projects by Region (Number of Projects)
51
Other
GovernmentCorporate Academia and non-profit
%
%
%
Millions Employees
Utility 2%
Direct Methanol 2%
2,000
500
2009
2,001 1,9912,043
1,7651,556
2,025
2011
2010 2011
Competition 4%
Labour shortages
15
12
5
5
4 2
2
1
1
1
12
JapanUK
Rest of Canada
184
136
2008 2009
194
1
1
23
23
195
215 211
133
194
168
237
218211
168
195
211
Sources of Funding for R&D Expenditure by Organization
Research and Development
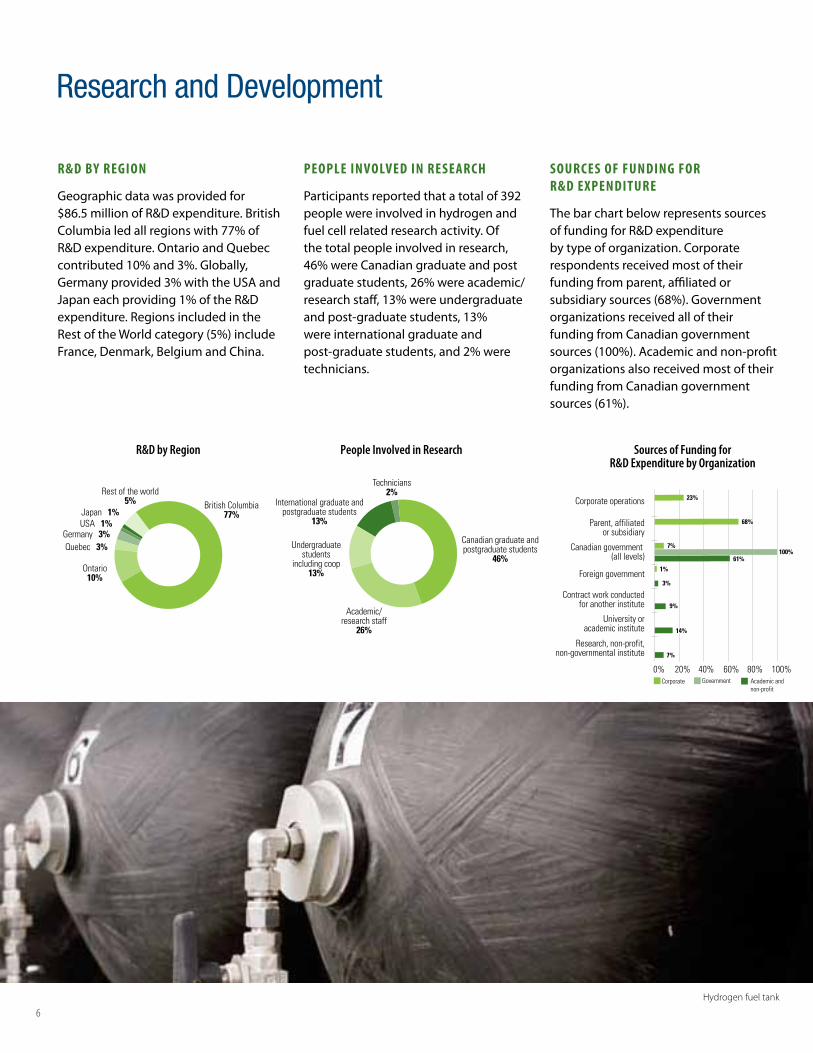
R&d by RegiOn
Geographic data was provided for $86.5 millionofR&Dexpenditure.BritishColumbialedallregionswith77%ofR&Dexpenditure.OntarioandQuebeccontributed10%and3%.Globally,Germanyprovided3%withtheUSAandJapaneachproviding1%oftheR&Dexpenditure.RegionsincludedintheRestoftheWorldcategory(5%)includeFrance,Denmark,BelgiumandChina.
PeOPle invOlved in ReseaRCH
Participantsreportedthatatotalof392people were involved in hydrogen and fuel cell related research activity. Of the total people involved in research, 46%wereCanadiangraduateandpostgraduatestudents,26%wereacademic/researchstaff,13%wereundergraduateandpost-graduatestudents,13%were international graduate and post-graduatestudents,and2%weretechnicians.
sOuRCes Of funding fOR R&d exPendituRe
The bar chart below represents sources offundingforR&Dexpenditureby type of organization. Corporate respondents received most of their funding from parent, affiliated or subsidiarysources (68%).Governmentorganizations received all of their funding from Canadian government sources(100%).Academicandnon-profitorganizations also received most of their funding from Canadian government sources(61%).
Private company40%
Public company15%Division/subsidiary
of public company8%
Governmentorganizations
18%
Educationorganization
18%
Non-profit organization incl. associations
1%
p. 2 Organization Type
Apr 2012
Not provided15%
> 20 years18%
11 – 20 years33%
5 – 10 years26%
< 5 years8%
p.2 Years of Involvement in Hydrogen and Fuel Cell Activities
Mobile –Auxiliary Power
5%
Mobile – Primary Power and Drivetrain
24%
Portable(including
micro)11%
Small Stationary 50kW or less
19%
Large Stationary > 50kW
14%HydrogenProduction
and Fueling Infrastructure
27%
p.3 Market Focus
Rest of World7%
Rest of Canada15%
Ontario18%
Quebec9%
Alberta6%
British Columbia22%
USA8%
p.3 Hydrogen and Fuel Cell Facilities by Region
Provision of services
37%
Product sales59%
Canadian government supportrecognized as revenue
1%
p.4 Revenue by Category
Small Stationary50kW or less
14%LargeStationary
> 50kW2%
Mobile –Primary
Power andDrivetrain
13%
Mobile – Auxiliary Power
21%
FuelingInfrastructure
50%
p.7 Focus of Demonstration Projects
Rest of Canada 4%USA5%
Quebec9%
Asia2%
Rest of Europe 6%
British Columbia58%
Ontario13%
p.8 Employment by Region
Government9%
Academia andnon-profit
15%
Corporate76%
p.8 Employment by Organization
Remain the same (+/-5%)
52%
Significant increase(greater than 15%
of current employees)17%
Increase(between 5%
and 15%)23%
p.11 Plans to change employment in the next 18 months
Government13%
Private equity19%
Other10%
Angel Investors4%
Operations52%
p.9 Sources of Funding - Corporate
A-Base15%
Programs85%
p.9 Sources of Funding - Government
Other non-profitorganization
37%
NSERC/Canadian Foundation for Innovation
13%
Other 50%
p.9 Sources of Funding – Academia and Non-Profit
Other OEM13%
Public-privatepartnerships
26%
Hydrogen andfuel cell companies
26%
EnergyProviders
11%
Other 7%
p.10 Strategic Alliances
Declined3%
No reply40%
Completed survey57%
p.10 Profile participation rate
Technicians2%
Academic/research staff
26%
Undergraduatestudents
including coop13%
Canadian graduate andpostgraduate students
46%
International graduate andpostgraduate students
13%
p.6 People Involved in Research
USA25%Germany
30%
Asia 4%
Rest of world 5%
BritishColumbia
27%Ontario 1%
Rest of Canada1%Rest of
Europe7%
p.6 R&D by region
British Columbia77%
Rest of the world5%
Ontario10%
Quebec 3%Germany 3%
USA 1%
p.4 Revenue by Region
R&DIn-house
48%
p.9 Funding Allocation by Area - Gov’t & Academia & Non-profit
R&DIntramural
35%
Marketing andbusiness development
1%Education,
safety and training5%
Policy development1%
Monitoringand reporting
1%
Demonstrationand pilot projects
9%
Europe11%
Other 3%
Germany 3%
Significantly decrease (greater than 15%)
3%Decrease
(between 5 and 15%)5%
Japan 1%
Japan4%
Automotive OEM17%
Public capital markets2%
R&D by Region People Involved in Research
Private company40%
Public company15%Division/subsidiary
of public company8%
Governmentorganizations
18%
Educationorganization
18%
Non-profit organization incl. associations
1%
p. 2 Organization Type
Apr 2012
Not provided15%
> 20 years18%
11 – 20 years33%
5 – 10 years26%
< 5 years8%
p.2 Years of Involvement in Hydrogen and Fuel Cell Activities
Mobile –Auxiliary Power
5%
Mobile – Primary Power and Drivetrain
24%
Portable(including
micro)11%
Small Stationary 50kW or less
19%
Large Stationary > 50kW
14%HydrogenProduction
and Fueling Infrastructure
27%
p.3 Market Focus
Rest of World7%
Rest of Canada15%
Ontario18%
Quebec9%
Alberta6%
British Columbia22%
USA8%
p.3 Hydrogen and Fuel Cell Facilities by Region
Provision of services
37%
Product sales59%
Canadian government supportrecognized as revenue
1%
p.4 Revenue by Category
Small Stationary50kW or less
14%LargeStationary
> 50kW2%
Mobile –Primary
Power andDrivetrain
13%
Mobile – Auxiliary Power
21%
FuelingInfrastructure
50%
p.7 Focus of Demonstration Projects
Rest of Canada 4%USA5%
Quebec9%
Asia2%
Rest of Europe 6%
British Columbia58%
Ontario13%
p.8 Employment by Region
Government9%
Academia andnon-profit
15%
Corporate76%
p.8 Employment by Organization
Remain the same (+/-5%)
52%
Significant increase(greater than 15%
of current employees)17%
Increase(between 5%
and 15%)23%
p.11 Plans to change employment in the next 18 months
Government13%
Private equity19%
Other10%
Angel Investors4%
Operations52%
p.9 Sources of Funding - Corporate
A-Base15%
Programs85%
p.9 Sources of Funding - Government
Other non-profitorganization
37%
NSERC/Canadian Foundation for Innovation
13%
Other 50%
p.9 Sources of Funding – Academia and Non-Profit
Other OEM13%
Public-privatepartnerships
26%
Hydrogen andfuel cell companies
26%
EnergyProviders
11%
Other 7%
p.10 Strategic Alliances
Declined3%
No reply40%
Completed survey57%
p.10 Profile participation rate
Technicians2%
Academic/research staff
26%
Undergraduatestudents
including coop13%
Canadian graduate andpostgraduate students
46%
International graduate andpostgraduate students
13%
p.6 People Involved in Research
USA25%Germany
30%
Asia 4%
Rest of world 5%
BritishColumbia
27%Ontario 1%
Rest of Canada1%Rest of
Europe7%
p.6 R&D by region
British Columbia77%
Rest of the world5%
Ontario10%
Quebec 3%Germany 3%
USA 1%
p.4 Revenue by Region
R&DIn-house
48%
p.9 Funding Allocation by Area - Gov’t & Academia & Non-profit
R&DIntramural
35%
Marketing andbusiness development
1%Education,
safety and training5%
Policy development1%
Monitoringand reporting
1%
Demonstrationand pilot projects
9%
Europe11%
Other 3%
Germany 3%
Significantly decrease (greater than 15%)
3%Decrease
(between 5 and 15%)5%
Japan 1%
Japan4%
Automotive OEM17%
Public capital markets2%
Hydrogen fuel tank
7
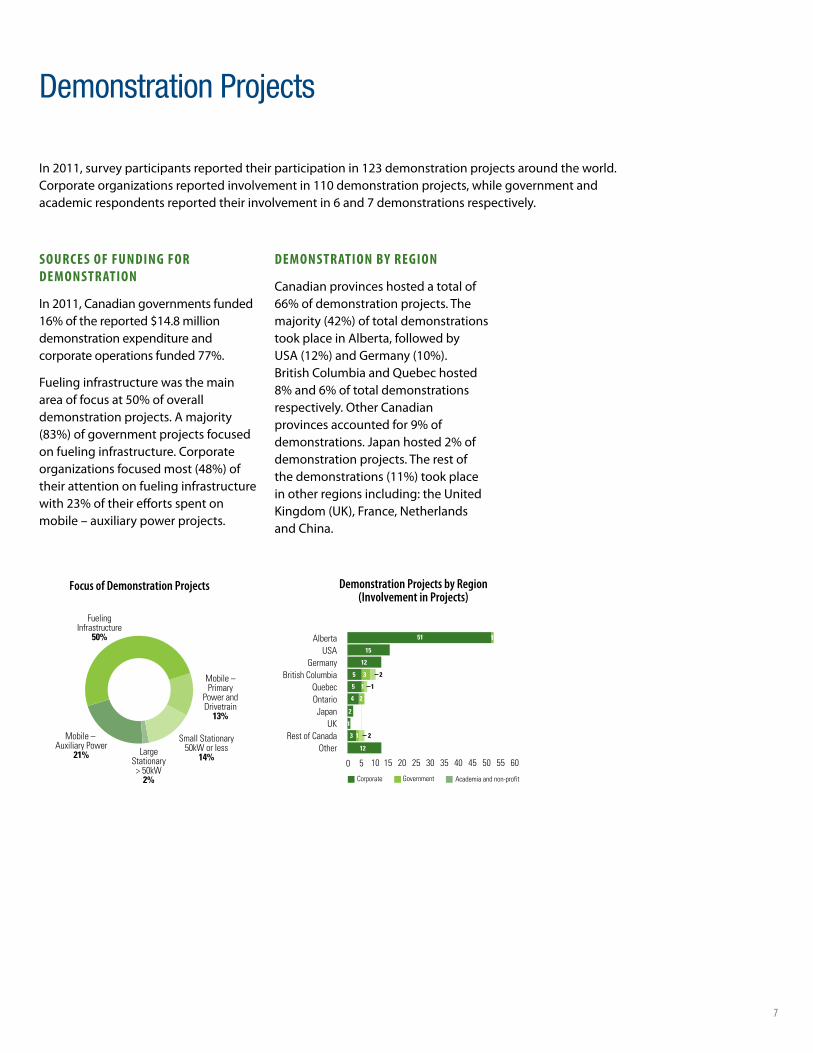
sOuRCes Of funding fOR demOnstRatiOn
In 2011, Canadian governments funded 16%ofthereported$14.8 milliondemonstration expenditure and corporateoperationsfunded77%.
Fueling infrastructure was the main areaoffocusat50%ofoveralldemonstrationprojects.Amajority(83%)ofgovernmentprojectsfocusedon fueling infrastructure. Corporate organizationsfocusedmost(48%)oftheir attention on fueling infrastructure with23%oftheireffortsspentonmobile–auxiliarypowerprojects.
demOnstRatiOn by RegiOn
Canadian provinces hosted a total of 66%ofdemonstrationprojects.Themajority(42%)oftotaldemonstrationstook place in Alberta, followed by USA(12%)andGermany(10%).British Columbia and Quebec hosted 8%and6%oftotaldemonstrationsrespectively. Other Canadian provincesaccountedfor9%ofdemonstrations.Japanhosted2%ofdemonstrationprojects.Therestofthedemonstrations(11%)tookplacein other regions including: the United Kingdom (UK), France, Netherlands and China.
Demonstration Projects
Private company40%
Public company15%Division/subsidiary
of public company8%
Governmentorganizations
18%
Educationorganization
18%
Non-profit organization incl. associations
1%
p. 2 Organization Type
Apr 2012
Not provided15%
> 20 years18%
11 – 20 years33%
5 – 10 years26%
< 5 years8%
p.2 Years of Involvement in Hydrogen and Fuel Cell Activities
Mobile –Auxiliary Power
5%
Mobile – Primary Power and Drivetrain
24%
Portable(including
micro)11%
Small Stationary 50kW or less
19%
Large Stationary > 50kW
14%HydrogenProduction
and Fueling Infrastructure
27%
p.3 Market Focus
Rest of World7%
Rest of Canada15%
Ontario18%
Quebec9%
Alberta6%
British Columbia22%
USA8%
p.3 Hydrogen and Fuel Cell Facilities by Region
Provision of services
37%
Product sales59%
Canadian government supportrecognized as revenue
1%
p.4 Revenue by Category
Small Stationary50kW or less
14%LargeStationary
> 50kW2%
Mobile –Primary
Power andDrivetrain
13%
Mobile – Auxiliary Power
21%
FuelingInfrastructure
50%
p.7 Focus of Demonstration Projects
Rest of Canada 4%USA5%
Quebec9%
Asia2%
Rest of Europe 6%
British Columbia58%
Ontario13%
p.8 Employment by Region
Government9%
Academia andnon-profit
15%
Corporate76%
p.8 Employment by Organization
Remain the same (+/-5%)
52%
Significant increase(greater than 15%
of current employees)17%
Increase(between 5%
and 15%)23%
p.11 Plans to change employment in the next 18 months
Government13%
Private equity19%
Other10%
Angel Investors4%
Operations52%
p.9 Sources of Funding - Corporate
A-Base15%
Programs85%
p.9 Sources of Funding - Government
Other non-profitorganization
37%
NSERC/Canadian Foundation for Innovation
13%
Other 50%
p.9 Sources of Funding – Academia and Non-Profit
Other OEM13%
Public-privatepartnerships
26%
Hydrogen andfuel cell companies
26%
EnergyProviders
11%
Other 7%
p.10 Strategic Alliances
Declined3%
No reply40%
Completed survey57%
p.10 Profile participation rate
Technicians2%
Academic/research staff
26%
Undergraduatestudents
including coop13%
Canadian graduate andpostgraduate students
46%
International graduate andpostgraduate students
13%
p.6 People Involved in Research
USA25%Germany
30%
Asia 4%
Rest of world 5%
BritishColumbia
27%Ontario 1%
Rest of Canada1%Rest of
Europe7%
p.6 R&D by region
British Columbia77%
Rest of the world5%
Ontario10%
Quebec 3%Germany 3%
USA 1%
p.4 Revenue by Region
R&DIn-house
48%
p.9 Funding Allocation by Area - Gov’t & Academia & Non-profit
R&DIntramural
35%
Marketing andbusiness development
1%Education,
safety and training5%
Policy development1%
Monitoringand reporting
1%
Demonstrationand pilot projects
9%
Europe11%
Other 3%
Germany 3%
Significantly decrease (greater than 15%)
3%Decrease
(between 5 and 15%)5%
Japan 1%
Japan4%
Automotive OEM17%
Public capital markets2%
Focus of Demonstration Projects
Access to markets
Lack of funding
Technology development
p.2 Areas of Expertise
p.3 Technology Focus
p.4 Total Revenue ($ millions)
Hydrogen production
Research organization
Policy development andprogram administration
Fuel cell user
Professional services provider
Hydrogen distribution
Fuel cell developer or manufacturer
5 10 15 20 250
Other
Systems integrator
Education, safety and training
Commercialization support
Supplier to developer or manufacturer
Hydrogen storage
Fuel cell distributor or agent
22%
12%
12%
9%
8%
7%
6%
5%
4%
3%
3%
2%
2%
3%
0 5 10 15 20 25 30 35 40 45
Proton Exchange Membrane
Solid Oxide Fuel Cells
Hydrogen Production
Hydrogen Distribution
Hydrogen Storage
Metal-Air
Molten Carbonate
Direct Liquid
Other
1%
7%
7%
37%
8%
2%
2%
14%
20%
0
50
100
150
200
250
2008
p.8 Employment
28. Growth since 2001
1,500
1,000
0
2,500
2006
2007 20092006
2007 2008 2010
0
50
100
150
200
250
300
2005 2006 2007 201020042003200220010
500
1,000
1,500
2,000
2,500
3,000
R&DRevenue Employees
$
p.7 Patents
200
100
0
300
400
235
351
Alberta
Canadian government (all levels)
Corporate operations
Parent, affiliatedor subsidiary
Research, non-profit,non-governmental institute
Contract work conductedfor another institute
0 20 40 60 80 100
12. Sources of Funding for R&D Expenditure by Organization
23%
68%
7%
7%
9%
Foreign government
University oracademic institute
1%
3%
14%
0% 20% 40% 60% 80% 100%
100%61%
GovernmentCorporate Academic and non-profit
290
179
134
276
188
97
133 135 133
177
128
2011
215
142
Feb 2011
Patentsapproved
Patentspending
p.11 Priorities to enhance competitive performance in 2012
0 5 10 15 20 25
Collaboration/strategic alliances
Gain market share
Better targetingof customers
Improving processes
Better marketor customer data
Plans for expansion(new products/new markets)
Other
Outsourcing
8%
1%
8%
21%
8%
Reduce costof operations
7%
6%
19%
12%
10%
p.? challenges faced in 2010
0% 5 10 15 20 25 30
Profitability
Economy
Exchange rates
6%
31%
6%
Other 9%
24%
10%
10%
GermanyUSA
British ColumbiaQuebecOntario
0 5 10 15 20 25 30 35 40 45 50 55 60
16. Demonstration Projects by Region (Number of Projects)
51
Other
GovernmentCorporate Academia and non-profit
%
%
%
Millions Employees
Utility 2%
Direct Methanol 2%
2,000
500
2009
2,001 1,9912,043
1,7651,556
2,025
2011
2010 2011
Competition 4%
Labour shortages
15
12
5
5
4 2
2
1
1
1
12
JapanUK
Rest of Canada
184
136
2008 2009
194
1
1
23
23
195
215 211
133
194
168
237
218211
168
195
211
Demonstration Projects by Region (Involvement in Projects)
In2011,surveyparticipantsreportedtheirparticipationin123demonstrationprojectsaroundtheworld.Corporateorganizationsreportedinvolvementin110demonstrationprojects,whilegovernmentandacademicrespondentsreportedtheirinvolvementin6and7demonstrationsrespectively.
8
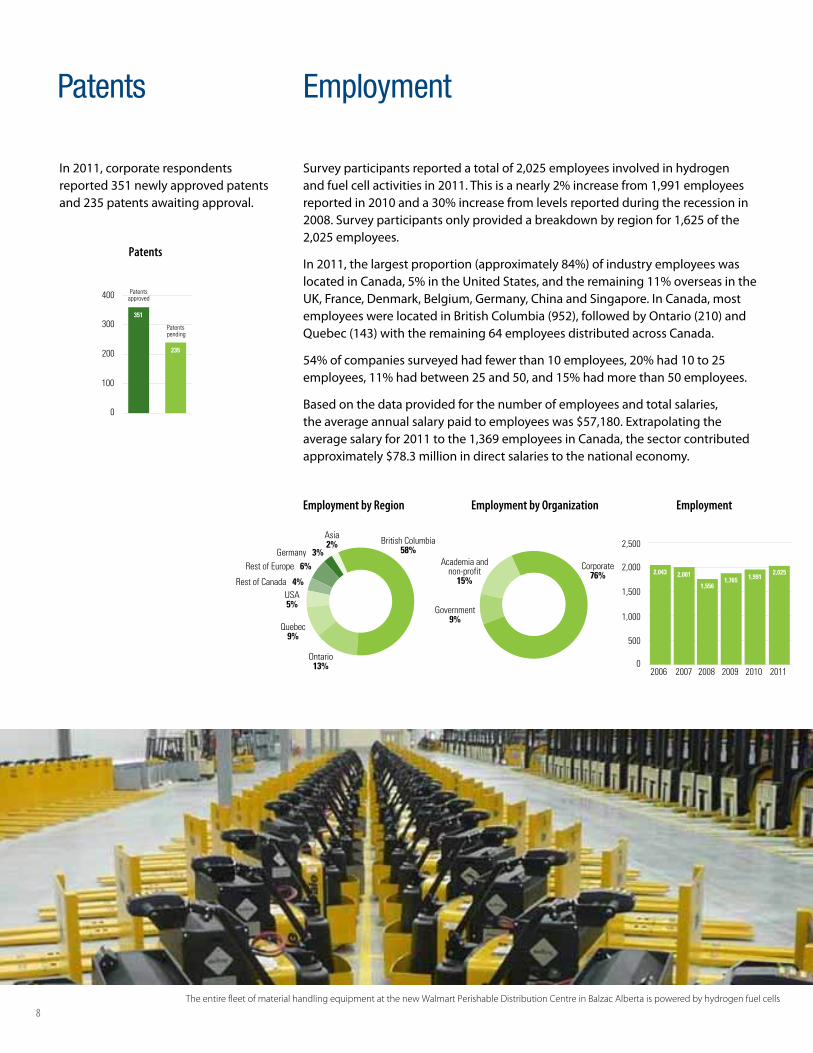
Surveyparticipantsreportedatotalof2,025employeesinvolvedinhydrogenandfuelcellactivitiesin2011.Thisisanearly2%increasefrom1,991employeesreportedin2010anda30%increasefromlevelsreportedduringtherecessionin2008.Surveyparticipantsonlyprovidedabreakdownbyregionfor1,625ofthe2,025employees.
In2011,thelargestproportion(approximately84%)ofindustryemployeeswaslocatedinCanada,5%intheUnitedStates,andtheremaining11%overseasintheUK,France,Denmark,Belgium,Germany,ChinaandSingapore.InCanada,mostemployeeswerelocatedinBritishColumbia(952),followedbyOntario(210)andQuebec(143)withtheremaining64employeesdistributedacrossCanada.
54%ofcompaniessurveyedhadfewerthan10employees,20%had10to25employees,11%hadbetween25and50,and15%hadmorethan50employees.
Based on the data provided for the number of employees and total salaries, theaverageannualsalarypaidtoemployeeswas$57,180.Extrapolatingtheaveragesalaryfor2011tothe1,369employeesinCanada,thesectorcontributedapproximately$78.3millionindirectsalariestothenationaleconomy.
Employment
Access to markets
Lack of funding
Technology development
p.2 Areas of Expertise
p.3 Technology Focus
p.4 Total Revenue ($ millions)
Hydrogen production
Research organization
Policy development andprogram administration
Fuel cell user
Professional services provider
Hydrogen distribution
Fuel cell developer or manufacturer
5 10 15 20 250
Other
Systems integrator
Education, safety and training
Commercialization support
Supplier to developer or manufacturer
Hydrogen storage
Fuel cell distributor or agent
22%
12%
12%
9%
8%
7%
6%
5%
4%
3%
3%
2%
2%
3%
0 5 10 15 20 25 30 35 40 45
Proton Exchange Membrane
Solid Oxide Fuel Cells
Hydrogen Production
Hydrogen Distribution
Hydrogen Storage
Metal-Air
Molten Carbonate
Direct Liquid
Other
1%
7%
7%
37%
8%
2%
2%
14%
20%
0
50
100
150
200
250
2008
p.8 Employment
28. Growth since 2001
1,500
1,000
0
2,500
2006
2007 20092006
2007 2008 2010
0
50
100
150
200
250
300
2005 2006 2007 201020042003200220010
500
1,000
1,500
2,000
2,500
3,000
R&DRevenue Employees
$
p.7 Patents
200
100
0
300
400
235
351
Alberta
Canadian government (all levels)
Corporate operations
Parent, affiliatedor subsidiary
Research, non-profit,non-governmental institute
Contract work conductedfor another institute
0 20 40 60 80 100
12. Sources of Funding for R&D Expenditure by Organization
23%
68%
7%
7%
9%
Foreign government
University oracademic institute
1%
3%
14%
0% 20% 40% 60% 80% 100%
100%61%
GovernmentCorporate Academic and non-profit
290
179
134
276
188
97
133 135 133
177
128
2011
215
142
Feb 2011
Patentsapproved
Patentspending
p.11 Priorities to enhance competitive performance in 2012
0 5 10 15 20 25
Collaboration/strategic alliances
Gain market share
Better targetingof customers
Improving processes
Better marketor customer data
Plans for expansion(new products/new markets)
Other
Outsourcing
8%
1%
8%
21%
8%
Reduce costof operations
7%
6%
19%
12%
10%
p.? challenges faced in 2010
0% 5 10 15 20 25 30
Profitability
Economy
Exchange rates
6%
31%
6%
Other 9%
24%
10%
10%
GermanyUSA
British ColumbiaQuebecOntario
0 5 10 15 20 25 30 35 40 45 50 55 60
16. Demonstration Projects by Region (Number of Projects)
51
Other
GovernmentCorporate Academia and non-profit
%
%
%
Millions Employees
Utility 2%
Direct Methanol 2%
2,000
500
2009
2,001 1,9912,043
1,7651,556
2,025
2011
2010 2011
Competition 4%
Labour shortages
15
12
5
5
4 2
2
1
1
1
12
JapanUK
Rest of Canada
184
136
2008 2009
194
1
1
23
23
195
215 211
133
194
168
237
218211
168
195
211
EmploymentEmployment by Region
Private company40%
Public company15%Division/subsidiary
of public company8%
Governmentorganizations
18%
Educationorganization
18%
Non-profit organization incl. associations
1%
p. 2 Organization Type
Apr 2012
Not provided15%
> 20 years18%
11 – 20 years33%
5 – 10 years26%
< 5 years8%
p.2 Years of Involvement in Hydrogen and Fuel Cell Activities
Mobile –Auxiliary Power
5%
Mobile – Primary Power and Drivetrain
24%
Portable(including
micro)11%
Small Stationary 50kW or less
19%
Large Stationary > 50kW
14%HydrogenProduction
and Fueling Infrastructure
27%
p.3 Market Focus
Rest of World7%
Rest of Canada15%
Ontario18%
Quebec9%
Alberta6%
British Columbia22%
USA8%
p.3 Hydrogen and Fuel Cell Facilities by Region
Provision of services
37%
Product sales59%
Canadian government supportrecognized as revenue
1%
p.4 Revenue by Category
Small Stationary50kW or less
14%LargeStationary
> 50kW2%
Mobile –Primary
Power andDrivetrain
13%
Mobile – Auxiliary Power
21%
FuelingInfrastructure
50%
p.7 Focus of Demonstration Projects
Rest of Canada 4%USA5%
Quebec9%
Asia2%
Rest of Europe 6%
British Columbia58%
Ontario13%
p.8 Employment by Region
Government9%
Academia andnon-profit
15%
Corporate76%
p.8 Employment by Organization
Remain the same (+/-5%)
52%
Significant increase(greater than 15%
of current employees)17%
Increase(between 5%
and 15%)23%
p.11 Plans to change employment in the next 18 months
Government13%
Private equity19%
Other10%
Angel Investors4%
Operations52%
p.9 Sources of Funding - Corporate
A-Base15%
Programs85%
p.9 Sources of Funding - Government
Other non-profitorganization
37%
NSERC/Canadian Foundation for Innovation
13%
Other 50%
p.9 Sources of Funding – Academia and Non-Profit
Other OEM13%
Public-privatepartnerships
26%
Hydrogen andfuel cell companies
26%
EnergyProviders
11%
Other 7%
p.10 Strategic Alliances
Declined3%
No reply40%
Completed survey57%
p.10 Profile participation rate
Technicians2%
Academic/research staff
26%
Undergraduatestudents
including coop13%
Canadian graduate andpostgraduate students
46%
International graduate andpostgraduate students
13%
p.6 People Involved in Research
USA25%Germany
30%
Asia 4%
Rest of world 5%
BritishColumbia
27%Ontario 1%
Rest of Canada1%Rest of
Europe7%
p.6 R&D by region
British Columbia77%
Rest of the world5%
Ontario10%
Quebec 3%Germany 3%
USA 1%
p.4 Revenue by Region
R&DIn-house
48%
p.9 Funding Allocation by Area - Gov’t & Academia & Non-profit
R&DIntramural
35%
Marketing andbusiness development
1%Education,
safety and training5%
Policy development1%
Monitoringand reporting
1%
Demonstrationand pilot projects
9%
Europe11%
Other 3%
Germany 3%
Significantly decrease (greater than 15%)
3%Decrease
(between 5 and 15%)5%
Japan 1%
Japan4%
Automotive OEM17%
Public capital markets2%
Employment by Organization
In 2011, corporate respondents reported351newlyapprovedpatentsand235patentsawaitingapproval.
Patents
Access to markets
Lack of funding
Technology development
p.2 Areas of Expertise
p.3 Technology Focus
p.4 Total Revenue ($ millions)
Hydrogen production
Research organization
Policy development andprogram administration
Fuel cell user
Professional services provider
Hydrogen distribution
Fuel cell developer or manufacturer
5 10 15 20 250
Other
Systems integrator
Education, safety and training
Commercialization support
Supplier to developer or manufacturer
Hydrogen storage
Fuel cell distributor or agent
22%
12%
12%
9%
8%
7%
6%
5%
4%
3%
3%
2%
2%
3%
0 5 10 15 20 25 30 35 40 45
Proton Exchange Membrane
Solid Oxide Fuel Cells
Hydrogen Production
Hydrogen Distribution
Hydrogen Storage
Metal-Air
Molten Carbonate
Direct Liquid
Other
1%
7%
7%
37%
8%
2%
2%
14%
20%
0
50
100
150
200
250
2008
p.8 Employment
28. Growth since 2001
1,500
1,000
0
2,500
2006
2007 20092006
2007 2008 2010
0
50
100
150
200
250
300
2005 2006 2007 201020042003200220010
500
1,000
1,500
2,000
2,500
3,000
R&DRevenue Employees
$
p.7 Patents
200
100
0
300
400
235
351
Alberta
Canadian government (all levels)
Corporate operations
Parent, affiliatedor subsidiary
Research, non-profit,non-governmental institute
Contract work conductedfor another institute
0 20 40 60 80 100
12. Sources of Funding for R&D Expenditure by Organization
23%
68%
7%
7%
9%
Foreign government
University oracademic institute
1%
3%
14%
0% 20% 40% 60% 80% 100%
100%61%
GovernmentCorporate Academic and non-profit
290
179
134
276
188
97
133 135 133
177
128
2011
215
142
Feb 2011
Patentsapproved
Patentspending
p.11 Priorities to enhance competitive performance in 2012
0 5 10 15 20 25
Collaboration/strategic alliances
Gain market share
Better targetingof customers
Improving processes
Better marketor customer data
Plans for expansion(new products/new markets)
Other
Outsourcing
8%
1%
8%
21%
8%
Reduce costof operations
7%
6%
19%
12%
10%
p.? challenges faced in 2010
0% 5 10 15 20 25 30
Profitability
Economy
Exchange rates
6%
31%
6%
Other 9%
24%
10%
10%
GermanyUSA
British ColumbiaQuebecOntario
0 5 10 15 20 25 30 35 40 45 50 55 60
16. Demonstration Projects by Region (Number of Projects)
51
Other
GovernmentCorporate Academia and non-profit
%
%
%
Millions Employees
Utility 2%
Direct Methanol 2%
2,000
500
2009
2,001 1,9912,043
1,7651,556
2,025
2011
2010 2011
Competition 4%
Labour shortages
15
12
5
5
4 2
2
1
1
1
12
JapanUK
Rest of Canada
184
136
2008 2009
194
1
1
23
23
195
215 211
133
194
168
237
218211
168
195
211
Patents
The entire fleet of material handling equipment at the new Walmart Perishable Distribution Centre in Balzac Alberta is powered by hydrogen fuel cells

9
CORPORate
Corporate participants report the top three sources of funding for 2011 from operations(52%),privateequity(19%)andgovernment(13%).Thefinancialrequirements for the next five years areestimatedtobe$544.9millionwithfunding expected to come from private equity(43%),publiccapitalmarkets(16%),operations(14%),andgovernment(5%)and22%fromothersources.
gOveRnment
The total budget for hydrogen and fuel cell related activities reported for 2011 for which government was directly responsible, (including employee salaries andbenefits)was$29million.Programscontributed85%offundingrequirementswithA-baseoperationscontributing15%.
aC ademia and nOn-PROfit
The total budget for hydrogen and fuel cell related activities reported for 2011, for which academic and non-profit was directly responsible, (including employee salaries andbenefits)was$6million.Thesourcesof funding for 2011 were from Natural ScienceandEngineeringResearchCouncilofCanada(NSERC)/CanadianFoundationforInnovation(13%),othernon-profitorganization(37%),andothersourceswithoutspecification(50%).
Funding Requirements
Continued education of governments and public capital markets on the benefits of investing in the hydrogen and fuel cell industry is an important part of the industry’s efforts to secure funding. Given the industry’s long developmentperiodanddemandingRD&Drequirements,adequatefinancingisnecessarytobringcommercialproducts to market.
About84%ofgovernmentfundingwasallocatedtoR&D,bothin-houseandintramural.Academicandnon-profitorganizationsfundingwasallocatedprimarilytoin-houseR&D(75%).BritishColumbiareceived69%ofthefundingallocation,26%wenttoOntario,4%wenttoQuebecandtheremaining1%wenttoSaskatchewan.
Private company40%
Public company15%Division/subsidiary
of public company8%
Governmentorganizations
18%
Educationorganization
18%
Non-profit organization incl. associations
1%
p. 2 Organization Type
Apr 2012
Not provided15%
> 20 years18%
11 – 20 years33%
5 – 10 years26%
< 5 years8%
p.2 Years of Involvement in Hydrogen and Fuel Cell Activities
Mobile –Auxiliary Power
5%
Mobile – Primary Power and Drivetrain
24%
Portable(including
micro)11%
Small Stationary 50kW or less
19%
Large Stationary > 50kW
14%HydrogenProduction
and Fueling Infrastructure
27%
p.3 Market Focus
Rest of World7%
Rest of Canada15%
Ontario18%
Quebec9%
Alberta6%
British Columbia22%
USA8%
p.3 Hydrogen and Fuel Cell Facilities by Region
Provision of services
37%
Product sales59%
Canadian government supportrecognized as revenue
1%
p.4 Revenue by Category
Small Stationary50kW or less
14%LargeStationary
> 50kW2%
Mobile –Primary
Power andDrivetrain
13%
Mobile – Auxiliary Power
21%
FuelingInfrastructure
50%
p.7 Focus of Demonstration Projects
Rest of Canada 4%USA5%
Quebec9%
Asia2%
Rest of Europe 6%
British Columbia58%
Ontario13%
p.8 Employment by Region
Government9%
Academia andnon-profit
15%
Corporate76%
p.8 Employment by Organization
Remain the same (+/-5%)
52%
Significant increase(greater than 15%
of current employees)17%
Increase(between 5%
and 15%)23%
p.11 Plans to change employment in the next 18 months
Government13%
Private equity19%
Other10%
Angel Investors4%
Operations52%
p.9 Sources of Funding - Corporate
A-Base15%
Programs85%
p.9 Sources of Funding - Government
Other non-profitorganization
37%
NSERC/Canadian Foundation for Innovation
13%
Other 50%
p.9 Sources of Funding – Academia and Non-Profit
Other OEM13%
Public-privatepartnerships
26%
Hydrogen andfuel cell companies
26%
EnergyProviders
11%
Other 7%
p.10 Strategic Alliances
Declined3%
No reply40%
Completed survey57%
p.10 Profile participation rate
Technicians2%
Academic/research staff
26%
Undergraduatestudents
including coop13%
Canadian graduate andpostgraduate students
46%
International graduate andpostgraduate students
13%
p.6 People Involved in Research
USA25%Germany
30%
Asia 4%
Rest of world 5%
BritishColumbia
27%Ontario 1%
Rest of Canada1%Rest of
Europe7%
p.6 R&D by region
British Columbia77%
Rest of the world5%
Ontario10%
Quebec 3%Germany 3%
USA 1%
p.4 Revenue by Region
R&DIn-house
48%
p.9 Funding Allocation by Area - Gov’t & Academia & Non-profit
R&DIntramural
35%
Marketing andbusiness development
1%Education,
safety and training5%
Policy development1%
Monitoringand reporting
1%
Demonstrationand pilot projects
9%
Europe11%
Other 3%
Germany 3%
Significantly decrease (greater than 15%)
3%Decrease
(between 5 and 15%)5%
Japan 1%
Japan4%
Automotive OEM17%
Public capital markets2%
Funding Allocation by Area – Government & Academia & Non-profit
Private company40%
Public company15%Division/subsidiary
of public company8%
Governmentorganizations
18%
Educationorganization
18%
Non-profit organization incl. associations
1%
p. 2 Organization Type
Apr 2012
Not provided15%
> 20 years18%
11 – 20 years33%
5 – 10 years26%
< 5 years8%
p.2 Years of Involvement in Hydrogen and Fuel Cell Activities
Mobile –Auxiliary Power
5%
Mobile – Primary Power and Drivetrain
24%
Portable(including
micro)11%
Small Stationary 50kW or less
19%
Large Stationary > 50kW
14%HydrogenProduction
and Fueling Infrastructure
27%
p.3 Market Focus
Rest of World7%
Rest of Canada15%
Ontario18%
Quebec9%
Alberta6%
British Columbia22%
USA8%
p.3 Hydrogen and Fuel Cell Facilities by Region
Provision of services
37%
Product sales59%
Canadian government supportrecognized as revenue
1%
p.4 Revenue by Category
Small Stationary50kW or less
14%LargeStationary
> 50kW2%
Mobile –Primary
Power andDrivetrain
13%
Mobile – Auxiliary Power
21%
FuelingInfrastructure
50%
p.7 Focus of Demonstration Projects
Rest of Canada 4%USA5%
Quebec9%
Asia2%
Rest of Europe 6%
British Columbia58%
Ontario13%
p.8 Employment by Region
Government9%
Academia andnon-profit
15%
Corporate76%
p.8 Employment by Organization
Remain the same (+/-5%)
52%
Significant increase(greater than 15%
of current employees)17%
Increase(between 5%
and 15%)23%
p.11 Plans to change employment in the next 18 months
Government13%
Private equity19%
Other10%
Angel Investors4%
Operations52%
p.9 Sources of Funding - Corporate
A-Base15%
Programs85%
p.9 Sources of Funding - Government
Other non-profitorganization
37%
NSERC/Canadian Foundation for Innovation
13%
Other 50%
p.9 Sources of Funding – Academia and Non-Profit
Other OEM13%
Public-privatepartnerships
26%
Hydrogen andfuel cell companies
26%
EnergyProviders
11%
Other 7%
p.10 Strategic Alliances
Declined3%
No reply40%
Completed survey57%
p.10 Profile participation rate
Technicians2%
Academic/research staff
26%
Undergraduatestudents
including coop13%
Canadian graduate andpostgraduate students
46%
International graduate andpostgraduate students
13%
p.6 People Involved in Research
USA25%Germany
30%
Asia 4%
Rest of world 5%
BritishColumbia
27%Ontario 1%
Rest of Canada1%Rest of
Europe7%
p.6 R&D by region
British Columbia77%
Rest of the world5%
Ontario10%
Quebec 3%Germany 3%
USA 1%
p.4 Revenue by Region
R&DIn-house
48%
p.9 Funding Allocation by Area - Gov’t & Academia & Non-profit
R&DIntramural
35%
Marketing andbusiness development
1%Education,
safety and training5%
Policy development1%
Monitoringand reporting
1%
Demonstrationand pilot projects
9%
Europe11%
Other 3%
Germany 3%
Significantly decrease (greater than 15%)
3%Decrease
(between 5 and 15%)5%
Japan 1%
Japan4%
Automotive OEM17%
Public capital markets2%
Sources of Funding – Government
Sources of Funding – Academia and Non-Profit
Private company40%
Public company15%Division/subsidiary
of public company8%
Governmentorganizations
18%
Educationorganization
18%
Non-profit organization incl. associations
1%
p. 2 Organization Type
Apr 2012
Not provided15%
> 20 years18%
11 – 20 years33%
5 – 10 years26%
< 5 years8%
p.2 Years of Involvement in Hydrogen and Fuel Cell Activities
Mobile –Auxiliary Power
5%
Mobile – Primary Power and Drivetrain
24%
Portable(including
micro)11%
Small Stationary 50kW or less
19%
Large Stationary > 50kW
14%HydrogenProduction
and Fueling Infrastructure
27%
p.3 Market Focus
Rest of World7%
Rest of Canada15%
Ontario18%
Quebec9%
Alberta6%
British Columbia22%
USA8%
p.3 Hydrogen and Fuel Cell Facilities by Region
Provision of services
37%
Product sales59%
Canadian government supportrecognized as revenue
1%
p.4 Revenue by Category
Small Stationary50kW or less
14%LargeStationary
> 50kW2%
Mobile –Primary
Power andDrivetrain
13%
Mobile – Auxiliary Power
21%
FuelingInfrastructure
50%
p.7 Focus of Demonstration Projects
Rest of Canada 4%USA5%
Quebec9%
Asia2%
Rest of Europe 6%
British Columbia58%
Ontario13%
p.8 Employment by Region
Government9%
Academia andnon-profit
15%
Corporate76%
p.8 Employment by Organization
Remain the same (+/-5%)
52%
Significant increase(greater than 15%
of current employees)17%
Increase(between 5%
and 15%)23%
p.11 Plans to change employment in the next 18 months
Government13%
Private equity19%
Other10%
Angel Investors4%
Operations52%
p.9 Sources of Funding - Corporate
A-Base15%
Programs85%
p.9 Sources of Funding - Government
Other non-profitorganization
37%
NSERC/Canadian Foundation for Innovation
13%
Other 50%
p.9 Sources of Funding – Academia and Non-Profit
Other OEM13%
Public-privatepartnerships
26%
Hydrogen andfuel cell companies
26%
EnergyProviders
11%
Other 7%
p.10 Strategic Alliances
Declined3%
No reply40%
Completed survey57%
p.10 Profile participation rate
Technicians2%
Academic/research staff
26%
Undergraduatestudents
including coop13%
Canadian graduate andpostgraduate students
46%
International graduate andpostgraduate students
13%
p.6 People Involved in Research
USA25%Germany
30%
Asia 4%
Rest of world 5%
BritishColumbia
27%Ontario 1%
Rest of Canada1%Rest of
Europe7%
p.6 R&D by region
British Columbia77%
Rest of the world5%
Ontario10%
Quebec 3%Germany 3%
USA 1%
p.4 Revenue by Region
R&DIn-house
48%
p.9 Funding Allocation by Area - Gov’t & Academia & Non-profit
R&DIntramural
35%
Marketing andbusiness development
1%Education,
safety and training5%
Policy development1%
Monitoringand reporting
1%
Demonstrationand pilot projects
9%
Europe11%
Other 3%
Germany 3%
Significantly decrease (greater than 15%)
3%Decrease
(between 5 and 15%)5%
Japan 1%
Japan4%
Automotive OEM17%
Public capital markets2%
Sources of Funding – Corporate
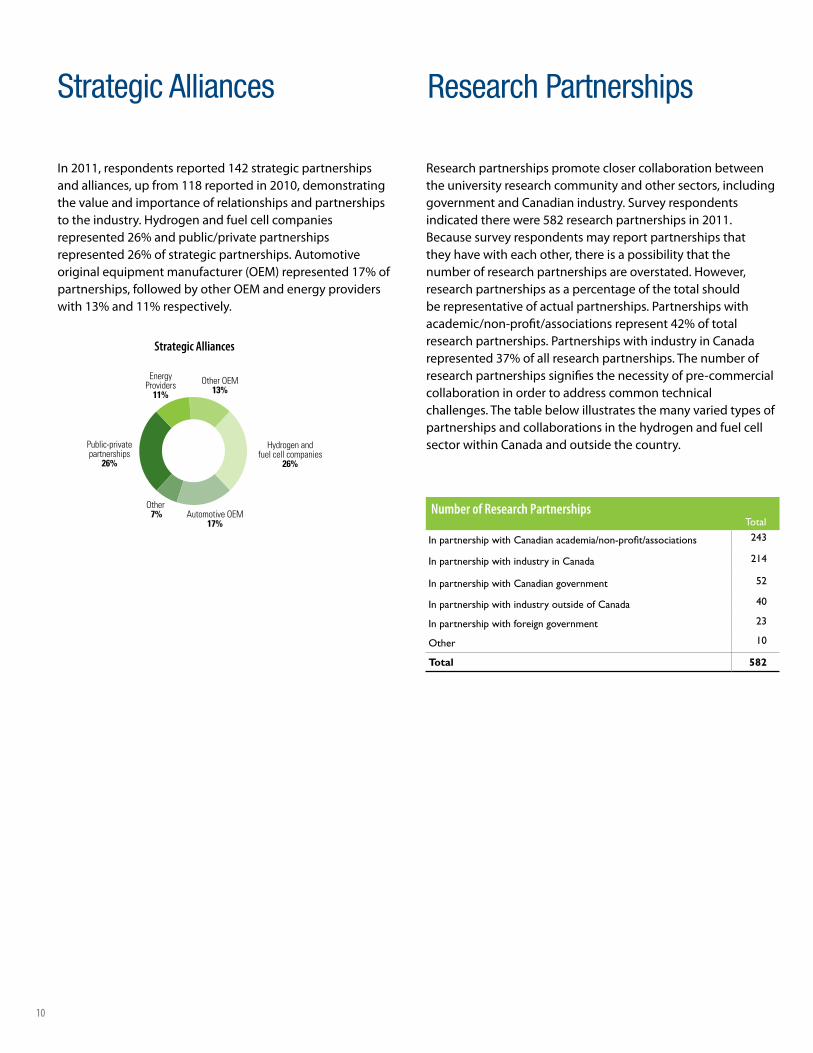
10
In 2011, respondents reported 142 strategic partnerships andalliances,upfrom118reportedin2010,demonstratingthe value and importance of relationships and partnerships to the industry. Hydrogen and fuel cell companies represented26%andpublic/privatepartnershipsrepresented26%ofstrategicpartnerships.Automotiveoriginalequipmentmanufacturer(OEM)represented17%ofpartnerships,followedbyotherOEMandenergyproviderswith13%and11%respectively.
Total
In partnership with Canadian academia/non-profit/associations 243
In partnership with industry in Canada 214
In partnership with Canadian government 52
In partnership with industry outside of Canada 40
In partnership with foreign government 23
Other 10
Total 582
Researchpartnershipspromoteclosercollaborationbetweenthe university research community and other sectors, including government and Canadian industry. Survey respondents indicatedtherewere582researchpartnershipsin2011.Because survey respondents may report partnerships that they have with each other, there is a possibility that the number of research partnerships are overstated. However, research partnerships as a percentage of the total should be representative of actual partnerships. Partnerships with academic/non-profit/associationsrepresent42%oftotalresearch partnerships. Partnerships with industry in Canada represented37%ofallresearchpartnerships.Thenumberofresearch partnerships signifies the necessity of pre-commercial collaboration in order to address common technical challenges. The table below illustrates the many varied types of partnerships and collaborations in the hydrogen and fuel cell sector within Canada and outside the country.
Strategic Alliances Research Partnerships
Strategic Alliances
Private company40%
Public company15%Division/subsidiary
of public company8%
Governmentorganizations
18%
Educationorganization
18%
Non-profit organization incl. associations
1%
p. 2 Organization Type
Apr 2012
Not provided15%
> 20 years18%
11 – 20 years33%
5 – 10 years26%
< 5 years8%
p.2 Years of Involvement in Hydrogen and Fuel Cell Activities
Mobile –Auxiliary Power
5%
Mobile – Primary Power and Drivetrain
24%
Portable(including
micro)11%
Small Stationary 50kW or less
19%
Large Stationary > 50kW
14%HydrogenProduction
and Fueling Infrastructure
27%
p.3 Market Focus
Rest of World7%
Rest of Canada15%
Ontario18%
Quebec9%
Alberta6%
British Columbia22%
USA8%
p.3 Hydrogen and Fuel Cell Facilities by Region
Provision of services
37%
Product sales59%
Canadian government supportrecognized as revenue
1%
p.4 Revenue by Category
Small Stationary50kW or less
14%LargeStationary
> 50kW2%
Mobile –Primary
Power andDrivetrain
13%
Mobile – Auxiliary Power
21%
FuelingInfrastructure
50%
p.7 Focus of Demonstration Projects
Rest of Canada 4%USA5%
Quebec9%
Asia2%
Rest of Europe 6%
British Columbia58%
Ontario13%
p.8 Employment by Region
Government9%
Academia andnon-profit
15%
Corporate76%
p.8 Employment by Organization
Remain the same (+/-5%)
52%
Significant increase(greater than 15%
of current employees)17%
Increase(between 5%
and 15%)23%
p.11 Plans to change employment in the next 18 months
Government13%
Private equity19%
Other10%
Angel Investors4%
Operations52%
p.9 Sources of Funding - Corporate
A-Base15%
Programs85%
p.9 Sources of Funding - Government
Other non-profitorganization
37%
NSERC/Canadian Foundation for Innovation
13%
Other 50%
p.9 Sources of Funding – Academia and Non-Profit
Other OEM13%
Public-privatepartnerships
26%
Hydrogen andfuel cell companies
26%
EnergyProviders
11%
Other 7%
p.10 Strategic Alliances
Declined3%
No reply40%
Completed survey57%
p.10 Profile participation rate
Technicians2%
Academic/research staff
26%
Undergraduatestudents
including coop13%
Canadian graduate andpostgraduate students
46%
International graduate andpostgraduate students
13%
p.6 People Involved in Research
USA25%Germany
30%
Asia 4%
Rest of world 5%
BritishColumbia
27%Ontario 1%
Rest of Canada1%Rest of
Europe7%
p.6 R&D by region
British Columbia77%
Rest of the world5%
Ontario10%
Quebec 3%Germany 3%
USA 1%
p.4 Revenue by Region
R&DIn-house
48%
p.9 Funding Allocation by Area - Gov’t & Academia & Non-profit
R&DIntramural
35%
Marketing andbusiness development
1%Education,
safety and training5%
Policy development1%
Monitoringand reporting
1%
Demonstrationand pilot projects
9%
Europe11%
Other 3%
Germany 3%
Significantly decrease (greater than 15%)
3%Decrease
(between 5 and 15%)5%
Japan 1%
Japan4%
Automotive OEM17%
Public capital markets2%
Number of Research Partnerships
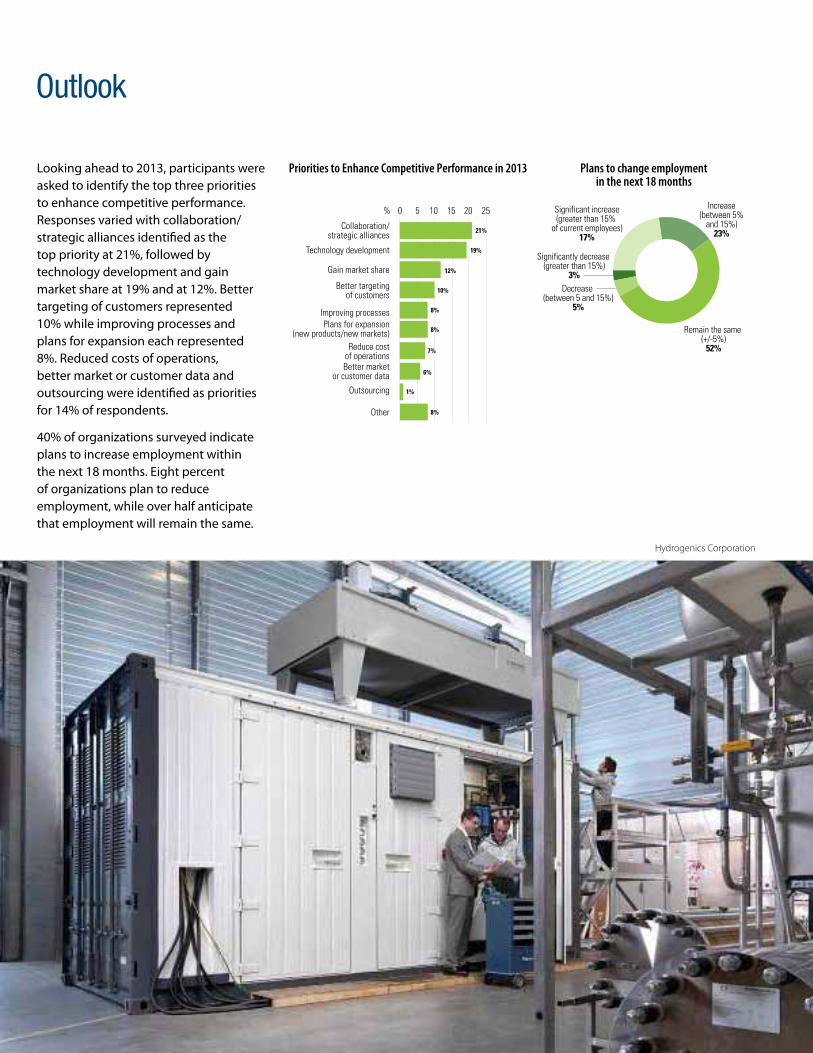
11
Outlook
Lookingaheadto2013,participantswereasked to identify the top three priorities to enhance competitive performance. Responsesvariedwithcollaboration/strategic alliances identified as the toppriorityat21%,followedbytechnology development and gain marketshareat19%andat12%.Bettertargeting of customers represented 10%whileimprovingprocessesandplans for expansion each represented 8%.Reducedcostsofoperations,better market or customer data and outsourcing were identified as priorities for14%ofrespondents.
40%oforganizationssurveyedindicateplans to increase employment within thenext18months.Eightpercentof organizations plan to reduce employment, while over half anticipate that employment will remain the same.
Access to markets
Lack of funding
Technology development
p.2 Areas of Expertise
p.3 Technology Focus
p.4 Total Revenue ($ millions)
Hydrogen production
Research organization
Policy development andprogram administration
Fuel cell user
Professional services provider
Hydrogen distribution
Fuel cell developer or manufacturer
5 10 15 20 250
Other
Systems integrator
Education, safety and training
Commercialization support
Supplier to developer or manufacturer
Hydrogen storage
Fuel cell distributor or agent
22%
12%
12%
9%
8%
7%
6%
5%
4%
3%
3%
2%
2%
3%
0 5 10 15 20 25 30 35 40 45
Proton Exchange Membrane
Solid Oxide Fuel Cells
Hydrogen Production
Hydrogen Distribution
Hydrogen Storage
Metal-Air
Molten Carbonate
Direct Liquid
Other
1%
7%
7%
37%
8%
2%
2%
14%
20%
0
50
100
150
200
250
2008
p.8 Employment
28. Growth since 2001
1,500
1,000
0
2,500
2006
2007 20092006
2007 2008 2010
0
50
100
150
200
250
300
2005 2006 2007 201020042003200220010
500
1,000
1,500
2,000
2,500
3,000
R&DRevenue Employees
$
p.7 Patents
200
100
0
300
400
235
351
Alberta
Canadian government (all levels)
Corporate operations
Parent, affiliatedor subsidiary
Research, non-profit,non-governmental institute
Contract work conductedfor another institute
0 20 40 60 80 100
12. Sources of Funding for R&D Expenditure by Organization
23%
68%
7%
7%
9%
Foreign government
University oracademic institute
1%
3%
14%
0% 20% 40% 60% 80% 100%
100%61%
GovernmentCorporate Academic and non-profit
290
179
134
276
188
97
133 135 133
177
128
2011
215
142
Feb 2011
Patentsapproved
Patentspending
p.11 Priorities to enhance competitive performance in 2012
0 5 10 15 20 25
Collaboration/strategic alliances
Gain market share
Better targetingof customers
Improving processes
Better marketor customer data
Plans for expansion(new products/new markets)
Other
Outsourcing
8%
1%
8%
21%
8%
Reduce costof operations
7%
6%
19%
12%
10%
p.? challenges faced in 2010
0% 5 10 15 20 25 30
Profitability
Economy
Exchange rates
6%
31%
6%
Other 9%
24%
10%
10%
GermanyUSA
British ColumbiaQuebecOntario
0 5 10 15 20 25 30 35 40 45 50 55 60
16. Demonstration Projects by Region (Number of Projects)
51
Other
GovernmentCorporate Academia and non-profit
%
%
%
Millions Employees
Utility 2%
Direct Methanol 2%
2,000
500
2009
2,001 1,9912,043
1,7651,556
2,025
2011
2010 2011
Competition 4%
Labour shortages
15
12
5
5
4 2
2
1
1
1
12
JapanUK
Rest of Canada
184
136
2008 2009
194
1
1
23
23
195
215 211
133
194
168
237
218211
168
195
211
Priorities to Enhance Competitive Performance in 2013
Private company40%
Public company15%Division/subsidiary
of public company8%
Governmentorganizations
18%
Educationorganization
18%
Non-profit organization incl. associations
1%
p. 2 Organization Type
Apr 2012
Not provided15%
> 20 years18%
11 – 20 years33%
5 – 10 years26%
< 5 years8%
p.2 Years of Involvement in Hydrogen and Fuel Cell Activities
Mobile –Auxiliary Power
5%
Mobile – Primary Power and Drivetrain
24%
Portable(including
micro)11%
Small Stationary 50kW or less
19%
Large Stationary > 50kW
14%HydrogenProduction
and Fueling Infrastructure
27%
p.3 Market Focus
Rest of World7%
Rest of Canada15%
Ontario18%
Quebec9%
Alberta6%
British Columbia22%
USA8%
p.3 Hydrogen and Fuel Cell Facilities by Region
Provision of services
37%
Product sales59%
Canadian government supportrecognized as revenue
1%
p.4 Revenue by Category
Small Stationary50kW or less
14%LargeStationary
> 50kW2%
Mobile –Primary
Power andDrivetrain
13%
Mobile – Auxiliary Power
21%
FuelingInfrastructure
50%
p.7 Focus of Demonstration Projects
Rest of Canada 4%USA5%
Quebec9%
Asia2%
Rest of Europe 6%
British Columbia58%
Ontario13%
p.8 Employment by Region
Government9%
Academia andnon-profit
15%
Corporate76%
p.8 Employment by Organization
Remain the same (+/-5%)
52%
Significant increase(greater than 15%
of current employees)17%
Increase(between 5%
and 15%)23%
p.11 Plans to change employment in the next 18 months
Government13%
Private equity19%
Other10%
Angel Investors4%
Operations52%
p.9 Sources of Funding - Corporate
A-Base15%
Programs85%
p.9 Sources of Funding - Government
Other non-profitorganization
37%
NSERC/Canadian Foundation for Innovation
13%
Other 50%
p.9 Sources of Funding – Academia and Non-Profit
Other OEM13%
Public-privatepartnerships
26%
Hydrogen andfuel cell companies
26%
EnergyProviders
11%
Other 7%
p.10 Strategic Alliances
Declined3%
No reply40%
Completed survey57%
p.10 Profile participation rate
Technicians2%
Academic/research staff
26%
Undergraduatestudents
including coop13%
Canadian graduate andpostgraduate students
46%
International graduate andpostgraduate students
13%
p.6 People Involved in Research
USA25%Germany
30%
Asia 4%
Rest of world 5%
BritishColumbia
27%Ontario 1%
Rest of Canada1%Rest of
Europe7%
p.6 R&D by region
British Columbia77%
Rest of the world5%
Ontario10%
Quebec 3%Germany 3%
USA 1%
p.4 Revenue by Region
R&DIn-house
48%
p.9 Funding Allocation by Area - Gov’t & Academia & Non-profit
R&DIntramural
35%
Marketing andbusiness development
1%Education,
safety and training5%
Policy development1%
Monitoringand reporting
1%
Demonstrationand pilot projects
9%
Europe11%
Other 3%
Germany 3%
Significantly decrease (greater than 15%)
3%Decrease
(between 5 and 15%)5%
Japan 1%
Japan4%
Automotive OEM17%
Public capital markets2%
Plans to change employment in the next 18 months
Hydrogenics Corporation
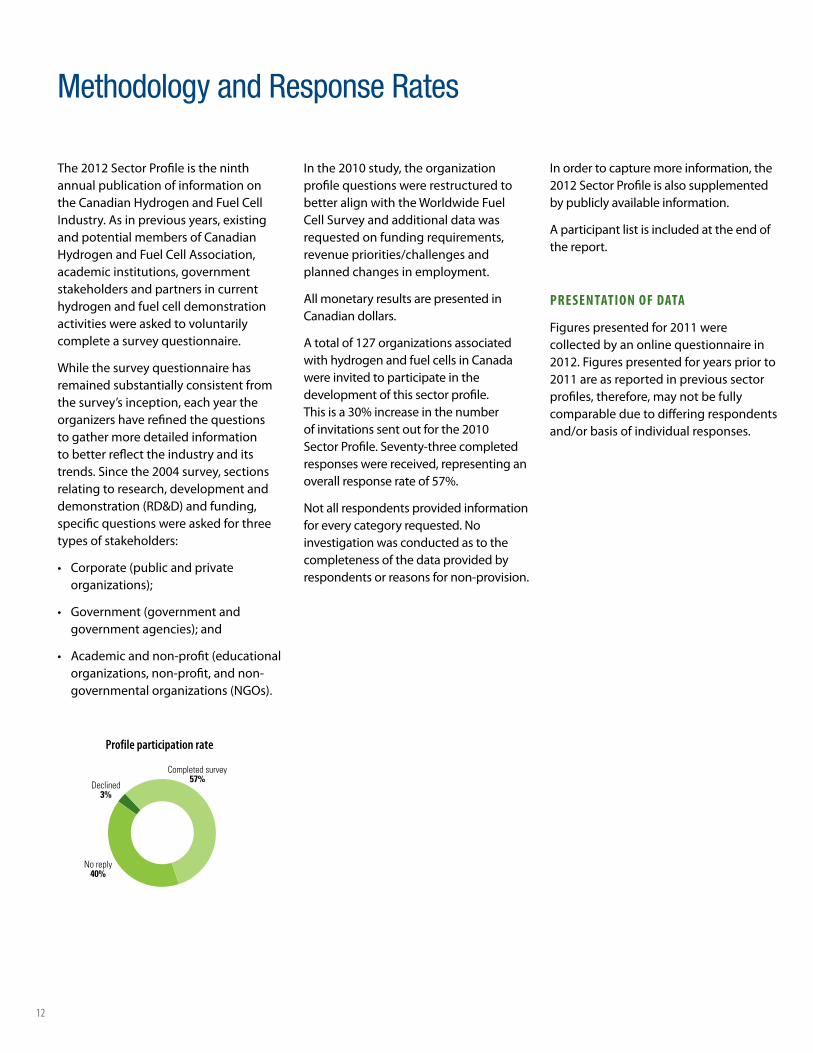
12
In the 2010 study, the organization profile questions were restructured to better align with the Worldwide Fuel Cell Survey and additional data was requested on funding requirements, revenuepriorities/challengesandplanned changes in employment.
All monetary results are presented in Canadian dollars.
A total of 127 organizations associated with hydrogen and fuel cells in Canada were invited to participate in the development of this sector profile. Thisisa30%increaseinthenumberof invitations sent out for the 2010 Sector Profile. Seventy-three completed responses were received, representing an overallresponserateof57%.
Not all respondents provided information for every category requested. No investigation was conducted as to the completeness of the data provided by respondents or reasons for non-provision.
In order to capture more information, the 2012 Sector Profile is also supplemented by publicly available information.
A participant list is included at the end of the report.
PResentatiOn Of data
Figures presented for 2011 were collected by an online questionnaire in 2012. Figures presented for years prior to 2011 are as reported in previous sector profiles, therefore, may not be fully comparable due to differing respondents and/orbasisofindividualresponses.
Methodology and Response Rates
Profile participation rate
Private company40%
Public company15%Division/subsidiary
of public company8%
Governmentorganizations
18%
Educationorganization
18%
Non-profit organization incl. associations
1%
p. 2 Organization Type
Apr 2012
Not provided15%
> 20 years18%
11 – 20 years33%
5 – 10 years26%
< 5 years8%
p.2 Years of Involvement in Hydrogen and Fuel Cell Activities
Mobile –Auxiliary Power
5%
Mobile – Primary Power and Drivetrain
24%
Portable(including
micro)11%
Small Stationary 50kW or less
19%
Large Stationary > 50kW
14%HydrogenProduction
and Fueling Infrastructure
27%
p.3 Market Focus
Rest of World7%
Rest of Canada15%
Ontario18%
Quebec9%
Alberta6%
British Columbia22%
USA8%
p.3 Hydrogen and Fuel Cell Facilities by Region
Provision of services
37%
Product sales59%
Canadian government supportrecognized as revenue
1%
p.4 Revenue by Category
Small Stationary50kW or less
14%LargeStationary
> 50kW2%
Mobile –Primary
Power andDrivetrain
13%
Mobile – Auxiliary Power
21%
FuelingInfrastructure
50%
p.7 Focus of Demonstration Projects
Rest of Canada 4%USA5%
Quebec9%
Asia2%
Rest of Europe 6%
British Columbia58%
Ontario13%
p.8 Employment by Region
Government9%
Academia andnon-profit
15%
Corporate76%
p.8 Employment by Organization
Remain the same (+/-5%)
52%
Significant increase(greater than 15%
of current employees)17%
Increase(between 5%
and 15%)23%
p.11 Plans to change employment in the next 18 months
Government13%
Private equity19%
Other10%
Angel Investors4%
Operations52%
p.9 Sources of Funding - Corporate
A-Base15%
Programs85%
p.9 Sources of Funding - Government
Other non-profitorganization
37%
NSERC/Canadian Foundation for Innovation
13%
Other 50%
p.9 Sources of Funding – Academia and Non-Profit
Other OEM13%
Public-privatepartnerships
26%
Hydrogen andfuel cell companies
26%
EnergyProviders
11%
Other 7%
p.10 Strategic Alliances
Declined3%
No reply40%
Completed survey57%
p.10 Profile participation rate
Technicians2%
Academic/research staff
26%
Undergraduatestudents
including coop13%
Canadian graduate andpostgraduate students
46%
International graduate andpostgraduate students
13%
p.6 People Involved in Research
USA25%Germany
30%
Asia 4%
Rest of world 5%
BritishColumbia
27%Ontario 1%
Rest of Canada1%Rest of
Europe7%
p.6 R&D by region
British Columbia77%
Rest of the world5%
Ontario10%
Quebec 3%Germany 3%
USA 1%
p.4 Revenue by Region
R&DIn-house
48%
p.9 Funding Allocation by Area - Gov’t & Academia & Non-profit
R&DIntramural
35%
Marketing andbusiness development
1%Education,
safety and training5%
Policy development1%
Monitoringand reporting
1%
Demonstrationand pilot projects
9%
Europe11%
Other 3%
Germany 3%
Significantly decrease (greater than 15%)
3%Decrease
(between 5 and 15%)5%
Japan 1%
Japan4%
Automotive OEM17%
Public capital markets2%
The 2012 Sector Profile is the ninth annual publication of information on the Canadian Hydrogen and Fuel Cell Industry. As in previous years, existing and potential members of Canadian Hydrogen and Fuel Cell Association, academic institutions, government stakeholders and partners in current hydrogen and fuel cell demonstration activities were asked to voluntarily complete a survey questionnaire.
While the survey questionnaire has remained substantially consistent from the survey’s inception, each year the organizers have refined the questions to gather more detailed information to better reflect the industry and its trends. Since the 2004 survey, sections relating to research, development and demonstration(RD&D)andfunding,specific questions were asked for three types of stakeholders:
• Corporate(publicandprivateorganizations);
• Government(governmentandgovernment agencies); and
• Academicandnon-profit(educationalorganizations, non-profit, and non-governmental organizations (NGOs).
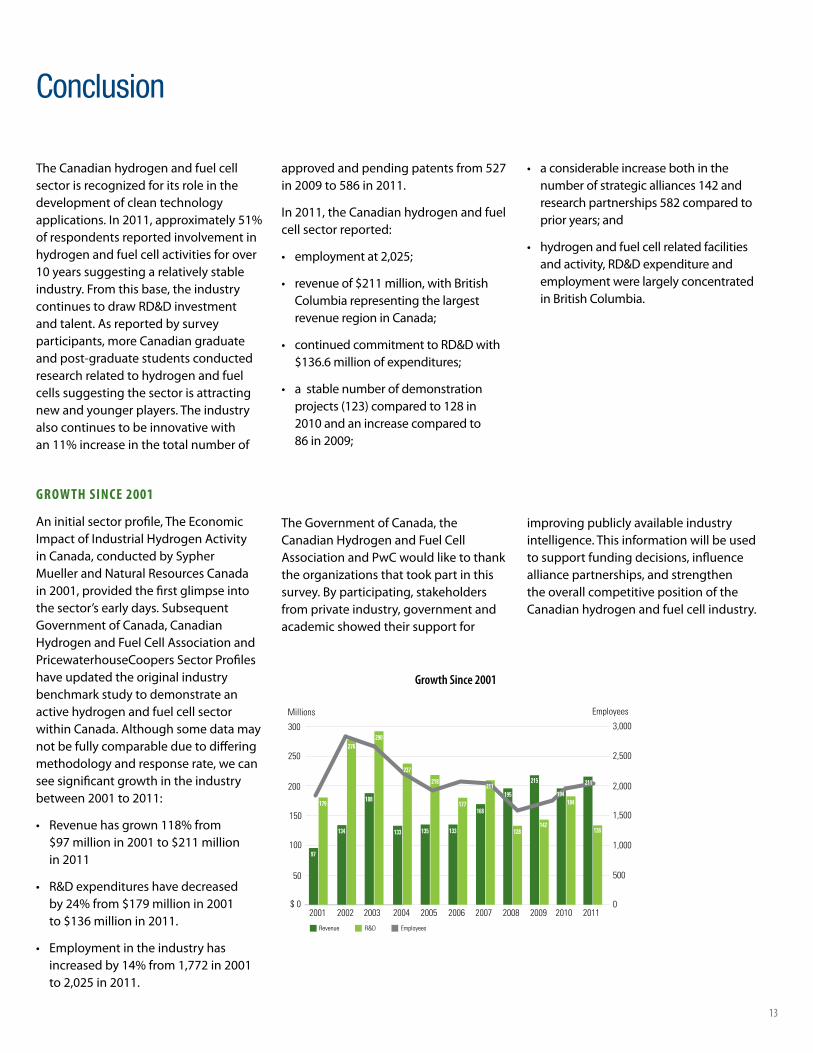
13
The Canadian hydrogen and fuel cell sector is recognized for its role in the development of clean technology applications.In2011,approximately51%of respondents reported involvement in hydrogen and fuel cell activities for over 10 years suggesting a relatively stable industry. From this base, the industry continuestodrawRD&Dinvestmentand talent. As reported by survey participants, more Canadian graduate and post-graduate students conducted research related to hydrogen and fuel cells suggesting the sector is attracting new and younger players. The industry also continues to be innovative with an11%increaseinthetotalnumberof
approvedandpendingpatentsfrom527in2009to586in2011.
In 2011, the Canadian hydrogen and fuel cell sector reported:
• employmentat2,025;
• revenueof$211million,withBritishColumbia representing the largest revenue region in Canada;
• continuedcommitmenttoRD&Dwith$136.6millionofexpenditures;
• astablenumberofdemonstrationprojects(123)comparedto128in2010 and an increase compared to 86 in 2009;
• aconsiderableincreasebothinthenumber of strategic alliances 142 and researchpartnerships582comparedtoprior years; and
• hydrogenandfuelcellrelatedfacilitiesandactivity,RD&Dexpenditureandemployment were largely concentrated in British Columbia.
gROw tH sinCe 2001
Aninitialsectorprofile,TheEconomicImpact of Industrial Hydrogen Activity in Canada, conducted by Sypher MuellerandNaturalResourcesCanadain 2001, provided the first glimpse into the sector’s early days. Subsequent Government of Canada, Canadian Hydrogen and Fuel Cell Association and PricewaterhouseCoopers Sector Profiles have updated the original industry benchmark study to demonstrate an active hydrogen and fuel cell sector within Canada. Although some data may not be fully comparable due to differing methodology and response rate, we can see significant growth in the industry between 2001 to 2011:
• Revenuehasgrown118%from$97 millionin2001to$211millionin 2011
• R&Dexpenditureshavedecreasedby24%from$179millionin2001to $136 millionin2011.
• Employmentintheindustryhasincreasedby14%from1,772in2001to2,025in2011.
Conclusion
Access to markets
Lack of funding
Technology development
p.2 Areas of Expertise
p.3 Technology Focus
p.4 Total Revenue ($ millions)
Hydrogen production
Research organization
Policy development andprogram administration
Fuel cell user
Professional services provider
Hydrogen distribution
Fuel cell developer or manufacturer
5 10 15 20 250
Other
Systems integrator
Education, safety and training
Commercialization support
Supplier to developer or manufacturer
Hydrogen storage
Fuel cell distributor or agent
22%
12%
12%
9%
8%
7%
6%
5%
4%
3%
3%
2%
2%
3%
0 5 10 15 20 25 30 35 40 45
Proton Exchange Membrane
Solid Oxide Fuel Cells
Hydrogen Production
Hydrogen Distribution
Hydrogen Storage
Metal-Air
Molten Carbonate
Direct Liquid
Other
1%
7%
7%
37%
8%
2%
2%
14%
20%
0
50
100
150
200
250
2008
p.8 Employment
28. Growth since 2001
1,500
1,000
0
2,500
2006
2007 20092006
2007 2008 2010
0
50
100
150
200
250
300
2005 2006 2007 201020042003200220010
500
1,000
1,500
2,000
2,500
3,000
R&DRevenue Employees
$
p.7 Patents
200
100
0
300
400
235
351
Alberta
Canadian government (all levels)
Corporate operations
Parent, affiliatedor subsidiary
Research, non-profit,non-governmental institute
Contract work conductedfor another institute
0 20 40 60 80 100
12. Sources of Funding for R&D Expenditure by Organization
23%
68%
7%
7%
9%
Foreign government
University oracademic institute
1%
3%
14%
0% 20% 40% 60% 80% 100%
100%61%
GovernmentCorporate Academic and non-profit
290
179
134
276
188
97
133 135 133
177
128
2011
215
142
Feb 2011
Patentsapproved
Patentspending
p.11 Priorities to enhance competitive performance in 2012
0 5 10 15 20 25
Collaboration/strategic alliances
Gain market share
Better targetingof customers
Improving processes
Better marketor customer data
Plans for expansion(new products/new markets)
Other
Outsourcing
8%
1%
8%
21%
8%
Reduce costof operations
7%
6%
19%
12%
10%
p.? challenges faced in 2010
0% 5 10 15 20 25 30
Profitability
Economy
Exchange rates
6%
31%
6%
Other 9%
24%
10%
10%
GermanyUSA
British ColumbiaQuebecOntario
0 5 10 15 20 25 30 35 40 45 50 55 60
16. Demonstration Projects by Region (Number of Projects)
51
Other
GovernmentCorporate Academia and non-profit
%
%
%
Millions Employees
Utility 2%
Direct Methanol 2%
2,000
500
2009
2,001 1,9912,043
1,7651,556
2,025
2011
2010 2011
Competition 4%
Labour shortages
15
12
5
5
4 2
2
1
1
1
12
JapanUK
Rest of Canada
184
136
2008 2009
194
1
1
23
23
195
215 211
133
194
168
237
218211
168
195
211
Growth Since 2001
The Government of Canada, the Canadian Hydrogen and Fuel Cell Association and PwC would like to thank the organizations that took part in this survey. By participating, stakeholders from private industry, government and academic showed their support for
improving publicly available industry intelligence. This information will be used to support funding decisions, influence alliance partnerships, and strengthen the overall competitive position of the Canadian hydrogen and fuel cell industry.
14
C anadian HydROgen and fuel Cell assOCiatiOn (CHfC a)
The Canadian Hydrogen and Fuel Cell Association (CHFCA) is the national association accelerating Canada’s world-recognized hydrogen and fuel cell sector. As the sector’s collective voice, the CHFCA works to raise awareness of the economic, environmental and social benefits of hydrogen and fuel cells. We are a national, non-profit association providing services and support to Canadian corporations, governments and educational institutions promoting development, demonstrating and deploying hydrogen and fuel cell products and services in Canada. Our members cover most types of hydrogen and fuel cell technologies, components, systems supply and integration, fuelling systems, fuel storage, and engineering and financial services.
TheCHFCAwasformedinJanuaryof2009asaresultofamergerbetweenthe Canadian Hydrogen Association (CHA)andHydrogen&FuelsCellsCanada (H2FCC). The merger unites the members of the former associations to create a vibrant, influential association thatrepresentsthemajorityofthestakeholders in Canada’s hydrogen and fuel cell sector.
industRy C anada
Industry Canada’s goal is to enhance the competitiveness of Canadian industry. The organization is responsible for maintaining channels of communication with key sectors to facilitate informed advocacy of industry interests in government decision-making and to convey the government perspective back to industry; analyzing the challenges and opportunities that face key sectors in the economy; developing policy options for possible government response to extraordinary challenges and opportunities; and delivering the subsequent programs and services.
Mercedes-Benz F-Cell fuel cell electric vehicle
15
Eric Denhoff PresidentandCEO Canadian Hydrogen and Fuel Cell Association
16047607176 [email protected]
For more information on the Canadian hydrogen and fuel cell sector profile please contact:
PwC
PwC understands and supports the fuel cell industry in Canada and around the world. Our Clean Technology network of professional staff drawn from over 154,000peopleinover153countrieshas a firm grasp of the issues facing companies in the industry as it evolves towards commercialization. We are continually expanding our knowledge and client base with the goal of being the pre-eminent advisor to the industry in local, national and global markets.
Eric Barker SeniorAdvisor,EmergingTechnologiesDirectorate Industry Canada
16046661426 [email protected]
Mike Pacholek Partner PwC
16048067323 [email protected]
16
2012 Participants
A.V. Tchouvelev & Associates Inc.
Air Liquide Canada
Atlantic Hydrogen Inc.
Automotive Fuel Cell Cooperation (AFCC)
Ballard Power Systems Inc.
Bereskin & Parr
Canadian Hydrogen and Fuel Cells Association
CCS Global Group
Dana Canada Corporation
dPoint Technologies
Enbridge Gas Distribution
FCTEK Holdings Ltd.,
Greenlight Innovation
HRH Consulting
HTEC Hydrogen Technology & Energy Corp.
Hummingbird Hydrogen Corporation
Hydrogen Link
Hydrogen Research Institute
Hydrogenics Corporation
Hyteon Inc.
Industry Canada
Isowater Corporation
Ku Group
Lambton College of Applied Arts and Technology
McMaster University
Mercedes-Benz Canada
Nalcor Energy
National Research Council (NRC)
Natural Resources Canada, CANMET
Natural Sciences and Engineering Council of Canada
New Flyer Industries Canada UL
Next Hydrogen Corporation
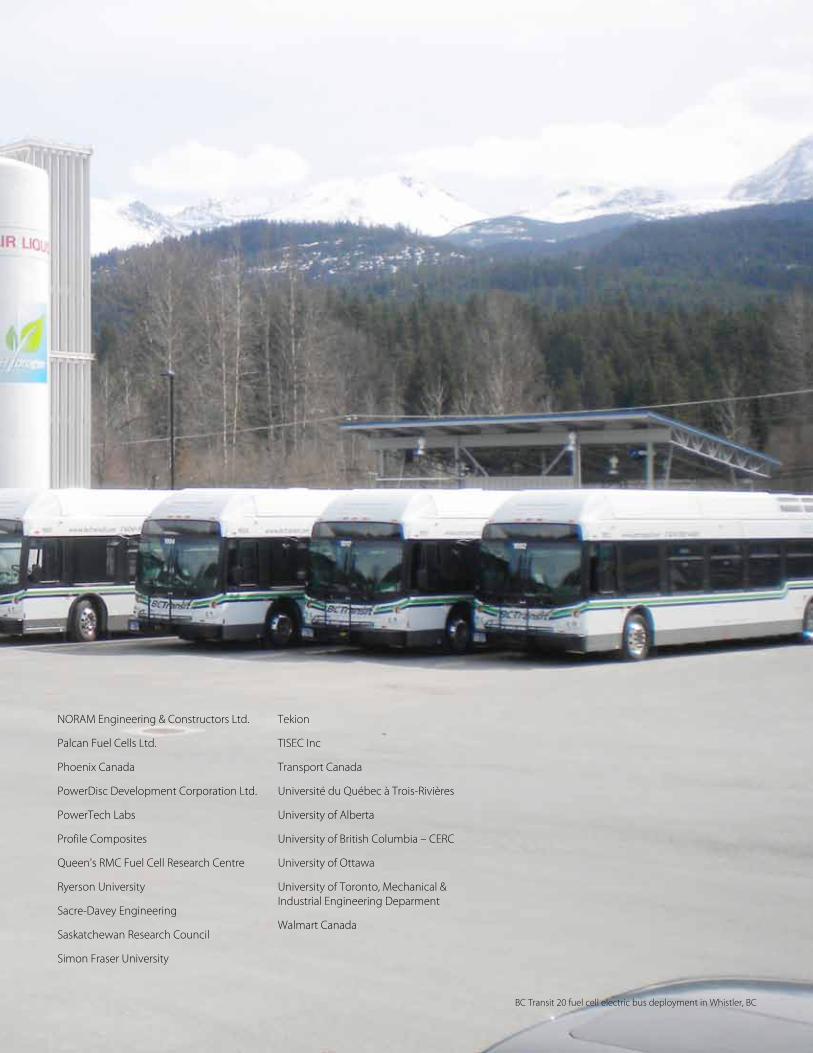
17
NORAM Engineering & Constructors Ltd.
Palcan Fuel Cells Ltd.
Phoenix Canada
PowerDisc Development Corporation Ltd.
PowerTech Labs
Profile Composites
Queen's RMC Fuel Cell Research Centre
Ryerson University
Sacre-Davey Engineering
Saskatchewan Research Council
Simon Fraser University
Tekion
TISEC Inc
Transport Canada
Université du Québec à Trois-Rivières
University of Alberta
University of British Columbia – CERC
University of Ottawa
University of Toronto, Mechanical & Industrial Engineering Deparment
Walmart Canada
2012 Participants
BC Transit 20 fuel cell electric bus deployment in Whistler, BC