Canadian Community Health Survey Cycle 1.2 Mental Health ...
93
Canadian Community Health Survey Cycle 1.2 Mental Health and Well-being Public Use Microdata File Documentation
Transcript of Canadian Community Health Survey Cycle 1.2 Mental Health ...

Canadian Community Health Survey Cycle 1.2
Mental Health and Well-being
Public Use Microdata File Documentation


Table of Contents 1. Introduction............................................................................................................................... 1 2. Background ............................................................................................................................... 2 3. Objectives ................................................................................................................................. 4 4. Survey Content.......................................................................................................................... 5
4.1 Consultation Processes ............................................................................................... 5 4.2 Content........................................................................................................................ 6
5. Sample Design ........................................................................................................................ 33 5.1 Target Population...................................................................................................... 33 5.2 Sample Size and Allocation ...................................................................................... 33 5.3 Sample Buy-ins......................................................................................................... 34 5.4 Sampling of Households from the Area Frame ........................................................ 35 5.5 Sampling of Respondents ......................................................................................... 37 5.6 Sample Allocation over the Collection Period ......................................................... 38
6. Data Collection ....................................................................................................................... 39 6.1 Questionnaire Design and Data Collection Method ................................................. 39 6.2 Supervision and Control ........................................................................................... 39 6.3 Field Tests................................................................................................................. 39 6.4 Interviewing .............................................................................................................. 40 6.5 Minimising Non-response......................................................................................... 40 6.6 Special Circumstances during Cycle 1.2 Collection Operations .............................. 41
7. Data Processing....................................................................................................................... 42 7.1 Editing....................................................................................................................... 42 7.2 Coding....................................................................................................................... 42 7.3 Creation of Derived and Grouped Variables ............................................................ 42 7.4 Imputation ................................................................................................................. 43 7.5 Weighting.................................................................................................................. 43 7.6 Suppression of Confidential Information.................................................................. 44
8. Weighting................................................................................................................................ 45 8.1 Adjustments Applied to the Initial Weight ............................................................... 45
9. Data Quality ............................................................................................................................ 50 9.1 Response Rates ......................................................................................................... 50 9.2 Survey Errors ............................................................................................................ 52
9.2.1 Non-sampling Errors...................................................................................... 52 9.2.2 Sampling Errors ............................................................................................. 53
10. Guidelines for Tabulation, Analysis and Release ................................................................. 54 10.1 Rounding Guidelines .............................................................................................. 54 10.2 Sample Weighting Guidelines for Tabulation ........................................................ 55
10.2.1 Definitions: Categorical Estimates, Quantitative Estimates ........................ 55 10.2.2 Tabulation of Categorical Estimates............................................................ 56
iii

CCHS Cycle 1.2, Mental Health and Well-being Public Use Microdata File Documentation
10.2.3 Tabulation of Quantitative Estimates .......................................................... 5710.3 Guidelines for Statistical Analysis.................................................................. 57
10.4 Release Guidelines.................................................................................................. 59 11 Approximate Sampling Variability Tables ............................................................................ 60
11.1 How to Use the CV Tables for Categorical Estimates............................................ 60 11.1.1 How to Use the disorder CV tables ............................................................. 62 11.1.2 How to Use the general CV tables............................................................... 65
11.2 Examples of Using the CV Tables for Categorical Estimates.............................. 67 11.3 How to Use the CV Tables to Obtain Confidence Limits .................................... 72 11.4 Example of Using the CV Tables to Obtain Confidence Limits .......................... 73 11.5 How to Use the CV Tables to do a Z-test............................................................. 73 11.6 Example of Using the CV Tables to do a Z-test................................................... 74 11.7 Exact Variances/Coefficients of Variation........................................................... 74 11.8 Release Cut-off for the CCHS.............................................................................. 76
12. File Usage ............................................................................................................................. 85 12.1 Use of Weights........................................................................................................ 85 12.2 Variable Naming Convention ................................................................................. 85
12.2.1 Variable Name Component Structure in CCHS .......................................... 85 12.2.2 Positions 1 to 3: Variable / Questionnaire Section Name............................ 86 12.2.3 Position 4: Cycle .......................................................................................... 87 12.2.4 Position 5: Variable Type ............................................................................ 87 12.2.5 Positions 6 to 8: Variable Name .................................................................. 88
12.3 Access to Master File Data ..................................................................................... 88 Appendix A: Questionnaire Appendix B: Record Layout Appendix C: Derived and Grouped Variables Appendix D: CV Tables Appendix E: Data Dictionary Alphabetical Index Topical Index
iv

CCHS Cycle 1.2, Mental Health and Well-being Public Use Microdata File Documentation
1. Introduction
The Canadian Community Health Survey (CCHS) is a cross-sectional survey that collects information related to health status, health care utilization and health determinants for the Canadian population. The CCHS operates on a two-year collection cycle. The first year of the survey cycle “.1” is a large sample, general population health survey, designed to provide reliable estimates at the health region level. The second year of the survey cycle “.2” is a smaller survey designed to provide provincial level results on specific focused health topics. This Microdata File contains data collected in the second year of collection for CCHS (Cycle 1.2). Information was collected between May 2002 and December 2002, for the ten provinces. Cycle 1.2 collects responses from persons aged 15 or older, living in private occupied dwellings. Excluded from the sampling frame are individuals living on Indian Reserves and on Crown Lands, Health Care institution residents, full-time members of the Canadian Armed Forces, and residents of certain remote regions. This document has been produced to facilitate the manipulation of the Cycle 1.2 cross-sectional microdata file, which is described in detail in the following text and appendices.
Any questions about the data sets or their use should be directed to:
• For technical/general data support:
Electronic Products Help Line: 1-800-949-9491
• For custom tabulations/general data support: Client Custom Services, Health Statistics Division: 1-613-951-1746 E-mail: [email protected]
• For remote access support: 1-613-951-1653 E-mail: [email protected]: 1-613-951-4198
1

CCHS Cycle 1.2, Mental Health and Well-being Public Use Microdata File Documentation
2. Background In 1991, the National Task Force on Health Information cited a number of issues and problems with the health information system. These problems were that: data was fragmented; data was incomplete; data could not be easily shared; data was not being analysed to the fullest extent; and the results of research are not consistently reaching Canadians. In responding to the needs, the Canadian Institute for Health Information (CIHI), Statistics Canada and Health Canada have joined forces to create a National Health Information Roadmap. The Roadmap is a direct response to the concerns and desires of more than 500 individuals representing a wide range of organizations and interest groups. Early in 1999, the three national organizations listed above conducted a broadly based national consultation on health information needs. Participants stressed that national agencies must work together to strengthen Canada’s health information system, and must build on and contribute to the considerable investments and expertise at local, regional, and provincial/territorial levels. The Roadmap represents an important contribution to building a comprehensive national health information system and infrastructure to provide Canadians with the information they need to maintain and improve Canada’s health system and the population’s health. What is needed is a co-ordinated plan of action. No single government or organization can combat the above-noted problems alone. Co-operation at all levels – national, provincial, territorial, regional and local health organizations – is a prerequisite for success. The plan of action starts by seeking answers to two crucial questions:
1. How healthy is the health care system? 2. How healthy are Canadians?
The first question encompasses the effectiveness, efficiency and responsiveness of the health care system. Generally, an effective, efficient and responsive health care system is one that offers the quality of care Canadians expect. The second question is broader, and addresses the basic objective of the system: Is the health of Canadians improving? To answer this, a strong health information system is needed. This information system must embrace six principle characteristics.
2

CCHS Cycle 1.2, Mental Health and Well-being Public Use Microdata File Documentation
The information system must be: • Secure and respectful of Canadians’ privacy; • Consistent; • Relevant; • Integrable; • Flexible; • User-friendly and accessible.
This health information system needs to be timely, provide person-oriented information, and have common data standards with other Canadian health surveys, such as the National Population Health Survey (NPHS). The new system must also provide: new or expanded data sets; data on health services; data on outcomes, health status and non-medical determinants of health; data on outcomes of selected health interventions; implement special studies involving priority issues; data on costs per service; information exchange protocols; expanded analytical and dissemination capacity, and public reports on the health care system. Given this mandate, the Canadian Community Health Survey (CCHS) was conceived. The format, content and objectives of the CCHS evolved through extensive consultation with key experts, federal, provincial and community health region stakeholders to determine their data requirements. The purpose of this publication, the Public Use Microdata File, is to follow through on the mandate of collecting reliable, relevant information on health services, health status, and health issues of importance to Canadians - at the provincial and national level - and disseminating this information to the public.
3
CCHS Cycle 1.2, Mental Health and Well-being Public Use Microdata File Documentation
3. Objectives The Cycle 1.2 mainly measures aspects linked to the mental health of Canadians. This cycle was then named “Canadian Community Health Survey - Mental Health and Well-being”. The primary objectives of the CCHS Mental Health and Well-being are to: • Provide timely, reliable, cross-sectional estimates of mental health determinants,
mental health status and mental health system utilization across Canada;
• Determine prevalence rates of selected mental disorders to assess the impact of burden of illness;
• Juxtapose access and utilization of mental health services with respect to
perceived needs; and
• Assess the disabilities associated with mental health problems to individuals and society.
As a key component of the Population Health Surveys Program of Statistics Canada, the CCHS helps fulfil broader requirements of health issues in Canada. These are to: • Aid in the development of public policy;
• Provide data for analytic studies that will assist in understanding the determinants
of health; • Collect data on the economic, social, demographic, occupational and
environmental correlates of health; • Increase the understanding of the relationship between health status and health
care utilization.
4
CCHS Cycle 1.2, Mental Health and Well-being Public Use Microdata File Documentation
4. Survey Content
The first sub-section of this section provides a general discussion of the consultation process used in survey content development and gives a summary of the final content selected for inclusion in this study.
4.1 Consultation Processes
One of the main CCHS Mental Health and Well-being objectives is to address priority mental health determinants, mental health status and mental health system utilization data gaps at the provincial level. Topic selection for the content of the Cycle 1.2 was conducted through a process of extensive consultations with regional, provincial, federal representatives and the research community. Expert consultation was seen as an integral part of the content development. The selection of priority areas in terms of mental disorders as well as mental well-being have been a result of discussions within the Mental Health Expert Group assembled for the survey, as well as the Population Health Advisory Committee. Consultations also include contacts with representatives of the World Health Organization, academia, federal and provincial governments, consumers and professional associations.
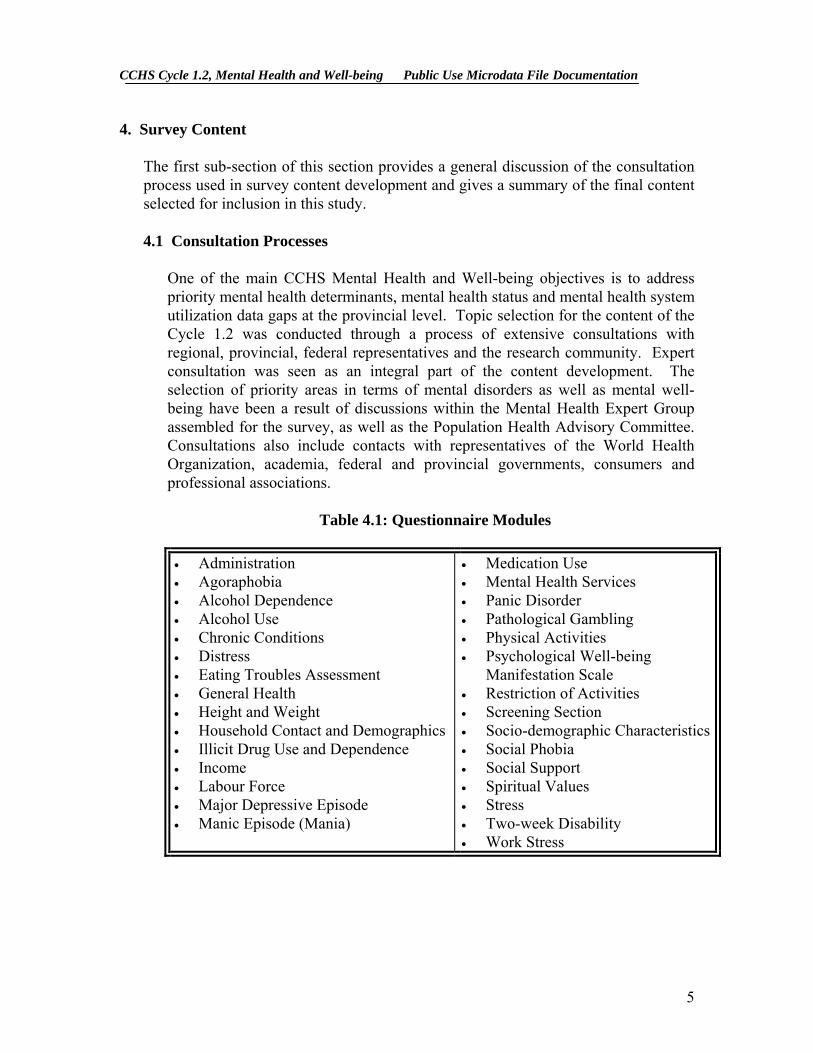
Table 4.1: Questionnaire Modules • Administration • Agoraphobia • Alcohol Dependence • Alcohol Use • Chronic Conditions • Distress • Eating Troubles Assessment • General Health • Height and Weight • Household Contact and Demographics • Illicit Drug Use and Dependence • Income • Labour Force • Major Depressive Episode • Manic Episode (Mania)
• Medication Use • Mental Health Services • Panic Disorder • Pathological Gambling • Physical Activities • Psychological Well-being
Manifestation Scale • Restriction of Activities • Screening Section • Socio-demographic Characteristics• Social Phobia • Social Support • Spiritual Values • Stress • Two-week Disability • Work Stress
5
CCHS Cycle 1.2, Mental Health and Well-being Public Use Microdata File Documentation
4.2 Content The content for Cycle 1.2 is partly based on a selection of mental disorders from the WMH-CIDI (World Mental Health – Composite International Diagnostic Interview Instrument). The WMH-CIDI is a lay-administered psychiatric interview that generates a profile of those with a disorder according to the definitions of the Diagnostic and Statistical Manual of Mental Disorders, 4th Edition (DSM-IV). The WMH-CIDI questions and algorithms were operationalised to meet the needs of CCHS 1.2. For the purposes of this survey, the questions and algorithms are referred to as “CCHS 1.2/WMH-CIDI”. Similar to the WMH-CIDI, the CCHS 1.2/WMH-CIDI can not be used to measure all aspects associated with the DSM-IV definitions and classification. The well-being and determinants of health in Cycle 1.2 are based on sources used on such surveys as the National Population Health Survey (NPHS), the CCHS (Cycle 1.1), the Health Promotion Survey (HPS) and other surveys. The following Table 4.2 provides a detailed breakdown of sources and changes from earlier usage in CCHS and NPHS.
6

CCHS Cycle 1.2, Mental Health and Well-being Public Use Microdata File Documentation
Table 4.2 CONTENT DESCRIPTION – CCHS 1.2 Order Modules Source/
past use Summary Description
(CCHS 1.2) Summary Description
(NPHS Cycle 4/CCHS 1.1) Changes from past CCHS and
NPHS cycles Reason(s) for change / Additional Comments
Introduction Social survey standards. Social survey standards. 1 Household/
Entry CCHS 1.1 Information collected on each
household member: Date of birth Sex Marital status Relationship of everyone to everyone else in the household Highest grade of elementary or high school completed Highest degree, certificate or diploma Type of dwelling Owner/tenant Number of bedrooms in dwelling Language of interview
2 GEN
General Health CCHS 1.1 Respondent’s general health status. General health status compared to one year ago. Sleep patterns. General level of stress in life. Sense of belonging to one’s community.
Respondent’s general health status. General health status compared to one year ago. Sleep patterns. General level of stress in life. Sense of belonging to one’s community.
GENB_04 – GENB_06: Replaced scale with one that is used in Social support. New scale : None of the time A little of the time Some of the time Most of the time All of the time Old scale : Most of the time Sometimes Never
Scale was replaced with more specific/definitive one to give respondents more options; better capture what they are feeling.
3 SCR
Screener for mental disorders
WMH-CIDI In order to reduce response burden, screening questions are used to identify and filter respondents who may experience symptoms that are associated with specific mental disorders.
New Module A screener question is found for generalized anxiety disorder although CCHS 1.2 did not collect other information about this specific disorder. Only the Canadian Forces 2002 Canadian Community Health
7
CCHS Cycle 1.2, Mental Health and Well-being Public Use Microdata File Documentation
Order Modules Source/ past use
Summary Description (CCHS 1.2)
Summary Description (NPHS Cycle 4/CCHS 1.1)
Changes from past CCHS and NPHS cycles
Reason(s) for change / Additional Comments
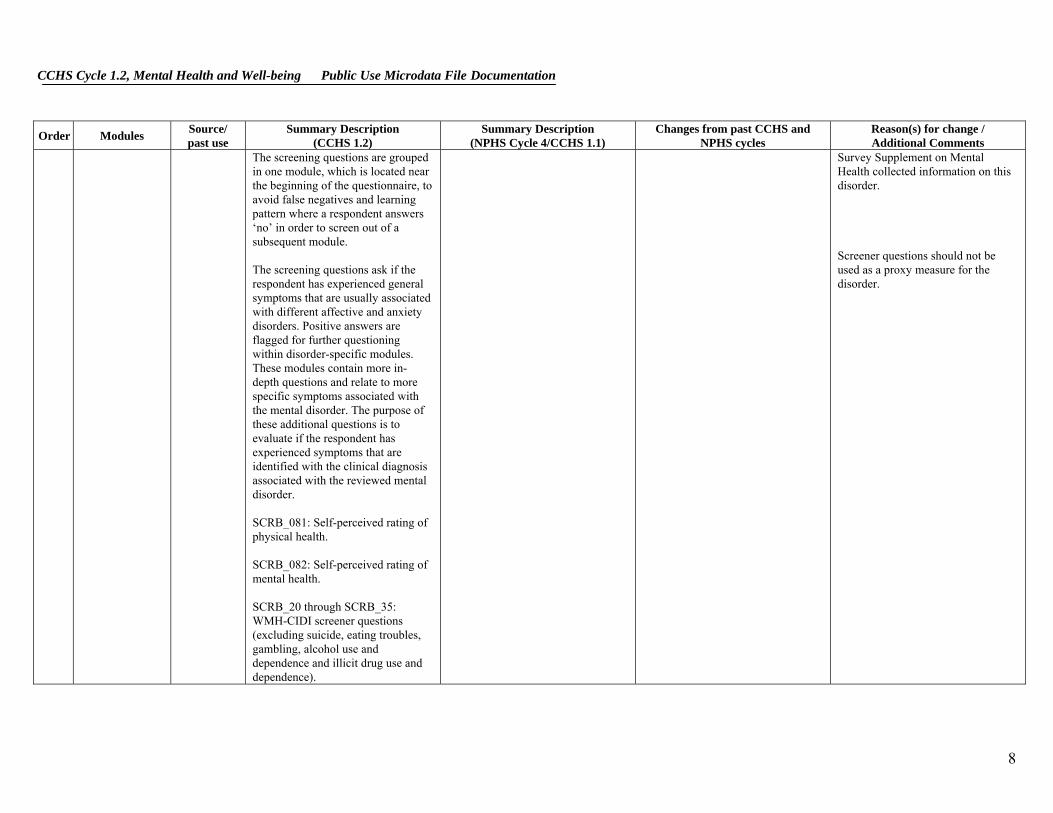
The screening questions are grouped in one module, which is located near the beginning of the questionnaire, to avoid false negatives and learning pattern where a respondent answers ‘no’ in order to screen out of a subsequent module. The screening questions ask if the respondent has experienced general symptoms that are usually associated with different affective and anxiety disorders. Positive answers are flagged for further questioning within disorder-specific modules. These modules contain more in-depth questions and relate to more specific symptoms associated with the mental disorder. The purpose of these additional questions is to evaluate if the respondent has experienced symptoms that are identified with the clinical diagnosis associated with the reviewed mental disorder. SCRB_081: Self-perceived rating of physical health. SCRB_082: Self-perceived rating of mental health. SCRB_20 through SCRB_35: WMH-CIDI screener questions (excluding suicide, eating troubles, gambling, alcohol use and dependence and illicit drug use and dependence).
Survey Supplement on Mental Health collected information on this disorder. Screener questions should not be used as a proxy measure for the disorder.
8

CCHS Cycle 1.2, Mental Health and Well-being Public Use Microdata File Documentation
Order Modules Source/ past use
Summary Description (CCHS 1.2)
Summary Description (NPHS Cycle 4/CCHS 1.1)
Changes from past CCHS and NPHS cycles
Reason(s) for change / Additional Comments
4 CCC
Chronic conditions
CCHS 1.1 NPHS Cycle 4
Allergies Asthma Fibromyalgia Arthritis or rheumatism Back problems excluding fibromyalgia and arthritis High blood pressure Migraine headaches Chronic bronchitis Emphysema or COPD Diabetes Epilepsy Heart disease Cancer Stomach or intestinal ulcers Effects of a stroke Bowel disorder, Crohn’s or Colitis Alzheimer's disease or other dementia Cataracts Glaucoma Thyroid condition Chronic fatigue syndrome Multiple chemical sensitivities Following not measured in NPHS or CCHS 1.1: Schizophrenia Other psychosis Obsessive-compulsive disorder Dysthymia Post-traumatic stress disorder Autism or any other developmental disorder such as Asperger’s syndrome or Rett syndrome Learning disability Type of learning disability (Attention Deficit Disorder, no hyperactivity
Allergies Asthma Fibromyalgia Arthritis or rheumatism Back problems excluding fibromyalgia and arthritis High blood pressure Migraine headaches Chronic bronchitis Emphysema or COPD Diabetes Epilepsy Heart disease Cancer Stomach or intestinal ulcers Effects of a stroke Urinary incontinence (not measured in CCHS 1.2) Bowel disorder, Crohn’s or Colitis Alzheimer's disease or other dementia Cataracts Glaucoma Thyroid condition Parkinson’s disease (not measured in CCHS 1.2) Multiple sclerosis (not measured in CCHS 1.2) Chronic fatigue syndrome Multiple chemical sensitivities Other long term condition
Not included: All questions related to the age when the diagnosis was made, sub-type of condition or specific type. Not included: CCCA_161: urinary incontinence CCCA_231: Parkinson’s disease CCCA_241: Multiple sclerosis Added new categories on mental disorders: CCCB_271: Schizophrenia CCCB_281: Other psychosis CCCB_291: Obsessive-compulsive disorder CCCB_301: Dysthymia CCCB_311: Post-traumatic stress disorder CCCB_321: Autism or any other developmental disorder such as Asperger’s syndrome or Rett syndrome CCCB_331: Learning disability CCCB_33A-D: Type of learning disability (Attention Deficit Disorder, no hyperactivity (ADD), Attention Deficit Hyperactivity Disorder (ADHD), Dyslexia, Other) CCCB_341: Eating disorder such as anorexia or bulimia
Time saving measure. Low counts and little relevance to mental health. Can be picked up by other categories. Long term conditions are needed to better understand the impacts associated with the experience of mental health symptoms. There are links between long term conditions and mental health problems. These were added because they were not measured in the diagnostic modules and mental health experts had shown interest in these areas.
9

CCHS Cycle 1.2, Mental Health and Well-being Public Use Microdata File Documentation
Order Modules Source/ past use
Summary Description (CCHS 1.2)
Summary Description (NPHS Cycle 4/CCHS 1.1)
Changes from past CCHS and NPHS cycles
Reason(s) for change / Additional Comments
(ADD), Attention Deficit Hyperactivity Disorder (ADHD), Dyslexia, Other) Eating disorder such as anorexia or bulimia Other long term physical or mental problem
5 HWT
Height and Weight
CCHS 1.1 NPHS Cycle 4
Height/weight (self-reported). Self-perceived body image.
Height/weight (self reported). Self-perceived body image.
Added: HWTB_01: question on pregnancy. This question was included in 1.1 but in a different location within the questionnaire.
In order to properly calculate BMI, need to know if respondent is pregnant. Correlate of mental health.
6 PAC
Physical Activity
CCHS 1.1 NPHS Cycle 4
Participation in physical activity in the past 3 months. Frequency of participation. STRB_66: respondents are asked if they jog or do other exercises to deal with stress.
Participation in physical activity in the past 3 months. Frequency of participation.
Added: PACB_6: added sentence at beginning of question; “Now I’m going to read you 4 sentences that can be used to describe the amount of physical activity that people usually do.”
Correlate of mental health.
7 PWB
Psychological Well being Scale
Massé’s Well-being scale New
Self-esteem Balance Social involvement Sociability Self-control Happiness
N/A New module Massé’s scale was used because it encompassed the aspects of the Bradburn Scale as well as the Mastery module. Correlate of mental health.
8 DIS
Distress CCHS 1.1 Kessler’s scale called the K10 measuring the frequency of feeling: NPHS
Cycle 4 Sad Nervous Restless Hopeless Worthless Everything was an effort
Kessler and Mroczek scale called the K6 measures frequency of feeling: Sad Nervous Restless or fidgety Hopeless Worthless Everything was an effort
Replaced by Kessler’s 10-items scale (very similar to the old one): Frequency of feeling: Tired for no good reason Nervous So nervous that nothing could calm down Hopeless
Replaced with new scale to be consistent with Kessler (K10). Measures important aspect of mental health and can be superimposed with diagnostic modules.
10

CCHS Cycle 1.2, Mental Health and Well-being Public Use Microdata File Documentation
Order Modules Source/ past use
Summary Description (CCHS 1.2)
Summary Description (NPHS Cycle 4/CCHS 1.1)
Changes from past CCHS and NPHS cycles
Reason(s) for change / Additional Comments
And: Tired for no good reason So nervous that nothing could calm down “…or fidgety” So restless couldn’t sit still “…or depressed” Chronic aspects of distress are also examined (i.e. more often, less often, or same as usual in the past month).
Chronic aspects of distress are also examined (i.e. more often, less often, or same as usual in the past month).
Restless or fidgety So restless couldn’t sit still Sad or depressed So depressed that nothing could cheer up Everything was an effort Worthless New question order: DISB_10A (so sad…) became DISB_10H (so depressed…). DISB_10C became DISB_10E. DISB_10E became DISB_10J. DISB_10F became DISB_10I Added: INT: intro text emphasising the 1 -month reference period DISB_10A: tired out for no good reason DISB_10C: so nervous that nothing could calm you DISB_10F: so restless you could not sit still DISB_10G: sad or depressed DISB_10N: text emphasising 1 -month reference period Using a booklet to display response categories.
Clear emphasis on reference periods is important because there are so many different reference periods in the survey. Will reduce interview time and response burden.
9 STR
Stress New STRB_1: Rating of the ability to handle unexpected and difficult problems (adapted from NPHS 96). STRB_2: Rating of the ability to handle the day-to-day demands of life (adapted from NPHS 96).
New module
Items for ways of coping questions (STRB_61 to STRB_611) are derived and modified in wording from several coping scales. The majority of questions are selected from Folkman and Lazarus (1985) Ways of Coping Revisited (WOC-
11

CCHS Cycle 1.2, Mental Health and Well-being Public Use Microdata File Documentation
Order Modules Source/ past use
Summary Description (CCHS 1.2)
Summary Description (NPHS Cycle 4/CCHS 1.1)
Changes from past CCHS and NPHS cycles
Reason(s) for change / Additional Comments
STRB_3: Respondent’s self report of the source of stress in day-to-day life contributing most to feelings of stress: Time pressures / not enough time Own physical health problem or condition Own emotional or mental health problem or condition Financial situation (e.g., not enough money, debt) Own work situation (e.g., hours of work, working conditions) School Employment status (e.g., unemployment) Caring for own children Caring for others Other personal or family responsibilities Personal relationships Discrimination Personal and Family’s safety Frequency use of ways of dealing with stress: STRB_61: Try to solve the problem STRB_62: Talk to others STRB_63: Avoid being with people STRB_64: Sleep more than usual STRB_65A: Try to feel better by eating more or less than usual STRB_65B: Try to feel better by smoking more cigarettes than usual STRB_65C: Try to feel better by drinking alcohol STRB_65D: Try to feel better by using drugs or medication.
R). Several questions are selected from Amirkhan (1990) Coping Strategy Indicator (CSI), and Carver et al. (1989) COPE scale.
12

CCHS Cycle 1.2, Mental Health and Well-being Public Use Microdata File Documentation
Order Modules Source/ past use
Summary Description (CCHS 1.2)
Summary Description (NPHS Cycle 4/CCHS 1.1)
Changes from past CCHS and NPHS cycles
Reason(s) for change / Additional Comments
STRB_66: Jog or do other exercise STRB_67: Pray or seek spiritual help STRB_68: Try to relax by doing something enjoyable STRB_69: Try to look on the bright side of things STRB_610: Blame oneself STRB_611: Wish the situation would go away or somehow be finished
10
Each of the following “disorders” (10A Major Depressive Episode, 10B Manic Episode (Mania), 10C Panic Disorder, 10D Social Phobia, 10E Agoraphobia)
WMH-CIDI NOTE: CCHS 1.2 questionnaire is based on a modified version of the WMH-CIDI instrument recognized by the WMH2000 Project. Diagnostic disorders were selected on the basis that they were prevalent enough to provide reliable estimates, that they were balanced across disorders, that they were treatable and program/policy relevant and were guided by recommendations from the Survey’s Expert Committee.
N/A New modules
10A DEP
Major depressive episode (including suicide thoughts and attempts)
WMH-CIDI Episodes of: Being “sad, empty or depressed” Losing interest in most things Feeling discouraged about how things are going in life Duration: Episodes of 2 weeks or longer recurring month after month for a year or longer Frequency: Most of the day, nearly everyday
Used short CIDI scale for major depressive episode. This is a subscale of an earlier version of the CIDI instrument.
New module Note that the Suicide module was integrated into major depressive episode (see Suicide below). Streamlined skips and wording for services section of major depressive episode to take into consideration services mentioned in suicide section.
Integrating suicide into major depressive episode facilitates programming, ensures consistency in questions (between those who go through major depressive episode and those who don’t), and keeps sensitive questions on a similar topic together (instead of asking about suicide in major depressive episode and again in the suicide module).
13

CCHS Cycle 1.2, Mental Health and Well-being Public Use Microdata File Documentation
Order Modules Source/ past use
Summary Description (CCHS 1.2)
Summary Description (NPHS Cycle 4/CCHS 1.1)
Changes from past CCHS and NPHS cycles
Reason(s) for change / Additional Comments
Severity: Worst and most recent episodes Specific symptoms: At least 5 symptoms such as change in weight or appetite, energy level, ability to concentrate
Added booklet for suicide questions and refer to thoughts of suicide, suicide plan, and attempted suicide as Experience A, B, and C. Added word “seriously” to thoughts of suicide.
Booklet increases confidentiality if others within earshot of interview, eases respondent discomfort with potentially sensitive topic. Qualitative testing showed its necessity. Many people said it is normal to think of suicide as teenagers but that they did not “seriously” consider it.
10a SUI
Suicidal thoughts and attempts
CCHS 1.1 WMH-CIDI
Measure of lifetime and past 12 months suicidal thoughts, plan and attempt. Age when experiences happened/ last happened. Most recent time when experiences happened (in relation to the last or worst event). Medical attention received because of attempt. Hospitalization overnight or longer because of attempt. Professional resources sought or talked to after suicide attempt. Location where contacts took place.
Considered committing suicide or taking own life in past 12 months. Attempted to commit suicide or tried taking own life in past 12 months. Medical attention received following suicide attempt.
New module
Questions on suicide are integrated in the major depressive episode module (see major depressive episode above). A confidential approach was used to collect this information through the reference to various experiences (suicidal thoughts, plan and attempt) as Experience A, B, C and the use of a booklet.
10B MIA
Manic Episode (mania)
WMH-CIDI
Episodes of: Being “so happy or excited that it leads to trouble” Duration: Episodes of several days or longer
New module
14

CCHS Cycle 1.2, Mental Health and Well-being Public Use Microdata File Documentation
Order Modules Source/ past use
Summary Description (CCHS 1.2)
Summary Description (NPHS Cycle 4/CCHS 1.1)
Changes from past CCHS and NPHS cycles
Reason(s) for change / Additional Comments
Severity: Worst and most recent episodes Specific symptoms: At least 3 symptoms such as restlessness, increased interest in sex, being more friendly or outgoing than usual, and other behaviours that might not be usual for the individual
10C PAD
Panic Disorder WMH-CIDI
Episodes of: “Attacks of fear or panic” and “attacks of suddenly experiencing symptoms associated with a panic disorder” Duration: Multiple sudden, short attacks Severity: Number of symptoms and episodes. Specific symptoms: At least 4 worsening symptoms such as shortness of breath, heart pounding, chest pain or discomfort, choking or smothering sensations
New module
10D SOP
Social Phobia WMH-CIDI
Episodes of: “Persistent and impairing fears of social and performance situations” Severity: Number of symptoms and episodes Feeling of disappointment with oneself Specific symptoms:
New module
15
CCHS Cycle 1.2, Mental Health and Well-being Public Use Microdata File Documentation
Order Modules Source/ past use
Summary Description (CCHS 1.2)
Summary Description (NPHS Cycle 4/CCHS 1.1)
Changes from past CCHS and NPHS cycles
Reason(s) for change / Additional Comments
At least 2 symptoms such as feeling dizzy, having chest pain or discomfort, trembling, sweating or having trouble breathing normally
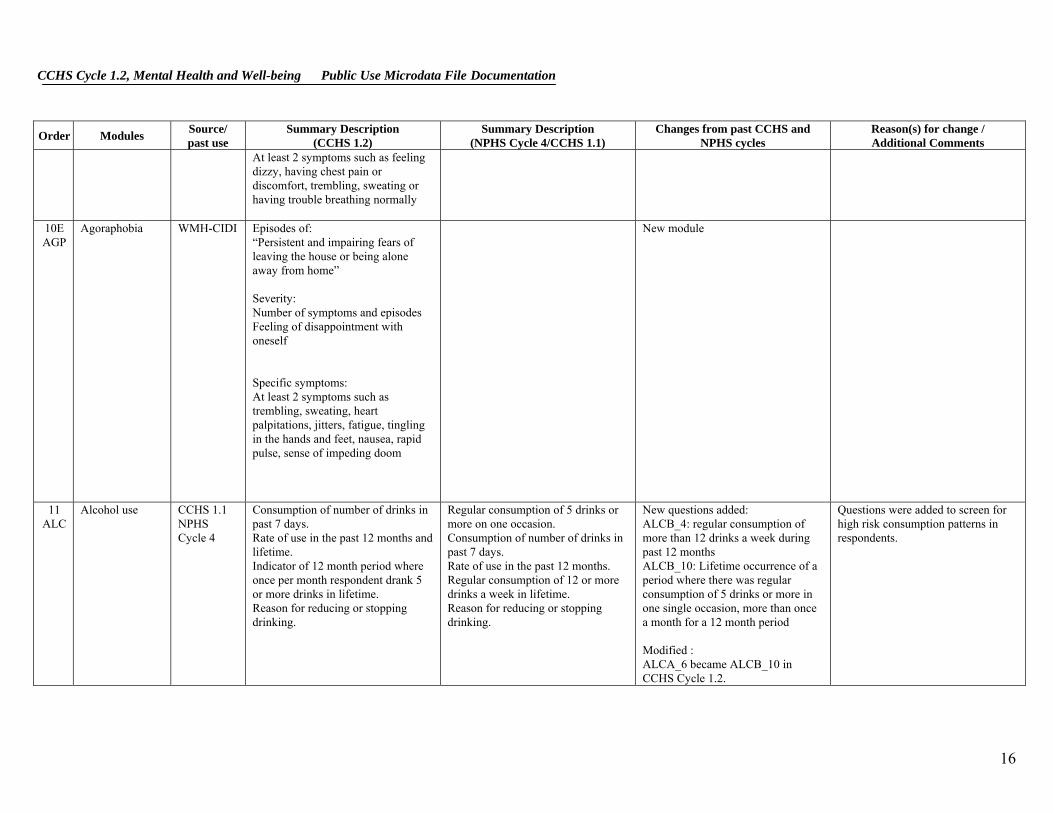
10E AGP
Agoraphobia WMH-CIDI
Episodes of: “Persistent and impairing fears of leaving the house or being alone away from home” Severity: Number of symptoms and episodes Feeling of disappointment with oneself Specific symptoms: At least 2 symptoms such as trembling, sweating, heart palpitations, jitters, fatigue, tingling in the hands and feet, nausea, rapid pulse, sense of impeding doom
New module
11 ALC
Alcohol use CCHS 1.1 NPHS Cycle 4
Consumption of number of drinks in past 7 days. Rate of use in the past 12 months and lifetime. Indicator of 12 month period where once per month respondent drank 5 or more drinks in lifetime. Reason for reducing or stopping drinking.
Regular consumption of 5 drinks or more on one occasion. Consumption of number of drinks in past 7 days. Rate of use in the past 12 months. Regular consumption of 12 or more drinks a week in lifetime. Reason for reducing or stopping drinking.
New questions added: ALCB_4: regular consumption of more than 12 drinks a week during past 12 months ALCB_10: Lifetime occurrence of a period where there was regular consumption of 5 drinks or more in one single occasion, more than once a month for a 12 month period Modified : ALCA_6 became ALCB_10 in CCHS Cycle 1.2.
Questions were added to screen for high risk consumption patterns in respondents.
16

CCHS Cycle 1.2, Mental Health and Well-being Public Use Microdata File Documentation
Order Modules Source/ past use
Summary Description (CCHS 1.2)
Summary Description (NPHS Cycle 4/CCHS 1.1)
Changes from past CCHS and NPHS cycles
Reason(s) for change / Additional Comments
12 ALD
Alcohol dependence
CCHS 1.1 WMH-CIDI
Lifetime and past 12 month’s alcohol dependence. Questions measure Kessler and Mroczek CIDI short form for DSM-IIIR Alcohol Dependence (7 symptoms). Added 5 symptoms from WMH-CIDI: drank more than intended, spent excessive time recovering from alcohol effects, reduced activities due to alcohol, drank despite exacerbating physical/mental condition Past 12 months interference in life and activities, such as: Home management activities Ability to attend school Ability to work at a job Ability to form and maintain close relationships Social life
Past 12 months alcohol dependence. Questions measure Kessler and Mroczek CIDI short form for DSM-IIIR Alcohol Dependence (7 symptoms).
Use of a booklet to display response categories. Added: ALDB_QINT2: new introduction. 5 symptoms from WMH-CIDI (ALDB_10 through ALDB_14): Experience of symptoms or situations associated with alcohol dependence. Examine lifetime occurrence. New question: “Has that ever happened?”: ALDB_01A, ALDB_03A, ALDB_04A, ALDB_05A, ALDB_06A, ALDB_07A, ALDB_09A, ALDB_10A, ALDB_11A, ALDB_12A, ALDB_13A, ALDB_14A Past 12 months interference in life and activities, such as: Home management activities Ability to attend school Ability to work at a job Ability to form and maintain close relationships Social life
Will reduce interview time and response burden. Booklet also provides confidentiality for sensitive modules and is less intrusive (especially desired by young respondents during testing). To provide indication of respondents experiencing symptoms or situations associated with alcohol dependence occurring in their lifetime. Assess lifetime alcohol dependence. Add questions to be consistent with disorder modules.
17
CCHS Cycle 1.2, Mental Health and Well-being Public Use Microdata File Documentation
Order Modules Source/ past use
Summary Description (CCHS 1.2)
Summary Description (NPHS Cycle 4/CCHS 1.1)
Changes from past CCHS and NPHS cycles
Reason(s) for change / Additional Comments
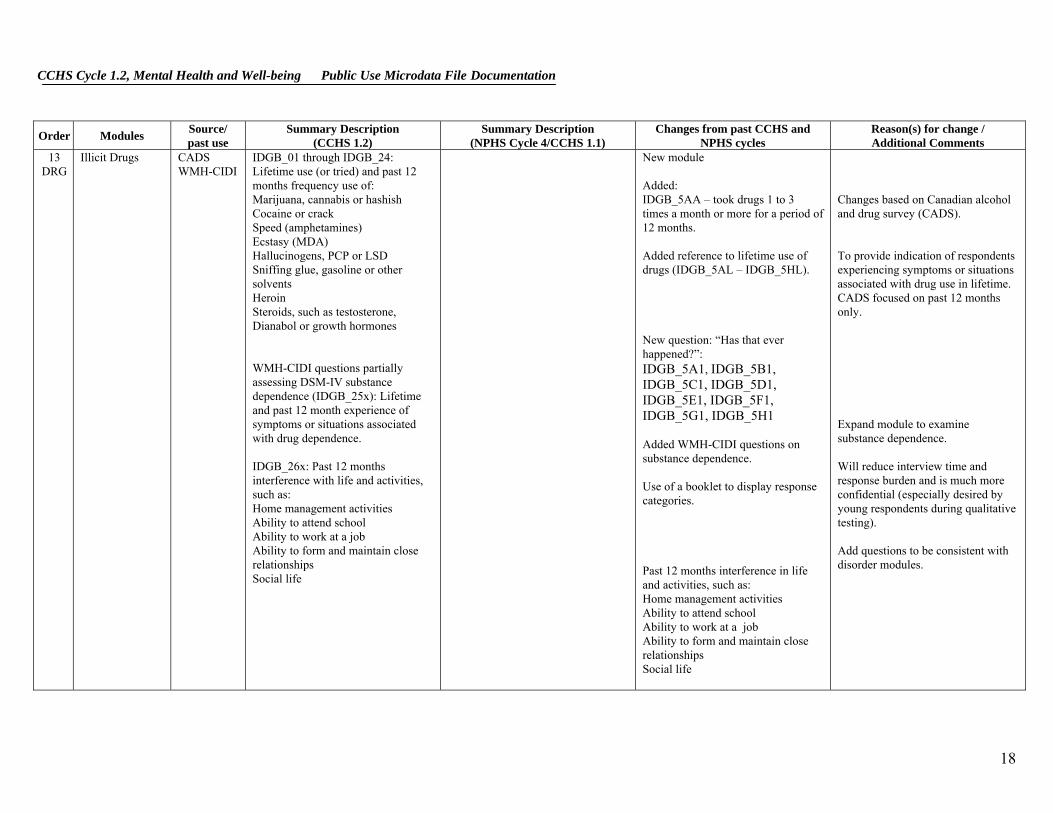
13 DRG
Illicit Drugs
CADS WMH-CIDI
IDGB_01 through IDGB_24: Lifetime use (or tried) and past 12 months frequency use of: Marijuana, cannabis or hashish Cocaine or crack Speed (amphetamines) Ecstasy (MDA) Hallucinogens, PCP or LSD Sniffing glue, gasoline or other solvents Heroin Steroids, such as testosterone, Dianabol or growth hormones WMH-CIDI questions partially assessing DSM-IV substance dependence (IDGB_25x): Lifetime and past 12 month experience of symptoms or situations associated with drug dependence. IDGB_26x: Past 12 months interference with life and activities, such as: Home management activities Ability to attend school Ability to work at a job Ability to form and maintain close relationships Social life
New module Added: IDGB_5AA – took drugs 1 to 3 times a month or more for a period of 12 months. Added reference to lifetime use of drugs (IDGB_5AL – IDGB_5HL). New question: “Has that ever happened?”: IDGB_5A1, IDGB_5B1, IDGB_5C1, IDGB_5D1, IDGB_5E1, IDGB_5F1, IDGB_5G1, IDGB_5H1 Added WMH-CIDI questions on substance dependence. Use of a booklet to display response categories. Past 12 months interference in life and activities, such as: Home management activities Ability to attend school Ability to work at a job Ability to form and maintain close relationships Social life
Changes based on Canadian alcohol and drug survey (CADS). To provide indication of respondents experiencing symptoms or situations associated with drug use in lifetime. CADS focused on past 12 months only. Expand module to examine substance dependence. Will reduce interview time and response burden and is much more confidential (especially desired by young respondents during qualitative testing). Add questions to be consistent with disorder modules.
18

CCHS Cycle 1.2, Mental Health and Well-being Public Use Microdata File Documentation
Order Modules Source/ past use
Summary Description (CCHS 1.2)
Summary Description (NPHS Cycle 4/CCHS 1.1)
Changes from past CCHS and NPHS cycles
Reason(s) for change / Additional Comments
14 CPG
Pathological gambling
CPGI (Canadian Problem Gambling Index)
Participation in different kinds of gambling (frequency in past 12 months) (modified from CPGI). Amount of money spent on gambling in past 12 months. Past 12 months attitudes and experiences of gambling which indicate severity of problem gambling (modified from CPGI). Family history of gambling. Past 12 month alcohol and drug use while gambling.
N/A New module Combined similar types of gambling activity questions (modified from Canadian problem gambling Index): Instant win or daily lottery tickets (2 questions in CPGI). Lottery tickets or raffle / fundraiser (2 questions in CPGI). Casino games other than coin slots/VLT (5 questions in CPGI: poker, blackjack, roulette, keno, and craps). Sports lotteries, pools, sporting events (2 questions in CPGI) Internet or arcade gambling (2 questions in CPGI). Other (not included in CPGI). Not included from CPGI: Screener on casino games. Use of booklet for response categories. Changed the names of some of the examples associated with gambling activities to suit region (i.e. added Mise-au-jeu for Quebec).
Gambling activities were conducive to grouping. Will reduce interview time and response burden. All changes were approved by the authors of the scale. Casino games questions were combined to one question on CCHS, hence screener was not needed. Booklet provides confidentiality for sensitive modules and is less intrusive (especially desired by young respondents during testing). Reduce length and response burden. To be more tailored to regional differences.
19

CCHS Cycle 1.2, Mental Health and Well-being Public Use Microdata File Documentation
Order Modules Source/ past use
Summary Description (CCHS 1.2)
Summary Description (NPHS Cycle 4/CCHS 1.1)
Changes from past CCHS and NPHS cycles
Reason(s) for change / Additional Comments
Past 12 months interference with life and activities, such as: Home management activities Ability to attend school Ability to work at a job Ability to form and maintain close relationships Social life
CPGI questions on amount of time (in minutes or hours) spent on gambling activities were not included. Combined amount of money spent to encompass all types of gambling activity instead of one variable per activity and to be total in 12 months instead of per month/per day and added response categories instead of open-ended. Some questions on correlates (like depression and suicidal thoughts) were not included since they are measured elsewhere in the questionnaire. Added the interference scale. “Do not gamble” is not used in same way as in CPGI. Changed skip pattern so that if respondent indicated that they gambled 1-5 times per month or less (or said don’t know or refuse) for each type of gambling activity from CPGB_01A to CPGB_01M or refused the first question (CPGB_01A), they were skipped out of the module and not asked the problem gambling questions. This skip pattern is not part of the CPGI.
Reduce length and response burden (CPGI can be scored without their inclusion). Reduce length and response burden (CPGI can be scored with this modification). Measured elsewhere in questionnaire. To indicate interference caused by gambling activity and to be consistent with other modules. CPG was identified during testing as a sensitive module and respondents felt that it was burdensome. In order to reduce the burden on respondents, interviewer fatigue and to maintain high response rates, this skip pattern was adopted.
20
CCHS Cycle 1.2, Mental Health and Well-being Public Use Microdata File Documentation
Order Modules Source/ past use
Summary Description (CCHS 1.2)
Summary Description (NPHS Cycle 4/CCHS 1.1)
Changes from past CCHS and NPHS cycles
Reason(s) for change / Additional Comments
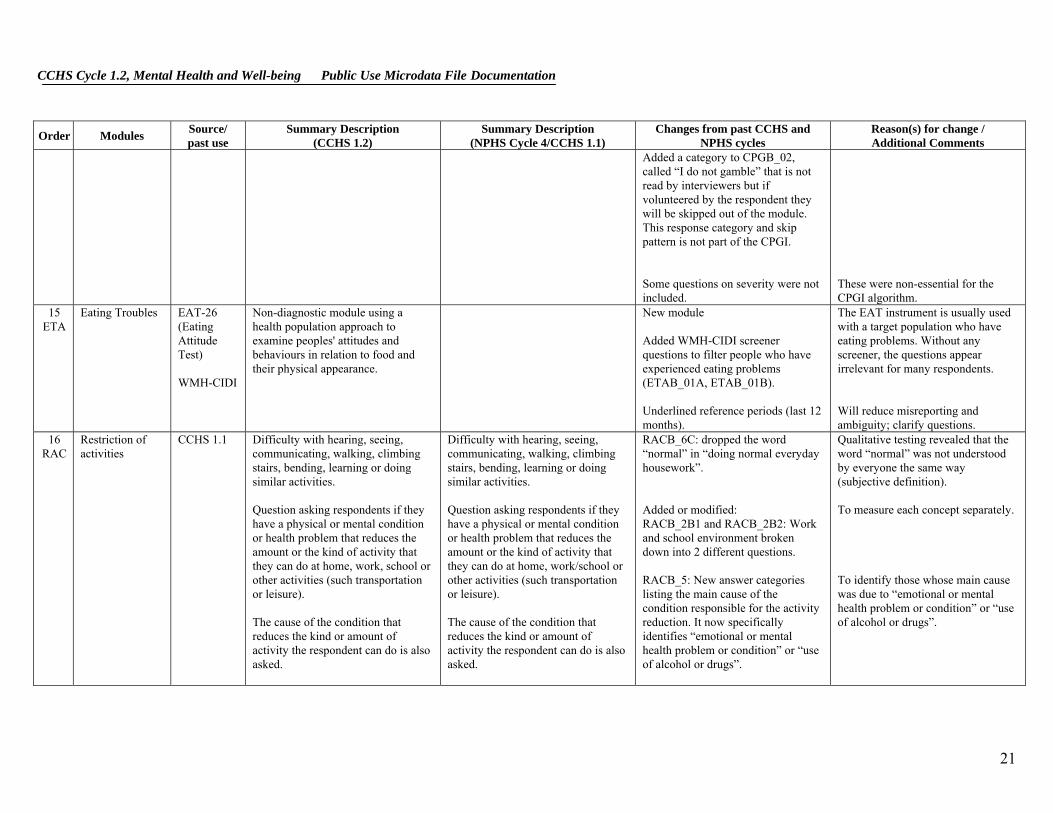
Added a category to CPGB_02, called “I do not gamble” that is not read by interviewers but if volunteered by the respondent they will be skipped out of the module. This response category and skip pattern is not part of the CPGI. Some questions on severity were not included.
These were non-essential for the CPGI algorithm.
15 ETA
Eating Troubles EAT-26 (Eating Attitude Test) WMH-CIDI
Non-diagnostic module using a health population approach to examine peoples' attitudes and behaviours in relation to food and their physical appearance.
New module Added WMH-CIDI screener questions to filter people who have experienced eating problems (ETAB_01A, ETAB_01B). Underlined reference periods (last 12 months).
The EAT instrument is usually used with a target population who have eating problems. Without any screener, the questions appear irrelevant for many respondents. Will reduce misreporting and ambiguity; clarify questions.
16 RAC
Restriction of activities
CCHS 1.1 Difficulty with hearing, seeing, communicating, walking, climbing stairs, bending, learning or doing similar activities. Question asking respondents if they have a physical or mental condition or health problem that reduces the amount or the kind of activity that they can do at home, work, school or other activities (such transportation or leisure). The cause of the condition that reduces the kind or amount of activity the respondent can do is also asked.
Difficulty with hearing, seeing, communicating, walking, climbing stairs, bending, learning or doing similar activities. Question asking respondents if they have a physical or mental condition or health problem that reduces the amount or the kind of activity that they can do at home, work/school or other activities (such transportation or leisure). The cause of the condition that reduces the kind or amount of activity the respondent can do is also asked.
RACB_6C: dropped the word “normal” in “doing normal everyday housework”. Added or modified: RACB_2B1 and RACB_2B2: Work and school environment broken down into 2 different questions. RACB_5: New answer categories listing the main cause of the condition responsible for the activity reduction. It now specifically identifies “emotional or mental health problem or condition” or “use of alcohol or drugs”.
Qualitative testing revealed that the word “normal” was not understood by everyone the same way (subjective definition). To measure each concept separately. To identify those whose main cause was due to “emotional or mental health problem or condition” or “use of alcohol or drugs”.
21
CCHS Cycle 1.2, Mental Health and Well-being Public Use Microdata File Documentation
Order Modules Source/ past use
Summary Description (CCHS 1.2)
Summary Description (NPHS Cycle 4/CCHS 1.1)
Changes from past CCHS and NPHS cycles
Reason(s) for change / Additional Comments
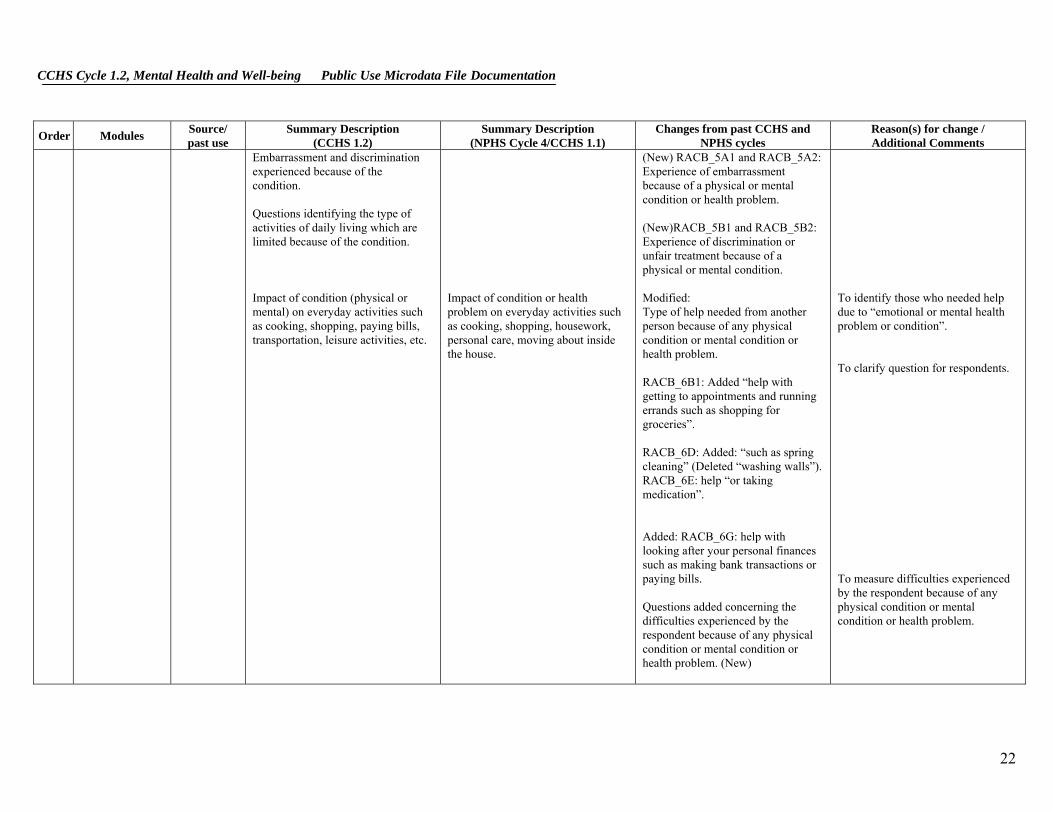
Embarrassment and discrimination experienced because of the condition. Questions identifying the type of activities of daily living which are limited because of the condition. Impact of condition (physical or mental) on everyday activities such as cooking, shopping, paying bills, transportation, leisure activities, etc.
Impact of condition or health problem on everyday activities such as cooking, shopping, housework, personal care, moving about inside the house.
(New) RACB_5A1 and RACB_5A2: Experience of embarrassment because of a physical or mental condition or health problem. (New)RACB_5B1 and RACB_5B2: Experience of discrimination or unfair treatment because of a physical or mental condition. Modified: Type of help needed from another person because of any physical condition or mental condition or health problem. RACB_6B1: Added “help with getting to appointments and running errands such as shopping for groceries”. RACB_6D: Added: “such as spring cleaning” (Deleted “washing walls”). RACB_6E: help “or taking medication”. Added: RACB_6G: help with looking after your personal finances such as making bank transactions or paying bills. Questions added concerning the difficulties experienced by the respondent because of any physical condition or mental condition or health problem. (New)
To identify those who needed help due to “emotional or mental health problem or condition”. To clarify question for respondents. To measure difficulties experienced by the respondent because of any physical condition or mental condition or health problem.
22

CCHS Cycle 1.2, Mental Health and Well-being Public Use Microdata File Documentation
Order Modules Source/ past use
Summary Description (CCHS 1.2)
Summary Description (NPHS Cycle 4/CCHS 1.1)
Changes from past CCHS and NPHS cycles
Reason(s) for change / Additional Comments
RACB_7A: difficulty making new friends or maintaining friendships. RACB_7B: difficulty dealing with people you don’t know well. RACB_7C: difficulty starting and maintaining a conversation. RACB_8: Cause of condition associated with required help or difficulty experienced by the respondent: Physical health Emotional or mental health Use of alcohol or drugs
17 TWD
2 week disability CCHS 1.1 Health during the past 14 days: Stay in bed because of illness or injury (number of days) Stay in bed was due to mental health or use of alcohol or drugs (number of days) Days when activities were cut down due to illness or injury (number of days) Days when activities were cut down due to mental health or use of alcohol or drugs (number of days)
Report on past 2 week disability. Number of days spent in bed. Number of days where respondent cut down on activities.
Deleted: TWDA_5: do you have a regular medical doctor? Added: TWDB_2A and TWDB_2B: # of days the respondent stayed in bed all day because of his/her emotional or mental health or use of alcohol or drugs. TWDB_4A and TWDB_4B: # of days the respondent cut down on things for all or most of the day because of his/her emotional or mental health or use of alcohol or drugs. TWDB_5A, TWDB_6, TWDB_6A and TWDB_6B: # of days when it took extra effort for the respondent to perform to his/her usual level
23
CCHS Cycle 1.2, Mental Health and Well-being Public Use Microdata File Documentation
Order Modules Source/ past use
Summary Description (CCHS 1.2)
Summary Description (NPHS Cycle 4/CCHS 1.1)
Changes from past CCHS and NPHS cycles
Reason(s) for change / Additional Comments
because of his/her emotional or mental health or use of alcohol or drugs. TWDB_1, TWDB_2: Replace “alité” with “dû garder le lit”. Moved: Entire module to the end of questionnaire so that respondents are more comfortable about reporting the cause of the two-week disability.
More familiar term for French respondents. Too much taboo/stigma associated with mental health to be easily reported as cause of two-week disability.
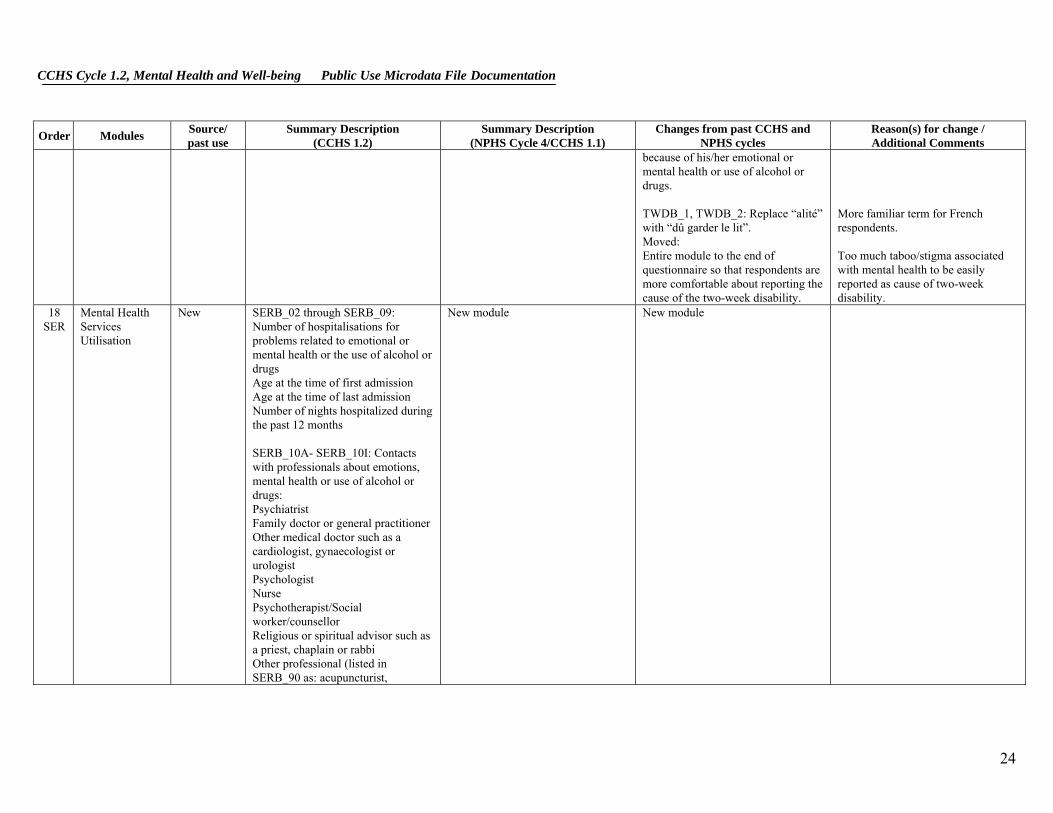
18 SER
Mental Health Services Utilisation
New SERB_02 through SERB_09: Number of hospitalisations for problems related to emotional or mental health or the use of alcohol or drugs Age at the time of first admission Age at the time of last admission Number of nights hospitalized during the past 12 months SERB_10A- SERB_10I: Contacts with professionals about emotions, mental health or use of alcohol or drugs: Psychiatrist Family doctor or general practitioner Other medical doctor such as a cardiologist, gynaecologist or urologist Psychologist Nurse Psychotherapist/Social worker/counsellor Religious or spiritual advisor such as a priest, chaplain or rabbi Other professional (listed in SERB_90 as: acupuncturist,
New module New module
24
CCHS Cycle 1.2, Mental Health and Well-being Public Use Microdata File Documentation
Order Modules Source/ past use
Summary Description (CCHS 1.2)
Summary Description (NPHS Cycle 4/CCHS 1.1)
Changes from past CCHS and NPHS cycles
Reason(s) for change / Additional Comments
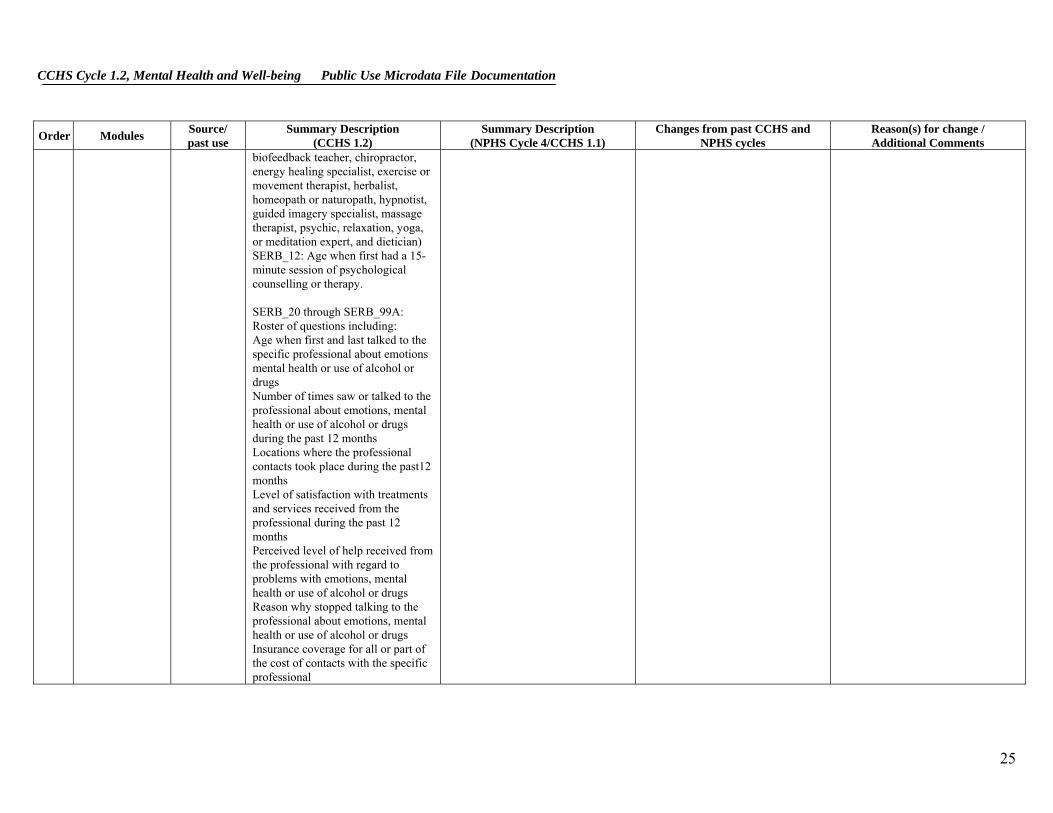
biofeedback teacher, chiropractor, energy healing specialist, exercise or movement therapist, herbalist, homeopath or naturopath, hypnotist, guided imagery specialist, massage therapist, psychic, relaxation, yoga, or meditation expert, and dietician) SERB_12: Age when first had a 15-minute session of psychological counselling or therapy. SERB_20 through SERB_99A: Roster of questions including: Age when first and last talked to the specific professional about emotions mental health or use of alcohol or drugs Number of times saw or talked to the professional about emotions, mental health or use of alcohol or drugs during the past 12 months Locations where the professional contacts took place during the past12 months Level of satisfaction with treatments and services received from the professional during the past 12 months Perceived level of help received from the professional with regard to problems with emotions, mental health or use of alcohol or drugs Reason why stopped talking to the professional about emotions, mental health or use of alcohol or drugs Insurance coverage for all or part of the cost of contacts with the specific professional
25

CCHS Cycle 1.2, Mental Health and Well-being Public Use Microdata File Documentation
Order Modules Source/ past use
Summary Description (CCHS 1.2)
Summary Description (NPHS Cycle 4/CCHS 1.1)
Changes from past CCHS and NPHS cycles
Reason(s) for change / Additional Comments
Professional recommending another professional or other type of clinic or program specializing in mental health services SERB_QA0C: Past 12 month’s use of an internet support group or chat room as help for problems with emotions, mental health or use of alcohol or drugs. SERB_A1A-SERB_A1D: Age when first and last used a support group as help for problems with emotions, mental health or use of alcohol or drugs and past 12 months use of support group. SERB_A2A- SERB_A2D: Age when first and last used a telephone helpline service for problems with emotions, mental health or use of alcohol or drugs and past 12 months use of helpline. SERB_A4A-SERB_A4I: Kind of help needed but not received during the past 12 months: Information about mental illness and its treatments Information on availability of services Medication Therapy or counselling Help with financial problems Help with housing problems Help with personal relationships Help with employment status or work situation
26
CCHS Cycle 1.2, Mental Health and Well-being Public Use Microdata File Documentation
Order Modules Source/ past use
Summary Description (CCHS 1.2)
Summary Description (NPHS Cycle 4/CCHS 1.1)
Changes from past CCHS and NPHS cycles
Reason(s) for change / Additional Comments
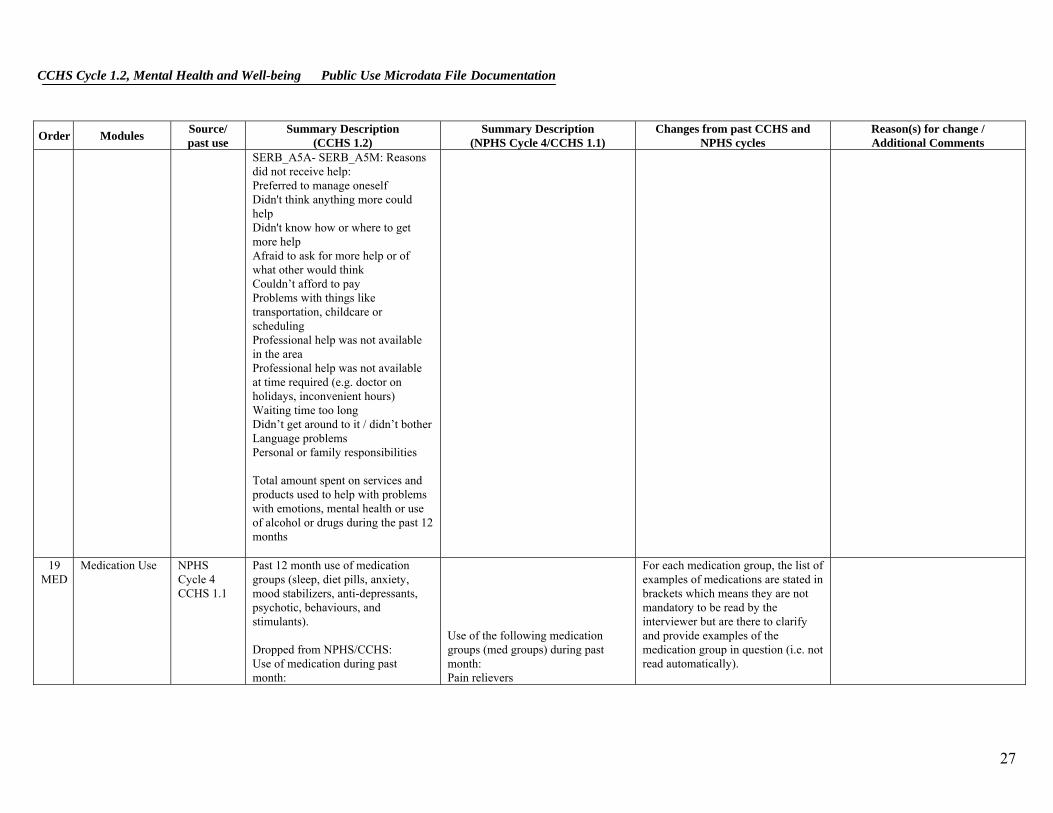
SERB_A5A- SERB_A5M: Reasons did not receive help: Preferred to manage oneself Didn't think anything more could help Didn't know how or where to get more help Afraid to ask for more help or of what other would think Couldn’t afford to pay Problems with things like transportation, childcare or scheduling Professional help was not available in the area Professional help was not available at time required (e.g. doctor on holidays, inconvenient hours) Waiting time too long Didn’t get around to it / didn’t bother Language problems Personal or family responsibilities Total amount spent on services and products used to help with problems with emotions, mental health or use of alcohol or drugs during the past 12 months
19 MED
Medication Use NPHS Cycle 4 CCHS 1.1
Past 12 month use of medication groups (sleep, diet pills, anxiety, mood stabilizers, anti-depressants, psychotic, behaviours, and stimulants). Dropped from NPHS/CCHS: Use of medication during past month:
Use of the following medication groups (med groups) during past month: Pain relievers
For each medication group, the list of examples of medications are stated in brackets which means they are not mandatory to be read by the interviewer but are there to clarify and provide examples of the medication group in question (i.e. not read automatically).
27
CCHS Cycle 1.2, Mental Health and Well-being Public Use Microdata File Documentation
Order Modules Source/ past use
Summary Description (CCHS 1.2)
Summary Description (NPHS Cycle 4/CCHS 1.1)
Changes from past CCHS and NPHS cycles
Reason(s) for change / Additional Comments
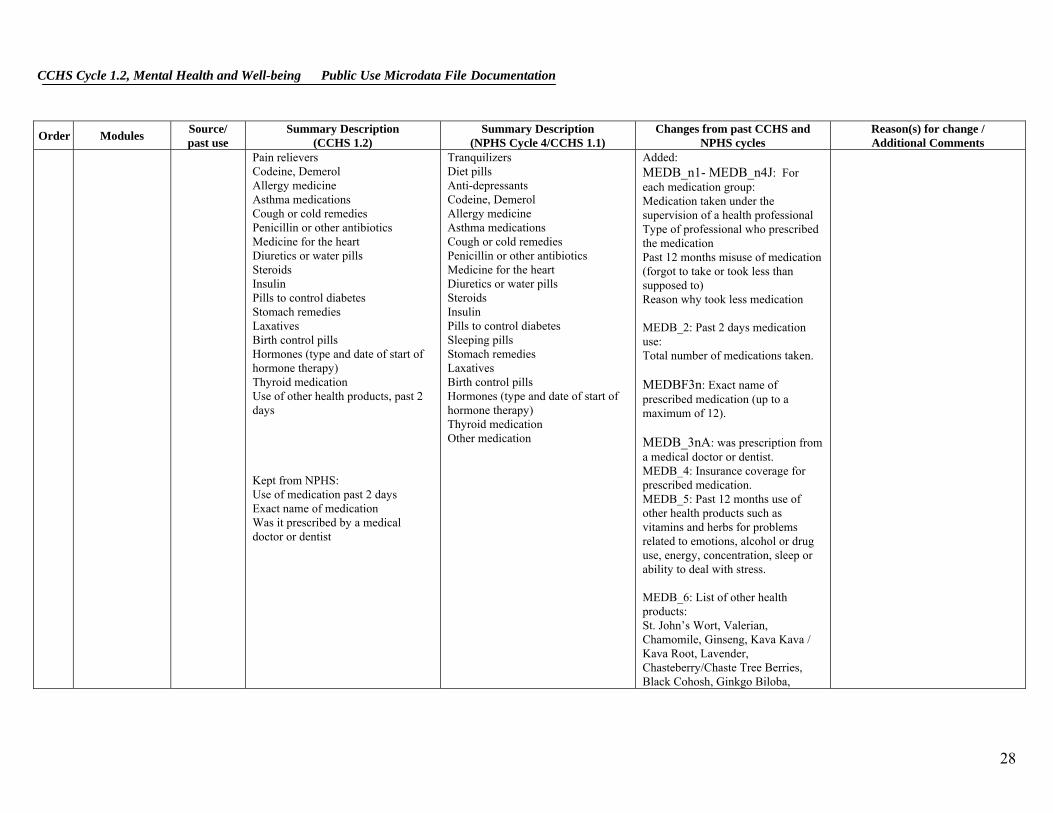
Pain relievers Codeine, Demerol Allergy medicine Asthma medications Cough or cold remedies Penicillin or other antibiotics Medicine for the heart Diuretics or water pills Steroids Insulin Pills to control diabetes Stomach remedies Laxatives Birth control pills Hormones (type and date of start of hormone therapy) Thyroid medication Use of other health products, past 2 days Kept from NPHS: Use of medication past 2 days Exact name of medication Was it prescribed by a medical doctor or dentist
Tranquilizers Diet pills Anti-depressants Codeine, Demerol Allergy medicine Asthma medications Cough or cold remedies Penicillin or other antibiotics Medicine for the heart Diuretics or water pills Steroids Insulin Pills to control diabetes Sleeping pills Stomach remedies Laxatives Birth control pills Hormones (type and date of start of hormone therapy) Thyroid medication Other medication
Added: MEDB_n1- MEDB_n4J: For each medication group: Medication taken under the supervision of a health professional Type of professional who prescribed the medication Past 12 months misuse of medication (forgot to take or took less than supposed to) Reason why took less medication MEDB_2: Past 2 days medication use: Total number of medications taken. MEDBF3n: Exact name of prescribed medication (up to a maximum of 12). MEDB_3nA: was prescription from a medical doctor or dentist. MEDB_4: Insurance coverage for prescribed medication. MEDB_5: Past 12 months use of other health products such as vitamins and herbs for problems related to emotions, alcohol or drug use, energy, concentration, sleep or ability to deal with stress. MEDB_6: List of other health products: St. John’s Wort, Valerian, Chamomile, Ginseng, Kava Kava / Kava Root, Lavender, Chasteberry/Chaste Tree Berries, Black Cohosh, Ginkgo Biloba,
28
CCHS Cycle 1.2, Mental Health and Well-being Public Use Microdata File Documentation
Order Modules Source/ past use
Summary Description (CCHS 1.2)
Summary Description (NPHS Cycle 4/CCHS 1.1)
Changes from past CCHS and NPHS cycles
Reason(s) for change / Additional Comments
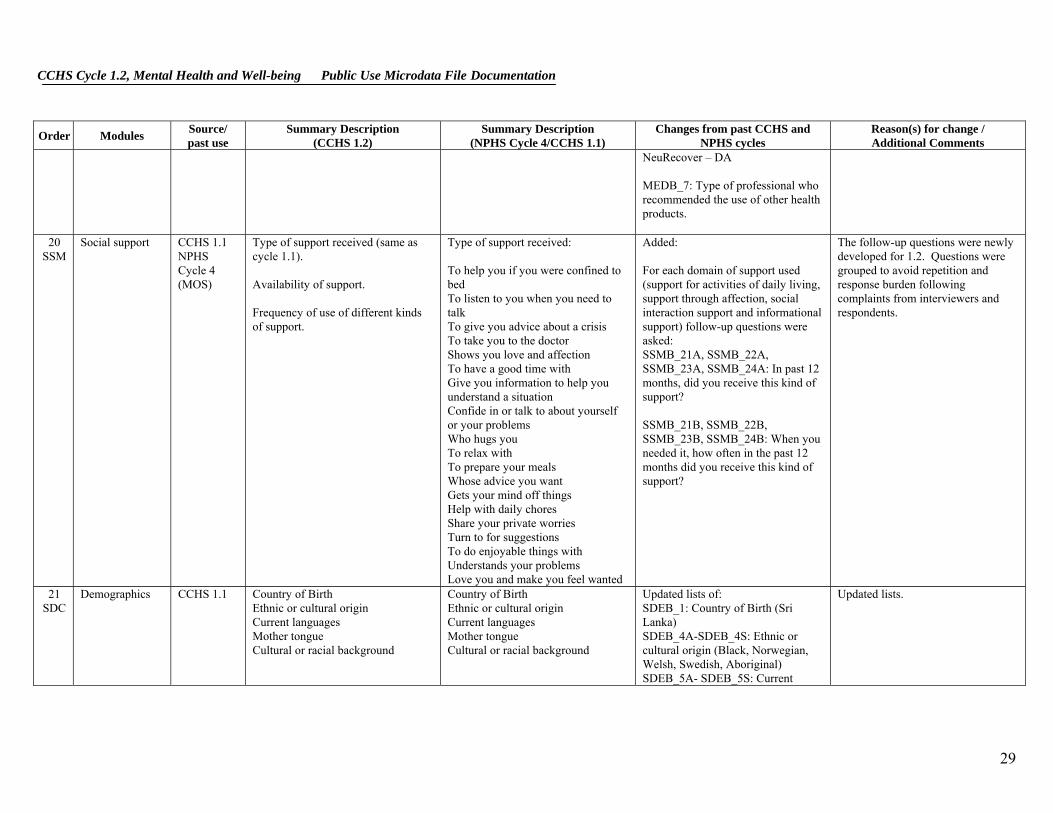
NeuRecover – DA MEDB_7: Type of professional who recommended the use of other health products.
20 SSM
Social support CCHS 1.1 NPHS Cycle 4 (MOS)
Type of support received (same as cycle 1.1). Availability of support. Frequency of use of different kinds of support.
Type of support received: To help you if you were confined to bed To listen to you when you need to talk To give you advice about a crisis To take you to the doctor Shows you love and affection To have a good time with Give you information to help you understand a situation Confide in or talk to about yourself or your problems Who hugs you To relax with To prepare your meals Whose advice you want Gets your mind off things Help with daily chores Share your private worries Turn to for suggestions To do enjoyable things with Understands your problems Love you and make you feel wanted
Added: For each domain of support used (support for activities of daily living, support through affection, social interaction support and informational support) follow-up questions were asked: SSMB_21A, SSMB_22A, SSMB_23A, SSMB_24A: In past 12 months, did you receive this kind of support? SSMB_21B, SSMB_22B, SSMB_23B, SSMB_24B: When you needed it, how often in the past 12 months did you receive this kind of support?
The follow-up questions were newly developed for 1.2. Questions were grouped to avoid repetition and response burden following complaints from interviewers and respondents.
21 SDC
Demographics CCHS 1.1 Country of Birth Ethnic or cultural origin Current languages Mother tongue Cultural or racial background
Country of Birth Ethnic or cultural origin Current languages Mother tongue Cultural or racial background
Updated lists of: SDEB_1: Country of Birth (Sri Lanka) SDEB_4A-SDEB_4S: Ethnic or cultural origin (Black, Norwegian, Welsh, Swedish, Aboriginal) SDEB_5A- SDEB_5S: Current
Updated lists.
29

CCHS Cycle 1.2, Mental Health and Well-being Public Use Microdata File Documentation
Order Modules Source/ past use
Summary Description (CCHS 1.2)
Summary Description (NPHS Cycle 4/CCHS 1.1)
Changes from past CCHS and NPHS cycles
Reason(s) for change / Additional Comments
languages (Dutch, Hindi, Russian, Tamil) SDEB_6A- SDEB_6S: Mother tongue (Dutch, Hindi, Russian, Tamil)
22 SPV
Spiritual Values CCHS 1.1 Questions on the role of spirituality in the respondent’s life: Past 12 months religious services attendance Role of spirituality in life Extent to which spirituality gives meaning to life, strength to face difficulties and help to understand difficulties in life Religious affiliation Self-perception of religious identity
Questions on the role of spirituality in the respondent’s life: Past 12 months religious services attendance Role of spirituality in life Self-perception of religious identity
Not included: SPRA_3: Self perception of how religious or spiritual the respondent is. Added: SPVB_2: Extent to which thought that spirituality helps find a meaning to life SPVB_3: Extent to which thought that spirituality gives strength to face everyday difficulties SPVB_4: Extent to which thought that spirituality helps understand the difficulties of life SPVB_5: Religion, if any SPVB_7: Self-perception of religious identity Modified: SPVB_QINT1, SPVB_1, SPVB_2, SPVB_3, SPVB_4: changed “spirituality” for “spiritual values”.
Qualitative testing revealed that respondents associated very religious connotation to “spirituality” whereas “spiritual values” had a more general meaning. To deal with this, significant changes were made to the module.
23 LBF
Labour Force participation
CCHS 1.1 Current employment status. Occupation. Work pattern past 12 months.
Current employment status. Occupation. Work pattern past 12 months.
Not included: LBFA_35: Restrictions on smoking at workplace
30

CCHS Cycle 1.2, Mental Health and Well-being Public Use Microdata File Documentation
Order Modules Source/ past use
Summary Description (CCHS 1.2)
Summary Description (NPHS Cycle 4/CCHS 1.1)
Changes from past CCHS and NPHS cycles
Reason(s) for change / Additional Comments
Health reason – not currently working; absent from work; not looking for work.
LBFA_43: Respondent’s preferred choice of number of hours worked versus pay LBFA_74: Weeks without work but looking all in one period, in separate periods or in 3 or more Added: LBFB_13A: Health reason - not currently working LBFB_41A: Health reason - absent from work last week LBFB_73A: Health reason - not looking for work The additional info asks the respondent to specify if the reason is due to: Physical health Emotional or mental health (including stress) Use of alcohol or drugs
24 WST
Work stress CCHS 1.1 Derived scale which measures different aspects related to work stress, including: Decision latitude Psychological job demand Physical workload Job insecurity Social support at work Job satisfaction
Derived scale which measures different aspects related to work stress, including: Decision latitude Psychological job demand Physical workload Job insecurity Social support at work Job satisfaction
Added: Use of a booklet to display response categories.
Reduce interview time and response burden.
31
CCHS Cycle 1.2, Mental Health and Well-being Public Use Microdata File Documentation
Order Modules Source/ past use
Summary Description (CCHS 1.2)
Summary Description (NPHS Cycle 4/CCHS 1.1)
Changes from past CCHS and NPHS cycles
Reason(s) for change / Additional Comments
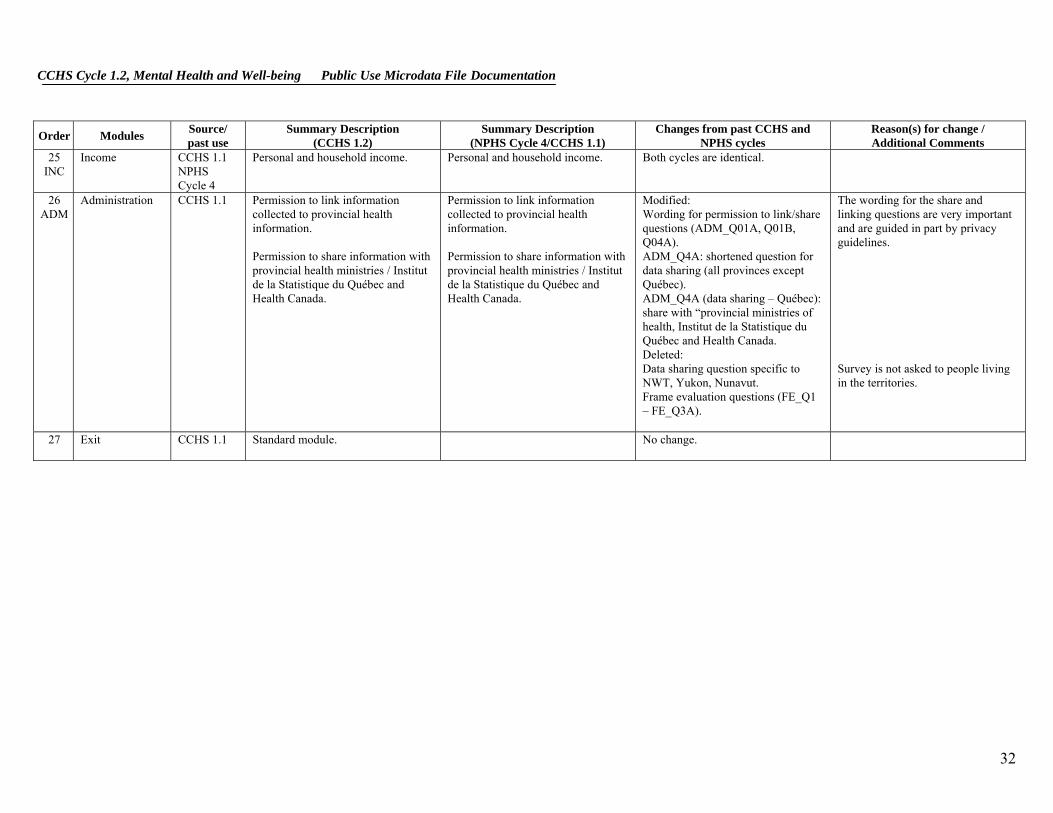
25 INC
Income CCHS 1.1 Personal and household income. NPHS Cycle 4
Personal and household income. Both cycles are identical.
26
ADM Administration CCHS 1.1 Permission to link information
collected to provincial health information. Permission to share information with provincial health ministries / Institut de la Statistique du Québec and Health Canada.
Permission to link information collected to provincial health information. Permission to share information with provincial health ministries / Institut de la Statistique du Québec and Health Canada.
Modified: Wording for permission to link/share questions (ADM_Q01A, Q01B, Q04A). ADM_Q4A: shortened question for data sharing (all provinces except Québec). ADM_Q4A (data sharing – Québec): share with “provincial ministries of health, Institut de la Statistique du Québec and Health Canada. Deleted: Data sharing question specific to NWT, Yukon, Nunavut. Frame evaluation questions (FE_Q1 – FE_Q3A).
The wording for the share and linking questions are very important and are guided in part by privacy guidelines. Survey is not asked to people living in the territories.
27 Exit CCHS 1.1 Standard module. No change.
32

CCHS Cycle 1.2, Mental Health and Well-being Public Use Microdata File Documentation
5. Sample Design
5.1 Target Population
CCHS Cycle 1.2 targets persons aged 15 years or older who are living in private dwellings in the 10 provinces. Residents of the three territories, persons living on Indian Reserves or Crown lands, clientele of institutions, full-time members of the Canadian Armed Forces and residents of certain remote regions are excluded from this survey. The Cycle 1.2 covered approximately 98% of the population aged 15 or older in the 10 provinces.
5.2 Sample Size and Allocation
To provide reliable estimates at the provincial level, and given the budget allocated to the Cycle 1.2 component, a sample of 30,000 respondents was desired. Because provinces vary greatly in population size and reliable estimates are required both at national and provincial levels, the sample was allocated among provinces proportionally to the square root of the estimated population in each province. Table 5.1 gives the targeted provincial sample sizes.
Table 5.1: Targeted sample sizes by province
Province Total sample size (targeted)
Newfoundland/Labrador 1,525Prince Edward Island *1,000Nova Scotia 1,960New Brunswick 1,765Quebec 5,485Ontario 6,720Manitoba 2,165Saskatchewan 2,045Alberta 3,370British Columbia 3,965 Canada 30,000
* The minimum sample size for a province was set to 1,000.
33

CCHS Cycle 1.2, Mental Health and Well-being Public Use Microdata File Documentation
Moreover and in order to have a good urban and rural representation in each province, the sample was subsequently allocated to two strata: urban and rural. The provincial sample was proportionally allocated to the urban and rural strata to the number of dwelling in each stratum. Then sample sizes were enlarged before data collection to take into account out-of-scope and vacant dwellings and anticipated non-response.
5.3 Sample Buy-ins
Prior to the start of the data collection, the provinces of Ontario and Nova Scotia had provided extra funds so that a larger sample of dwellings could be selected. The purpose of those buy-ins were to get sufficient sample size in order to provide reliable estimates for sub-provincial areas. Ontario added 7,702 sample units while Nova Scotia added 790 units.
The province of Ontario was divided in seven regions. The allocation of the 14,422 sample units among the sub-provincial areas was performed using the root-N approach while respecting a minimum sample size of 1,842 for each region. This well-known allocation scheme balances the reliability requirements at provincial and sub-provincial levels.
The province of Nova Scotia was divided into six regions (in fact, they were the same as for the CCHS Cycle 1.1). The provincial sample of 2,750 units was equally allocated to the regions in order to have similar levels of reliability in the estimates for every region. Thus and except for allocating 525 sample units to the region “Zone 6”, each region was allocated 445 sample units. Table 5.2 gives the sample allocation by sub-provincial area for the provinces of Ontario and Nova Scotia.
34

CCHS Cycle 1.2, Mental Health and Well-being Public Use Microdata File Documentation
Table 5.2 Allocation by region for Ontario and Nova Scotia with buy-in samples
Sub-provincial Area Sample Size
Ontario 14,422 Southwest 1,895 Central South 1,842 Central West 2,211 Central East 2,105 Toronto 2,632 East 1,895 North 1,842 Nova Scotia 2,750 Zone 1 445 Zone 2 445 Zone 3 445 Zone 4 445 Zone 5 445 Zone 6 525
5.4 Sampling of Households from the Area Frame
The Cycle 1.2 used the area frame designed for the Canadian Labour Force Survey (LFS) as its frame. The sampling plan of the LFS is a multistage stratified cluster design in which the dwelling is the final sampling unit.1 In the first stage, homogeneous strata were formed and independent samples of clusters were drawn from each stratum. In the second stage dwelling lists were prepared for each cluster and dwellings, or households, were selected from the lists.
For the purpose of the plan, each province is divided into three types of regions: major urban centres, cities and rural regions. Geographic or socio-economic strata are created within each major urban centre. Within the strata, between 150 and 250 dwellings are regrouped to create clusters. Some urban centres have separate strata for apartments or for census enumeration areas (EA) in which the average household income is high. In each stratum, six clusters or residential buildings (sometimes 12 or 18 apartments) are chosen by a random sampling method with a probability proportional to size (PPS), the size of which corresponds to the number of households. The number six was used throughout
1 Statistics Canada (1998), Methodology of the Canadian Labour Force Survey, Statistics Canada,
Catalogue No. 71-526-XPB.
35

CCHS Cycle 1.2, Mental Health and Well-being Public Use Microdata File Documentation
the sample design to allow a one-sixth rotation of the sample every month for the LFS. The other cities and rural regions of each province are stratified first on a geographical basis, then according to socio-economic characteristics. In the majority of strata, six clusters (usually census EAs) are selected using the PPS method. Where there is low population density, a three-step plan is used whereby two or three primary sampling units (PSU), which normally correspond to groups of EAs, are selected and dividing each PSU into clusters, six of which are sampled. The selection is made at each step using the PPS method.
Once the new clusters are listed, the sample is obtained using a systematic sampling of dwellings. Table 5.3 gives an overview of the types of PSUs used for the entire LFS sample. The yield is the number of households selected within the framework of the LFS for a given month. As the sampling rates are determined in advance, there is frequently a difference between the expected sample size and the numbers that are obtained. The yield of the sample, for example, is sometimes excessive. This especially happens in sectors where there is an increase in the number of dwellings due to new construction, for example. To reduce the cost of collection, an excessive output is corrected by eliminating, from the beginning, a part of the units selected and by modifying the weight of the sample design. Such an operation, usually conducted at an aggregate level, is called sample stabilization. Moreover, one increases the required size of the sample by households to account for dwellings, experience having shown that 12% of all dwellings are not occupied by households that are part of the field of observation (certain dwellings are vacant or occupied seasonally, others are occupied by households that are not targeted by the survey).
Table 5.3 Major first-stage units, sizes and yields
Area
Primary Sampling Unit
(PSU)
Size (households
per PSU)
Yields (sampled
households) Toronto, Montréal, Vancouver Cluster 200-250 6 Other cities Cluster 150-200 8 Apartment frame Apartment Varies 5 Most rural areas / small urban centres
Enumeration area
300 10
36
CCHS Cycle 1.2, Mental Health and Well-being Public Use Microdata File Documentation
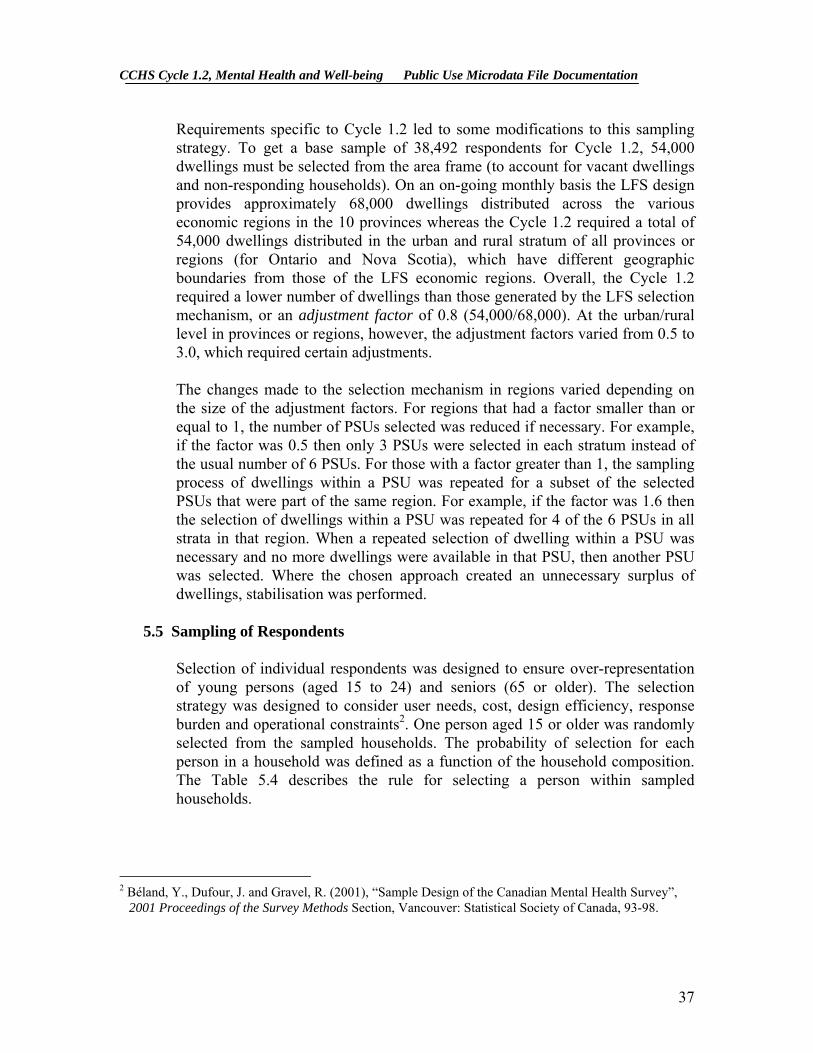
Requirements specific to Cycle 1.2 led to some modifications to this sampling strategy. To get a base sample of 38,492 respondents for Cycle 1.2, 54,000 dwellings must be selected from the area frame (to account for vacant dwellings and non-responding households). On an on-going monthly basis the LFS design provides approximately 68,000 dwellings distributed across the various economic regions in the 10 provinces whereas the Cycle 1.2 required a total of 54,000 dwellings distributed in the urban and rural stratum of all provinces or regions (for Ontario and Nova Scotia), which have different geographic boundaries from those of the LFS economic regions. Overall, the Cycle 1.2 required a lower number of dwellings than those generated by the LFS selection mechanism, or an adjustment factor of 0.8 (54,000/68,000). At the urban/rural level in provinces or regions, however, the adjustment factors varied from 0.5 to 3.0, which required certain adjustments.
The changes made to the selection mechanism in regions varied depending on the size of the adjustment factors. For regions that had a factor smaller than or equal to 1, the number of PSUs selected was reduced if necessary. For example, if the factor was 0.5 then only 3 PSUs were selected in each stratum instead of the usual number of 6 PSUs. For those with a factor greater than 1, the sampling process of dwellings within a PSU was repeated for a subset of the selected PSUs that were part of the same region. For example, if the factor was 1.6 then the selection of dwellings within a PSU was repeated for 4 of the 6 PSUs in all strata in that region. When a repeated selection of dwelling within a PSU was necessary and no more dwellings were available in that PSU, then another PSU was selected. Where the chosen approach created an unnecessary surplus of dwellings, stabilisation was performed.
5.5 Sampling of Respondents
Selection of individual respondents was designed to ensure over-representation of young persons (aged 15 to 24) and seniors (65 or older). The selection strategy was designed to consider user needs, cost, design efficiency, response burden and operational constraints2. One person aged 15 or older was randomly selected from the sampled households. The probability of selection for each person in a household was defined as a function of the household composition. The Table 5.4 describes the rule for selecting a person within sampled households.
2 Béland, Y., Dufour, J. and Gravel, R. (2001), “Sample Design of the Canadian Mental Health Survey”,
2001 Proceedings of the Survey Methods Section, Vancouver: Statistical Society of Canada, 93-98.
37

CCHS Cycle 1.2, Mental Health and Well-being Public Use Microdata File Documentation
Table 5.4: Selection Strategy based on Household Composition
Number of persons aged 25 or over (m) Number of 15-24 year
olds 0 1 2 3 4 5+
0 - A A A A A 1 A B B B B A 2 A B B A A A
3+ A A A A A A
A: Selection of one person with equal probability.
B: Selection of one person where those in the 15-to-24 age group would have a probability of 2.6/(2.6*n+m) of being selected and the others would have a probability of 1/(2.6*n+m), where n is the number of persons between 15 and 24 and m is the number of persons aged 25 or over.
5.6 Sample Allocation over the Collection Period
In order to balance interviewer workload, the initial sample of dwellings was equally allocated at random, within each region, over the three collection periods covering seven months (May to November 2002). The first collection period covered three months (Q1: May to July 2002) while the other two collection periods covered two months each (Q2: August and September 2002, and Q3: October and November 2002). More time was allowed for the first collection period compared to the other two periods in order to give a chance to the interviewers to familiarise themselves with the survey. For operational constraints, all dwellings of a PSU were assigned to the same collection period. It is also important to mention that data collection continued until the end of December in order to improve response rates.
38
CCHS Cycle 1.2, Mental Health and Well-being Public Use Microdata File Documentation
6. Data Collection
6.1 Questionnaire Design and Data Collection Method
The Cycle 1.2 questionnaire was administered using computer-assisted interviewing (CAI). Sample units selected from the area frame were interviewed using the Computer-Assisted Personal Interviewing (CAPI) method.
CAI offers a number of data quality advantages over other collection methods. First, question text, including reference periods and pronouns, is customised automatically based on factors such as the age and sex of the respondent, the date of the interview and answers to previous questions.
Second, edits to check for inconsistent answers or out-of-range responses are applied automatically and on-screen prompts are shown when an invalid entry is recorded. Immediate feedback is given to the respondent and the interviewer is able to correct any inconsistencies.
Third, questions that are not applicable to the respondent are skipped automatically.
6.2 Supervision and Control
CAPI interviewers worked independently from their homes using laptop computers and were supervised from a distance by senior interviewers. Completed interviews were transmitted daily to Statistics Canada’s head office using a secure telephone transmission directly from the interviewer’s home.
6.3 Field Tests
A CAPI field test was conducted in February 2002. The test was conducted in Alberta and Quebec using a sample of 600 units.
The main objectives of the CAPI test were to evaluate respondent reaction to the questions and to obtain estimates of completion times for the various sections of the questionnaire. Field operations procedures, interviewer training and the computer-assisted interviewing application were also tested.
39
CCHS Cycle 1.2, Mental Health and Well-being Public Use Microdata File Documentation
6.4 Interviewing
In all selected dwellings, a knowledgeable household member was asked to supply basic demographic information on all residents of the dwelling. Depending on the composition of the household, one member aged 15 or over was then selected for a more in-depth interview.
CAPI interviewers were trained to make an initial personal contact with each sampled dwelling. In cases where this initial visit resulted in non-response, telephone follow-ups were permitted.
Every effort was made to conduct the interviews face to face. Collection by telephone was authorized only when travel was prohibitive or the respondent refused to conduct the interview in person. As well, household contact and selection of a respondent was allowed by telephone, after an initial contact was attempted in person.
In the end, 14% of cases nationally were completed by telephone (slightly higher in Ontario). No proxy interviews were permitted for this survey.
6.5 Minimising Non-response
Prior to the first contact by an interviewer, an introductory letter and brochure were delivered to each selected dwelling for which we had a valid mailing address. These explained the importance of the survey and provided examples of how Cycle 1.2 data would be used.
Interviewers were instructed to make all reasonable attempts to obtain Cycle 1.2 interviews. When the timing of the interviewer's visit was inconvenient, an appointment was made to call back at a more convenient time. If no one was home, numerous call-backs were made. For individuals who at first refused to participate in the survey, a letter was sent from the Regional Office to the respondent, stressing the importance of the survey and the household's collaboration. This was followed by a second call (or visit) from a senior interviewer, a project supervisor or another interviewer to try to convince respondents of the importance of participating in the survey. During the final months of data collection, non-response cases and selected persons who had previously refused were again approached and encouraged to participate in the survey. This diligence in contact may have resulted in stronger survey results by maximising the response rate. To help minimize non-response, some non-response cases were followed-up one more time in November. Refusals were excluded from these.
40

CCHS Cycle 1.2, Mental Health and Well-being Public Use Microdata File Documentation
To reduce the impact of language as a barrier to conducting interviews, each of the Statistics Canada Regional Offices has recruited interviewers with a wide range of language competencies. To help these interviewers, an ‘official’ translation of key terms was created in Chinese and Punjabi, the two most prevalent non-official languages from CCHS Cycle 1.1. Interviewers able to speak those languages used the guide to translate questions and complete the interview. Interviewers were restricted from conducting interviews in any other language because of the complexity of the question concepts.
6.6 Special Circumstances during Cycle 1.2 Collection Operations
Data collection took place between May 2002 and December 2002, a period of seven months. This plan was carefully designed to ensure that the survey’s quality objectives would be met. The final month of collection was planned to provide interviewers with an opportunity for a final attempt to convert non-responding cases.
For most of Statistics Canada’s household surveys, collection operations proceed smoothly and within the established parameters. For Cycle 1.2, the total workload imposed by the lengthy interview, complex content and difficult respondent burden in some cases, proved to be a challenge for the data collection infrastructure in place. To ensure the success of collection operations, a number of strategies were put into place. Among these were, specialized training on mental illness and how to conduct difficult interviews for interviewers, careful planning of collection periods and interviewer assignment sizes, addition of staff in key areas, and the decision to allow limited data collection by telephone.
To ensure that data quality was maintained during collection, a monitoring system was put in place. Various aspects related to the interview process were monitored at the interviewer level such as average interview time and item non-response. Regular weekly feedback from Head Office to the Regional Offices helped maintain and correct problems as they occurred. A validation process was also put in place in the field to monitor the quality of the work performed by the interviewers. At the end of data collection, a national response rate of 77% was achieved. The reader will find complete details regarding the response rates in Section 9.
41
CCHS Cycle 1.2, Mental Health and Well-being Public Use Microdata File Documentation
7. Data Processing
7.1 Editing
Most editing of the data was performed at the time of the interview by the computer-assisted interviewing (CAI) application. It was not possible for interviewers to enter out-of-range values and flow errors were controlled through programmed skip patterns. For example, CAI ensured that questions that did not apply to the respondent were not asked.
In response to some types of inconsistent or unusual reporting, warning messages were invoked but no corrective action was taken at the time of the interview. Where appropriate, edits were instead developed to be performed after data collection at Head Office. Inconsistencies were usually corrected by setting one or both of the variables in question to "not stated".
7.2 Coding
Pre-coded answer categories were supplied for all suitable variables. Several questions in the Cycle 1.2 questionnaire allow write-in responses. For some of these questions, write-in responses were either coded into one of the existing listed categories if the write-in information duplicated a listed category or into new unique categories. Medication questions were coded to the Anatomical Therapeutic Classification (ATC).
7.3 Creation of Derived and Grouped Variables
To facilitate data analysis, a number of variables on the file have been derived using items found on the Cycle 1.2 questionnaire. Derived variables generally have a "D" or "G" in the fifth character of the variable name. In some cases, the derived variables are straightforward, involving collapsing of response categories. In other cases, several variables have been combined to create a new variable. Appendix C provides details on how these more complex variables were derived.
42
CCHS Cycle 1.2, Mental Health and Well-being Public Use Microdata File Documentation
7.4 Imputation
Due to some technical problems in certain skip patterns of the suicide module, some respondents were not asked the questions required for the calculation of the derived variables ‘12-month suicidal thought’ and ‘12-month suicidal attempt’. Consequently, important information was missing for those individuals (this represented 4.83% of all respondents for the ‘12-month suicidal thought’ and 1.03% of all respondents for the ‘12-month suicidal attempt’). Moreover and because of their profiles, those individuals are more likely to have had a 12-month suicidal thought and/or a 12-month suicidal attempt which would have resulted in an underestimation of the prevalence. To fill in these missing responses, values were imputed using the approach described below.
Two methods of imputation were used, a deterministic method and one based on a logistic regression model. As it was possible to derive directly the missing value based on other responses for some respondents, a deterministic imputation method was first used. This was the case for all missing values for the 12-month suicidal attempt and for about one fourth of the missing values for the 12-month suicidal thought. For the remaining missing values of the 12-month suicidal thought, a logistic regression imputation method was used. The method consisted in fitting a logistic regression model between the variable to impute (the 12–month suicidal thought) and correlated characteristics using respondents without missing values who were similar to those to impute. Using the fitted model, a probability of response (yes or no) was calculated for each respondent who needed imputation; a response was then imputed based on that probability.
7.5 Weighting
The principle behind estimation in a probability sample such as Cycle 1.2 is that each person in the sample "represents", besides himself or herself, several other persons not in the sample. For example, in a simple random 2% sample of the population, each person in the sample represents 50 persons in the population. In the terminology used here, it can be said that each person has a weight of 50.
The weighting phase is a step that calculates, for each person, his or her associated sampling weight. This weight appears on the microdata file, and must be used to derive meaningful estimates from the survey. For example, if the number of individuals who had a major depressive episode is to be estimated, it is done by selecting the records referring to those individuals in the sample having that characteristic and summing the weights entered on those records. Details of the method used to calculate sampling weights are presented in Section 8.
43

CCHS Cycle 1.2, Mental Health and Well-being Public Use Microdata File Documentation
7.6 Suppression of Confidential Information
It should be noted that the 'Public Use' microdata file described above differs in a number of important respects from the survey 'master' file held by Statistics Canada. These differences are the result of actions taken to protect the anonymity of individual survey respondents. Protection of respondents is assured through suppression of individual values, variable grouping, and variable capping. Users requiring access to information excluded from the microdata files have three options: to purchase custom tabulations, use one of the Research Data Centres3, or use the remote access option. (See sub-section 12.3)
3 The most current information about the Research Data Centres can be found at www.statcan.ca
44

CCHS Cycle 1.2, Mental Health and Well-being Public Use Microdata File Documentation
8. Weighting
In order for the estimates produced from survey data to be representative of the covered population and not just the sample itself, a user must incorporate the survey weights into their calculations. A survey weight is given to each person included in the final sample, that is, the sample of persons having answered the survey. This weight corresponds to the number of persons represented by the respondent for the entire population. As described in Section 5, Cycle 1.2 had recourse to the area frame of the LFS. For this reason, the weighting strategy of the CCHS is very similar to the LFS one. Table 8.1 presents an overview of the different adjustments, part of the weighting strategy, in the order in which they are applied.
Table 8.1: List of adjustments in the weighting
0 Initial weight 1 Sample increase or decrease 2 Stabilization 3 Removal of out-of-scope units 4 Household non-response 5 Creation of person level weight 6 Person non-response 7 Poststratification
These adjustments will be explained in the following section. 8.1 Adjustments Applied to the Initial Weight
Adjustment 0 – Initial weight Since the mechanism established for the LFS was used to select the area frame sample, the initial weights had to be computed with respect to that mechanism. First, within each stratum defined by the LFS, clusters (primary units) are selected with probabilities proportional to population sizes (based on 1991 Census counts). Next, dwellings are sampled within each selected cluster using systematic sampling. The product of the probabilities for each of these selections represents the overall probability of selection, and the inverse of that probability is used as the initial weight of the unit. For more details about the selection mechanism, as
45
CCHS Cycle 1.2, Mental Health and Well-being Public Use Microdata File Documentation
well as a more complete definition of strata and clusters, refer to Statistics Canada (1998).4 Adjustment 1 – Sample increase or decrease Some modifications were made to the default LFS mechanism at the time of sample selection for Cycle 1.2. The LFS design provides approximately 68,000 dwellings nationally, which is very close to the needs of Cycle 1.2. However, at the provincial level or regional level (in Ontario and Nova-Scotia), the number of dwellings provided by the sample design of the LFS can either exceed the needs of Cycle 1.2 or be insufficient. Modifications made in order to obtain the needed sample within a province or a Health Region (HR) consisted, in summary, of repeating the sampling process of dwellings within a few clusters in the provinces or HRs where Cycle 1.2 needed more dwellings, or not selecting any dwelling in a few clusters when it needed less dwellings. This modification had the effect of increasing or decreasing the sample and had to be accounted for in the weighting to correctly represent the probability of selection. An adjustment factor representing the sample increase or decrease rate at the provincial level or regional level (in Ontario and Nova-Scotia) was calculated. The initial weight was multiplied by this adjustment factor, which results in weight 1. Adjustment 2 – Stabilization In the HRs or provinces where Cycle 1.2 needed more dwellings, increasing the sample as described in the previous paragraph resulted in a significantly larger sample than necessary. Stabilization was therefore instituted to bring the sample size back down to the desired level. The stabilization process consisted of randomly subsampling dwellings at the provincial level or at the HR level in Ontario and Nova-Scotia. An adjustment factor representing the effect of this stabilization was therefore calculated to adjust the probability of selection appropriately. This factor, multiplied by the weight 1, produces weight 2. Adjustment 3 – Removal of out-of-scope units Among all dwellings sampled, a certain proportion are identified during collection as being out-of-scope. Dwellings that are demolished or in construction, vacant, seasonal or secondary dwellings, and institutions are examples of out-of-scope cases for Cycle 1.2. Records for these dwellings were simply removed from the sample, leaving only in-scope dwellings. They kept the same weight as in the previous step, which is now called weight 3.
4 Statistics Canada (1998), Methodology of the Canadian Labour Force Survey, Statistics Canada, Cat. No.
71-526-XPB.
46

CCHS Cycle 1.2, Mental Health and Well-being Public Use Microdata File Documentation
Adjustment 4 – Household non-response During collection, a certain proportion of interviewed households inevitably resulted in non-response. This usually occurs when a household refuses to participate in the survey, provides unusable data, or cannot be reached for an interview. Weights of non-responding households were distributed to respondents using response propensity classes. The CHAID (Chi-Square Automatic Interaction Detector) algorithm available in Knowledge Seeker,5 was used to identify which characteristics best split the sample into groups that were dissimilar with respect to response/non-response. Note that groups were formed independently within each province or HR in the case of Ontario and Nova-Scotia. Since the information available for non-respondents is limited, only characteristics such as, collection period (with 3 periods; May 2002 to July 2002, August 2002 to September 2002 and October 2002 to December 2002) and a rural/urban indicator could be used in the creation of the classes. In a few provinces or HRs, both variables were significant in the creation of classes. In a few others, only one variable was significant, and in the remaining, none was significant. An adjustment factor was therefore calculated within each class as follows:
householdsrespondingallforweightofSumhouseholdsallforweightofSum
33
Weight 3 for responding households was multiplied by this factor to produce weight 4. Non-responding households were dropped out of the process at this point. Adjustment 5 – Creation of person level weight Since the ultimate sampling unit for the CCHS is a person, the household level weights computed up to this point need to be converted down to the person level. This weight is obtained by multiplying the weight 4 by the inverse of the probability of selection of the person selected in the household. This gives the weight 5. As mentioned before, in the households with a certain number of persons in the age groups 15 to 24 and 25 and over, this probability of selection is larger for the persons in the age group 15 to 24 (see Section 5.4 for more details on the algorithm of the selection of the person). For the other households, this probability is equal to the inverse of the number of persons aged 15 and over in the household, no matter which person is selected.
5 ANGOSS Software (1995), Knowledge Seeker IV for Windows - User's Guide, ANGOSS Software
International Limited.
47

CCHS Cycle 1.2, Mental Health and Well-being Public Use Microdata File Documentation
Adjustment 6 – Person non-response A Cycle 1.2 interview can be seen as a two-part process. First the interviewer gets the complete roster of the people living within the responding household. Second, (s)he interviews the selected person within the household. In some cases, interviewers can only get through the first part, either because they cannot get in touch with the selected person, or because that selected person refuses to be interviewed. Such cases are defined as person non-response and an adjustment factor must be applied to the weights of respondents to overcome this non-response. As for the treatment of household non-response, the adjustment was applied within classes based on characteristics available for both respondents and non-respondents. All characteristics collected when rostering all household members were in fact available for the creation of the classes. The CHAID algorithm was once again used to define the classes and the final result presented definitions that varied from one province to another (or HR in the case of Ontario and Nova-Scotia). Depending on the province or HR, the following characteristics were used to form the adjustment classes: sex, age group, urban/rural indicator, education, marital status and the size of the household. As a result, an adjustment factor is calculated as follows:
personsselectedrespondingallfor5weightofSumpersonsselectedallfor5weightofSum
Weight 5 of responding persons was therefore multiplied by this adjustment factor to produce weight 6. Non-responding persons are dropped out of the weighting process from this point onward. Adjustment 7 – Poststratification The final step necessary to obtain the final Cycle 1.2 weight was the poststratification. Poststratification is done to ensure that the sum of the final weights corresponds to the population estimates defined at the provincial level and regional level in Ontario and Nova-Scotia, for all eight age-sex groups of interest, that is, the four age groups 15 to 24, 25 to 44, 45 to 64, 65 and over, for both males and females. The population estimates for 2002 were based on the 1996 Census counts and estimates of birth, death, immigration and emigration counts. The average of these monthly estimates for each of the province (or HR)-age-sex poststrata was used to poststratify. The weight 6 was therefore adjusted to obtain the final weight 7 with the help of the adjustment factor defined as follows:
48

CCHS Cycle 1.2, Mental Health and Well-being Public Use Microdata File Documentation
respondent the of group sex-age-HR) (or province the for 6 weightsof Sumrespondent the ofgroupsex-age-HR) (or province the for estimate Population
Consequently, the weight 7 corresponds to the final Cycle 1.2 weight that can be found on the data file with the variable name WTSB_M.
49

CCHS Cycle 1.2, Mental Health and Well-being Public Use Microdata File Documentation
9. Data Quality 9.1 Response Rates
In total and after removing the out-of-scope units, 48,047 households were selected to participate in Cycle 1.2. Out of these selected households a response was obtained for 41,560 which results in an overall household-level response rate of 86.5%. Among these responding households 41,559 individuals (one per household) were selected to participate in Cycle 1.2 out of which a response was obtained for 36,984 which results in an overall person-level response rate of 89.0%. At the Canada level, this would yield a combined response rate of 77.0% for Cycle 1.2. Table 9.1 gives combined response rates as well as relevant information for calculation of them by province and for seven Ontario regions. Next we describe how the various components of the equation should be handled to correctly compute combined response rates. Household-level response rate HHRR = number of responding households all in-scope households Person-level response rate PPRR = number of responding persons all selected persons Combined response rate = HHRR x PPRR Next is an example on how to calculate the combined response rate for Canada using the information found in Table 9.1. HHRR = 41,559 = 0.865 48,047 PPRR = 36,984 = 0.890 41,559 Combined response rate = 0.865 x 0.890 = 0.770 = 77.0%
50

CCHS Cycle 1.2, Mental Health and Well-being Public Use Microdata File Documentation
Table 9.1 Combined Response Rates by Province
Household Level Person Level Combined
Province Health Region
# In Scope
Hh # Resp
Hh
HhResp.Rates
# Pers.Select. # Resp.
Pers. Resp. Rates
Resp. Rates
Canada Total 48,046 41,559 86.5 41,559 36,984 89.0 77.0
Newfoundland Total 1,898 1,750 92.2 1,750 1,562 89.3 82.3
Prince Edward Island Total 1,227 1,098 89.5 1,098 1,002 91.3 81.7
Nova Scotia Total 3,476 3,131 90.1 3,131 2,785 88.9 80.1
New Brunswick Total 2,185 1,942 88.9 1,942 1,706 87.8 78.1
Quebec Total 6,829 5,961 87.3 5,961 5,332 89.4 78.1
Ontario Total 17,956 15,038 83.7 15,038 13,184 87.7 73.4
South West 2,307 1,977 85.7 1,977 1,782 90.1 77.2
Central South 2,302 1,940 84.3 1,940 1,675 86.3 72.8
Central West 2,747 2,304 83.9 2,304 2,035 88.3 74.1
Central East 2,622 2,258 86.1 2,258 1,947 86.2 74.3
Toronto 3,378 2,582 76.4 2,582 2,142 83.0 63.4
East 2,298 1,963 85.4 1,963 1,783 90.8 77.6
North 2,302 2,014 87.5 2,014 1,820 90.4 79.1
Manitoba Total 2,705 2,403 88.8 2,403 2,230 92.8 82.4
Saskatchewan Total 2,553 2,245 87.9 2,245 2,045 91.1 80.1
Alberta Total 4,198 3,629 86.4 3,629 3,236 89.2 77.1
British Columbia Total 5,019 4,362 86.9 4,362 3,902 89.5 77.7
51

CCHS Cycle 1.2, Mental Health and Well-being Public Use Microdata File Documentation
9.2 Survey Errors
The estimates derived from this survey are based on a sample of individuals. Somewhat different figures might have been obtained if a complete census had been taken using the same questionnaire, interviewers, supervisors, processing methods, etc. as those actually used. The difference between the estimates obtained from the sample and the results from a complete count under similar conditions is called the sampling error of the estimate. Errors which are not related to sampling may occur at almost every phase of a survey operation. Interviewers may misunderstand instructions, respondents may make errors in answering questions, the answers may be incorrectly entered on the computer and errors may be introduced in the processing and tabulation of the data. These are all examples of non-sampling errors.
9.2.1 Non-sampling Errors
Over a large number of observations, randomly occurring errors will have little effect on estimates derived from the survey. However, errors occurring systematically will contribute to biases in the survey estimates. Considerable time and effort was made to reduce non-sampling errors in the survey. Quality assurance measures were implemented at each step of data collection and processing to monitor the quality of the data. These measures included the use of highly skilled interviewers, extensive training with respect to the survey procedures and questionnaire, and the observation of interviewers to detect problems. Testing of the Computer Assisted Interview application and field tests were also essential procedures to ensure that data collection errors were minimized. A major source of non-sampling errors in surveys is the effect of non-response on the survey results. The extent of non-response varies from partial non-response (failure to answer just one or some questions) to total non-response. Partial non-response to Cycle 1.2 was minimal; once the questionnaire was started, it tended to be completed with very little non-response. Total non-response occurred either because a respondent refused to participate in the survey, or because the interviewer was unable to contact the selected respondent. Total non-response was handled by adjusting the weight of persons who responded to the survey to compensate for those who did not respond. See section 8 for details of the weight adjustment for non-response.
52

CCHS Cycle 1.2, Mental Health and Well-being Public Use Microdata File Documentation
9.2.2 Sampling Errors
Since it is an unavoidable fact that estimates from a sample survey are subject to sampling error, sound statistical practice calls for researchers to provide users with some indication of the magnitude of this sampling error. The basis for measuring the potential size of sampling errors is the standard deviation of the estimates derived from survey results. However, because of the large variety of estimates that can be produced from a survey, the standard deviation of an estimate is usually expressed relative to the estimate to which it pertains. This resulting measure, known as the coefficient of variation (CV) of an estimate, is obtained by dividing the standard deviation of the estimate by the estimate itself and is expressed as a percentage of the estimate. For example, suppose hypothetically that one estimates that 12% of Canadians aged 15 and over have had at least one major depressive episode during their life and that this estimate is found to have a standard deviation of .007. Then the CV of the estimate is calculated as:
(0.007/0.12) x 100% = 5.83%. Statistics Canada commonly uses CV results when analyzing data, and urges users producing estimates from Cycle 1.2 data files to also do so. For details on how to determine CVs, see Section 11. For guidelines on how to interpret CV results, see the table at the end of sub-section 10.4.
53
CCHS Cycle 1.2, Mental Health and Well-being Public Use Microdata File Documentation
10. Guidelines for Tabulation, Analysis and Release
This section of the documentation outlines the guidelines to be adhered to by users tabulating, analyzing, publishing or otherwise releasing any data derived from the survey microdata file. With the aid of these guidelines, users of microdata should be able to produce figures that are in close agreement with those produced by Statistics Canada and, at the same time, will be able to develop currently unpublished figures in a manner consistent with these established guidelines.
10.1 Rounding Guidelines
In order that estimates for publication or other release derived from this microdata file correspond to those produced by Statistics Canada, users are urged to adhere to the following guidelines regarding the rounding of such estimates:
a) Estimates in the main body of a statistical table are to be rounded to the
nearest hundred units using the normal rounding technique. In normal rounding, if the first or only digit to be dropped is 0 to 4, the last digit to be retained is not changed. If the first or only digit to be dropped is 5 to 9, the last digit to be retained is raised by one. For example, in normal rounding to the nearest 100, if the last two digits are between 00 and 49, they are changed to 00 and the preceding digit (the hundreds digit) is left unchanged. If the last digits are between 50 and 99 they are changed to 00 and the proceeding digit is incremented by 1;
b) Marginal sub-totals and totals in statistical tables are to be derived from their
corresponding unrounded components and then are to be rounded themselves to the nearest 100 units using normal rounding;
c) Averages, proportions, rates and percentages are to be computed from
unrounded components (i.e., numerators and/or denominators) and then are to be rounded themselves to one decimal using normal rounding. In normal rounding to a single digit, if the final or only digit to be dropped is 0 to 4, the last digit to be retained is not changed. If the first or only digit to be dropped is 5 to 9, the last digit to be retained is increased by 1;
d) Sums and differences of aggregates (or ratios) are to be derived from their
corresponding unrounded components and then are to be rounded themselves to the nearest 100 units (or the nearest one decimal) using normal rounding;
e) In instances where, due to technical or other limitations, a rounding technique
other than normal rounding is used resulting in estimates to be published or
54
CCHS Cycle 1.2, Mental Health and Well-being Public Use Microdata File Documentation
otherwise released that differ from corresponding estimates published by Statistics Canada, users are urged to note the reason for such differences in the publication or release document(s);
f) Under no circumstances are unrounded estimates to be published or otherwise
released by users. Unrounded estimates imply greater precision than actually exists.
10.2 Sample Weighting Guidelines for Tabulation
The sample design used for Cycle 1.2 was not self-weighting. That is to say, the sampling weights are not identical for all individuals in the sample. When producing simple estimates, including the production of ordinary statistical tables, users must apply the proper sampling weight.
If proper weights are not used, the estimates derived from the microdata files cannot be considered to be representative of the survey population, and will not correspond to those produced by Statistics Canada.
Users should also note that some software packages might not allow the generation of estimates that exactly match those available from Statistics Canada, because of their treatment of the weight field.
10.2.1 Definitions: Categorical Estimates, Quantitative Estimates
Before discussing how Cycle 1.2 data can be tabulated and analyzed, it is useful to describe the two main types of point estimates of population characteristics that can be generated from the microdata file.
Categorical Estimates:
Categorical estimates are estimates of the number or percentage of the surveyed population possessing certain characteristics or falling into some defined category. The number of individuals who smoke daily is an example of such an estimate. An estimate of the number of persons possessing a certain characteristic may also be referred to as an estimate of an aggregate.
55

CCHS Cycle 1.2, Mental Health and Well-being Public Use Microdata File Documentation
Example of Categorical Question: SMKA_202: At the present do/does ... smoke cigarettes daily,
occasionally or not at all? __ Daily __ Occasionally __ Not at all
Quantitative Estimates:
Quantitative estimates are estimates of totals or of means, medians and other measures of central tendency of quantities based upon some or all of the members of the surveyed population.
An example of a quantitative estimate is the average number of cigarettes smoked per day by individuals who smoke daily. The numerator is an estimate of the total number of cigarettes smoked per day by individuals who smoke daily, and its denominator is an estimate of the number of individuals who smoke daily.
Example of Quantitative Question:
SMKA_204: How many cigarettes do/does you/he/she smoke each day now?
|_|_| Number of cigarettes
10.2.2 Tabulation of Categorical Estimates
Estimates of the number of people with a certain characteristic can be obtained from the microdata files by summing the final weights of all records possessing the characteristic of interest.
Proportions and ratios of the form are obtained by: Y / X ˆˆ
a) summing the final weights of records having the characteristic of
interest for the numerator ( X );
b) summing the final weights of records having the characteristic of interest for the denominator ( Y ); then
c) dividing the numerator estimate by the denominator estimate.
56

CCHS Cycle 1.2, Mental Health and Well-being Public Use Microdata File Documentation
10.2.3 Tabulation of Quantitative Estimates
Estimates of quantities can be obtained from the microdata files by:
a) multiplying the value of the variable of interest by the final weight
and summing this quantity over all records of interest to obtain the numerator ( X );
b) summing the final weights of records having the characteristic of
interest for the denominator ( Y ); then
c) dividing the numerator estimate by the denominator estimate.
For example, to obtain an estimate of the average number of cigarettes smoked each day by individuals who smoke daily, multiply the value of variable SMKA_2046 by the weight, WTSB_M, then sum this value over those records with a value of "daily" to the variable SMKA_202 to obtain the numerator ( X ). Sum the final weight of those records with a value of "daily" to the variable SMKA_202 to obtain the denominator ( Y ). Divide ( X ) by ( Y ) to obtain the average number of cigarettes smoked each day by daily smokers.
10.3 Guidelines for Statistical Analysis
Cycle 1.2 is based upon a complex design, with stratification and multiple stages of selection, and unequal probabilities of selection of respondents. Using data from such complex surveys presents problems to analysts because the survey design and the selection probabilities affect the estimation and variance calculation procedures that should be used.
While many analysis procedures found in statistical packages allow weights to be used, the meaning or definition of the weight in these procedures can differ from what is appropriate in a sample survey framework, with the result that while in many cases the estimates produced by the packages are correct, the variances that are calculated are almost meaningless.
6 See Section 12.2 for variable naming convention
57

CCHS Cycle 1.2, Mental Health and Well-being Public Use Microdata File Documentation
For many analysis techniques (for example linear regression, logistic regression, analysis of variance), a method exists that can make the application of standard packages more meaningful. If the weights on the records are rescaled so that the average weight is one (1), then the results produced by the standard packages will be more reasonable; they still will not take into account the stratification and clustering of the sample's design, but they will take into account the unequal probabilities of selection. The rescaling can be accomplished by using in the analysis a weight equal to the original weight divided by the average of the original weights for the sampled units (people) contributing to the estimator in question. In order to provide a means of assessing the quality of tabulated estimates, Statistics Canada has produced a set of Approximate Coefficients of Variations Tables (commonly referred to as "CV Tables") for the CCHS. These tables can be used to obtain approximate coefficients of variation for categorical-type estimates and proportions. See Section 11 for more details.
58
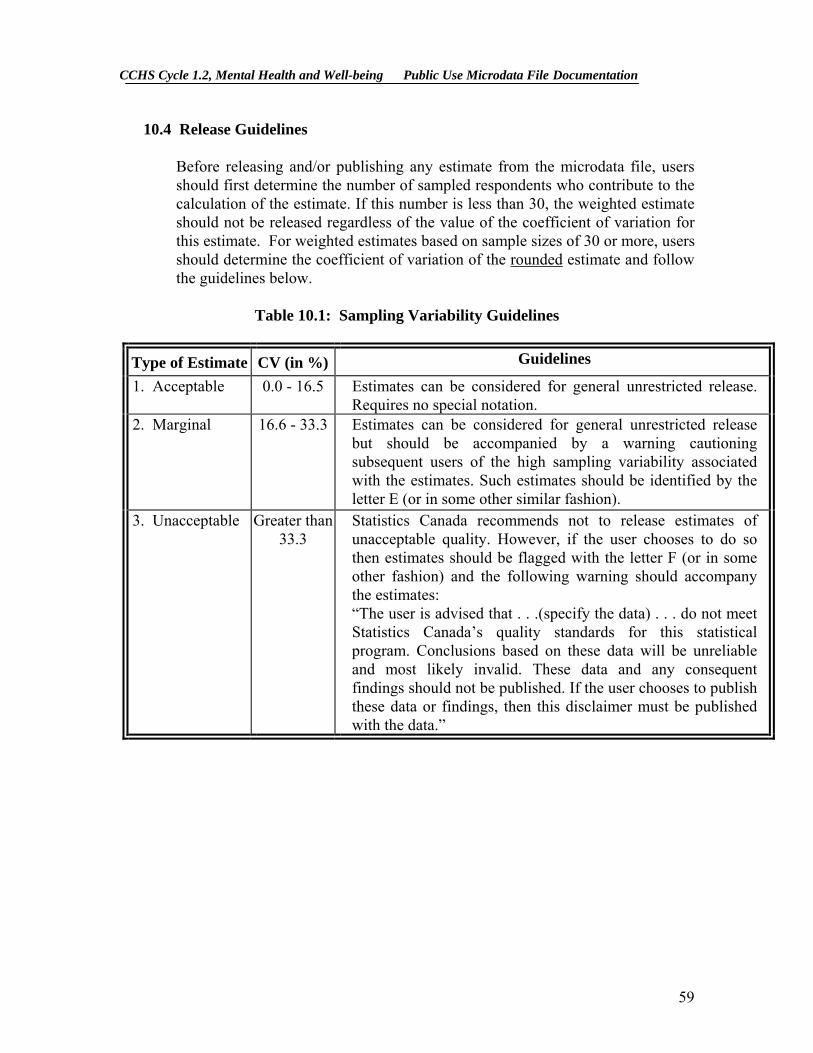
CCHS Cycle 1.2, Mental Health and Well-being Public Use Microdata File Documentation
10.4 Release Guidelines
Before releasing and/or publishing any estimate from the microdata file, users should first determine the number of sampled respondents who contribute to the calculation of the estimate. If this number is less than 30, the weighted estimate should not be released regardless of the value of the coefficient of variation for this estimate. For weighted estimates based on sample sizes of 30 or more, users should determine the coefficient of variation of the rounded estimate and follow the guidelines below.
Table 10.1: Sampling Variability Guidelines
Type of Estimate CV (in %) Guidelines
1. Acceptable 0.0 - 16.5 Estimates can be considered for general unrestricted release. Requires no special notation.
2. Marginal 16.6 - 33.3 Estimates can be considered for general unrestricted release but should be accompanied by a warning cautioning subsequent users of the high sampling variability associated with the estimates. Such estimates should be identified by the letter E (or in some other similar fashion).
3. Unacceptable Greater than 33.3
Statistics Canada recommends not to release estimates of unacceptable quality. However, if the user chooses to do so then estimates should be flagged with the letter F (or in some other fashion) and the following warning should accompany the estimates: “The user is advised that . . .(specify the data) . . . do not meet Statistics Canada’s quality standards for this statistical program. Conclusions based on these data will be unreliable and most likely invalid. These data and any consequent findings should not be published. If the user chooses to publish these data or findings, then this disclaimer must be published with the data.”
59

CCHS Cycle 1.2, Mental Health and Well-being Public Use Microdata File Documentation
11. Approximate Sampling Variability Tables
In order to supply coefficients of variation that would be applicable to a wide variety of categorical estimates produced from this microdata file and that could be readily accessed by the user, a set of Approximate Sampling Variability Tables has been produced. These "look-up" tables allow the user to obtain an approximate coefficient of variation based on the size of the estimate calculated from the survey data.
The coefficients of variation (CV) are derived using the variance formula for simple random sampling and incorporating a factor which reflects the multi-stage, clustered nature of the sample design. This factor, known as the design effect, was determined by first calculating design effects for a wide range of characteristics and then choosing, for each table produced, a conservative value among all design effects relative to that table. The value chosen was then used to generate a table that applies to the entire set of characteristics.
The design effects, sample sizes and population counts used to produce the Approximate Sampling Variability Tables are presented in Appendix D. All coefficients of variation in the Approximate Sampling Variability Tables are approximate and, therefore, unofficial. Options concerning the computation of exact coefficients of variation are discussed in sub-section 11.7.
Remember: As indicated in Sampling Variability Guidelines in Section 10.4, if the number of observations on which an estimate is based is less than 30, the weighted estimate should not be released regardless of the value of the coefficient of variation. Coefficients of variation based on small sample sizes are too unpredictable to be adequately represented in the tables.
11.1 How to Use the CV Tables for Categorical Estimates
The following rules should enable the user to determine the approximate coefficients of variation from the Sampling Variability Tables for estimates of the number, proportion or percentage of the surveyed population possessing a certain characteristic and for ratios and differences between such estimates. One should note that there are three types of CV tables and that the kind of table to use depends on the population considered and on the form of the estimate (number or proportion).
The tables of the first type basically have the same format as the CV tables that are habitually published (for example, all tables from Cycle 1.1 of CCHS have this form). These are the general tables. The appendix contains 22 CV tables of
60
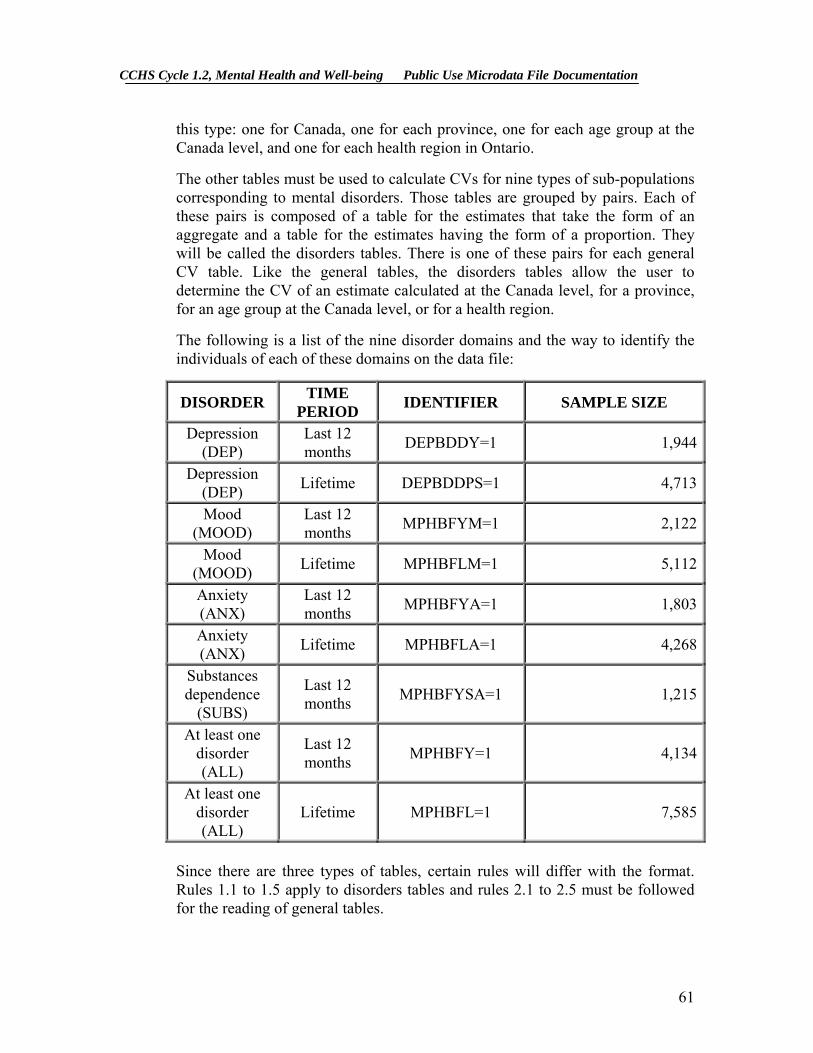
CCHS Cycle 1.2, Mental Health and Well-being Public Use Microdata File Documentation
this type: one for Canada, one for each province, one for each age group at the Canada level, and one for each health region in Ontario.
The other tables must be used to calculate CVs for nine types of sub-populations corresponding to mental disorders. Those tables are grouped by pairs. Each of these pairs is composed of a table for the estimates that take the form of an aggregate and a table for the estimates having the form of a proportion. They will be called the disorders tables. There is one of these pairs for each general CV table. Like the general tables, the disorders tables allow the user to determine the CV of an estimate calculated at the Canada level, for a province, for an age group at the Canada level, or for a health region.
The following is a list of the nine disorder domains and the way to identify the individuals of each of these domains on the data file:
DISORDER TIME PERIOD IDENTIFIER SAMPLE SIZE
Depression (DEP)
Last 12 months DEPBDDY=1 1,944
Depression (DEP) Lifetime DEPBDDPS=1 4,713
Mood (MOOD)
Last 12 months MPHBFYM=1 2,122
Mood (MOOD) Lifetime MPHBFLM=1 5,112
Anxiety (ANX)
Last 12 months MPHBFYA=1 1,803
Anxiety (ANX) Lifetime MPHBFLA=1 4,268
Substances dependence
(SUBS)
Last 12 months MPHBFYSA=1 1,215
At least one disorder (ALL)
Last 12 months MPHBFY=1 4,134
At least one disorder (ALL)
Lifetime MPHBFL=1 7,585
Since there are three types of tables, certain rules will differ with the format. Rules 1.1 to 1.5 apply to disorders tables and rules 2.1 to 2.5 must be followed for the reading of general tables.
61
CCHS Cycle 1.2, Mental Health and Well-being Public Use Microdata File Documentation
11.1.1 How to Use the disorder CV tables
The CV disorders tables were made in order to determine the CV of an estimate calculated for one of the following populations:
All the people aged 15 and over, in Canada, and in one of the nine
disorder domains presented in the table of the previous page
All the people in Canada in one of the nine disorder domains presented in the table of the previous page and belonging to one of the following age groups: 15-24, 25-44, 45-64, 65+
All the people aged 15 and over, in a province or a health region and in
one of the nine disorder domains presented in the table of the previous page
For example, suppose we are interested in determining the CV of the estimate of the proportion of occasional drinkers among all individuals aged 25 to 44 who have had a depression episode in the last 12 months. Since the population of interest is one of the populations for which the disorder tables were made, these latter tables have to be used to determine the appropriate approximate CV.
On the other hand, if we are interested in determining the CV of the estimate of the proportion of occasional drinkers among all females aged 25 to 44 who have had a depression episode in the last 12 months, we have to use the general tables, since the females aged 25 to 44 who have had a depression episode in the last 12 months is not one of the domains of disorder previously described (all the individuals aged 25 to 44 who have had a depression episode in the last 12 months is a disorder domain, but not all the females aged 25 to 44).
62
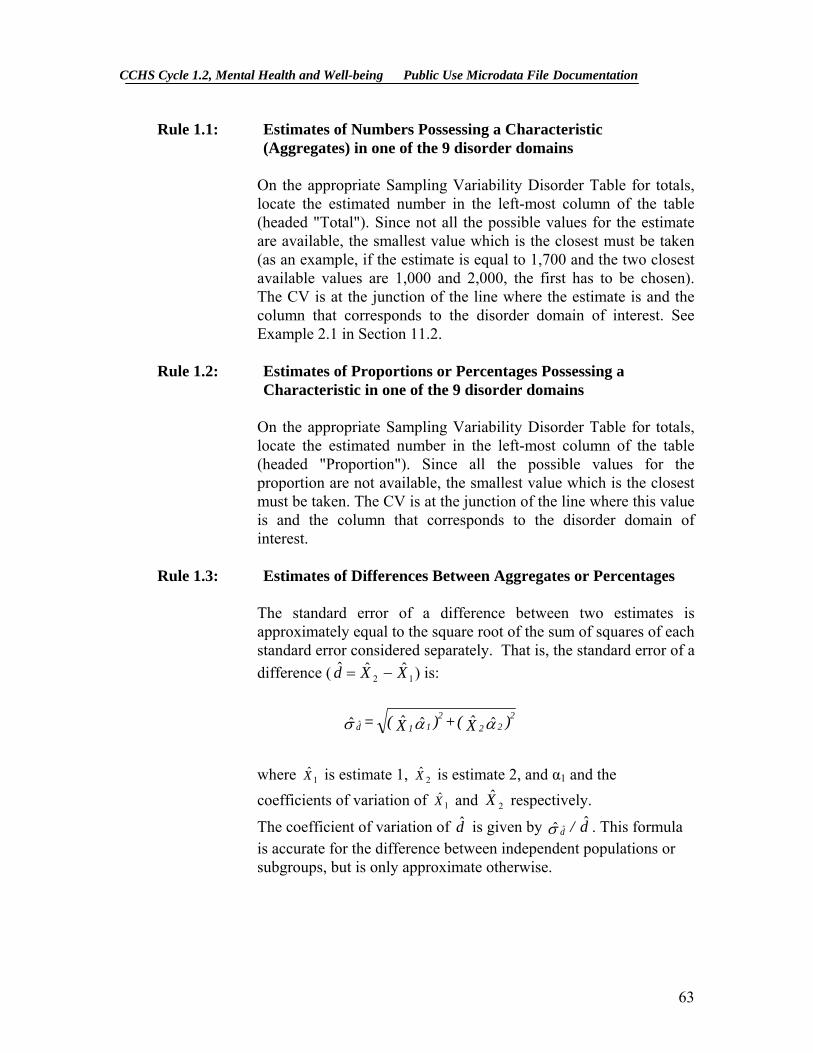
CCHS Cycle 1.2, Mental Health and Well-being Public Use Microdata File Documentation
Rule 1.1: Estimates of Numbers Possessing a Characteristic (Aggregates) in one of the 9 disorder domains
On the appropriate Sampling Variability Disorder Table for totals, locate the estimated number in the left-most column of the table (headed "Total"). Since not all the possible values for the estimate are available, the smallest value which is the closest must be taken (as an example, if the estimate is equal to 1,700 and the two closest available values are 1,000 and 2,000, the first has to be chosen). The CV is at the junction of the line where the estimate is and the column that corresponds to the disorder domain of interest. See Example 2.1 in Section 11.2.
Rule 1.2: Estimates of Proportions or Percentages Possessing a Characteristic in one of the 9 disorder domains
On the appropriate Sampling Variability Disorder Table for totals, locate the estimated number in the left-most column of the table (headed "Proportion"). Since all the possible values for the proportion are not available, the smallest value which is the closest must be taken. The CV is at the junction of the line where this value is and the column that corresponds to the disorder domain of interest.
Rule 1.3: Estimates of Differences Between Aggregates or Percentages
The standard error of a difference between two estimates is approximately equal to the square root of the sum of squares of each standard error considered separately. That is, the standard error of a difference ( ) is: 12
ˆˆˆ XXd −=
) X( + ) X( = 222
112
d αασ ˆˆˆˆˆ ˆ
where is estimate 1, is estimate 2, and α1X 2X 1 and the coefficients of variation of and respectively. 1X 2X
The coefficient of variation of d is given by . This formula is accurate for the difference between independent populations or subgroups, but is only approximate otherwise.
ˆ d / dˆˆ ˆσ
63

CCHS Cycle 1.2, Mental Health and Well-being Public Use Microdata File Documentation
Rule 1.4: Estimates of Ratios
In the case where the numerator is a subset of the denominator, the ratio should be converted to a percentage and Rule 2 applied. This would apply, for example, to the case where the denominator is the number of drinkers among all individuals in Canada who had a depression episode in the last 12 months and the numerator is the number of regular drinkers among all individuals in Canada who have had a depression episode in the last 12 months.
Consider the case where the numerator is not a subset of the denominator, as for example, the ratio of the number of individuals who are occasional or regular drinkers compared to the number of individuals who do not drink at all. The standard deviation of the ratio of the estimates is approximately equal to the square root of the sum of squares of each coefficient of variation considered separately multiplied by , where is the ratio of the estimates ( ). That is, the standard error of a ratio is:
R R
X / X = R 21 ˆˆˆ
αασ ˆˆˆˆ ˆ 22
12
R + R =
where 1α and 2α are the coefficients of variation of and respectively. X 1ˆ X 2ˆ
The coefficient of variation of R is given by αασ ˆˆˆˆ ˆ 2
21
2R + = R / .
The formula will tend to overstate the error, if and are positively correlated and understate the error if and are negatively correlated.
X 1ˆ X 2ˆ
X 1ˆ X 2ˆ
Rule 1.5: Estimates of Differences of Ratios
In this case, Rules 1.3 and 1.4 are combined. The CV's for the two ratios are first determined using Rule 1.4, and then the CV of their difference is found using Rule 1.3.
64

CCHS Cycle 1.2, Mental Health and Well-being Public Use Microdata File Documentation
11.1.2 How to Use the general CV tables
The general tables are made to determine a CV when the population of interest is not one of the disorder domains:
All the individuals aged 15 or more in Canada All the individuals in Canada in one of the following age groups: 15-24,
25-44, 45-64, 65+
All the individuals aged 15 or more in a province or a health region
Any other population that is not one of the disorder domains described in Section 11.1.1
As an example, suppose we are interested in determining the CV of the estimate of the proportion of regular drinkers in Canada, in a province, in a health region, or in one of the following age groups, in Canada: 15-24, 25-44, 45-64, 65+. Since this population is not one of the disorder domains, the general tables have to be used.
Rule 2.1: Estimates of Numbers Possessing a Characteristic (Aggregates) with the general tables
The coefficient of variation depends only on the size of the estimate itself. On the appropriate general Sampling Variability Table, locate the estimated number in the left-most column of the table (headed "Numerator of Percentage") and follow the asterisks (if any) across to the first figure encountered since not all the possible values for the estimate are available, the smallest value which is the closest must be taken). This figure is the approximate coefficient of variation.
Rule 2.2: Estimates of Proportions or Percentages Possessing a Characteristic with the general tables
The coefficient of variation of an estimated proportion (or percentage) depends on both the size of the proportion and the size of the numerator upon which the proportion is based. Estimated proportions are relatively more reliable than the corresponding estimates of the numerator of the proportion when the proportion is based upon a sub-group of the population. This is due to the fact that the coefficients of variation of the latter type of estimates are
65
CCHS Cycle 1.2, Mental Health and Well-being Public Use Microdata File Documentation
based on the largest entry in a row of a particular table, whereas the coefficients of variation of the former type of estimators are based on some entry (not necessarily the largest) in that same row. (Note that in the tables the CV's decline in value reading across a row from left to right). As an example, the estimated proportion of regular drinkers is more reliable than the estimated number of regular drinkers.
When the proportion (or percentage) is based upon the total population covered by each specific table, the CV of the proportion is the same as the CV of the numerator of the proportion. In this case, this is equivalent to applying Rule 1.
When the proportion (or percentage) is based upon a subset of the total population (e.g., those who never drink), reference should be made to the proportion (across the top of the table) and to the numerator of the proportion (down the left side of the table). Since not all the possible values for the proportion are available, the smallest value which is the closest must be taken (for example, if the proportion is 23% and the two closest values available in the column are 20% and 25%, 20% must be chosen) The intersection of the appropriate row and column gives the coefficient of variation.
Rule 2.3: Estimates of Differences between Aggregates or Percentages
Same as Rule 1.3. Rule 2.4: Estimates of Ratios
Same as Rule 1.4.
Rule 2.5: Estimates of Differences of Ratios
Same as Rule 1.5.
66
CCHS Cycle 1.2, Mental Health and Well-being Public Use Microdata File Documentation
11.2 Examples of Using the CV Tables for Categorical Estimates
The following "real life" examples are included to assist users in applying the foregoing rules. Examples 1.1 and 1.2 are related to the general CV tables. Examples 1.3 and 1.4 show how to use these coefficients to evaluate the variability of estimates that are differences of totals, differences of proportions or ratios. Finally, Examples 2.1 and 2.2 show how to use the disorder CV tables. Example 1.1: Estimates of Numbers Possessing a Characteristic (Aggregates) with the general tables
Suppose that a user estimates that 3,037,049 individuals in Canada have had at least one depression episode in their life. How does the user determine the coefficient of variation of this estimate?
1) Refer to the CANADA level general CV table since the target population is all the Canadians (except the out-of-scopes)
2) The estimated aggregate (3,037,049) does not appear in the left-hand column (the "Numerator of Percentage" column), so it is necessary to use the smallest figure closest to it, namely 3,000,000.
3) The coefficient of variation for an estimated aggregate (expressed as a percentage) is found by referring to the first non-asterisk entry on that row, namely, 2.1%.
4) So the approximate coefficient of variation of the estimate is 2.1%. According to the Sampling Variability Guidelines presented in Section 10.4, the finding that there were 3,037,049 individuals have had at least one depression episode in their life is publishable with no qualifications.
Example 1.2: Estimates of Proportions or Percentages Possessing a Characteristic with the general tables
Suppose that the user estimates that 3,037,049/24,996,593 = 12.1% of all the individuals in Canada have had at least one depression episode in their life. How does the user determine the coefficient of variation of this estimate?
1) Refer to the CANADA level general CV table since the estimate is a proportion based on a subpopulation of the total population that is not a disorder domain.
67

CCHS Cycle 1.2, Mental Health and Well-being Public Use Microdata File Documentation
2) It is necessary to use both the percentage (12.1%) and the numerator portion of the percentage (24,996,593) in determining the coefficient of variation.
3) The numerator (3,037,049) does not appear in the left-hand column (the "Numerator of Percentage" column) so it is necessary to use the smallest figure closest to it, namely 3,000,000. Similarly, the percentage estimate does not appear as any of the column headings, so it is necessary to use the smallest figure closest to it (on the right), namely 10.0%.
4) The figure at the right of the intersection of the row and column used (since there are asterisks at this intersection, the first number available at the right must be taken), namely 2.1% is the coefficient of variation (expressed as a percentage) to be used.
5) So the approximate coefficient of variation of the estimate is 2.1%. According to the Sampling Variability Guidelines presented in Section 10.4, the finding that 12.1% of all the individuals in Canada have had at least one depression episode in their life can be published with no qualifications.
Example 1.3: Estimates of Differences Between Aggregates or Percentages
Suppose that a user estimates that, among men, 1,125,806/12,286,111 = 9.1% have had a depression episode in their life (estimate 1), while for women, this percentage is estimated at 1,911,243/12,710,482= 15.0 % (estimate 2). How does the user determine the coefficient of variation of the difference between these two estimates? 1) The Canada level CV general table have to be used to obtain the CV’s of the two estimates since the target populations are men for the first estimate and women for the second. Using this table in the same manner as described in example 1.2 gives the CV for estimate 1 as 3.8% (expressed as a percentage), and the CV for estimate 2 as 3.0% (expressed as a percentage).
68

CCHS Cycle 1.2, Mental Health and Well-being Public Use Microdata File Documentation
2) Using rule 1.3, the standard error of a difference ( d = - ) is : ˆ X 2ˆ X 1ˆ
) X( + ) X( = 222
112
d αασ ˆˆˆˆˆ ˆ
where X 1 is estimate 1, is estimate 2, and ˆ X 2ˆ 1α and 2α are the coefficients of variation of and respectively. X 1ˆ X 2ˆ
The standard error of the difference d = (.091 - .150) = -.059 is : ˆ
006.030.150.038(.091.ˆ ˆ
= )])([( + )])[( = 22
dσ
3) The coefficient of variation of d is given by =
ˆ d / dˆˆ ˆσ
.102.0|059.|006. =−/
4) So the approximate coefficient of variation of the difference between the estimates is 10.2% (expressed as a percentage). According to the Sampling Variability Guidelines presented in Section 10.4, this estimate can be published with no qualifications.
Example 1.4: Estimates of Ratios
Suppose that the user estimates that 14,498,721 individuals are regular drinkers, while 4,760,435 individuals are occasional drinkers. The user is interested in comparing the estimate of daily to occasional smokers in the form of a ratio. How does the user determine the coefficient of variation of this estimate?
1) First of all, this estimate is a ratio estimate, where the numerator of the estimate (= X ) is the number of regular drinkers. The denominator of the estimate (= X ) is the number of occasional drinkers.
1ˆ
2ˆ
2) Refer to the CANADA level general CV table.
3) The numerator of this ratio estimate is 14,498,721. The smallest figure closest to it in the left column of the CV table is 12,500,000. The coefficient of variation for this estimate (expressed as a percentage) is found by referring to the first non-asterisk entry on that row, namely, 0.6%.
69

CCHS Cycle 1.2, Mental Health and Well-being Public Use Microdata File Documentation
4) The denominator of this ratio estimate is 4,760,435. The smallest figure closest to it is 4,000,000. The coefficient of variation for this estimate (expressed as a percentage) is found by referring to the first non-asterisk entry on that row, namely, 1.8%.
5) So the approximate coefficient of variation of the ratio estimate is given by rule 1.4, which is,
ααα ˆˆˆ ˆ 22
12
R + = ,
That is,
9
86ˆ ˆ
0.01 =
)(.01 + )(.00 = 22Rα
where α1 and α2 are the coefficients of variation of and respectively. The obtained ratio of regular drinkers to occasional drinkers is 14,498,721/4,760,435 which is 3.05:1.
X 1ˆ X 2ˆ
The coefficient of variation of this estimate is 1.9% (expressed as a percentage), which is releasable with no qualifications, according to the Sampling Variability Guidelines presented in Section 10.4.
Example 2.1 : Estimates of Numbers Possessing a Characteristic (Aggregates) with the disorder tables Suppose that a user estimates that in Canada, 664,642 individuals among those who have had at least one depressive episode in their life are regular drinkers. How does the user determine the coefficient of variation of this estimate?
1) Refer to the CANADA level disorder CV table for an estimate expressed as a total since the target population is all Canadians who have had at least one depressive period in their life. 2) The estimated aggregate (664,642) does not appear in the left-hand column (the "Total " column), so it is necessary to use the smallest figure closest to it, namely 500,000.
70

CCHS Cycle 1.2, Mental Health and Well-being Public Use Microdata File Documentation
3) The coefficient of variation for an estimated aggregate (expressed as a percentage) is found at the intersection of the column « DEP – Lifetime » and the line found in 2), namely, 5.4%.
4) So the approximate coefficient of variation of the estimate is 5.4%. The finding that there were 664,642 individuals among those who have had at least one depressive episode in their life are regular drinkers is publishable with no qualifications.
Example 2.2 : Estimates of Proportions or Percentages Possessing a Characteristic with the disorder tables
Suppose that the user estimates that 1,195,955 / 3,037,049 = 39.4% of all Canadians, among those who have had at least one depressive episode in their life, have had one of these episodes in the last 12 months. How does the user determine the coefficient of variation of this estimate?
1) Refer to the CANADA level disorder CV table for a proportion since the target population is all Canadians who have had at least one depressive episode in their life.
2) The percentage (39.4%) does not appear in the left-hand column (the "Percentage" column) so it is necessary to use the smallest figure closest to it, namely 35.0 %.
3) The figure at the intersection of the column « DEP – Lifetime » and the line found in 2), namely 3.1%, is the coefficient of variation (expressed as a percentage) to be used.
4) So the approximate coefficient of variation of the estimate is 3.1%. According to the Sampling Variability Guidelines presented in Section 10.4, the finding that 39.4% of all Canadians, among those who have had at least one depression episode in their life, have had one in the last 12 months, can be published with no qualifications.
71

CCHS Cycle 1.2, Mental Health and Well-being Public Use Microdata File Documentation
11.3 How to Use the CV Tables to Obtain Confidence Limits
Although coefficients of variation are widely used, a more intuitively meaningful measure of sampling error is the confidence interval of an estimate. A confidence interval constitutes a statement on the level of confidence that the true value for the population lies within a specified range of values. For example a 95% confidence interval can be described as follows: if sampling of the population is repeated indefinitely, each sample leading to a new confidence interval for an estimate, then in 95% of the samples the interval will cover the true population value.
Using the standard error of an estimate, confidence intervals for estimates may be obtained under the assumption that, under repeated sampling of the population, the various estimates obtained for a population characteristic are normally distributed about the true population value. Under this assumption, the chances are about 68 out of 100 that the difference between a sample estimate and the true population value would be less than one standard error, about 95 out of 100 that the difference would be less than two standard errors, and about 99 out 100 that the differences would be less than three standard errors. These different degrees of confidence are referred to as the confidence levels.
Confidence intervals for an estimate X , are generally expressed as two numbers, one below the estimate and one above the estimate, as ( X -k, X +k), where k is determined depending upon the level of confidence desired and the sampling error of the estimate.
Confidence intervals for an estimate can be calculated directly from the Approximate Sampling Variability Tables by first determining from the appropriate table the coefficient of variation of the estimate X , and then using the following formula to convert to a confidence interval CI:
] Xz + X , Xz - X [ = CI XXX αα ˆˆˆˆˆˆ ˆˆ
where α X is determined coefficient of variation for X , and
z = 1 if a 68% confidence interval is desired z = 1.6 if a 90% confidence interval is desired z = 2 if a 95% confidence interval is desired
z = 3 if a 99% confidence interval is desired.
72
CCHS Cycle 1.2, Mental Health and Well-being Public Use Microdata File Documentation
Note: Release guidelines which apply to the estimate also apply to the confidence interval. For example, if the estimate is not releasable, then the confidence interval is not releasable either.
11.4 Example of Using the CV Tables to Obtain Confidence Limits
A 95% confidence interval for the estimated proportion of individuals who have had a depressive episode in the last 12 months (from example 2.2, sub-section 11.2) would be calculated as follows:
X = 0.394
z = 2
α X = 0.031 is the coefficient of variation of this estimate as determined
from the tables.
CIX = {0.394 - (2) (0.394) (0.031), 0.394 + (2) (0.394) (0.031)}
CIX = {0.370 , 0.418}
11.5 How to Use the CV Tables to do a Z-test
Standard errors may also be used to perform hypothesis testing, a procedure for distinguishing between population parameters using sample estimates. The sample estimates can be numbers, averages, percentages, ratios, etc. Tests may be performed at various levels of significance, where a level of significance is the probability of concluding that the characteristics are different when, in fact, they are identical.
Let and be sample estimates for 2 characteristics of interest. Let the standard error on the difference - be
X 1ˆ X 2ˆ
X 1ˆ X 2ˆ σ d . If the ratio of - over X 1ˆ X 2ˆ σ d is between -2 and 2, then no conclusion about the difference between the characteristics is justified at the 5% level of significance. If however, this ratio is smaller than -2 or larger than +2, the observed difference is significant at the 0.05 level.
73

CCHS Cycle 1.2, Mental Health and Well-being Public Use Microdata File Documentation
11.6 Example of Using the CV Tables to do a Z-test
Let us suppose we wish to test, at 5% level of significance, the hypothesis that there is no difference between the proportion of men who have had a depressive episode AND the proportion of women who have had one. From example 1.3, sub-section 11.2, the standard error of the difference between these two estimates was found to be = .006. Hence,
8.9659
615091ˆˆ
ˆ−
− = .00.0 =
.00. - . = X - X =z
d
21
σ
Since z = -9.8 is smaller than -2, it must be concluded that there is a significant difference between the two estimates at the 0.05 level of significance. Note that the two sub-groups compared are considered as being independent, so the test is correct.
11.7 Exact Variances/Coefficients of Variation
All coefficients of variation in the Approximate Sampling Variability Tables (CV Tables) are indeed approximate and, therefore, unofficial.
The computation of exact coefficients of variation is not a straightforward task since there is no simple mathematical formula that would account for all CCHS sampling frame and weighting aspects. Therefore, other methods such as resampling methods must be used in order to estimate measures of precision. Among these methods, the bootstrap method is the one recommended for analysis of CCHS data.
The computation of coefficients of variation (or any other measure of precision) with the use of the bootstrap method requires access to information that is considered confidential and not available on the public use microdata file. This computation must be done via other avenues, such as remote access. Remote access, as well as other alternatives to obtain exact coefficients of variation, is discussed in sub-section 12.3.
The remote access service allows users to gain access to the bootstrap method for the computation of coefficients of variation. A macro program, called “Bootvar”, was developed in order to give users easy access to the bootstrap method. The Bootvar program is available in SAS and SPSS formats, and is made up of macros that calculate the variances of totals, ratios, differences between ratios, and linear and logistic regressions.
There are a number of reasons why a user may require an exact variance. A few are given below.
74

CCHS Cycle 1.2, Mental Health and Well-being Public Use Microdata File Documentation
Firstly, if a user desires estimates at a geographic level other than those available in the tables (for example, at the rural/urban level), then the CV tables provided are not adequate. Coefficients of variation of these estimates may be obtained using "domain" estimation techniques through the exact variance program.
Secondly, should a user require more sophisticated analyses such as estimates of parameters from linear or logistic regression models, the CV tables will not provide correct associated coefficients of variation. Although some standard statistical packages allow sampling weights to be incorporated in the analyses, the variances that are produced often do not take into account the stratified and clustered nature of the design properly, whereas the exact variance program would do so.
Thirdly, for estimates of quantitative variables, separate tables are required to determine their sampling error. Since most of the variables for the CCHS (Cycle 1.2) are primarily categorical in nature, this has not been done. Thus, users wishing to obtain coefficients of variation for quantitative variables can do so through the exact variance program. As a general rule, however, the coefficient of variation of a quantitative total will be larger than the coefficient of variation of the corresponding category estimate (i.e., the estimate of the number of persons contributing to the quantitative estimate). If the corresponding category estimate is not releasable, the quantitative estimate will not be either. For example, the coefficient of variation of the estimate of the total number of cigarettes smoked each day by individuals who smoke daily would be greater than the coefficient of variation of the corresponding estimate of the number of individuals who smoke daily. Hence if the coefficient of variation of the latter is not releasable, then the coefficient of variation of the corresponding quantitative estimate will also not be releasable. Lastly, should users find themselves in a position where they can use the CV tables, but this renders a coefficient of variation in the "marginal" range (16.6% - 33.3%), the user should release the associated estimate with a warning cautioning users of the high sampling variability associated with the estimate. This would be a good opportunity to recalculate the coefficient of variation through the exact variance program to find out if it is releasable without a qualifying note. The reason for this is that the coefficients of variation produced by the tables are based on a wide range of variables and are therefore considered crude, whereas the exact variance program would give an exact coefficient of variation associated with the variable in question.
75
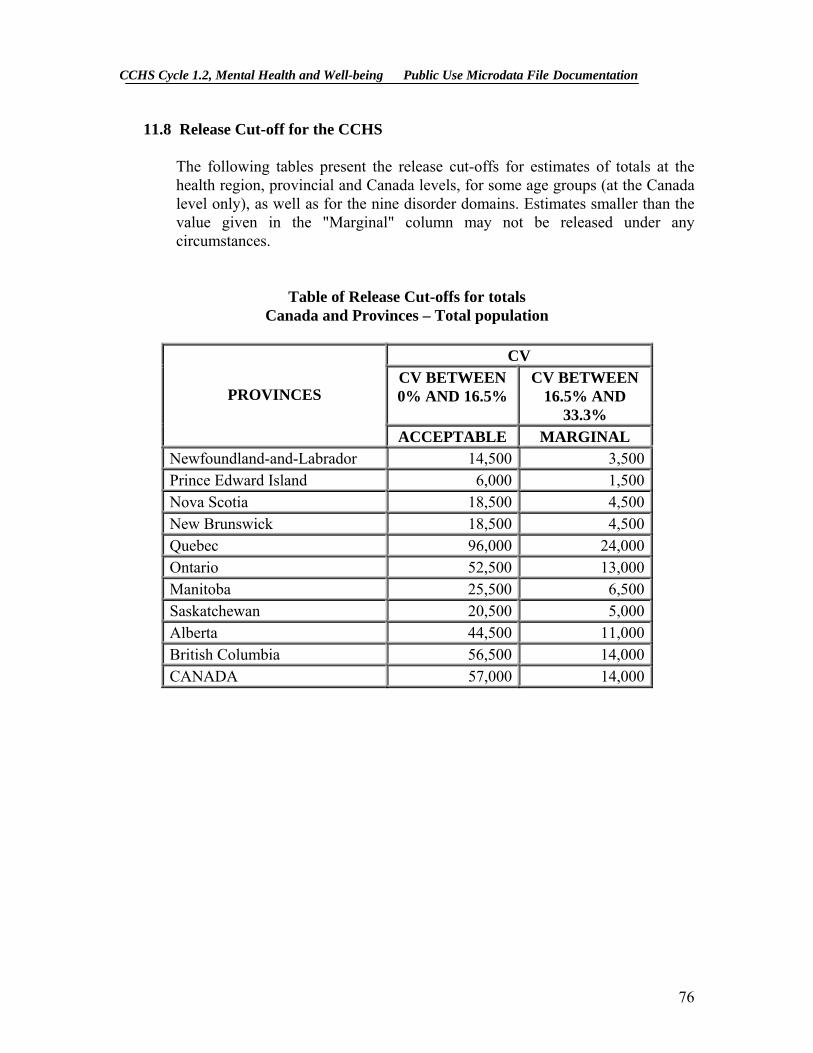
CCHS Cycle 1.2, Mental Health and Well-being Public Use Microdata File Documentation
11.8 Release Cut-off for the CCHS
The following tables present the release cut-offs for estimates of totals at the health region, provincial and Canada levels, for some age groups (at the Canada level only), as well as for the nine disorder domains. Estimates smaller than the value given in the "Marginal" column may not be released under any circumstances.
Table of Release Cut-offs for totals Canada and Provinces – Total population
CV
CV BETWEEN 0% AND 16.5%
CV BETWEEN 16.5% AND
33.3% PROVINCES
ACCEPTABLE MARGINAL Newfoundland-and-Labrador 14,500 3,500 Prince Edward Island 6,000 1,500 Nova Scotia 18,500 4,500 New Brunswick 18,500 4,500 Quebec 96,000 24,000 Ontario 52,500 13,000 Manitoba 25,500 6,500 Saskatchewan 20,500 5,000 Alberta 44,500 11,000 British Columbia 56,500 14,000 CANADA 57,000 14,000
76
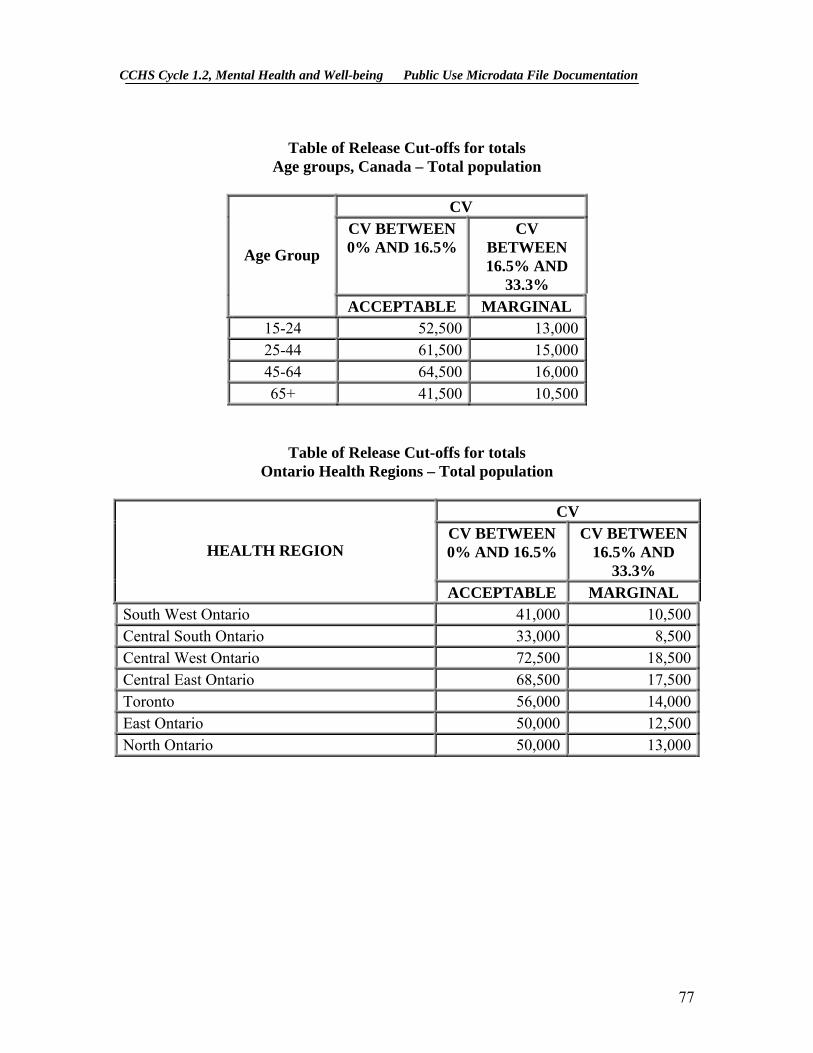
CCHS Cycle 1.2, Mental Health and Well-being Public Use Microdata File Documentation
Table of Release Cut-offs for totals
Age groups, Canada – Total population
CV CV BETWEEN 0% AND 16.5%
CV BETWEEN 16.5% AND
33.3%
Age Group
ACCEPTABLE MARGINAL 15-24 52,500 13,000 25-44 61,500 15,000 45-64 64,500 16,000 65+ 41,500 10,500
Table of Release Cut-offs for totals Ontario Health Regions – Total population
CV
CV BETWEEN 0% AND 16.5%
CV BETWEEN 16.5% AND
33.3% HEALTH REGION
ACCEPTABLE MARGINAL South West Ontario 41,000 10,500Central South Ontario 33,000 8,500Central West Ontario 72,500 18,500Central East Ontario 68,500 17,500Toronto 56,000 14,000East Ontario 50,000 12,500North Ontario 50,000 13,000
77

CCHS Cycle 1.2, Mental Health and Well-being Public Use Microdata File Documentation
Table of Release Cut-offs for totals Canada and Provinces – Disorder domains
CV
CV BETWEEN 0% AND 16.5%
CV BETWEEN 16.5% AND
33.3% PROVINCE DOMAIN
ACCEPTABLE MARGINAL
DEP – 12 months 11,500 3,000DEP – lifetime 11,500 3,000MOOD -12 months 11,500 3,000MOOD – lifetime 11,000 3,000ANX – 12 months 20,500 5,000ANX –lifetime 17,000 4,500SUBS – 12 months 23,500 6,000ALL – 12 months 17,500 4,500
Newfoundland-and-Labrador
ALL – lifetime 14,500 3,500DEP – 12 months 3,500 1,000DEP – lifetime 4,500 1,000MOOD -12 months 3,500 1,000MOOD – lifetime 5,000 1,500ANX – 12 months 3,000 500ANX –lifetime 6,500 1,500SUBS – 12 months 5,500 1,500ALL – 12 months 4,500 1,000
Prince Edward Island
ALL – lifetime 5,500 1,500DEP – 12 months 15,000 4,000DEP – lifetime 20,500 5,000MOOD -12 months 14,500 3,500MOOD – lifetime 23,500 6,000ANX – 12 months 23,000 6,000ANX –lifetime 20,500 5,000SUBS – 12 months 31,000 8,000ALL – 12 months 20,500 5,000
Nova Scotia
ALL – lifetime 22,500 5,500
78

CCHS Cycle 1.2, Mental Health and Well-being Public Use Microdata File Documentation
DEP – 12 months 12,000 3,000DEP – lifetime 13,500 3,500MOOD -12 months 12,000 3,000MOOD – lifetime 13,500 3,500ANX – 12 months 19,000 4,500ANX –lifetime 16,500 4,000SUBS – 12 months 15,500 4,000ALL – 12 months 16,500 4,000
New Brunswick
ALL – lifetime 14,500 3,500DEP – 12 months 64,500 16,000DEP – lifetime 84,000 21,000MOOD -12 months 64,000 16,000MOOD – lifetime 87,500 21,500ANX – 12 months 74,000 18,500ANX –lifetime 87,500 21,500SUBS – 12 months 74,000 18,500ALL – 12 months 71,500 17,500
Quebec
ALL – lifetime 90,000 22,500DEP – 12 months 54,500 13,500DEP – lifetime 51,000 12,500MOOD -12 months 53,000 13,000MOOD – lifetime 51,000 12,500ANX – 12 months 53,500 13,000ANX –lifetime 50,500 12,500SUBS – 12 months 40,500 10,000ALL – 12 months 48,500 12,000
Ontario
ALL – lifetime 51,000 12,500DEP – 12 months 28,500 7,000DEP – lifetime 23,500 6,000MOOD -12 months 28,000 7,000MOOD – lifetime 23,000 5,500ANX – 12 months 26,000 6,500ANX –lifetime 26,500 6,500SUBS – 12 months 20,500 5,000ALL – 12 months 24,000 6,000
Manitoba
ALL – lifetime 25,000 6,500
79

CCHS Cycle 1.2, Mental Health and Well-being Public Use Microdata File Documentation
DEP – 12 months 18,000 4,500DEP – lifetime 18,500 4,500MOOD -12 months 17,500 4,500MOOD – lifetime 19,500 5,000ANX – 12 months 22,000 5,500ANX –lifetime 23,500 6,000SUBS – 12 months 21,500 5,500ALL – 12 months 22,000 5,500
Saskatchewan
ALL – lifetime 22,000 5,500DEP – 12 months 45,500 11,500DEP – lifetime 44,500 11,000MOOD -12 months 44,000 11,000MOOD – lifetime 42,000 10,500ANX – 12 months 43,000 10,500ANX –lifetime 40,500 10,000SUBS – 12 months 31,500 8,000ALL – 12 months 42,000 10,500
Alberta
ALL – lifetime 41,500 10,500DEP – 12 months 37,000 9,000DEP – lifetime 41,500 10,500MOOD -12 months 39,500 10,000MOOD – lifetime 44,000 11,000ANX – 12 months 48,000 12,000ANX –lifetime 56,000 14,000SUBS – 12 months 54,000 13,500ALL – 12 months 52,000 13,000
British-Columbia
ALL – lifetime 52,500 13,000DEP – 12 months 50,500 12,500DEP – lifetime 57,500 14,000MOOD -12 months 50,000 12,500MOOD – lifetime 59,500 14,500ANX – 12 months 52,000 13,000ANX –lifetime 55,500 13,500SUBS – 12 months 43,500 10,500ALL – 12 months 51,000 12,500
CANADA
ALL – lifetime 58,500 14,500
80

CCHS Cycle 1.2, Mental Health and Well-being Public Use Microdata File Documentation
Table of Release Cut-offs for totals Ontario Health Regions – Disorder domains
CV CV BETWEEN 0% AND 16.5%
CV BETWEEN 16.5% AND
33.3% HEALTH REGION DOMAIN
ACCEPTABLE MARGINAL
DEP – 12 months 19,500 6,500DEP – lifetime 24,000 7,000MOOD -12 months 19,000 6,500MOOD – lifetime 24,500 7,000ANX – 12 months 19,500 7,000ANX –lifetime 36,000 11,000SUBS – 12 months 15,500 6,500ALL – 12 months 26,500 8,000
South West Ontario
ALL – lifetime 35,000 9,500DEP – 12 months 15,000 5,000DEP – lifetime 23,000 6,500MOOD -12 months 17,500 6,000MOOD – lifetime 25,000 7,500ANX – 12 months 18,000 6,000ANX –lifetime 28,500 8,500SUBS – 12 months 16,500 6,500ALL – 12 months 22,000 6,500
Central South Ontario
ALL – lifetime 33,000 9,500DEP – 12 months 64,500 28,000DEP – lifetime 70,000 23,000MOOD -12 months 64,000 26,500MOOD – lifetime 69,500 22,000ANX – 12 months 51,000 20,500ANX –lifetime 52,000 16,000SUBS – 12 months 20,000 7,500ALL – 12 months 57,000 17,500
Central West Ontario
ALL – lifetime 60,500 17,000
81

CCHS Cycle 1.2, Mental Health and Well-being Public Use Microdata File Documentation
DEP – 12 months 21,000 7,000DEP – lifetime 33,500 10,000MOOD -12 months 20,500 6,500MOOD – lifetime 35,500 10,500ANX – 12 months 39,500 15,000ANX –lifetime 42,500 12,500SUBS – 12 months 24,500 10,000ALL – 12 months 41,000 12,500
Central East Ontario
ALL – lifetime 46,000 13,000DEP – 12 months 25,000 8,000DEP – lifetime 34,500 10,000MOOD -12 months 25,000 8,000MOOD – lifetime 34,000 9,500ANX – 12 months 29,500 9,500ANX –lifetime 33,500 9,500SUBS – 12 months 13,500 5,500ALL – 12 months 29,000 8,000
Toronto
ALL – lifetime 39,000 10,500DEP – 12 months 25,000 8,500DEP – lifetime 34,000 10,000MOOD -12 months 26,500 9,000MOOD – lifetime 36,500 10,500ANX – 12 months 29,000 11,000ANX –lifetime 40,000 12,000SUBS – 12 months 20,000 9,000ALL – 12 months 40,000 12,500
East Ontario
ALL – lifetime 42,000 11,500DEP – 12 months 19,000 7,000DEP – lifetime 22,000 6,500MOOD -12 months 19,000 7,000MOOD – lifetime 21,500 6,500ANX – 12 months 12,000 4,000ANX –lifetime 18,000 5,500SUBS – 12 months 14,500 6,500ALL – 12 months 22,500 7,000
North Ontario
ALL – lifetime 24,000 7,000
82
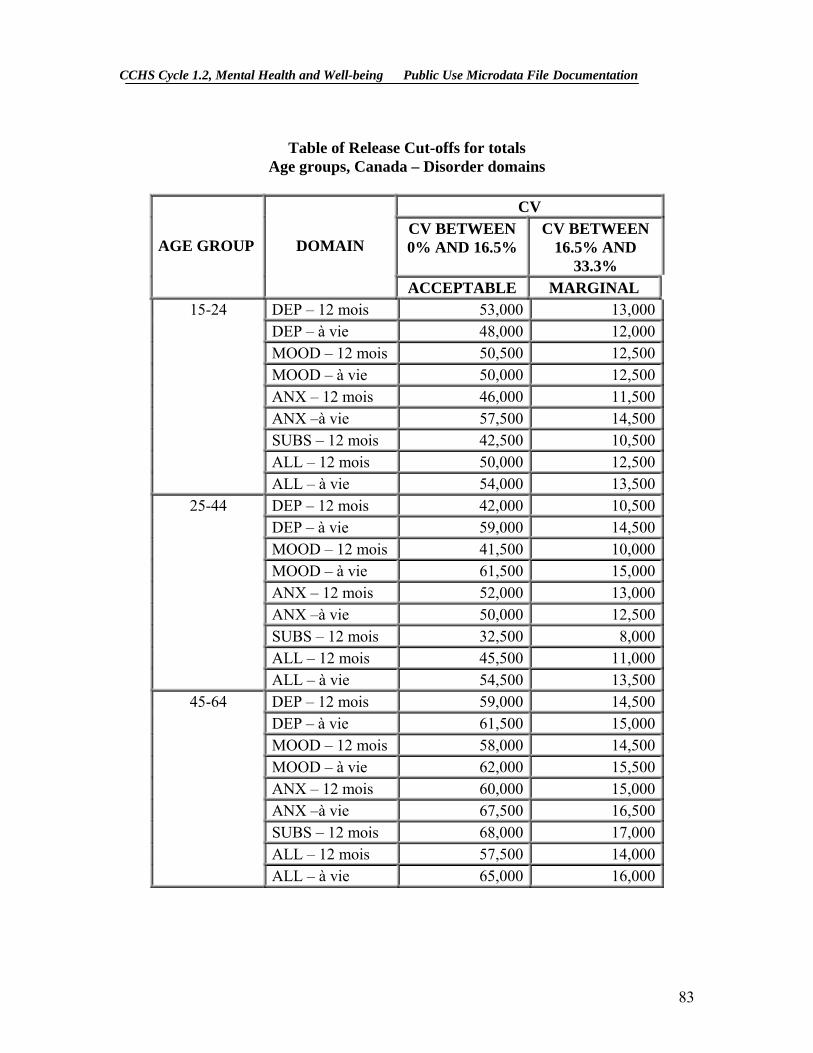
CCHS Cycle 1.2, Mental Health and Well-being Public Use Microdata File Documentation
Table of Release Cut-offs for totals
Age groups, Canada – Disorder domains
CV CV BETWEEN 0% AND 16.5%
CV BETWEEN 16.5% AND
33.3% AGE GROUP DOMAIN
ACCEPTABLE MARGINAL 15-24 DEP – 12 mois 53,000 13,000
DEP – à vie 48,000 12,000MOOD – 12 mois 50,500 12,500MOOD – à vie 50,000 12,500ANX – 12 mois 46,000 11,500ANX –à vie 57,500 14,500SUBS – 12 mois 42,500 10,500ALL – 12 mois 50,000 12,500
ALL – à vie 54,000 13,50025-44 DEP – 12 mois 42,000 10,500
DEP – à vie 59,000 14,500MOOD – 12 mois 41,500 10,000MOOD – à vie 61,500 15,000ANX – 12 mois 52,000 13,000ANX –à vie 50,000 12,500SUBS – 12 mois 32,500 8,000ALL – 12 mois 45,500 11,000
ALL – à vie 54,500 13,50045-64 DEP – 12 mois 59,000 14,500
DEP – à vie 61,500 15,000MOOD – 12 mois 58,000 14,500MOOD – à vie 62,000 15,500ANX – 12 mois 60,000 15,000ANX –à vie 67,500 16,500SUBS – 12 mois 68,000 17,000ALL – 12 mois 57,500 14,000
ALL – à vie 65,000 16,000
83

CCHS Cycle 1.2, Mental Health and Well-being Public Use Microdata File Documentation
65+ DEP – 12 mois 46,500 11,500
DEP – à vie 40,500 10,000MOOD – 12 mois 46,500 11,500MOOD – à vie 40,500 10,000ANX – 12 mois 45,000 11,000ANX –à vie 39,000 9,500SUBS – 12 mois N/A N/AALL – 12 mois 38,500 9,500
ALL – à vie 39,000 9,500
84

CCHS Cycle 1.2, Mental Health and Well-being Public Use Microdata File Documentation
12. File Usage This section starts by describing the weight variable of the master file and explains how it should be used when doing tabulations on the public use microdata file. This is followed by an explanation of the variable naming convention that is employed for the CCHS. The last part of the section discusses alternate approaches to data access available to analysts.
12.1 Use of Weights
Only one weight, WTSB_M, appears on the file. This weight is applicable to all age groups, provinces and territories. ALL VARIABLES ON THE FILE SHOULD BE ANALYZED USING THIS WEIGHT.
(For a more detailed explanation on the creation of this weight, see Section 8 of the documentation on weighting.)
12.2 Variable Naming Convention
The CCHS adopted a variable naming convention that allows data users to easily use and identify the data based on module and cycle. The variable naming convention includes the following mandatory requirements: restrict variable names to a maximum of 8 characters for ease of use by analytical software products; identify the survey cycle (Cycle 1.1, 1.2 …) in the name; and allow conceptually identical variables to be easily identifiable over survey cycles. The variable names for these identical modules and questions should only differ in the cycle position identifying the particular survey occasion in which they were collected.
12.2.1 Variable Name Component Structure in CCHS
Each of the eight characters in a variable name contains information about the type of data contained in the variable.
Positions 1 to 3: Module/Questionnaire section name
Position 4: Survey cycle
Position 5: Variable type
Positions 6 to 8: Question number
85
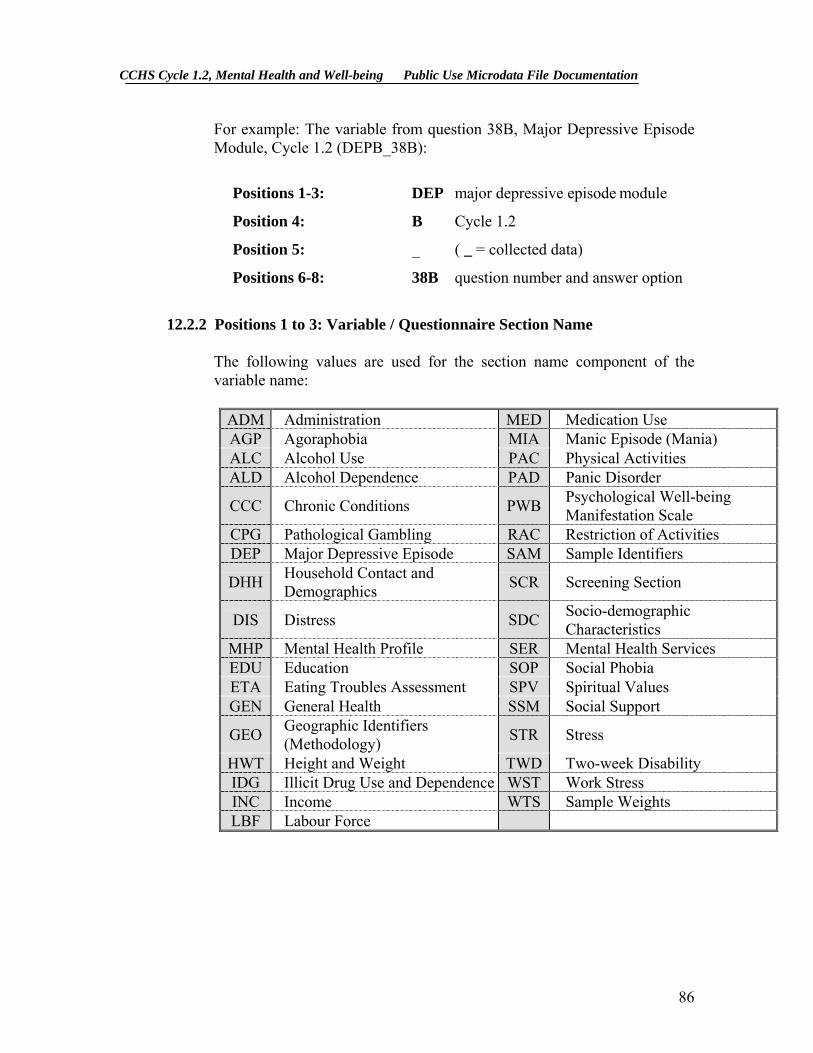
CCHS Cycle 1.2, Mental Health and Well-being Public Use Microdata File Documentation
For example: The variable from question 38B, Major Depressive Episode Module, Cycle 1.2 (DEPB_38B):
Positions 1-3: DEP major depressive episode module
Position 4: B Cycle 1.2
Position 5: _ ( _ = collected data)
Positions 6-8: 38B question number and answer option
12.2.2 Positions 1 to 3: Variable / Questionnaire Section Name
The following values are used for the section name component of the variable name:
ADM Administration MED Medication Use AGP Agoraphobia MIA Manic Episode (Mania) ALC Alcohol Use PAC Physical Activities ALD Alcohol Dependence PAD Panic Disorder
CCC Chronic Conditions PWB Psychological Well-being Manifestation Scale
CPG Pathological Gambling RAC Restriction of Activities DEP Major Depressive Episode SAM Sample Identifiers
DHH Household Contact and Demographics SCR Screening Section
DIS Distress SDC Socio-demographic Characteristics
MHP Mental Health Profile SER Mental Health Services EDU Education SOP Social Phobia ETA Eating Troubles Assessment SPV Spiritual Values GEN General Health SSM Social Support
GEO Geographic Identifiers (Methodology) STR Stress
HWT Height and Weight TWD Two-week Disability IDG Illicit Drug Use and Dependence WST Work Stress INC Income WTS Sample Weights LBF Labour Force
86

CCHS Cycle 1.2, Mental Health and Well-being Public Use Microdata File Documentation
12.2.3 Position 4: Cycle
Cycle Description
A Cycle 1.1: Canadian Community Health Survey
: Regional level survey, stratified by health region; : Common content and optional content selected by health region; : Estimates for health regions, provinces, territories and Canada.
B Cycle 1.2: Canadian Community Health Survey, Mental Health and Well-Being
: Provincial level survey; : Focus content with additional, general content; : Estimates for the provinces and Canada.
12.2.4 Position 5: Variable Type
_ Collected variable A variable that appeared directly on the questionnaire
C Coded variable A variable coded from one or more collected variables (e.g., Standard Industrial Classification code (SIC))
D Cross-sectional derived variable
A variable calculated from one or more collected or coded variables, usually calculated during head office processing (e.g., Health Utility Index)
F Flag variable A variable calculated from one or more collected variables (like a derived variable), but usually calculated by the data collection computer application for later use during the interview (e.g., work flag)
G Grouped variable Collected, coded, suppressed or derived variables collapsed into groups (e.g., age groups)
I Imputation flag variable
A flag variable associated with another variable in the data file and that indicates whether the latter was imputed or not. Refer to the data dictionary to identify which variable the flag variable is associated with.
87
CCHS Cycle 1.2, Mental Health and Well-being Public Use Microdata File Documentation
12.2.5 Positions 6 to 8: Variable Name
In general, the last three positions follow the variable numbering used on the questionnaire. The letter "Q" used to represent the word "question" is removed, and all question numbers are presented in a two- digit format. For example, question Q01A in the questionnaire becomes simply 01A, and question Q15 becomes simply 15.
For questions which have more than one response option, the final position in the variable naming sequence is represented by a letter. For this type of question, new variables were created to differentiate between a “yes” or “no” answer for each response option. For example, if Q2 had 4 response options, the new questions would be named Q2A for option 1, Q2B for option 2, Q2C for option 3, etc. If only options 2 and 3 were selected, then Q2A = No, Q2B = Yes, Q2C = Yes and Q2D = No.
12.3 Access to Master File Data
In order to protect the confidentiality of respondents participating in the survey, microdata files must meet stringent security and confidentiality standards required by the Statistics Act before they are released for public access. To ensure that these standards have been achieved, each microdata file goes through a formal review process to ensure that an individual cannot be identified. Rare values in variables that may lead to identification of an individual are suppressed on the file or are collapsed to broader categories so that individual disclosure is minimized. Frequently, these are the variables that are most critical for doing a complete and comprehensive analysis of the survey data. Since a significant amount of resources is spent on collecting these data, ensuring that the microdata files reach their full analytical potential is important for a complete return on the statistical investment.
Remote access to the survey master file is one way to have access to these data. Each user of the microdata product can be supplied with a ‘dummy’ test master file and a corresponding record layout. With this, the user can spend time developing a set of analytical computer programs using the test file to confirm that the program commands are functioning correctly. At that point, the code for the custom tabulations is then sent via e-mail. The code will then be transferred into Statistics Canada’s internal secured network and processed using the appropriate master file of CCHS Cycle 1.2 data. Remote access allows computer programs to be submitted by users for processing at Statistics Canada. Estimates generated will be released to the user, subject to meeting the guidelines for analysis and release outlined in Section 10 of this document. Results are
88

CCHS Cycle 1.2, Mental Health and Well-being Public Use Microdata File Documentation
screened for confidentiality and reliability concerns and, once these have been addressed, the output is returned to the client. There is no charge for this service. For more information, contact the Data Access Unit at the following address: [email protected].
A second approach for any client is the production of custom tabulations done by the Client Custom Services staff in Health Statistics Division. This service allows users who do not possess knowledge of tabulation software products to get custom results. As with remote access, the results are screened for confidentiality and reliability concerns before release. Unlike remote access, there is a charge for this service. You can have access to this service by writing to [email protected].
Finally, the Research Data Centre’s Program allows researchers to submit to Statistics Canada, a research project that uses data from the Master File. These projects are accepted based on a set of specific rules. When the project is accepted, the researcher is designated as a "deemed employee" of Statistics Canada for the duration of the research, and given access to the Master File data from designated Statistics Canada sites. For more information on this program, please consult the Statistics Canada website at the following address: http://www.statcan.ca/english/rdc/index.htm.
89