Canadian Bioinformatics Workshops
98
Canadian Bioinformatics Workshops www.bioinformatics.ca
-
Upload
avram-caldwell -
Category
Documents
-
view
24 -
download
0
description
Canadian Bioinformatics Workshops. www.bioinformatics.ca. Module #: Title of Module. 2. Module 7 Metabolomic Data Analysis Using MetaboAnalyst. David Wishart Informatics and Statistics for Metabolomics July 8-9-2013. Learning Objectives. - PowerPoint PPT Presentation
Transcript of Canadian Bioinformatics Workshops

Canadian Bioinformatics Workshops
www.bioinformatics.ca

2Module #: Title of Module
Module 7Metabolomic Data Analysis Using
MetaboAnalyst

Learning Objectives
• To become familiar with the standard metabolomics data analysis workflow
• To become aware of key elements such as: data integrity checking, outlier detection, quality control, normalization, scaling, etc.
• To learn how to use MetaboAnalyst to facilitate data analysis

A Typical Metabolomics Experiment

2 Routes to Metabolomics
1234567ppm
hippurate urea
allantoin creatininehippurate
2-oxoglutarate
citrate
TMAO
succinatefumarate
water
creatinine
taurine
1234567ppm
-25
-20
-15
-10
-5
0
5
10
15
20
25
-30 -20 -10 0 10
PC1
PC2
PAP
ANIT
Control
Quantitative (Targeted)Methods
Chemometric (Profiling)Methods

Metabolomics Data Workflow
• Data Integrity Check• Spectral alignment or
binning• Data normalization• Data QC/outlier
removal• Data reduction &
analysis• Compound ID
• Data Integrity Check• Compound ID and
quantification• Data normalization• Data QC/outlier
removal• Data reduction &
analysis
Chemometric Methods Targeted Methods

Data Integrity/Quality• LC-MS and GC-MS have
high number of false positive peaks
• Problems with adducts (LC), extra derivatization products (GC), isotopes, breakdown products (ionization issues), etc.
• Not usually a problem with NMR
• Check using replicates and adduct calculators
MZedDB http://maltese.dbs.aber.ac.uk:8888/hrmet/index.htmlHMDB http://www.hmdb.ca/search/spectra?type=ms_search

Data/Spectral Alignment• Important for LC-MS
and GC-MS studies• Not so important for
NMR (pH variation)• Many programs
available (XCMS, ChromA, Mzmine)
• Most based on time warping algorithms
http://mzmine.sourceforge.net/http://bibiserv.techfak.uni-bielefeld.de/chromahttp://metlin.scripps.edu/download/

bin1 bin2 bin3 bin4 bin5 bin6 bin7 bin8...
xi,yi
x = 232.1 (AOC)y = 10 (bin #)
Binning (3000 pts to 14 bins)

Data Normalization/Scaling
• Can scale to sample or scale to feature
• Scaling to whole sample controls for dilution
• Normalize to integrated area, probabilistic quotient method, internal standard, sample specific (weight or volume of sample)
• Choice depends on sample & circumstances
Same or different?

Data Normalization/Scaling
• Can scale to sample or scale to feature
• Scaling to feature(s) helps manage outliers
• Several feature scaling options available: log transformation, auto-scaling, Pareto scaling, probabilistic quotient, and range scaling
MetaboAnalyst http://www.metaboanalyst.caDieterle F et al. Anal Chem. 2006 Jul 1;78(13):4281-90.

Data QC, Outlier Removal & Data Reduction
• Data filtering (remove solvent peaks, noise filtering, false positives, outlier removal -- needs justification)
• Dimensional reduction or feature selection to reduce number of features or factors to consider (PCA or PLS-DA)
• Clustering to find similarity

MetaboAnalyst
http://www.metaboanalyst.ca
• Web server designed to handle large sets of LC-MS, GC-MS or NMR-based metabolomic data
• Supports both univariate and multivariate data processing, including t-tests, ANOVA, PCA, PLS-DA
• Identifies significantly altered metabolites, produces colorful plots, provides detailed explanations & summaries
• Links sig. metabolites to pathways via SMPDB

MetaboAnalyst Workflow
15

Other utilities
Two/multi-group analysisEnrichment analysis Time-series analysis
Quality checkingImage Center
• GC/LC-MS raw spectra• Peak lists• Spectral bins• Concentration table
• Spectra processing • Peak processing• Noise filtering• Missing value estimation
• Row-wise normalization • Column-wise normalization• Combined approach
Data input Data processing Data normalizationData integrity
check
Functional Interpretation Statistical Exploration
• Univariate analysis • Correlation analysis• Chemometric analysis• Feature selection • Cluster analysis • Classification
• Data overview • Two-way ANOVA• ANOVA - SCA• Time-course analysis
Pathway analysis
• Enrichment analysis• Topology analysis• Interactive visualization
• Over representation analysis• Single sample profiling• Quantitative enrichment analysis
Outputs
• Resolution: 150/300/600 dpi• Format: png, tiff, pdf, svg, ps
• Processed data• Result tables• Analysis report• Images
• Methods comparision• Temporal drift• Batch effect• Biolgoical checking
• Peak searching • Pathway mapping• Name/ID conversion• Lipidomics

MetaboAnalyst Overview
• Raw data processing– Using MetaboAnalyst
• Data Reduction & Statistical analysis– Using MetaboAnalyst
• Functional enrichment analysis– Using MSEA in MetaboAnalyst
• Metabolic pathway analysis– Using MetPA in MetaboAnalyst

Example Datasets

Example Datasets
Metabolomic Data Processing
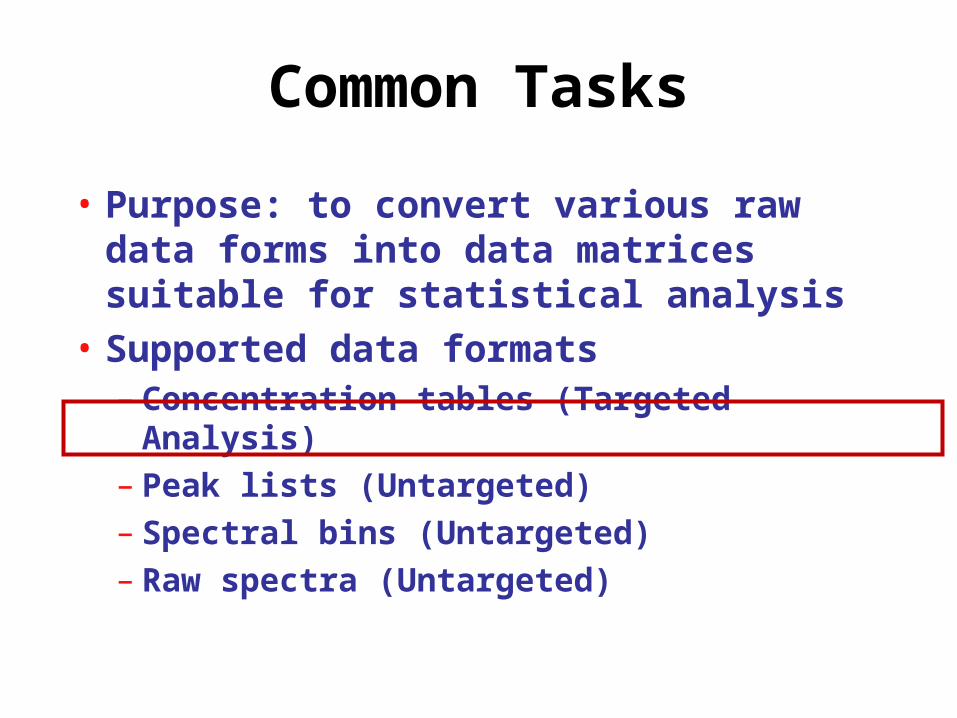
Common Tasks
• Purpose: to convert various raw data forms into data matrices suitable for statistical analysis
• Supported data formats– Concentration tables (Targeted Analysis)– Peak lists (Untargeted)– Spectral bins (Untargeted)– Raw spectra (Untargeted)

Data Upload

Alternatively …

Data Set Selected
• Here we will be selecting a data set from dairy cattle fed different proportions of cereal grains (0%, 15%, 30%, 45%)
• The rumen was analyzed using NMR spectroscopy using quantitative metabolomic techniques
• High grain diets are thought to be stressful on cows

Data Integrity Check

Data Normalization

Data Normalization• At this point, the data has been transformed to a
matrix with the samples in rows and the variables (compounds/peaks/bins) in columns
• MetaboAnalyst offers three types of normalization, row-wise normalization, column-wise normalization and combined normalization
• Row-wise normalization aims to make each sample (row) comparable to each other (i.e. urine samples with different dilution effects)

Data Normalization
• Column-wise normalization aims to make each variable (column) comparable in scale to each other, thereby generating a “normal” distribution
• This procedure is useful when variables are of very different orders of magnitude
• Four methods have been implemented for this purpose – log transformation, autoscaling, Pareto scaling and range scaling

Normalization Result

Quality Control
• Dealing with outliers – Detected mainly by visual inspection– May be corrected by normalization– May be excluded
• Noise reduction– More of a concern for spectral bins/
peak lists – Usually improves downstream results

Visual Inspection
• What does an outlier look like?
Finding outliers via PCA Finding outliers via Heatmap

Outlier Removal

Noise Reduction

Noise Reduction (cont.)
• Characteristics of noise & uninformative features– Low intensities– Low variances (default)

Data Reduction and Statistical Analysis
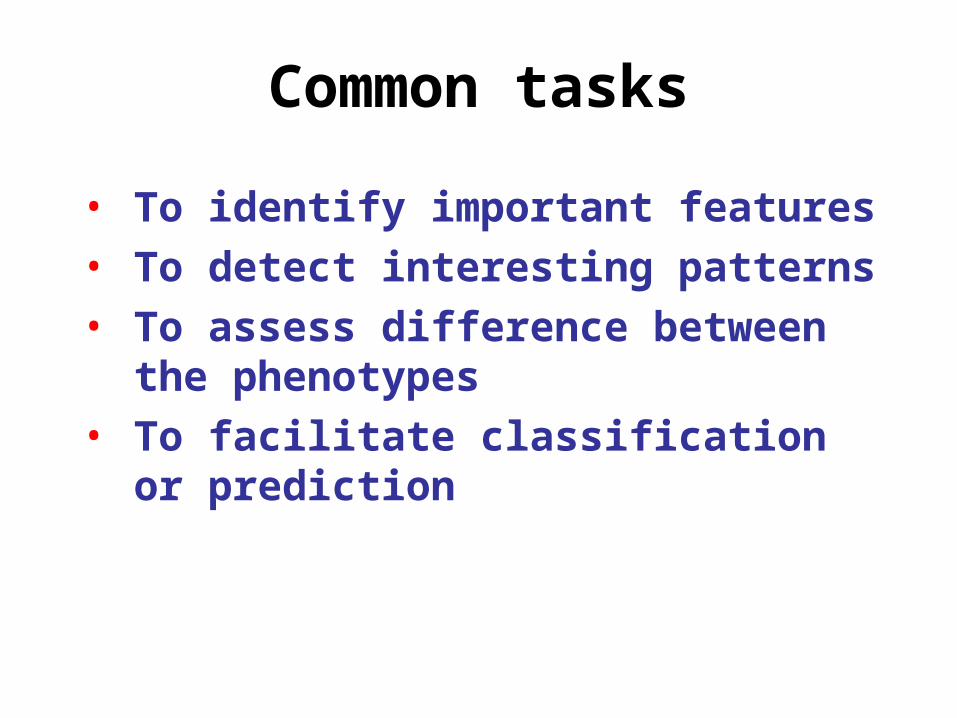
Common tasks
• To identify important features
• To detect interesting patterns
• To assess difference between the phenotypes
• To facilitate classification or prediction


ANOVA

View Individual Compounds

Questions• Q: Which compounds show
significant difference among all the neighboring groups (0-15, 15-30, and 30-45)?
• Q: For Uracil, are groups 15, 30, 45 significantly different from each other?

Overall correlation pattern

Specify format
Specify resolution
Specify size
High resolution image

Question
• Q: In untargeted metabolomics using NMR, researchers often look for region(s) on the spectra showing biggest change in their correlation patterns under different conditions. Can you do that in MetaboAnalyst?
• Hint: check the available parameters of Correlation analysis

Template Matching• Looking for compounds showing interesting
patterns of change• Essentially a method to look for linear trends or
periodic trends in the data• Best for data that has 3 or more groups

Template Matching (cont.)
Strong linear + correlationto grain %
Strong linear - correlationto grain %

Question
• Q: Identify compounds that decrease in the first three groups but increase in the last group?

PCA Scores Plot

PCA Loading Plot
Compoundsmost responsiblefor separation

3D-PCA
49

Question
Q: Identify compounds that contribute most to the separation between group 15 and 45

PLS-DA Score Plot

Evaluation of PLS-DA Model
• PLS-DA Model evaluated by cross validation of Q2 and R2
• More principal components to model improves quality of fit, but try to minimize this value
• 3 Component (3 PCs)model seems to be a good compromise here
• Good R2/Q2 (>0.7)

Important Compounds

Model Validation

Questions
• Q: What does p < 0.01 mean?
• Q: How many permutations need to be performed if you want to claim p value < 0.0001?
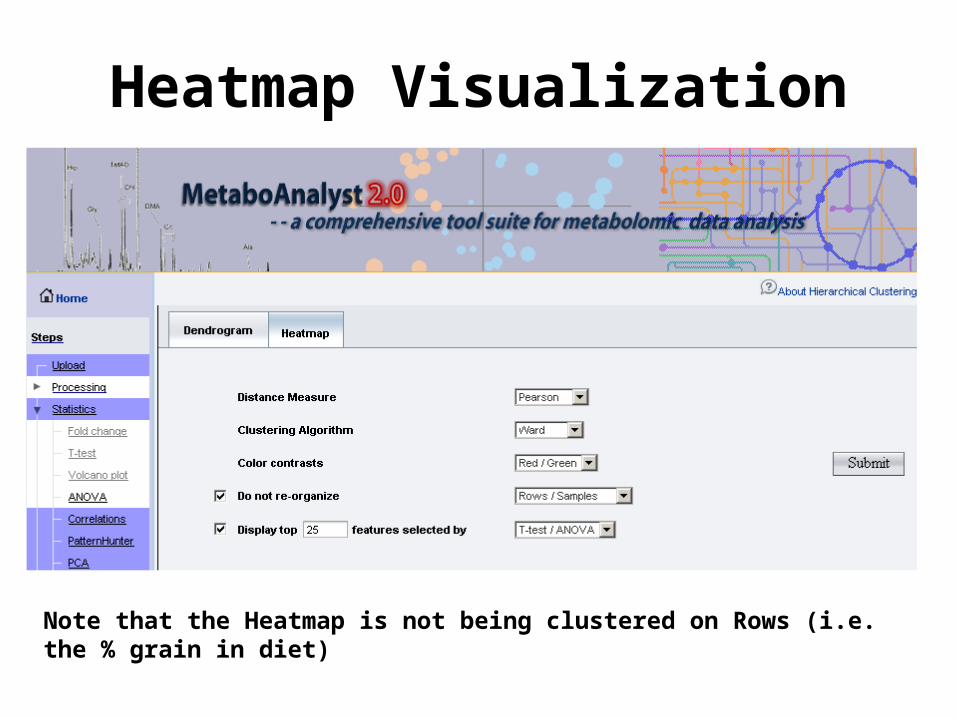
Heatmap Visualization
Note that the Heatmap is not being clustered on Rows (i.e. the % grain in diet)

Heatmap Visualization (cont.)

Question
Q: Identify compounds with a low concentration in group 0, 15 but increase in the group 35 and 45
Q: Which compound is the only one significantly increased in group 45?
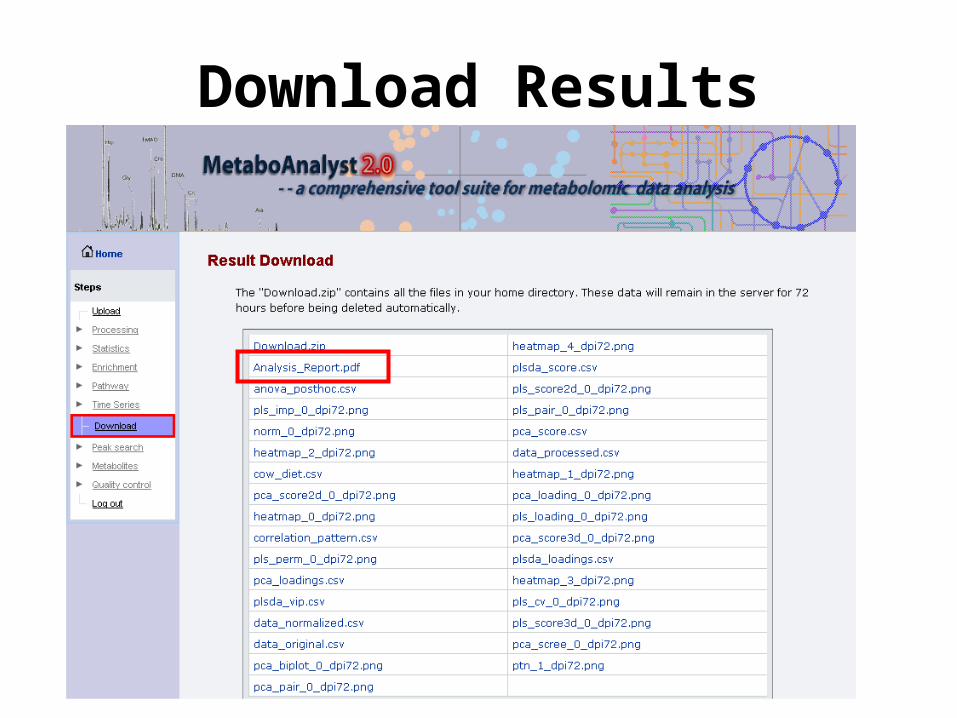
Download Results

Analysis Report
Metabolite Set Enrichment Analysis

Metabolite Set Enrichment Analysis (MSEA)
http://www.msea.ca
• Web tool designed to handle lists of metabolites (with or without concentration data)
• Modeled after Gene Set Enrichment Analysis (GSEA)
• Supports over representation analysis (ORA), single sample profiling (SSP) and quantitative enrichment analysis (QEA)
• Contains a library of 6300 pre-defined metabolite sets including 85 pathway sets & 850 disease sets
Enrichment Analysis
• Purpose: To test if there are some biologically meaningful groups of metabolites that are significantly enriched in your data
• Biological meaningful– Pathways– Disease– Localization
• Currently, only supports human metabolomic data
MSEA
• Accepts 3 kinds of input files• 1) list of metabolite names only (ORA)• 2) list of metabolite names +
concentration data from a single sample (SSP)
• 3) a concentration table with a list of metabolite names + concentrations for multiple samples/patients (QEA)

The MSEA approach
65
Assess metabolite sets directly
Compound concentrations
Compound concentrations
Compound selection (t-tests, clustering)
Abnormal compoundsAbnormal compounds
Compound concentrations Compound concentrations
Metabolite set librariesMetabolite set libraries
Over Representation Analysis
Quantitative Enrichment Analysis
Biological interpretation
Find enriched biological themes
Compound concentrations
Compound concentrations
Important compound listsImportant compound lists
Single Sample Profiling
Compare to normal references
ORA inputFor MSEA

Data Set Selected
• Here we are using a collection of metabolites identified by NMR (compound list + concentrations) from the urine from 77 lung and colon cancer patients, some of whom were suffering from cachexia (muscle wasting)

Start with a Compound List

Upload Compound List
Normally GSEAwould requirea list of all knowngenes for the givenplatform. Here we just use the list of metabolites foundin KEGG. ORA isa “weak” analysis inMSEA
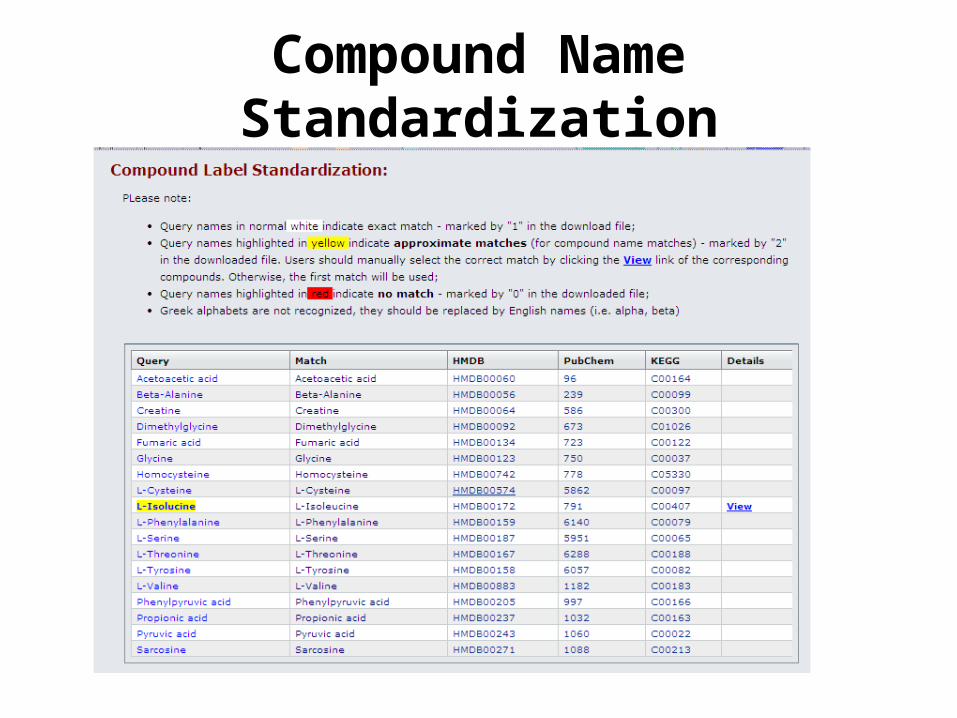
Compound Name Standardization

Name Standardization (cont.)

Select a Metabolite Set Library

Result

Result (cont.)

The Matched Metabolite Set

Single Sample Profiling(Basically used by a physician to
analyze a patient)

Single Sample Profiling (cont.)

Concentration Comparison
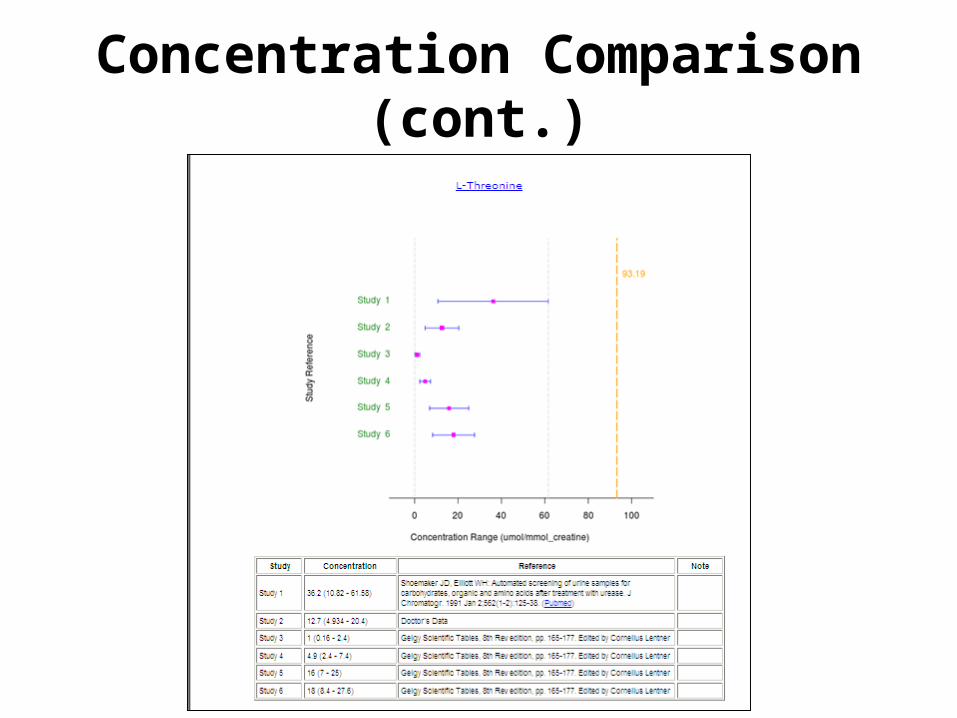
Concentration Comparison (cont.)

Quantitative Enrichment Analysis

Result

The Matched Metabolite Set

Question
• Q: Are these metabolites increased or decreased in the cachexia group?

Metabolic Pathway Analysis with MetPA

Pathway Analysis
• Purpose: to extend and enhance metabolite set enrichment analysis for pathways by – Considering the pathway structures– Supporting pathway visualization
• Currently supports 15 organisms

Data Upload

Data Set Selected
• Here we are using a collection of metabolites identified by NMR (compound list + concentrations) from the urine from 77 lung and colon cancer patients, some of whom were suffering from cachexia (muscle wasting)

Normalization

Pathway Libraries

Network Topology Analysis

Position Matters
90
Junker et al. BMC Bioinformatics 2006
Which positions are important?
Hubs Nodes that are highly
connected (red ones) Bottlenecks
Nodes on many shortest paths between other nodes (blue ones)
Graph theory Degree centrality Betweenness centrality

Which Node is More Important?
High betweenness centrality
High degree centrality

Pathway Visualization

Pathway Visualization (cont.)

Question
• Q: Which pathway do you think is likely to be affected the most? Why?

Result

Not Everything Was Covered
• Clustering (K-means, SOM)
• Classification (SVM, randomForests)
• Time-series data analysis
• Two factor data analysis
• Data quality checks
• Peak searching
• ….

Time Series Analysis in MetaboAnalyst
97

Quality Checking Module