
Canada_Economics_Focus_-_House_Prices_(Feb_11)
7
Canada Economics Focus 1 CANADA ECONOMICS FOCUS 3 r d F e b . 2 0 1 1 House prices likely to fall for several years The recent housing boom has resulted in the largest rises in house prices ever seen in Canada, which have been similar in magnitude to those during the recent boom in the US. Unfortunately, the subsequent falls in prices could also be just as severe as those elsewhere. We predict that nominal house prices are likely to decline by a cumulative 25% over the next few years, in the same ball-park as the recorded declines in the US and other countries . Growth in future personal disposable income per worker will not close the large gap between house prices and income within any reasonable length of time. Various housing affordability ratios have been used to rationalise high house prices relative to income. However, this justification is flawed and potentially misleading because it fails to take account of inflation. In a low inflation environment, you should expect lower nominal mortgage rates to result in a lower housing affordability ratio. More importantly, the real burden of mortgage payments will change little over time because nominal household income is growing at a slower pace. In short, while housing affordability may seem reasonable at present, longer-term housing affordability is anything but. Even small rises in official interest rates have been shown to have a big effect on homeowner confidence in other countries under similar circumstances, as they can change perceptions towards the housing market very quickly. As such, if the Bank of Canada does resume its monetary tightening this year, this could easily prove to be a tipping point for a house price collapse . What’s more, if house prices do decline as we predict, let alone more sharply, the knock-on effects to consumer spending and housing investment could be significant and perhaps even strong enough to push the economy into another recession. The falls in house prices that we predict would also have significant financial implications for the Canadian Mortgage and Housing Corporation (CMHC), the government-run financial institution that insures most high loan-to-value mortgages. According to our calculations, a sharp decline in house prices could lead to losses of around C$10 billion, which would be enough to wipe out all of the CMHC equity. David Madani Tel: 1 416 413 0428 North America Europe Asia 2 Bloor Street West, Suite 1740 150 Buckingham Palace Road #26-03,16 Collyer Quay Toronto, ON London Singapore 049318 M4W 3E2 SW1W 9TR Canada United Kingdom Tel: +1 416 413 0428 Tel: +44 (0)20 7823 5000 Tel: +65 6595 5190 Managing Director Roger Bootle ([email protected]) Chief International Economist Julian Jessop ([email protected]) Canada Economist David Madani ([email protected])
-
Upload
sladurantaye -
Category
Documents
-
view
217 -
download
0
Transcript of Canada_Economics_Focus_-_House_Prices_(Feb_11)

8/7/2019 Canada_Economics_Focus_-_House_Prices_(Feb_11)
http://slidepdf.com/reader/full/canadaeconomicsfocus-housepricesfeb11 1/6
Canada Economics Focus 1
CANADA
ECONOMICS FOCUS 3 r d
F e b .
2 0 1 1
House prices likely to fall for several years
The recent housing boom has resulted in the largest rises in house prices ever seen in Canada,
which have been similar in magnitude to those during the recent boom in the US. Unfortunately,
the subsequent falls in prices could also be just as severe as those elsewhere.
We predict that nominal house prices are likely to decline by a cumulative 25% over the next few
years, in the same ball-park as the recorded declines in the US and other countries. Growth in
future personal disposable income per worker will not close the large gap between house prices and
income within any reasonable length of time.
Various housing affordability ratios have been used to rationalise high house prices relative to
income. However, this justification is flawed and potentially misleading because it fails to take
account of inflation. In a low inflation environment, you should expect lower nominal mortgage
rates to result in a lower housing affordability ratio. More importantly, the real burden of mortgage
payments will change little over time because nominal household income is growing at a slower
pace. In short, while housing affordability may seem reasonable at present, longer-term housing
affordability is anything but.
Even small rises in official interest rates have been shown to have a big effect on homeowner
confidence in other countries under similar circumstances, as they can change perceptions towards
the housing market very quickly. As such, if the Bank of Canada does resume its monetarytightening this year, this could easily prove to be a tipping point for a house price collapse.
What’s more, if house prices do decline as we predict, let alone more sharply, the knock-on effects
to consumer spending and housing investment could be significant and perhaps even strong enough
to push the economy into another recession.
The falls in house prices that we predict would also have significant financial implications for the
Canadian Mortgage and Housing Corporation (CMHC), the government-run financial institution that
insures most high loan-to-value mortgages. According to our calculations, a sharp decline in house
prices could lead to losses of around C$10 billion, which would be enough to wipe out all of the
CMHC equity.
David MadaniTel: 1 416 413 0428
North America Europe Asia 2 Bloor Street West, Suite 1740 150 Buckingham Palace Road #26-03,16 Collyer QuayToronto, ON London Singapore 049318M4W 3E2 SW1W 9TRCanada United KingdomTel: +1 416 413 0428 Tel: +44 (0)20 7823 5000 Tel: +65 6595 5190
Managing Director Roger Bootle ([email protected])
Chief International Economist Julian Jessop ([email protected])Canada Economist David Madani ([email protected])
8/7/2019 Canada_Economics_Focus_-_House_Prices_(Feb_11)
http://slidepdf.com/reader/full/canadaeconomicsfocus-housepricesfeb11 2/6
Canada Economics Focus 2
The housing boom over the last ten years has
resulted in the largest rises ever seen in Canadian
house prices, raising concern that a new bubble is
developing. Understandably, this concern has cast
doubt on hopes of a painless rebalancing of the
Canadian economy. In this Focus, we examine the
extent of the housing bubble, and in the light of
our assessment make some forecasts for house
prices.Housing prices
Since the start of the residential investment boom
in 1999, the prices of resale houses have increased
substantially across the country. However, some of
the appreciation shown in the reported house price
data (what little there is available) is the result of
changes in the quality and size of house changing
hands, and in geographical locations where most
sales are taking place. This last factor is
presumably partly why the rise in new houseprices have been less pronounced, as a large
amount of single-detached housing construction
occurs around the fringes of many major city
centres (properties which are relatively cheap).
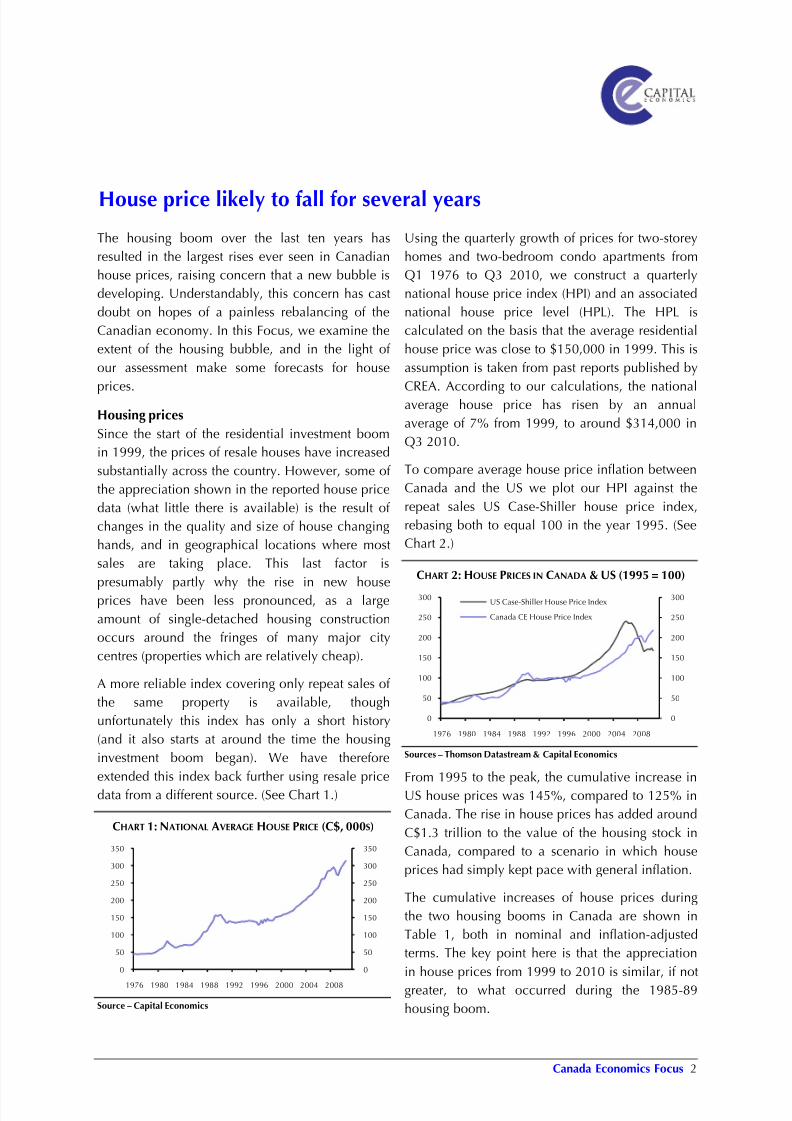
A more reliable index covering only repeat sales of
the same property is available, though
unfortunately this index has only a short history
(and it also starts at around the time the housing
investment boom began). We have therefore
extended this index back further using resale price
data from a different source. (See Chart 1.)
CHART 1: NATIONAL AVERAGE HOUSE PRICE (C$, 000S)
Source – Capital Economics
Using the quarterly growth of prices for two-storey
homes and two-bedroom condo apartments from
Q1 1976 to Q3 2010, we construct a quarterly
national house price index (HPI) and an associated
national house price level (HPL). The HPL is
calculated on the basis that the average residential
house price was close to $150,000 in 1999. This is
assumption is taken from past reports published by
CREA. According to our calculations, the nationalaverage house price has risen by an annual
average of 7% from 1999, to around $314,000 in
Q3 2010.
To compare average house price inflation between
Canada and the US we plot our HPI against the
repeat sales US Case-Shiller house price index,
rebasing both to equal 100 in the year 1995. (See
Chart 2.)
CHART 2: HOUSE PRICES IN CANADA & US (1995 = 100)
Sources – Thomson Datastream & Capital Economics
From 1995 to the peak, the cumulative increase in
US house prices was 145%, compared to 125% in
Canada. The rise in house prices has added around
C$1.3 trillion to the value of the housing stock in
Canada, compared to a scenario in which house
prices had simply kept pace with general inflation.
The cumulative increases of house prices during
the two housing booms in Canada are shown in
Table 1, both in nominal and inflation-adjusted
terms. The key point here is that the appreciation
in house prices from 1999 to 2010 is similar, if not
greater, to what occurred during the 1985-89
housing boom.
0
50
100
150
200
250
300
350
0
50
100
150
200
250
300
350
1976 1980 1984 1988 1992 1996 2000 2004 2008
0
50
100
150
200
250
300
0
50
100
150
200
250
300
1976 1980 1984 1988 1992 1996 2000 2004 2008
US Case-Shiller House Price Index
Canada CE House Price Index
House price likely to fall for several years

8/7/2019 Canada_Economics_Focus_-_House_Prices_(Feb_11)
http://slidepdf.com/reader/full/canadaeconomicsfocus-housepricesfeb11 3/6
Canada Economics Focus 3
Furthermore, the appreciation in house prices(both for new and existing houses) has exceeded
growth in personal disposable income, shown here
in the Table as per worker. Adjusted for inflation,
the cumulative growth in real (resale) house prices
have been at least triple that of real income
growth. The same does not appear so for real new
house prices, which have risen by a smaller 25%.
TABLE 1: CUMULATIVE HOUSE PRICE GROWTH IN BOOMS (%)
1985 -
1989
1999 -
2007
1999 -
Present
Capital Economics: Nominal 120 90 110
Real 80 55 65
Royal LePage: Nominal 120 120 145
Real 75 85 95
New House Price Index: Nominal 60 55 55
Real 30 25 25
Memorandum Items:
Consumer Price Inflation 25 25 30
Disposable Income per Worker
Nominal 25 30 45Real 0 15 20
Sources – Teranet-National Bank & Capital Economics
House price to income ratio
To better gauge just how much house prices have
risen relative to income we can easily compare our
HPL to personal disposable income per worker. In
Q3 2010, the HPL was around $314,000 and the
disposable income per worker is $58,347. This
tells us that the general level of house prices has
risen to almost five and a half times income, well
above the long-term historical average of 3.5. Thisindicates the fair value was around $205,000 in
Q3 2010. (See Chart 3.)
House price to rent ratio
Another common measure used to evaluate fair
value in house prices is the house price to rent
ratio, as rental properties and homes for purchase
are (in theory) competing alternatives. Chart 4
shows that the ratio of house prices to rents has
risen to a record high, far above the peak reached
in the previous boom.
CHART 3: HOUSE PRICE TO INCOME RATIO
Sources – Thomson Datastream & Capital Economics
CHART 4: HOUSE PRICE TO CPI RENT RATIO (1995=100)
Sources – Thomson Datastream & Capital Economics
In short, both of these housing valuation ratios tell
us that the current levels of house prices are
relatively high and probably unsustainable. We
should therefore expect a period when house price
inflation either slows, or turns negative.
Mortgage payment to income ratio
However, other commentators have questioned
whether these ratios have any relevance to today's
housing valuations. It is often argued that financialinnovation and very low interest rates have
permitted borrowers to take on much more debt.
Although house prices are high relative to income,
the mortgage payments are still affordable. So
what's the problem?
First, similar arguments were made in other
countries with very low mortgage rates, including
the US. However, this did not prevent house prices
from falling in many of these countries. As such, it
could just be a matter of timing before we see
similar weakness in Canadian housing markets.
2.0
2.5
3.0
3.5
4.0
4.5
5.0
5.5
6.0
2.0
2.5
3.0
3.5
4.0
4.5
5.0
5.5
6.0
1976 1981 1986 1991 1996 2001 2006 2011
Average = 3.5
40
60
80
100
120
140
160
180
200
40
60
80
100
120
140
160
180
200
1976 1980 1984 1988 1992 1996 2000 2004 2008
8/7/2019 Canada_Economics_Focus_-_House_Prices_(Feb_11)
http://slidepdf.com/reader/full/canadaeconomicsfocus-housepricesfeb11 4/6
Canada Economics Focus 4
Second, mortgage payment to income ratios canbe misleading because they fail to account for
lower inflation. If real interest rates are constant,
that is low nominal interest rates simply reflect low
inflation, the real burden of the debt does not
change over the lifetime of the loan. This reality,
we suspect, has not been given very much
consideration at all.
Lastly, slower economic growth, higher
unemployment and an uncertain global outlook
have all increased the financial risks confrontinghouseholds. So far this has not deterred
homebuyers from paying high prices relative to
their income. This optimism might be due to the
expectation that house price gains would outweigh
the additional costs of repaying larger mortgage
loans. Some homebuyers may also simply not
understand the size of the long-term burden of
mortgage debt that they are taking on. But as and
when homebuyers reassess these risks, prices
could fall sharply.
Long-term mortgage payment to income ratio
To illustrate the problems of longer-term
affordability, we can calculate a typical mortgage
payment and show this as a share of future
disposable income per worker at year 5, 10, and
20. A higher ratio implies housing affordability is
deteriorating, whereas lower ratio signifies an
improvement.
Before we can do this, we need to make a few
assumptions about future income growth,mortgage rates, and mortgage loan size. In our
stylised example, we assumed that the parameters
of the mortgage loan remained unchanged. This
means that the mortgage payment is fixed over the
entire term of the mortgage (which is 25 years). For
income, we assume modest annual real income
growth per worker of around 0.6%, compared to
the historical average of 0.8% (from 1980 to 2010).
For inflation, we pair this modest real income
growth profile with an equally modest inflation
projection of 1%.
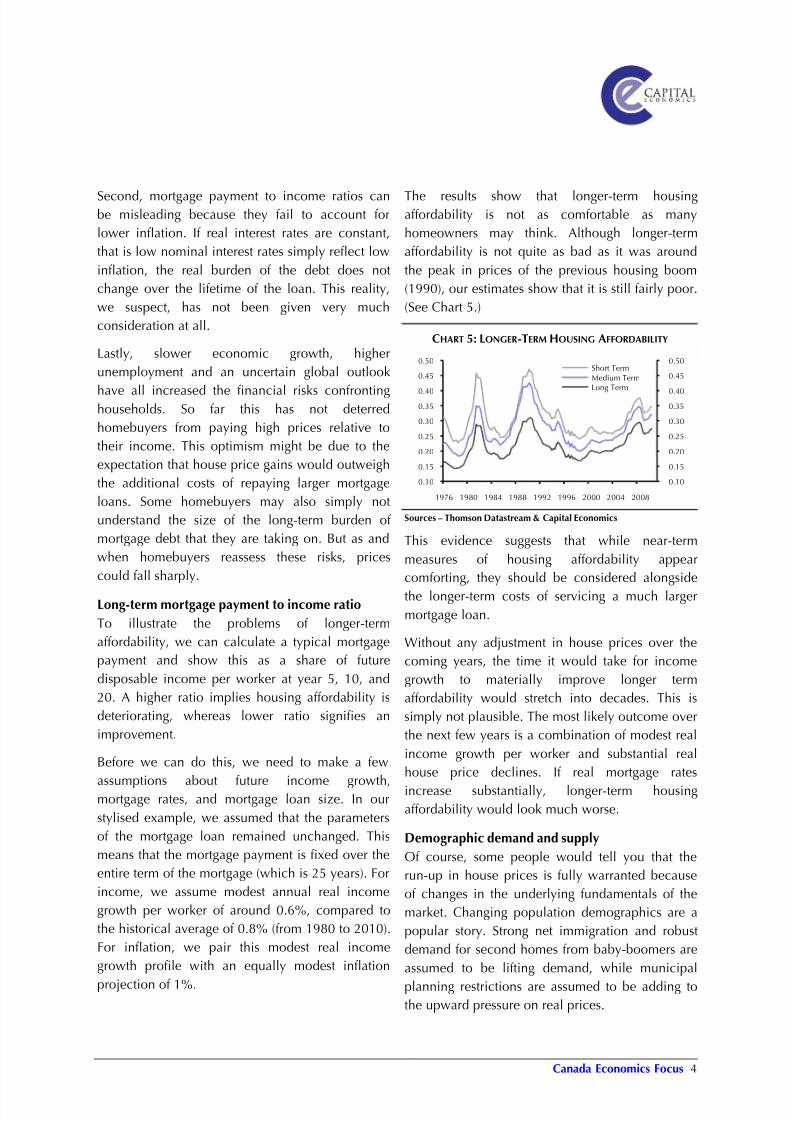
The results show that longer-term housingaffordability is not as comfortable as many
homeowners may think. Although longer-term
affordability is not quite as bad as it was around
the peak in prices of the previous housing boom
(1990), our estimates show that it is still fairly poor.
(See Chart 5.)
CHART 5: LONGER-TERM HOUSING AFFORDABILITY
Sources – Thomson Datastream & Capital Economics
This evidence suggests that while near-term
measures of housing affordability appear
comforting, they should be considered alongside
the longer-term costs of servicing a much larger
mortgage loan.
Without any adjustment in house prices over the
coming years, the time it would take for income
growth to materially improve longer term
affordability would stretch into decades. This is
simply not plausible. The most likely outcome over
the next few years is a combination of modest real
income growth per worker and substantial real
house price declines. If real mortgage rates
increase substantially, longer-term housing
affordability would look much worse.
Demographic demand and supply
Of course, some people would tell you that the
run-up in house prices is fully warranted because
of changes in the underlying fundamentals of the
market. Changing population demographics are a
popular story. Strong net immigration and robust
demand for second homes from baby-boomers are
assumed to be lifting demand, while municipal
planning restrictions are assumed to be adding tothe upward pressure on real prices.
0.10
0.15
0.20
0.25
0.30
0.350.40
0.45
0.50
0.10
0.15
0.20
0.25
0.30
0.350.40
0.45
0.50
1976 1980 1984 1988 1992 1996 2000 2004 2008
Short TermMedium TermLong Term
8/7/2019 Canada_Economics_Focus_-_House_Prices_(Feb_11)
http://slidepdf.com/reader/full/canadaeconomicsfocus-housepricesfeb11 5/6
Canada Economics Focus 5
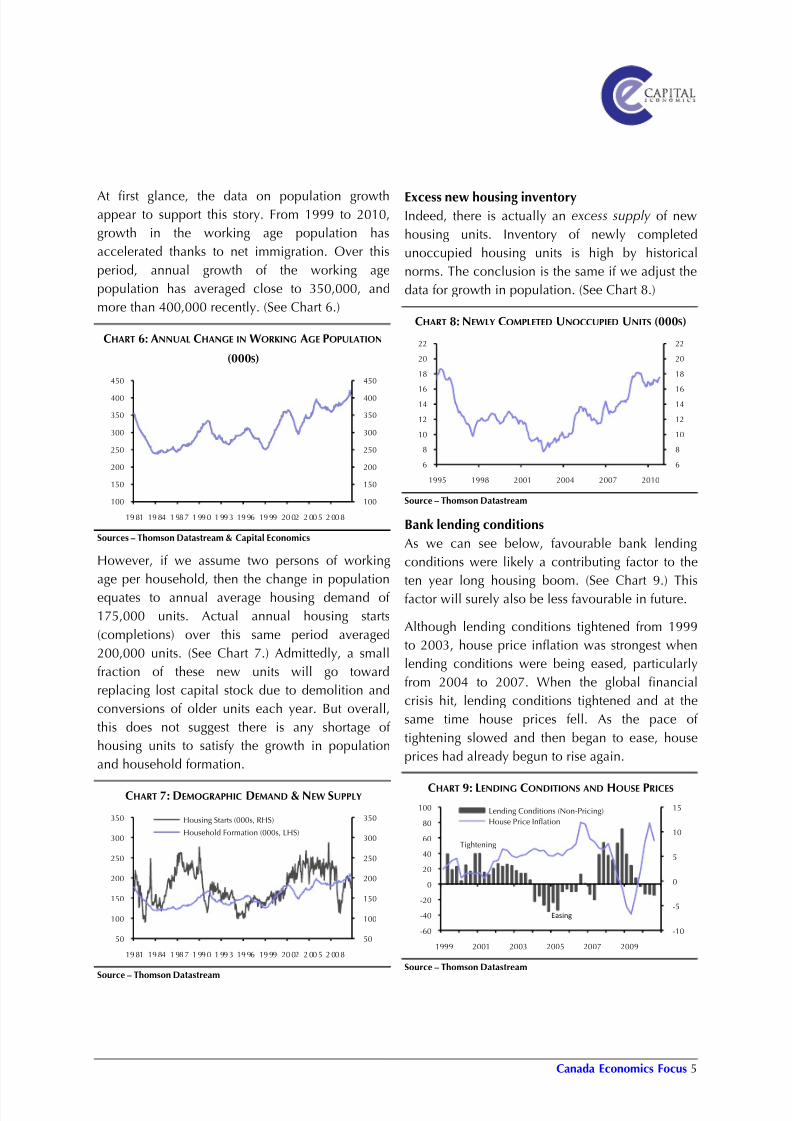
At first glance, the data on population growthappear to support this story. From 1999 to 2010,
growth in the working age population has
accelerated thanks to net immigration. Over this
period, annual growth of the working age
population has averaged close to 350,000, and
more than 400,000 recently. (See Chart 6.)
CHART 6: ANNUAL CHANGE IN WORKING AGE POPULATION
(000S)
Sources – Thomson Datastream & Capital Economics
However, if we assume two persons of working
age per household, then the change in population
equates to annual average housing demand of
175,000 units. Actual annual housing starts
(completions) over this same period averaged
200,000 units. (See Chart 7.) Admittedly, a small
fraction of these new units will go toward
replacing lost capital stock due to demolition and
conversions of older units each year. But overall,
this does not suggest there is any shortage of
housing units to satisfy the growth in population
and household formation.
CHART 7: DEMOGRAPHIC DEMAND & NEW SUPPLY
Source – Thomson Datastream
Excess new housing inventoryIndeed, there is actually an excess supply of new
housing units. Inventory of newly completed
unoccupied housing units is high by historical
norms. The conclusion is the same if we adjust the
data for growth in population. (See Chart 8.)
CHART 8: NEWLY COMPLETED UNOCCUPIED UNITS (000S)
Source – Thomson Datastream
Bank lending conditions
As we can see below, favourable bank lending
conditions were likely a contributing factor to the
ten year long housing boom. (See Chart 9.) This
factor will surely also be less favourable in future.
Although lending conditions tightened from 1999
to 2003, house price inflation was strongest when
lending conditions were being eased, particularly
from 2004 to 2007. When the global financial
crisis hit, lending conditions tightened and at the
same time house prices fell. As the pace of
tightening slowed and then began to ease, house
prices had already begun to rise again.
CHART 9: LENDING CONDITIONS AND HOUSE PRICES
Source – Thomson Datastream
100
150
200
250
300
350
400
450
100
150
200
250
300
350
400
450
1981 1984 1987 1990 1993 1996 1999 2002 2005 2008
50
100
150
200
250
300
350
50
100
150
200
250
300
350
1981 1984 1987 1990 1993 1996 1999 2002 2005 2008
Housing Starts (000s, RHS)
Household Formation (000s, LHS)
6
8
10
12
1416
18
20
22
6
8
10
12
1416
18
20
22
1995 1998 2001 2004 2007 2010
-10
-5
0
5
10
15
-60
-40
-20
0
20
40
60
80
100
1999 2001 2003 2005 2007 2009
Lending Conditions (Non-Pricing)
House Price Inflation
Tightening
Easing
8/7/2019 Canada_Economics_Focus_-_House_Prices_(Feb_11)
http://slidepdf.com/reader/full/canadaeconomicsfocus-housepricesfeb11 6/6
Canada Economics Focus 6
Housing price outlook and conclusionsWe conclude that housing prices have formed a
bubble and are at risk of falling substantially over
the next few years.
To determine the most likely path for average
house price we consider the previous boom-bust
cycle and use our measure of house prices relative
to income as a model.
If we assume that real disposable income grows at
close to its historical annual average of around 2%,
and add to that annual inflation of 2%, then
nominal disposable income growth is 4% (which is
being slightly generous given that we expect more
subdued household income growth and lower
inflation). This profile for income would bring the
house price to income ratio back to its long-run
average of 3.5 beyond year 2020. This is much
longer than the previous housing correction of
around three years, and therefore seems
unreasonable.
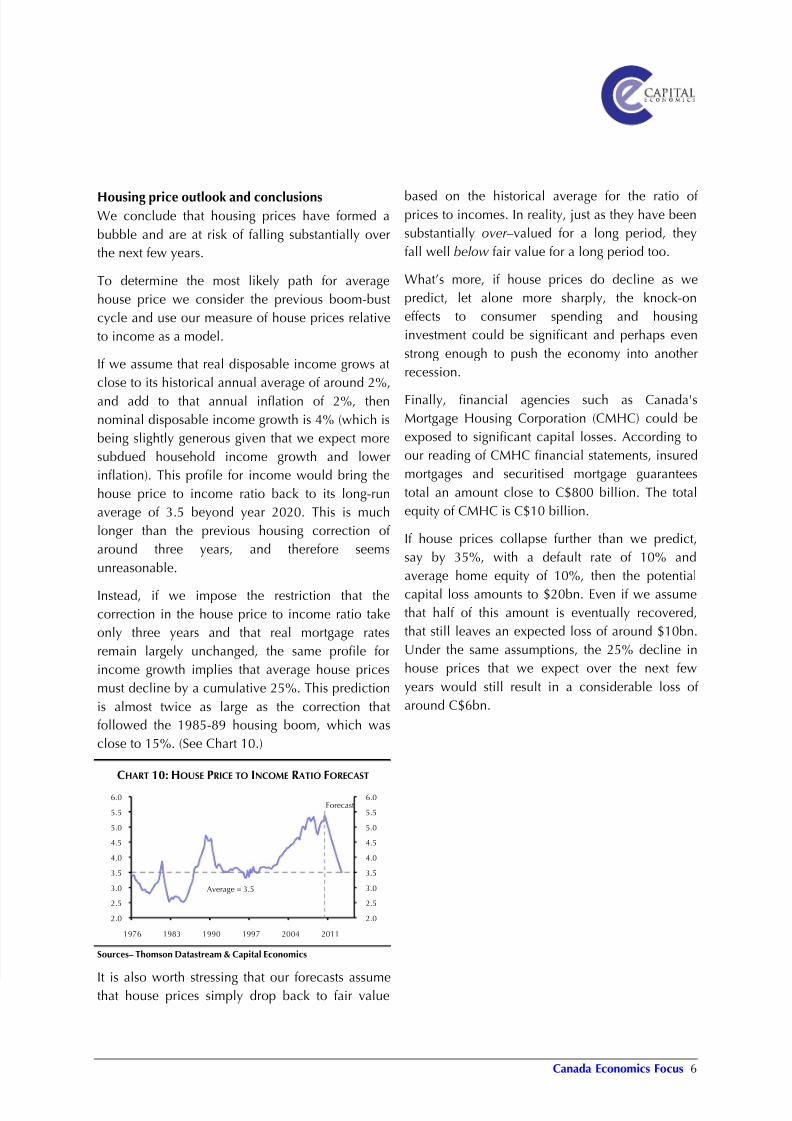
Instead, if we impose the restriction that the
correction in the house price to income ratio take
only three years and that real mortgage rates
remain largely unchanged, the same profile for
income growth implies that average house prices
must decline by a cumulative 25%. This prediction
is almost twice as large as the correction that
followed the 1985-89 housing boom, which was
close to 15%. (See Chart 10.)
CHART 10: HOUSE PRICE TO INCOME RATIO FORECAST
Sources– Thomson Datastream & Capital Economics
It is also worth stressing that our forecasts assumethat house prices simply drop back to fair value
based on the historical average for the ratio of prices to incomes. In reality, just as they have been
substantially over–valued for a long period, they
fall well below fair value for a long period too.
What’s more, if house prices do decline as we
predict, let alone more sharply, the knock-on
effects to consumer spending and housing
investment could be significant and perhaps even
strong enough to push the economy into another
recession.
Finally, financial agencies such as Canada's
Mortgage Housing Corporation (CMHC) could be
exposed to significant capital losses. According to
our reading of CMHC financial statements, insured
mortgages and securitised mortgage guarantees
total an amount close to C$800 billion. The total
equity of CMHC is C$10 billion.
If house prices collapse further than we predict,
say by 35%, with a default rate of 10% and
average home equity of 10%, then the potential
capital loss amounts to $20bn. Even if we assume
that half of this amount is eventually recovered,
that still leaves an expected loss of around $10bn.
Under the same assumptions, the 25% decline in
house prices that we expect over the next few
years would still result in a considerable loss of
around C$6bn.
2.0
2.5
3.0
3.5
4.0
4.5
5.0
5.5
6.0
2.0
2.5
3.0
3.5
4.0
4.5
5.0
5.5
6.0
1976 1983 1990 1997 2004 2011
Average = 3.5
Forecast


