CANADA PROGRAMMATIC AD SPENDING FORECAST 2016 … · Open Exchange: Public RTB auction open to all...
13
CANADA PROGRAMMATIC AD SPENDING FORECAST 2016 Automated Methods Will Increasingly Dominate Display Ad Buying OCTOBER 2016 Paul Briggs Contributors: Sean Creamer, Shelleen Shum Read this on eMarketer for iPad
Transcript of CANADA PROGRAMMATIC AD SPENDING FORECAST 2016 … · Open Exchange: Public RTB auction open to all...

CANADA PROGRAMMATIC AD SPENDING FORECAST 2016Automated Methods Will Increasingly Dominate Display Ad Buying
OCTOBER 2016
Paul Briggs
Contributors: Sean Creamer, Shelleen Shum
Read this on eMarketer for iPad
CANADA PROGRAMMATIC AD SPENDING FORECAST 2016 ©2016 EMARKETER INC. ALL RIGHTS RESERVED 2
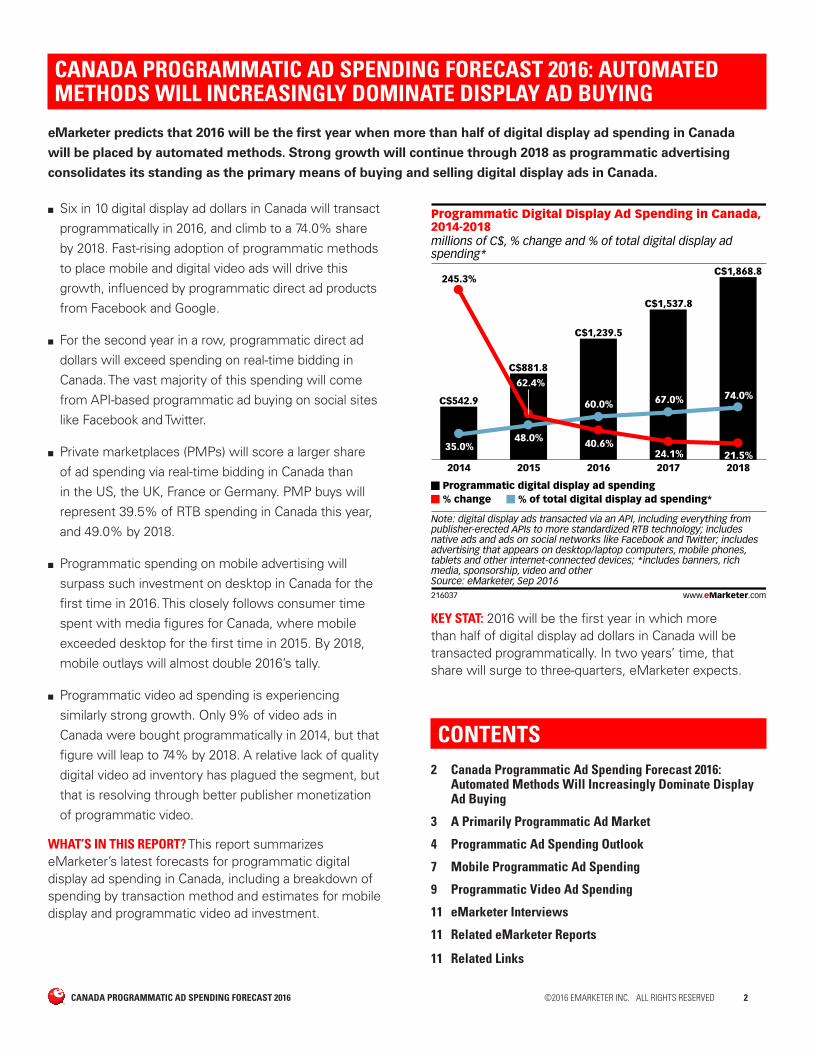
CANADA PROGRAMMATIC AD SPENDING FORECAST 2016: AUTOMATED METHODS WILL INCREASINGLY DOMINATE DISPLAY AD BUYING
eMarketer predicts that 2016 will be the first year when more than half of digital display ad spending in Canada
will be placed by automated methods. Strong growth will continue through 2018 as programmatic advertising
consolidates its standing as the primary means of buying and selling digital display ads in Canada.
■ Six in 10 digital display ad dollars in Canada will transact programmatically in 2016, and climb to a 74.0% share by 2018. Fast-rising adoption of programmatic methods to place mobile and digital video ads will drive this growth, influenced by programmatic direct ad products from Facebook and Google.
■ For the second year in a row, programmatic direct ad dollars will exceed spending on real-time bidding in Canada. The vast majority of this spending will come from API-based programmatic ad buying on social sites like Facebook and Twitter.
■ Private marketplaces (PMPs) will score a larger share of ad spending via real-time bidding in Canada than in the US, the UK, France or Germany. PMP buys will represent 39.5% of RTB spending in Canada this year, and 49.0% by 2018.
■ Programmatic spending on mobile advertising will surpass such investment on desktop in Canada for the first time in 2016. This closely follows consumer time spent with media figures for Canada, where mobile exceeded desktop for the first time in 2015. By 2018, mobile outlays will almost double 2016’s tally.
■ Programmatic video ad spending is experiencing similarly strong growth. Only 9% of video ads in Canada were bought programmatically in 2014, but that figure will leap to 74% by 2018. A relative lack of quality digital video ad inventory has plagued the segment, but that is resolving through better publisher monetization of programmatic video.
WHAT’S IN THIS REPORT? This report summarizes eMarketer’s latest forecasts for programmatic digital display ad spending in Canada, including a breakdown of spending by transaction method and estimates for mobile display and programmatic video ad investment.
millions of C$, % change and % of total digital display adspending*
Programmatic Digital Display Ad Spending in Canada,2014-2018
2014
C$542.9
245.3%
35.0%
2015
C$881.862.4%
48.0%
2016
C$1,239.5
40.6%
60.0%
2017
C$1,537.8
24.1%
67.0%
2018
C$1,868.8
21.5%
74.0%
Programmatic digital display ad spending% change % of total digital display ad spending*
Note: digital display ads transacted via an API, including everything frompublisher-erected APIs to more standardized RTB technology; includesnative ads and ads on social networks like Facebook and Twitter; includesadvertising that appears on desktop/laptop computers, mobile phones,tablets and other internet-connected devices; *includes banners, richmedia, sponsorship, video and otherSource: eMarketer, Sep 2016216037 www.eMarketer.com
KEY STAT: 2016 will be the first year in which more than half of digital display ad dollars in Canada will be transacted programmatically. In two years’ time, that share will surge to three-quarters, eMarketer expects.
CONTENTS2 Canada Programmatic Ad Spending Forecast 2016:
Automated Methods Will Increasingly Dominate Display Ad Buying
3 A Primarily Programmatic Ad Market
4 Programmatic Ad Spending Outlook
7 Mobile Programmatic Ad Spending
9 Programmatic Video Ad Spending
11 eMarketer Interviews
11 Related eMarketer Reports
11 Related Links

CANADA PROGRAMMATIC AD SPENDING FORECAST 2016 ©2016 EMARKETER INC. ALL RIGHTS RESERVED 3
A PRIMARILY PROGRAMMATIC AD MARKET
Programmatic trading is now the primary method
of buying and selling digital display advertising in
Canada. This year, programmatic’s proportion of
digital ad spending will swell to 60.0%, up from 48.0%
in 2015. That share will climb to 74.0% by 2018.
The efficiencies gained by automated ad buys are driving programmatic ad spending’s growth. Those benefits include more precise audience targeting, campaign scale and greater flexibility to tune campaigns on the fly. “There’s more standards, there’s more control, there’s more technology allowing the better delivery of quality advertising, and in turn, get better results,” said Karel Wegert, senior vice president of digital systems at Media Experts, a Montreal-based media buying agency.
Advertisers in Canada are now more comfortable using automation and technology for ad buying, overcoming a reticence that stalled adoption initially and led to the market being a step behind the US and the UK. Publishers have also shown a greater willingness to make premium ad inventory available, which they were reluctant to do when control over pricing was limited. As publishers grew more comfortable with programmatic advertising technology, they’ve learned how to better monetize audience-based ad sales across desktop, mobile and video.
“The value of programmatic is that it allows each impression to be transacted among many buyers,” said Nathan Mekuz, chief technology officer and vice president of ad operations at AcuityAds, a Toronto-based demand-side platform (DSP). “If the system allows the best match to be made, then that drives efficiencies, and that is a win-win for everyone—buyers and sellers.”
Even though programmatic will represent three-quarters of digital display ad spending in Canada by 2018, inhibitors to full saturation remain. Ad fraud is particularly an issue in open marketplace real-time bidding (RTB), where transparency of impression delivery still needs to be improved. Also, the complexity of the programmatic ecosystem—involving DSPs, supply-side platforms (SSPs), trading desks, ad exchanges and data management platforms (DMPs)—causes confusion among brand marketers and raises questions about how intermediaries take a slice of the revenue pie.
“One of the things holding programmatic back in both Canada and the US was the stigma that exists around the technology tax and margin size that was built into media spend, making a lot of advertisers uncomfortable,” said Wegert. “The industry is pushing towards a more transparent relationship between programmatic players and advertisers, which will ultimately drive more investment into programmatic because it is a better way of buying digital at the end of the day.”
Behind the Numbers
eMarketer’s forecasts and estimates are based on an analysis of quantitative and qualitative data from research firms, government agencies, media firms and public companies, plus interviews with top executives at publishers, ad buyers and agencies. Data is weighted based on methodology and soundness. Each eMarketer forecast fits within the larger matrix of all its forecasts, with the same assumptions and general framework used to project figures in a wide variety of areas. Regular re-evaluation of available data means the forecasts reflect the latest business developments, technology trends and economic changes.
French Canada
Because eMarketer’s Canada forecast is national, it does not break out the Quebec market or French-language media. There was a consensus among those interviewed for this report that bilingual campaigns in national publications would account for a proportionate revenue share according to population, about 23% in Quebec. However, there’s been little evidence of French-language media embracing programmatic advertising targeting Francophones only.
CANADA PROGRAMMATIC AD SPENDING FORECAST 2016 ©2016 EMARKETER INC. ALL RIGHTS RESERVED 4
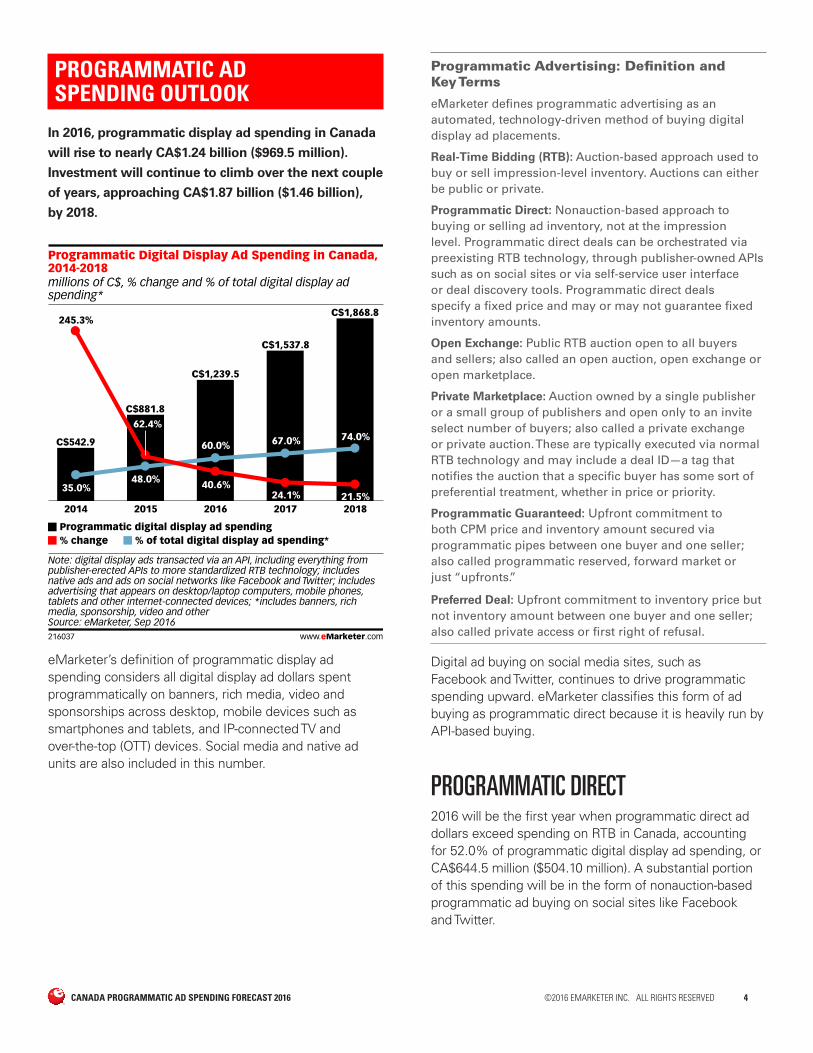
PROGRAMMATIC AD SPENDING OUTLOOK
In 2016, programmatic display ad spending in Canada
will rise to nearly CA$1.24 billion ($969.5 million).
Investment will continue to climb over the next couple
of years, approaching CA$1.87 billion ($1.46 billion),
by 2018.
millions of C$, % change and % of total digital display adspending*
Programmatic Digital Display Ad Spending in Canada,2014-2018
2014
C$542.9
245.3%
35.0%
2015
C$881.862.4%
48.0%
2016
C$1,239.5
40.6%
60.0%
2017
C$1,537.8
24.1%
67.0%
2018
C$1,868.8
21.5%
74.0%
Programmatic digital display ad spending% change % of total digital display ad spending*
Note: digital display ads transacted via an API, including everything frompublisher-erected APIs to more standardized RTB technology; includesnative ads and ads on social networks like Facebook and Twitter; includesadvertising that appears on desktop/laptop computers, mobile phones,tablets and other internet-connected devices; *includes banners, richmedia, sponsorship, video and otherSource: eMarketer, Sep 2016216037 www.eMarketer.com
eMarketer’s definition of programmatic display ad spending considers all digital display ad dollars spent programmatically on banners, rich media, video and sponsorships across desktop, mobile devices such as smartphones and tablets, and IP-connected TV and over-the-top (OTT) devices. Social media and native ad units are also included in this number.
Programmatic Advertising: Definition and Key Terms
eMarketer defines programmatic advertising as an automated, technology-driven method of buying digital display ad placements.
Real-Time Bidding (RTB): Auction-based approach used to buy or sell impression-level inventory. Auctions can either be public or private.
Programmatic Direct: Nonauction-based approach to buying or selling ad inventory, not at the impression level. Programmatic direct deals can be orchestrated via preexisting RTB technology, through publisher-owned APIs such as on social sites or via self-service user interface or deal discovery tools. Programmatic direct deals specify a fixed price and may or may not guarantee fixed inventory amounts.
Open Exchange: Public RTB auction open to all buyers and sellers; also called an open auction, open exchange or open marketplace.
Private Marketplace: Auction owned by a single publisher or a small group of publishers and open only to an invite select number of buyers; also called a private exchange or private auction. These are typically executed via normal RTB technology and may include a deal ID—a tag that notifies the auction that a specific buyer has some sort of preferential treatment, whether in price or priority.
Programmatic Guaranteed: Upfront commitment to both CPM price and inventory amount secured via programmatic pipes between one buyer and one seller; also called programmatic reserved, forward market or just “upfronts.”
Preferred Deal: Upfront commitment to inventory price but not inventory amount between one buyer and one seller; also called private access or first right of refusal.
Digital ad buying on social media sites, such as Facebook and Twitter, continues to drive programmatic spending upward. eMarketer classifies this form of ad buying as programmatic direct because it is heavily run by API-based buying.
PROGRAMMATIC DIRECT 2016 will be the first year when programmatic direct ad dollars exceed spending on RTB in Canada, accounting for 52.0% of programmatic digital display ad spending, or CA$644.5 million ($504.10 million). A substantial portion of this spending will be in the form of nonauction-based programmatic ad buying on social sites like Facebook and Twitter.
CANADA PROGRAMMATIC AD SPENDING FORECAST 2016 ©2016 EMARKETER INC. ALL RIGHTS RESERVED 5
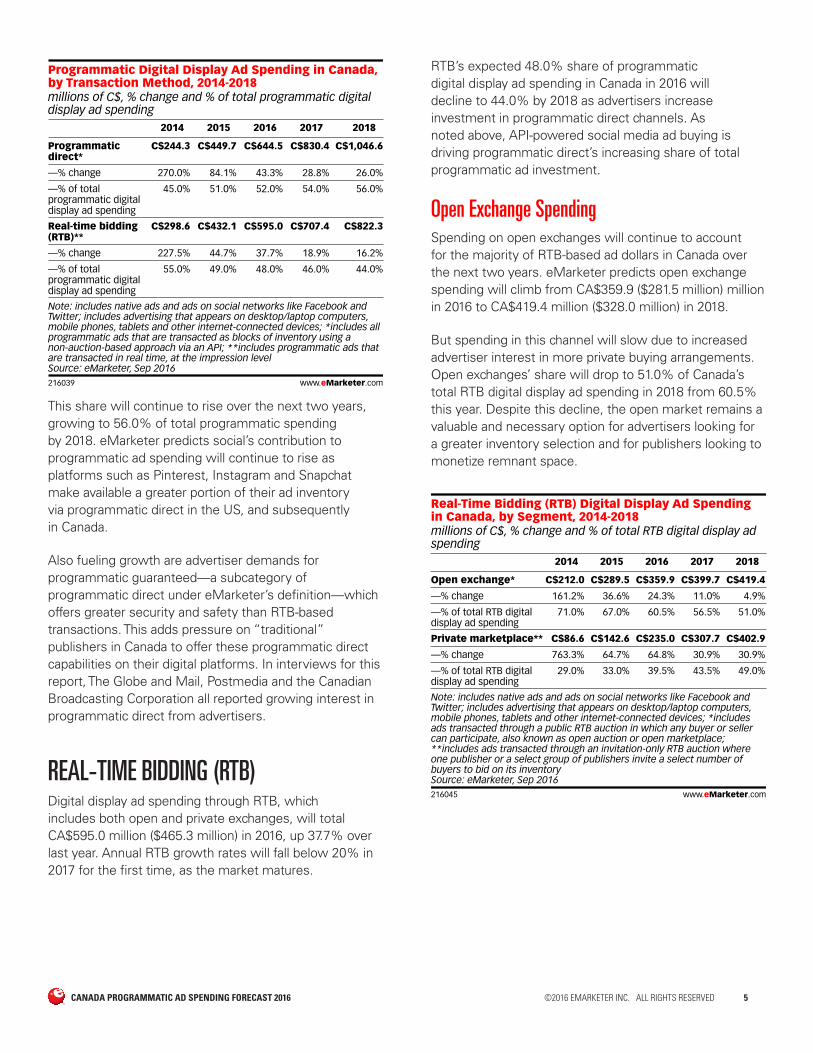
millions of C$, % change and % of total programmatic digitaldisplay ad spending
Programmatic Digital Display Ad Spending in Canada,by Transaction Method, 2014-2018
Programmatic direct*
—% change
—% of total programmatic digital display ad spending
Real-time bidding (RTB)**
—% change
—% of totalprogrammatic digitaldisplay ad spending
2014
C$244.3
270.0%
45.0%
C$298.6
227.5%
55.0%
2015
C$449.7
84.1%
51.0%
C$432.1
44.7%
49.0%
2016
C$644.5
43.3%
52.0%
C$595.0
37.7%
48.0%
2017
C$830.4
28.8%
54.0%
C$707.4
18.9%
46.0%
2018
C$1,046.6
26.0%
56.0%
C$822.3
16.2%
44.0%
Note: includes native ads and ads on social networks like Facebook andTwitter; includes advertising that appears on desktop/laptop computers,mobile phones, tablets and other internet-connected devices; *includes allprogrammatic ads that are transacted as blocks of inventory using anon-auction-based approach via an API; **includes programmatic ads thatare transacted in real time, at the impression levelSource: eMarketer, Sep 2016216039 www.eMarketer.com
This share will continue to rise over the next two years, growing to 56.0% of total programmatic spending by 2018. eMarketer predicts social’s contribution to programmatic ad spending will continue to rise as platforms such as Pinterest, Instagram and Snapchat make available a greater portion of their ad inventory via programmatic direct in the US, and subsequently in Canada.
Also fueling growth are advertiser demands for programmatic guaranteed—a subcategory of programmatic direct under eMarketer’s definition—which offers greater security and safety than RTB-based transactions. This adds pressure on “traditional” publishers in Canada to offer these programmatic direct capabilities on their digital platforms. In interviews for this report, The Globe and Mail, Postmedia and the Canadian Broadcasting Corporation all reported growing interest in programmatic direct from advertisers.
REAL-TIME BIDDING (RTB) Digital display ad spending through RTB, which includes both open and private exchanges, will total CA$595.0 million ($465.3 million) in 2016, up 37.7% over last year. Annual RTB growth rates will fall below 20% in 2017 for the first time, as the market matures.
RTB’s expected 48.0% share of programmatic digital display ad spending in Canada in 2016 will decline to 44.0% by 2018 as advertisers increase investment in programmatic direct channels. As noted above, API-powered social media ad buying is driving programmatic direct’s increasing share of total programmatic ad investment.
Open Exchange Spending Spending on open exchanges will continue to account for the majority of RTB-based ad dollars in Canada over the next two years. eMarketer predicts open exchange spending will climb from CA$359.9 ($281.5 million) million in 2016 to CA$419.4 million ($328.0 million) in 2018.
But spending in this channel will slow due to increased advertiser interest in more private buying arrangements. Open exchanges’ share will drop to 51.0% of Canada’s total RTB digital display ad spending in 2018 from 60.5% this year. Despite this decline, the open market remains a valuable and necessary option for advertisers looking for a greater inventory selection and for publishers looking to monetize remnant space.
millions of C$, % change and % of total RTB digital display adspending
Real-Time Bidding (RTB) Digital Display Ad Spendingin Canada, by Segment, 2014-2018
Open exchange*
—% change
—% of total RTB digital display ad spending
Private marketplace**
—% change
—% of total RTB digital display ad spending
2014
C$212.0
161.2%
71.0%
C$86.6
763.3%
29.0%
2015
C$289.5
36.6%
67.0%
C$142.6
64.7%
33.0%
2016
C$359.9
24.3%
60.5%
C$235.0
64.8%
39.5%
2017
C$399.7
11.0%
56.5%
C$307.7
30.9%
43.5%
2018
C$419.4
4.9%
51.0%
C$402.9
30.9%
49.0%
Note: includes native ads and ads on social networks like Facebook andTwitter; includes advertising that appears on desktop/laptop computers,mobile phones, tablets and other internet-connected devices; *includesads transacted through a public RTB auction in which any buyer or sellercan participate, also known as open auction or open marketplace;**includes ads transacted through an invitation-only RTB auction whereone publisher or a select group of publishers invite a select number ofbuyers to bid on its inventorySource: eMarketer, Sep 2016216045 www.eMarketer.com

CANADA PROGRAMMATIC AD SPENDING FORECAST 2016 ©2016 EMARKETER INC. ALL RIGHTS RESERVED 6
The trend away from open RTB could reverse, according to some interviewed for this report. As vendors move to full transparency of inventory sources for open auctions and the true cost of inventory for all parties involved becomes clear, increased trust in open RTB could drive a return to share dominance over private marketplaces in the long term. Another contingency that could return open exchange spending to greater annual growth rates is if advertiser concerns about ad fraud and viewability lessen over time. These concerns are now increasingly assuaged by the industry’s policing of nefarious actors in digital display and by creating standards for viewability and what constitutes a delivered impression.
Private Marketplace Spending Private marketplaces have been a go-to approach in Canada for both advertisers and publishers during the emerging years of RTB. This condition persists: Canada leads all countries in eMarketer’s 2016 country-specific forecasts for PMP as a proportion of RTB volumes. This year, 39.5% of RTB in Canada will be private, compared with 36.5% in the UK, 36.0% in the US, 33.0% in France, 25.0% in Germany and just 9.0% in China.
The “publisher conglomerate” model is particularly strong in Canada, a supply-side collaboration that combines inventory from a group of publishers and makes it available to a select group of advertisers. The Canadian Premium Audience Exchange (CPAX) is a major private marketplace that has grown significantly since it switched from being an open marketplace in 2014. Founded by major publisher partners Canadian Broadcasting Corporation (CBC), Rogers and Shaw Media, the conglomerate is now made up of 19 publishers.
eMarketer forecasts PMP spending in Canada will reach CA$235.0 million ($183.8 million) in 2016, up 64.8% from 2015. By 2018, investment will climb to CA$402.9 million ($315.1 million) and account for 49.0% of all RTB-based ad spending. This amount will represent over 21% of programmatic display ad spending in Canada.
In addition to greater control, private RTB affords ad buyers access to first-party data sets from publishers, which improves audience targeting. Publishers will most likely reserve this valuable data for select buyers willing to pay a premium to leverage it, instead of making it available in open auctions, where CPMs are typically much lower.
The advent of header bidding in Canada is also positively influencing private marketplace RTB. Some of the first tests involving header tags took place in Canada in 2015, with publishers looking to enhance their private marketplace features for advertisers. “Header bidding and private go hand in hand,” said Lizzie Komar, senior director of research and insights at Index, a New York-based SSP. “Header bidding is growing at such a pronounced rate in Canada, it will see a bigger share of private.”
Header bidding enables publishers to provide first-look access to impressions for certain buyers, offering the ability to bid on them before they are made available in an auction. A 20% lift in CPMs is what many publishers are experiencing with header bidding, according to Komar.
For more on header bidding, see eMarketer’s March 2016 brief, “Header Bidding: What’s Behind This Popular Trend.”

CANADA PROGRAMMATIC AD SPENDING FORECAST 2016 ©2016 EMARKETER INC. ALL RIGHTS RESERVED 7
MOBILE PROGRAMMATIC AD SPENDING
The majority of mobile display ad dollars in Canada
(62.0%), will transact programmatically in 2016. By
2018, that share will reach 75.0% and amount to
CA$1.32 billion ($1.04 billion), an almost doubling of
volumes in a two-year period.
millions of C$, % change and % of total mobile display adspending
Mobile Programmatic Display Ad Spending in Canada,2014-2018
2014
C$184.9
484.9%
43.7%2015
104.4%
54.0%
2016
C$672.9
78.1%
62.0%
2017
C$971.6
44.4%
69.0%
2018
C$1,324.0
36.3%
75.0%
Mobile programmatic display ad spending% change % of total mobile display ad spending
Note: mobile display ads transacted via an API, including everything frompublisher-erected APIs to more standardized RTB technology; includesnative ads and ads on social networks like Facebook and Twitter; includesad spending on tabletsSource: eMarketer, Sep 2016216048 www.eMarketer.com
C$377.9
With consumers in Canada now averaging more time per day on mobile devices (2 hours, 28 minutes, not including voice activities) than on laptops and desktops (1 hour, 53 minutes), advertisers are naturally putting more ad budgets into mobile. Most of that new investment goes to mobile programmatic, in part because of advertiser interest in using audience data to inform targeting.
“It’s definitely the advertisers (that are driving growth),” said Susie Macrae, vice president of marketing at Toronto-based programmatic platform Juice Mobile. “Definitely on the demand side, the supply has been there,” she said. “But there were just not a whole bunch of players within the advertising world who gravitated to mobile at the beginning. The supply was infinite, prices were awesome.”
Those conditions have changed, as demand and supply are more in equilibrium, driven by massive demand growth. Programmatic spending on mobile advertising, which includes advertising on tablets, will surpass desktop ad investment in Canada for the first time this year (CA$672.9 million vs. CA$566.6 million, or $526.3 million vs. $443.2 million). eMarketer expects the desktop figure to peak this year, then shrink in both 2017 and 2018, underlining the degree to which mobile will steal programmatic ad revenue share. This year, mobile will represent more than 54.3% of programmatic digital display spending in Canada, and will exceed 70% by 2018.
millions of C$, % change and % of total programmatic digitaldisplay ad spending
Programmatic Digital Display Ad Spending in Canada,by Device, 2014-2018
Desktop/laptop
—% change
—% of totalprogrammatic digital displayad spending
Mobile*
—% change
—% of totalprogrammatic digital display ad spending
2014
C$358.0
185.0%
65.9%
C$184.9
484.9%
34.1%
2015
C$504.0
40.8%
57.2%
C$377.9
104.4%
42.8%
2016
C$566.6
12.4%
45.7%
C$672.9
78.1%
54.3%
2017
C$566.2
-0.1%
36.8%
C$971.6
44.4%
63.2%
2018
C$544.8
-3.8%
29.2%
C$1,324.0
36.3%
70.8%
Note: digital display ads transacted via an API, including everything frompublisher-erected APIs to more standardized RTB technology; includesnative ads and ads on social networks like Facebook and Twitter; *includesad spending on tabletsSource: eMarketer, Sep 2016216046 www.eMarketer.com
Several factors will spur mobile programmatic’s rapid growth. For one, mobile advertising is well suited to automation. An automated ability to consider many data points, especially location data and history, is particularly relevant for mobile. Another factor is that cross-device targeting capabilities and measurement are improving, making it easier for brands to leverage audience data and use programmatic technology to execute mobile ad buys. But perhaps the strongest factor in mobile programmatic’s rapid growth is the impact of Facebook and Google, both of which offer proven mobile ad products with cross-device targeting capabilities.
Mobile attribution remains a challenge that most advertisers are looking to solve, mainly to justify skyrocketing mobile budgets. Linking certain mobile promotions to other digital behaviors and offline actions is being modeled by measurement companies that aim to solve the attribution problem.
CANADA PROGRAMMATIC AD SPENDING FORECAST 2016 ©2016 EMARKETER INC. ALL RIGHTS RESERVED 8
“How do you do attribution on mobile?” asked Naveed Ahmad, CEO of Toronto-based mobile ad solutions firm Addictive Mobility. “I don’t think anyone’s got it right, but everyone’s trying to sort it out.”
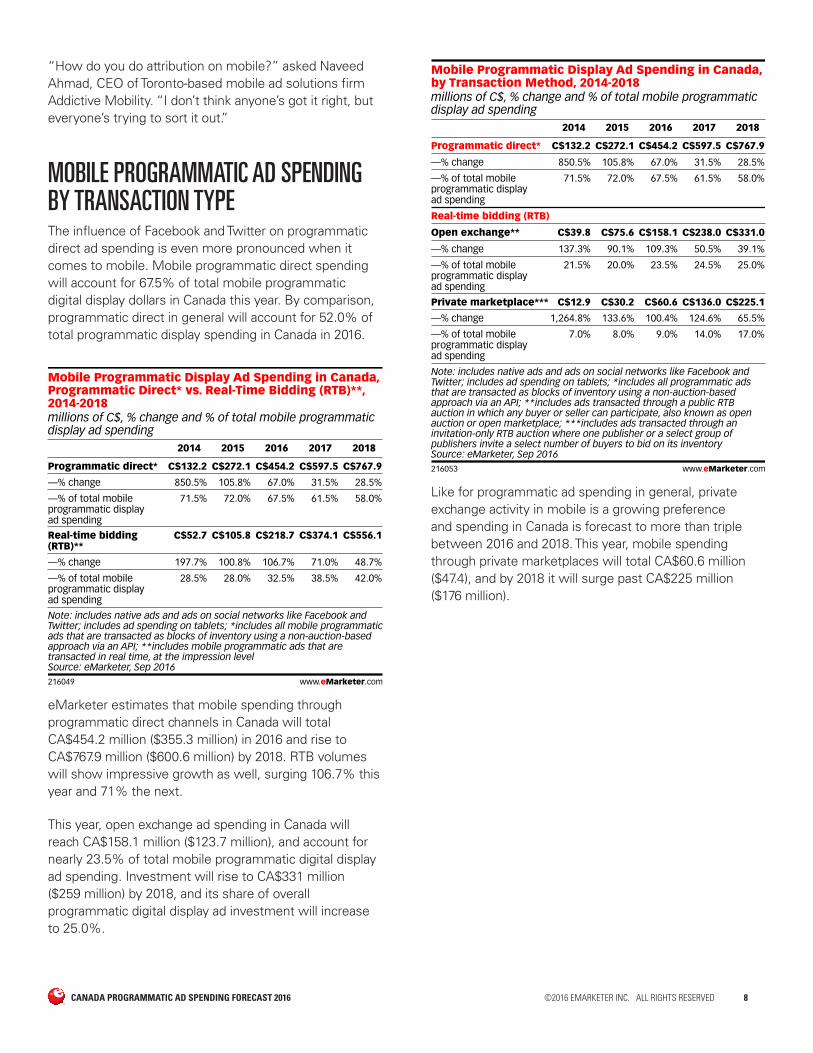
MOBILE PROGRAMMATIC AD SPENDING BY TRANSACTION TYPE The influence of Facebook and Twitter on programmatic direct ad spending is even more pronounced when it comes to mobile. Mobile programmatic direct spending will account for 67.5% of total mobile programmatic digital display dollars in Canada this year. By comparison, programmatic direct in general will account for 52.0% of total programmatic display spending in Canada in 2016.
millions of C$, % change and % of total mobile programmaticdisplay ad spending
Mobile Programmatic Display Ad Spending in Canada,Programmatic Direct* vs. Real-Time Bidding (RTB)**,2014-2018
Programmatic direct*
—% change
—% of total mobileprogrammatic display ad spending
Real-time bidding (RTB)**
—% change
—% of total mobileprogrammatic display ad spending
2014
C$132.2
850.5%
71.5%
C$52.7
197.7%
28.5%
2015
C$272.1
105.8%
72.0%
C$105.8
100.8%
28.0%
2016
C$454.2
67.0%
67.5%
C$218.7
106.7%
32.5%
2017
C$597.5
31.5%
61.5%
C$374.1
71.0%
38.5%
2018
C$767.9
28.5%
58.0%
C$556.1
48.7%
42.0%
Note: includes native ads and ads on social networks like Facebook andTwitter; includes ad spending on tablets; *includes all mobile programmaticads that are transacted as blocks of inventory using a non-auction-basedapproach via an API; **includes mobile programmatic ads that aretransacted in real time, at the impression levelSource: eMarketer, Sep 2016216049 www.eMarketer.com
eMarketer estimates that mobile spending through programmatic direct channels in Canada will total CA$454.2 million ($355.3 million) in 2016 and rise to CA$767.9 million ($600.6 million) by 2018. RTB volumes will show impressive growth as well, surging 106.7% this year and 71% the next.
This year, open exchange ad spending in Canada will reach CA$158.1 million ($123.7 million), and account for nearly 23.5% of total mobile programmatic digital display ad spending. Investment will rise to CA$331 million ($259 million) by 2018, and its share of overall programmatic digital display ad investment will increase to 25.0%.
millions of C$, % change and % of total mobile programmaticdisplay ad spending
Mobile Programmatic Display Ad Spending in Canada,by Transaction Method, 2014-2018
Programmatic direct*
—% change
—% of total mobileprogrammatic display ad spending
Real-time bidding (RTB)
Open exchange**
—% change
—% of total mobileprogrammatic display ad spending
Private marketplace***
—% change
—% of total mobileprogrammatic display ad spending
2014
C$132.2
850.5%
71.5%
C$39.8
137.3%
21.5%
C$12.9
1,264.8%
7.0%
2015
C$272.1
105.8%
72.0%
C$75.6
90.1%
20.0%
C$30.2
133.6%
8.0%
2016
C$454.2
67.0%
67.5%
C$158.1
109.3%
23.5%
C$60.6
100.4%
9.0%
2017
C$597.5
31.5%
61.5%
C$238.0
50.5%
24.5%
C$136.0
124.6%
14.0%
2018
C$767.9
28.5%
58.0%
C$331.0
39.1%
25.0%
C$225.1
65.5%
17.0%
Note: includes native ads and ads on social networks like Facebook andTwitter; includes ad spending on tablets; *includes all programmatic adsthat are transacted as blocks of inventory using a non-auction-basedapproach via an API; **includes ads transacted through a public RTBauction in which any buyer or seller can participate, also known as openauction or open marketplace; ***includes ads transacted through aninvitation-only RTB auction where one publisher or a select group ofpublishers invite a select number of buyers to bid on its inventorySource: eMarketer, Sep 2016216053 www.eMarketer.com
Like for programmatic ad spending in general, private exchange activity in mobile is a growing preference and spending in Canada is forecast to more than triple between 2016 and 2018. This year, mobile spending through private marketplaces will total CA$60.6 million ($47.4), and by 2018 it will surge past CA$225 million ($176 million).
CANADA PROGRAMMATIC AD SPENDING FORECAST 2016 ©2016 EMARKETER INC. ALL RIGHTS RESERVED 9
PROGRAMMATIC VIDEO AD SPENDING
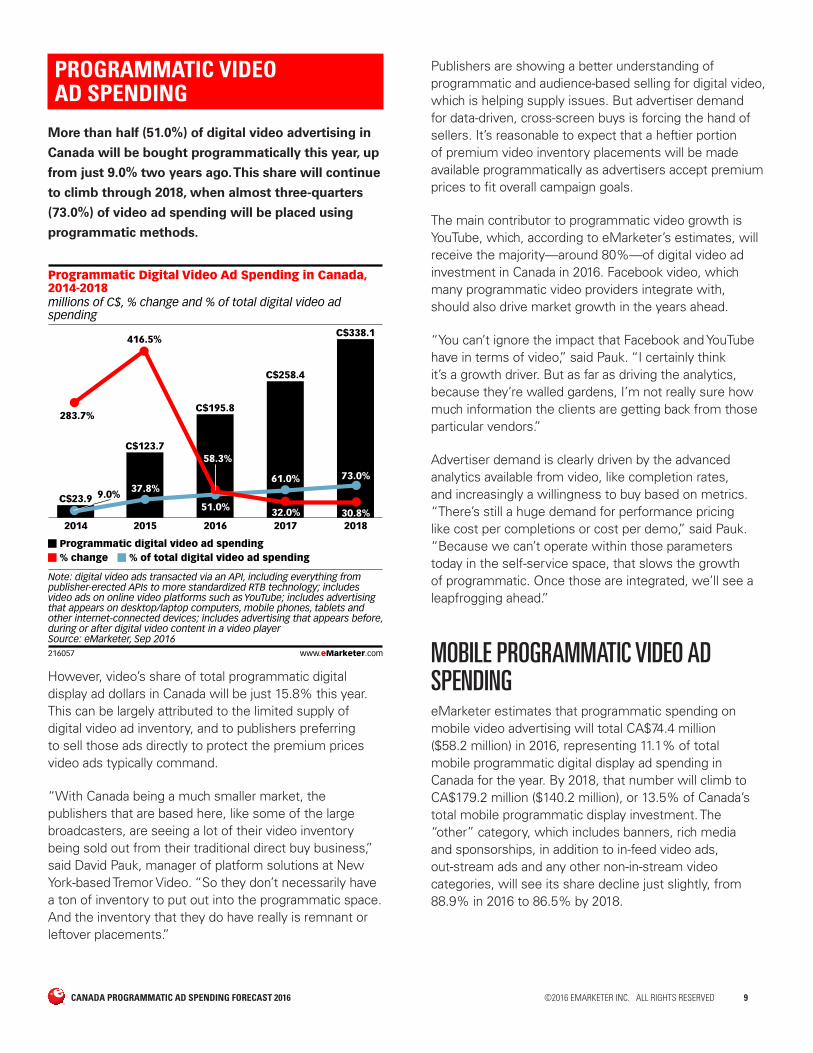
More than half (51.0%) of digital video advertising in
Canada will be bought programmatically this year, up
from just 9.0% two years ago. This share will continue
to climb through 2018, when almost three-quarters
(73.0%) of video ad spending will be placed using
programmatic methods.
millions of C$, % change and % of total digital video adspending
Programmatic Digital Video Ad Spending in Canada,2014-2018
2014
C$23.9
283.7%
9.0%
2015
C$123.7
416.5%
37.8%
2016
C$195.8
58.3%
51.0%
2017
C$258.4
32.0%
61.0%
2018
C$338.1
30.8%
73.0%
Programmatic digital video ad spending% change % of total digital video ad spending
Note: digital video ads transacted via an API, including everything frompublisher-erected APIs to more standardized RTB technology; includesvideo ads on online video platforms such as YouTube; includes advertisingthat appears on desktop/laptop computers, mobile phones, tablets andother internet-connected devices; includes advertising that appears before,during or after digital video content in a video playerSource: eMarketer, Sep 2016216057 www.eMarketer.com
However, video’s share of total programmatic digital display ad dollars in Canada will be just 15.8% this year. This can be largely attributed to the limited supply of digital video ad inventory, and to publishers preferring to sell those ads directly to protect the premium prices video ads typically command.
“With Canada being a much smaller market, the publishers that are based here, like some of the large broadcasters, are seeing a lot of their video inventory being sold out from their traditional direct buy business,” said David Pauk, manager of platform solutions at New York-based Tremor Video. “So they don’t necessarily have a ton of inventory to put out into the programmatic space. And the inventory that they do have really is remnant or leftover placements.”
Publishers are showing a better understanding of programmatic and audience-based selling for digital video, which is helping supply issues. But advertiser demand for data-driven, cross-screen buys is forcing the hand of sellers. It’s reasonable to expect that a heftier portion of premium video inventory placements will be made available programmatically as advertisers accept premium prices to fit overall campaign goals.
The main contributor to programmatic video growth is YouTube, which, according to eMarketer’s estimates, will receive the majority—around 80%—of digital video ad investment in Canada in 2016. Facebook video, which many programmatic video providers integrate with, should also drive market growth in the years ahead.
“You can’t ignore the impact that Facebook and YouTube have in terms of video,” said Pauk. “I certainly think it’s a growth driver. But as far as driving the analytics, because they’re walled gardens, I’m not really sure how much information the clients are getting back from those particular vendors.”
Advertiser demand is clearly driven by the advanced analytics available from video, like completion rates, and increasingly a willingness to buy based on metrics. “There’s still a huge demand for performance pricing like cost per completions or cost per demo,” said Pauk. “Because we can’t operate within those parameters today in the self-service space, that slows the growth of programmatic. Once those are integrated, we’ll see a leapfrogging ahead.”
MOBILE PROGRAMMATIC VIDEO AD SPENDING eMarketer estimates that programmatic spending on mobile video advertising will total CA$74.4 million ($58.2 million) in 2016, representing 11.1% of total mobile programmatic digital display ad spending in Canada for the year. By 2018, that number will climb to CA$179.2 million ($140.2 million), or 13.5% of Canada’s total mobile programmatic display investment. The “other” category, which includes banners, rich media and sponsorships, in addition to in-feed video ads, out-stream ads and any other non-in-stream video categories, will see its share decline just slightly, from 88.9% in 2016 to 86.5% by 2018.

CANADA PROGRAMMATIC AD SPENDING FORECAST 2016 ©2016 EMARKETER INC. ALL RIGHTS RESERVED 10
millions of C$, % change and % of total mobile programmaticdisplay ad spending
Mobile Programmatic Display Ad Spending in Canada,by Format, 2014-2018
Video*
—% change
—% of total mobileprogrammatic display ad spending
Other**
—% change
—% of total mobileprogrammatic display ad spending
2014
C$3.1
731.3%
1.7%
C$181.8
482.0%
98.3%
2015
C$30.9
893.4%
8.2%
C$346.9
90.9%
91.8%
2016
C$74.4
140.6%
11.1%
C$598.5
72.5%
88.9%
2017
C$117.6
58.1%
12.1%
C$854.0
42.7%
87.9%
2018
C$179.2
52.4%
13.5%
C$1,144.8
34.1%
86.5%
Note: mobile display ads transacted via an API, including everything frompublisher-erected APIs to more standardized RTB technology; includes adspending on tablets; *includes advertising that appears before, during orafter digital video content in a video player; includes video ads on onlinevideo platforms such as YouTube; **includes banners, rich media,sponsorship and other; includes native ads and ads on social networks likeFacebook and TwitterSource: eMarketer, Sep 2016216060 www.eMarketer.com
Mobile’s share of programmatic digital video ad spending in Canada will reach 38.0% 2016, and will surpass desktop/laptop by 2018, when it will represent 53.0% of the total.
millions of C$, % change and % of total programmatic digitalvideo ad spending
Programmatic Digital Video Ad Spending in Canada,by Device, 2014-2018
Desktop/laptop
—% change
—% of total programmaticdigital video ad spending
Mobile*
—% change
—% of total programmaticdigital video ad spending
2014
C$20.8
255.1%
87.0%
C$3.1
731.3%
13.0%
2015
C$92.7
345.3%
75.0%
C$30.9
893.4%
25.0%
2016
C$121.4
30.9%
62.0%
C$74.4
140.6%
38.0%
2017
C$140.8
16.0%
54.5%
C$117.6
58.1%
45.5%
2018
C$158.9
12.8%
47.0%
C$179.2
52.4%
53.0%
Note: digital display ads transacted via an API, including everything frompublisher-erected APIs to more standardized RTB technology; includesadvertising that appears before, during or after digital video content in avideo player; includes video ads on online video platforms such as YouTube;*includes ad spending on tabletsSource: eMarketer, Sep 2016216061 www.eMarketer.com
“There’s a number of different formats that are coming that are going to help take away TV budgets as more and more eyeballs, and more and more people, start to focus on mobile video,” said Ahmad. “Vertical video is coming into play. Interstitial wrappers are making horizontal video assets work vertically.”
Vertical video is designed to match how people hold their phones most of the time. More and more content creation is being done vertically to suit mobile audiences. In 2015, Snapchat reported that vertical video on its platform had nine times the completion rate of standard horizontal video across the industry. While Snapchat is driving a lot of the growth in vertical video, it’s becoming a more common requirement in advertiser creative briefs for mobile generally, according to Ahmad.
CANADA PROGRAMMATIC AD SPENDING FORECAST 2016 ©2016 EMARKETER INC. ALL RIGHTS RESERVED 11
EMARKETER INTERVIEWS
Naveed Ahmad Chief Executive Officer
Addictive Mobility Interview conducted on August 3, 2016
Mike Caprio General Manager, Programmatic and Senior Vice President, Global Partnerships
Sizmek
Interview conducted on July 18, 2016
Tim Castree Managing Director and Head of North America
Videology Interview conducted on July 26, 2016
Lizzie Komar Senior Director, Research and Insights
Index Interview conducted on August 8, 2016
Jeff MacPherson Director, Monetization Platform and Services
Canadian Broadcasting Corporation Interview conducted on August 3, 2016
Susie Macrae Vice President, Marketing
Juice Mobile Interview conducted on July 21, 2016
Nathan Mekuz Chief Technology Officer and Vice President, Ad Operations
AcuityAds
Interview conducted on July 14, 2016
Steve Melles Director of Globe Alliance and Business Development
The Globe and Mail
Interview conducted on July 25, 2016
Samuel Parent President
Titan Interactif Interview conducted on July 14, 2016
Tony Patel Vice President, Monetization and Programmatic Trading
Postmedia Network
Interview conducted on July 28, 2016
David Pauk Manager, Platform Solutions
Tremor Video Interview conducted on July 21, 2016
Taylor Schreiner Vice President, Research
TubeMogul Interview conducted on July 14, 2016
Tim Webster Co-Founder and Chief Strategy Officer
The Exchange Lab Interview conducted on July 14, 2016
Karel Wegert Senior Vice President, Digital Media Systems
Media Experts Interview conducted on July 14, 2016
RELATED EMARKETER REPORTS
US Programmatic Ad Spending Forecast: Most Mobile Display, Video Ad Dollars to be Automated by 2018
UK Programmatic Advertising Forecast: Market Maturation Leads to Greater Confidence in Automated Trading
Programmatic Advertising in France: Publishers Help Spur Transformation of Digital Ad Landscape
Programmatic Advertising in Germany: Efficiencies of Automation Begin to Persuade Brands, Agencies and Publishers
RELATED LINKS
Canadian Broadcasting Corporation
Canadian Premium Audience Exchange
Postmedia
The Globe and Mail

CANADA PROGRAMMATIC AD SPENDING FORECAST 2016 ©2016 EMARKETER INC. ALL RIGHTS RESERVED 12
EDITORIAL AND PRODUCTION CONTRIBUTORS
Cliff Annicelli Managing Editor, ReportsMichael Balletti Copy EditorJoanne DiCamillo Senior Production ArtistDana Hill Director of ProductionEden Kelley Chart EditorStephanie Meyer Senior Production ArtistKris Oser Deputy Editorial DirectorHeather Price Senior Copy EditorJohn Rambow Executive Editor, ReportsAllie Smith Director of Charts
Coverage of a Digital WorldeMarketer data and insights address how consumers spend time and money, and what marketers are doing to reach them in today’s digital world. Get a deeper look at eMarketer coverage, including our reports, benchmarks and forecasts, and charts.
Confidence in the NumbersOur unique approach of analyzing data from multiple research sources provides our customers with the most definitive answers available about the marketplace. Learn why.
Customer StoriesThe world’s top companies across every industry look to eMarketer first for information on digital marketing, media and commerce. Read more about how our clients use eMarketer to make smarter decisions.
Your account team is here to help:Email [email protected] to submit a request for research support, or contact [email protected] or 866-345-3864 to discuss any details related to your account.
The leading research firm for marketing in a digital world.