Canada Fraser BasinFINAL -...
135
Fraser River Basin Case Study British Columbia, Canada Background Paper K.S. Calbick, Raymond McAllister, David Marshall & Steve Litke for the Fraser Basin Council December 2004 This paper is a product of the study, “Integrated River Basin Management and the Principle of Managing Water Resources at the Lowest Appropriate Level – When and Why Does It (Not) Work in Practice?” The Research Support Budget of the World Bank provided major funding. The project was carried out by the Agriculture and Rural Development Department at the World Bank. The Water Resources Management Group and the South Asia Social and Environment Unit at the World Bank have provided additional support. The study core team includes Karin Kemper and Ariel Dinar (Co- Task Team Leaders, World Bank), William Blomquist and Anjali Bhat (consultants, Indiana University), and Michele Diez (World Bank), William Fru (consultant), and Gisèle Sine (International Network of Basin Organizations). Basin case study consultants include Maureen Ballestero (Tárcoles - Costa Rica), Ken Calbick and David Marshall (Fraser - Canada), Rosa Formiga (Alto Tietê and Jaguaribe - Brazil), Consuelo Giansante (Guadalquivir - Spain), Brian Haisman (Murray Darling - Australia), Kikkeri Ramu and Trie Mulat Sunaryo (Brantas - Indonesia), and Andrzej Tonderski (Warta - Poland). The views expressed in this paper are those of the author and should not be attributed to the World Bank.
Transcript of Canada Fraser BasinFINAL -...

Fraser River Basin Case Study British Columbia, Canada
Background Paper
K.S. Calbick, Raymond McAllister, David Marshall & Steve Litke for the Fraser Basin Council
December 2004
This paper is a product of the study, “Integrated River Basin Management and the Principle of Managing Water Resources at the Lowest Appropriate Level – When and Why Does It (Not) Work in Practice?” The Research Support Budget of the World Bank provided major funding. The project was carried out by the Agriculture and Rural Development Department at the World Bank. The Water Resources Management Group and the South Asia Social and Environment Unit at the World Bank have provided additional support. The study core team includes Karin Kemper and Ariel Dinar (Co-Task Team Leaders, World Bank), William Blomquist and Anjali Bhat (consultants, Indiana University), and Michele Diez (World Bank), William Fru (consultant), and Gisèle Sine (International Network of Basin Organizations). Basin case study consultants include Maureen Ballestero (Tárcoles - Costa Rica), Ken Calbick and David Marshall (Fraser - Canada), Rosa Formiga (Alto Tietê and Jaguaribe - Brazil), Consuelo Giansante (Guadalquivir - Spain), Brian Haisman (Murray Darling - Australia), Kikkeri Ramu and Trie Mulat Sunaryo (Brantas - Indonesia), and Andrzej Tonderski (Warta - Poland). The views expressed in this paper are those of the author and should not be attributed to the World Bank.
Table of Contents 1. CANADA IN BRIEF........................................................................................................................... 1
1.1 OVERVIEW ........................................................................................................................................ 1 1.2 ECONOMIC DEVELOPMENT ............................................................................................................... 3 1.3 GOVERNMENTAL SYSTEM................................................................................................................. 8 1.4 NATIONAL GOVERNMENT ................................................................................................................. 8 1.5 REGIONAL AND LOCAL GOVERNMENT............................................................................................ 11 1.6 WATER RESOURCE CONDITIONS AND PROBLEMS ........................................................................... 12 1.7 WATER GOVERNANCE .................................................................................................................... 13 1.8 RIVER BASIN MANAGEMENT .......................................................................................................... 17 1.9 CONTEXT OF NATURAL RESOURCE MANAGEMENT ........................................................................ 18
1.9.1. Fish and Aquatic Wildlife ....................................................................................................... 18 1.9.2. Migratory Waterfowl............................................................................................................... 19 1.9.3. Other Wildlife.......................................................................................................................... 19 1.9.4. Forest Resources..................................................................................................................... 19 1.9.5. Agricultural Land.................................................................................................................... 20
2. THE FRASER RIVER BASIN......................................................................................................... 21 2.1 PHYSICAL DIMENSIONS................................................................................................................... 21 2.2 INTERNAL PHYSICAL STRUCTURE................................................................................................... 22
2.2.1. Tributaries............................................................................................................................... 22 2.3 UPPER FRASER................................................................................................................................ 23 2.4 STUART-TAKLA .............................................................................................................................. 23 2.5 NECHAKO ....................................................................................................................................... 24 2.6 QUESNEL ........................................................................................................................................ 24 2.7 WEST ROAD-BLACKWATER............................................................................................................ 24 2.8 CHILCOTIN...................................................................................................................................... 24 2.9 MIDDLE FRASER ............................................................................................................................. 24 2.10 NORTH THOMPSON ......................................................................................................................... 25 2.11 SOUTH THOMPSON.......................................................................................................................... 25 2.12 THOMPSON-NICOLA........................................................................................................................ 25 2.13 BRIDGE-SETON ............................................................................................................................... 26 2.14 LILLOOET-HARRISON...................................................................................................................... 26 2.15 LOWER FRASER AND ESTUARY....................................................................................................... 26 2.16 FRASER BASIN COUNCIL REGIONS.................................................................................................. 27 2.17 GREATER VANCOUVER-SQUAMISH-PEMBERTON REGION .............................................................. 30 2.18 FRASER VALLEY REGION................................................................................................................ 30 2.19 THOMPSON REGION ........................................................................................................................ 31 2.20 CARIBOO-CHILCOTIN REGION ........................................................................................................ 32 2.21 UPPER FRASER REGION................................................................................................................... 33 2.22 HABITAT DIVERSITY....................................................................................................................... 34 2.23 HYDROLOGY OF THE FRASER RIVER BASIN .................................................................................... 35
2.23.1. Climatic Characteristics ......................................................................................................... 37 2.23.2. Water Inputs............................................................................................................................ 37 2.23.3. Streamflow .............................................................................................................................. 38
2.24 HUMAN-BUILT RESERVOIRS ........................................................................................................... 41 3. HISTORICAL AND CURRENT DEVELOPMENT OF WATER RESOURCES ..................... 43
3.1 HYDRO DEVELOPMENT................................................................................................................... 43 3.2 IRRIGATION AND DRAINAGE ........................................................................................................... 44 3.3 FLOOD CONTROL ............................................................................................................................ 44 3.4 GROUNDWATER .............................................................................................................................. 45 3.5 WATER USE CONFLICTS.................................................................................................................. 46 3.6 WATER QUALITY ............................................................................................................................ 47
3.6.1. Fraser River at Hope .............................................................................................................. 49
3.6.2. Fraser River at Marguerite..................................................................................................... 50 3.6.3. Fraser River at Stoner............................................................................................................. 50 3.6.4. Fraser River at Hansard ......................................................................................................... 51 3.6.5. Thompson River at Spences Bridge......................................................................................... 51 3.6.6. Nechako River at Prince George ............................................................................................ 51
3.7 SOCIAL CONTEXT ........................................................................................................................... 51 3.7.1. Demographics ......................................................................................................................... 51 3.7.2. Employment and Unemployment............................................................................................. 52 3.7.3. Aboriginal Groups .................................................................................................................. 53 3.7.4. Halkomelem (Salishan) ........................................................................................................... 56 3.7.5. Nlaka'pamux or Thompson (Salishan) .................................................................................... 57 3.7.6. Lillooet, also Li'lwet, or Stl'atl'imx, (Salishan) ....................................................................... 57 3.7.7. Shuswap (Salishan) ................................................................................................................. 57 3.7.8. Chilcotin (Athapaskan) ........................................................................................................... 57 3.7.9. Carrier (Athapaskan).............................................................................................................. 58
4. MANAGEMENT OF THE FRASER RIVER BASIN ................................................................... 59
5. PRE-DECENTRALIZATION PERIOD TO 1992 ......................................................................... 61 5.1 FRASER RIVER ESTUARY MANAGEMENT PROGRAMME (FREMP).................................................. 61 5.2 CANADA’S GREEN PLAN................................................................................................................. 63 5.3 FRASER RIVER ACTION PLAN ......................................................................................................... 66
5.3.1. Building Partnerships ............................................................................................................. 66 5.3.2. Cleaning Up Pollution ............................................................................................................ 66 5.3.3. Restoring the Productivity of the Natural Environment.......................................................... 67
6. DECENTRALIZATION PROCESS FROM 1992 TO 1997.......................................................... 68 6.1 FRASER BASIN MANAGEMENT BOARD (FBMB)............................................................................. 68 6.2 SELECTION OF BOARD MEMBERS ................................................................................................... 69 6.3 DIVERSITY OF VIEWS OF BOARD MEMBERS.................................................................................... 70 6.4 UNDERSTANDING OF AND COMMITMENT TO THE AGREEMENT ....................................................... 71 6.5 LEARNING THE CONSENSUS PROCESS ............................................................................................. 72 6.6 THE USE OF MULTISTAKEHOLDER PROCESSES ............................................................................... 72 6.7 REINFORCING REGIONAL INPUT...................................................................................................... 73 6.8 IMPLEMENTATION ACTIVITIES OF THE FRASER BASIN MANAGEMENT BOARD ............................... 74
6.8.1. Developing Management Strategies........................................................................................ 74 6.8.2. Selecting Demonstration Projects........................................................................................... 75 6.8.3. Facilitating Institutional Development ................................................................................... 75 6.8.4. Auditing................................................................................................................................... 75 6.8.5. Communication and Education............................................................................................... 76 6.8.6. State of the Basin Report and Board Report Cards ................................................................ 77 6.8.7. Creating a plan for sustainability ........................................................................................... 78
7. POST-DECENTRALIZATION PERIOD FROM 1997 ................................................................ 80 7.1 FRASER BASIN COUNCIL SOCIETY .................................................................................................. 80 7.2 FRASER BASIN COUNCIL (FBC)...................................................................................................... 80
7.2.1. The Responsibilities of Fraser Basin Council Directors......................................................... 82 7.2.2. The Role of the Fraser Basin Council..................................................................................... 82 7.2.3. Institutional Concept............................................................................................................... 83
7.3 FRASER BASIN COUNCIL PROGRAMMES ......................................................................................... 83 7.3.1. Basinwide Programs............................................................................................................... 83 7.3.2. Regional Programs ................................................................................................................. 88
8. PERFORMANCE MEASURES ...................................................................................................... 96 8.1 FRASER BASIN COUNCIL EFFECTIVENESS ....................................................................................... 96 8.2 MANDATE OF THE FRASER BASIN COUNCIL.................................................................................... 96

8.3 RESULTS FROM PROJECTS AND OPERATIONS OF THE COUNCIL ....................................................... 97 8.4 STRATEGIES PURSUED BY THE COUNCIL......................................................................................... 97 8.5 OPERATIONS OF THE COUNCIL ........................................................................................................ 97 8.6 SUCCESS FACTORS.......................................................................................................................... 97 8.7 FBC FINANCIAL PERFORMANCE ..................................................................................................... 98
9. MEASURING PROGRESS TOWARDS A MORE SUSTAINABLE FRASER BASIN.......... 101 9.1 A SNAPSHOT ON SUSTAINABILITY: STATE OF THE FRASER BASIN REPORT................................... 101 9.2 SCOPE AND LIMITATIONS OF THE SNAPSHOT REPORT.................................................................... 102
9.2.1. Population............................................................................................................................. 103 9.3 HEALTH ........................................................................................................................................ 106 9.4 EDUCATION................................................................................................................................... 107 9.5 HOUSING....................................................................................................................................... 108 9.6 COMMUNITY ENGAGEMENT.......................................................................................................... 109 9.7 ABORIGINAL AND NON-ABORIGINAL RELATIONSHIPS.................................................................. 111 9.8 WATER QUALITY .......................................................................................................................... 112 9.9 AIR QUALITY ................................................................................................................................ 114 9.10 FISH AND WILDLIFE ...................................................................................................................... 115
9.10.1. Fraser River Salmon Stocks .................................................................................................. 115 9.10.2. Species at Risk....................................................................................................................... 116 9.10.3. Protected Areas and Resource Management Planning......................................................... 117
9.11 INCOME AND EMPLOYMENT.......................................................................................................... 117 9.12 ECONOMIC DIVERSIFICATION ....................................................................................................... 118 9.13 CORPORATE SOCIAL RESPONSIBILITY........................................................................................... 119 9.14 FORESTS AND FORESTRY .............................................................................................................. 120 9.15 AGRICULTURE............................................................................................................................... 121 9.16 ENERGY ........................................................................................................................................ 122 9.17 FRASER RIVER FLOODING............................................................................................................. 124
REFERENCES ......................................................................................................................................... 126

LIST OF FIGURES FIGURE 1.1: THE CURRENT MAP OF CANADA................................................................................................. 1 FIGURE 1.2: VALUE OF CANADIAN EXPORTS AND IMPORTS FROM 1998 TO 2003.......................................... 7 FIGURE 1.3: CANADIAN POPULATION FROM 1861 TO 2003 ............................................................................ 7 FIGURE 1.4: THE STRUCTURE OF CANADIAN FEDERAL GOVERNMENT ........................................................... 9 FIGURE 2.1: THE FRASER RIVER BASIN, BRITISH COLUMBIA, CANADA........................................................ 21 FIGURE 2.2: THE FRASER RIVER BASIN’S 13 SUB-WATERSHEDS ................................................................... 22 FIGURE 2.3: THE FIVE REGIONS OF THE FRASER BASIN COUNCIL................................................................ 28 FIGURE 2.4: THE REGIONAL DISTRICTS OF BRITISH COLUMBIA ................................................................... 29 FIGURE 2.5: HYDROLOGIC REGIONS OF THE FRASER RIVER BASIN.............................................................. 36 FIGURE 2.6: LOCATIONS OF LONG-TERM WATER QUALITY MONITORING SITED IN THE FRASER BASIN ..... 48 FIGURE 2.7: SKETCH MAP SHOWING THE DISTRIBUTION AND EXTENT OF THE EIGHT ABORIGINAL
LANGUAGE GROUPS IN THE FRASER BASIN......................................................................................... 56 FIGURE 3.1: TIME LINE FOR VARIOUS FRASER RIVER MANAGEMENT ACTIONS ........................................... 59 FIGURE 3.2: RELATIONSHIP AND STRUCTURE OF THE SOCIETY AND COUNCIL............................................ 82 FIGURE 4.1: FRASER BASIN’S POPULATION GROWTH. HISTORICAL DATA FROM 1986 TO 2002, AND
PROJECTED GROWTH FROM 2001 TO 2031. ........................................................................................ 106 FIGURE 4.2: LIFE EXPECTANCY BY REGION FROM 1991 TO 2001............................................................... 107 FIGURE 4.3: BASIN POPULATION BY LEVEL OF EDUCATIONAL ATTAINMENT FROM 1981 TO 1996 ........... 108 FIGURE 4.4: HOUSEHOLDS IN CORE HOUSING NEED BY TENURE AND REGION FOR 1991 AND 1996......... 109 FIGURE 4.5: VOLUNTEER RATES AND AVERAGE NUMBER OF HOURS VOLUNTEERED FOR 1997 AND 2000
........................................................................................................................................................... 110 FIGURE 4.6: B.C. VOTER TURNOUT TO FEDERAL (1984 – 2000) AND PROVINCIAL ELECTIONS (1983 – 2000)
........................................................................................................................................................... 111 FIGURE 4.7: WATER QUALITY TRENDS FOR THE BASIN AND ITS FIVE REGIONS ........................................ 113 FIGURE 4.8: NUMBER OF BASIN AND REGIONAL BOIL-WATER ADVISORIES FROM 1995 TO 2002 ............ 113 FIGURE 4.9: PERCENT OF TIME COMMUNITIES ARE EXPOSED TO PM10 GREATER THAN 25 MICROGRAMS/M3
........................................................................................................................................................... 115 FIGURE 4.10: STATUS OF SALMON STOCK ESCAPEMENT BY AREA (RECENT VS. HISTORICAL RECORDS)....... 116 FIGURE 4.11: STATUS OF SALMON STOCK ESCAPEMENT LEVELS BY SPECIES (RECENT VS. HISTORICAL
RECORDS) .......................................................................................................................................... 116 FIGURE 4.12: CUMULATIVE AREA CERTIFIED OR REGISTERED IN THE FRASER BASIN BY STANDARD FROM
1999 - 2002........................................................................................................................................ 121 FIGURE 4.13: PERCENT INCREASE IN PRODUCTIVE AGRICULTURAL LAND IN THE FRASER BASIN FROM 1986
- 1996................................................................................................................................................. 122 FIGURE 4.14: NET FARM INCOME IN THE FRASER BASIN FROM 1986 - 1996 .............................................. 122 FIGURE 4.15: ENERGY CONSUMPTION IN B.C. BY SOURCE FROM 1982 - 1998........................................... 123 FIGURE 4.16: GREENHOUSE GAS EMISSIONS IN B.C. FROM 1990 – 2000.................................................... 124
LIST OF TABLES
TABLE 1.1: CANADA’S GDP BY INDUSTRY FROM 1999 TO 2003 ..................................................................... 5 TABLE 1.2: CANADIAN EXPORTS BY SECTOR FROM 1999 TO 2003................................................................... 6 TABLE 1.3: SUMMARY OF CANADIAN WATER MANAGEMENT INSTITUTIONS WITH A FOCUS ON BRITISH
COLUMBIA ........................................................................................................................................... 15 TABLE 2.1: STREAM LENGTHS AND DRAINAGE AREAS FOR THE FRASER RIVER BASIN’S 13 SUB-WATERSHEDS
............................................................................................................................................................. 23 TABLE 2.2: APPROXIMATE CROSS-REFERENCE AMONG REGIONS, REGIONAL DISTRICTS AND TRIBUTARY
WATERSHEDS ....................................................................................................................................... 29 TABLE 2.3: AREA COVERED BY THE DIFFERENT BIOGEOCLIMATIC ZONES IN THE FRASER BASIN .................. 35 TABLE 2.4: STREAMFLOW AND RUN-OFF IN THE FRASER BASIN.................................................................... 40 TABLE 2.5: HUMAN-BUILT WATER RESERVOIRS IN THE FRASER RIVER BASIN.............................................. 41 TABLE 2.6: POPULATIONS AND TRENDS FOR FRASER BASIN REGIONS........................................................... 54 TABLE 2.7: LABOUR FORCE EMPLOYMENT BY INDUSTRY IN THE FRASER BASIN........................................... 54

TABLE 2.8: REGIONAL PARTICIPATION, EMPLOYMENT AND UNEMPLOYMENT RATES FOR VARIOUS AGE GROUPS WITHIN THE FRASER BASIN..................................................................................................... 55
TABLE 3.1: THE CHARTER’S FOUR DIRECTIONS FOR ACHIEVING THE VISION OF SUSTAINABILITY IN THE FRASER BASIN ..................................................................................................................................... 79
TABLE 3.2: THE CHARTER’S PRINCIPLES FOR SUSTAINABILITY ...................................................................... 79 TABLE 4.1: FBC’S FINANCIAL PERFORMANCE SINCE INCEPTION ................................................................... 99 TABLE 4.2: FRASER BASIN COUNCIL'S SUSTAINABILITY INDICATORS USED TO TRACK PROGRESS............... 104

-1-
1. CANADA IN BRIEF
1.1 OVERVIEW
Canada is a sparsely populated country occupying the northern half of North America. Its land area is 9,984,670 km2 and the population is currently approximately 32 million, mostly concentrated along the Canadian-U.S. border. British Columbia, with a land area of 944,735 km2, constitutes about 9.5% of Canada’s total land area. Currently, 10 provinces and three territories form Canada (fig. 1.1). With the addition of Nunavut in 1999, Canada's third territory, the country’s internal boundaries changed for the first time since the entry of Newfoundland into Confederation 50 years ago. Before Newfoundland, Alberta and Saskatchewan, both in 1905, were the last provinces to enter the Dominion, while the Yukon was given territorial status in 1898. Prince Edward Island joined the Dominion in 1873, British Columbia in 1871, and Manitoba and the Northwest Territories in 1870.
Figure 1.1: The Current Map Of Canada
Source: National Library of Canada and National Archives of Canada website - www.operation-dialogue.com/e/historical_geo.html; accessed 29 April 2004

-2-
Canada was first contacted by Europeans in about 1000 AD, with the landing of Viking Leif Eriksson in Vinland, probably at the site now called L'Anse-aux-Meadows in Newfoundland. While the Greenland Vikings founded a short-lived colony, it wasn’t until about 500 years later that Europeans permanently settled in Canada. In 1497, John Cabot, a Genoan sailor in English duty, explored Canada’s east coast, followed by the French sailor Jacque Cartier who, between 1534 and 1541, explored the Gulf of St. Lawrence. Landing on Quebec's Gaspe Peninsula, he claimed the land for France.
From this point, it took another 200 years before French explorers and fur traders, between 1730 and 1740, reached the Rocky Mountains, the natural barrier demarcating the beginning of what was to become Canada’s most western province, British Columbia. In 1793, Alexander Mackenzie, traveling through the northern and central part of B.C., was the first person to reach the Pacific overland when he landed at Bella Coola. Fifteen years later, in 1807 and 1808, explorers David Thompson and Simon Fraser finally explored much of southern portion of the province, with Simon Fraser traveling the river that bears his name from its source high in the Rocky Mountains almost to the mouth of the river.
With the enactment of the British North America Act in 1867 (renamed the Constitution Act in 1982) the Dominion of Canada was founded. Original Dominion members included Ontario, Quebec, New Scotland (now Nova Scotia) and New Brunswick. Sir John A. Macdonald served as Canada’s first prime minister. British Colombia joined the Dominion in 1871 with the promise of a transcontinental railroad that would link them to the rest of the country. Although Canada was an English colony and strongly identified with Great Britain, its monarchy and parliament, it gradually attained political autonomy. The Statute of Westminster in 1931 legally dissolved almost all subordination to the imperial parliament in London. This gradual process of gaining autonomy culminated in 1982 when Canada adopted a new constitution that officially ended British control over Canadian constitutional amendments.
Canada was far from being a “vast empty land” when the first Europeans arrived. Indeed, it was inhabited from the Atlantic to the Pacific by indigenous peoples known today as Canada’s First Nations. These original inhabitants had lived in North America for many centuries, and for some on the west coast of Canada, for at least 5,000 years since the last Ice Age. First Nations in all regions of the country had elaborate lifestyles and customs that had evolved through long adaptation to their particular environments. Though the population was relatively small, with estimates varying from 500,000 to 2,000,000 (Department of Indian and Northern Affairs Canada website www.ainc-inac.gc.ca/ch/rcap/sg/sg3_e.html; accessed 5 May 2004), the use of the land was more

-3-
extensive than those figures indicate. The mobile hunting and gathering way of life for most of Canada's First Nations was land-intensive and thus required continuous movement in search of new resources.
Of the two main regions where sedentary societies developed, the west coast of what is now British Columbia had by far the highest population because of its rich sea and rain forest resources. In fact, it was one of the most densely settled areas in the world for non-agricultural peoples. The other region was southern Ontario, where the climate and fertile soil allowed for farming. Across Canada, more than 50 languages were spoken; these have been classified into 12 families, half of which were spoken only in British Columbia. By far the most widespread were (and still are) Cree, in the Algonkian group, and Inuktitut, an Eskaleut language of the Arctic.
The Fraser Basin is home to about 50,000 Aboriginal peoples who are grouped in eight language groups: Dakelh (Carrier); Ts’ilhqot’in (Chilcotin)’ Secwepemc (Shuswap); Stl’at’imc (Lillooet); Nlaka’pamux (Thompson); Okanagan (Okanogan); Hal’q’emeylem (Stolo); and Hunqumi’num (Lower Fraser First Nations).
1.2 ECONOMIC DEVELOPMENT
Canada enjoys strong economic growth, low inflation and balanced budgets. These factors combine to provide Canadians with one of the world's highest standards of living. To ensure future productivity, competitiveness and prosperity, Canada has adopted an official Innovation Strategy that sets aggressive targets designed to:
build a culture of excellence and encourage research and the creation of new knowledge; make sure Canada's workforce has the skills to compete in the new world economy; create a business and regulatory environment that promotes entrepreneurship; and build strong communities that both entice investment and remain attractive locales in
which to reside.
Canada is a trading country and a founding member of the World Trade Organization. The export of goods and services accounts for more than 40% of the country's economic activity. The enactment of the North American Free Trade Agreement in 1994 has promoted the integration of the Canadian and U.S. economies. Canada enjoys assured access to the North American market of over 400 million people with a combined gross domestic product (GDP) of over US$11.4 trillion. Indeed, exports to the U.S. now account for over 30% of Canada’s GDP.
Over the last five years, Canada’s GDP has increased from about CAN$896.5 billion for 1999 to CAN$1,013 billion for 2003 in constant 1997 dollars (table 1.1). Overall, Canada’s economy has increased at an average annual pace of 3.1%. Goods-producing industries, lead by manufacturing and construction, increased from CAN$292 billion to

-4-
CAN$316 billion, for an average annual growth rate of about 2.0%. These industries account for about 32% of the total GDP. Service-producing industries, lead by finance and insurance, real estate, renting and leasing, and management of companies and enterprises, grew from CAN$604.5 billion to CAN$697 billion, representing an average annual growth rate of about 3.6%. The service-producing industries produce about 68% of Canada’s GDP. At the same time, Canada’s per capita GDP of US$28,900 compares well to Japan, US$26,700, Australia, US$27,500, France, US$26,500, Germany, US$26,300, U.K., US$26,400 and the United States, US$35,200 (OECD 2003).

-5-
Table 1.1: Canada’s GDP By Industry From 1999 To 2003
1999 2000 2001 2002 2003 $ constant 1997 (millions)
All industries1 896,490 945,783 961,522 992,319 1,012,956 GOODS-PRODUCING INDUSTRIES
Agriculture, forestry, fishing and hunting 23,322 22,997 21,249 20,147 22,938
Mining and oil and gas extraction 34,311 34,107 34,665 34,081 35,507 Manufacturing 161,536 179,827 172,943 177,432 176,943 Construction industries 46,406 48,461 51,567 52,480 54,726 Utilities 26,412 26,474 25,815 26,411 25,825
SERVICES-PRODUCING INDUSTRIES Transportation and warehousing 43,609 45,734 45,262 45,873 45,880 Information and cultural industries 33,660 36,256 38,955 41,316 41,929 Wholesale trade 50,467 53,671 55,186 59,497 62,696 Retail trade 47,496 50,611 52,512 55,464 56,665 Finance and insurance, real estate and renting and leasing and management of companies and enterprises
174,009 182,540 190,430 199,031 202,799
Professional, scientific and technical services 37,549 40,293 42,132 43,482 44,867
Administrative and support, waste management and remediation services
18,328 19,472 20,430 21,470 22,296
Public administration 51,826 53,257 54,840 56,102 57,814 Educational services 43,566 44,200 44,814 45,552 45,579 Health care and social assistance 53,407 54,866 56,074 58,070 60,356 Arts, entertainment and recreation 7,982 8,478 8,752 9,171 9,552 Accommodation and food services 21,630 22,560 23,117 23,235 22,666 Other services (except public administration) 20,974 21,979 22,779 23,505 23,918
Source: Statistics Canada Website www.statcan.ca/english/Pgdb/econ41.htm; accessed 29 April 2004. 1. North American Industry Classification Standard.
Canada’s economic growth has been accompanied in recent years by low inflation rates. Canada’s average annual inflation rate from 1993 to 2003 was 1.9% (Statistics Canada website www.statcan.ca/english/Pgdb/econ46.htm; accessed 30 April 2004). Such a rate of inflation compares extremely well with Australia’s at 2.3%, the United States at 2.9% and European Union at 3.2%, as measured over similar time periods. Moreover, Canada’s strong economy is progressing from strong fundamentals. The federal budget has produced surpluses since the 1997-1998 fiscal year, and recently yielded a surplus of CAN$7.0 billion for 2002-2003 (Department of Finance Canada website www.fin.gc.ca/afr/2003/afr03_1e.html#Budgetary%20Balance; accessed 30 April 2004).
-6-
According to the Organization for Economic Cooperation and Development (OECD), Canada was the only Group of Seven country to post a surplus in 2002. Federal debt as a percentage of the economy was just over 44% in 2002–03, a reduction of almost 25 percentage points from its peak of 68.4% in 1995–96 (Department of Finance Canada website www.fin.gc.ca/afr/2003/afr03_1e.html#Budgetary%20Balance; accessed 30 April 2004). On an international basis, Canada has made more progress in reducing its debt burden than any other G-7 country. According to the OECD, Canada’s net debt burden is now below the G-7 average, well below those in Italy and Japan and in line with those in Germany, France and the United States. Only the United Kingdom has a significantly lower debt burden.
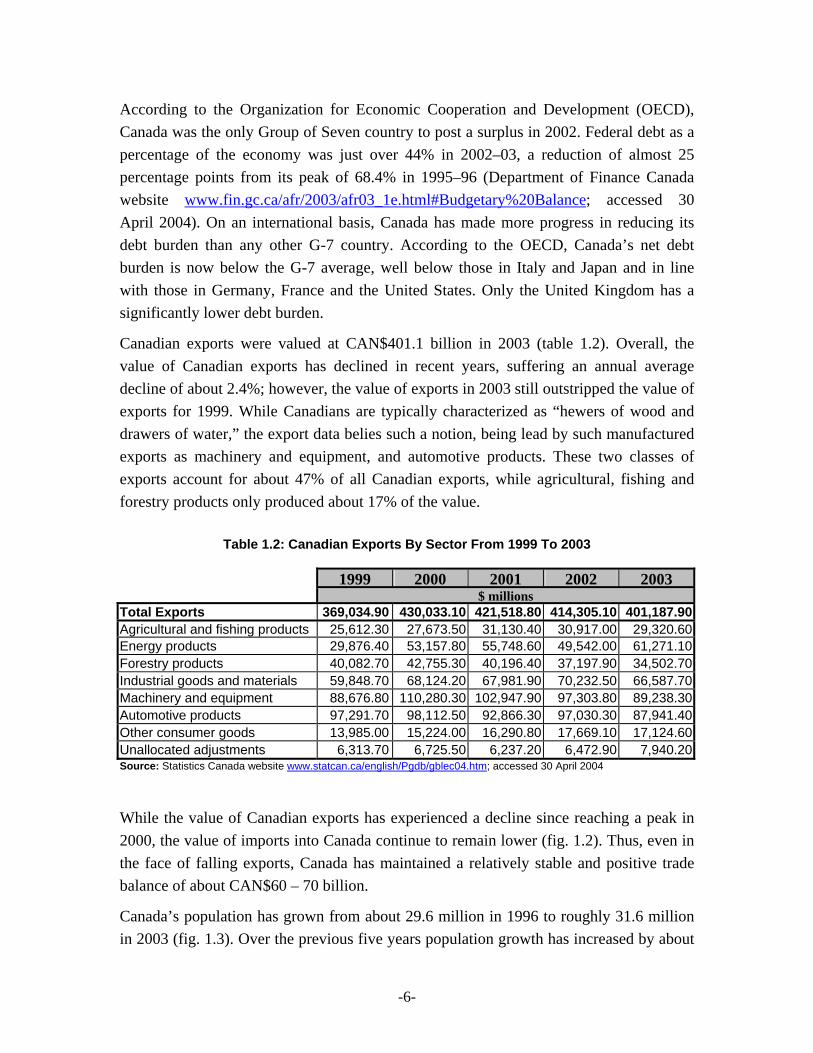
Canadian exports were valued at CAN$401.1 billion in 2003 (table 1.2). Overall, the value of Canadian exports has declined in recent years, suffering an annual average decline of about 2.4%; however, the value of exports in 2003 still outstripped the value of exports for 1999. While Canadians are typically characterized as “hewers of wood and drawers of water,” the export data belies such a notion, being lead by such manufactured exports as machinery and equipment, and automotive products. These two classes of exports account for about 47% of all Canadian exports, while agricultural, fishing and forestry products only produced about 17% of the value.
Table 1.2: Canadian Exports By Sector From 1999 To 2003
1999 2000 2001 2002 2003 $ millions
Total Exports 369,034.90 430,033.10 421,518.80 414,305.10 401,187.90Agricultural and fishing products 25,612.30 27,673.50 31,130.40 30,917.00 29,320.60Energy products 29,876.40 53,157.80 55,748.60 49,542.00 61,271.10Forestry products 40,082.70 42,755.30 40,196.40 37,197.90 34,502.70Industrial goods and materials 59,848.70 68,124.20 67,981.90 70,232.50 66,587.70Machinery and equipment 88,676.80 110,280.30 102,947.90 97,303.80 89,238.30Automotive products 97,291.70 98,112.50 92,866.30 97,030.30 87,941.40Other consumer goods 13,985.00 15,224.00 16,290.80 17,669.10 17,124.60Unallocated adjustments 6,313.70 6,725.50 6,237.20 6,472.90 7,940.20Source: Statistics Canada website www.statcan.ca/english/Pgdb/gblec04.htm; accessed 30 April 2004
While the value of Canadian exports has experienced a decline since reaching a peak in 2000, the value of imports into Canada continue to remain lower (fig. 1.2). Thus, even in the face of falling exports, Canada has maintained a relatively stable and positive trade balance of about CAN$60 – 70 billion.
Canada’s population has grown from about 29.6 million in 1996 to roughly 31.6 million in 2003 (fig. 1.3). Over the previous five years population growth has increased by about

-7-
1% annually (Statistics Canada website www.statcan.ca/english/Pgdb/demo02a.htm; accessed 30 April 2004), which is slightly lower than the world average of about a 1.3% annual growth (United Nations Population Division 2003: 2).
Figure 1.2: Value Of Canadian Exports And Imports From 1998 To 2003
Figure 1.3: Canadian Population From 1861 To 2003
0
50
100
150
200
250
300
350
400
450
1998 1999 2000 2001 2002 2003
Year
Valu
e in
bill
ions
Exports Imports Balance
Source: Statistics Canada website www.statcan.ca/english/Pgdb/gblec02a.htm; accessed 30 April 2004
02,000,0004,000,0006,000,0008,000,000
10,000,00012,000,00014,000,00016,000,00018,000,00020,000,00022,000,00024,000,00026,000,00028,000,00030,000,00032,000,000
1861
1866
1871
1876
1881
1886
1891
1896
1901
1906
1911
1916
1921
1926
1931
1936
1941
1946
1951
1956
1961
1966
1971
1976
1981
1986
1991
1996
2001
2006
Year
Popu
latio
n
Source: Statistics Canada website - www.statcan.ca/english/Pgdb/demo03.htm, 1868 – 2001; www.statcan.ca/english/Pgdb/demo02.htm, 2002 and 2003; accessed 29 April 2004

-8-
1.3 GOVERNMENTAL SYSTEM
Canada is a democracy and a constitutional monarchy. The head of state is the Queen of Canada, who is also Queen of Britain, Australia and New Zealand, as well as a host of other countries scattered around the world from the Bahamas and Grenada to Papua New Guinea and Tuvalu. Every act of government is done in the name of the Queen, but the authority for every act flows from the Canadian people.
When the men who framed the basis of our present written constitution, the Fathers of Confederation, were drafting it in 1867, they freely, deliberately and unanimously chose to vest the formal executive authority in the Queen, “to be administered according to the well understood principles of the British constitution by the Sovereign personally or by the Representative of the Queen.” That meant responsible government, with a cabinet responsible to the House of Commons, and the House of Commons answerable to the people. All of the powers of the Queen are now exercised by her representative, the governor-general, except when the Queen is in Canada.
The governor-general, who is now always a Canadian, is appointed by the Queen on the advice of the Canadian prime minister and, except in very extraordinary circumstances, exercises all powers of the office on the advice of the cabinet (a council of ministers), which has the support of a majority of the members of the popularly elected House of Commons.
Canada is not only an independent sovereign democracy, but is also a federal state, with 10 largely self-governing provinces and three territories controlled by the central government.
1.4 NATIONAL GOVERNMENT
Canada's federation has two levels of government: federal and provincial, each with its own law-making bodies, governing executive and judiciary. At the federal level, the Canadian government has two law-making bodies: the 301 seat House of Commons and the 105 seat Senate (fig. 1.4). B.C. residents are represented by 34 elected members of parliament (MPs) and six appointed senators. The prime minister and appointed ministers comprise the federal cabinet or governing executive. The federal judiciary includes the Supreme Court of Canada, the highest court of appeal for all cases.
The national Parliament has power “to make laws for the peace, order and good government of Canada,” except for “subjects assigned exclusively to the legislatures of the provinces.” The provincial legislatures have power over direct taxation in the

-9-
province for provincial purposes, natural resources, prisons (except penitentiaries), charitable institutions, hospitals (except marine hospitals), municipal institutions, licenses for provincial and municipal revenue purposes, local works and undertakings (with certain exceptions), incorporation of provincial companies, solemnization of marriage, property and civil rights in the province, the creation of courts and the administration of justice, fines and penalties for breaking provincial laws, matters of a merely local or private nature in the province, and education (subject to certain rights of the Protestant and Roman Catholic minorities in some provinces).
Figure 1.4: The Structure Of Canadian Federal Government
Subject to the limitations imposed by the Constitution Act, 1982, the provinces can amend their own constitutions by an ordinary Act of the legislature. They cannot touch the office of lieutenant-governor; they cannot restrict the franchise or qualifications for members of the legislatures or prolong the lives of their legislatures except as provided for in the Canadian Charter of Rights and Freedoms.

-10-
Of course, the power to amend provincial constitutions is restricted to changes in the internal machinery of the provincial government. Provincial legislatures are limited to the powers explicitly given to them by the written constitution. So, no provincial legislature can take over powers belonging to the Parliament of Canada. Nor could any provincial legislature pass an Act taking the province out of Canada. No such power is to be found in the written constitution, so no such power exists. Similarly, of course, Parliament cannot take over any power of a provincial legislature. Parliament and the provincial legislatures both have power over agriculture and immigration, and over certain aspects of natural resources; but if their laws conflict, the national law prevails. Parliament and the provincial legislatures also have power over old age, disability and survivors’ pensions; but if their laws conflict, the provincial power prevails.
By virtue of the Constitution Act, 1867, everything not mentioned as belonging to the provincial legislatures comes under the national Parliament. This aspect looks like an immensely wide power. It is not, in fact, as wide as it looks, because the courts have interpreted the provincial powers, especially “property and civil rights,” as covering a very wide field. As a result, all labor legislation (maximum hours, minimum wages, safety, workers’ compensation, industrial relations) comes under provincial law, except for certain industries such as banking, broadcasting, air navigation, atomic energy, shipping, interprovincial and international railways, telephones, telegraphs, pipelines, grain elevators, enterprises owned by the national government, and works declared by Parliament to be for the general advantage of Canada or of two or more of the provinces. Social security (except for employment insurance, which is purely national, and the shared power over pensions) comes under the provinces. However, the national Parliament, in effect, established nation-wide systems of hospital insurance and medical care by making grants to the provinces (or, for Quebec, yielding some of its field of taxes) on condition that their plans reach certain standards.
The courts’ interpretation of provincial and national powers has put broadcasting and air navigation under Parliament's general power to make laws for the “peace, order and good government of Canada,” but otherwise has reduced it to not much more than an emergency power for wartime or grave national crises such as nation-wide famine, epidemics, or massive inflation (though some recent cases go beyond this).
The Fathers of Confederation, not content with giving Parliament what they thought an ample general power, added, “for greater certainty,” a long list of examples of exclusive national powers: taxation, direct and indirect; regulation of trade and commerce (the courts have interpreted this to mean interprovincial and international trade and commerce); “the public debt and property” (this enables Parliament to make grants to individuals—such as family allowances—or to provinces: hospital insurance and

-11-
medicare, higher education, public assistance to the needy, and equalization grants to bring the standards of health, education and general welfare in the poorer provinces up to an average national standard); the post office; the census and statistics; defense; beacons, buoys, lighthouses and Sable Island; navigation and shipping; quarantine; marine hospitals; the fisheries; interprovincial and international ferries, shipping, railways, telegraphs, and other such international or interprovincial “works and undertakings”—which the courts have interpreted to cover pipelines and telephones; money and banking; interest; bills of exchange and promissory notes; bankruptcy; weights and measures; patents; copyrights; Indians and Indian lands (the courts have interpreted this to cover Inuit as well); naturalization and aliens; the criminal law and procedure in criminal cases; the general law of marriage and divorce; and local works declared by Parliament to be “for the general advantage of Canada or of two or more of the provinces” (this has been used many times, notably to bring atomic energy and the grain trade under exclusive national jurisdiction). A 1940 constitutional amendment gave Parliament exclusive power over unemployment insurance and a specific section of the Act of 1867 gives it power to establish courts “for the better administration of the laws of Canada.” This has enabled Parliament to set up the Supreme Court of Canada and the Federal Court.
As already noted, the national Parliament can amend the Constitution in relation to the executive government of Canada and the Senate and the House of Commons, except that it cannot touch the office of the Queen or the governor-general, nor those aspects of the Senate and the Supreme Court of Canada entrenched by the amending formulas. Though Parliament cannot transfer any of its powers to a provincial legislature, nor a provincial legislature any of its powers to Parliament, Parliament can delegate the administration of a federal Act to provincial agencies (as it has done with the regulation of interprovincial and international highway traffic); and a provincial legislature can delegate the administration of a provincial Act to a federal agency. This “administrative delegation” is an important aspect of the flexibility of our constitution.
1.5 REGIONAL AND LOCAL GOVERNMENT
Local governments in B.C. consist of incorporated municipalities, regional districts, school districts, regional hospital districts and special purpose improvement districts. Incorporated municipalities—cities, districts, towns and villages—provide facilities such as roads, waterworks and sewers, as well as a wide range of social, recreational and protection services. Regional districts provide common services on a shared basis over a large area. Revenue for municipal and regional services is derived mainly from property taxation and grants from the provincial government.

-12-
1.6 WATER RESOURCE CONDITIONS AND PROBLEMS
Canada has 7% of the world's renewable supply of freshwater and 20% of the world's total freshwater resources (including waters captured in glaciers and the polar ice cap) (Government of Canada 2003). However, the sources of water and its distribution and availability vary considerably across the country. Canada's Atlantic and Pacific coastal areas receive an average of between 1,100 and 1,400 millimeters of precipitation per year. The southern portions of western Canada's Prairie provinces, on the other hand, receive less than 500 millimeters per year, and those regions experience periodic droughts. Massive floods in various parts of Canada have affected tens of thousands of people.
Nationally, Canada possesses 23 river basins of varying sizes and descriptions; too many to adequately discuss. These river basins exhibit varying degrees of development, experience a plethora of problems that range from too little water to too much water, and water quality may range from pristine to polluted. Due to the somewhat autonomous provincial responsibility for managing inland water resources represented by these river basins, a number of unique responses have developed. Included among these river basins is B.C.’s Fraser River Basin that has its own set of unique problems and developed responses.
Serious water resource management problems have been created by development in the Fraser Basin but they need to be seen in perspective. There are still many undeveloped headwaters with pristine water quality conditions. The large size of the basin, the enormous main stem flows, and the concentration of development pressures close to the main stem and particularly in the downstream sub-basin have diluted the impacts. The main stem of the river has not yet been dammed, unlike the Columbia River. Due to its Heritage River status, there will never be a bank-to-bank dam on the Fraser River. Overall, the main stem Fraser has fairly good water quality conditions when compared with systems such as the St. Lawrence River and the Great Lakes, which have been subject to longer and more intensive development and have become much more seriously polluted.
However, major and diverse impacts on the system stemming from developments over the last 150 years have occurred. Some of these are listed below.
While the number of salmon returning to spawn increased in half the basin streams assessed, as determined by comparing the average of the last decade to the historical record, the other half of the basin streams experienced a decline (FBC 2003).
Major losses of estuarine wetlands important to salmon and waterfowl populations resulted from dyking and drainage in the lower Fraser at the end of the last century.
Despite the enormous flows in the main stem, concentrations of toxic materials have accumulated in fish far downstream from the sources of such materials (e.g., chlorinated

-13-
guaiacols from pulp mills found in estuarine fish). Recently though, toxic discharges have been declining due to municipal sewage treatment plant upgrades and the adoption of new process and effluent technologies at basin pulp and paper plants (Fraser Basin Management Board 1996; B.C. Ministry of Environment, Lands and Parks (B.C. MELP), now Ministry of Water, Land, and Air Protection (B.C. MWLAP), 2000; B.C. MWLAP 2002).
Adjacent to outfalls and in more poorly flushed streams, toxic materials have accumulated in sediments and biota. However, the lower Fraser River bottom sediments have demonstrated improving trends in lead concentrations due to the phased reduction and ban of leaded gasoline (B.C. MELP 2000).
Groundwater in some aquifers in the lower Fraser Valley has been contaminated by manure, fertilizers and pesticides (Hall et al. 1991). In particular, the Abbotsford/Sumas aquifer and the Brookswood aquifer receive excess amounts of nitrogen, phosphorous and potassium.
In the Interior, some lakes (e.g., Williams, Loon and Dragon) are showing the impacts of nutrient additions from animal wastes (Hall et al. 1991; B.C. MELP 1996).
Precipitation is contaminated by heavy metals (e.g., lead), PAH's and acidic gases, particularly from atmospheric emissions in the Greater Vancouver area (Hall et al. 1991).
High demands for water in parts of the arid Interior have resulted in local water shortages (Boeckh et al. 1991a). Indeed, as of March 2000, eight of 15 watercourses designated as sensitive streams occur in the basin (Land and Water B.C. website lwbc.bc.ca/03water/licencing/ql/sensitive_streams.pdf; accessed 5 May 2004).
1.7 WATER GOVERNANCE
Because Canada is a federation, different levels of government have different jurisdictional roles related to water management, with many areas of shared commitment.
Canadian provinces and territories have primary jurisdiction over most areas of water management and protection. Most provincial governments delegate certain authorities to municipalities, especially drinking water treatment and distribution, and wastewater treatment operations. Provinces may also delegate some water resource management functions to local authorities that may be responsible for a particular area or river basin. Most major uses of water in Canada are permitted or licensed under provincial water management authorities.
Federal jurisdiction applies to the conservation and protection of oceans and their resources, fisheries, navigation, and international relations, including responsibilities related to the management of boundary waters shared with the United States. The federal government also has responsibilities for water on federal lands, including Canada's three territories (Northwest Territories, Yukon, and Nunavut), national parks, and First Nations communities.
Water resource management in B.C. involves numerous agencies and organizations and includes all orders of government (table 1.3). At the federal level, Environment Canada

-14-
(EC) and the Department of Fisheries and Oceans (DFO) are the primary agencies responsible for water resource management. In relation to water management issues, EC manages water pollutants through such efforts as compiling water quality and quantity data, and by setting national water quality guidelines, while DFO is primarily concerned with the management of anadromous fish stocks, such as salmon, and their habitat through such instruments as stock enhancement plans and habitat protection programs. Additionally, the Department of Canadian Heritage coordinates the federal-provincial cooperative program for the Canadian Heritage River System. Rivers possessing a significant feature receive heritage status through developing a management plan, or heritage strategy, that ensures the river will be managed to conserve its outstanding natural, cultural, or recreational values.
The federal government also provides conditional funding for investment in municipal infrastructure, including water and waste treatment related projects, through Infrastructure Canada. In most cases, the Infrastructure Canada Programme matches the provincial government contribution, providing up to one-third of the cost of each municipal infrastructure project. The remaining funds come from provincial, territorial, and municipal governments. The private sector and others, such as non-governmental organizations, may also be considered as partners for projects.

-15-
Table 1.3: Summary Of Canadian Water Management Institutions With A Focus On British Columbia
LEVEL OF GOVERNMENT
MAIN AGENCIES
PRIMARY CONTEXTUAL PURPOSE
AUTHORIZING LEGISLATION
Environment Canada Manages water contaminants Canadian Environmental Protection Act
Fisheries and Oceans Canada Manages anadromous fish stocks, such as salmon, and their habitat Fisheries Act
Infrastructure Canada Funds water and waste treatment systems numerous
Federal Government
Canadian Heritage Administers the Canadian Heritage River System Department of Canadian Heritage Act
Ministry of Water, Land, and Air Protection Protects water resource quality and quantity Waste Management Act
River Forecasting Centre Forecasts water quantity condition, i.e., flooding or drought —
Ministry of Sustainable Resource Management
Develops water resources; provide corporate leadership on water resources policy, planning, and integration numerous
Land and Water British Columbia Inc.
Manages the allocation of surface water resources by issuing licenses Water Act
Ministry of Health Services Regulates drinking water quality Drinking Water Protection Act
Provincial Government
B.C. Hydro and Power Authority Hydropower generation Hydro and Power Authority
Act Municipalities Regional Districts Local
Government Improvement Districts
Provide citizens with services such as potable water and waste treatment Local Government Act
First Nations
Indian & Northern Affairs Canada Administers potable water supplies on reserves Indian Act

-16-
Provincially, in B.C. three ministries play primary roles in water resource management. The Ministry of Water, Land, and Air Protection (MWLAP) safeguards water resources, both in quality and quantity, through monitoring and enforcement efforts. The Ministry of Sustainable Resource Management (MSRM) provides strategic planning services directed towards the long-term management of water resources. Specifically, MSRM is the lead provincial agency responsible for planning, policies, and resource information in support of the sustainable economic development of Crown land, water, and other resources. Lastly, the Ministry of Health Services regulates drinking water quality through a regime of monitoring and enforcement activities; however, drinking water sources, such as reservoirs and lakes, are protected by MWLAP. Notably, among water issues, drinking water alone benefits from cross-agency meetings of the approximately 13 government agencies involved in some aspect of drinking water management in the province1.
Supporting the activities and roles of these three ministries are three other agencies: Land and Water British Columbia Inc. (LWBC), B.C. Hydro and Power Authority (B.C. Hydro), and the River Forecasting Centre (RFC). LWBC, a quasi-Crown corporation, plays a primary role in allocating surface water resources by issuing withdrawal licenses. Significantly, groundwater resources are unregulated and use does not require a license, except for withdrawals in excess of 75 liters per second (which are large and rare)2. Surface water licenses provide the holder a legal right, under the provincial Water Act, to a certain maximum quantity of water. Water licensing decisions are primarily made regionally. Applications for water licenses can only be made by landowners or by those with a long-term interest in the land, such as that resulting from a 30-year lease, and only for an authorized use. However, an applicant may apply for an interest in the land along side an application for a water license. Applications must have an economically viable basis, and be environmentally reasonable, with large-scale projects requiring an environmental impact assessment. All applicants are referred to other potentially affected stakeholders, such as riparian-rights holders, other water users, or First Nations.
B.C. Hydro, charged with generating and distributing power for economic gain, manages about 35 facilities in about 23 watersheds and is the province’s single largest water user. In 1996, B.C. Hydro initiated a water use planning approach designed to balance multiple uses and multiple values. Such an all-inclusive process was designed to build relationships with stakeholders. This approach was developed in response to the
1 Based on information obtained from interview with Valerie Z. Cameron, Drinking Water Specialist with the Water, Air, and Climate Change Branch of the B.C. Ministry of Water, Land, and Air Protection on 31 May 2004. 2 Data provided during interview with James S. Mattison, Executive Director and Comptroller of Water Rights, Strategic Initiatives Division, Land and Water British Columbia Inc. on 31 May 2004.

-17-
difficulties encountered when other avenues were used. Litigation is expensive and does not yield clarity, and an ad hoc approach can result in different and inconsistent practices at different sites. Currently, all but one of the plans is complete, with 20 out of 23 plans achieving consensus3.
Staff of RFC collect and interpret snow, meteorological, and streamflow data to provide warnings and forecasts of stream and lake runoff conditions around the province. Thus, this agency estimates water resource quantities to advise on the potential for flood or drought conditions around the province. Most of the meteorological and streamflow data are collected by other agencies, but the RFC is the lead agency in the province for the aggregation, quality control, analysis and archiving of snow data.
Finally, forms of local governments (see table 1.3), as defined by the provincial Local Government Act, are primarily responsible for funding and building municipal infrastructure, including water and waste treatment systems. However, larger projects, like the Annacis Island Wastewater Treatment Plant upgrade from primary to secondary treatment, are also jointly funded by the federal and provincial governments. First Nations and local governments are also involved in managing water resources, including management of drinking water supplies, operation of treatment facilities for sewage and wastewater, and management of flood protection and drainage systems.
1.8 RIVER BASIN MANAGEMENT
A complex web of legislation and regulatory tools guide the management of water resources in B.C., and thus, in the Fraser River Basin. Since its beginnings almost one and half centuries ago, and particularly in the last two decades, there have been continuing and substantial innovations in the governance system for managing water and associated resources in British Columbia. From the outset, the Fraser River Basin has been a major focus of those innovations. The original water rights system was designed in response to the conflicts in its tributary streams that arose during the early gold rush. The Fraser River Estuary Management Programme, started in the 1970s, was at the forefront of attempts to manage water resources in an integrated fashion. However, during the 1980s, there was no comprehensive plan to address water resource management and other sustainability issues in the Fraser Basin.
The Fraser River Action Plan was first announced as part of Canada's Green Plan in the early 1990s. This effort was the third time in the history of the Fraser River that an
3 B.C. Hydro information based on personnel communication with Daryl Fields, Manager of Resource Planning for B.C. Hydro on 1 June 2004.

-18-
attempt was made to develop a comprehensive plan for the basin. The first attempt to develop such a plan was begun by the Dominion-Provincial Board in the early 1950's and was a response to the disastrous flood of 1948. In many ways, it was ahead of its time. After encountering tremendous difficulties in generating information about the natural resources of the basin and their development, a summary was published in an interim report (Fraser River Board 1956) and the comprehensive initiative then faded as attention narrowed to focus on flood control issues (Sewell 1965; 1977).
Thirty years later, a second attempt was made to develop a comprehensive plan for the basin. In the late 1970's, in response to the increasing conflicts in watersheds and the weaknesses of the earlier federal-provincial comprehensive river basin studies, such as the Okanagan Study, the province initiated a Strategic Planning Programme (Barrons 1989).
It began with a prototype investigation in the Nicola watershed and envisaged that initial Strategic Plans for each of 41 planning units in the province would be completed at a rate of eight plans each year and then progressively refined. Once again, an ambitious initiative that could have produced a set of plans for the whole basin did not come to fruition. By 1989, only 16 plans had been completed and most of them fell short of the comprehensiveness that had been envisaged. Again, the task was found to be daunting, even when approached strategically and with a great deal more data available than when the Dominion-Provincial Board had struggled with its studies in the early 1950's.
Eventually, a comprehensive assessment of the Fraser River Basin’s sustainability was completed in 1991 by UBC’s Westwater Research Centre (Water in Sustainable Development: Exploring Our Common Future in the Fraser River Basin Vol. I and II 1991). The recommendations from this study formed the foundations of the Fraser Basin Management Board initiated in May 1992, which subsequently became the Fraser Basin Council Society in June 1997.
1.9 CONTEXT OF NATURAL RESOURCE MANAGEMENT
1.9.1. Fish and Aquatic Wildlife
Federal and provincial governments share management of the Fraser River Basin’s fish and aquatic wildlife populations. As noted earlier, the federal government has constitutional authority over marine and inland fisheries, but in B.C. the administration and protection of freshwater fisheries was delegated in 1937 to the province; the federal government retained responsibility for marine anadromous fish (salmon) in both freshwater and marine environments.
-19-
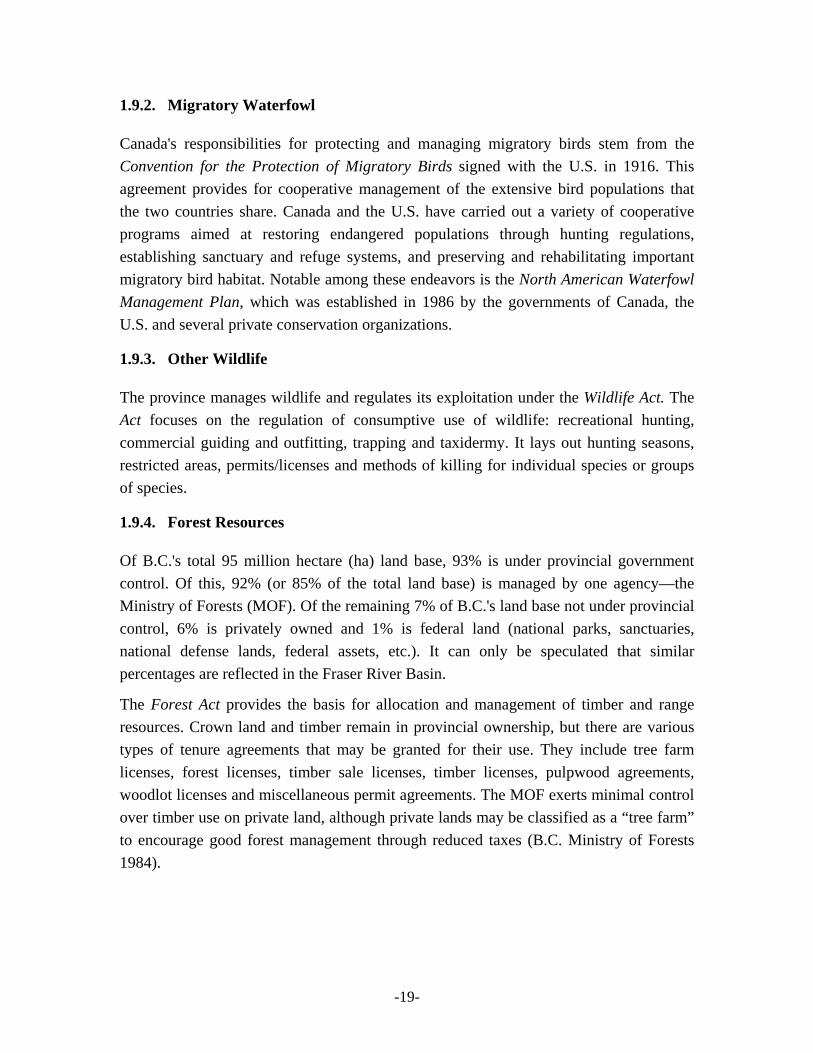
1.9.2. Migratory Waterfowl
Canada's responsibilities for protecting and managing migratory birds stem from the Convention for the Protection of Migratory Birds signed with the U.S. in 1916. This agreement provides for cooperative management of the extensive bird populations that the two countries share. Canada and the U.S. have carried out a variety of cooperative programs aimed at restoring endangered populations through hunting regulations, establishing sanctuary and refuge systems, and preserving and rehabilitating important migratory bird habitat. Notable among these endeavors is the North American Waterfowl Management Plan, which was established in 1986 by the governments of Canada, the U.S. and several private conservation organizations.
1.9.3. Other Wildlife
The province manages wildlife and regulates its exploitation under the Wildlife Act. The Act focuses on the regulation of consumptive use of wildlife: recreational hunting, commercial guiding and outfitting, trapping and taxidermy. It lays out hunting seasons, restricted areas, permits/licenses and methods of killing for individual species or groups of species.
1.9.4. Forest Resources
Of B.C.'s total 95 million hectare (ha) land base, 93% is under provincial government control. Of this, 92% (or 85% of the total land base) is managed by one agency—the Ministry of Forests (MOF). Of the remaining 7% of B.C.'s land base not under provincial control, 6% is privately owned and 1% is federal land (national parks, sanctuaries, national defense lands, federal assets, etc.). It can only be speculated that similar percentages are reflected in the Fraser River Basin.
The Forest Act provides the basis for allocation and management of timber and range resources. Crown land and timber remain in provincial ownership, but there are various types of tenure agreements that may be granted for their use. They include tree farm licenses, forest licenses, timber sale licenses, timber licenses, pulpwood agreements, woodlot licenses and miscellaneous permit agreements. The MOF exerts minimal control over timber use on private land, although private lands may be classified as a “tree farm” to encourage good forest management through reduced taxes (B.C. Ministry of Forests 1984).

-20-
1.9.5. Agricultural Land
The Agricultural Land Reserve (ALR) was established in 1973 in an attempt to preserve quality farmland throughout B.C. from ever increasing urbanization and development. Lands were initially selected for inclusion in the Reserve on the basis of the British Columbia Land Inventory Agricultural Capability classification. The ALR presently encompasses some 4.7 million hectares of private and Crown land (Agricultural Land Commission website www.alc.gov.bc.ca/alr/alr_main.htm; accessed 30 April 2004), about 5% of the provincial land base.
The ALR is administered by the Agricultural Land Commission within the Ministry of Sustainable Resource Management. The Commission has broad powers to preserve farmlands under the Agricultural Land Commission Act. Specifically, the commission oversees: inclusion and exclusion of land from the ALR; nonagricultural use and subdivision of land within an ALR; and soil removal and fill on ALR land (Andrews et al., 1986).

-21-
2. THE FRASER RIVER BASIN
2.1 PHYSICAL DIMENSIONS
The Fraser River Basin is the fifth largest river basin in Canada, spanning an area of 238,000 km2—an area comparable to the state of California. The Fraser River is 1,399 km in length, flowing through diverse terrain, starting in the Rocky Mountains along the eastern border of British Columbia, traversing through vast forested areas, plateaus, canyons, rolling uplands, wetland and estuaries, finally discharging into the Strait of Georgia (fig. 2.1). Aboriginal peoples have lived in the basin for more than 10,000 years, and their populations likely never exceeded 50,000. Since Simon Fraser’s historic trip down the Fraser in 1808, the population in the basin increased significantly in the 19th century and exploded in the past hundred years, particularly after World War II. The population in the basin today is over 2.7 million. The current use of the Fraser varies along its length, with forestry, pulp and paper, fishing and recreational uses dominating the sparsely populated upstream region, and industrial, trade and municipal uses becoming more dominant in the more densely populated downstream region of Greater Vancouver.
Figure 2.1: The Fraser River Basin, British Columbia, Canada
Source: Dorcey 1991: 3

-22-
2.2 INTERNAL PHYSICAL STRUCTURE
2.2.1. Tributaries
The Fraser River Basin’s vast watershed has 13 main sub-watersheds: Upper Fraser, Stuart-Takla, Nechako, Quesnel, West Road-Blackwater, Chilcotin, Middle Fraser, North Thompson, South Thompson, Thompson-Nicola, Bridge-Seton, Lillooet-Harrison, and Lower Fraser and Estuary.
These sub-watersheds are illustrated by fig. 2.2, with stream lengths and basin areas summarized in table 2.1.
Figure 2.2: The Fraser River Basin’s 13 sub-watersheds
Source: FBC website - www.fraserbasin.bc.ca/fraser_basin/watersheds.html; accessed 15 April 2004

-23-
Table 2.1: Stream Lengths And Drainage Areas For The Fraser River Basin’s 13 Sub-Watersheds
TRIBUTARY LENGTH (km)
DRAINAGE AREA1 (ha)
Upper Fraser/ Middle/
Lower Fraser Total 1,399
2,818,650/ 2,988,150/
713,100 Stuart-Takla 187 2,021,700
Nechako 516 3,131,250 Quesnel 200 1,231,050
West Road-Blackwater 227 1,251,150 Chilcotin 235 1,963,950
North Thompson 365 2,067,600 South Thompson 161 1,718,100 Thompson-Nicola 169/150 1,781,400
Bridge-Seton 142 659,550 Lillooet-Harrison 218 814,950
1. Drainage areas from Boeckh et al. 1991b: 145
2.3 UPPER FRASER
The Fraser River—named by David Thompson after his North West Company (NWC) colleague Simon Fraser—begins its 1,399 km journey to the sea at Mount Robson (3,954 meters), the highest peak in the Rocky Mountains. The ice-blue trickle merges into its only settling site at Moose Lake, soon thereafter to become the familiar golden brown river known as the “mighty” or “muddy” Fraser. The river passes Valemount and McBride as it heads northwest through the Rocky Mountain Trench. The river then turns south to Prince George. Major tributaries in the Upper Fraser watershed include the McGregor River (known for the McGregor model forest where research is done on sustainable logging), the Salmon River north of Prince George and Bowron River and Lake (renowned for its 116 km chain of 11 lakes, rivers and portages). Bowron Lake is named after John Bowron, one of the Overlanders of 1862 who came for the gold rush and stayed on as postmaster and government agent in Barkerville.
2.4 STUART-TAKLA
The most northern watershed of the Fraser Basin is the Stuart-Takla. The Stuart River (named after NWC fur trader John Stuart) originates at the south end of Stuart Lake near Fort St. James and flows south-eastward for 187 km to join the Nechako River 55 km west of Prince George. Takla Lake (from the Dakelh/Carrier term meaning “at the end of the lake”) empties to the southeast via the Middle River into Trembleur Lake and then into Stuart Lake.

-24-
2.5 NECHAKO
The Nechako River (516 km) rises on the Nechako Plateau east of the Coast Mountains and south of Burns Lake, flows north through Fort Fraser, then east through Vanderhoof to join the Fraser at Prince George. The name comes from the Dakelh/Carrier term meaning “big river.” The Chilako River (“beaver hand river”) joins the Nechako just west of Prince George.
2.6 QUESNEL
The Quesnel River (200 km; named after North West Trading Company fur trader Jules-Maurice Quesnel) drains Quesnel Lake (264 km2) by flowing northwest from between Bowron Lake and Wells Gray Provincial Park to meet the Fraser at Quesnel.
2.7 WEST ROAD-BLACKWATER
The West Road River (227 km) rises in the Ilgachuz Range near Tweedsmuir Provincial Park and flows east to its confluence with the Fraser River between Prince George and Quesnel. Also known as the Blackwater River, the West Road formed part of the “Grease Trail” used by First Nations as a trading route to the interior from the coast. Alexander Mackenzie named it West Road (as he was heading West to the Pacific); because of its black color, it also was called Blackwater.
2.8 CHILCOTIN
The Chilcotin River watershed, including Chilko Lake and River and Taseko Lake and River, drains the Chilcotin Plateau that stretches east to west from the Fraser River to the Coast Mountains and north to south from the Nechako Plateau to the Bridge River country. Chilko Lake (185.4 km2 and 83 km long) is the centre of Ts'yl-os Provincial Park, and its 1,171-metre elevation makes it B.C.'s highest major lake. The Chilko River drains the lake and runs 107 km to join the Chilcotin River near Alexis Creek for a total stream length of 235 km. Named after the Tsilhqot'in or Chilcotin First Nation people who live in the region, the Chilcotin River joins the Fraser south of Williams Lake. The name means “ochre river people.”
2.9 MIDDLE FRASER
The Middle Fraser watershed extends from just north of Quesnel to Hope, and includes the communities of Williams Lake, Lillooet, Lytton, Boston Bar and Yale. Many of the

-25-
Fraser's major tributaries join the main stem of the River along this watershed, including the Chilcotin, Quesnel, West Road-Blackwater, Thompson-Nicola and Bridge-Seton Rivers. Lac La Hache (“Axe Lake” that derives its name from the Hudson Bay Company (HBC) having lost a load of axes into the lake) drains into the San Jose River (named after the St. Joseph Mission). It then flows into Williams Lake and Creek (named after Chief William, leader of the Sugar Cane Reserve in the 1860s) and joins the Fraser.
The northern portion of the watershed is dependent on forestry and cattle ranching. The southern portion of the watershed, known as the Fraser Canyon, is very dry and rugged terrain that often records the highest summer temperatures in Canada. Hell's Gate is a narrow gorge about 30 km north of Yale, bursting with turbulent rapids. Railway construction in 1913–14 caused rockslides that blocked the river and depleted the runs of salmon; the situation did not improve until 1946 when fish ladders were constructed around the slide area. At the river's peak flow, 908 million liters of water roar through the gorge every minute.
2.10 NORTH THOMPSON
The North Thompson (365 km) rises in the Cariboo Mountains east of Wells Gray Provincial Park and flows southerly through wooded country to Kamloops. Although part of the FBC's Cariboo-Chilcotin Region (see below), 100-Mile House is located in the North Thompson watershed.
2.11 SOUTH THOMPSON
At Kamloops, the north branch of the Thompson merges with the South Thompson (161 km) flowing in from Shuswap Lake (named after the local Shuswap or Secwepemc First Nation) on the east. The watershed includes the Adams Lake and River, famous for one of North America's largest salmon runs that occur every four years. The River is named after a Shuswap Chief, Sel-howt-ken, who was baptized in 1849 as “Adam.” Communities in the watershed include Salmon Arm, Chase, Enderby and Armstrong.
2.12 THOMPSON-NICOLA
The Thompson River, the longest tributary of the Fraser River, drains a 55,671 km2 watershed in central B.C. and contributes 25% of the waters flowing through the Fraser. The Thompson was named by Simon Fraser for his fellow explorer David Thompson—mistakenly, as it turned out: Thompson never actually saw the river. The Thompson River consists of two branches.

-26-
The combined North and South Thompson Rivers flow west from Kamloops Lake through arid grasslands for 169 km to the Fraser River. The name Kamloops comes from a Shuswap/Secwepemc word “Kahm-o-loops” meaning “the meeting of the waters.” The community of Lytton overlooks the confluence of the rivers. The Bonaparte River (probably named after Napoleon Bonaparte) joins the Thompson at Ashcroft. The Nicola River (named after Chief Hwistesmex'quen who was given the name “Nicolas” by early fur traders) rises on the Douglas Plateau. After the river passes through Nicola Lake, it flows under the Coquihalla Highway and merges with the Coldwater River at Merritt. The Nicola flows west 150 km to join the Thompson near Spences Bridge.
2.13 BRIDGE-SETON
The Bridge River (142 km) flows east out of the Coast Mountains and merges with the Fraser River just north of Lillooet. Its name refers to a toll footbridge built across its mouth by the local First Nations. Seton Lake was named after British Colonel Alexander Seton. Bridge River mines produced just over 4 million ounces of gold. Two dams were built between 1946 and1960 creating two lakes, Carpenter Lake and Downton Lake. The water from Carpenter is diverted to a powerhouse at Seton Lake that lies west of Lillooet.
2.14 LILLOOET-HARRISON
The Lillooet River (218 km; from an anglicized Lillooet word referring to the area around the Mount Currie Reserve) originates with meltwater from the Lillooet Glacier high in the Coast Mountains north of Vancouver. The Lillooet flows south and east past the towns of Pemberton and Mount Currie to the north end of Harrison Lake—the largest lake in the Fraser Valley—that drains by way of the Harrison River 18 km to the Fraser. The Lake is named after Benjamin Harrison, a director of the HBC. The watershed also includes the Chehalis River that enters the Fraser just west of the Harrison.
2.15 LOWER FRASER AND ESTUARY
The Lower Fraser watershed is the most densely populated watershed in the entire Fraser River system. It extends from Hope to the world-renowned estuary at the mouth of the river, a crucial staging area on the Pacific Flyway for massive flights of migratory birds. All communities in the Fraser Valley and Greater Vancouver Regional Districts are located in this watershed.
Historically, this portion of the river flooded each spring, spreading fertile silt across the valley floor and rejuvenating the wetlands that supported abundant wildlife. Today, much

-27-
of the land in the Fraser Valley, Maple Ridge, Pitt Meadows, Coquitlam, Richmond and Delta lies behind 600 km of dykes.
The Chilliwack River (named after the local First Nation people) flows 100 km from Chilliwack Lake through the Skagit Range of the Cascade Mountains to join the Sumas River shortly before it merges with the Fraser River west of Chilliwack. The lower portion of the river was named the Vedder River/Canal (after an early Dutch settler) when it was re-routed as part of the Sumas Reclamation Scheme. In 1922, this project drained Sumas Lake to create new agricultural land called Sumas Prairie.
The Lower Fraser watershed has a number of smaller watersheds. Stave Lake and River (named for the “staves” that were made in the area and used in barrel making at Fort Langley) drain into the Fraser at Mission. Alouette Lake and River flow into the Pitt River at Haney. The Pitt River, probably named for British Prime Minister William Pitt the Younger, drains south from Garibaldi Provincial Park through Pitt Lake, emptying into the Fraser River at Port Coquitlam. Widgeon Slough, a managed habitat for waterfowl and other birds, is located at the south end of the Lake next to Golden Ears Provincial Park.
Coquitlam Lake drains via the Coquitlam River to empty into the Fraser River just east of the Port Mann Bridge. The name is a corruption of “Kwikwetl'em,” the local First Nation. The lake was dammed at its lower end in 1903 and water was diverted via a 3.5-km tunnel to neighboring Buntzen Lake for hydroelectric purposes. The Brunette River drains Burnaby Lake and Still Creek to join the Fraser at Coquitlam. The Fraser River splits at New Westminster into the North Arm and South Arm, with Vancouver and Burnaby to the north, Surrey and Delta to the south and Richmond in the middle.
Historically there were dozens of streams that criss-crossed the forested wetland that became Greater Vancouver. Most of those waterways are gone, culverted and buried under fill as the city expanded. One of Vancouver's few remaining streams (and the only salmon-bearing stream in the city), Musqueam Creek, flows through Musqueam Park and the Musqueam Indian Reserve just below the University of British Columbia.
2.16 FRASER BASIN COUNCIL REGIONS
To ensure that the interests and issues of residents throughout the Fraser Basin are addressed, the Fraser Basin Council (FBC) divided the basin into five regions based on river watershed and regional district boundaries (see descriptions for each region below):
Greater Vancouver-Squamish-Pemberton Region. Fraser Valley Region. Thompson Region.

-28-
Cariboo-Chilcotin Region. Upper Fraser Region.
These regions as pictured in fig. 2.3, while table 2.2 provides an approximate cross-reference among regions, regional districts and tributary watersheds. The regional districts of B.C. are shown in fig. 2.4. Note that regional district statistics are used for socioeconomic descriptions below.
Figure 2.3: The Five Regions Of The Fraser Basin Council
Source: FBC website - www.fraserbasin.bc.ca/regions/index.html; accessed 15 April 2004

-29-
1 East Kootenay 3 Central Kootenay 5 Kootenay Boundary 7 Okanagan-Similkameen 9 Fraser-Cheam11 Dewdnay-Aloutte13 Central Fraser Valley15 Greater Vancouver17 Capital19 Cowichan Valley21 Nanaimo23 Alberni-Clayoquot25 Comox-Strathcona27 Powell River29 Sunshine Coast31 Squamish-Lillooet33 Thompson-Nicola35 Central Okanagan37 North Okanagan39 Columbia-Shuswap41 Cariboo43 Mount Waddington45 Central Coast47 Skeena-Queen Charlotte49 Kitimat-Stikine51 Bulkley-Nechako53 Fraser-Ft George55 Peace River57 Stikine (region)59 Fort Nelson-Liard
5957
4955
535147
45 4139
333731
351
3579
43
4325
23
21
19
17
15
11
13
3129
27
3
3
3
3
3
3
3
Vancouver
Victoria
Cranbrook
Prince George
DawsonCreek
PrinceRupert
Kamloops
see inset
Inset
25
Table 2.2: Approximate Cross-Reference Among Regions, Regional Districts And Tributary Watersheds
REGION REGIONAL DISTRICT TRIBUTARY Greater Vancouver Regional District (#15) Greater Vancouver-
Squamish-Pemberton Region Squamish-Lillooet Regional District (#31)
Lower Fraser
Fraser Valley Region Fraser Valley Regional District (#9) Lillooet North Thompson Thompson-Nicola Regional District (#33) South Thompson Thompson/Nicola Thompson Region
Columbia-Shuswap Regional District (#39) Bridge-Seton Quesnel
West Road/BlackwaterChilcotin
Cariboo-Chilcotin Region Cariboo Regional District (#41)
Middle Fraser Fraser-Fort George Regional District (#53) Upper Fraser
Bulkley-Nechako Regional District (#51) Nechako Upper Fraser Region
Stuart-Takla
Figure 2.4: The Regional Districts Of British Columbia
Source: B.C. Stats website - www.bcstats.gov.bc.ca/data/pop/maps/rd91lan.pdf; accessed 15 April 2004

-30-
2.17 GREATER VANCOUVER-SQUAMISH-PEMBERTON REGION
Regional Boundaries: The Greater Vancouver-Squamish-Pemberton Region extends from the eastern boundary of the Greater Vancouver Regional District (GVRD) to the mouth of the Fraser River. It also includes those Canadian watersheds draining into Burrard Inlet, Boundary Bay and Semiahmoo Bay, the aquifers within the region and the river plume extending to Howe Sound, and the western portion of the Squamish-Lillooet Regional District (SLRD) including the Village of Lions Bay, the District of Squamish and the Resort Municipality of Whistler.
Major Sustainability Issues: Major sustainability issues facing the region include: increasing population urban sprawl transportation congestion air pollution improving Aboriginal/non-Aboriginal relations preparing for the next Fraser River flood ensuring the 2010 Olympic Winter Games are truly sustainable managing waterborne debris on the lower Fraser dealing effectively with crime and other social problems cleaning up pollution from the Britannia Mine maintaining a healthy estuary at the mouth of the Fraser River.
General Description: From high rises, cruise ships and tapas bars in downtown Vancouver to farmer's markets in Richmond, new subdivisions in Surrey, traffic gridlock on the Port Mann Bridge, sawmills and fishing boats along the Fraser, high-tech business parks in Burnaby, and winter athletes preparing for the 2010 Winter Games in Whistler, the Greater Vancouver-Squamish-Pemberton Region is the most populous and urbanized region in the Fraser Basin. Over two million people live in this region—78% of the basin's total population—and the economy is highly diversified.
2.18 FRASER VALLEY REGION
Regional Boundaries: Even though by definition the Fraser Valley extends from Hope to the estuary of the Fraser River, the FBC Fraser Valley Region follows the boundaries of the Fraser Valley Regional District (FVRD) and includes all the communities in the FVRD. The Region begins at Boston Bar and includes the lower Fraser Canyon and the central Fraser Valley from Hope to the eastern boundaries of the GVRD. The Region extends from the U.S. border on the south to the Chilliwack and Harrison River watersheds on the north.
-31-
Major Sustainability Issues: Major sustainability issues facing the region include: flood hazard management erosion rapid population growth and urban sprawl loss of agricultural land transportation congestion air pollution improving Aboriginal/non-Aboriginal relations maintaining healthy fisheries and fish habitat crime prevention and other social risk factors conflicts over land use, particularly at the urban/rural interface
General Description: The Fraser Valley Region is located east of Vancouver and has a population of approximately 240,000 people, or 9% of the total population of the Fraser Basin. The Fraser Valley is a broad, fertile floodplain on the lower Fraser River that drains westward to the sea. The valley lies between the Coast Mountains and the Cascade Mountains north of the U.S. border.
The Fraser Valley contains some of the most productive agricultural land in Canada and, indeed, in the world. Its topography, soils, climate and proximity to major markets all favor agriculture, which is the dominant economic activity in Abbotsford, Chilliwack, Kent and other smaller farming communities. Agricultural production in B.C. exceeds $1.4 billion in gross farm receipts, over one-half of which is generated in the Valley from fruit and berry crops, eggs, poultry, vegetables, nursery stock, turf, mushrooms and dairy products. In the Hope, Kent-Harrison and Mission areas, forestry is a significant industry. Commercial fishing is an important industry throughout the Lower Fraser. The Fraser Valley also provides a transportation and utility corridor for road, rail, river, natural gas and power for the major urban centers. Other major sectors include tourism, service industries, agricultural processing and manufacturing.
2.19 THOMPSON REGION
Regional Boundaries: The boundaries of the Thompson Region are based primarily on watersheds, including the North and South Thompson, Thompson/Nicola and Bridge-Seton watersheds as well as part of the rugged Fraser Canyon. The region includes all communities in the Thomson-Nicola Regional District (TNRD), as well as a number of communities located in the western portions of the Columbia Shuswap Regional District (CSRD).

-32-
Major Sustainability Issues: Major sustainability issues facing the region include habitat loss growth management dependence on single industries and the need for more economic diversification loss of agricultural land the impacts of invasive or non-native plant species water usage and deteriorating water quality in some lakes improving Aboriginal/non-Aboriginal relations.
General Description: The FBC Thompson Region extends from Boston Bar in the Fraser Canyon north to Goldbridge and Albreeda, east through Kamloops and the Shuswap Lake area to Three Valley Gap, and south to Aspen Grove and the Coquihalla toll booths. The region is known for its rich history, varied geography, abundant wildlife and diversified economy. It contains spectacular countryside from deep forest with white water rivers to semi-arid, desert-like terrain and rolling grasslands. The region has a population of approximately 175,000 people, or 5% of the total population of the Fraser Basin. Communities include Kamloops, Merritt, Ashcroft, Clearwater, Salmon Arm, Enderby, Lumby, Lytton and Lillooet.
Kamloops, the largest city in the region, has a diverse local economy based on forest industries, highway and rail services, mining, agriculture, regional trade, financial and other services, education and training, manufacturing, tourism and recreation. A variety of international corporations are located in Kamloops along with numerous federal and provincial government services and organizations. The University College of the Cariboo, located in Kamloops, is a degree granting university/college with an enrolment of over 8,000 full and part-time students. Mining, highway services and forest industries now employ more residents than do farming and ranching in the Ashcroft area. In and around Merritt, forestry, mining and agriculture are the leading industries. The Shuswap area has become a tourist mecca with visitors from around the world enjoying houseboating and other water-based activities. In the North Thompson, forest industries predominate, with highway transport a fast-growing sector. Tourism plays a significant role throughout the region.
2.20 CARIBOO-CHILCOTIN REGION
Regional Boundaries: The boundaries of the Cariboo-Chilcotin Region are based primarily on watersheds, including the Quesnel, West Road/Blackwater, Chilcotin and Bridge-Seton watersheds as well as part of the Middle Fraser River. The region includes all the major communities in the Cariboo Regional District (CRD).

-33-
Major Sustainability Issues: Major sustainability issues facing the region include: dependence on single industries and the need for more economic diversification growth management access to health care effective transportation links improving Aboriginal/non-Aboriginal relations forest devastation from the Mountain Pine beetle epidemic.
General Description: The Cariboo-Chilcotin Region is the largest region in the Fraser Basin. Located in the B.C. Central Interior, the region straddles Highway 97 from 70-Mile House in the south to five km south of Hixon in the north, from the Cariboo Mountains in the east to the Coast Mountains in the west. The region is divided roughly in half. The Cariboo, or eastern half of the region, refers to the Interior Plateau spreading east of the Fraser River to the Cariboo Mountains. The area to the west of the Fraser is called the Chilcotin. The Chilcotin Plateau spreads west 300 km from the Fraser River to the Coast Mountains. The name comes from the Tsilhqot'in or Chilcotin First Nation who live in the region.
The region is renowned for its varied topography, abundant wildlife and spectacular landscapes—from rolling fields to craggy peaks, rainforests to grasslands. The population of the region is approximately 70,000 people, or 3% of the total population of the Fraser Basin. Major communities include Quesnel, 100-Mile House and Williams Lake, the largest city in the region with a population of 15,000.
Historically, the region depended on the land, with furs, minerals, timber and ranching being the mainstays of the economy. Today, forestry is the dominant industry in the region; ranching, agriculture and mining are also major economic sectors. Tourism focused on the region's gold rush history, spectacular scenery and outdoor recreational opportunities is playing an increasingly important role.
2.21 UPPER FRASER REGION
Regional Boundaries: The boundaries of the Upper Fraser Region are based primarily on watersheds, including the Upper Fraser, Nechako and Stuart-Takla. The region includes almost all the major communities in the Fraser-Fort George Regional District (FFGRD) and the central and eastern communities in the Bulkley-Nechako Regional District (BNRD).
Major Sustainability Issues: Major sustainability issues facing the region include: dependence on single industries and the need for more economic diversification the softwood lumber dispute with the U.S. access to health care

-34-
improving Aboriginal/non-Aboriginal relations effective transportation links forest devastation from the mountain pine beetle epidemic.
General Description: The Upper Fraser Region extends from the headwaters of the Fraser River on Mount Robson, northwest along the Rocky Mountain Trench to Prince George, north through the Stuart-Takla watershed to Fort St. James and Takla Landing, and west through Vanderhoof and Burns Lake in the Nechako watershed to the Coast Mountains. The population of the region is approximately 135,000 people, or 5% of the total population of the Fraser Basin. Communities include Burns Lake, Fort St. James, McBride, Prince George, Valemount, and Vanderhoof.
The economy of Prince George is based on the forest industry, with fourteen sawmills, two single pulp mills and one of the largest twinned pulp mills in the world. Wood products manufacturing, a refinery, a brewery, chemical plants and diesel locomotive repair shops contribute to the industrial base. The city is a manufacturing centre for the Northern Interior, a staging centre for mining and prospecting, and a major regional transportation, trade and government hub.
The forest industry is important to all the communities in the region. Terrain and climate support agriculture, primarily in the Nechako and Robson valleys near the communities of Vanderhoof and McBride respectively. Tourism, especially outdoor adventure and recreational activities, plays an increasingly important role in the region.
2.22 HABITAT DIVERSITY
The Fraser Basin includes 11 of the 14 biogeoclimatic zones of B.C., which makes it one of the most diversified basins in Canada (Savard 1991). The zones represented include the Coastal Western Hemlock, Interior Cedar Hemlock, Interior Douglas Fir, Ponderosa Pine, Bunchgrass, Mountain Spruce, Engelmann Spruce – Sub-Alpine Fir, Mountain Hemlock, Sub-Boreal Spruce, Sub-Boreal Pine Spruce and Alpine Tundra (B.C. Ministry of Forests 1988). Several of the zones cover extensive portions of the basin, while others only cover a small section (table 2.3). Each biogeoclimatic zone can be further subdivided into several different habitat types based on other characteristics such as vegetation age, type and degree of wetness.

-35-
Table 2.3: Area Covered By The Different Biogeoclimatic Zones In The Fraser Basin
BIOGEOCLIMATIC ZONE AREA WITHIN THE
FRASER RIVER BASIN (ha)
Coastal Western Hemlock 839,798 Interior Cedar Hemlock 2,125,799
Interior Douglas Fir 3,292,015 Ponderosa Pine 220,943
Bunchgrass 327,811 Mountain Spruce 647,954
Engelmann Spruce – Sub-Alpine Fir 5,003,156 Mountain Hemlock 456,006 Sub-Boreal Spruce 6,874,301
Sub-Boreal Pine Spruce 2,359,961 Alpine Tundra 1,079,198
Source: Savard 1991: 190
The Fraser Basin is one of the greatest salmon-producing river systems in the world, and contains a wide diversity of fish and waterfowl species. As Canada’s largest producer of salmon (Pomeroy 1995), over 60% of the sockeye, 60% of the pink and 16% of the Chinook salmon catches are from the Fraser. An average annual return of $300 million is realized from commercial, recreational and Aboriginal fisheries (Marshall 1998). The basin has been home to Aboriginal peoples for thousands of years, and fishing is a key part of their culture.
The Fraser River estuary also supports the highest density of wintering waterfowl, shorebirds and birds of prey in Canada. In a typical year, about 1.5 million birds (150 species) use the estuary and its adjacent upland, especially between October and December (Tellus Institute In press) for birds migrating from eastern Siberia and western North America to South America
It has been estimated that about 512 species of birds, mammals, fish, reptiles and amphibians reside within the Fraser River Basin. About one in ten vertebrate species that live in the basin is “red-listed”, meaning they have exhibited significant declines in population abundance. Of the 111 “red-listed” vertebrates in B.C., about 42% of these are present in the Fraser Basin, illustrating the importance of this basin in supporting biodiversity in British Columbia (FBC 2003).
2.23 HYDROLOGY OF THE FRASER RIVER BASIN
The hydrology of an area reflects the interactions between climatic, physiographic, geologic and vegetative factors, as well as human activity. In large part, the climate

-36-
determines the timing and magnitude of water inputs to the surface, while the other factors control the subsequent partitioning of inputs into overland flow, soil moisture, groundwater, lakes and wetlands, and streamflow. For purposes of hydrologic description, the Fraser Basin can be divided into three regions: the Coast Mountains, Interior Plateau and Eastern Mountains (including the Columbia and Rocky Mountains) (fig. 2.5).
Figure 2.5: Hydrologic Regions Of The Fraser River Basin
Source: Moore 1991: 21

-37-
2.23.1. Climatic Characteristics
The climates of the Fraser Basin reflect the interaction of the dominant westerly atmospheric circulation with the mountain ranges. During winter, a relatively steady succession of low-pressure systems moves eastward from the Pacific Ocean, bringing wet conditions associated with cyclonic, frontal and, in the mountains, orographic uplift. Outbreaks of arctic air occasionally occur during winter, bringing cold conditions and brisk winds, particularly in the lower Fraser Valley. In summer, the westerly circulation weakens and a persistent high-pressure area develops off the coast resulting in a decreasing frequency of storms and frequent periods of fine weather.
The Coast Mountains endure westerly weather systems and experience heavy precipitation during the autumn and winter. Mean annual precipitation may exceed 2,000 mm in some localities. At higher elevations, much of the precipitation falls as snow and remains in storage until the spring thaw. The windward slopes of the mountain ranges experience the heaviest precipitation, while the lee slopes tend to experience a rain-shadow effect. Precipitation generally increases with elevation. The Interior Plateau lies in the rain shadow of the Coast Mountains, and mean annual precipitation ranges from about 400 mm to 800 mm. In contrast to the Coast Mountains, weather monitoring stations in the Interior Plateau experience a precipitation peak in summer, reflecting the influence of summer convective storms. Most of the winter precipitation falls as snow.
Easterly-moving air masses produce precipitation when the Eastern Mountains are encountered. However, having already lost moisture over the Coast Mountains, the air masses are not so productive, and mean annual precipitation in the region ranges from 1,000 mm to as much as 2,000 mm. As in the Coast Mountains, elevation and exposure to the prevailing winds influence precipitation. The autumn precipitation peak is not as great as in the Coast Mountains.
Temperature decreases with both elevation and latitude. Consequently, the relative importance of snow as winter precipitation increases with these two factors. The affect of elevation is especially important in the southern Coast Mountains, where storm snowline elevations frequently lie well above sea level.
2.23.2. Water Inputs
Rainfall, snowmelt and glacier melt contribute varying amounts of water to the Fraser Basin, typically termed run-off. The magnitude and timing of snowmelt varies through the basin, depending upon the interaction of snow accumulation and melt processes. At lower elevations, especially in the Coast Mountains, mid-winter melt events are common,

-38-
and decrease the amount of snowpack that would be released during spring thaw. At higher elevations, mid-winter melt events occur less frequently and more of the precipitation falls as snow, due to decreasing temperatures with elevation. The bulk of the winter's snowfall at higher elevations melts during spring and early summer. Peak accumulation is greater in the mountains, particularly the Coast Mountains, than in the Interior Plateau.
The timing of the main spring thaw varies according to location and elevation. In the Interior Plateau, the main melt begins in March. In contrast, melt normally begins in May in the higher elevations of the Coast Mountains. At McBride, melt begins in March at the lowest station, April at the middle-elevation station and in May for the highest station. Thus, the amount and timing of snowmelt vary from year to year. Glacier melt is an important source of run-off water mainly in the headwater basins in the Coast Mountains, Cariboo Mountains and the Rocky Mountains. At the scale of the major tributaries to the Fraser (i.e., basins draining areas in the order of 100,000 ha and larger), the Lillooet-Harrison Basin probably receives the greatest input of glacial meltwater, since maps indicate that this basin has the greatest proportion of glacier cover.
2.23.3. Streamflow
Table 2.4 provides mean monthly streamflows, averaged over the period of record for each station and expressed as cubic meters per second (m3/s). Most basins respond to the melting of seasonal snow accumulation. The bulk of run-off occurs in spring and summer, with low flows occurring in winter when most of the precipitation falls as snow and is stored in the snowpack. The run-off regimes of the Coquihalla and Chilliwack Rivers are dominated by snowmelt, but also reflect the input of rainfall at lower elevations during autumn and winter. Run-off is greater in basins which are dominated by mountainous terrain and/or lie near the Coast (Harrison, Coquihalla, McGregor, North and South Thompson) than basins which dominantly drain Interior Plateau country (Nautley, Nicola, West Road, Salmon Rivers near Prince George). Table 2.4 shows that tributary inflow to the main stem above Hope is dominated by the Thompson, Nechako and Harrison Rivers, together accounting for over half the mean annual flow of the Fraser River at Hope.
The basins that drain mountainous and/or interior areas exhibit spring-summer flood peaks resulting from the melt of the seasonal snowpack, aided in some cases by rainfall during melt. Some basins, particularly those draining the Coast Mountains, also exhibit autumn-winter peak flows caused by rain associated with cyclonic storms. In some basins (e.g., the Coquihalla and Harrison) autumn-winter rainfall peak flows are higher than the spring-summer melt peak flows. The Fraser River at Hope drains a sufficiently large area

-39-
that only the spatially widespread and prolonged seasonal melting of snow and ice produce peak flows. Many of the basins that are dominated by snowmelt run-off from mountainous areas exhibit low flows in winter, when most of the precipitation is stored as snowpack (e.g., McGregor River, South Thompson River; see table 2.4). Low elevation coastal basins experience low flows in summer when rainfall is low and evaporation high.

-40-
Table 2.4: Streamflow And Run-Off In The Fraser Basin
HYDROLOGIC REGION1 QMA
3 QMAR3 QJUN
3 SUB-BASIN
DRAINAGEAREA
(ha) %CM %IP %EM
RO2 mm
m3/s %4 m3/s %4 m3/s %4
Fraser River at McBride 689,000 0 0 100 904 196.0 7.2 31.9 3.7 569.4 8.1 Bowron River near Hansard 355,000 0 50 50 664 74.4 2.7 23.4 2.7 209.5 3.0 McGregor River at Lower Canyon 477,000 0 34 66 1,510 218.0 8.0 45.8 5.3 611.3 8.7 Willow River near Willow River 311,000 0 50 50 480 34.7 1.3 15.3 1.8 106.8 1.5 Salmon River near Prince George 430,000 0 100 0 214 29.0 1.1 11.2 1.3 44.9 0.6 Stuart River near Fort St. James 1,460,000 0 100 0 281 130.5 4.8 46.5 5.4 269.2 3.8 Nautley River near Fort Fraser 603,000 0 100 0 167 30.9 1.1 11.1 1.3 87.1 1.2 Nechako River at Isle Pierre5 4,250,000 15 85 0 216 278.5 10.3 127.1 14.8 522.9 7.5 West Road River near Cinema 1,240,000 0 100 0 83 33.0 1.2 14.5 1.7 69.3 1.0 Quesnel River near Quesnel 1,150,000 0 75 25 643 237.8 8.8 66.3 7.7 626.2 8.9 Chilcotin River below Big Creek 1,930,000 23 77 0 158 101.2 3.7 28.3 3.3 207.0 3.0 North Thompson River at Mclure 1,960,000 0 64 36 690 429.3 15.8 94.5 11.0 1,341.5 19.2 South Thompson River at Chase 1,620,000 0 50 50 562 292 10.8 93 10.8 855 12.2 Thompson River at Spences Bridge 5,460,000 3 71 26 450 741 27.3 194 22.6 2211 31.6 Coquihalla River near Hope 74,100 100 0 0 1,407 33.0 1.2 19.9 2.3 78.5 1.1 Fraser River at Hope 21,700,000 10 73 17 396 2,713 100 859 100 7,003 100 Chilliwack River at Vedder Crossing 123,000 100 0 0 1,729 66.7 2.5 43.5 5.1 137.3 2.0 Harrison River near Hot Springs 787,000 100 0 0 1,795 440 16.2 219 25.2 922 13.2
1. Percentages of basin lying within each hydrologic region: CM = Coast Mountains, IP = Interior Plateau, EM = Eastern Mountains. Source: Moore 1991: 26 2. RO = run-off. These values represent average annual run-off for each sub-basin. Source: Moore 1991: 26 3. Qma refers to mean annual discharge, while Qmar and Qjun refer to mean monthly discharge for the months of March and June respectively. March is the month of
lowest mean flow in the Fraser River at Hope, while June is the month with the highest mean flow. All values are means based on the monitoring period at each station, rather than on a standard period. Source: Water Survey of Canada electronic database of archived hydrometric data; www.msc-smc.ec.gc.ca/wsc/hydat/H2O/; accessed 26-29 April 2004.
4. Flow as a percentage of the corresponding flow in the Fraser River at Hope (in bold type). 5. Regulated flow.

-41-
2.24 HUMAN-BUILT RESERVOIRS
Predictions were made early in this century that rapid industrial growth in the lower Fraser would be supported by cheap, abundant electricity generated by harnessing the Fraser River itself. However, the Fraser mainstem has never been dammed, primarily due to concern over the disastrous effect it would have on the river's salmon stocks. However, 12 major hydroelectric generation facilities have been built on tributary systems to the Fraser (table 2.5). The largest is the Kemano facility (Kenney dam) operated by the Aluminum Company of Canada Ltd. (Alcan), which diverts a large proportion of the upper Nechako River westward, out of the Fraser system. The remaining facilities are owned by B.C. Hydro, and about 11% of that company's gross electrical demand (40,793 GWh in 1988; Boeckh et al. 1991b: 175) is produced in the basin.
Table 2.5: Human-Built Water Reservoirs In The Fraser River Basin
SUB-BASIN DAM NAME1 RESERVOIR VOLUME2 (million m3)
ENERGY GENERATION CAPACITY3
(MW) Nechako Kenney3 23,675 896
La Joie 721 25 Terzaghi 1,014 466 Bridge-Seton
Seton 84 48 Shuswap 0.1 (run of river) 6 South Thompson
Sugar Lake 163 No Generation Facilities Wahleach 66 63 Alouette 210 9
Buntzen #1, #2 191 72.8 Ruskin 42 105
Stave Falls 684 91
Lower Fraser
Cheakamus 5.6 140 1. Kenney dam owned by Alcan; B.C. Hydro and Power Authority own all others. 2. Reservoir volumes from Boeckh et al. 1991b: 175, except Cheakamus, which is from water
license data available online: www.elp.gov.bc.ca:8000/pls/wtrwhse/water_licences.input; accessed 29 April 2004.
3. Energy generation capacities represent maximum sustained capacities from B.C. Hydro’s Quick Facts, 31 March 2003, available online www.bchydro.com/rx_files/info/info3519.pdf; accessed 29 April 2004. Kenney dam generation capacity from Alcan Power Project: Global Project Profile, undated, available online www.wgint.com/docs/alcan.pdf; accessed 29 April 2004.
The Lower Mainland, along with Vancouver Island, consumes the majority of the province’s electrical energy, and it contains several hydroelectric generation stations. Wahleach generating station is a 63 MW “high head” facility located west of Hope. The Stave River generation complex includes the 9 MW Alouette, the 91 MW Stave Falls and

-42-
the 105 MW Ruskin generating stations. The two Buntzen stations produce 72.8 MW, in part using water diverted from the Coquitlam River to Buntzen Lake.
The Bridge River complex is the third largest development in the B.C. Hydro system (after the Peace and Columbia projects). The complex consists of three distinct components. The La Joie Dam and 25 MW generating station near Bralorne discharges into Carpenter Lake, which is formed by the 466 MW Terzaghi Dam on the Bridge River. These plants use water diverted from Carpenter Lake through tunnels to the stations located on Seton Lake. The 48 MW Seton generating station is situated at the east end of Seton Lake near Lillooet. Water releases are required for fish spawning in Seton Creek. Studies are underway to determine a balance among flood control, environmental and power benefits.
The Cheakamus generating station, located on the Squamish River, is a two unit, 140-MW facility using water diverted from Daisy Lake on the Cheakamus River. The reservoir is subject to very rapid draw down and filling. Considerable effort has been made to reduce flooding below the dam during adverse weather conditions.

-43-
3. HISTORICAL AND CURRENT DEVELOPMENT OF WATER RESOURCES
3.1 HYDRO DEVELOPMENT
In the mid 1950s, Morrison Knudsen-Canada, a Washington Group International Heritage Company, built the largest hydroelectric project ever created by private enterprise up to that time. The project for Alcan included an underground powerhouse carved into the solid-rock side of a mountain, a 317-foot-high dam, a ten-mile-long power tunnel and a 51-mile-long electrical transmission line. Following World War II, the British Columbia government wanted to develop the area’s natural resources and establish new population centers. It also wanted to do it without spending Canadian taxpayers’ money. The cost of the development, and the lack of any consumer base in the area, prompted the government to seek an energy-intensive industry that could justify the necessary investment. Alcan reviewed the situation and was interested. The B.C. government, for its part, saw a way to open up the central part of the province to growth and development. Alcan not only built the largest hydroelectric power generating operation at the time, it also built the infrastructure and original housing for the wilderness communities of Kitamat and Kemano. The Kenney Dam, at one time the largest rock-filled dam in the world, impounds the waters that form the huge Nechako Reservoir. This vast network of flooded lakes has been diverted westward to feed the massive Alcan power project at Kemano, 50 miles inland from the Pacific Ocean. The power plant’s eight 112-MW generators produce electricity for the Alcan smelter in Kitamat.
With the exception of the Kemano project on the Nechako River, the Fraser River Basin is not a major producer of hydroelectricity. However, substantial power generating potential does exist. Besides the Nechako, potential sources that have received attention are the McGregor River and the Fraser River at the Moran Gorge. In the 1950's, studies were undertaken of a diversion from the Columbia River through Eagle Pass to the Eagle River and the major potentials that might be developed in the Thompson and Fraser as a result of the increased flows. The Fraser River valley also plays a significant role as an electrical transmission corridor. This role is likely to expand over the next 40 – 50 years as energy sources in the interior are further developed to supply the expanding demands on the coast and for markets in the U.S.
-44-
3.2 IRRIGATION AND DRAINAGE
The need for water for irrigation in the middle 1800's was one of the driving forces behind the establishment of water rights in B.C. Irrigation needs, and thus, related infrastructure, are predominantly located within the dry interior parts of the Fraser Basin, particularly within the Thompson sub-basin. Drainage systems are primarily located within the lower Fraser due to higher levels of rainfall on the south coast of B.C. and an extensive dyking system along the lower Fraser, which prevents free-flowing drainage into the main stem of the Fraser. Pumps are required to pump water through the dyking system.
In the 1960's, the provincial government with federal assistance under the Agricultural Rehabilitation and Development Act began assisting irrigation districts with the conversion of open ditch and flume systems to closed, pressurized systems. Works worth about $60 million were completed under this program, and the conversion was estimated to reduce irrigation requirements by as much as 30% (Shady 1989). In 1977, the provincial and federal governments signed the Agriculture and Rural Development Subsidiary Agreement under which $5.3 million in irrigation projects and $7.3 million in drainage projects were completed. In 1985, a new Agri-Food Regional Development Subsidiary Agreement was signed which allocated $31 million to irrigation and drainage projects over a five-year period. The province has also invested about $40 million in drainage and dyking in areas not covered under the federal-provincial agreements.
Perhaps the largest single drainage project undertaken in the Fraser River Basin is the draining of Sumas Lake in the Fraser Valley beginning in 1919. The lake was drained and the land—now called Sumas Prairie—was reclaimed for agricultural purposes.
Most of the work on irrigation is concentrated outside the Fraser in the Okanagan River Basin. However, a large percentage of the drainage and ditching funded under these agreements takes place in reclaimed areas behind dykes in the lower Fraser Valley and Delta. Much of the work is closely associated with construction of flood control works under previous federal-provincial flood control programs.
3.3 FLOOD CONTROL
A major dyke extension and improvement program was undertaken between 1968 and 1995. The Fraser River Flood Control Program was instigated following a review of the 1948 flood by the Governments of Canada and British Columbia. This program aimed at repairing, strengthening, constructing and rehabilitating dykes along the lower Fraser
-45-
River. Initially, funding for the program was $18 million each from the federal and provincial governments, but this was increased to $61 million in 1969 and $120 million in 1976 (Smith 1991). Up to 1991, some $134 million of the approved $161 million had been spent under the program (Smith 1991). Agreements between local authorities, which have benefited from works, and the province of British Columbia stipulate that local authorities will be responsible for the operation and maintenance of the dykes and will encourage flood proofing behind dykes to reduce flood losses. More recently, the B.C. Flood Protection Assistance Fund has helped local governments and dyking districts undertake major repairs and rehabilitation of flood protection works, including dykes and erosion protection works.
Standard dykes along the lower Fraser River provide flood protection to the 1894 Fraser River flood level plus 0.6 meters of freeboard. This is the Fraser River “flood of record” that has been estimated to have a 1-in-200-year return frequency. Unfortunately, many of the soils within the lower Fraser River floodplain are also susceptible to liquefaction during an earthquake event. A study of the Abbotsford area (Klohn Leonoff 1989) concluded that a 200-year earthquake occurring at any time of the year would cause sufficient damage to the dykes that rehabilitation prior to the next Fraser River freshet might not be possible. Additional flood protection could be achieved through the development of upstream storage reservoirs or diversions of major tributary rivers. The Lower McGregor diversion was found to be the only economically viable project that would provide such protection by the Fraser River Upstream Storage Study (Fraser River Joint Advisory Committee 1979). This diversion was vetoed on environmental grounds due to the risk of fish parasites migrating from the Pacific into the Arctic drainage basin. During winter and spring conditions when there is a high flood threat, other water storage reservoirs such as hydro-electricity dams operate to help reduce the peak flow during the spring run-off.
3.4 GROUNDWATER
Groundwater provides a large percentage of the domestic and agricultural water supplies for communities in the Stuart, Nechako and middle Fraser sub-basins. Of the 18 aquifers in B.C. that are classified as “heavily used,” nine (half) are located within the Fraser Basin (FBC 2003). Of the 43 aquifers in B.C. that have water quality or quantity concerns identified, 17 are located within the Fraser Basin (FBC 2003). Eleven of these aquifers are in the lower Fraser and six are within the interior part of the basin. Wells in a large part of the Middle Fraser Region and some parts of the Thompson Region contain hard or very hard water that causes cleaning problems since this water consumes excess soap and detergent if it is not softened. Many groundwater supplies throughout the Fraser River

-46-
Basin contain iron and manganese levels that exceed the acceptable drinking water standards. These contaminants do not present a health hazard but cause aesthetic concerns by staining fixtures and clothing.
Groundwater from the Abbotsford area of the lower Fraser sub-basin is badly polluted with nitrates largely from animal wastes and agricultural fertilizers (Hall et al. 1991; B.C. MELP 1996, 2000). Levels appear to be increasing and there are public health concerns for infants who can develop methemoglobinemia, sometimes referred to as “blue baby syndrome.” Some of the more soluble pesticides, such as dinoseb, are getting into well water in the intensively farmed lower Fraser Valley; however, the extent of pesticides in groundwater has not been adequately investigated and requires more research.
3.5 WATER USE CONFLICTS
Conflicts over water use exist throughout the basin but they vary greatly in kind and intensity. Conflicts are particularly numerous, intense and varied in the Fraser River Estuary, where competing demands are associated with effluents from three primary sewage treatment plants, a variety of industries and urban run-off; habitats for fish and waterfowl; moorage for fishing and recreational boats; ports for imports and exports by bulk and containerized shipping; parks and beaches for recreation; waters for commercial, sport and Aboriginal fishing; wetlands for duck hunting and bird watching; waterfront lands for residential homes and industrial development; foreshore moorage for log-booms and floating homes; and floodplain lands for urban, industrial and agricultural uses.
In the lower Fraser sub-basin outside the Greater Vancouver Regional District (GVRD), the competing demands are generally not as varied or intense, but nonetheless are probably the second greatest in the basin. Notable differences from the estuary are that most municipal effluents receive secondary treatment, there are relatively few direct industrial discharges and there are no deep-sea shipping facilities. However, there is greater agricultural activity on the floodplain in this region where irrigation, dependence on groundwater and forestry in tributary watersheds such as the Chilliwack and Harrison result in water use conflicts.
In the interior Fraser, competing demands are particularly associated with the five urban-industrial centers. For the most part, they generate comparable competing demands to the communities of similar size in the lower Fraser sub-basin with two major additions: the pulp mills create much larger demands on water than any other industry in the basin; and water demands per capita in the dry belt are almost twice as great as elsewhere in the basin with associated local water shortages.

-47-
Throughout the basin in forested watersheds, competing demands of varying intensity exist for timber, fish and wildlife habitat, recreation and community water supply. On accessible lakes and streams, intense recreational fisheries are depleting freshwater fish stocks; and in some parts of the basin, sport fisheries are competing with Aboriginal food fisheries. Where dams have been constructed, there are competing demands for flows to maintain fish habitats, generate power and reduce flood hazards.
While the nature of the conflicts differs throughout the basin, they are also increasingly interdependent and basinwide. For example,
upstream pulp mills contaminate fish in the estuary; diversion of headwater streams reduces mainstem flows hundreds of kilometers
downstream, increasing the concentration of pollutants and threatening fish migration at low flows;
coastal and estuarine fisheries reduce upriver catch; Greater Vancouver's atmospheric pollution contaminates the upper end of the Lower
Fraser Valley; overfishing of lake fisheries in the lower Fraser shifts demand pressures to the lakes of
the Fraser interior; and declining stocks of mature timber in the lower sub-basins shift demands to the greater
stocks in upper sub-basins.
Thus, the Fraser today is a river under pressure from an increasing diversity and intensity of demands, the likes of which Simon Fraser could not possibly have imagined less than 200 years ago.
3.6 WATER QUALITY
Industrial and municipal discharges in the upper basin, particularly in the reach between Hansard and Marguerite on the main stem Fraser, and downstream of Kamloops on the Thompson River, have the potential to affect stream concentrations of common dissolved constituents. French and Chambers (1995) estimated total pulp and paper mill effluent volumes to the upper Fraser at 410,000 m3/day, and domestic wastes at about 35,000 m3/day, quantities which together can constitute as much as two per cent of the total winter flow at Marguerite. In addition to the commonly measured water quality variables, pulp mills and municipal treatment plants also discharge a wide range of halogenated and non-halogenated organic compounds, metals, dissolved ions and dissolved nutrients (French and Chambers 1995; Norecol 1993).
Water quality monitoring data have been collected since about 1985 at nine sites in the Fraser River Basin under the Canada-B.C. Water Quality Monitoring Agreement (Shaw and Tuominen 1999). These stations are located on the main stem Fraser River at Red Pass, Hansard, Stoner (downstream of Prince George), Marguerite (downstream of

-48-
Quesnel) and Hope; on the Nechako and Thompson rivers, the Fraser’s major tributaries; on the Salmon River, near Salmon Arm; and on the Sumas River in the Fraser Valley (Fig. 2.6). Water samples have been collected and analyzed for dissolved ions, nutrients, trace metals and a range of other variables on a bi-weekly basis at many of the sites since the mid-1980s. Because the analysis of contaminants, such as organochlorines (e.g., chlorophenols, guaiacols, catechols) released into the environment by industrial discharges, are costly, a relatively inexpensive indicator, AOX (adsorbable organohalides), is measured at the Stoner and Marguerite sites, which are downstream of the pulp and paper mills.
The largest input of wastewater occurs in the Fraser River Estuary, largely through effluents discharged from the Vancouver area wastewater treatment facilities. Together, three plants in the region release roughly 429,000 m3/day (Shaw and Tuominen 1999: 49). A wide variety of industrial discharges, including metal fabricating plants, sawmills, pulp and paper mills, chemical plants and other activities release a range of contaminants in relatively low-volume discharges to the Fraser River. Other more poorly characterized effluents are those released through the 20 combined sewer overflows (McGreer and Belzer 1999), which transmit an estimated volume of 6,270,000 m3/yr to the North Arm and main stem of the Fraser (FREMP 1996).
Figure 2.6: Locations Of Long-Term Water Quality Monitoring Sited In The Fraser Basin
Source: Shaw and Tuominen 1999: 50

-49-
Evaluating the environmental effects, and even the measurement of ambient concentrations of these contaminants, is complex due to the array of inputs, the spectrum of contaminants and the physical interactions between the river flow and tidal intrusion. In more than ten years of monitoring, measured concentrations of most variables in the main stem Fraser River have not exceeded levels which would compromise potential water uses. Some of the current water quality guidelines for total trace metals developed by the Canadian Council of Ministers of the Environment (CCME) were frequently exceeded, particularly the 0.3 mg/l guideline for protection of aquatic life from total iron. However, these high metal concentrations were related to native metal in suspended sediments and represent background levels in the river. In addition, despite major effluent improvement, the present stringent water quality objective for AOX (no significant increase from upstream to downstream of a discharge, Swain et al. 1997) was exceeded at locations downstream of pulp and paper mills for much of the period of record.
The following discussion focuses on the main Fraser River water quality monitoring stations, as well as on monitoring stations located on the two main tributaries, the Thomson and Nechako Rivers.
3.6.1. Fraser River at Hope
Major ions, trace elements, nutrients, color, dissolved and suspended solids, pH, and temperature have been monitored once every two weeks since 1979 at the Highway #1 bridge crossing at Hope. Monitoring of fecal coliforms began in 1987 and AOX began in 1991. Flow has been monitored continuously at the same location.
Chloride and AOX declined since 1991 due to the reduction in chloride and AOX in the effluents of upstream pulp mills because of changes in the pulp bleaching process to reduce the use of elemental chlorine (B.C. MWLAP 2000). The AOX objective for the Fraser River was still not attained consistently at Hope in 1997, but it is considered to be of low environmental significance because chlorinated phenols and dioxins and furans met the objectives in 1995. AOX is merely a surrogate indicator for these chlorinated compounds. For example, chlorinated phenols in the Fraser River at Hope were no longer detectable and met the objectives in 1995. Dioxins and furans in mountain whitefish muscle met the objective in 1995. The B.C. Ministry of Health lifted restrictions on the consumption of fish muscle in 1994.
Fecal coliforms probably did not meet the water quality objective to protect raw drinking water that will receive partial treatment and disinfection, although the safe level for recreation was probably met (B.C. MWLAP 2000). Monitoring was not frequent enough to be certain whether the objectives were met or not met. Exceeding the objective is not

-50-
of immediate concern because the Fraser near Hope is not used for drinking water at present, but increased monitoring is needed to assess the attainment of the fecal coliform objectives more accurately.
3.6.2. Fraser River at Marguerite
Major ions, trace elements, nutrients, color, dissolved and suspended solids, pH, fecal coliforms, AOX (surrogate indicator for chlorinated compounds), and temperature were monitored once every two weeks since about 1985-1990, depending on the indicator. Flow has been monitored continuously since 1950.
Chloride and AOX declined since 1990 due to the reduction in chloride and AOX in the effluents from the upstream pulp mills (B.C. MWLAP 2000). Again caused by changing the pulp mill bleaching process to reduce the use of elemental chlorine. Fecal coliforms have declined since 1988 due to improved sewage treatment and disposal at Prince George and Quesnel (B.C. MWLAP 2000).
The decline in AOX indicates that chlorinated organics, which can be toxic to aquatic life and to humans and wildlife that consume aquatic life, have been reduced substantially in the Fraser River. For example, chlorinated phenols in the Fraser River at Marguerite were no longer detectable and met the objectives in 1995. Similarly, dioxins and furans in mountain whitefish muscle declined between 1990-91 and 1995, and met the objective in most fish in 1995 (B.C. MWLAP 2000). The B.C. Ministry of Health lifted restrictions on the consumption of fish muscle in 1994. The objective for AOX was still not attained consistently at Marguerite in 1996, but this is considered to be of low environmental significance because chlorinated phenols and dioxins and furans largely met the objectives in 1995. The decline in fecal coliforms indicates that the water was safer for drinking water supply, recreation and irrigation. The objective for fecal coliforms was still not attained consistently, and further monitoring and investigation of sources of fecal contamination are needed to determine abatement options.
3.6.3. Fraser River at Stoner
AOX were monitored once every two weeks since late 1990. The Fraser River at Stoner had an improving trend in AOX, a measure of chlorinated organics, due to waste abatement at the pulp mills at Prince George (B.C. MWLAP 2000). The objective for AOX was still not attained consistently in 1996, but this was not deemed serious because the objectives for specific chlorinated organics were attained in 1995. Similarly, dioxins and furans in mountain whitefish muscle declined between 1990-91 and 1995, and met

-51-
the objective in 1995, and as above the B.C. Ministry of Health lifted consumption restrictions in 1994.
3.6.4. Fraser River at Hansard
Major ions, trace elements, nutrients, color, dissolved and suspended solids, pH, AOX, fecal coliforms, and temperature were monitored once every two weeks since 1985. Flow has been monitored continuously. There were no environmentally significant changes from 1985 through 1994 (B.C. MWLAP 2000). Monitoring is continuing at Hansard, which will serve as a control station for the Fraser Basin upstream from the industrial and municipal waste discharges at Prince George and further downstream.
3.6.5. Thompson River at Spences Bridge
Major ions, trace elements, nutrients, color, dissolved and suspended solids, pH, and temperature have been monitored once every two weeks at Spences Bridge since 1985. Flow has been monitored continuously at this location.
Chloride declined from 1988 to 1993 due to waste abatement at the pulp mill in Kamloops (B.C. MWLAP 2000). Chloride levels were well below all water quality guidelines. The significance of chloride in this situation is as an indicator of chlorinated organics, which can be toxic to aquatic life and to humans and wildlife that consume aquatic life. The decline in chloride indicates that chlorinated organics have been substantially reduced in the Thompson River. Indeed, the levels of the chlorinated organic, dioxins and furans, in fish have declined substantially during 1988 – 95. Fish consumption advisories have been lifted by the provincial health authorities, and the objective to protect the fish themselves was attained in 1995.
3.6.6. Nechako River at Prince George
Major ions, trace elements, nutrients, color, dissolved and suspended solids, pH, fecal coliforms, and temperature were monitored once every two weeks since 1985. Flow has been monitored continuously at Isle Pierre, 52 km upstream. There were no environmentally significant changes from 1985 through 1995 (B.C. MWLAP 2000).
3.7 SOCIAL CONTEXT
3.7.1. Demographics
Table 2.6 contains a time series from 1993 to 2003 of population data for the Fraser Basin regions. These population estimates were compiled by combining relevant regional

-52-
district (see table 2.2) statistics provided by B.C. Stats. Approximately 77% of the total basin population reside in the Greater Vancouver-Squamish-Pemberton Region, due to its greater degree of urbanization, while the Cariboo-Chilcotin Region contains the smallest proportion of the basin’s population at roughly 2% to 3%. All regions grew over each of the time periods examined, with the exception of the Cariboo-Chilcotin Region, which experienced a slight decline from 2002 to 2003. The growth trends all appear to be declining, measured by the average annual change columns in table 2.6, as well, except for the Fraser Valley and Upper Fraser Regions. These trends appear to be slightly increasing. Overall, the Fraser Basin contains about 68% of the B.C.’s total population.
3.7.2. Employment and Unemployment
Table 2.7 presents regional employment by industry. Again, these statistics have been compiled from the corresponding regional districts (see table 2.2) as provided by B.C. Stats. Similar to population levels, the basin contains about 68% of the total work force. As expected, the highly urbanized Greater Vancouver-Squamish-Pemberton Region has the largest share of the work force at 78%, while the more rural Cariboo-Chilcotin Region has about 2.5% of the work force within the basin. While all regions have similar levels of government service employment, an urban-rural divide can be seen in the levels of primary industries and non-government service industries. Regions with greater urban areas have more non-government service employment, while rural regions have greater levels of employment in the primary industries. Moreover, manufacturing industries employment appears to be more highly concentrated in rural areas. This likely results from the fact that sawmills and pulp mills are classified as manufacturing industries, and these mills are a primary employer in rural regions.
Table 2.8 presents regional participation, employment and unemployment rates for various age groups. Again, these statistics have been compiled from the corresponding regional districts (see table 2.2) as provided by B.C. Stats. All regions, over all age groups, have similar participation and employment rates, which are in turn comparable to the corresponding provincial averages. The rural-urban divide can again be observed by comparing the regional unemployment rates for each age group. Consistently, the highly urbanized Greater Vancouver-Squamish-Pemberton Region has the lowest rate of unemployment, while the more rural Cariboo-Chilcotin Region has the highest rate of unemployment. This contrast of unemployment rates likely reflects the more diversified economy offered by urbanized areas, which, on average, provide more opportunities.

-53-
3.7.3. Aboriginal Groups
For thousands of years the Fraser Basin has been home to Aboriginal peoples including Hun'qumi'num, Okanagan, Secwepemc, Tsilhqot'in, Carrier, Nlakapmx, St'at'imc and Halq'emeylem speaking people. Some 50,000 indigenous people currently live in the basin.
The Fraser Basin is inhabited by indigenous people speaking eight separate, mutually unintelligible languages belonging to two great language families (fig. 2.7). The FBC is the only organization in British Columbia whose board of directors includes representation from all eight Aboriginal language groups in the basin: Dakelh (Carrier); Ts’ilhqot’in (Chilcotin)’ Secwepemc (Shuswap); Stl’at’imc (Lillooet); Nlaka’pamux (Thompson); Okanagan (Okanogan); Hal’q’emeylem (Stolo); and Hunqumi’num (Lower Fraser First Nations).

-54-
Table 2.6: Populations And Trends For Fraser Basin Regions
REGIONAL DISTRICT
POPULATION 2003
POPULATION 2002
POPULATION 1998
POPULATION 1993
ANNUAL AVERAGE CHANGE
2002-2003 (%)
ANNUAL AVERAGE CHANGE
1998-2003 (%)
ANNUAL AVERAGE CHANGE
1993-2003 (%)
Greater Vancouver-Squamish-Pemberton 2,161,988 2,138,030 2,018,879 1,772,819 1.1 1.4 2.2
Fraser Valley 256,464 252,475 238,380 207,876 1.6 1.5 2.3 Thompson 175,052 175,168 175,509 157,100 -0.1 -0.1 1.1 Cariboo-Chilcotin 67,677 68,087 70,529 64,073 -0.6 -0.8 0.6 Upper Fraser 141,408 141,218 146,366 137,122 0.1 -0.7 0.3 Total 2,802,589 2,774,978 2,649,663 2,338,990 1.0 1.2 2.0 British Columbia 4,146,580 4,114,981 3,983,077 3,567,406 0.8 0.8 1.6
Source: B.C. Stats online data www.bcstats.gov.bc.ca/data/sep/rd/rd_main.htm; accessed 15 April 2004
Table 2.7: Labor Force Employment By Industry In The Fraser Basin
FRASER BASIN REGION
TOTAL LABOR FORCE
PRIMARY INDUSTRIES(% of Labor
Force)
MANUFACTURING INDUSTRIES
(% of Labor Force)
CONSTRUCTION INDUSTRIES
(% of Labor Force)
NON-GOVERNMENT SERVICE
INDUSTRIES (% of Labor Force)
GOVERNMENT SERVICE
INDUSTRIES (% of Labor
Force) Greater Vancouver-Squamish-Pemberton 1,070,115 1.6 9.3 5.2 79.6 4.3
Fraser Valley 115,655 9.1 11.4 7.4 66.1 5.9 Thompson 84,960 8.7 9.6 6.9 69.3 5.5 Cariboo-Chilcotin 34,375 14.4 16.0 6.0 58.2 5.4 Upper Fraser 73,765 10.1 15.3 5.5 63.1 6.1 Total 1,378,870 3.4 10.0 5.5 76.4 4.7 British Columbia 2,014,605 4.6 9.6 5.9 74.3 5.6
Source: B.C. Stats online data www.bcstats.gov.bc.ca/data/sep/rd/rd_main.htm; accessed 15 April 2004

-55-
Table 2.8: Regional Participation, Employment And Unemployment Rates For Various Age Groups Within The Fraser Basin
POPULATION 15 YEARS AND OVER POPULATION 15-24 YEARS
POPULATION 25 YEARS AND OVER FRASER BASIN REGION
PR1 (%) ER2 (%) UR3 (%) PR (%) ER (%) UR (%) PR (%) ER (%) UR (%) Greater Vancouver-Squamish-Pemberton 66.4 61.6 7.3 59.5 51.3 13.8 67.7 63.6 6.1 Fraser Valley 65.0 59.4 8.6 67.5 57.3 15.1 64.4 59.8 7.1 Thompson 64.5 57.2 11.3 64.1 52.3 18.4 64.6 58.1 10.0 Cariboo-Chilcotin 68.2 58.4 14.3 61.9 47.3 23.6 69.5 60.8 12.6 Upper Fraser 71.8 63.5 13.7 64.1 52.1 18.7 73.7 66.2 10.1 Total 66.4 61.1 8.0 60.8 51.9 14.8 67.6 63.0 6.8 British Columbia 65.2 59.6 8.5 61.9 52.1 15.8 65.8 61.1 7.2
Source: B.C. Stats online data www.bcstats.gov.bc.ca/data/sep/rd/rd_main.htm; accessed 15 April 2004 1. PR = Participation rate. The proportion of the total labor force to total population. 2. ER = Employment rate. The proportion of the total employed to total population. 3. UR = Unemployment rate. The proportion of the total unemployed to the total labor force.

-56-
Within the basin, two distinctive cultural forms can be distinguished: the northwest coast cultural forms on the lower part of the river and adjoining sea coast, and plateau cultural forms in the middle and upper parts of the basin (Kew and Griggs 1991). This diversity suggests that, to a great degree, and with the notable exception of occasional trade and barter or raids, each language group remained independent of its neighbors and was largely self-contained and self-sufficient within its traditional territories. In the downstream part of the system are four Salishan languages, while the two in upstream portions are Athapaskan, sometimes referred to as Dene.
Figure 2.7: Sketch Map Showing The Distribution And Extent Of The Eight Aboriginal Language Groups In The Fraser Basin
3.7.4. Halkomelem (Salishan)
Halkomelem is the language spoken along the Fraser and its lower tributaries from Yale to the sea. It is also the language of the adjacent portion of Vancouver Island and northern Gulf Islands from Nanoose Bay to Mill Bay on Saanich Inlet (Kew and Griggs 1991). Within this region, there are different dialects of Halkomelem, and of the eight
Source: Kew and Griggs 1991: 22
SHUSWAP

-57-
languages in the basin, the territory of these speakers extends further from the boundaries of the watershed than any other. Association of the Vancouver Island Halkomelem villages, such as Nanaimo and Cowichan, with the Fraser River was maintained, however, for these Vancouver Island people too, in the early 19th century, had summer habitat sites in the Fraser Delta and fished its waters for salmon (Duff 1952). In some degree, all Halkomelem speakers share access to the great salmon runs of the Fraser River.
3.7.5. Nlaka'pamux or Thompson (Salishan)
Nlaka'pamux is spoken by people whose main villages are in the Fraser Canyon, lower Thompson River and Nicola River (Kew and Griggs 1991). Their territory includes mountainous areas in the Coast Range over to the Similkameen headwaters on the Columbia River system, an area of seasonal gathering and hunting. Their territory is mainly, but not exclusively, within the Fraser Basin watershed.
3.7.6. Lillooet, also Li'lwet, or Stl'atl'imx, (Salishan)
Lillooet is spoken by people who have their villages on the Fraser near the town of Lillooet, on the Bridge and Seton Rivers, and further west on the Lillooet River, from the vicinity of Mount Currie downstream to, and including part of, Harrison Lake, where their territory joins that of the Halkomelem speakers (Kew and Griggs 1991). Lillooet territory lies within the Fraser watershed and, like Nlaka'pamux territory, is a land with deep river gorges, steep hillsides and varied biotic communities as one ascends from the river banks to alpine zones.
3.7.7. Shuswap (Salishan)
Shuswap is spoken by the people on both sides of the Fraser from the Lillooet territory upstream to Soda Creek Canyon, in the whole of the upper Thompson River and Shuswap Lakes watersheds, and over the intervening high wooded plateau between the two great river valleys (Kew and Griggs 1991). It includes the upper part of the Quesnel River system with the lake of that name and the great sockeye-bearing Horsefly River. It lies within the boundaries of the Fraser watershed, except for a small portion of the Rocky Mountain trench extending into the upper Columbia drainage.
3.7.8. Chilcotin (Athapaskan)
Chilcotin is spoken by the people of the Chilcotin River system. In fact, their name means literally 'people of the Chilco River' (their name for the Chilcotin of modern maps). Except for a part of the Dean River above the high falls, which were impassable to

-58-
salmon, and some of the similar upper tributaries of other coastal streams, Chilcotin territory was entirely within the Fraser system (Kew and Griggs 1991).
3.7.9. Carrier (Athapaskan)
Carrier is spoken by the people occupying the remaining portions of the upper Fraser watershed from Alexandria upstream. There is a marked division of this group, partly in dialect but more so in social organization. The Southern or Lower Carrier consists of people downstream from the Nechako confluence, including the other tributary basins as far as the Shuswap territory (Kew and Griggs 1991). It also includes the Algatcho who occupy part of the Blackwater and the upper Dean River, including the salmon fishing station below the aforementioned falls. The entire southern Carrier except the Algatcho live within the Fraser Basin. Their kinship system is one with bilineal descent like their neighbors the Chilcotin and the Shuswap. Central Carrier on the other hand has a system of matrilineal descent. Their territory includes a major part of the Nechako drainage and the upper Fraser itself. A separate language from this, sometimes referred to as Western Carrier, is spoken by both the Natao'ten of Babine Lake and the Wet'suwet'en of the Bulkley River system (Kew and Griggs 1991). Their territories lie predominantly within the Skeena River watershed, although the Wet'suwet'en, occupy part of the upper, westernmost tributaries of the Nechako.

-59-
4. MANAGEMENT OF THE FRASER RIVER BASIN
Over the past century, the Fraser River has been degraded by a wide variety of pollutants including toxic chemicals from sawmills, pulp and paper production, mining and other industries, municipal sewage, agricultural wastes and, increasingly, urban run-off. During the 1980s, the increasing pace of industrial activities, coupled with rapid urbanization and over-fishing throughout the Fraser Basin, were raising environmental alarm bells. It was becoming clear to governments and the general public that the overall health of the river was in jeopardy. Although the situation seemed bleak at the time, environmental management agencies believed that the watershed could still recover if the proper steps were taken. Figure 3.1 outlines various management activities along the Fraser River.
Figure 3.1: Time Line For Various Fraser River Management Actions
Year 1977 84 85 90 91 92 97 98 04
Fraser River Estuary Study Fraser River Estuary Management Program
Fraser River Basin
Start-upCommittee
Fraser Basin Management
Program Fraser Basin
Council
Fraser River Action Plan
The encounter that crystallized concern over the health of the Fraser River and the basin it drains took place more than fourteen years ago. Gordon Campbell, then Mayor of Vancouver, and John Backhouse, then Mayor of Prince George, challenged each other to “clean up their parts of the (Fraser) River” (Campagnolo 2001). The joint challenge was

-60-
itself recognition that making progress towards sustainability for the whole Fraser River Basin would require a collaborative effort all along the river and across all jurisdictions.
Out of this challenge arose the Fraser Cities Coalition of some 35 basin-based cities and communities that formed the Fraser River Basin Start-up Committee (Campagnolo 2001). The committee was charged with bringing an expressed need for a sustainable basin management plan to fruition. Funds were accessed from the 1992 federal Green Plan and added to provincial and local government funding to create the mainly governmental five-year Fraser Basin Management Program (FBMP). This program, mainly through its associated board and with much public involvement, developed an innovative public-private partnership dedicated to achieving a sustainable future for the Fraser River Basin.
In 1990, the Government of Canada identified the Fraser River Basin as a major freshwater system requiring priority action. As part of Canada's Green Plan, the Fraser River Action Plan (FRAP) was established. Jointly sponsored by Environment Canada (EC) and the Department of Fisheries and Oceans (DFO), FRAP was modeled on the successful Fraser River Estuary Management Program (FREMP) that focused on improving inter-agency cooperation on estuary management. FRAP set targets for restoring the environmental health of the watershed. The program focused on ecosystems within the entire watershed, encouraged collective stewardship and cooperative partnerships, and involved the public so that British Columbians could better understand how their actions could harm or improve watershed health.
Established in 1992, under the auspices of federal, provincial, and local governments, the FBMP built on the work of FRAP by bringing together all four orders of Canadian government (federal, provincial, municipal, and First Nations) with the private sector and civil society to address key river management issues identified by FRAP. The FBMP also developed a strategic plan for the sustainability of the entire Fraser River Basin, which became the Charter for Sustainability. In 1997, the Fraser Basin Council (FBC) succeeded the FBMP. The mandate of the FBC is to bring people together to solve complex, multijurisdictional issues in the Fraser Basin, to take advantage of opportunities, and to strengthen the capacity of institutions and individuals to deal with emerging issues that threaten the overall sustainability of the basin. Thus, the evolution of management efforts for the Fraser River Basin may be thought of as a journey from top down management towards fully inclusive, collaborative planning and decision-making processes characterized as a pre-decentralization period to 1992, a decentralization process from 1992 to 1997, and a post-decentralization period from 1997 onwards.
-61-
5. PRE-DECENTRALIZATION PERIOD TO 1992
5.1 FRASER RIVER ESTUARY MANAGEMENT PROGRAMME (FREMP)
FREMP has been described as Canada's most successful coastal management program (Dorcey 1990), and also as a “working model of an environment-economy partnership” as espoused by The World Commission on Environment Development (McPhee 1989). Concerned with a good deal more than salmon, FREMP comprises analytical and regulatory efforts to protect fish as well as wildlife habitat through an explicit process of multi-agency, multi-government planning. Thus, it represents a clear attempt to forge consensus on issues central to sustainable development.
FREMP began in the late 1970's, an era of ambitious comprehensive planning schemes. Coastal zone management had joined river basin planning as a major preoccupation of both government and non-government organizations that advocated a break from narrow, compartmentalized resource management. They literally met in the Fraser estuary. The deterioration of water quality and the increasing incidence of multiple use conflict (Dale 1991) fixed public attention on this, the most heavily populated and industrialized estuarine region along Canada's west coast.
In 1977, the Fraser River Estuary Study began under a federal-provincial agreement. The initial purpose was to prepare a comprehensive plan for a 1,000-metre strip along the shores from the river's mouth up to the head of tide near the Pitt River. During the first eighteen month phase, background physical and land use studies as well as concepts for a future management entity were assessed. This work was completed by a Federal-Provincial Steering Committee that provided an early opportunity for partial multi-agency consensus building (Dorcey 1990).
In Phase II, which lasted for three years, the steering committee was enlarged and became the Fraser River Estuary Planning Committee. In its 1982 final report, the committee outlined the options for managing the estuary in terms of institutional structures, coordinating mechanisms and planning tools. After a lengthy review period, an agreement was signed for the establishment of the Fraser River Estuary Management Program.
From its earliest days as the Fraser River Estuary Study, the paramount challenge facing this program has been the existence of a multiplicity of government agencies, as well as other stakeholders with an interest in resource decision making. This multiplicity is

-62-
reflected in FREMP's Management Committee with its five agency executive4 and 27 members at large, including other federal and provincial agencies, regional and municipal governments and several First Nations.
Protection and enhancement of salmon stocks and associated habitat were among the leading public concerns motivating the creation of FREMP, and with DFO as a signatory to the formative agreement, such concerns remain high in program activities. Single agencies continue to look after their own mandate whether that be DFO's for fish stocks or the Harbour Commissions' for port management: FREMP plays a role only where the regulated activities begin to affect one another.
FREMP used several mechanisms to achieve consensus-based decisions, such as: The Coordinated Project Review Process – essentially a multi-agency sharing of
information and an orderly circulation of detailed applications for making joint decisions on projects within FREMP's boundaries;
An evolving system of Area Designations whereby optimal use(s) of each coastal sub-area is negotiated by member agencies on the basis of full sharing of resource use information;
Activity Work Groups which meet to consider both specific current issues and to develop profiles of their focal activity (e.g., Port and Industrial Development Work Group, Log Management Work Group); and
Development of detailed environmental management plans for major subsystems of the estuary (e.g., North Fraser Harbour Environmental Management Plan).
DFO's Habitat Division is a leading agency in all of the above mechanisms due to the authority granted it by the federal Fisheries Act. Such authority provides DFO tremendous influence over estuary activities, even in the absence of such an entity as FREMP. DFO's participation in FREMP provides an excellent opportunity for developing shared understanding and building the consensus that is so vital to sustainable development. Outside of a setting like FREMP, DFO's defense of fish habitat is likely to be confrontational (i.e., the regulator pitted directly against the developer) and narrow in purpose. Moreover, without the kind of guidance furnished through Area Designations, each case would be regulated with little regard for how the habitat at a specific location relates to the larger ecosystem.
The North Fraser Harbour Environmental Management Plan provides a clarifying example of the way in which FREMP complements DFO's salmon habitat mandate. This Plan, co-signed by the chairman of the North Fraser Harbour Commission and the minister of Fisheries and Oceans, details a new relationship between the agency with
4 The five agencies that were co-signatories of the FREMP Agreement include: B.C. Ministry of the Environment (now Ministry of Water, Land, and Air Protection), Environment Canada, Fisheries & Oceans Canada, the North Fraser Harbour Commission and the Fraser River Harbour Commission.

-63-
development responsibilities for the North Fraser and the most powerful and omnipresent regulatory agency, DFO. Several key features from this Plan that exemplify this new developer/regulator relationship are:
Agreement to determine the broad acceptability of future activities on the basis of a continually refined habitat inventory and classification;
Incorporation of a single agency's policy (i.e., DFO's “no net loss” habitat policy) in a bilateral inter-agency agreement;
Creation of a habitat compensation bank within the agreement area, administered by the Harbour Commission to provide compensatory habitat where development leads to unavoidable habitat loss; and,
Commitment to a multifaceted “cooperative management program” aimed at strengthening the working relationship between the commission and DFO.
From one perspective, DFO voluntarily fettered the legitimate pursuit of its mandate with a formal and explicit recognition of the Harbour Commission's legitimate interests in the Fraser estuary. Yet, this fettering is done in a planning context not as an ad hoc reaction in the midst of political controversy. In comparison to other interactions in the Fraser Basin, DFO has been accused of having compromised its responsibilities. In the case of Alcan's proposed Kemano Completion Project, the proponent of a major water diversion from the Nechako (a Fraser tributary) to the Kemano River took DFO to court. Its arguments were that early contracts gave Alcan rights to such water for hydroelectric development. In the long shadow of the court, negotiations took place whereby DFO sanctioned the project. Local environmental groups and some DFO staff felt that this agreement impinged on DFO’s legislated mandate to protect fish habitat (Dale 1991).
FREMP, then, provides one model of how consensus and a more cooperative spirit can be approached in the context of sustainable development. The program is not without critics, especially environmental groups that argue it lacks the necessary dedication to preservation and environmental quality enhancement (Dorcey 1990). Moreover, FREMP does not foster direct involvement in decision making by public interest groups and is therefore criticized for being too insular; public participation has been multifaceted but not at all empowering. On the other hand, FREMP has moved to enhance the role of local governments, particularly in its efforts to facilitate the negotiation of “statements of intent,” whereby municipalities would be centrally involved in the Area Designation system. Furthermore, several non-government organizations are also involved in the Activity Work Groups.
5.2 CANADA’S GREEN PLAN
The Green Plan was introduced during a period of intense interest in the environment in Canada. The growing strength of environmental organizations, the success of the

-64-
Bundled Commission’s report, Our Common Future, and the emergence of Canadian business interests and funding for environmental initiatives shaped this interest. Not only had public opinion changed over the course of the 1980s, but also the concept of sustainable development provided a new discourse in which business, government, and non-government organizations could participate with some degree of enthusiasm. The Green Plan was formally announced by the Canadian government on 11 December 1990. It was intended to be a five-year, $3-billion comprehensive environmental action plan to guide federal environmental policy. A key objective of the Plan's designers was to change the machinery of government concerning environment and sustainability issues.
While it is often difficult to trace the origin of ideas in public policy, the Green Plan appears to be the product of three converging agendas (Gale 1997). First, the environmental community provided the government with both a message and an agenda. There was a large increase in the membership of environmental organizations in the late 1980s. Many now worked together to lobby government for action on environmental and resource management issues. In 1988, some groups joined forces under the aegis of the Green print for Canada Committee to prepare their own environmental action plan for Canada, the Green print for Canada. This document, or at the very least the committee's idea, was to have some considerable influence on the newly elected Minister of the Environment, Lucien Bouchard (Gale 1997).
Second, following the 1988 election Mr. Bouchard was establishing a legislative docket. It appears that the idea of a national environmental strategy, presented to him by the Green print for Canada Committee, caught his attention. However, as a novice in Cabinet, he needed a higher profile than afforded by the then low-profile Environment Ministry (Gale 1997). To enhance his status in Cabinet, Mr. Bouchard was added to two committees of the important inner circle of Cabinet members: the Priorities and Planning Committee and the Operations Committee. He also was placed in charge of a new coordinating committee, the Cabinet Committee on Environment. It appears that the origins of Canada’s Green Plan may be closely allied with Mr. Bouchard’s rising influence within Cabinet. The environment minister also had the prime minister's unequivocal support, a situation that greatly aided the eventual launch of the Green Plan. Thus, at the political level the fruition of the Green Plan is attributed to Mr. Bouchard (Gale 1997).
Third, EC, equipped with the mission of sustainable development, had a way of leveraging influence in the bureaucracy. The department was eager to enhance its role in decisions about the environment and economy with initiatives of its own (Gale 1997). At the international level, the 1980 IUCN World Conservation Strategy provided sections of the department with compelling arguments for conservation and protection. The

-65-
department later produced its own report on the conservation challenge for Canada (Pollard and McKechnie 1986). At the domestic level, some key personnel in the department embraced the 1977 Science Council of Canada's report, Canada as a Conserver Society: Resource Uncertainties and the Need for New Technologies, which substantially predates the Bundled Commission. It provided important precursory information for the Green Plan by developing the constituency for environment and economic integration so prominently emphasized in Our Common Future.
More than 100 initiatives were contained in Canada's Green Plan for a Healthy Environment. Eight broad categories were identified, each with different programs, goals, and initiatives (Government of Canada 1990). Funding for each category was earmarked as follows:
Clean water, land, and air: emissions and effluents, and solid and hazardous waste ($850 million).
Renewable resources: forests, fisheries, and soil quality ($350 million). Unique spaces and species: national parks, protected areas, and biodiversity ($175
million). The Arctic: management and protection of the Arctic ($100 million). Global environmental security: global warming, ozone-layer protection,
transboundary pollution, and international aid ($575 million). Environmentally responsible decision making: research, public education, funding of
environmental groups, and national accounting for environmental quality ($500 million).
Federal environmental stewardship: committed the government to a Code of Environmental Stewardship, environmental auditing, and environmental impact assessments ($275 million).
Emergency preparedness: response to natural and human-made emergencies, such as toxic releases and oil spills ($175 million).
The department's 174-page publication Canada's Green Plan described each initiative in greater detail (Government of Canada 1990). Some of the major undertakings included (Gale 1997):
Virtual elimination of the discharge of persistent toxic substances into the environment, Canada-wide reduction of the concentration of ground-level ozone (smog) to below the
threshold of health effects in the most susceptible segments of the population, A 50% reduction in Canada's generation of waste by 2000, The shifting of forest management from sustained yield to sustainable development, The setting aside of 12% of the country as protected space, Completion of the national parks system by 2000, Stabilization of carbon dioxide and other greenhouse gas emissions at 1990 levels by
2000, Phasing-out CFCs by 1997, and methyl chloroform and other major ozone-depleting
substances by 2000, and A 50% reduction of sulphur dioxide emissions in eastern Canada by 1994, capping of
acid-rain-related emissions in eastern Canada beyond 1994, and extension of the acid rain control program to emissions in western Canada.

-66-
5.3 FRASER RIVER ACTION PLAN
In an attempt to address the deterioration of the Fraser River and its salmon stocks, the Government of Canada initiated the Fraser River Action Plan (FRAP) in June 1991. FRAP was conceived as a six-year, $100 million Green Plan initiative to be undertaken jointly by EC and the Department of Fisheries and Oceans (DFO), each of which was to administer half of the program’s funding (Canada 1998). EC’s attention was directed towards the contamination issue and enhancement of wildlife habitat, especially for migratory waterfowl, while DFO focused on salmon habitat and management. Both departments worked together on the cooperative management plan through their participation and support for the 19-member Fraser Basin Management Board, which included membership from the federal, provincial, and local governments; as well as other stakeholders.
FRAP was originally developed with three distinct components: building partnerships with all levels of government, industry, communities, and Aboriginal groups in the basin, cleaning up and preventing basin pollution, and restoring the productivity of the natural environment (Canada 1998).
5.3.1. Building Partnerships
A major objective of FRAP was to change the way activities that affected fish and fish habitat in the Fraser River watershed were managed and regulated by building more effective partnerships. This partnership component was undertaken to foster a more coordinated approach to environmental management in the Fraser River Basin; but rather than attempt to duplicate existing provincial planning processes, DFO-FRAP undertook to ensure that fisheries concerns were presented in the context of the provincial initiatives.
Overall, although basinwide sustainability remains far from being achieved, FRAP can be seen as having supported progress toward this goal. Projects were initiated through FRAP which have proved, in a local sense at least, that it is possible for agencies and stakeholders to cooperate in the sustainable management of watersheds.
5.3.2. Cleaning Up Pollution
This component of FRAP was primarily the responsibility of Environment Canada. DFO's main function here was to ensure that the EC’s water quality projects took into account fisheries concerns.

-67-
Currently, the Fraser River may be characterized as being only slightly cleaner than it was before FRAP (Canada 1998). However, given the magnitude of the pollution problem in the Fraser Basin, which in the late 1980s had the fastest population growth in Canada, it was perhaps unrealistic to believe that a program of FRAP’s size could significantly improve the situation. Nonetheless, it should be noted that, since FRAP's inception, a much clearer picture of the extent, sources, and potential mitigation of Fraser River pollution has been formed. Water quality monitoring projects undertaken by DFO in partnership with EC have yielded important baseline information concerning contaminant levels in the Fraser River and its biota. DFO Science Sector projects concerning the impact of contaminants on salmon have been particularly successful in identifying sub-lethal effects of pollution.
5.3.3. Restoring the Productivity of the Natural Environment
This component of FRAP was directed at providing an improved understanding of the productive and carrying capacity of the river, as well as promoting a more coordinated approach to habitat management. Research projects conducted under this FRAP component focused on developing a better understanding of the interface between habitats and stocks, especially the productivity of habitats with respect to fish.
Not surprisingly, FRAP did not succeed in achieving its originally stated goal of restoring salmon populations in the basin to historic levels (Canada 1998). It was noted in early FRAP documents that this could take as long as 20 years. This goal was unrealistic, as the degradation of the productive capacity of the Fraser Basin is only one of several factors contributing to the decline of the river’s salmon stocks. Important determinants of salmon populations such as fishing pressures and variation in ocean survival were not addressed by FRAP’s restoration programs. Even if FRAP’s goal had been limited to reversing the trend of ongoing habitat degradation in the Fraser Basin, the activities undertaken were simply too limited in scope to address the large-scale changes being brought about by development in the basin. Funding cutbacks in FRAP’s habitat restoration and enhancement program contributed greatly to the program’s inability to reach its goal (Canada 1998). On the other hand, through FRAP, habitat-mapping and science studies were undertaken which would not have otherwise been carried out. The legacy of these studies is a greater understanding of how the river ecosystem functions, particularly with regard to factors that affect its salmon.

-68-
6. DECENTRALIZATION PROCESS FROM 1992 TO 1997
6.1 FRASER BASIN MANAGEMENT BOARD (FBMB)
In developing its Green Plan, the federal government had concluded that building partnerships would be critical to its success. However, both EC and DFO had developed their own plans for FRAP, with severe restrictions placed on discussion of these plans outside of their organizations before they were announced (Tellus Institute In press). EC and DFO intended to remedy this situation by building partnerships through a collaborative process, thus funding from the Green Plan was combined with funds provided from the provincial and local governments to create FBMP.
An agreement was reached on 26 May 1992 to initiate FBMP, to be led by a multi-governmental and non-governmental, multi-interest committee, called the Fraser Basin Management Board. This board was required to make decisions by consensus and to encourage consensus-based decision making in all basin activities, as well as to facilitate the development of locally based decision-making processes.
No formal basinwide organization existed prior to the FBMB. The board was given five years to accomplish its goal. At the end of the five years in 1997, a new institution was established—the Fraser Basin Council (discussed in the next section). The FBMP and its board set a path, with much public involvement, toward a very different kind of collaborative governance structure dedicated to advancing sustainability of the Fraser Basin.
In its first phase during its second year (1993), the Fraser Basin Management Board adopted a set of sustainability principles to guide implementation of its mandate. The role of the FBMB was to:
Influence federal, provincial and local governments to ensure the fundamental needs and values of the people of the Fraser Basin, present and future, are met while recognizing the basin's ecological constraints;
Incorporate and support First Nations in a manner that is consistent with the existence of their Aboriginal rights and title;
Ensure renewable and nonrenewable resources are conserved and prudently managed; Foster equal and fair access to information and decision-making processes to reflect all
citizens' needs and aspirations for ecological, community and cultural diversity; Ensure that integrated and innovative approaches occur throughout the full range of
planning levels in the basin by coordinating the collection, analysis and sharing of data and information; and
Recognize the need for adaptive and precautionary decision making (e.g., Tellus Institute In press).

-69-
These principles were translated into a set of five goals for the overall Fraser Basin Management Program. Five strategic programs, each with action plans, were laid out, all designed to contribute to the production of a “Strategy for Sustainability” for the basin by the end of the first five-year Agreement in 1997. The five strategic programs focused on: (1) basin management strategies for priority issues, (2) demonstration projects, (3) institutional development, (4) auditing sustainability, and (5) information, communications and education. These programs and their action plans are discussed below under implementation activities.
Establishing a multistakeholder consensus process proved to be quite difficult. The first issue concerned the process to select board members. Once selected, members then had to learn to recognize other perspectives of both the basin and the Agreement. The consensus process was also new to most members of the board, and initially appeared to be slow and tedious. In addition, the board members represented larger constituencies who also needed to believe that they were a part of the decision-making process. As well, communication to the larger public was essential.
6.2 SELECTION OF BOARD MEMBERS
The 19 member board consisted of an appointed “neutral” chair, three representatives of each of the four orders of government (federal, provincial, local and First Nations) and six non-governmental representatives from economic, environmental and social interests in the basin. The process to select board members varied between each of the representative groups:
The federal and provincial governments each selected three senior public servants from relevant governmental agencies.
Local municipalities and regional districts grouped their communities into three areas of the basin (upper, middle and lower) and each group carried out a nomination and election process to fill the three local government seats on the board.
The three First Nations positions on the board were also filled by representatives from among the eight Nations in the upper, middle and lower regions of the basin.
The remaining six positions were filled through a process facilitated by the chair. Nominations were sought by advertising throughout the basin. The criteria for selection were made explicit via public announcements (e.g., knowledgeable about sustainability and willing to commit to consensus processes). Over a hundred nominations were received, reviewed in terms of the criteria, and then forwarded to all signatory governments who eventually reached a consensus on the six appointees. This task was not easy given a federal Progressive Conservative government in Ottawa, a provincial New Democratic Party government in Victoria, and a diversity of political interests among the local governments.
For the most part, the selection processes for the various positions on the board worked quite well and produced a diverse membership that was generally acceptable to basin

-70-
stakeholders. Nevertheless, two significant difficulties arose. First, the environmental interests represented by members of the B.C. Environmental Network (BCEN) believed that they, just as the governments, should have three seats on the board and, indeed, believed that they had obtained a commitment for this from the federal organizers of the program. Although several of the non-governmental individuals appointed to the board did represent environmental interests, the BCEN considered this an inadequate alternative. It took more than a year and a great deal of effort to restore good working relations with members of the BCEN and to obtain their participation on the Board's multistakeholder committees. The problem was not completely resolved until one of the BCEN's members became a board member when a vacancy arose in the third year of the Agreement.
The second difficulty related to selection of the First Nations members of the board. Subsequent to the drafting of the Agreement but before its signing, the federal and provincial governments decided that First Nations should also have three seats on the board. This was done to be consistent with these two governments' emerging recognition of First Nations as a fourth order of government. However, the First Nations had not been signatories to the Agreement. Since there was no organization that represented all the eight Nations whose territories included parts of the basin, there was no readily available mechanism for selecting their three members. After extensive discussions with the chair throughout the summer of 1992, three members of First Nations agreed to join the board at its inaugural meeting and to serve until they could complete their own internal selection processes. This agreement temporarily resolved the difficulties that had arisen from First Nations and ensured their participation from the outset of the board's activities.
The difficulties that arose with the representation of environmental interests and First Nations, while not unusual in such processes, illustrate how failure to ensure appropriate representation of stakeholders at the beginning of collaborations can cause substantial difficulties later on. The absence of these two major interests in the Fraser Basin would have seriously undermined the effectiveness of the board.
6.3 DIVERSITY OF VIEWS OF BOARD MEMBERS
A potential strength of the board was the diversity of knowledge and experience of the members about the basin, its governance processes, and management issues. At the outset, however, major challenges arose in exploiting this diversity. While the civil servants were familiar with the administrative processes of government, this was not the case for many of the non-governmental members. Although individuals knew parts of the basin where they had lived and worked, few members were well acquainted with the

-71-
basin in its entirety. Each of the non-Aboriginal members had a great deal to learn about the First Nations in the basin. While some board members had expertise in environmental issues, the comparative advantage of others was in economic or social issues. The lack of common knowledge and differing perspectives made communications very challenging in the early discussions. The potential strength in the members' diversity only gradually began to be harnessed as people began to know each other. In facing these difficulties, the board was no different than most other multistakeholder processes, except in the remarkable diversity of its members, and the breadth and complexity of the task it faced.
6.4 UNDERSTANDING OF AND COMMITMENT TO THE AGREEMENT
From the inaugural meeting of the board, it soon became evident that there were widely varying interpretations about what the board was required and authorized to do. The Agreement document was lengthy, contradictory in some important issues and silent in others. The questions raised were wide ranging and fundamental, and included: Should the sustainability focus be on environmental issues rather than economic and social ones? Shouldn't the focus be on the water and not all the land issues? Was the board to provide leadership or only coordinate? What was the difference between the board and the program?
Through the early meetings, the board members struggled to reach agreement on the concepts and language that ultimately resulted in the statements of vision, mandate and goals in the Strategic Plan in 1993. In the process, not only did the differing interests of the board members become clearer, but it also became evident that they had come to the initiative with varying ideas about what it was intended to do, how it would operate and what it might deliver. For the federal government members, the board was the essential mechanism for building the partnerships (in particular for getting cooperation from the provincial and local governments and involving large numbers of stakeholders) that were going to be crucial in delivering on their ambitious goals for the FRAP. For the provincial government, it was an opportunity to influence where and how the $100 million in the federal FRAP would be spent. For the local governments, there were hopes of obtaining funds through the board to meet their own growing costs for building water supply and sewage treatment systems. For the First Nations, the board was an opportunity to be recognized as one of four orders of government and bring forward their claims and, in particular, their immediate concerns about fishery allocations. Finally, in their varied interests, the non-governmental members were looking for new ways to influence the governments and hold them more accountable.

-72-
6.5 LEARNING THE CONSENSUS PROCESS
In the early meetings, the explicit use of consensus processes was a relatively new experience for most of the board members. For those who were accustomed to imposing decisions by virtue of their positions and authority or by quickly calling for a vote, the process initially seemed to be time consuming and inefficient. As time went on, however, most members came to recognize the strengths of the consensus process, and to use the process more efficiently. This acceptance was hastened by the experience of successfully dealing with a major challenge that arose at the board's second meeting. It took the better part of an intense day of discussions to reach agreement on the wording of one sentence and thereby avoid the First Nations members threat to vacate the board: “The board recognizes four orders of government sitting at this table.” This was wording that all members of the board could live with and this early success in averting a major setback by using the consensus process gave the new decision-making approach some credibility and the board members a boost of confidence.
A second major step forward occurred in 1993 when the board had to make its first decision about taking a public position on an issue related to one of the participating governments' activities. The occasion was the opening of hearings to be conducted by the B.C. Utilities Commission into Alcan's Kemano Completion Project. The issue was politically very controversial and there were extremely strong and differing views among the board members. A task force of the members was formed and a consensus was gradually reached on the position to be taken. From these early successes, the board's use of consensus processes continued to progress. The board never found it necessary to develop and adopt formal consensus procedures, in contrast to many other multistakeholder processes (e.g., B.C. Round Table). While this could have been seen as a result of the good working relations that had evolved amongst the board members, it would also be viewed as a reflection of the relatively weak commitments being made at the board table (i.e., in situations where there were differing interests, unless members are being pressed to make substantial commitments for which the board will then hold them accountable, there are not going to be significant stresses and strains on the consensus process).
6.6 THE USE OF MULTISTAKEHOLDER PROCESSES
A key component of the board's strategy was the use of multistakeholder processes to fulfill its mandate. At an early stage, it became evident that there was much to be gained in moving towards sustainability by requiring that the diversity of stakeholders represented on the board also be reflected in appropriate ways in each of its collaborative

-73-
initiatives. For example, diverse stakeholders were included in each of its steering committees, task forces and demonstration projects. In meetings throughout the communities of the basin, the power of this approach was revealed as individuals and organizations discovered others that were working toward similar ends, when previously they had not known about each other’s efforts. At a time when resources of all kinds were coming under increasing demands, such a happenstance lead to the identification of ways to collaborate and thus use limited resources more productively. Convening, facilitating and spinning off these collaborative processes were one of the board's most profound influences.
At the outset, the board together with its staff faced a huge challenge not only in developing its own understanding of what it had been mandated to do but also in building support for its mandate among all the stakeholders. All things considered, the board and its staff were remarkably successful in avoiding a major disaster and slowly began to build understanding and support. Little things gradually made a difference; for example, the board members going into the communities early, making clear that they were there to listen and learn; and then acting promptly to show that they had heard by reporting back promptly to stakeholders on what had been said and acting on demonstration projects. However, progress was slow, and perhaps the greatest difficulties were encountered in winning the support of people in the government agencies. In the beginning, the board staff had to spend inordinate amounts of time contending with active hostility to the initiative, allaying suspicions, correcting misinformation, clarifying the role of the board, and persuading people of its potential usefulness to them. But what made the greatest difference and was key to the gradual progress on all fronts was the establishment and ongoing use of the multistakeholder processes, particularly as they increased regional and local involvement, facilitated collaboration among all levels, and began to show tangible results.
6.7 REINFORCING REGIONAL INPUT
During the third year, the board gave major attention to establishing a continuing presence in the regions of the basin. One of the key action items was to establish coordinators in each of four regions of the basin: the upper sub-basin from the headwaters at Mount Robson down to and including Prince George; the middle sub-basin down to the Fraser Canyon and including Quesnel, Williams Lake and Lillooet; the Thompson River sub-basin including Kamloops and Salmon Arm; and, the lower valley sub-basin from Hope, through Greater Vancouver, to the Georgia Strait. The establishment of fulltime, locally hired and based regional coordinators, paid by the board, was a critical step in moving towards fulfilling the commitment to foster decision-making processes that were

-74-
based as much as possible in the communities and watersheds. Until this time, the board had relied on communications taking place through its regional board members, regional participants on basinwide steering committees and task forces, periodic community consultations, and continuing relations with the demonstration projects. The role of the regional coordinators, who were based in the communities, was to supplement and enhance these mechanisms by facilitating coordination among all government consultation and planning processes, and making it easier for all stakeholders to keep abreast of programs and activities in the regions. The coordinators identified key regional stakeholders and established lines of communication to assist them in monitoring issues and collaborating on solutions. By 1996, coordinators were active in all four regions.
6.8 IMPLEMENTATION ACTIVITIES OF THE FRASER BASIN MANAGEMENT BOARD
In the second year of its existence, FBMB emphasized collaboration in the implementation of the action plans. During the spring and summer of 1994, multistakeholder steering committees were used to develop proposals for each of the strategic programs. Draft ideas were then discussed during the autumn in a series of two-day workshops in five communities of the basin. Nearly 400 people participated in the workshop discussions; hundreds more attended evening open houses at which governmental and non-governmental organizations set up displays and made presentations on their activities in the basin. The workshop discussions focused on how to build on the strengths of existing management activities and how to remedy weaknesses, identifying who should do what, how and when (Tellus Institute In press). Through this process a new vision of watershed management emerged, where old ways of governance, dominated by top-down processes, were replaced by new approaches, ones which would involve local decision making, a diversity of interests and consensus processes.
6.8.1. Developing Management Strategies
The board's report at the end of the second year summarized the priority issues and more than 50 action items for 1993/94 that had been identified by the four multistakeholder steering committees responsible for water resources management, fisheries and aquatic habitat management, pollution prevention and waste minimization, and community development. The action items identified the organizations involved in the program that had agreed to take the lead in forming appropriate partnerships and implementing them. In most cases, this was one of the government agencies and only occasionally was it the board or a non-governmental organization.

-75-
6.8.2. Selecting Demonstration Projects
The board invited proposals for demonstration projects in the basin, and received more than 30 proposals in response. Using selection criteria based on the principles and goals of the program, a multistakeholder task force reviewed the proposals and made recommendations to the board. In November 1993, six projects from various watersheds were endorsed. The projects were the Salmon River Watershed Management Partnership (lower Fraser); Nahatlatch Integrated Resource Management Plan (Fraser Canyon); Nicola Watershed Community Round Table (Thompson sub-basin); Prince George Riverfront Trails Project (upper Fraser); Salmon River Watershed Roundtable (Thompson sub-basin); and Williams Lake River Valley Corridor Project (middle Fraser). The board's endorsement constituted a commitment to work with each of these multistakeholder initiatives, many of which had grassroots origins but all of which included governmental and non-governmental participants, in securing the technical and financial support needed to achieve their goals as long as these remained consistent with the sustainability principles of the program.
6.8.3. Facilitating Institutional Development
To be able to facilitate coordination and institutional development, the board began by identifying who does what in the basin. An overview was compiled and widely distributed as a response to many stakeholder complaints about the immense difficulty of understanding an institutional system that included hundreds of departments, boards, commissions, programs, agencies and organizations each affecting some aspect of the environmental, economic and social health of the Basin and most having different administrative boundaries. To further understanding, the first intergovernmental workshop on the basin—Integration of Government Program Delivery and Shared Responsibility in the Basin—was held. Eighty participants from federal, provincial, local and First Nations’ governments discussed the newly emerging vision of watershed governance that merged bottom-up and top-down decision making. To guide assessments of how the institutional system affects sustainability and might be improved, a report was prepared on the criteria that should be employed.
6.8.4. Auditing
This report on institutional design, together with one on sustainability indicators, was used in conducting the board's first audit, an assessment of the Fraser River Flood Control Program. Flood control had been identified during the consultations as an issue of great concern, heightened by the imminent prospect of the federal-provincial agreement for flood control coming to an end in 1995. A multistakeholder task force was

-76-
established to assess the system that had been put in place as a result of the $300 million spent on the dyking program since it began in 1968. Its overall conclusion was that the program had done a good job of fulfilling its mandate under the 1968 terms of reference. However, from the 1994 perspective, much needed to be done to improve flood protection, especially for those who now lived in the floodplain and may have developed a false sense of security. For example, most people were unaware that there was an estimated 1 in 3 chance that the greatest flood of record (1894) would be exceeded in the next 60 years and many mistakenly believed they would be covered by insurance if it should happen. The report outlined recommendations on river management, dyke maintenance, new dyke control, flood-proofing and integrated floodplain management.
6.8.5. Communication and Education
Each of the board members faced different challenges in reporting back to the stakeholders whose interests they represented, and it took considerable time to build effective communication channels. The federal and provincial government members used interdepartmental committees to facilitate communications. The three local government members reported back to a steering committee consisting of a representative from each of the 60 basin communities involved. The three First Nations members and the six non-governmental members had no single mechanism for reporting back but instead used the various organizations and networks to which they had access. All of the board members were extremely busy with other responsibilities. Thus, they had limited time available for conveying the substance of discussions that had taken place at the board meeting. During the first two years of the board's activities, when there was little buy-in to the Fraser Basin initiative because of limited consultation during the drafting of the agreement and when it was seen as being just one more of too many initiatives, the constraints on communications were very debilitating. It was not until the multistakeholder processes had begun to operate and a much wider diversity of governmental and non-governmental interests became directly involved, that a two way flow of information started to take place and a foundation of trust and collaboration began to be built.
The initial communication problems were particularly great within the federal and provincial agencies, where members of the board's staff found that little clear information or instruction was filtering down from their respective government's board members. The governments instituted a coordinating committee consisting of senior representatives of their board members to facilitate intergovernmental and interdepartmental coordination. This became problematic, as it was perceived by non-governmental board members as the federal and provincial government bureaucracy beginning to predominate over the board's activities. The occurrence led to questions about the independence of the board

-77-
and its staff. These strains became particularly great when this committee got involved in the early negotiations over the board's budget and began to act as the representative of the parties to the Agreement. Again, these difficulties slowly receded with the creation of the multistakeholder committees that directly involved a wider variety of governmental personnel from all four orders of government and began the process of building trust and commitment. Particularly significant was the involvement of the non-governmental members of the board.
The board responded to the immense demands for more and better information about sustainability and management initiatives in several ways. A multistakeholder steering committee was established to identify how the many programs and organizations developing and offering education programs relating to environmental, economic and community sustainability might be better coordinated, particularly at the local level. In response to requests that information be relevant, concise, readable and accessible, The Source Book and a computer bulletin board system were introduced. The Source Book was a binder designed to hold copies of the papers, newsletters, profiles, reports and reviews produced by the board. The idea was that information would always be released in a brief format with references to the relevant fuller documents and designed for insertion in a tabbed subsection of the binder.
6.8.6. State of the Basin Report and Board Report Cards
The board was committed to promoting a healthy and sustainable basin. Part of the board’s mandate was to check up on the basin’s health by monitoring its vital signs. Monitoring efforts included looking at specifics like groundwater quality, pulp mill effluents, employment, education levels and economic diversification. This monitoring required developing new ways of gathering information that would indicate progress—or lack thereof—towards sustainability of the basin.
In 1995, the board released its State of the Fraser Basin report, a compendium of eight reports that addressed key sustainability issues in the basin (FBMB 1995). The report was a first attempt to answer the questions of basin residents about whether progress was being made in achieving sustainability. The State of the Fraser Basin report covered eight topics:
Population growth; Water resources management; The basin’s salmon fisheries; Forests in the basin; The basin’s economy; Planning processes in the basin; Building new relationships with First Nations communities; and Decision making.

-78-
In conjunction with the State of the Fraser Basin report, the board released its first FBMP Board Report Card in 1995 and a second in 1996 (FBMB 1995, 1996). These Report Cards graded progress on some of the more critical issues facing the basin. The 1996 Report Card showed a slight increase in the basin’s progress towards a more sustainable future.
6.8.7. Creating a plan for sustainability
One of the board’s key deliverables in its five-year mandate was a strategic plan for sustainability of the Fraser Basin. This plan, named the Charter for Sustainability of the Fraser Basin, was published on 27 February 1997 (FBC 1997). The Charter is a prescription developed by, and for, the people who live, work and play in the Fraser Basin. The Charter was developed based on the work of government and non-government agencies, committees and individuals working together throughout the Fraser Basin. It was conceived and confirmed as a “good faith” document and as a long-term plan to sustain the Fraser Basin. The Charter for Sustainability continues as the guiding set of principles for the basin and all activities of the Fraser Basin Council. These principles are based on an agreed upon vision:
The Fraser Basin is a place where social well-being is supported by a vibrant economy and sustained by a healthy environment.
The Charter provides four directions (table 3.1) needed for achieving the vision of sustainability, and a set of principles (table 3.2) from which to operate.
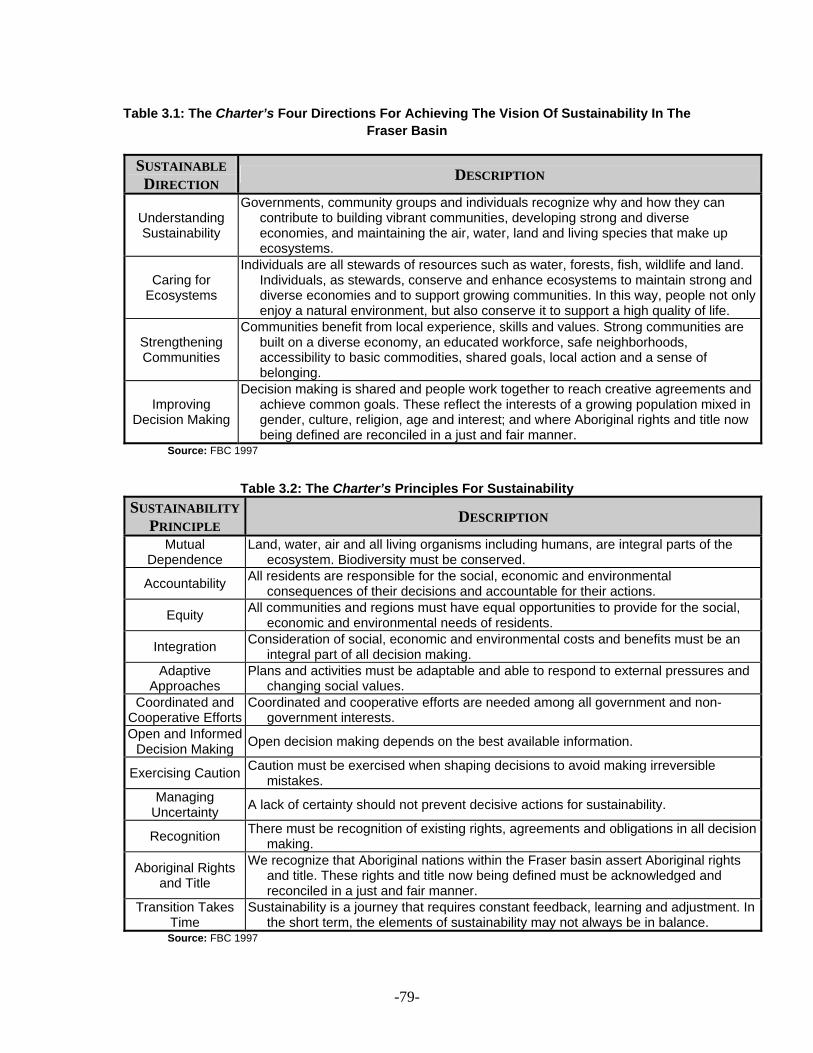
-79-
Table 3.1: The Charter’s Four Directions For Achieving The Vision Of Sustainability In The Fraser Basin
SUSTAINABLE DIRECTION DESCRIPTION
Understanding Sustainability
Governments, community groups and individuals recognize why and how they can contribute to building vibrant communities, developing strong and diverse economies, and maintaining the air, water, land and living species that make up ecosystems.
Caring for Ecosystems
Individuals are all stewards of resources such as water, forests, fish, wildlife and land. Individuals, as stewards, conserve and enhance ecosystems to maintain strong and diverse economies and to support growing communities. In this way, people not only enjoy a natural environment, but also conserve it to support a high quality of life.
Strengthening Communities
Communities benefit from local experience, skills and values. Strong communities are built on a diverse economy, an educated workforce, safe neighborhoods, accessibility to basic commodities, shared goals, local action and a sense of belonging.
Improving Decision Making
Decision making is shared and people work together to reach creative agreements and achieve common goals. These reflect the interests of a growing population mixed in gender, culture, religion, age and interest; and where Aboriginal rights and title now being defined are reconciled in a just and fair manner.
Source: FBC 1997
Table 3.2: The Charter’s Principles For Sustainability SUSTAINABILITY
PRINCIPLE DESCRIPTION
Mutual Dependence
Land, water, air and all living organisms including humans, are integral parts of the ecosystem. Biodiversity must be conserved.
Accountability All residents are responsible for the social, economic and environmental consequences of their decisions and accountable for their actions.
Equity All communities and regions must have equal opportunities to provide for the social, economic and environmental needs of residents.
Integration Consideration of social, economic and environmental costs and benefits must be an integral part of all decision making.
Adaptive Approaches
Plans and activities must be adaptable and able to respond to external pressures and changing social values.
Coordinated and Cooperative Efforts
Coordinated and cooperative efforts are needed among all government and non-government interests.
Open and Informed Decision Making Open decision making depends on the best available information.
Exercising Caution Caution must be exercised when shaping decisions to avoid making irreversible mistakes.
Managing Uncertainty A lack of certainty should not prevent decisive actions for sustainability.
Recognition There must be recognition of existing rights, agreements and obligations in all decision making.
Aboriginal Rights and Title
We recognize that Aboriginal nations within the Fraser basin assert Aboriginal rights and title. These rights and title now being defined must be acknowledged and reconciled in a just and fair manner.
Transition Takes Time
Sustainability is a journey that requires constant feedback, learning and adjustment. In the short term, the elements of sustainability may not always be in balance.
Source: FBC 1997

-80-
7. POST-DECENTRALIZATION PERIOD FROM 1997
7.1 FRASER BASIN COUNCIL SOCIETY
The Fraser Basin Management Board expected that a significant portion of the Charter would be self-implementing through individual and institutional actions (Marshall 1998). The board strongly believed there was a need for an organization that was independent of government to oversee implementation of the Charter. It also recognized, however, that government needed to be involved and, if possible, be part of the management structure of the organization. After examining a number of models, the board recommended one similar in composition to the former board that would be funded by federal, provincial and local governments, as well as other sources of funding through not-for-profit status. It is expected that as First Nations move closer to self-government, they too could be in a position to contribute financially to the new organization. On 3 June 1997, the Fraser Basin Council Society was established as a unique collaborative governance model that would include government, the private sector and civil society.
The Fraser Basin Council Society is a not-for-profit society registered under the British Columbia Societies Act. It also has charitable status under Revenue Canada. The society’s seven members meet once annually. Its principal function is to provide a legal foundation for the Fraser Basin Council. In this capacity, the society acts as custodian of the society’s constitution and bylaws (Marshall 1998).
Members of the society are empowered to elect the officers of the society (i.e., president, vice-president and secretary-treasurer) who, in turn, become the officers of the Council (chair, vice-chair and executive director). All decisions made by the society are made by consensus. Such a procedure allows government to be represented on the board of directors of the organization, to assure continuing balance of representation on the Council, and to avoid even the perception or possibility of one interest or another overtaking the society (Marshall 1998).
7.2 FRASER BASIN COUNCIL (FBC)
The operational arm of the Fraser Basin Council Society is the Fraser Basin Council (Marshall 1998). As a custodian of the strategic plan for the basin, the FBC has a mandate of implementing the Charter for Sustainability (FBC 1997). The Council is unique because, while organizations are normally constructed on adversarial lines, FBC is not, and represents a new approach that cuts across traditional adversarial lines and

-81-
other differences to promote the common social good (Marshall 1998). It is a non-governmental organization informed by governments, the private sector and civil society. Governments are part of the Council’s management structure but it is “arms length” from governments. It is a not-for-profit, fee-for-service entity that can, for the first time, legally meld public sector funding with private sector participation. Although the Council receives financial contributions from the federal, provincial and local governments, it is empowered to raise funds from many sources including corporations, foundations and individuals.
The FBC is structured around 36 directors (fig. 3.2): three from each of the federal and provincial governments, and one from each of the eight regional districts in the basin (Marshall 1998). Each of the eight First Nations language groups in the basin has representation on the Council and the board of directors.
For purposes of FBC operations, the Fraser Basin is divided into five geographic regions: Upper Fraser, Cariboo-Chilcotin, Thompson, Fraser Valley and Greater Vancouver-Squamish-Pemberton (GVSP). Two non-government directors are chosen from each region to represent a broad range of interests and sectoral considerations. Directors have experience and background in a range of subjects that are important to the realization of sustainability.
In addition, four directors are basinwide representatives of sustainability providing the following perspectives: environmental sustainability, social sustainability, economic sustainability and an impartial chair.
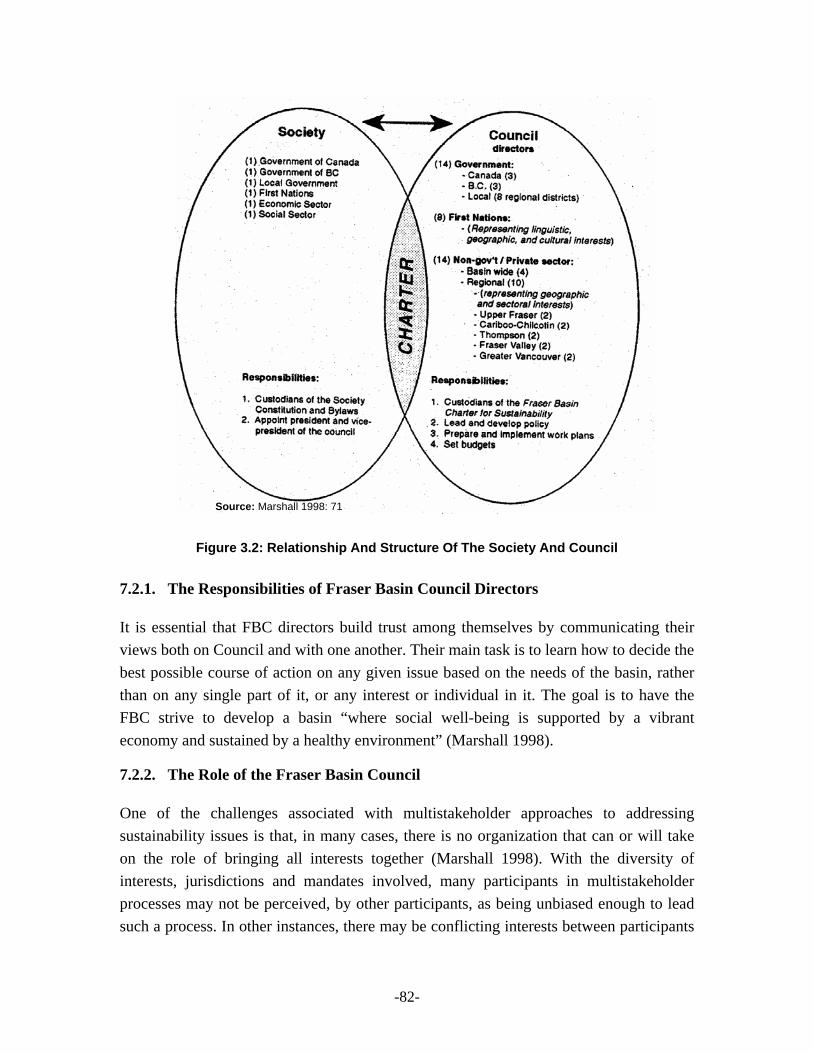
-82-
Figure 3.2: Relationship And Structure Of The Society And Council
7.2.1. The Responsibilities of Fraser Basin Council Directors
It is essential that FBC directors build trust among themselves by communicating their views both on Council and with one another. Their main task is to learn how to decide the best possible course of action on any given issue based on the needs of the basin, rather than on any single part of it, or any interest or individual in it. The goal is to have the FBC strive to develop a basin “where social well-being is supported by a vibrant economy and sustained by a healthy environment” (Marshall 1998).
7.2.2. The Role of the Fraser Basin Council
One of the challenges associated with multistakeholder approaches to addressing sustainability issues is that, in many cases, there is no organization that can or will take on the role of bringing all interests together (Marshall 1998). With the diversity of interests, jurisdictions and mandates involved, many participants in multistakeholder processes may not be perceived, by other participants, as being unbiased enough to lead such a process. In other instances, there may be conflicting interests between participants
Source: Marshall 1998: 71

-83-
in the process. This makes it difficult for participants to initiate and maintain such processes. In the case of some issues, there is simply no organization with the jurisdiction or mandate for addressing an issue. The structure and mandate of the FBC allows it to play the role of an impartial facilitator that can bring all interests together to develop solutions that recognize the diversity of interests involved.
7.2.3. Institutional Concept
FBC is a unique partnership of public and private interests, assuring broad representation from all sectors of society and emphasizing an integrated approach to realizing social, economic and environmental goals (Marshall 1998). It provides a nonconfrontational, consensus-based forum in which no participant is first among equals, and in which the interests of all stakeholders can be presented. The FBC is a means of doing business together across insurmountable boundaries and it allows for inclusive, shared decision making. Governments were made part of FBC’s management structure in an effort to allow for greater influence on government policy and programs than is normally generated through traditional non-governmental organizations. No similar organization exists in Canada today.
The FBC is designed to achieve its goals by facilitating cooperative and collective action throughout the basin. It will not duplicate existing governmental and non-governmental mandates and activities. It will, however, act as a catalyst to minimize duplication and facilitate harmonization and collaboration among diverse basin interests.
7.3 FRASER BASIN COUNCIL PROGRAMMES
Based on the priorities identified by the board and its committees, the Fraser Basin Council becomes involved as a conflict resolution agent, catalyst and facilitator in specific issues of concern. It has also provided secretariat, interim project management and coordinator services for many projects, and has initiated programs to educate the public, government, business and professional organizations on many aspects of sustainability. In all its activities, the FBC is first and foremost an advocate for sustainability.
Basinwide and regional programs illustrate the breadth of issues that the FBC has undertaken and the degree of cooperation it has developed throughout the basin.
7.3.1. Basinwide Programs
Flood Hazard Management: Two devastating floods inundated the lower Fraser Valley and other parts of the Fraser Basin in 1894 and 1948. Scientists predict that there is a one-

-84-
in-three chance that a flood of similar proportions will occur within the next 60 years. Such a catastrophic flood would result in severe social, economic, and environmental impacts. These include risk of injury and loss of life; billions of dollars in damage to private and public property; temporary loss of infrastructure and community services; disruption of business and trade; and numerous impacts to water quality, as well as fish and wildlife habitat.
The FBC provides the lead role in the Joint Program Committee (JPC) comprised of 36 federal, provincial and local government agencies working towards Integrated Flood Hazard Management. The FBC and its partners have initiated a number of programs and policies to reduce the threat and effects of flooding. These include the Comprehensive Management for Flood Protection Works report that promotes the establishment of a long-term, sustained funding program for proactive flood hazard management in B.C.; the Floodproofing Options for Historic Settlement Areas report that promotes practical design options for the implementation of floodproofing; and a public education, outreach, and consultation program. The JPC also provides a forum to exchange information and share lessons learned with respect to flood hazard management.
In 2003/2004, FBC has worked with the province and local governments to develop a range of essential flood hazard management tools including digital flood hazard reference maps, a GPS survey of flood protection dykes and a hydraulic model scoping study. These tools will assist government, First Nations and other agencies to better understand, plan for and mitigate potential flood hazards.
Strengthening Communities: In 2002, the FBC established “Strengthening Communities” as a priority program. Strong and economically diversified communities are essential for the sustainability of the Fraser Basin. In BC, many rural communities face challenging economic transitions as traditional forestry, mining and fishing industries undergo profound restructuring. The FBC and its partners such as the Canadian Rural Partnership (CRP) are working together to develop an action plan to address rural concerns, improve the delivery of services to rural communities and strengthen community capacity.
Phase One of the plan included the completion of an inventory of B.C. projects that focus on building economically vibrant, sustainable communities. Phase Two involved documenting 40 case studies that reflect the Lessons Learned from projects across B.C. where sustainability issues have been addressed in local communities. Phase Three focused on linking communities to expand the transfer of this knowledge and experience. The FBC also co-hosted the “Rural Communities/Rural Vision” conference in 2001.
The FBC Board has approved five pilot projects, one in each region of the basin:

-85-
Greater Vancouver-Squamish-Pemberton Region: An imaginative project to revitalize the waterfront in downtown Squamish before the 2010 Winter Olympics, boosting tourism and the local economy.
Fraser Valley Region: The project in Kent will enhance small lot agriculture, promote and market locally grown farm products, and support agri-tourism.
Thompson Region: Working with partners to make broadband Internet access a reality as quickly as possible in Fraser Canyon communities, including Boston Bar, Lytton and Spences Bridge.
Cariboo-Chilcotin Region: This project brings together a number of small rural and First Nations communities to research and compile a South Cariboo community profile and build an Action Plan to retain community residents.
Upper Fraser Region: This project brings together representatives from McBride and Dunster to identify and build a common vision for the Robson Valley area.
Invasive Plant Strategy for B.C.: The Fraser Basin Council recently released the Invasive Plant Strategy for British Columbia—a groundbreaking document that targets the rapid spread of invasive, non-native plants in British Columbia. Without natural enemies to control their populations, alien plant species are invading our grasslands, forests, lake and communities.
These aliens threaten fragile ecosystems, reduce biodiversity and harm human and animal health. Annual economic losses from invasive plants cost ranchers, farmers, utilities, forest companies, government and the general public tens of millions—and perhaps even hundreds of millions—of dollars each year in lost productivity.
The strategy was developed with support and expertise from the provincial government, First Nations, regional districts and many non-government organizations. A non-profit Invasive Plant Council of British Columbia will be established to coordinate invasive plant management province-wide, improve compliance with current and new legislation, establish research priorities and coordinate public awareness programs.
First Nations Action Plan: In February 2004, the FBC Board approved an “Action Plan on Building and Improving Aboriginal and non-Aboriginal Relations in the Fraser Basin”. The Action Plan is founded on the belief that good relations are the basis for good process, and lead to better understanding and effective action.
The Action Plan recognizes that just and fair acknowledgement and reconciliation of Aboriginal rights and title is integral to achieving a more sustainable Fraser Basin. It provides a roadmap for how the FBC will recognize Aboriginal rights and title and provide meaningful opportunities for Aboriginal involvement in FBC activities.
The Plan’s goals are to: Enhance understanding of the historical and current context of key Aboriginal issues,
and how recognition of Aboriginal title and rights relates to achieving sustainability in the Fraser Basin; and

-86-
Promote joint solutions to sustainability issues that are shared by Aboriginal and non-Aboriginal communities in the Fraser Basin.
B.C. Climate Exchange/Climate Change: Like many other parts of the world, the Fraser Basin is already seeing signs of a changing climate such as increases in water temperatures, rising sea levels, winter floods on coastal tributaries, summer droughts and insect infestations. In 2002, the FBC was selected to host a Public Education and Outreach “Hub” for Climate Change in B.C., subsequently renamed the B.C. Climate Exchange. The purpose of the initiative is to promote learning about climate change and support the work of business, government and community organizations engaged in public education and outreach on this important sustainability issue.
FBC staff have been working to bring together individuals and organizations throughout the province that are involved in climate change education and outreach as well as greenhouse gas mitigation.
Over the past year, the B.C. Climate Exchange has: held seminars and workshops in communities throughout the province on green energy opportunities, transportation demand management and reducing greenhouse gases (GHGs); produced three Climate Change newsletters; hosted a website that includes a comprehensive set of climate change education resources and a list of upcoming events; worked with two pilot communities through the “Cool Communities” program; and worked with partners to expand the web-based Greenhouse Gas Action Guide to assist municipalities and First Nations to reduce GHGs.
Sustainable Fisheries Strategy: Fish, fisheries and their habitat are enduring symbols in the Fraser Basin. There is a sense, however, that their future is imperiled, in part because Fraser River fish and fisheries are undergoing significant change. Some of the challenges threatening the social, economic, and environmental sustainability of Fraser fish and fisheries include declines in fish abundance and diversity, habitat damage or destruction, changes in harvesting methods, changing roles and responsibilities of management agencies, and altered lifestyles for groups and communities whose work and history are linked to fishing.
There have been numerous efforts to address these challenges but, despite considerable work and much goodwill, they have never been fully successful. This is partly because they have never been developed collectively.
The FBC’s “Sustainable Fisheries Strategy,” also called “Fraser Fish and Fisheries Together,” aims to develop a new and collaborative approach to sustainable management of fish, fish habitat, and fisheries throughout the Fraser Basin.

-87-
State of the Fraser Basin Conferences: Every two years, the FBC convenes a conference that brings together community and business leaders, politicians, environmentalists and other non-governmental organizations to raise public awareness about sustainability, honor those who have made significant contributions toward a more sustainable future, and report on the basin's progress in addressing social, economic and environmental challenges.
In 1998, the FBC held its first ever State of the Fraser Basin Conference. The second conference in 2000 focused on the theme of “Doing and Measuring” and reinforced the importance of measuring progress toward sustainability. The 2003 conference, which attracted over 350 delegates, focused on the theme of “Collaborative Leadership for Sustainability.” The theme of the fourth conference to be held 26 and 27 November in Vancouver is “Sustainability Works!”
At the 2003 Conference, Sustainability Awards honored the achievements and commitment of dedicated people and organizations that have worked to make the Fraser Basin more sustainable. Nearly 100 nominations were received from all regions of the basin and five awards were presented for Overall Sustainability (co-winners the City of Burnaby and the City of Quesnel), Understanding Sustainability (Cooperative Auto Network), Caring for Ecosystems (Chilako Watershed Council), Strengthening Communities (Lheidli T'enneh Nation, the City of Prince George and the Fraser-Fort George Regional District) and Improving Decision Making (FORREX – Forest Research Extension Partnership).
Sustainability Indicator Reports: Sustainability indicators are useful tools to track progress toward sustainability goals, report on key social, economic, environmental and decision-making trends, and promote dialogue that will improve decision-making and facilitate action towards a more sustainable basin.
The FBC released its first A Snapshot on Sustainability: State of the Fraser Basin Report at the January 2003 State of the Fraser Basin Conference. The groundbreaking report examined a set of environmental, social and economic indicators for the Fraser Basin. These addressed such topics as population trends, water and air quality, climate change, fish and wildlife species at risk, health, education, housing, Aboriginal and non-Aboriginal relations, income and employment, economic diversity, forestry, agriculture and preparing for the next great Fraser River flood. Over 500 people participated in the development of the indicators over the past two years. Nearly 10,000 copies of the report have been distributed to organizations, agencies and individuals.
The FBC has received an overwhelmingly positive response to its sustainability report. Readers have commented on the quantity and quality of information, the sustainability

-88-
analysis, the readability of the report and the collaborative process that was used to develop the report. The FBC will continue to communicate the findings of the report to government, business and civil society to assist all in making more informed decisions about sustainability. Work is well underway on the next indicator report to be released at the 2004 conference.
Rural Development: The Canadian Rural Partnership (CRP) was established by the federal government in partnership with provincial governments in 1998 to improve coordination of government efforts for the delivery of services to rural communities. The CRP's B.C. Rural Team involves innovative partnerships between all orders of government as well as non-governmental interests. The FBC is bringing its expertise in process design and facilitation to the B.C. Rural Team to assist them with identifying opportunities in the planning and implementation of government services to better meet local needs.
Potential programs being considered include improving access to government programs, increasing program flexibility and strengthening community capacity in rural communities. In addition, the FBC, in partnership with the Coastal Communities Network, helped coordinate a rural stakeholder conference, “Rural Communities, Rural Visions,” aimed at strengthening rural communities by increasing understanding of rural issues among all levels of government and encouraging co-operation and action on joint projects.
Drinking Water Review Panel: Chaired by the FBC, an independent Drinking Water Review Panel reviewed the effectiveness of B.C.’s Drinking Water Protection Act and looked at the quality and delivery of drinking water and well water, tampering of water systems, funding infrastructure and protecting groundwater resources. In 2002, the provincial government responded by developing a Drinking Water Action Plan, investing $16 million in additional funding to increase monitoring of drinking water and create new Drinking Water Protection Officer positions.
7.3.2. Regional Programs
Greater Vancouver-Squamish-Pemberton Region
Debris Management: Management of waterborne debris in the Fraser River and adjacent marine waters presents a serious challenge, posing significant threats to public safety, navigation, recreation and habitat. A regional, cooperative approach to debris management is needed, as debris affects many interests and no single entity bears sole responsibility for finding solutions. In addition, funding for the operation of a critical

-89-
debris capture facility, the Fraser River Debris Trap near Hope, has historically been unstable due to uncertain responsibility among senior governments.
In 1999, government funding cuts nearly resulted in the closure of this unique facility. Had this occurred, enough woody debris to fill 13 North American football fields to a depth of three meters would have flowed downstream and caused severe damage to infrastructure, interfered with navigation, clogged sensitive marshes and possibly resulted in loss of life.
To address this challenge, the FBC intervened to secure interim funding for the debris trap. It also acted as a catalyst and facilitator to bring together a broad range of agencies and interests to develop a regional, cooperative approach to debris management, secure long-term funding and find environmentally, economically and socially sound methods of processing wood waste and managing wood debris in support of healthy aquatic ecosystems.
Britannia Mine Reclamation and Remediation: The Britannia Mine, which operated from 1902 to 1974, has been described by Environment Canada as “the largest single point source metal contamination problem in North America.” Acid Rock Drainage (ARD) effluent from the mine severely impacts marine life in Howe Sound, including some 4.5 million salmon that migrate up the eastern side of Howe Sound each year. ARD, combined with contaminated soil and sediments at the site of the former mine, pose a significant obstacle to the long-term economic and social development of the Britannia area.
Since 1998, the FBC has played an instrumental role in bringing the Britannia Mine remediation issue to the public’s attention. FBC, acting as catalyst, facilitator and conflict resolution agent, has also encouraged cooperation among all orders of government, the private sector and the community towards developing a socially, economically and environmentally viable future for the town of Britannia Beach and the surrounding area. The federal and provincial governments, with the support and encouragement of FBC, have negotiated a settlement agreement with past owners of the mine who will contribute $30 million into a cleanup fund in exchange for release from future liabilities with the mine site. Remediation activities are now underway at the site.
The Changing Face of the Lower Fraser River Estuary: The Fraser River Estuary, which stretches from Langley to the sea, is a critical gateway to the Fraser Basin. A growing population looks to the estuary to satisfy demands for housing, commercial and industrial development, port expansion, transportation and recreation. Recent scientific research suggests that geophysical and biological changes are occurring in the estuary –

-90-
changes that may have implications with respect to the social, economic and environmental sustainability of the region.
In Spring 2002, the FBC and a community organization, the Fraser River Coalition, partnered with the Fraser River Estuary Management Program and the GVRD to co-host a symposium entitled The Changing Face of the Lower Fraser River Estuary. Participants discussed recent physical, biological and institutional changes in the Fraser River Estuary, and the implications of these changes for sustainability in the region. The event helped set the stage for more informed and inclusive dialogue and cooperative action to enhance the sustainability of this globally significant estuary.
GVRD Sustainable Region Initiative: The Greater Vancouver Regional District (GVRD) Sustainable Region Initiative (SRI) provides a planning framework, a vision and an action plan for Greater Vancouver that embraces economic prosperity, community well-being and environmental integrity. The FBC is contributing to the SRI in a number of ways including assembling a group of experienced local leaders to provide advice to senior GVRD staff as the SRI is developed; participating as a member of the SRI Partners Committee to help ensure that the SRI fully integrates all three dimensions of sustainability; and chairing an internal GVRD staff committee examining the governance aspects of the SRI.
Fraser Valley Region
Fraser River Management Plan – Hope to Mission: In recent years there has been growing conflict over the management and use of in-river gravel contained in the “gravel reach” of the lower Fraser River. Gravel movement and build-up in some areas of the river reduces the ability of local communities to protect themselves from floods; it also affects commercial navigation in the river. However, the removal or movement of in-river gravel has implications for fish habitat as well as in-river infrastructure such as bridges, pipelines and bank protection.
To address this complex issue, the FBC brought together all interested parties to facilitate the development of a plan that would address key issues including flood and erosion protection, gravel resources, fish and aquatic habitat, and navigation, as well as First Nations concerns. The resulting plan developed by the Fraser River Management Plan (FRMP) Steering Committee defined the location, timing and quantity for potential gravel removals in order to focus efforts on flood, erosion and navigation hazards, while avoiding impacts to habitat.
Agricultural Nutrient Management: The Fraser Valley is one of North America's most productive food-producing regions and accounts for almost 75% of B.C.’s total farm

-91-
income. However, some agricultural practices generate pollution and require management to prevent degradation of soils and water. Oversupply or inappropriate application of commercial fertilizers or manure from livestock and poultry may pollute the groundwater and surface water with nitrates and phosphates.
The FBC worked with the agricultural sector and federal and provincial government agencies to develop a Nutrient Management Planning Strategy (NMPS) for the Fraser Valley. The long-term goal is the management of agricultural nutrients in a way that supports the economic viability of farming and the social and environmental objectives of government and communities.
The Sustainable Manure Management Program has been the catalyst for farmers to invest more than $10 million in manure storage to protect surface and groundwater from agricultural run-off. The Sustainable Poultry Farming Group Program has resulted in poultry farmers trucking excess manure to other areas where it is needed, while protecting the local aquifer.
Thompson Region
Mid-Fraser Economic Development Conference: “Working together to share ideas and make them a reality” was the theme of an ambitious conference in Lillooet in March 2004 to promote sustainable economic development in the mid-Fraser region. Organized under the auspices of the FBC’s Strengthening Communities initiative, this conference attracted speakers and delegates from the Fraser Canyon, the eastern Fraser Valley, Pemberton, the Thompson-Nicola region and the southern Cariboo.
The conference provided people wanting to start a new businesses in agriculture, tourism, forestry, mining and other sectors with practical, hands-on tools on how to get started, secure financing, build effective partnerships, take advantage of opportunities from the 2010 Olympics, plan and market their business.
Shuswap Lake Water Quality: As the population and intensity of activity in the Shuswap Lake area increases, concerns have begun to emerge regarding the quality of water in Shuswap Lake. The lake provides important fish habitat, is a source of drinking water and is an important recreational area. The FBC is working with local governments in the region to raise awareness of the extent and nature of water quality concerns and facilitate the development of solutions involving all interested parties.
The FBC coordinated the development of a summary report of water quality test sites in Shuswap Lake. In addition, the FBC developed a publication for the general public on the water quality of Shuswap Lake entitled How is Our Lake Doing? The document was widely distributed in the local area to increase awareness of issues affecting the lake.

-92-
Shuswap Lake Library, Map and Database Project: To determine or assess the land's natural value when subdivisions are proposed, regional districts often can rely only on public hearings and anecdotal knowledge of its staff and other government agencies. In the case of the Columbia Shuswap Regional District (CSRD), local planners and citizens believed that these sources of information were inadequate.
When an opportunity arose through a partnership between the former B.C. Ministry of Environment, Lands and Parks and Fisheries and Oceans Canada to place a Habitat Steward with the FBC’s Thompson Regional office, the CSRD worked with FBC staff to research and compile extensive data and other relevant information on the Shuswap and Mara Lakes. The challenge was in identifying information sources, designing a tool that would encourage all parties to share their information and making it accessible to all. Phase One has been completed and Phase Two—expanding the knowledge base by gathering information on tributaries that feed the lakes—is now underway.
South Thompson Settlement Strategy: To maintain the Basin's rivers in as natural a state as possible, growth management is crucial. The South Thompson is undergoing the greatest pressure for growth. The Thompson Nicola Regional District (TNRD) recognizes this and asked the FBC for help in gathering background information and consulting the public on ideas to accommodate the growth while protecting the natural values of the area. The process took several years but has culminated in the development of the South Thompson Settlement Strategy (STSS) that was proclaimed into law in the fall of 2002.
Habitat Stewardship in the Thompson: New and emerging federal and provincial legislation is placing greater responsibility on municipalities and regional districts to manage growth and protect habitat. With the support of DFO’s Habitat Conservation and Stewardship Program and the provincial government, the Fraser Basin Council has put in place two stewardship coordinators in the Thompson region. They are assisting the Columbia Shuswap and Thompson-Nicola Regional Districts to gather information needed to adopt and implement new bylaws and zoning requirements. The long-term goal is to prepare a template, which can assist other local governments with amendments to Official Community Plans and zoning bylaws to reflect the legislation changes to the Local Government Act and other relevant federal and provincial legislation.
Cariboo-Chilcotin Region
Quesnel Sustainability Indicators: A number of communities have recognized the usefulness of developing sustainability indicators as a tool for measuring their progress toward meeting community sustainability goals. Recognizing the FBC’s expertise in this area, the community of Quesnel and the Ministry of Community, Aboriginal and

-93-
Women’s Services invited the FBC to facilitate the development of sustainability indicators. Working with a local Project Team, the FBC facilitated the consolidation of community sustainability goals and challenges from the many existing studies and plans already undertaken in the Quesnel area including an Official Community Plan and Economic Development Strategy. Based on these goals and challenges, the FBC facilitated the development of a set of sustainability indicators that can be used by the community to track progress toward the realization of the community’s vision. Twenty-one indicators were selected and described in a final report published in the spring of 2002.
Caribou Management: The population of the eastern mountain caribou is recognized as needing special management to help ensure that the sub-species population is sustainable. To help increase public awareness of caribou and related management concerns, the FBC facilitated a broad-based panel to encourage public discussion and invite recommendations for protecting these animals. The panel brought together representatives from the forest industry, environmental groups, guide outfitters, snowmobilers and recreationists to identify possible volunteer actions. The panel identified what actions recreationists, community organizations, industry and governments can take to help ensure the viability of the local population. A key message was the need to work cooperatively together in planning and in the field to minimize negative impacts on the Caribou herd.
Economic Networking Directory and Planning: In the Cariboo Region, there is a diverse range of interests involved in economic planning. Communities in the region identified a need and opportunity to strengthen communication, coordination and cooperation among all interests in support of achieving the region's economic development objectives. The FBC provided leadership in developing the Cariboo Chilcotin Economic Development Directory. This document, developed with funding support from Human Resource Development Canada, is a key resource for strengthening economic networking between agencies within the Cariboo. It has helped to build liaisons among the small communities in order to share information and address common issues. In addition to its work on the Directory, the FBC facilitated an economic workshop in 100-Mile House that focused on specific actions to strengthen that community.
Cariboo/Chilcotin Fish Enhancement Society: The Cariboo/Chilcotin Fish Enhancement Society was established in 1998 to promote watershed enhancement work throughout the region. The membership of the society is diverse, representing thirty watershed and community partner groups interested in fish and fish habitat. Identifying key priorities for fish enhancement funding and action has been a challenge for the society.

-94-
The FBC facilitated strategic planning sessions focused on organizational structure and proposal reviews, and continues to support the society by assisting in the development of long-term strategies as well as current organizational priorities. The FBC’s assistance resulted in a change in the society’s structure and increased their effectiveness. The society provided $300,000 for 14 projects in its 2000 fiscal year.
Upper Fraser Region
Nechako Watershed Council (NWC): For the past 50 years, concerns about the development of the Nechako River to generate hydroelectricity for Alcan's smelter in Kitimat have generated tremendous controversy over the management of the Nechako, a major tributary of the Fraser. This situation resulted in decades of entrenched positions and strained relationships among those involved.
In 1998, the FBC helped establish the NWC, a multi-interest group with First Nations, business, community and government representation. The NWC has accomplished much towards its goal of developing a water management strategy that incorporates socially, economically and environmentally viable solutions to the longstanding conflicts in the watershed. For six years, the FBC (and its predecessor the Fraser Basin Management Board) continued its crucial role in facilitating the resolution of Nechako water management issues.
In 2001, the FBC concluded its work with the Nechako Environmental Enhancement Fund (NEEF) Management Committee with the Committee's decision that a Cold Water Release Facility (CWRF) be constructed at the Kenney Dam as the primary means of downstream enhancement. Building the CWRF is seen as the single most important way of resolving almost all of the issues, while meeting environmental, social and economic interests and supporting the sustainability of the Nechako Watershed.
During 2001/2002, the FBC continued to work with the NWC as it prepared a CWRF Work Plan in cooperation with its provincial and corporate partners. Because of these efforts, the provincial government and Alcan BC have each committed to providing $100,000 per year for the next three years to NEEF to implement Phase 1 of the CWRF Work Plan. With assistance from FBC, NWC members together with provincial and Alcan staff are also working to develop flow regimes that would be possible to implement after the proposed CWRF has been constructed, and would accommodate the broad range of interests.
Nechako River Environmental Enhancement: The Council has also assisted the Nechako Environmental Enhancement Fund Management Committee (NEEF MC) with consultations on the downstream enhancement of the Nechako watershed area by

-95-
facilitating workshops to obtain advice on enhancement options. Workshop participants included representatives from First Nations, federal, provincial and local governments, environmental organizations, the private sector and other interests.
In June 2001, the NEEF MC announced their decision that a cold-water-release facility was to be constructed on the Nechako River near the Kenney Dam. The announcement comes with a total estimated price tag of just under $100 million. This decision serves as a key milestone towards the rehabilitation of fish that depend on the Nechako River and its tributaries, including sturgeon, sockeye salmon, chinook salmon and many others.
Chilako Watershed Council: The FBC has continued to support the efforts of rural residents and agency staff to improve the riparian area of the Chilako River and help address residents’ concerns about flooding. The successful efforts of the Chilako Watershed Council (CWC) received national recognition 2002 when it received the Countryside Canada Environmental Stewardship Award from the Canadian Federation of Agriculture. FBC staff is helping the group develop a watershed management strategy that will incorporate the results of several studies and the residents' plans for restoration work at various sites.

-96-
8. PERFORMANCE MEASURES
8.1 FRASER BASIN COUNCIL EFFECTIVENESS
The following excerpts are taken from the Summary Report: Evaluation of Fraser Basin Council Effectiveness (SALASAN 2002).
In September 2001, the Fraser Basin Council contracted a consultant to conduct an independent evaluation of the Council’s effectiveness over its initial four years of operation. The purpose of the evaluation was to:
Assess the effectiveness of the Fraser Basin Council in enhancing sustainability in the Fraser Basin;
Ensure the continuing effectiveness and credibility of the Council by supporting planning for next cycle of the Council’s life; and
Compile information about the nature and activities of the Council in a manner that resonates with current and potential donors and partners.
Actions that have been undertaken by the Council to promote sustainability in the Fraser Basin were considered in the evaluation—recognizing that the Council’s work is intended to complement the efforts of other organizations using an array of strategies, projects and activities. Within this context, the evaluation focused specifically at an operational level. That is, given the vision for sustainability, the basinwide and regional goals and the principles for sustainability, how well has the organization put these aims into operation? The evaluation considered five evaluation areas:
Mandate – the purpose of the Fraser Basin Council; Results – from projects and operations of the Council; Strategies – being pursued to achieve the Council’s intended results; Operations – the structure and activities of the Fraser Basin Council by organizational
function; and Success factors – that have made (or could make) the Fraser Basin Council successful
in realizing its vision and mandate.
The evaluation involved staff members, current and past directors and “external interests”—individuals who had been involved in activities sponsored by the Council (such as conferences or projects) but who had not served as staff or directors.
8.2 MANDATE OF THE FRASER BASIN COUNCIL
The mandate of the Fraser Basin Council, was described by respondents as either promoting, advocating, advancing, educating or pursuing sustainability in the Fraser Basin. While sustainability was commonly seen as a “fuzzy” and evolving concept that is poorly understood among the residents of the basin, respondents felt that the concept provides a strong and motivating core foundation to the Fraser Basin Council.

-97-
8.3 RESULTS FROM PROJECTS AND OPERATIONS OF THE COUNCIL
The most significant and widely acknowledged “result” of the Fraser Basin Council’s operations is increased communications among key parties with an interest in the management of one or more aspects of the basin. This increased communication and subsequent increase in mutual understanding is most apparent at the level of the Council itself. Directors and former directors repeatedly spoke of the value of bringing engaged people with disparate interests together for a common purpose (promoting sustainability and addressing important shared issues).
8.4 STRATEGIES PURSUED BY THE COUNCIL
The governing structure of the Council has been carefully crafted with the intention of providing an inclusive and representative reflection of the Fraser Basin. Respondents almost universally complemented the Council staff and directors on their efforts to remain inclusive and representative, and their attempts to transform the apparent unwieldiness of the resulting Council structure and processes into strengths.
8.5 OPERATIONS OF THE COUNCIL
Many respondents commented on the quality and dedication of both the leadership (current and past Chair and Executive Director) and the staff of the Council. The importance of regional staff and support for regional initiatives was seen as important for future growth and credibility of the organization.
8.6 SUCCESS FACTORS
The Fraser Basin Council is unique in that has pulled together a diversified working group from many different organizations and from the private sector. There probably are few groups out there that are so well represented and are able to collectively make decisions with most all parties on board.
The Fraser Basin Council was (conceived as) a new kind of 21st century organization, purposely designed to have no legal powers, but to be instead an impartial facilitator of sustainable decision making. It operates under a new mode of collaborative governance. The Council is meant to be infinitely flexible and constantly evolutionary. It is a transpartisan, non-political, non-governmental, autonomous organization where governments and others serve as equals together in on-going progress toward sustainability.

-98-
8.7 FBC FINANCIAL PERFORMANCE
In addition to evaluating its first five years, the Council also publishes annual reports containing financial statements prepared by third-party auditors, as required by the provincial Society Act. Table 4.1 presents financial information compiled from the Council’s audited financial reports since its inception.

-99-
Table 4.1: FBC’s Financial Performance Since Inception
1998 1999 2000 2001 2002 2003 % budget allocated by external (government) agency1 94.5% 85.7% 70.7% 64.5% 52.1% 51.2% % derived from stakeholders in river basin 0.00% 0.00% 0.00% 0.00% 0.20% 0.12% % derived from project revenue 3.6% 6.1% 26.7% 27.1% 46.3% 35.9% % derived from conference 0.0% 6.5% 0.0% 6.6% 0.0% 11.3% % derived from other sources 1.90% 1.68% 2.69% 1.78% 1.41% 1.50% % budget invested in the basin 100.0% 100.0% 100.0% 100.0% 100.0% 100.0% % budget used for development activities2 50.9% 55.9% 55.4% 50.9% 66.2% 53.2% % budget used for O & M3 39.5% 38.5% 42.0% 30.5% 32.8% 31.9% % budget used for other4 9.6% 5.6% 2.6% 16.2% 0.9% 14.9%
Source: FBC 1999; 2000, 2002, 2003a
1. Government contributions from federal, provincial, and municipal levels 2. Includes, as appropriate, basinwide and regional projects, as well as outreach initiatives 3. Includes communications costs, board operations expenses, administration costs, amortization of capital assets, and Goods and Services Tax 4. Includes net revenues (or deficits) and conference expenses

-100-
FBC’s total budget has more than doubled in its seven years of existence. Starting at just under a million dollars annually in 1998, FBC’s total budget reached over two million dollars for the last fiscal year. Initially, FBC received the lion's share of its funding from the federal, provincial, and local governments (local government funding is provided by the eight regional districts within the basin on a per capita basis), with each contributing order of government providing approximately equal portions. However, government funding, while remaining constant in absolute terms, has decreased proportionally and currently accounts for just over half of FBC’s total budget. Most of FBC’s budgetary growth is attributable to the strong increases in project revenues, which currently account for between 35% and 45% of the total budget. Some growth is also attributable to revenues generated by the biennial State of the Fraser Basin Conference. Individual donations from river basin stakeholders are increasing, but this funding source remains insignificant.
All revenues generated by and funds allocated to the Council are reinvested into the Fraser Basin in some manner. Since its inception FBC has spent more than half of every budgetary dollar on basin developmental activities characterized previously. Ongoing operational and maintenance activities originally required around 40% of the budget, but for the last three fiscal years this cost item has been trimmed to roughly 30%. Another major budgetary item, the State of the Fraser Basin Conference, captured by the “other” category, spikes every other year when the conference is held. The “other” category also includes net revenues (deficits), which are retained, forming unrestricted assets that accumulate from year to year. Recently, much of the accumulated unrestricted assets from the Council’s first few years of operations were invested into a Sustainability Fund intended to help finance future projects and operations through earned interest. Currently, unrestricted assets and the Sustainability Fund, together termed the “cash reserve,” total over $500, 000, with the fund accounting for just over half of this total.

-101-
9. MEASURING PROGRESS TOWARDS A MORE SUSTAINABLE FRASER BASIN
9.1 A SNAPSHOT ON SUSTAINABILITY: STATE OF THE FRASER BASIN REPORT
To assess progress made towards achieving sustainability, FBC has worked for several years on developing a set of sustainability indicators. Sustainability indicators are tools that provide some insight on certain trends and help identify areas where progress is being made or where more change is required; they are not decisive measurements or solutions in and of themselves. Such indicators offer insight into the direction of a society’s pursuit of sustainability. In fact, FBC’s constitution requires regular reporting to basin residents on progress made in achieving sustainability.
In the fall of 2000, FBC initiated a process to identify indicators to be used in tracking and reporting on progress towards sustainability of the basin (FBC 2001). Between fall 2000 and spring 2001, FBC undertook a number of communication and consultation activities to raise awareness of the indicator initiative, and seek input on a draft set of indicators. Key communication and consultation initiatives included workshops held in each of the basin’s five regions, a survey to provide feedback on the draft indicators and indicators workshops held during the 2001 State of the Fraser Basin Conference.
Based on the feedback provided by FBC partners and the general public, a number of key messages emerged that helped guide FBC’s work in developing and utilizing these sustainability indicators (FBC 2001):
The indicators must appeal to government and non-government decision makers, and the general public.
Economic and institutional indicators need strengthening. Indicators must address both rural and urban perspectives. Support for fewer, rather than more, “primary” indicators was evident. Indicators should be reported on every three years. Indicator targets, along with interpretation of trends, should accompany reporting. Indicators reporting should lead to collaborative action. FBC should be prepared to play a role in facilitating action where trends suggest
significant sustainability challenges exist.
In 2002, FBC compiled and published a report entitled A Snapshot on Sustainability: State of the Fraser Basin Report, using a comprehensive list of indicators (FBC 2003b). The sustainability indicators, outlined in table 4.2, include over 30 items for measuring progress on achieving environmental, economic and social aspects of sustainability distributed across 16 broad categories. The subjects covered encompass not only the standard indicators, such as water quality, education levels and income levels, but also

-102-
provide innovative markers. Such innovative indicators include: the area of forestland certified as being sustainably managed; the number of treaties, protocols and other agreements signed with Aboriginal groups; and the level of volunteerism within the basin population. Most of these indicators could be categorized as specifically environmental, economic or social; the report attempts to strike a balance between these important elements of sustainability.
9.2 SCOPE AND LIMITATIONS OF THE SNAPSHOT REPORT
When producing the report, we learned that there is much we do not know. Sustainability trends are difficult to identify and additional information and analysis is required. In this process, the FBC is the general practitioner, not the specialist, and will facilitate dialogue among multiple interests to ensure that we continue to advance our understanding of areas where our sustainability knowledge is inconclusive.
While the report is founded on objective analysis of scientific and statistical information, it also endeavors to distil some key messages to make sustainability real for people in their homes, their communities and their organizations. Like any tool, indicators have limitations, but if used with care and attention, they can lead to constructive outcomes. The assessments of sustainability are only as good as the information they are based on. In some cases, we don’t have the information we would like to know; sometimes the best available information is not good enough.
There are several challenges in analyzing and reporting on sustainability trends on a regional basis over time due to a number of factors including: evolving knowledge and analytical methods; some data were unavailable for the Fraser Basin or its regions; changing resources for monitoring and analysis in different regions; and different administrative and physical boundaries for data collection; however, sustainability cannot wait for perfect knowledge. The FBC and many others are using the trends outlined in its first Snapshot report as a starting point for informed and broad-based dialogue, identification of key gaps in our knowledge and constructive action. Research and planning for the second Snapshot report is underway. In many cases, more recent data has become available, for example, from the most recent Canada census. After receiving extensive feedback on the first report, a number of new indicator topics have been added and much more regional information will be available in the second report.
The following discussion summarizes FBC’s first comprehensive report on the state of sustainability in the Fraser Basin—A Snapshot of Sustainability (FBC 2003b). While an attempt was made to provide indicator data going back to the 1980s, unfortunately, data for the pre-decentralization period are not available for all indicators in the report.
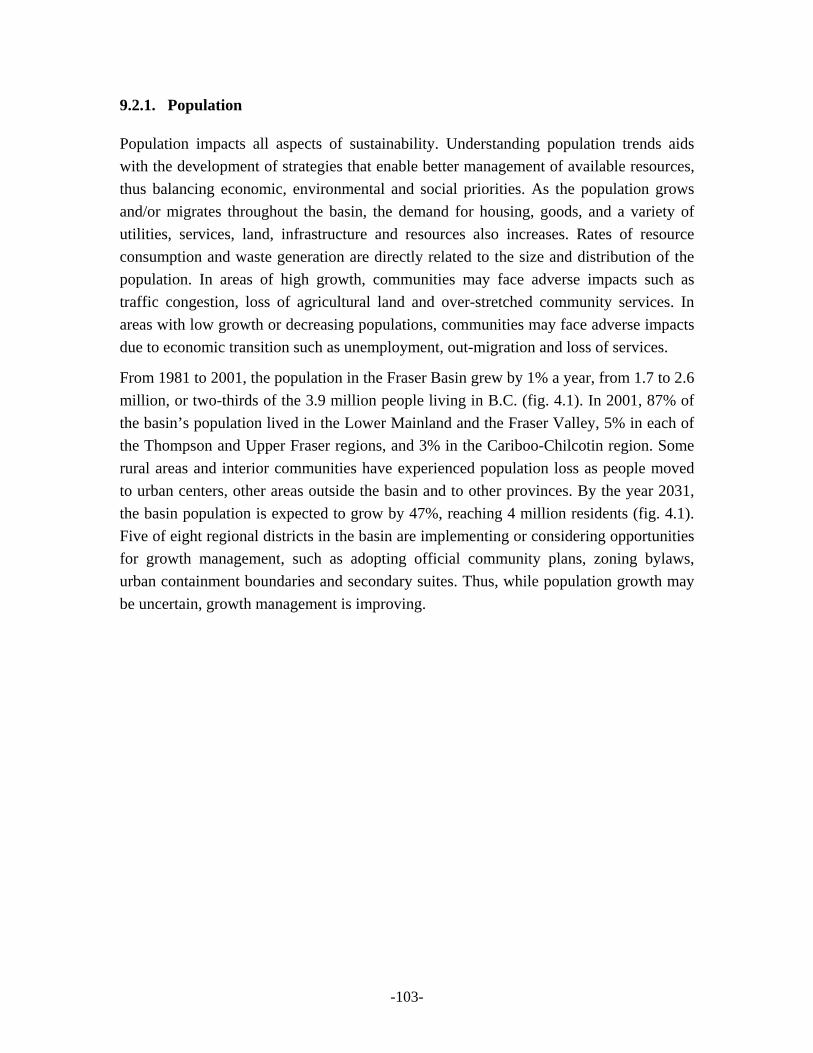
-103-
9.2.1. Population
Population impacts all aspects of sustainability. Understanding population trends aids with the development of strategies that enable better management of available resources, thus balancing economic, environmental and social priorities. As the population grows and/or migrates throughout the basin, the demand for housing, goods, and a variety of utilities, services, land, infrastructure and resources also increases. Rates of resource consumption and waste generation are directly related to the size and distribution of the population. In areas of high growth, communities may face adverse impacts such as traffic congestion, loss of agricultural land and over-stretched community services. In areas with low growth or decreasing populations, communities may face adverse impacts due to economic transition such as unemployment, out-migration and loss of services.
From 1981 to 2001, the population in the Fraser Basin grew by 1% a year, from 1.7 to 2.6 million, or two-thirds of the 3.9 million people living in B.C. (fig. 4.1). In 2001, 87% of the basin’s population lived in the Lower Mainland and the Fraser Valley, 5% in each of the Thompson and Upper Fraser regions, and 3% in the Cariboo-Chilcotin region. Some rural areas and interior communities have experienced population loss as people moved to urban centers, other areas outside the basin and to other provinces. By the year 2031, the basin population is expected to grow by 47%, reaching 4 million residents (fig. 4.1). Five of eight regional districts in the basin are implementing or considering opportunities for growth management, such as adopting official community plans, zoning bylaws, urban containment boundaries and secondary suites. Thus, while population growth may be uncertain, growth management is improving.

-104-
Table 4.2: Fraser Basin Council's Sustainability Indicators Used To Track Progress
CATEGORY WHY IS IT IMPORTANT FOR SUSTAINABILITY INDICATOR STATUS Population Growth Uncertain Population Rates of resource consumption and waste generation are directly
related to the size and distribution of the population Growth Management Getting BetterLife Expectancy Getting Better
Health Health is linked to the quality of the natural and human-made
environment, and is also a function of social and economic factors Leading Causes of Death Getting Worse/
Getting Better
Education Education contributes to individual and community strength,
helping people meet basic needs, and achieve social, economic and environmental goals.
Education Level Getting Better
Housing Housing influences health, well-being and economic stability Core Housing Need Getting WorseVolunteers Getting WorseCommunity
engagement The more involved individuals become in their community, the
more they are likely to connect with, and value, their community Voter Turnout Getting Worse
Aboriginal and Non-Aboriginal
Relationships
Building relationships between Aboriginal and non-Aboriginal communities and reconciling issues of Aboriginal self-determination will lead to more certainty and stability, as well as social, economic and environmental sustainability for all basin residents
Treaties, Protocols, Other Agreements Uncertain
Water Quality Trends Getting BetterWater Quality Clean water is important for supporting human health, agriculture, recreation, tourism, industry and a variety of other businesses Boil Water Advisories Getting Worse
Particulate Matter Getting BetterAir Quality
Human activities impact air quality, with direct links between air pollution and energy consumption, population growth, transportation and industry Smog and Other Air Pollutants Getting Worse
Fraser River Salmon Stocks Getting Worse/Getting Better
Species at Risk Uncertain Fish and Wildlife
Salmon carcasses supply nutrients to support the health of aquatic and terrestrial ecosystems and also have social and economic values
Trends in species at risk reflect the health of ecosystems Land use and protected area planning help to reduce conflict and
uncertainty as well as provide social, economic and environmental benefits including community development and employment
Protected Areas/Resource Management Getting Better
Average Household Income Getting BetterEmployment and Unemployment Getting BetterIncome and
Employment
Income and employment trends are related to social indicators such as health and education, and are linked natural resources availability Proportion of Low-income Families Getting Worse
Economic Diversification
A healthy economy helps to support many important public and private services, and programs for basin residents Diverse Employment Distribution Uncertain

-105-
Forest Sector Getting BetterCorporate Social Responsibility
Corporate social responsibility supports sustainability by addressing such issues as resource and energy use, generation of wastes, income, employment, health and education Other Sector Uncertain
Forest Cover Uncertain Forests and Forestry Forests provide clean water, fish and wildlife habitat, recreation opportunities, and various spiritual and cultural values Sustainable Forest Management Getting Better
Area in Agricultural Production Uncertain Agriculture
A reliable food supply is vital to community health and provides economic benefits such as employment opportunities, income and diversification Farm Economies Getting Better
Energy Consumption Getting WorseEnergy
Sources of energy and the rate of energy consumption can have a significant impact on the environment, causing air pollution, flooding of river valleys, and preventing fish and wildlife movement
Greenhouse Gas Emissions Getting Worse
Population Vulnerable Getting WorseFraser River Flooding
Among the risks of flooding are loss of life, injury, damage to property and infrastructure, disruption of business and community services, and disruption or loss of agricultural production Flood Management Getting Worse/
Getting BetterSource: FBC 2003b

-106-
Figure 4.1: Fraser Basin’s population growth. Historical data from 1986 to 2002, and projected growth from 2001 to 2031.
9.3 HEALTH
Human health is vitally linked to personal well-being and quality of life. A healthy population is better able to pursue its collective goals and aspirations, as well as to contribute to society. The quality of our natural and human-made environment has a significant impact on public health; therefore, important linkages are formed between health, air and water quality, solid and liquid waste management, pesticide management and recreational pursuits. Health is also a function of the social and economic environment. For example, human health is related to different social and economic opportunities, lifestyle choices and habits. A population’s health also has economic implications, particularly in relation to health care costs.
Life expectancy has increased steadily throughout the basin over the past ten years but variation among regions of the Fraser Basin is evident (fig. 4.2). For example, people living in the Greater Vancouver region can currently expect to live until the age of 80.3, while the Cariboo region has an average life expectancy of 77.5 years. Cancer is the leading cause of death in the basin, followed by heart and respiratory diseases. More than 45% of British Columbians are considered overweight; double the number in 1985. Moreover, child obesity has tripled since 1985, with more than 50% of the population age 12 and older not maintaining even minimal levels of physical activity, resulting in increased risk of heart disease, osteoporosis, stroke and type-2 diabetes. In 2001, basin residents reported themselves as being less healthy than they reported in 1994, with a 7% decrease in people who reported their health as being either excellent or very good. Thus, life expectancy is improving, while some leading causes of death are getting better and others are getting worse.
0
500,000
1,000,000
1,500,000
2,000,000
2,500,000
3,000,000
3,500,000
4,000,000
1986
1989
1992
1995
1998
2001
2004
2007
2010
2013
2016
2019
2022
2025
2028
2031
Years
Popu
latio
n
Total Population % Change
3%
1%2%
3%
1%Source: FBC 2003b: 4

-107-
Figure 4.2: Life Expectancy By Region From 1991 To 2001
9.4 EDUCATION
Learning and personal development is a continuous, life-long process for all people in the Fraser Basin. It is not limited to those enrolled in formal educational programs. Education is an important factor contributing towards individual and community strength, helping people meet their basic needs, and achieve their social, economic and environmental goals. Furthermore, early child development has significant implications for well-being. The first six years of a child's life are fundamental for learning, behavioral development and physical health throughout their lives. Education, along with life experience and personal values, contributes to a person’s involvement in their community and their understanding of sustainability. By contrast, a lack of education, skills and experience may limit opportunities for employment and financial security.
Educational levels in the basin have risen steadily between 1981 and 1996 (fig. 4.3). The proportion of the population in the basin with some level of post-secondary training rose from 43% to 55% between 1981 and 1996, while those with less than a grade 9 level of education decreased. The largest increase was with the number of people with university degrees, which grew by 73%. Education levels are similar in the different regions, although a higher concentration of people with post-secondary training and university-
74
75
76
77
78
79
80
81
1991 1996 2001
Year
Age
Greater Vancouver Fraser Valley Thompson Upper Fraser Cariboo
Source: FBC 2003b: 5

-108-
level education occurs in the Lower Mainland. Additionally, the student-teacher ratio in basin classrooms has increased slightly between 1997 and 2002, with 82% of school districts experiencing a 1% to 7% decline in the number of teachers. Clearly, education is improving in the Fraser Basin.
Figure 4.3: Basin Population By Level Of Educational Attainment From 1981 To 1996
9.5 HOUSING
Housing is a basic need for all residents of the basin and plays an important role in determining the quality of life for basin residents. The adequacy, suitability and affordability of housing influence the health, well-being and economic stability of individuals and families. Housing is also part of the broader issue of land-use planning, and it may contribute to efficient, compact, multi-use neighborhoods that are transit and pedestrian friendly. Alternatively, urban sprawl can result in a loss of green space and/or agricultural lands, increased traffic congestion and higher development costs associated with utility and transportation infrastructure. Moreover, housing relates to environmental sustainability in terms of “green building” concepts such as energy efficient housing designs and environmentally friendly building materials.
In 1996, 80% of households in B.C. had met or exceeded their housing needs; however, 20% were in a state of “core housing need.” Core housing need represents households
Source: FBC 2003b: 6
0
50
100
150
200
250
300
350
400
450
500
1981 1986 1991 1996Year
Popu
latio
n (0
00's
)
University Other non-university Trade certificate/ diplomaGr. 9-12 with certificate Gr. 9-12 without certificate Less than Gr. 9

-109-
that cannot access dwellings that are adequate in condition and suitable in size without spending 30% or more of total before tax household income on their shelter, a rate which is above the accepted affordability norm. This level of need represented an increase of 3% between 1991 and 1996 (fig. 4.4). Many rural regions experienced larger increases, including the Thompson (8% increase), Fraser Valley (7% increase) and Cariboo (6% increase) regions (fig. 4.4). The greatest housing need is among renting households (36% in 1996) rather than owner-occupied households (10% in 1996). Local governments in urban areas are using a variety of tools, such as urban containment and secondary suites, to encourage more compact communities and minimize the impacts of urban sprawl, thus, supporting more sustainable urban development. However, core housing need is still worsening.
Figure 4.4: Households In Core Housing Need By Tenure And Region For 1991 And 1996
9.6 COMMUNITY ENGAGEMENT
Community engagement is at the core of community sustainability and includes volunteerism, voting, charitable donations and participation in a variety of community planning and decision-making processes. Community engagement is central to a well-functioning, democratic society. The more involved individuals become in their community, the more they are likely to connect with, and value, their community. Community engagement is about members of a community participating in the decisions and actions that help shape their community.
22% 24
% 25%
29%
34%
33%
32% 35
%
40%
36%
36%
7%
5% 5% 5%
8% 7%7%
10% 11
%
10% 10%
10%
40%
0%
5%
10%
15%
20%
25%
30%
35%
40%
Upper Fraser Cariboo Thompson Fraser Valley GreaterVancouver,Squamish,Pemberton
Fraser BasinTotal
Fraser Basin Regions
% H
ouse
hold
s in
Cor
e H
ousi
ng N
eed
renters 1991 renters 1996 owners 1991 owners 1996
Source: FBC 2003b: 7

-110-
People in B.C. communities volunteered less in 2000 than in 1997 (fig. 4.5 (a)). The volunteer rate in B.C. was slightly below the Canadian average in 2000, although the average number of hours put in by each volunteer was considerably higher in B.C. (fig 4.5 (b)). A large proportion of B.C. volunteers come from rural areas of the province (relative to the population). Since the mid-1980s, voter turnout to both provincial and federal elections has dropped from 78% to 71% and 78% to 63%, respectively (fig. 4.6). Consequently, community engagement, as measured by volunteerism and voter turnout, is declining.
Figure 4.5: Volunteer Rates And Average Number Of Hours Volunteered For 1997 And 2000
(b) Average Number of Houres Volunteered
BC169
BC169
Canada162
Canada149
135
140
145
150
155
160
165
170
175
1997 2000Year
Ave
rage
# H
ours
Source: FBC 2003b: 8
(a) Volunteer Rates
BC26%
BC32%
Canada27%
Canada31%
0
5
10
15
20
25
30
35
1997 2000Year
Perc
ent o
f Pop
ulat
ion

-111-
Figure 4.6: B.C. Voter Turnout To Federal (1984 – 2000) And Provincial Elections (1983 – 2000)
9.7 ABORIGINAL AND NON-ABORIGINAL RELATIONSHIPS
Building relationships between Aboriginal and non-Aboriginal communities and reconciling issues of Aboriginal self-determination will lead to more certainty and stability, as well as social, economic and environmental sustainability for all basin residents. The history of Aboriginal people and culture, and the historical interaction between Aboriginal and non-Aboriginal communities, provides an important context to current efforts to build relationships and advance self-determination. The Constitution Act 1982, of Canada and recent legal decisions such as Sparrow (1990), Delgamuukw (1997) and Haida Gwaii (2002) support the need for constructive relationships and Aboriginal self-determination. Although many issues remain unclear, important considerations include fiduciary responsibility, accommodation, consultation, compensation, infringement and the roles of parties other than the Crown.
Aboriginal self-determination is a central component of constructive relationships and refers to the ability of Aboriginal people to exercise their rights and implement their vision of a sustainable future. Constructive relationships and Aboriginal self-determination can be advanced through a variety of means including community-based initiatives, government policies and programs, legal claims, treaties, protocols and cooperative agreements among communities, governments, businesses and other organizations. The B.C. Treaty Commission (B.C. TC) process is one mechanism to settle issues relating to Aboriginal self-determination. Currently, 53 of the 198 First Nations in B.C. are involved in the treaty process (~70% of the First Nations population)
20001996
1991
19861983
2000
1997
1993
19881984
62%
64%
66%
68%
70%
72%
74%
76%
78%
80%
1983 1986 1991 1996 2000
Election Years
Perc
ent o
f Pop
ulat
ion
Provincial FederalSource: FBC 2003b: 8

-112-
(FBC 2003: 9). In 2001, 42 First Nations were at Stage 4 (Agreement In Principle) of a six-stage process. In the Fraser Basin, 17 of 91 First Nations are part of the B.C. TC process; 13 of these have reached Stage 4. Significantly, though, many First Nations in the basin have chosen not to participate in the B.C. TC process. Thus, the status of Aboriginal and non-Aboriginal relationships remains uncertain.
9.8 WATER QUALITY
Water is a necessity for all life and safe drinking water is vital to human health. An adequate supply of clean water is important for supporting agriculture, recreation, tourism, industry, and a variety of small- and medium-sized businesses. Water quality is also important for maintaining healthy ecosystems including fish and wildlife and their associated habitat. Measures of drinking water quality may also reflect the effectiveness of drinking water protection policies, management practices and treatment systems throughout the basin.
Among the 35 water bodies monitored between 1985 and 2000, 19 sites (54%) demonstrated no detectable change in quality, 11 sites (31%) displayed an improvement in water quality, and five sites exhibited deteriorating quality (fig. 4.7). The number of boil-water advisories issued per year in the basin has more than doubled from 1995 to 2002, increasing from 65 advisories to 134 by April 2002 (fig 4.8). The Thompson and Fraser Valley regions had the greatest number of advisories issued, while the Cariboo region had the fewest. A “boil water” advisory is issued when a drinking water source is contaminated or has a known risk of contamination. Advisories consider water source quality, distribution and filtration processes; therefore, the number of boil-water advisories issued reflects both the quality of drinking water sources within the basin as well as the adequacy of systems to provide clean water. Since 1990, the Fraser Basin has experienced four confirmed and three suspected waterborne disease outbreaks (25% of the 16 outbreaks in B.C.). Thus, water quality in the basin is improving, but the number of boil-water advisories is worsening.

-113-
Figure 4.7: Water Quality Trends For The Basin And Its Five Regions
Figure 4.8: Number Of Basin And Regional Boil-Water Advisories From 1995 To 2002
Some recent advances in water quality protection in the Fraser Basin include a substantial investment in water and sewage treatment facilities. In 1995, the provincial government and the GVRD came to a cost-sharing agreement, in conjunction with earlier approved federal funds, that allowed completion of the upgrades from primary to secondary treatment at the Annacis Island Wastewater Treatment Plant (WWTP) in 1998 (FBMB 1996). As well, the GVRD approved a further $113 million for upgrading the Lulu Island
0
20
40
60
80
100
120
140
Jun-95 Oct-96 Oct-97 Nov-98 Dec-99 Dec-00 Oct-01 Apr-02
Date
Num
ber o
f Boi
l-Wat
er A
dvis
orie
s
Greater Vancouver Fraser Valley Thompson Upper Fraser Cariboo Total
0
2
4
6
8
10
12
14
16
18
20
GreaterVancouver
Fraser Valley Upper Fraser Thompson Cariboo Basin TotalsRegion
Num
ber o
f Wat
er B
odie
s
Deteriorating No Change Improving
Source: adapted from FBC 2003b: 10
Source: FBC 2003b: 10

-114-
WWTP, also completed in 1998 (FBMB 1996). It is estimated that these upgrades combined to reduce biochemical oxygen demand of treated effluent by 85-90% and total suspended solids by 75%.
Furthermore, pulp mills spent invested some $1 billion in new technologies to meet new requirements (FBMB 1995). In 1990 and 1992, the provincial and federal enacted regulations requiring pulp mills to eliminate dioxins and furans from their bleaching process effluents. Today, the pulp mills have achieved a 98% reduction of dioxins in the effluent of seven pulp mills in the basin (FBC 2003b).
9.9 AIR QUALITY
Each of us breathes over 11,000 liters of air each day, making air quality a critical part of human health. A wide range of human activities impact air quality, with direct links between air pollution and energy consumption, population growth, transportation and industry. Many air pollutants have been associated with increases in a variety of respiratory diseases (e.g., asthma, bronchitis, emphysema and lung cancer) and cardiac diseases (e.g., heart attacks and stroke). Particulate matter consists of microscopic particles in the air that can be inhaled deep into our lungs, generally referred to as PM10, particles less than 10 micrometers in size. Particulate matter is of particular concern for children, the elderly and those with respiratory diseases such as asthma. Social and economic systems, such as health care costs, may also be affected by poor air quality.
Average air quality in the Fraser Basin is improving, yet sometimes air pollution reaches a level known to have human health risks. In terms of direct impact on people’s health, fine particulate matter has been identified as the most serious form of air pollution in B.C. Since 1994, levels of particulate matter have generally improved in the Fraser Basin. In 2000, three of the 15 Fraser Basin communities monitored were exposed to health risks from particulate matter more than 15% of the time, and seven at least 5% of the time (fig. 4.9). In addition to particulate matter, ground-level ozone (GLO), nitrogen oxides, carbon monoxide and volatile organic compounds (VOCs) all influence the quality of air in the basin. VOCs and nitrogen oxides react in the presence of sunlight to form GLO, which is associated with a range of health problems and vegetation damage. GLO levels have increased slightly over the last ten years in the Fraser Valley, Greater Vancouver and Cariboo regions. While particulate matter concentrations are improving, other air pollutants are worsening.

-115-
Figure 4.9: Percent Of Time Communities Are Exposed To PM10 Greater Than 25 Micrograms/M3
9.10 FISH AND WILDLIFE 9.10.1. Fraser River Salmon Stocks
Salmon play an important role in complex ecosystems. When salmon return to spawn, their carcasses supply nutrients to support the health of both aquatic and terrestrial ecosystems. Salmon are also valued on many social and economic levels. Commercial and recreational fisheries realize benefits from salmon, while tourism and recreation often involve interactions with salmon and their habitat. Moreover, salmon provide an important contribution to First Nations’ communities, supplying food and supporting cultural and spiritual values. Salmon abundance is influenced by many factors such as the health and productivity of freshwater and ocean environments, harvesting and enhancement efforts. Estimates of salmon abundance are also significantly affected by survey methodologies. With limited available data, scientists and managers are therefore cautious about making a direct connection between trends in salmon abundance and ecosystem health or management practices.
The number of salmon returning to spawn in the basin increased in half of the rivers and streams assessed when comparing the average of the past decade to the long-term average. Rivers and streams in the Cariboo-Chilcotin and Upper Fraser watersheds exhibited the greatest improvements while those in lower Fraser, Squamish and Thompson watersheds exhibited the greatest declines (fig. 4.10). Among salmon species, coho declined the most and pink declined the least (fig. 4.11). All trends in Fraser River salmon stocks are difficult to confirm due to data limitations. Thus, some Fraser River salmon stocks are worsening and others are improving.
Source: FBC 2003b: 11
20.1%
4.4%
10.3%
4.7%
11.5%
5.8%
18.8%
25.6%
14.5%
0% 5% 10% 15% 20% 25%
Prince George
Kamloops
Squamish
Burnaby South
Mission
Chilliwack
Williams Lake
Quesnel
100 Mile House
% of Time Exposed

-116-
Figure 4.10: Status of salmon stock escapement by area (recent vs. historical records)
Figure 4.11: Status Of Salmon Stock Escapement Levels By Species (Recent Vs. Historical Records)
9.10.2. Species at Risk
Fish and wildlife are key components of the ecosystems in which humans also live, and trends in species at risk reflect the health of these ecosystems. Diverse and viable populations of fish and wildlife contribute to human economic and social well-being because they support a variety of aesthetic, cultural and spiritual values, and also provide the basis for industry, tourism and many recreational pursuits, such as photography, fishing and hunting. A diverse ecosystem also confers health benefits and may provide an important buffer against major disturbances such as disease outbreaks and climate change. Human activities may often have adverse impacts on fish, wildlife and their habitats, and it is necessary to manage these impacts to protect ecosystem health and
Source: FBC 2003b: 14
Source: FBC 2003b: 14
0%
20%
40%
60%
80%
100%
Upper Fraser Cariboo-Chilcotin
Mid Fraser Thompson Squamish Lower Fraser
Areas
Perc
ent o
f Sto
cks
Ass
esse
d
Increasing Unknown Decreasing
0%
20%
40%
60%
Chinook Chum Coho Pink SockeyeSalmon Species
Perc
ent o
f Sto
cks
Ass
esse
d
Increasing Decreasing Extreme Decline (>80%) Unknown

-117-
ensure that the social, economic and environmental benefits of healthy ecosystems are maintained.
About one in 10 vertebrate species that live in the Fraser Basin is “red-listed”, meaning they have exhibited significant declines in population abundance. Red-listed species are indigenous species that are “legally designated under the provincial Wildlife Act as extirpated (locally extinct), threatened, endangered or likely to become endangered if limiting factors are not reversed.” Another one in 10 vertebrate species in the basin are “blue-listed” and although these species are not considered to be immediately threatened, they are designated as “vulnerable or of concern because of characteristics that make them particularly sensitive to human activities or natural events.” Of the 111 red-listed vertebrate species that live in B.C., 47 (42%) are present in the Fraser Basin. Currently, the status of species at risk is uncertain.
9.10.3. Protected Areas and Resource Management Planning
Significant effort has been exerted over the past decade to better plan and manage the basin’s land and resources supporting both economic development and the conservation of fish, wildlife and habitat. Land use and protected area planning help to reduce conflict and uncertainty as well as provide social, economic and environmental benefits including community development and employment and income from forestry and mining, recreation and tourism. Initiatives of note include the land and resource management planning processes (LRMPs) and the Protected Areas Strategy. Protected areas help to conserve ecological and cultural heritage by identifying wildlife management zones where management practices can be applied to sustain ecological values, while LRMPs direct the management of lands and resources on Crown lands.
Strategic land use plans have been advanced on a majority of the Crown land in the Fraser Basin. Between 1991 and 2002, the total land area with protected area status in the Fraser Basin increased from 7% to 13%, for a total of over three million hectares in 2002. There were significant increases in protected land area in each of the basin’s five regions of the basin over this period; however, several eco-sections are currently under-represented by current protected areas. Overall, though, the status of protected areas and resource management is improving.
9.11 INCOME AND EMPLOYMENT
Sufficient income to meet household needs is critical for individual, family and community well-being. Employment is the primary mechanism by which people derive income and participate in the economy. Changes in income and employment levels can

-118-
also be linked to the availability of natural resources, including steps taken to ensure the sustainability of resources. Income and employment trends can be strongly related to other social indicators including health and education. Many rural regions and their communities continue to face employment challenges that are linked to economic trends in various resource sectors, particularly downturns in mining, forestry and fisheries.
Average household incomes have increased steadily in the Fraser Basin, almost doubling between 1981 and 1996; however, once adjusted for inflation, the increase is only 8.3%. Most income (78%) is derived from employment earnings, with 12% from government transfers (i.e., pensions, welfare, etc.) and a further 10% from other sources. From 1981 to 1996, the proportion of low-income families increased marginally basinwide to 22%, with the Greater Vancouver-Squamish-Pemberton region experiencing a 23% increase. Apart from mining, the numbers of people employed in all sectors of the economy have increased, and the unemployment rate since 1981 dropped from 12.8% to 9.5%. Hence, average household incomes and unemployment rates are improving, but the proportion of low-income families is worsening.
9.12 ECONOMIC DIVERSIFICATION
Economic diversification is an important measure of economic health and community stability, resilience and sustainability. A healthy economy helps to support many important public and private services, and programs for basin residents. Diversified economies are based on a variety of sectors, resources and services, and provide a range of social, economic and environmental benefits. A sustainable economy is built by managing local, regional and global economic resources and activities in a way that meets current needs without diminishing opportunities for future generations. A diverse economy is one of the primary means of ensuring that changes in these resources and activities can be adjusted to and managed effectively. Diverse economies help to ensure reduced reliance and impact on any one resource, industry or service.
In 1996, the majority of employment in the basin came from the community, business and personal services (CBPS) (39% of total employment), retail trade (12%) and manufacturing (11%) sectors. Based on measures of employment distribution among sectors, the basin’s economy was less diversified in 1996 compared to 1981; however, it should be noted that several individual sectors such as CBPS may have become more diversified due to the emergence of new technology, innovation and consulting services. The CBPS sector accounted for the highest amount of employment and employment growth in the basin, as well as each of its regions, increasing from 30% to 39% of total employment between 1981 and 1996. During this period, the proportion of total basin

-119-
employment provided by almost every other sector declined. The proportion of total employment provided by the manufacturing sector decreased from 15% to 11% between 1981 and 1996. Total employment provided by the government services sector also dropped slightly from 6% to 5%. Currently, the status of economic diversification is uncertain.
9.13 CORPORATE SOCIAL RESPONSIBILITY
Business provides an important contribution to social and economic well-being by employing people and generating wealth in the community. Corporate social responsibility (CSR) refers to an organization’s policies and continuous actions in such areas as employee relations, diversity, community development, environment, international relationships, marketplace practices, fiscal responsibility and accountability. The concept of corporate social responsibility is consistent with and supportive of sustainability goals and addresses a number of sustainability issues including resource and energy use, generation of wastes, income, employment, health, education and other social, economic and environmental challenges. Both concepts are premised on the idea that long-term economic prosperity, environmental stewardship and social well-being are mutually supportive, not conflicting, goals.
Research suggests that most Canadians expect companies to contribute to societal well-being, and they support companies that do. In a 1997 poll, 77% of respondents agreed that companies have a commitment to society. Eight in ten respondents stated they try to buy from companies that are good corporate citizens. As such, many companies find bottom-line benefits to CSR, such as becoming more efficient; reducing costs; developing positive working relationships with employees, stakeholders and shareholders; and achieving competitive advantage in the marketplace.
To understand the extent to which CSR is being implemented in the basin, research was undertaken on 17 companies, including six forestry companies and 11 other companies representing a variety of economic sectors. The businesses considered were large, publicly traded companies located and operating within the Fraser Basin with readily available information. A variety of criteria were considered in relation to six key components of CSR: community, employees, customers, suppliers, the environment and shareholders.
The forest sector, in recent years, has expended considerable effort to operationalize the principles of CSR, including efforts by companies to achieve sustainable forest management certification. Research on six forest companies and 11 other companies in B.C. found the forestry industry to be relatively advanced, compared to other sectors, in

-120-
terms of implementing CSR, particularly for environmental criteria. All six companies researched have an environmental policy; five of the six have independent environmental audits, and four of these provide environmental training for their employees. Only two companies offer Employee Assistance Programs and policies for hiring/contracting to First Nations; only one of the six companies has either a code of ethics or a social/ethics audit; and only one offers profit sharing options to their employees or retraining in the case of layoffs. Research on the 11 additional companies involved a broad cross-section of other sectors including financial services, retail trade, mining, energy, communications and agriculture. Similar to the forest sector, environmental criteria were implemented most frequently. Collectively, these companies outperformed the forest companies in employee, customer and supplier criteria. Five of the 11 companies were implementing at least one of the community criteria. Overall, forestry companies are improving their CSR, while the status of other sectors remains uncertain.
9.14 FORESTS AND FORESTRY
The basin’s forests provide many social, economic and environmental benefits, such as clean water, fish and wildlife habitat, recreation opportunities, and various spiritual and cultural values. Many communities and workers are highly dependent on the economic contributions of the forest sector. Significant job losses have already been experienced within the forest sector and more are expected as a result of restructuring in the industry, the softwood lumber dispute with the U.S.A. and related mill closures. Forest sustainability includes the biodiversity of forest stands (e.g., forest species and age classes), the diversification of forest product development, public involvement in forest management and the long-term health of forests.
Of the 23 million hectares of land in the basin, 74% is covered with a diversity of forests, most in the upper Fraser, Cariboo and Thompson regions. About 51% of basin forests are between 21 and 140 years old, 37% are older than 140 years and 12% are younger than 21 years. Virtually every major B.C. forest company has achieved or is pursuing third-party Sustainable Forest Management certification. About eight million hectares of Fraser Basin forests have been certified by either the Sustainable Forest Initiative (SFI) or Canada Standards Association (CSA) certification standards, while over eight million hectares have achieved the ISO 14001 standard (fig. 4.12). The status of forest cover in the basin is uncertain, but sustainable forest management practices are clearly improving.

-121-
Figure 4.12: Cumulative area certified or registered in the Fraser Basin by standard from 1999 - 2002
9.15 AGRICULTURE
The area of land in agricultural production in the Fraser Basin increased by 15% between 1986 and 1996 (fig. 4.13). Most significant increases occurred in the Cariboo region, with a 42% increase; however, the lower Fraser region experienced a 9% reduction in productive farm area. Between 1974 and 1999, the Agricultural Land Reserve (lands set aside by provincial statute for agricultural uses) decreased marginally in all regions of the Fraser Basin, except the upper Fraser, by a total of about 0.1%. In 1996, the Fraser Basin produced 78% of B.C.’s total net farm income; about 95% of this net income was earned in the lower Fraser region (fig. 4.14). Net farm income for the Fraser Basin increased by 184% between 1986 and 1996, with the greatest increases occurring in the Thompson region (705%) and the lower Fraser region (166%). While the status of area in agricultural production is uncertain, farm economies are clearly improving.
Source: FBC 2003b: 19
0
10
20
30
40
50
60
70
80
90
1999 2000 2001 2002Year Certified
Are
a C
ertif
ied
(100
,000
s of
hec
tare
s)
ISO: 8,100,000 ha
FSC: 1300 ha
SFI: 4,500,000 ha
CSA: 2,130,000

-122-
Figure 4.13: Percent Increase In Productive Agricultural Land In The Fraser Basin From 1986 - 1996
Figure 4.14: Net Farm Income In The Fraser Basin From 1986 - 1996
9.16 ENERGY
A safe, reliable, affordable energy supply supports strong communities and vibrant economies. Nonrenewable energy sources such as oil, natural gas and coal are depleted with use, while renewable sources such as hydroelectricity, solar, wind and tidal power provide energy in perpetuity, and are thus more sustainable. Sources of energy and the rate of energy consumption can have a significant impact on the environment, causing air pollution, flooding of river valleys and preventing fish and wildlife movement. Furthermore, the combustion of fossil fuels is a major source of greenhouse gas (GHG) emissions and air pollution. A majority of scientists have concluded that greenhouse gas
-20
0
20
40
60
80
100
120
140
160
Year
Net
Far
m In
com
e ($
mill
ions
)
Cariboo & Upper Fraser Thompson Lower Fraser
1986 1991 1996
-10%
0%
10%
20%
30%
40%
50%
BritishColumbia
Fraser RiverBasin
Upper Fraser Cariboo Thompson Lower Fraser
Fraser Basin Regions
Perc
ent I
ncre
ase
Source: FBC 2003b: 20
Source: FBC 2003b: 20

-123-
emissions from human activity are resulting in changes to the earth's climate, with a variety of adverse impacts.
British Columbians consumed 1,145 petajoules of energy in 1999, an increase of 28% since 1981 (fig. 4.15). About two-thirds of the total energy consumed was produced from petroleum and natural gas sources, while hydroelectricity and alternative energy sources, including biomass, each provided about 18%. Between 1981 and 1999, natural gas consumption increased by 77% and hydroelectricity consumption increased by 34%. Total GHG emissions in B.C. increased by 25% between 1990 and 2000 (fig. 4.16). In 2000, over 80% of the GHG emissions in B.C. were related to energy production and use, with the transportation sector (cars, trucks, rail, marine, etc.) accounting for approximately half of the increase. The growth in population observed between 1990 and 2000 (23%) had a strong influence on both energy consumption and increases in total GHG emissions (25%). Clearly, both energy consumption and GHG emissions are increasing in the basin.
Figure 4.15: Energy Consumption In B.C. By Source From 1982 - 1998
0
200
400
600
800
1,000
1,200
1,400
1982 1984 1986 1988 1990 1992 1994 1996 1998Year
Ener
gy C
onsu
med
(Pet
ajou
les)
Total Energy Petroleum Natural GasCoal & Coke Hydro Alternative Energy
Source: FBC 2003b: 21

-124-
Figure 4.16: Greenhouse Gas Emissions In B.C. From 1990 – 2000
9.17 FRASER RIVER FLOODING
Flooding can impact economic, social and environmental dimensions of sustainability. Among the risks are loss of life, injury, damage to property and infrastructure, disruption of business and community services, and disruption or loss of agricultural production. A significant flood would likely disrupt major utilities, transportation and trade corridors, including the Trans Canada Highway, railways, ports and the Vancouver International Airport, adversely impacting the regional, provincial and national economies. A major flood event also poses a risk of contaminating all groundwater wells located within the floodplain. Global climate change may exacerbate Fraser River flood risks.
Scientists predict the chances of a record Fraser River flood occurring in the next 60 years are one in three, and could happen in any year. The Fraser River experienced devastating floods in 1894 and 1948, with high flood threats in 1997 and 1999. Many of the basin’s communities are partly vulnerable to Fraser River flooding, particularly in the Fraser Valley, Greater Vancouver and Thompson regions, but also in the Cariboo and Upper Fraser regions. In 2001, almost 327,000 people lived in more than 100,000 homes within the floodplain of the lower Fraser River; a 168% increase between 1981 and 2001. Potential costs from the next Fraser River flood of record, if major dyke failures occurred, could reach more than $2 billion in direct damages. This level of damage represents at least a 14-fold increase since the last great Fraser River flood in 1948. More than three-quarters of all communities that responded to a recent B.C. Ministry of Water, Land and Air Protection survey had floodplain maps, flood provisions in their official community plans and flood protection works. Almost 90% of respondents had developed
0
10
20
30
40
50
60
70
1990 1991 1992 1993 1994 1995 1996 1997 1998 1999 2000
Year
GH
G E
mis
sion
s (m
egat
onne
s 00
0s)
GHG Totals Emissions from Energy Consumption Emissions from Transport Source: FBC 2003b: 21

-125-
emergency response plans However, some communities in the floodplain have inadequate flood protection works that do not meet the provincial design standard based largely on the flood of record. For example, over half of the 118 kilometers of dykes from Hope to Mission are considered too low, with about 17% low by more than 0.4 meters, due in part to changes in river alignment and sediment deposition. Thus, the population vulnerable to Fraser River flooding is increasing, and flood management practices are improving in some areas but likely worsening in other areas.

REFERENCES Andrews, W. J., J. W. Higham, and R. L. Sherwood. 1986. Protecting the B.C. Environment:
A Catalogue of Project Review Processes. Vancouver, B.C.: Environment Canada.
British Columbia Ministry of Environment, Lands and Parks (B.C. MELP). 1996. British Columbia Water Quality Status Report. Victoria, B.C.: Queen’s Printer for B.C.
British Columbia Ministry of Environment, Lands and Parks (B.C. MELP). 2000. Water Quality Trends in Selected British Columbia Waterbodies. Victoria, B.C.: Queen’s Printer for B.C.
British Columbia Ministry of Forests. 1988. Biogeoclimatic Zones of British Columbia. Map-BC553. Victoria, B.C.: Ministry of Forests
British Columbia Ministry of Forests. 1984. 1984 Forest and Range Resource Analysis. Victoria, B.C.: Ministry of Forests.
British Columbia Ministry of Water, Land and Air Protection (B.C. MWLAP). 2002. Environmental Trends in British Columbia. Victoria, B.C.: Queen’s Printer for B.C.
Barrons, J. F. 1989. Water Resources Planning in the Fraser River Basin: An Assessment of the Principles in Practice 1948-1989. Unpublished MS Thesis. Scholl of Community and Regional Planning, The University of British Columbia.
Boeckh, Ian, Victoria S. Christie, Anthony H. J. Dorcey, and Harriet I. Rueggeberg. 1991a. “Water Use in the Fraser Basin” in Water in Sustainable Development: Exploring Our Common Future in the Fraser River Basin Vol. II, pgs 181-200. Ed. Anthony H. J. Dorcey and Julian R. Griggs. Vancouver B.C.: Westwater Research Centre, University of British Columbia.
Boeckh, Ian, Victoria S. Christie, Anthony H. J. Dorcey, and Harriet I. Rueggeberg. 1991b. “Human Settlement and Development in the Fraser Basin” in Water in Sustainable Development: Exploring Our Common Future in the Fraser River Basin Vol. II, pgs. 145-172. Ed. Anthony H. J. Dorcey and Julian R. Griggs. Vancouver B.C.: Westwater Research Centre, University of British Columbia.
Campagnolo, Iona. 2001. Chair Iona Campagnolo’s Final Fraser Basin Council Operations Committee Report – 31 August 2001. Vancouver, B.C.: Fraser Basin Council.
Canada. Fisheries and Oceans Canada. 1998. Review of the Fraser River Action Plan. Prepared by Aquatic Resources Limited for the Review Directorate. Ottawa: Fisheries and Oceans Canada. <Online: www.dfo-mpo.gc.ca/communic/cread/reports/98-99/fraser/fraser_e.pdf; accessed 21 June 2004.>
Dale, Norman G. 1991. “The Quest for Consensus on Sustainable Development in the Use and Management of Fraser River Salmon,” in Water in Sustainable Development: Exploring Our Common Future in the Fraser River Basin Vol. I, pgs. 155-188. Ed. Anthony H. J. Dorcey. Vancouver B.C.: Westwater Research Centre, University of British Columbia.
Dorcey, Anthony H. J. 1990. Sustainable Development of the Fraser River Estuary: Success Amidst Failure. Paper prepared for Coastal Resources Management Group, Environment Directorate, OECD, Paris.
Dorcey, Anthony H. J. 1991. “Water in the Sustainable Development of the Fraser River Basin,” in Water in Sustainable Development: Exploring Our Common Future in the Fraser River Basin Vol. II, pgs 3-20. Ed. Anthony H. J. Dorcey and Julian R. Griggs. Vancouver B.C.: Westwater Research Centre, University of British Columbia.
Dorcey, Anthony H. J., Ed. 1991. Water in Sustainable Development: Exploring Our Common Future in the Fraser River Basin Vol. I. Vancouver B.C.: Westwater Research Centre, University of British Columbia.
Dorcey, Anthony H. J. and Julian R., Griggs, Eds. 1991. Water in Sustainable Development: Exploring Our Common Future in the Fraser River Basin Vol. II. Vancouver B.C.: Westwater Research Centre, University of British Columbia.
Duff, W. 1952. The Upper Stalo Indians of the Fraser River of B.C. Victoria, B.C.: Provincial Museum.
Fraser River Board. 1956. Investigations into Measures for Flood Control in the Fraser River Basin: Interim Report. Victoria, B.C.: Queen’s Printer for B.C.
Fraser Basin Council (FBC). 1997. The Charter for Sustainability. Vancouver, B.C.: Fraser Basin Council.
Fraser Basin Council (FBC). 1999. Annual Report 1998 – 1999. Vancouver, B.C.: Fraser Basin Council.
Fraser Basin Council (FBC). 2000. Annual Report 1999 – 2000. Vancouver, B.C.: Fraser Basin Council.
Fraser Basin Council (FBC). 2001. Sustainability Indicators for the Fraser Basin: Consultation Report. Vancouver, B.C.: Fraser Basin Council.
Fraser Basin Council (FBC). 2002. Annual Report 2001 – 2002. Vancouver, B.C.: Fraser Basin Council.
Fraser Basin Council (FBC). 2003a. Annual Report 2002 – 2003. Vancouver, B.C.: Fraser Basin Council.
Fraser Basin Council (FBC). 2003b. A Snapshot on Sustainability: State of the Fraser Basin Report. Vancouver, B.C.: Fraser Basin Council.
Fraser Basin Management Board (FBMB). 1995. FBMB Report Card: Assessing Progress Towards Sustainability in the Fraser Basin. Vancouver, B.C.: Fraser Basin Management Program.
Fraser Basin Management Board (FBMB). 1996. FBMB Report Card: Assessing Progress Towards Sustainability in the Fraser Basin. Vancouver, B.C.: Fraser Basin Management Program.
Fraser River Joint Advisory Committee. 1979. Fraser River Upstream Storage Review Report. Victoria, B.C.: Queen’s Printer for B.C.
Fraser River Estuary Management Program (FREMP). 1996. The Fraser River Estuary. Environmental Quality Report. Burnaby, B.C.: Fraser River Estuary Management Program.
French, T. D. and P. A. Chambers. 1995. Nitrogen and Phosphorus in the Upper Fraser River in Relation to Point and Diffuse Source Loadings. DOE FRAP 1995-09. Vancouver, B.C.: Environment Canada, Fraser River Action Plan.
Gale, Robert J.P. 1997. Canada's Green Plan, pp. 97–120 in Nationale Umweltpläne in ausgewählten Industrieländern (A Study of the Development of a National Environmental Plan with expert submissions to the Enquete Commission 'Protection of People and the Environment' for the Bundestag [German Parliament]), Berlin: Springer-Verlag. <Online: www.ecological-economics.org/pages/greenplan.pdf; accessed 21 June 2004.>
Government of Canada. 1990. Canada's Green Plan for a Healthy Environment. Ottawa: Minister of Supply and Services Canada.
Government of Canada. 2003. Water and Canada: Preserving a Legacy for People and the Environment. Ottawa: Queen’s Printer for Canada.
Hall, Kenneth J., Hans Shreier, and Sandra J. Brown. 1991. “Water Quality in the Fraser River Basin,” in Water in Sustainable Development: Exploring Our Common Future in the Fraser River Basin Vol. I,. pgs. 41-76 Ed. Anthony H. J. Dorcey and Julian R. Griggs. Vancouver B.C.: Westwater Research Centre, University of British Columbia.
Klohn Leonoff Ltd. 1989. Floodplain Management Plan. Engineering Studies. District of Abbotsford. Richmond, B.C.: Klohn Leonoff Ltd.
Kew Micheal J. E. and Julian R. and Griggs. 1991. “Native Indians of the Fraser Basin: Towards a Model of Sustainable Resource Use,” in Water in Sustainable Development: Exploring Our Common Future in the Fraser River Basin Vol. I, pgs. 17-48. Ed. Anthony H. J. Dorcey. Vancouver B.C.: Westwater Research Centre, University of British Columbia.
Marshall David. 1998. Watershed Management in British Columbia: The Fraser River Basin Experience. Environments. Vol. 25 (2/3): 64-79.
McGreer, E. and W. Belzer. 1999. “Contaminant sources to the Fraser River Basin,” in Health of the Fraser River Aquatic Ecosystem, DOE FRAP 1998-11 Eds. Colin Gray and Taina Tuominen. Vancouver, B.C.: Aquatic and Atmospheric Sciences Division, Environment Canada.
McPhee, M. 1989. “Implementing Area Designations in the Fraser Estuary,” in Coastal Zone 89 V: 4206-4212.
Moore, R. Daniel.1991. “Hydrology and Water Supply in the Fraser River Basin,” in Water in Sustainable Development: Exploring Our Common Future in the Fraser River Basin Vol. II, pgs. 21-40. Ed. Anthony H. J. Dorcey and Julian R. Griggs. Vancouver B.C.: Westwater Research Centre, University of British Columbia.
Norecol. 1993. Recommended Guidelines for Wastewater Characterisation in the Fraser River Basin. Volume 1. Development document. DOE FRAP 1993-10. Vancouver, B.C.: Environment Canada, Fraser River Action Plan.
Organization for Economic Cooperation and Development (OECD). 2003. Gross Domestic Product per Capita for OECD Countries. Paris, France: Organization for Economic Cooperation and Development.

Pollard, D.F.W. and M.R. McKechnie. 1986. World Conservation Strategy – Canada: A Report on Achievements in Conservation. Ottawa: Environment Canada.
Pomeroy. 1995. The Fraser Basin – Towards Sustainability. Water Science and Technology Vol. 31(8): 33-39.
Savard, Jean-Pierre L. 1991. “Birds of the Fraser Basin in Sustainable Development,” in Water in Sustainable Development: Exploring Our Common Future in the Fraser River Basin Vol. I, pgs. 189-216. Ed. Anthony H. J. Dorcey. Vancouver B.C.: Westwater Research Centre, University of British Columbia.
SALASAN Associates Inc. 2002. Summary Report: Evaluation of Fraser Basin Council Effectiveness. Vancouver, B.C.: Fraser Basin Council.
Science Council of Canada. 1977. Canada as a Conserver Society: Resource Uncertainties and the Need for New Technologies. Report 27. Ottawa: Supply and Services Canada.
Sewell, W. R. D. 1965. Water Management and Floods in the Fraser River Basin. Chicago, Ill: The University of Chicago, Department of Geography.
Sewell, W. R. D. 1977. “Changing Approaches to Water Management in the Fraser River Basin,” in Effects of Complex River Development. Ed. G. F. White. Boulder, Colo.: Westview Press.
Shaw, Patrick D. and Taina Tuominen. 1999. “Water Quality in the Fraser River Basin,” in Health of the Fraser River Aquatic Ecosystem, DOE FRAP 1998-11, pgs 47-61. Eds. Colin Gray and Taina Tuominen. Vancouver, B.C.: Aquatic and Atmospheric Sciences Division, Environment Canada.
Shady, A. M. 1989. Irrigation Drainage and Flood Control in Canada. CIDA
Smith, Sandra E. 1991. “Floodplain Management in the Fraser Basin,” in Water in Sustainable Development: Exploring Our Common Future in the Fraser River Basin Vol. I, pgs. 115-132. Ed. Anthony H. J. Dorcey. Vancouver B.C.: Westwater Research Centre, University of British Columbia.
Swain, L. G., D. G. Walton, and W. Obedkoff. 1997. Water Quality Assessment and Objectives for the Fraser River from Moose Lake to Hope. Victoria, B.C.: B.C. Ministry of Environment, Lands and Parks.
Tellus Institute. In press. “The Fraser River Case Study,” in Global Lessons for Watershed Management in the U.S. Boston, Mass.: Tellus Institute.
United Nations Population Division. 2003. World Population Prospects: The 2002 Revisions Highlights. ESA/P/WP. 180, 23 February 2003. New York: United Nations.