Can we predict the rundown and long term value of...
16
Eyre Peninsula Farming Systems 2012 Summary 104 Nutrition Section Editor: Roy Latta SARDI, Minnipa Agricultural Centre Section 5 Key messages • Using the residual P trial data from Minnipa we have developed a spreadsheet model to predict the rundown of soil P reserves under continuous cropping. • With this prediction we can attempt to determine the long term value of investment in P fertiliser. • As expected P applied becomes less valuable with time and is eventually unable to maintain crop productivity at optimal levels if there are no further applications of P. The uncertainty of the outcome also increases with increasing time since soil fertility was monitored. • This is a work in progress! Why do the trial? Phosphorus (P) fertiliser is the second largest nutrient input on Australian farms and prices are projected to increase as resources become more difficult to extract. Phosphorus is available to the crops as residual P (which includes native soil P and fertiliser P previously applied), and as P fertiliser freshly applied in the growing season. To maximise the economic benefit of soil P it is necessary to be able to predict the ability of soil and fertiliser to adequately supply crop demand for P over time. Fertiliser price spikes and a series of droughts both tend to result in farmers reducing inputs of P fertiliser. This decision is an uncertain one as the value of previously applied fertiliser is difficult to predict. We also observe the situation of soil P reserves increasing with time when P inputs exceed removal in grain or hay and soil fixation. While this may not be the most efficient use of P, it is a risk averse approach that maintains a high soil P supply, which allows more flexibility to lower P fertiliser rates in seasons where finance is constrained. We wanted to know if we could manage the risk of over or undersupply of P to crops by developing a tool that would predict the change in P reserves with time. How was it done? • Data from the residual P trial at Minnipa was used to predict the soil test P response to P exported in grain crops (amount of soil P rundown with different grain yields). • Laboratory trials were used to predict the amount of fertiliser P that is available to growing plants and not ‘fixed’ by soil when it is first added. • A published value was used to predict the ageing of fertiliser in soil which reduces its availability with time. • A 60 year APSIM simulation was used to generate the non-P limited yield potential over a range of season types. • The calibration curves for the DGT-P soil test were used to estimate the yield penalty caused to the yield potential at different levels of soil test P. • A bio-economic model (@ risk) was used to run 8 year sequences of yield potential in 50,000 different combinations to test the range of possible soil test P rundown possibilities. • This distribution of possibilities was used to calculate the economic value of soil P with time. What happened and what does this mean? With a starting soil test P of 75 μg/L (as was the case for the Residual P trial), the spreadsheet model predicted that there would be a mean yield penalty of 44% due to soil P rundown after 6 years of cropping with no P addition (Figure 1). Can we predict the rundown and long term value of P? Therese McBeath 1 , Sean Mason 2 , Jackie Ouzman 1 , Craig Scanlan 3 , Merv Probert 1 and Lisa Brennan 1 1 CSIRO, 2 University of Adelaide, 3 DAFWA Research
Transcript of Can we predict the rundown and long term value of...
Eyre Peninsula Farming Systems 2012 Summary104
Nutrition
Section Editor:Roy LattaSARDI, Minnipa Agricultural Centre
Section
5
Key messages• Using the residual P trial
data from Minnipa we have developed a spreadsheet model to predict the rundown of soil P reserves under continuous cropping.
• With this prediction we can attempt to determine the long term value of investment in P fertiliser.
• As expected P applied becomes less valuable with time and is eventually unable to maintain crop productivity at optimal levels if there are no further applications of P. The uncertainty of the outcome also increases with increasing time since soil fertility was monitored.
• This is a work in progress!
Why do the trial? Phosphorus (P) fertiliser is the second largest nutrient input on Australian farms and prices are projected to increase as resources become more difficult to extract. Phosphorus is available to the crops as residual P (which includes native soil P and fertiliser P previously applied), and as P fertiliser freshly applied in the growing season. To maximise the economic benefit of soil P it is necessary to be able to predict the ability of soil and fertiliser to adequately supply crop demand for P over time. Fertiliser price spikes and a series of droughts both tend to
result in farmers reducing inputs of P fertiliser. This decision is an uncertain one as the value of previously applied fertiliser is difficult to predict.
We also observe the situation of soil P reserves increasing with time when P inputs exceed removal in grain or hay and soil fixation. While this may not be the most efficient use of P, it is a risk averse approach that maintains a high soil P supply, which allows more flexibility to lower P fertiliser rates in seasons where finance is constrained.
We wanted to know if we could manage the risk of over or undersupply of P to crops by developing a tool that would predict the change in P reserves with time.
How was it done? • Data from the residual P trial
at Minnipa was used to predict the soil test P response to P exported in grain crops (amount of soil P rundown with different grain yields).
• Laboratory trials were used to predict the amount of fertiliser P that is available to growing plants and not ‘fixed’ by soil when it is first added.
• A published value was used to predict the ageing of fertiliser in soil which reduces its availability with time.
• A 60 year APSIM simulation was used to generate the
non-P limited yield potential over a range of season types.
• The calibration curves for the DGT-P soil test were used to estimate the yield penalty caused to the yield potential at different levels of soil test P.
• A bio-economic model (@risk) was used to run 8 year sequences of yield potential in 50,000 different combinations to test the range of possible soil test P rundown possibilities.
• This distribution of possibilities was used to calculate the economic value of soil P with time.
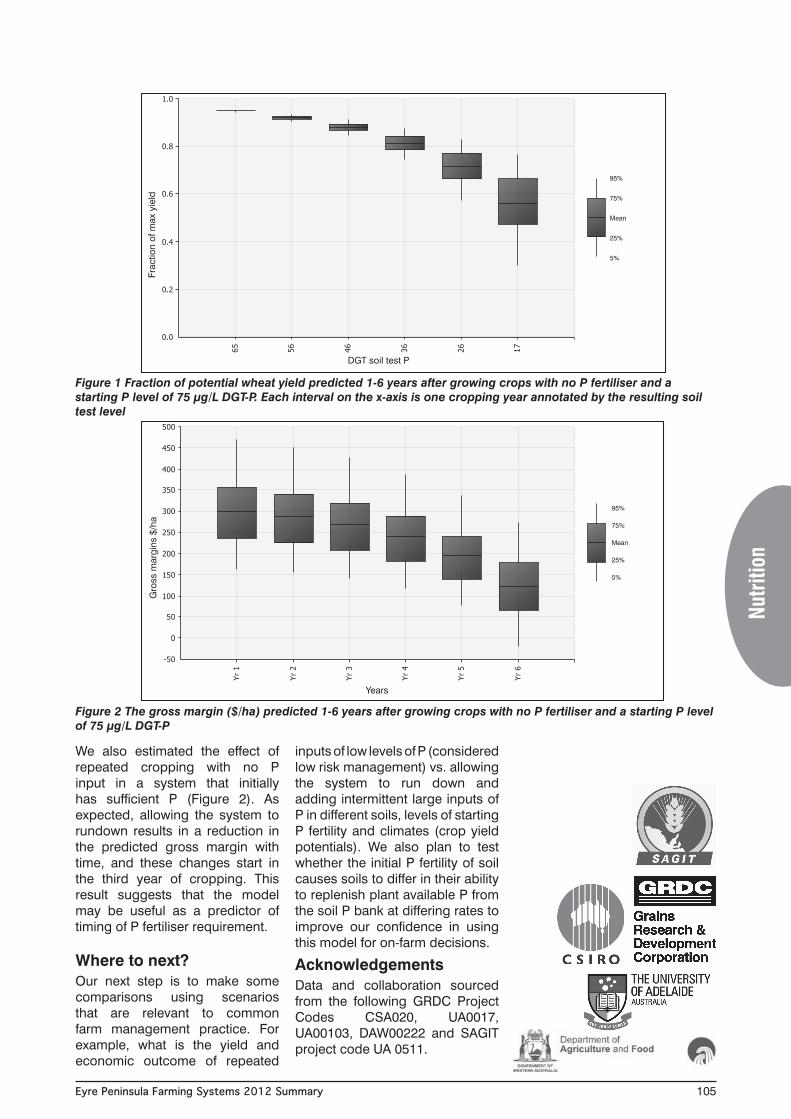
What happened and what does this mean? With a starting soil test P of 75 μg/L (as was the case for the Residual P trial), the spreadsheet model predicted that there would be a mean yield penalty of 44% due to soil P rundown after 6 years of cropping with no P addition (Figure 1).
Can we predict the rundown and long term value of P?Therese McBeath1, Sean Mason2, Jackie Ouzman1, Craig Scanlan3, Merv Probert1 and Lisa Brennan1
1CSIRO, 2University of Adelaide, 3DAFWA Research
Eyre Peninsula Farming Systems 2012 Summary 105
We also estimated the effect of repeated cropping with no P input in a system that initially has sufficient P (Figure 2). As expected, allowing the system to rundown results in a reduction in the predicted gross margin with time, and these changes start in the third year of cropping. This result suggests that the model may be useful as a predictor of timing of P fertiliser requirement.
Where to next?Our next step is to make some comparisons using scenarios that are relevant to common farm management practice. For example, what is the yield and economic outcome of repeated
inputs of low levels of P (considered low risk management) vs. allowing the system to run down and adding intermittent large inputs of P in different soils, levels of starting P fertility and climates (crop yield potentials). We also plan to test whether the initial P fertility of soil causes soils to differ in their ability to replenish plant available P from the soil P bank at differing rates to improve our confidence in using this model for on-farm decisions.
Acknowledgements Data and collaboration sourced from the following GRDC Project Codes CSA020, UA0017, UA00103, DAW00222 and SAGIT project code UA 0511.
Figure 1 Fraction of potential wheat yield predicted 1-6 years after growing crops with no P fertiliser and a starting P level of 75 µg/L DGT-P. Each interval on the x-axis is one cropping year annotated by the resulting soil test level
Figure 2 The gross margin ($/ha) predicted 1-6 years after growing crops with no P fertiliser and a starting P level of 75 µg/L DGT-P
Nutr
ition
Frac
tion
of m
ax y
ield
DGT soil test P
95%
75%
Mean
25%
5%
95%
75%
Mean
25%
5%
Gro
ss m
argi
ns $
/ha
Years
Eyre Peninsula Farming Systems 2012 Summary106
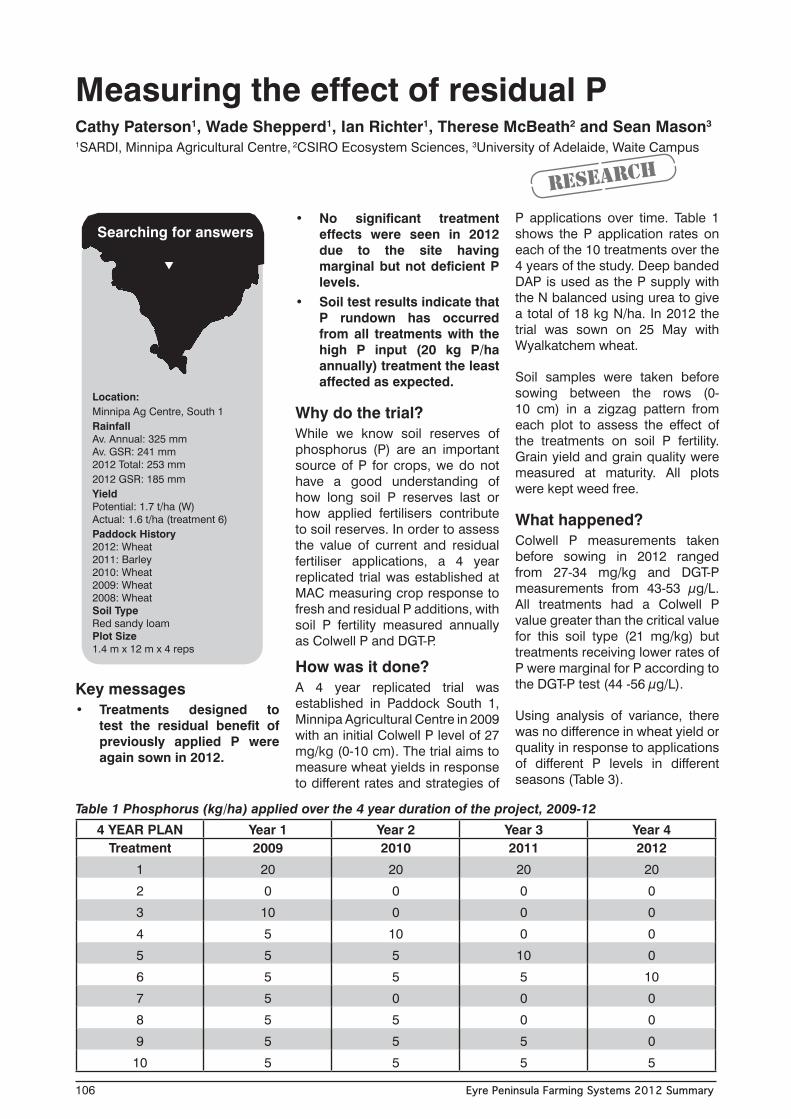
Key messages• Treatments designed to
test the residual benefit of previously applied P were again sown in 2012.
• No significant treatment effects were seen in 2012 due to the site having marginal but not deficient P levels.
• Soil test results indicate that P rundown has occurred from all treatments with the high P input (20 kg P/ha annually) treatment the least affected as expected.
Why do the trial? While we know soil reserves of phosphorus (P) are an important source of P for crops, we do not have a good understanding of how long soil P reserves last or how applied fertilisers contribute to soil reserves. In order to assess the value of current and residual fertiliser applications, a 4 year replicated trial was established at MAC measuring crop response to fresh and residual P additions, with soil P fertility measured annually as Colwell P and DGT-P.
How was it done? A 4 year replicated trial was established in Paddock South 1, Minnipa Agricultural Centre in 2009 with an initial Colwell P level of 27 mg/kg (0-10 cm). The trial aims to measure wheat yields in response to different rates and strategies of
P applications over time. Table 1 shows the P application rates on each of the 10 treatments over the 4 years of the study. Deep banded DAP is used as the P supply with the N balanced using urea to give a total of 18 kg N/ha. In 2012 the trial was sown on 25 May with Wyalkatchem wheat. Soil samples were taken before sowing between the rows (0-10 cm) in a zigzag pattern from each plot to assess the effect of the treatments on soil P fertility. Grain yield and grain quality were measured at maturity. All plots were kept weed free.
What happened? Colwell P measurements taken before sowing in 2012 ranged from 27-34 mg/kg and DGT-P measurements from 43-53 μg/L. All treatments had a Colwell P value greater than the critical value for this soil type (21 mg/kg) but treatments receiving lower rates of P were marginal for P according to the DGT-P test (44 -56 μg/L).
Using analysis of variance, there was no difference in wheat yield or quality in response to applications of different P levels in different seasons (Table 3).
Measuring the effect of residual P Cathy Paterson1, Wade Shepperd1, Ian Richter1, Therese McBeath2 and Sean Mason3
1SARDI, Minnipa Agricultural Centre, 2CSIRO Ecosystem Sciences, 3University of Adelaide, Waite Campus
t
Location: Minnipa Ag Centre, South 1RainfallAv. Annual: 325 mmAv. GSR: 241 mm2012 Total: 253 mm2012 GSR: 185 mmYieldPotential: 1.7 t/ha (W)Actual: 1.6 t/ha (treatment 6)Paddock History2012: Wheat2011: Barley2010: Wheat2009: Wheat2008: WheatSoil TypeRed sandy loamPlot Size1.4 m x 12 m x 4 reps
Searching for answers
Research
4 YEAR PLAN Year 1 Year 2 Year 3 Year 4Treatment 2009 2010 2011 2012
1 20 20 20 20
2 0 0 0 0
3 10 0 0 0
4 5 10 0 0
5 5 5 10 0
6 5 5 5 10
7 5 0 0 0
8 5 5 0 0
9 5 5 5 0
10 5 5 5 5
Table 1 Phosphorus (kg/ha) applied over the 4 year duration of the project, 2009-12

Eyre Peninsula Farming Systems 2012 Summary 107
Soil test values measured before the 2010 growing season were 37 mg/kg Colwell P and 75 μg/L DGT P and in 2012 Colwell P was 27-34 mg/kg and DGT-P was 43-53 μg/L (Table 2). The P levels are drawing down due to significant P removal from above average yields in 2010 and 2011. Continued monitoring of soil P levels through soil testing is especially important when using management techniques that are likely to draw down on soil P reserves (eg. nil and low P inputs).
What does this mean? The value of soil testing showing adequate P levels was emphasised by the similar grain yields produced irrespective of 2012 P applications, 0 to 20 kg P/ha. This information provides the farmer with the opportunity to determine level of P input based on personal situation not through immediate agronomic necessity.
Acknowledgements We acknowledge the funding from GRDC EP Farming Systems 3 project UA00107 for this work.
P applied (kg/ha)
Colwell P (mg/kg)
DGT-P (µg/L)
0+0+0+0 28 442009 applied fertiliser (residual)
5+0+0+0 27 4710+0+0+0 28 51
2010 applied fertiliser (residual)5+5+0+0 31 43
5+10+10+0 31 472011 applied fertiliser (residual)
5+5+5+0 33 435+5+10+0 30 50
20+20+20+20 34 53
Table 2 2012 pre-sowing soil test P in response to P fertiliser applied in 2009 - 2012
P applied (kg/ha)2009+10+11+12
Grain Yield(t/ha)
Test Wt(kg/hL)
Screenings(%)
Protein(%)
0+0+0+0 1.39 84.2 3.7 10.42009 applied fertiliser (residual)
5+0+0+0 1.21 84.2 4.3 10.210+0+0+0 1.42 84.3 4.0 10.3
2010 applied fertiliser (residual)5+5+0+0 1.48 84.4 4.0 10.0
5+10+10+0 1.51 84.5 4.2 10.02011 applied fertiliser (residual)
5+5+5+0 1.38 84.2 4.5 10.05+5+10+0 1.18 84.1 3.9 10.3
2012 applied fertiliser (fresh)5+5+5+5 1.40 84.2 4.2 10.2
5+5+5+10 1.59 84.5 4.5 9.720+20+20+20 1.54 84.5 4.3 9.9LSD (P=0.05) ns ns ns ns
Table 3 2012 wheat grain yield and quality response to P fertiliser applied in 2009 - 2012
Critical Colwell P = 21 mg/kg, critical DGT = 50μg/L (Confidence Interval 44-56 μg/L)
Nutr
ition
Eyre Peninsula Farming Systems 2012 Summary108
Key messages In 2012 medic was sown without P fertiliser to plots receiving 0, 10, 20 and replacement P rates in 2009, 2010 and 2011, and;• Soil test P did not increase
with increasing levels of P application in 2009-2011, and tended to be highest where 10 kg P/ha was applied in each of the 3 years.
• Pasture biomass production increased linearly with increasing soil test P.
Why do the trial? There was an accumulation of P reserves in many cropping soils as a result of application rates in excess of crop demand over a run of poor seasons prior to 2009. Replacement P application rates were tested for their ability to maintain production and soil P levels compared with 0, 10 and 20 kg P/ha applied annually. The replacement P rate was based on the estimated P exported from the paddock as a grain calculated as 3 kg P/ha/t of cereal grain harvested.
The aim of this study was to monitor crop production and economic outcomes from applying P at nil, replacement, 10 kg P/ha (district practice) and 20 kg P/ha (double district practice) on a deep sandy loam (good zone) and a shallow (poor zone) constrained soil at Minnipa. This work follows on from articles in the 2009 (pp 154-155), 2010 (pp 110-111) and 2011 (pp 119-122) EP Farming Systems summaries. In 2012 plots were sown to Angel medic with no additional P fertiliser to evaluate the residual effects of three years of different P application strategies.
How was it done? Two replicated trials were established in Paddock North 1 (N1) on Minnipa Agricultural Centre (MAC) in 2009; one on a deep red sandy loam (good zone) that has been P responsive and a second trial on a shallow, heavy soil (poor zone) that has been non-responsive to added P prior to 2009. At the start of the trial in 2009, pre-sowing Colwell P levels were sufficient based on critical levels at 25 and 35 mg/kg on the good and poor soil respectively. There were four P treatments which have been tested for three consecutive years (2009, 2010 and 2011) on the same plot. P was applied as DAP
banded at sowing, with N balanced with urea to give a total of 18 kg N/ha on all treatments. In 2012, both trials were sown with medic on 27 April (a seed mix of 10 kg/ha un-scarified medic seed harvested from paddock N5N mixed with 1 kg/ha Angel medic) and received no fertiliser application. Soil samples were taken before sowing between the rows (0-10 cm depth) in a zigzag pattern from each plot to assess the effect of previous applications on soil P levels.
What happened and what does it mean? The P balance in Table 1 shows the amount of P applied and exported in the 3 seasons 2009 to 2011. The P balance for replacement P is negative because of low P applied (after a poor season in 2008), but high levels of P were subsequently exported in 2009. There is a substantial surplus of P where 20 kg P/ha has been applied annually and a deficit where 0 kg P/ha has been applied, while the application of 10 kg P/ha was the treatment closest to achieving a neutral balance (Table 1).
The pre-sowing soil P test values showed that there was not a relationship of increasing soil test P with increasing P applications from over the 3 seasons, 2009 to 2011 (Table 1). However, these samples were taken between crop rows in 2012 to avoid sampling fertiliser applied in 2011, which means that they are more likely to intercept the 2010 cropping row and the conditions at sowing for the 2012 cropping row. The 2012 pre-sowing soil test P tended to be highest where 10 kg P/ha has been applied annually (which yielded worse than both the replacement P and 20 kg P treatments in 2010).
Replacement P in cropping systems on upper EPCathy Paterson1, Wade Shepperd1, Ian Richter1, Sean Mason2 and Therese McBeath3 1SARDI, Minnipa Agricultural Centre, 2University of Adelaide, 3CSIRO Ecosystem Sciences
Research
t
Location: Minnipa Ag Centre, paddock North 1RainfallAv. Annual: 325 mmAv. GSR: 242 mm2012 Total: 253 mm2012 GSR: 185 mmPaddock History2011: Barley2010: Wheat2009: Wheat2008: WheatSoil TypeRed sandy loamPlot Size1.4 m x 9 m x 4 repsYield Limiting FactorsDry springEnvironmental ImpactsWater useRunoff potential: lowResouce efficiencyGreenhouse gas emissions (CO2, NO2, methane): reduced fertiliser inputSocial/PracticeTime (hrs): no extraClash with other farming operations: standard practiceEconomicInfrastructure/operating inputs: standardCost of adoption risk: medium
Searching for answers

Eyre Peninsula Farming Systems 2012 Summary 109
The production of pasture biomass was found to be directly related to the level of pre-sowing soil test P in 2012 at both times of measurement and on both soil types, with DGT-P a better predictor of the relationship in three of the four comparisons (Figure 1). The production of pasture biomass was not directly related to the level of previous P applications over the three seasons, 2009-2011 (Table 1).
In the 2012 season the medic sown without P fertiliser to plots which had previously received 0, 10, 20 and replacement P rates in seasons 2009-11 showed; soil test P did not increase with increasing levels of P application in 2009-2011 seasons, and tended to be highest where 10 kg P/ha was applied in each of the 3 years and the pasture biomass production increased linearly with increasing soil test P.
Acknowledgements We acknowledge the funding from GRDC projects UA00107 and UA00103 for this work.
P treatment(kg/ha)
P applied 2009 - 2011
(kg/ha)
*P removed 2009 - 2011
(kg/ha)
2009-2011 P - balance (P added - P
removed)
Pre-sowing soil P 2012
(DGT-P/Colwell-P)
Medic** Biomass 2012
(t/ha)
Good zone, deep sandy loam
0 0.0 30.6 -30.6 41/29 0.62
10 30.0 33.9 -3.9 44/27 0.90
20 60.0 35.7 24.3 40/25 0.72
Replacement P 28.2 34.5 -6.3 42/27 0.64
Poor zone, shallow constrained soil
0 0.0 24.6 -24.6 32/41 0.54
10 30.0 25.8 4.2 34/48 0.71
20 60.0 27.0 33.0 32/47 0.66
Replacement P 21.3 26.1 -4.8 31/47 0.59
Table 1 P added and P removed (kg/ha) in 2009, 2010 and 2011 and resulting soil test P and biomass (sum of the two cuts, 15 August and 27 September) in 2012
*P removed estimated as 3 kg P/t grain harvested.**Effect of P treatments on 2012 biomass was not significant (P>0.05)
R² = 0.49 R² = 0.91
0
20
40
60
80
100
120
25 30 35 40 45 50
DM (k
g/ha
)
Soil test value
Poor Zone-15/08/2012DGT (ug/L) Colwell P (mg/kg)
R² = 0.83 R² = 0.57
0100200300400500600700
25 30 35 40 45 50
DM (k
g/ha
)
Soil test value
Poor Zone-27/09/2012DGT (ug/L) Colwell P (mg/kg)
R² = 0.27 R² = 0.76
0
20
40
60
80
100
120
140
20 25 30 35 40 45 50
DM (k
g/ha
)
Soil test value
Good zone-15/08/2012Colwell P (mg/kg) DGT (ug/L)
R² = 0.34
0100200300400500600700800900
20 25 30 35 40 45 50
DM (k
g/ha
)
Soil test value
Good zone-27/09/2012Colwell P (mg/kg) DGT (ug/L)
Figure 1 Relationship between soil test P and annual medic biomass production in 2012 measured on 15 August and 27 September
Nutr
ition

Eyre Peninsula Farming Systems 2012 Summary110
Key message• No further yield benefit was
measured from applying other nutrients and trace elements over and above P and N in 2012.
Why do the trial? Phosphorus (P) has been a major limiting factor to crop growth on calcareous grey soils of the upper Eyre Peninsula. P deficiency causes plants to be low in vigour and fail to produce adequate tillers. Research with fluid fertilisers has not only confirmed P was the major limiting nutrient,
but also that fluids increased the availability of P.
Research conducted by Holloway et al in the early-mid 2000’s showed that the use of fluid P increased dry matter production by 20-30% compared to granular fertiliser at equivalent rates of P, but did not always result in a yield increase. This extra growth also increased the demand for other nutrients, which can cause other deficiencies and reduce the response to applied fertiliser (EPFS Summary 2004, pp 92-94).
During the 2012 farmer meetings concerns were raised about not getting the expected yield increases from using a fluid fertiliser system. This trial was designed to begin investigating what nutrients (macro and micro) are required to increase grain yield in a fluid fertiliser system.
How was it done? The trial was sown on 19 June with Axe wheat @ 50 kg/ha with 8 treatments (Table 1), replicated 4 times. Measurements taken during the year included soil chemical analysis, plant establishment (not reported), dry matter at early tillering, anthesis and harvest, grain yield and grain quality.
What happened?Soil chemical analysis performed before sowing measured the Colwell P level (0-10 cm) at 32 mg/kg, mineral nitrogen (N) (0-60 cm) 58 kg N/ha and trace element analysis (DTPA 0-10 cm) reported copper (Cu) 0.3 mg/kg, zinc (Zn) 0.8 mg/kg and manganese (Mn) 2.4 mg/kg. The iron (Fe) (0-10 cm) level was 1.7 mg/kg, sulphur (S) (0-10 cm) was 8.8 mg/kg, potassium (K) (0-10 cm) was 266 mg/kg and exchangeable magnesium (Mg)
(0-10 cm) was 0.71 meg/100g. With the exception of copper all nutrient levels were above critical values.
Compared to the nil treatment there was more early dry matter production (Table 2) where P plus N was applied but no further increases in response to other nutrients applied. At anthesis there was a response to N+P+S but no further increases in response to other nutrients applied and at harvest all treatments had higher dry matter production where P was applied.
There was a grain yield benefit from applying P and N compared to applying no fertiliser, but no further increases in response to other nutrients applied. Grain test weight and protein levels were higher in response to P, and P and N respectively. Screenings were above 5% for all treatments with the lowest amount of screenings being achieved where P was applied.
Trace elements in a fluid fertiliser system at MudamucklaCathy Paterson, Wade Shepperd and Ian Richter SARDI, Minnipa Agricultural Centre
Searching for Answers
Research
Location: MudamucklaPeter KuhlmannRainfallAv. Annual: 291 mmAv. GSR: 219 mm2012 Total: 169 mm2012 GSR: 128 mmYieldPotential: 0.8 t/ha (W)Actual: 0.63 t/ha (treatment 6)Paddock History2012: Wheat2011: Canola2010: Wheat2009: Wheat2008: WheatSoil TypeGrey calcareous sandy loamSoil Testsoil chemical analysisPlot Size1.4 m x 18 m x 4 repsYield Limiting FactorsLater sowing and dry spell
t

Eyre Peninsula Farming Systems 2012 Summary 111
Table 2 Plant dry matter production, grain yield and quality, Mudamuckla 2012
TreatmentEarly DM
(t/ha)
Anthesis DM
(t/ha)
Harvest DM
(t/ha)
Yield (t/ha)
Test Wt (kg/hL)
Protein (%)
Screenings (%)
Nil 0.12 1.01 1.65 0.42 82.9 12.5 8.5
N 0.14 0.89 1.67 0.59 83.1 12.6 8.7
P 0.21 1.08 1.80 0.58 84.2 12.9 6.2
N+P 0.35 1.33 2.02 0.61 83.7 13.5 5.8
N+P+S 0.37 1.42 1.83 0.56 83.7 13.4 5.8
N+P+S+K+MG 0.32 1.42 2.01 0.63 83.6 13.3 5.3
N+P+Zn+Mn+Cu 0.33 1.49 1.92 0.61 83.9 13.2 5.7
N+P+Zn+Mn+K+S+Mg+Cu 0.40 1.60 2.01 0.62 84.0 13.3 5.9
LSD (P=0.05) 0.08 0.39 0.33 0.04 0.5 0.6 1.1
What does this mean? Grain yield increases were achieved with the application of P and N but there were no further benefits with applying other nutrients in 2012. The dry conditions experienced meant that these increases were small and the screenings of all treatments were over 5%, downgrading the grain from Hard to Feed 1. This site was only deficient in copper (The Wheat Book - Principles and Practice), although there was
no benefit gained from applying this nutrient this season. The dry conditions and consequential low yields would have reduced the plants demand for all nutrients.
The results from this trial demonstrate that more work is required into the use of nutrients other than P in a fluid system across a range of seasonal conditions to investigate if these increases can be consistently achieved and what rate and form is most likely to provide an economic benefit.
Acknowledgements Thanks to Peter Kuhlmann for the provision of land for this trial, Therese McBeath and Roy Latta for technical advice and support during the year and to GRDC for funding the EP Farming Systems 3 Project UA00107.
Nutr
ition

Eyre Peninsula Farming Systems 2012 Summary112
Key messages • Liquid N gave the most
significant response of all liquid treatments in terms of mid-season biomass production and final yield.
• A full liquid system including N, P, trace elements and fungicides provided the greatest yield response, significantly better than
district practice granular treatments.
• Full liquid and liquid N treatments provided similar returns to that of traditional treatments, and greater returns than liquid P only treatments.
Why do the trial?The necessity to evaluate a decision to convert a grower’s system to full liquid technology in 2011 prompted the establishment of split paddock trials in that season, resulting in a $100/ha gross margin benefit in the Liquid system over the traditional granule MAP + urea system on a farm at Tuckey. This gross margin increase prompted investigation into what components of this liquid system were responsible for such a benefit, thus the establishment of this trial site in 2012.
How was it done?The trial was established on a uniform grey brown loam top soil over soft limestone subsoil, with a Colwell P of 36 mg/kg (sufficient) and nitrate N of 36 mg/kg (sufficient) (Figure 1), and chemical fallowed over summer. Sown with certified Mace wheat on 28 May, the replicated trials consisted of a number of liquid, granular, and liquid/granule combination treatments of nitrogen (N), phosphorous (P), trace elements (TE) and in furrow fungicide (fung) designed to establish which component has the greater effect on final yields. The treatments are summarised in Table 1.
What happened?Visual differences in treatments were observed from crop emergence through to grain fill, with treatments containing liquid
nitrogen, as well as the complete liquid treatment establishing quicker, with increased early vigour and maintaining a growth stage and biomass advantage. Emergence counts were variable, however it was noted that most complete liquid and liquid N treatments had greater emergence than the control (nil fert), while all complete granule and granule N treatments had a lower emergence than the control. It was also observed that higher P rates, regardless of P form, increased crop emergence.
Tissue analysis showed that treatments with liquid trace elements had healthier plants and liquid treatments had more favourable levels of N and P, although this was not validated. Tiller counts showed that higher rates of P (12 units) in the granule form supported increased tillering, but this did not translate into a significant yield benefit. Similarly, liquid flutriafol showed a tillering advantage over granule, but no yield benefit in 2012.
Liquid fertiliser evaluation trial Tristan Baldock1 and Cathy Paterson2 1Cleve Rural Traders, 2SARDI, Minnipa Agricultural Centre
Research
Searching for Answers
Location: TuckeyJason & Julie BurtonRainfallAv. Annual: 330 mmAv. GSR: 235 mm2012 Total: 169 mm2012 GSR: 289 mmYieldPotential: 1.95 t/ha (W)Actual: 0.63 t/haPaddock History2011: Angel medic pasture2010: Stiletto wheat2009: WheatSoil TypeGrey brown loamSoil TestCDGT 36: Predicted Response (DGT) 81%Plot Size50 m x 2 m x 3 repsYield Limiting FactorsEarly finish Social/PracticeTime (hrs): uses less labourClash with other farming operations: more timely sowing operationsLabour requirements: Savings in terms of logistics and associated labour costs
t

Eyre Peninsula Farming Systems 2012 Summary 113
Nutr
ition
Yield data (Table 1) shows the full liquid treatment (treatment 8) yielded significantly more than the district practice of granule MAP + Urea (treatment 1). This is consistent with observations in the 2011 split paddock trial, however the liquid treatment assessed in 2011 (Burton Brew treatment 21), which has less liquid P and N than other liquid treatments, did not have a significant yield advantage over granules this season. Trace elements, or the addition of fungicide, had no impact on final yields, but rather
differences were driven by N and P. Despite these trials being planted on medic pasture stubble, liquid N had a far greater impact on yield than P when fertiliser form was analysed as a factor (Figure 2). Treatments containing liquid N yielded significantly more than traditional granule treatments, as well as those containing granule N and liquid P.
Grain test weight was the only quality measure to show any significant difference between treatments, however not enough
to affect the grain quality grade, therefore having no impact on gross margin return (data not shown). Improved yields did not translate into higher profits, with no difference in gross margin return between full liquid, liquid N and granule treatments (Figure 2). Liquid P had the poorest return, returning up to $70/ha less than Liquid N or granule treatments and $35/ha less than the higher costing complete liquid treatments.
Figure 1 Soil test results for Rudall trial site, 2012

Eyre Peninsula Farming Systems 2012 Summary114
Table 1 Wheat emergence, tiller count, grain yield (t/ha), test weight (kg/hL) and gross margins ($/ha) in response to fertiliser treatments. Note all treatments contain 20 units of N and 8 units of P unless specified otherwise in the description. Trace elements (TE) consists of Zn and Mn @480 gms/ha and Cu @ 193 gms/ha as sulphate, except for treatment 13 which is EDTA chelate. Fungicide consists of flutriafol @ 100 gm/ha active ingredient as a liquid, except for treatment 18 which has a coating on granule fertiliser. Furthermore, the Burton Blend contains N-(6liquid+14granule), P-(6liquid+2 granule), Zn Mn 480 gms, Cu 193 gms, and Burton Double N-12liquid, 14granule, P-12liquid+2granule, Zn Mn 1000 gms, Cu 42 gms.
Treatment Treatment Description Emergence (plants/m2)
Tiller Count (/m2)
Grain Yield(t/ha)
Test Wt (kg/hL)
Gross Margin ($/ha)
1 granN granP (T1) 144 172 2.38 84.8 666
2 ganN granP +fung -TE (T2) 146 226 2.37 84.6 660
3 granN granP -fung +TE (T3) 151 234 2.41 84.4 664
4 granN granP +fung +TE (T4) 133 232 2.40 84.8 658
5 liqN liqP -fung -TE (T5) 172 233 2.53 84.9 636
6 liqN liqP +fung -TE (T6) 175 235 2.49 84.8 619
7 liqN liqP -fung +TE (T7) 162 231 2.55 84.7 638
8 liqN liqP +fung +TE (T8) 181 232 2.64 84.6 658
9 liqN granP -fung -TE (T9) 178 245 2.55 85.0 675
10 granN liqP (T10) 134 231 2.38 84.4 593
11 liqN granP -fung +TE (T11) 160 242 2.56 84.6 673
12 ganN liqP -fung +TE (T12) 137 205 2.44 84.5 600
13 liqNliqP +fung +TE (T13) 160 221 2.51 84.9 598
14 granN (20) granP (12) -fung -TE (T14) 154 235 2.42 84.2 668
15 Burton Double (T15) 140 242 2.55 84.4 630
16 liqNliqP (6) +fung +TE (T16) 170 243 2.57 84.5 650
17 granNgranP (12) +fung +TE (T17) 149 258 2.46 84.6 671
18 granNgranP +granfung +H20 +TE (T18) 135 206 2.51 84.4 683
19 nil fert (T19) 160 219 2.43 84.7 728
20 nil fert +fung (T20) 165 228 2.44 84.9 729
21 Burton Brew (T21) 142 * 2.43 84.3 655
LSD (P=0.05) 23 35 0.15 0.5 47
Figure 2 Wheat yield (t/ha) and gross margins ($/ha) of liquid treatments compared to nil fertiliser, granule treatments and granule N + liquid P

Eyre Peninsula Farming Systems 2012 Summary 115
What does this mean?Results from previous split paddock trials near this site suggest potential for large gross margin improvements in a full liquid system over a traditional granule fertiliser system at sowing. This study supports some of these observations, showing improvements in crop establishment and early vigour resulting in significant improvements in yield under a liquid system compared with granules, although there is no increase in profitability in this instance. This is however a significant outcome in a season where water was the limiting factor, not nutritional inputs.
This study also suggests that liquid N has had a greater impact on yields than P on this farm, which has given greater financial returns. Trace elements had no impact on final yield, although they did have an impact on crop establishment and tillering, indicating possible benefits in a more favourable spring. Likewise, the presence of flutriafol, whether as a liquid stream or as a coating on granule fertiliser, had no impact on final yield in a season where no disease pressure was observed.
This study has captured one year of split paddock trials and one year of replicated plot trials, which has encompassed two very different sets of seasonal conditions. While similar results and trends have
been observed both years, further research is required to validate the results and learn more about the impacts of liquids under varying seasonal conditions. At this point there appears to be an advantage in liquid technology outside of P response with possible benefits in returns when liquid N is considered in the system.
AcknowledgmentsThanks to the Burton family for providing land for this trial, Cleve Rural Traders, MAC EP Farming Systems 3 project UA00107 and Spraygro for operational and funding support, and special thanks to Therese McBeath for technical support.
RURAL TRADER S
Nutr
ition

Eyre Peninsula Farming Systems 2012 Summary116
Key message• In 2012 applying N at GS31
increased yields but no response to manganese was measured.
Why do the trial? During the 2010 growing season the Wharminda Ag Bureau questioned the value of applying manganese (Mn) with nitrogen (N) as this is a common practice for some farmers in the area. As a result in 2010 an unreplicated treatment strip of foliar Mn was applied to barley in a small area in the EP Farming Systems 3 Wharminda Focus Paddock, where there was a yield increase possibly in response to added Mn in combination with N in a decile 9 season.
In 2011 a trial was established to investigate Mn response in barley (EPFS Summary 2011 pp 133-134). This trial was repeated in 2012.
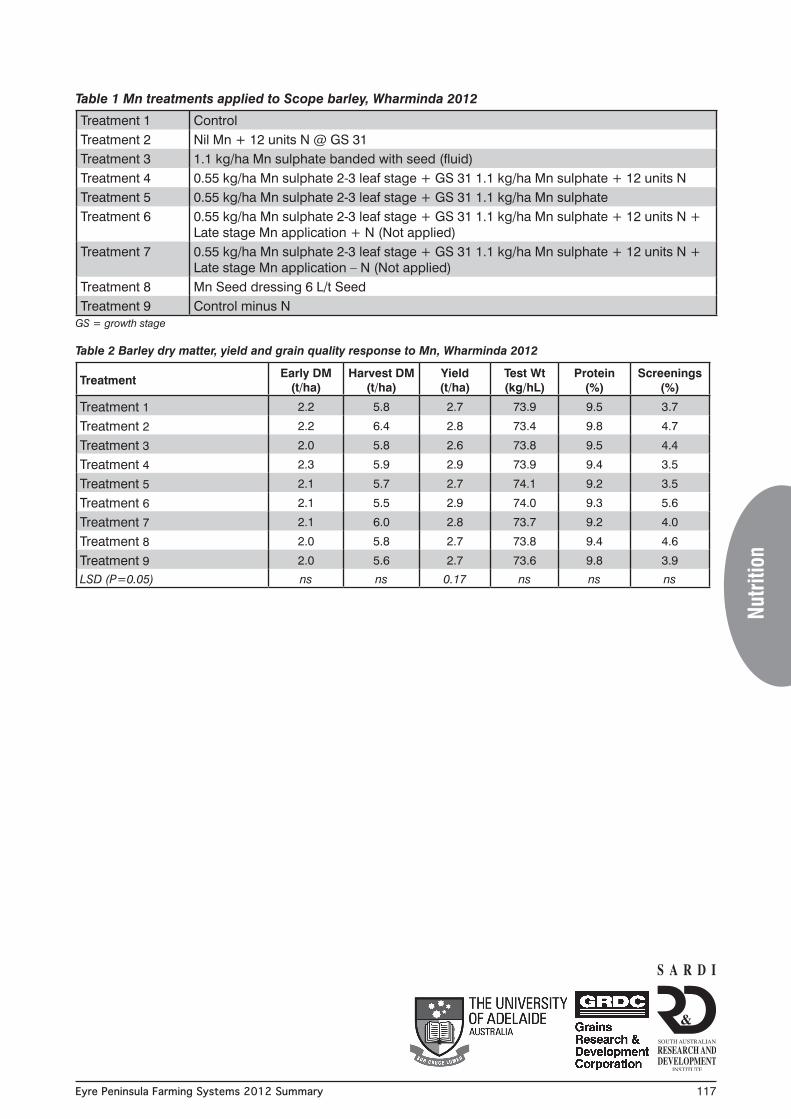
How it was done?The trial was sown with Scope barley @ 55 kg/ha at Wharminda on 29 May with 9 treatments applied (Table 1). All treatments received DAP @ 50 kg/ha except treatment 9 which received triple super @ 48 kg/ha (equal to 10 kg P/ha). These treatments were established to investigate the benefit in applying Mn at different rates, different timings of application and method of application, as well as the interaction between N and Mn.
Due to a lack of spring rain in 2012 the late stage applications of Mn and N in treatments 6 and 7 were not applied.
Soil chemical analysis performed before sowing indicated that the Colwell P level (0-10 cm) was 18 mg/kg, mineral N (0-60 cm) was 34 kg/ha and DTPA Mn (0-10 cm) was 1.9 mg/kg. Measurements taken during the year included plant establishment (not reported), dry matter at early tillering and anthesis, grain yield and grain quality.
What happened?There was no dry matter response to Mn or N at any stage during the growing season (Table 2), however there was a grain yield response to N when it was applied at GS 31, while the application of Mn did not result in a higher yield. In terms of grain quality all treatments were in the Barley Feed 1 parameters and there was no grain quality response to applied nutrients.
What does this mean?Given that there was a grain yield increase only when N was applied at GS 31 it is doubtful that there is an agronomic advantage in applying these two nutrients together in the absence of severe Mn deficiency. The response at this site was most likely due to the lower mineral N status rather than Mn, as 1.9 mg/kg Mn is considered borderline for deficiency (The Wheat Book - Principles and Practice).
This trial needs to be repeated in different seasonal conditions and background soil nutrition levels to further explore any interaction between Mn and N.
AcknowledgementsWe acknowledge the funding from GRDC for the EP Farming Systems 3 Project UA00107 which made this work possible and the Hunt family for providing the land for this trial.
Manganese response in barley at WharmindaCathy Paterson, Wade Shepperd and Ian Richter SARDI, Minnipa Agricultural Centre
Research
Searching for Answers
Location: WharmindaEd HuntRainfallAv. Annual: 322 mmAv. GSR: 222 mm2012 Total: 241 mm2012 GSR: 209 mmYieldPotential: 2.5 t/ha (B)Actual: 2.7-2.9 t/haPaddock History2011: Pasture2010: Barley2009: WheatDiseaseNilYield Limiting FactorsDry spring
t
Eyre Peninsula Farming Systems 2012 Summary 117
Treatment 1 ControlTreatment 2 Nil Mn + 12 units N @ GS 31Treatment 3 1.1 kg/ha Mn sulphate banded with seed (fluid)Treatment 4 0.55 kg/ha Mn sulphate 2-3 leaf stage + GS 31 1.1 kg/ha Mn sulphate + 12 units NTreatment 5 0.55 kg/ha Mn sulphate 2-3 leaf stage + GS 31 1.1 kg/ha Mn sulphateTreatment 6 0.55 kg/ha Mn sulphate 2-3 leaf stage + GS 31 1.1 kg/ha Mn sulphate + 12 units N +
Late stage Mn application + N (Not applied)Treatment 7 0.55 kg/ha Mn sulphate 2-3 leaf stage + GS 31 1.1 kg/ha Mn sulphate + 12 units N +
Late stage Mn application – N (Not applied)Treatment 8 Mn Seed dressing 6 L/t SeedTreatment 9 Control minus N
Table 1 Mn treatments applied to Scope barley, Wharminda 2012
GS = growth stage
Treatment Early DM (t/ha)
Harvest DM (t/ha)
Yield (t/ha)
Test Wt (kg/hL)
Protein (%)
Screenings (%)
Treatment 1 2.2 5.8 2.7 73.9 9.5 3.7
Treatment 2 2.2 6.4 2.8 73.4 9.8 4.7
Treatment 3 2.0 5.8 2.6 73.8 9.5 4.4
Treatment 4 2.3 5.9 2.9 73.9 9.4 3.5
Treatment 5 2.1 5.7 2.7 74.1 9.2 3.5
Treatment 6 2.1 5.5 2.9 74.0 9.3 5.6
Treatment 7 2.1 6.0 2.8 73.7 9.2 4.0
Treatment 8 2.0 5.8 2.7 73.8 9.4 4.6
Treatment 9 2.0 5.6 2.7 73.6 9.8 3.9
LSD (P=0.05) ns ns 0.17 ns ns ns
Table 2 Barley dry matter, yield and grain quality response to Mn, Wharminda 2012
Nutr
ition
Eyre Peninsula Farming Systems 2012 Summary118
Key messages• No residual effects from
varying fertiliser rates applied in 2010 were measured in 2012, following a 2011 pasture phase.
• Yield increased with P applied at sowing.
Why do the trial? It is important that our low rainfall farming systems are low risk,
flexible and responsive. Paddock inputs need to balance the best agronomic and economic advice with the need to ensure reliable outcomes at low cost.
A paddock at Wharminda, one of three focus paddocks in the current GRDC funded EP Farming Systems 3 project, was chosen as representative of eastern Eyre Peninsula soils varying from deep sand to shallow clay loam. The emphasis in 2009 and 2010 was on managing risk through tailoring inputs to different production zone potential by using variable rate technology. In 2012 the Wharminda Focus Paddock was in the wheat phase of a pasture-wheat-barley-pasture rotation with the residual effects of the 2010 treatments to be assessed as well as the phosphorus (P) response of wheat yield on the three identified production zones.
How it was done?A paddock at Wharminda was selected and zoned according to soil type; deep sand over clay representing 20% of the paddock, shallow sand over clay representing 50% of the paddock and loam representing 30% of the paddock, with four permanent sampling points per zone established. In 2010 the paddock was sown with Fleet barley with three fertiliser treatments of low, standard and high applied to the paddock in alternating strips across the paddock (EPFS
Summary 2010, pp 93-94). In 2011 the paddock was in the pasture phase of the rotation, a self-regenerating pasture, established from the soil seed reserve, with no applied fertiliser (EPFS Summary 2011, pp 109-110).
In 2012 three trial sites were established on one of the four permanent sampling points in each zone, with treatments sown at 90 degrees to the treatment strips applied in 2010. The trials were sown on 29 May with Clearfield Stiletto @ 65 kg/ha. P was applied at 0, 3, 6, 9, 12, 15, 20, 40 kg P/ha as Triple Super and replicated 4 times. All treatments had N, Zn, Cu, Mn and S applied at seeding.Measurements taken during the year included soil Colwell P levels, Phosphorus Buffering Index (PBI), deep N, root disease testing (RDTS), soil moisture at sowing and harvest, plant establishment, dry matter production (early and harvest), grain yield and quality.
What happened?Soil chemical analysis prior to seeding showed that mineral N levels were low in all soil types (Table 1) and the loam and deep sand over clay zone had adequate P levels for this soil type for the high and standard input treatments (≥ 22 mg/kg). In all soil types the 2010 low input treatments were below the critical level for this soil type. All soil types had an extremely low PBI level.
Phosphorus rate trials at WharmindaCathy Paterson, Wade Shepperd and Ian Richter SARDI, Minnipa Agricultural Centre
Research
Searching for Answers
Location: WharmindaEd HuntRainfallAv. Annual: 322 mmAv. GSR: 222 mm2012 Total: 241 mm2012 GSR: 209 mmYieldPotential: 2.5 t/ha (B)Actual: 2.7-2.9 t/haPaddock History2011: Pasture2010: Barley2009: WheatDiseaseNilYield Limiting FactorsDry spring
t
Table 1 Soil chemical analysis for Wharminda Focus Paddock, 2012
ZoneColwell P 0-10 cm (mg/kg)
PBITotal Mineral N 0-60 cm (kg/ha)
High* Standard# Low ¥ High* Standard# Low ¥
Deep sand/clay 25 28 14 7 34 54 48
Shallow sand/clay 18 15 14 9 39 45 46
Loam 24 22 19 11 39 49 26* 2010 P applied @ 16 kg P/ha, # 2010 P applied @ 8 kg P/ha, ¥ 2010 no P applied
Eyre Peninsula Farming Systems 2012 Summary 119
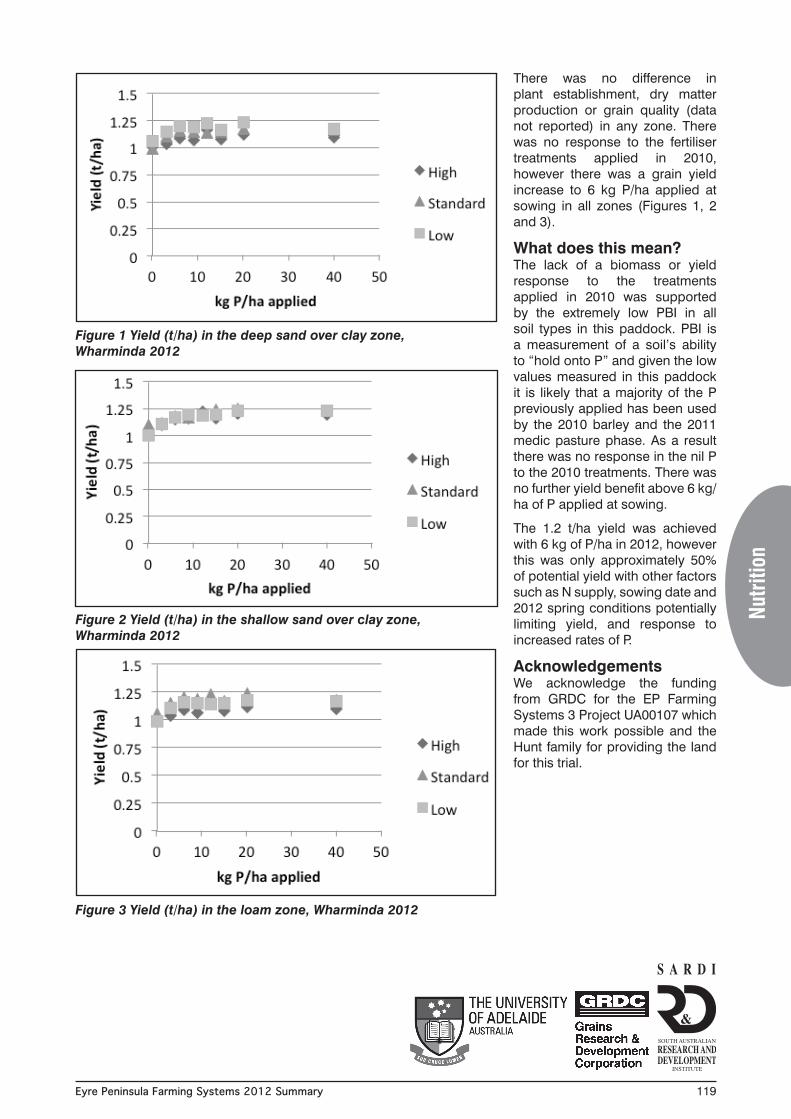
There was no difference in plant establishment, dry matter production or grain quality (data not reported) in any zone. There was no response to the fertiliser treatments applied in 2010, however there was a grain yield increase to 6 kg P/ha applied at sowing in all zones (Figures 1, 2 and 3).
What does this mean?The lack of a biomass or yield response to the treatments applied in 2010 was supported by the extremely low PBI in all soil types in this paddock. PBI is a measurement of a soil’s ability to “hold onto P” and given the low values measured in this paddock it is likely that a majority of the P previously applied has been used by the 2010 barley and the 2011 medic pasture phase. As a result there was no response in the nil P to the 2010 treatments. There was no further yield benefit above 6 kg/ha of P applied at sowing.
The 1.2 t/ha yield was achieved with 6 kg of P/ha in 2012, however this was only approximately 50% of potential yield with other factors such as N supply, sowing date and 2012 spring conditions potentially limiting yield, and response to increased rates of P.
AcknowledgementsWe acknowledge the funding from GRDC for the EP Farming Systems 3 Project UA00107 which made this work possible and the Hunt family for providing the land for this trial.
Figure 1 Yield (t/ha) in the deep sand over clay zone, Wharminda 2012
Figure 2 Yield (t/ha) in the shallow sand over clay zone, Wharminda 2012
Figure 3 Yield (t/ha) in the loam zone, Wharminda 2012
Nutr
ition